| source | dataset | Title | .html | .rData |
|---|---|---|---|---|
| eurostat | nama_10_a64 | National accounts aggregates by industry (up to NACE A*64) | 2026-02-16 | 2026-02-15 |
| eurostat | nama_10_a64_e | National accounts employment data by industry (up to NACE A*64) | 2026-02-16 | 2026-02-15 |
National accounts aggregates by industry (up to NACE A*64)
Data - Eurostat
Info
Data on macro
| source | dataset | Title | .html | .rData |
|---|---|---|---|---|
| eurostat | nama_10_a10 | Gross value added and income by A*10 industry breakdowns | 2026-02-16 | 2026-02-15 |
| eurostat | nama_10_a10_e | Employment by A*10 industry breakdowns | 2026-02-16 | 2026-02-15 |
| eurostat | nama_10_gdp | GDP and main components (output, expenditure and income) | 2026-02-16 | 2026-02-15 |
| eurostat | nama_10_lp_ulc | Labour productivity and unit labour costs | 2026-02-16 | 2026-02-15 |
| eurostat | namq_10_a10 | Gross value added and income A*10 industry breakdowns | 2026-02-16 | 2026-02-15 |
| eurostat | namq_10_a10_e | Employment A*10 industry breakdowns | 2025-05-24 | 2026-02-15 |
| eurostat | namq_10_gdp | GDP and main components (output, expenditure and income) | 2025-10-27 | 2026-02-15 |
| eurostat | namq_10_lp_ulc | Labour productivity and unit labour costs | 2026-02-16 | 2026-02-15 |
| eurostat | namq_10_pc | Main GDP aggregates per capita | 2026-02-16 | 2026-02-15 |
| eurostat | nasa_10_nf_tr | Non-financial transactions | 2026-02-16 | 2026-02-15 |
| eurostat | nasq_10_nf_tr | Non-financial transactions | 2026-02-16 | 2026-02-15 |
| fred | gdp | Gross Domestic Product | 2026-02-15 | 2026-02-15 |
| oecd | QNA | Quarterly National Accounts | 2024-06-06 | 2025-05-24 |
| oecd | SNA_TABLE1 | Gross domestic product (GDP) | 2026-02-10 | 2025-05-24 |
| oecd | SNA_TABLE14A | Non-financial accounts by sectors | 2026-02-10 | 2024-06-30 |
| oecd | SNA_TABLE2 | Disposable income and net lending - net borrowing | 2024-07-01 | 2024-04-11 |
| oecd | SNA_TABLE6A | Value added and its components by activity, ISIC rev4 | 2024-07-01 | 2024-06-30 |
| wdi | NE.RSB.GNFS.ZS | External balance on goods and services (% of GDP) | 2026-02-15 | 2026-02-15 |
| wdi | NY.GDP.MKTP.CD | GDP (current USD) | 2026-02-15 | 2026-02-15 |
| wdi | NY.GDP.MKTP.PP.CD | GDP, PPP (current international D) | 2026-02-15 | 2026-02-15 |
| wdi | NY.GDP.PCAP.CD | GDP per capita (current USD) | 2026-02-15 | 2026-02-15 |
| wdi | NY.GDP.PCAP.KD | GDP per capita (constant 2015 USD) | 2026-02-15 | 2026-02-15 |
| wdi | NY.GDP.PCAP.PP.CD | GDP per capita, PPP (current international D) | 2026-02-15 | 2026-02-15 |
| wdi | NY.GDP.PCAP.PP.KD | GDP per capita, PPP (constant 2011 international D) | 2026-02-15 | 2026-02-15 |
Data on industry
Code
load_data("industry.RData")
industry %>%
  arrange(-(dataset == "nama_10_a64")) %>%
source_dataset_file_updates()| source | dataset | Title | .html | .rData |
|---|---|---|---|---|
| eurostat | nama_10_a64 | National accounts aggregates by industry (up to NACE A*64) | 2026-02-16 | 2026-02-15 |
| ec | INDUSTRY | Industry (sector data) | 2026-01-16 | 2023-10-01 |
| eurostat | ei_isin_m | Industry - monthly data - index (2015 = 100) (NACE Rev. 2) - ei_isin_m | 2026-02-16 | 2026-02-15 |
| eurostat | htec_trd_group4 | High-tech trade by high-tech group of products in million euro (from 2007, SITC Rev. 4) | 2026-02-16 | 2026-02-15 |
| eurostat | nama_10_a64_e | National accounts employment data by industry (up to NACE A*64) | 2026-02-16 | 2026-02-15 |
| eurostat | namq_10_a10_e | Employment A*10 industry breakdowns | 2025-05-24 | 2026-02-15 |
| eurostat | road_eqr_carmot | New registrations of passenger cars by type of motor energy and engine size - road_eqr_carmot | 2026-02-16 | 2026-02-15 |
| eurostat | sts_inpp_m | Producer prices in industry, total - monthly data | 2026-02-16 | 2026-02-15 |
| eurostat | sts_inppd_m | Producer prices in industry, domestic market - monthly data | 2026-02-16 | 2026-02-15 |
| eurostat | sts_inpr_m | Production in industry - monthly data | 2026-02-16 | 2026-02-15 |
| eurostat | sts_intvnd_m | Turnover in industry, non domestic market - monthly data - sts_intvnd_m | 2026-02-16 | 2026-02-15 |
| fred | industry | Manufacturing, Industry | 2026-02-15 | 2026-02-15 |
| oecd | ALFS_EMP | Employment by activities and status (ALFS) | 2024-04-16 | 2025-05-24 |
| oecd | BERD_MA_SOF | Business enterprise R&D expenditure by main activity (focussed) and source of funds | 2024-04-16 | 2023-09-09 |
| oecd | GBARD_NABS2007 | Government budget allocations for R and D | 2024-04-16 | 2023-11-22 |
| oecd | MEI_REAL | Production and Sales (MEI) | 2024-05-12 | 2025-05-24 |
| oecd | MSTI_PUB | Main Science and Technology Indicators | 2024-09-15 | 2025-05-24 |
| oecd | SNA_TABLE4 | PPPs and exchange rates | 2024-09-15 | 2025-05-24 |
| wdi | NV.IND.EMPL.KD | Industry, value added per worker (constant 2010 USD) | 2024-01-06 | 2026-02-15 |
| wdi | NV.IND.MANF.CD | Manufacturing, value added (current USD) | 2026-02-15 | 2026-02-15 |
| wdi | NV.IND.MANF.ZS | Manufacturing, value added (% of GDP) | 2025-05-24 | 2026-02-15 |
| wdi | NV.IND.TOTL.KD | Industry (including construction), value added (constant 2015 USD) - NV.IND.TOTL.KD | 2024-01-06 | 2026-02-15 |
| wdi | NV.IND.TOTL.ZS | Industry, value added (including construction) (% of GDP) | 2025-05-24 | 2026-02-15 |
| wdi | SL.IND.EMPL.ZS | Employment in industry (% of total employment) | 2026-02-15 | 2026-02-15 |
| wdi | TX.VAL.MRCH.CD.WT | Merchandise exports (current USD) | 2024-01-06 | 2026-02-15 |
LAST_COMPILE
| LAST_COMPILE |
|---|
| 2026-02-21 |
Last
Code
nama_10_a64 %>%
  group_by(time) %>%
  summarise(Nobs = n()) %>%
  arrange(desc(time)) %>%
  head(2) %>%
print_table_conditional()| time | Nobs |
|---|---|
| 2024 | 199059 |
| 2023 | 287392 |
na_item
Code
nama_10_a64 %>%
  left_join(na_item, by = "na_item") %>%
  group_by(na_item, Na_item) %>%
  summarise(Nobs = n()) %>%
  arrange(-Nobs) %>%
print_table_conditional| na_item | Na_item | Nobs |
|---|---|---|
| B1G | Value added, gross | 2643245 |
| P51C | Consumption of fixed capital | 2438203 |
| P1 | Output | 1425609 |
| P2 | Intermediate consumption | 1382574 |
| D1 | Compensation of employees | 361452 |
| D11 | Wages and salaries | 357348 |
| D29X39 | Other taxes less other subsidies on production | 353194 |
| B2A3N | Operating surplus and mixed income, net | 345121 |
nace_r2
- Liste. pdf
All
Code
nama_10_a64 %>%
  left_join(nace_r2, by = "nace_r2") %>%
  group_by(nace_r2, Nace_r2) %>%
  summarise(Nobs = n()) %>%
  arrange(-Nobs) %>%
  print_table_conditional
Manufacturing
Code
nama_10_a64 %>%
  filter(grepl("C", nace_r2)) %>%
  left_join(nace_r2, by = "nace_r2") %>%
  group_by(nace_r2, Nace_r2) %>%
  summarise(Nobs = n()) %>%
  arrange(nace_r2) %>%
print_table_conditional| nace_r2 | Nace_r2 | Nobs |
|---|---|---|
| C | Manufacturing | 103695 |
| C10-C12 | Manufacture of food products; beverages and tobacco products | 99411 |
| C13-C15 | Manufacture of textiles, wearing apparel, leather and related products | 99411 |
| C16 | Manufacture of wood and of products of wood and cork, except furniture; manufacture of articles of straw and plaiting materials | 97250 |
| C16-C18 | Manufacture of wood, paper, printing and reproduction | 99411 |
| C17 | Manufacture of paper and paper products | 97337 |
| C18 | Printing and reproduction of recorded media | 97353 |
| C19 | Manufacture of coke and refined petroleum products | 94428 |
| C20 | Manufacture of chemicals and chemical products | 97011 |
| C21 | Manufacture of basic pharmaceutical products and pharmaceutical preparations | 98597 |
| C22 | Manufacture of rubber and plastic products | 97353 |
| C22_C23 | Manufacture of rubber and plastic products and other non-metallic mineral products | 99411 |
| C23 | Manufacture of other non-metallic mineral products | 97353 |
| C24 | Manufacture of basic metals | 97359 |
| C24_C25 | Manufacture of basic metals and fabricated metal products, except machinery and equipment | 99411 |
| C25 | Manufacture of fabricated metal products, except machinery and equipment | 97362 |
| C26 | Manufacture of computer, electronic and optical products | 99408 |
| C27 | Manufacture of electrical equipment | 99411 |
| C28 | Manufacture of machinery and equipment n.e.c. | 99417 |
| C29 | Manufacture of motor vehicles, trailers and semi-trailers | 97362 |
| C29_C30 | Manufacture of motor vehicles, trailers, semi-trailers and of other transport equipment | 99420 |
| C30 | Manufacture of other transport equipment | 96982 |
| C31-C33 | Manufacture of furniture; jewellery, musical instruments, toys; repair and installation of machinery and equipment | 99411 |
| C31_C32 | Manufacture of furniture; other manufacturing | 97353 |
| C33 | Repair and installation of machinery and equipment | 97254 |
- Sublists, non overlapping
Code
nama_10_a64 %>%
  filter(grepl("C", nace_r2),
         !(nace_r2 %in% c("C16", "C17", "C18", "C22", "C23", "C24", "C25",
                          "C29", "C30", "C33"))) %>%
  left_join(nace_r2, by = "nace_r2") %>%
  group_by(nace_r2, Nace_r2) %>%
  summarise(Nobs = n()) %>%
  arrange(nace_r2) %>%
print_table_conditional| nace_r2 | Nace_r2 | Nobs |
|---|---|---|
| C | Manufacturing | 103695 |
| C10-C12 | Manufacture of food products; beverages and tobacco products | 99411 |
| C13-C15 | Manufacture of textiles, wearing apparel, leather and related products | 99411 |
| C16-C18 | Manufacture of wood, paper, printing and reproduction | 99411 |
| C19 | Manufacture of coke and refined petroleum products | 94428 |
| C20 | Manufacture of chemicals and chemical products | 97011 |
| C21 | Manufacture of basic pharmaceutical products and pharmaceutical preparations | 98597 |
| C22_C23 | Manufacture of rubber and plastic products and other non-metallic mineral products | 99411 |
| C24_C25 | Manufacture of basic metals and fabricated metal products, except machinery and equipment | 99411 |
| C26 | Manufacture of computer, electronic and optical products | 99408 |
| C27 | Manufacture of electrical equipment | 99411 |
| C28 | Manufacture of machinery and equipment n.e.c. | 99417 |
| C29_C30 | Manufacture of motor vehicles, trailers, semi-trailers and of other transport equipment | 99420 |
| C31-C33 | Manufacture of furniture; jewellery, musical instruments, toys; repair and installation of machinery and equipment | 99411 |
| C31_C32 | Manufacture of furniture; other manufacturing | 97353 |
unit
Code
nama_10_a64 %>%
  left_join(unit, by = "unit") %>%
  group_by(unit, Unit) %>%
  summarise(Nobs = n()) %>%
  arrange(-Nobs) %>%
print_table_conditional| unit | Unit | Nobs |
|---|---|---|
| CP_MEUR | Current prices, million euro | 931071 |
| CP_MNAC | Current prices, million units of national currency | 931071 |
| PC_TOT | Percentage of total | 929200 |
| PYP_MNAC | Previous year prices, million units of national currency | 357579 |
| PYP_MEUR | Previous year prices, million euro | 352941 |
| CLV15_MNAC | Chain linked volumes (2015), million units of national currency | 331688 |
| CLV10_MNAC | Chain linked volumes (2010), million units of national currency | 331531 |
| CLV05_MNAC | Chain linked volumes (2005), million units of national currency | 330888 |
| CLV15_MEUR | Chain linked volumes (2015), million euro | 327912 |
| CLV10_MEUR | Chain linked volumes (2010), million euro | 327755 |
| CLV05_MEUR | Chain linked volumes (2005), million euro | 327112 |
| CLV20_MNAC | NA | 326880 |
| CLV20_MEUR | NA | 323104 |
| CLV_I15 | Chain linked volumes, index 2015=100 | 322041 |
| CLV_I10 | Chain linked volumes, index 2010=100 | 321914 |
| PD10_EUR | Price index (implicit deflator), 2010=100, euro | 321473 |
| PD10_NAC | Price index (implicit deflator), 2010=100, national currency | 321473 |
| PD15_NAC | Price index (implicit deflator), 2015=100, national currency | 321472 |
| CLV_I20 | NA | 317352 |
| PD20_NAC | NA | 316997 |
| CLV_PCH_PRE | Chain linked volumes, percentage change on previous period | 311871 |
| PD_PCH_PRE_NAC | Price index (implicit deflator), percentage change on previous period, national currency | 311803 |
| PD_PCH_PRE_EUR | Price index (implicit deflator), percentage change on previous period, euro | 311618 |
time
Code
nama_10_a64 %>%
  group_by(time) %>%
  summarise(Nobs = n()) %>%
  arrange(desc(time)) %>%
  print_table_conditional
geo
Code
nama_10_a64 %>%
  left_join(geo, by = "geo") %>%
  group_by(geo, Geo) %>%
  summarise(Nobs = n()) %>%
  arrange(-Nobs) %>%
  mutate(Flag = gsub(" ", "-", str_to_lower(Geo)),
         Flag = paste0('<img src="../../bib/flags/vsmall/', Flag, '.png" alt="Flag">')) %>%
  select(Flag, everything()) %>%
{if (is_html_output()) datatable(., filter = 'top', rownames = F, escape = F) else .}Manufacturing
Table by manuf. Value
Code
nama_10_a64 %>%
  filter(na_item == "B1G",
         nace_r2 %in% c("C", "TOTAL"),
         unit == "CP_MEUR",
         time == "2019") %>%
  select_if(~ n_distinct(.) > 1) %>%
  left_join(geo, by = "geo") %>%
  spread(nace_r2, values) %>%
  arrange(-TOTAL) %>%
  mutate(Flag = gsub(" ", "-", str_to_lower(Geo)),
         Flag = paste0('<img src="../../bib/flags/vsmall/', Flag, '.png" alt="Flag">')) %>%
  select(Flag, everything()) %>%
{if (is_html_output()) datatable(., filter = 'top', rownames = F, escape = F) else .}2019 Table - All Manufacturing (€)
Code
nama_10_a64 %>%
  filter(na_item == "B1G",
         grepl("C", nace_r2) | nace_r2 == "TOTAL",
         unit == "CP_MEUR",
         time == "2019") %>%
  select_if(~ n_distinct(.) > 1) %>%
  left_join(geo, by = "geo") %>%
  spread(nace_r2, values) %>%
  arrange(-TOTAL) %>%
  mutate(Flag = gsub(" ", "-", str_to_lower(Geo)),
         Flag = paste0('<img src="../../bib/flags/vsmall/', Flag, '.png" alt="Flag">')) %>%
  select(Flag, everything()) %>%
  {if (is_html_output()) datatable(., filter = 'top', rownames = F, escape = F) else .}
Some Manufacturing
Code
nama_10_a64 %>%
  filter(na_item == "B1G",
         nace_r2 %in% c("C10-C12", "C13-C15", "C16-C18", "C22_C23", "C29_C30", "TOTAL"),
         unit == "CP_MEUR",
         time == "2019") %>%
  select_if(~ n_distinct(.) > 1) %>%
  left_join(geo, by = "geo") %>%
  spread(nace_r2, values) %>%
  arrange(-TOTAL) %>%
  mutate(Flag = gsub(" ", "-", str_to_lower(Geo)),
         Flag = paste0('<img src="../../bib/flags/vsmall/', Flag, '.png" alt="Flag">')) %>%
  select(Flag, everything()) %>%
  {if (is_html_output()) datatable(., filter = 'top', rownames = F, escape = F) else .}
Greece, Germany, Spain, France, Italy
2019 Table (% du PIB)
Code
nama_10_a64 %>%
  filter(na_item == "B1G",
         geo %in% c("EL", "DE", "ES", "FR", "IT"),
         unit == "CP_MNAC",
         time == "2019") %>%
  select_if(~ n_distinct(.) > 1) %>%
  left_join(geo, by = "geo") %>%
  left_join(nace_r2, by = "nace_r2") %>%
  select(-geo) %>%
  group_by(Geo) %>%
  mutate(values = round(100* values/ values[nace_r2 == "TOTAL"], 2)) %>%
  mutate(Geo = gsub(" ", "-", str_to_lower(Geo)),
         Geo = paste0('<img src="../../bib/flags/vsmall/', Geo, '.png" alt="Flag">')) %>%
  spread(Geo, values) %>%
  {if (is_html_output()) datatable(., filter = 'top', rownames = F, escape = F) else .}
2019 Table (€)
Code
nama_10_a64 %>%
  filter(na_item == "B1G",
         geo %in% c("EL", "DE", "ES", "FR", "IT"),
         unit == "CP_MNAC",
         time == "2019") %>%
  select_if(~ n_distinct(.) > 1) %>%
  left_join(geo, by = "geo") %>%
  left_join(nace_r2, by = "nace_r2") %>%
  select(-geo) %>%
  mutate(Geo = gsub(" ", "-", str_to_lower(Geo)),
         Geo = paste0('<img src="../../bib/flags/vsmall/', Geo, '.png" alt="Flag">')) %>%
  spread(Geo, values) %>%
  {if (is_html_output()) datatable(., filter = 'top', rownames = F, escape = F) else .}
Manufacturing Value Added (% of GDP)
2019 France, Germany, Italy
Code
nama_10_a64 %>%
  filter(geo %in% c("FR", "DE", "IT"),
         unit == "CP_MNAC",
         na_item == "B1G",
         time == "2019") %>%
  left_join(nace_r2, by = "nace_r2") %>%
  select(geo, nace_r2, Nace_r2, values) %>%
  group_by(geo) %>%
  mutate(values = round(100*values /values[nace_r2 =="TOTAL"], 1)) %>%
  spread(geo, values) %>%
  filter(nace_r2 != "TOTAL") %>%
  arrange(-FR) %>%
  {if (is_html_output()) datatable(., filter = 'top', rownames = F) else .}
France: 2019, 1999, 1979
Code
nama_10_a64 %>%
  filter(geo %in% c("FR"),
         unit == "CP_MNAC",
         na_item == "B1G",
         time %in% c("2019",  "1999", 1979)) %>%
  left_join(nace_r2, by = "nace_r2") %>%
  select(time, nace_r2, Nace_r2, values) %>%
  group_by(time) %>%
  mutate(values = round(100*values /values[nace_r2 =="TOTAL"], 1)) %>%
  spread(time, values) %>%
  filter(nace_r2 != "TOTAL") %>%
  arrange(-`2019`) %>%
  {if (is_html_output()) datatable(., filter = 'top', rownames = F) else .}
France, Germany, United Kingdom
Code
nama_10_a64 %>%
  filter(na_item == "B1G",
         nace_r2 %in% c("C", "TOTAL"),
         geo %in% c("FR", "DE", "UK"),
         unit == "CP_MNAC") %>%
  year_to_date() %>%
  left_join(geo, by = "geo") %>%
  select(geo,  Geo, nace_r2, date, values) %>%
  spread(nace_r2, values) %>%
  mutate(values = C/TOTAL) %>%
  left_join(colors, by = c("Geo" = "country")) %>%
  ggplot(.) + geom_line(aes(x = date, y =values, color = color)) +
  theme_minimal() + xlab("") + ylab("Manufacturing Value added (% of GDP)") +
  scale_color_identity() +
  scale_x_date(breaks = seq(1960, 2100, 5) %>% paste0("-01-01") %>% as.Date,
               labels = date_format("%Y")) +
  add_3flags +
  theme(legend.position = "none") +
  scale_y_continuous(breaks = 0.01*seq(-500, 200, 1),
                     labels = percent_format(accuracy = 1))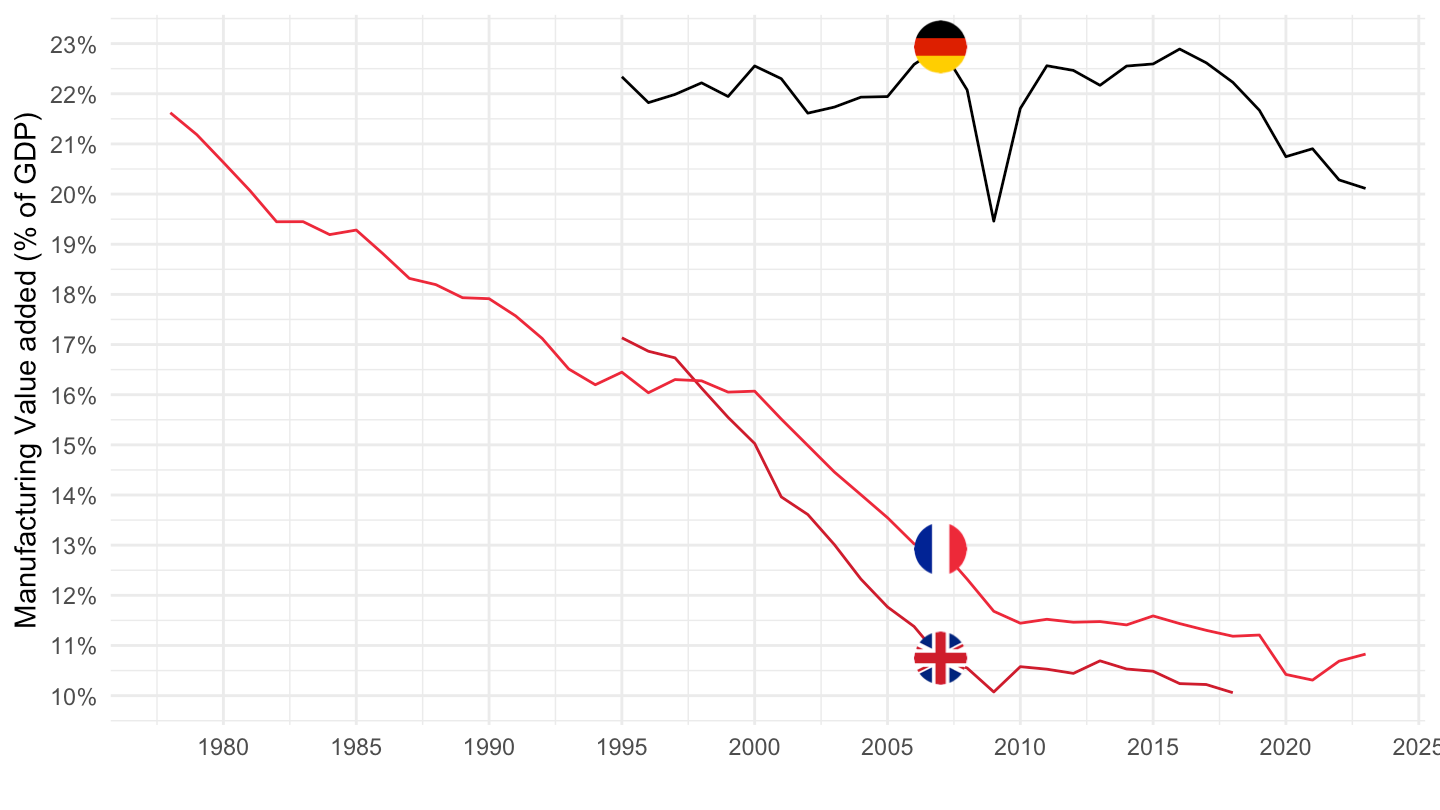
France, Germany, Greece, Italy, Portugal, Spain
All
Code
nama_10_a64 %>%
  filter(na_item == "B1G",
         nace_r2 %in% c("C", "TOTAL"),
         geo %in% c("FR", "DE", "EL", "ES", "IT", "PT"),
         unit == "CP_MNAC") %>%
  year_to_date() %>%
  filter(date >= as.Date("1995-01-01")) %>%
  left_join(geo, by = "geo") %>%
  select(geo,  Geo, nace_r2, date, values) %>%
  spread(nace_r2, values) %>%
  left_join(colors, by = c("Geo" = "country")) %>%
  mutate(values = C/TOTAL) %>%
  ggplot(.) + geom_line(aes(x = date, y = values, color = color)) +
  theme_minimal() + xlab("") + ylab("Manufacturing Value added (% of GDP)") +
  scale_color_identity() +
  scale_x_date(breaks = seq(1960, 2100, 2) %>% paste0("-01-01") %>% as.Date,
               labels = date_format("%Y")) +
  add_6flags +
  theme(legend.position = "none") +
  scale_y_continuous(breaks = 0.01*seq(-500, 200, 1),
                     labels = percent_format(accuracy = 1))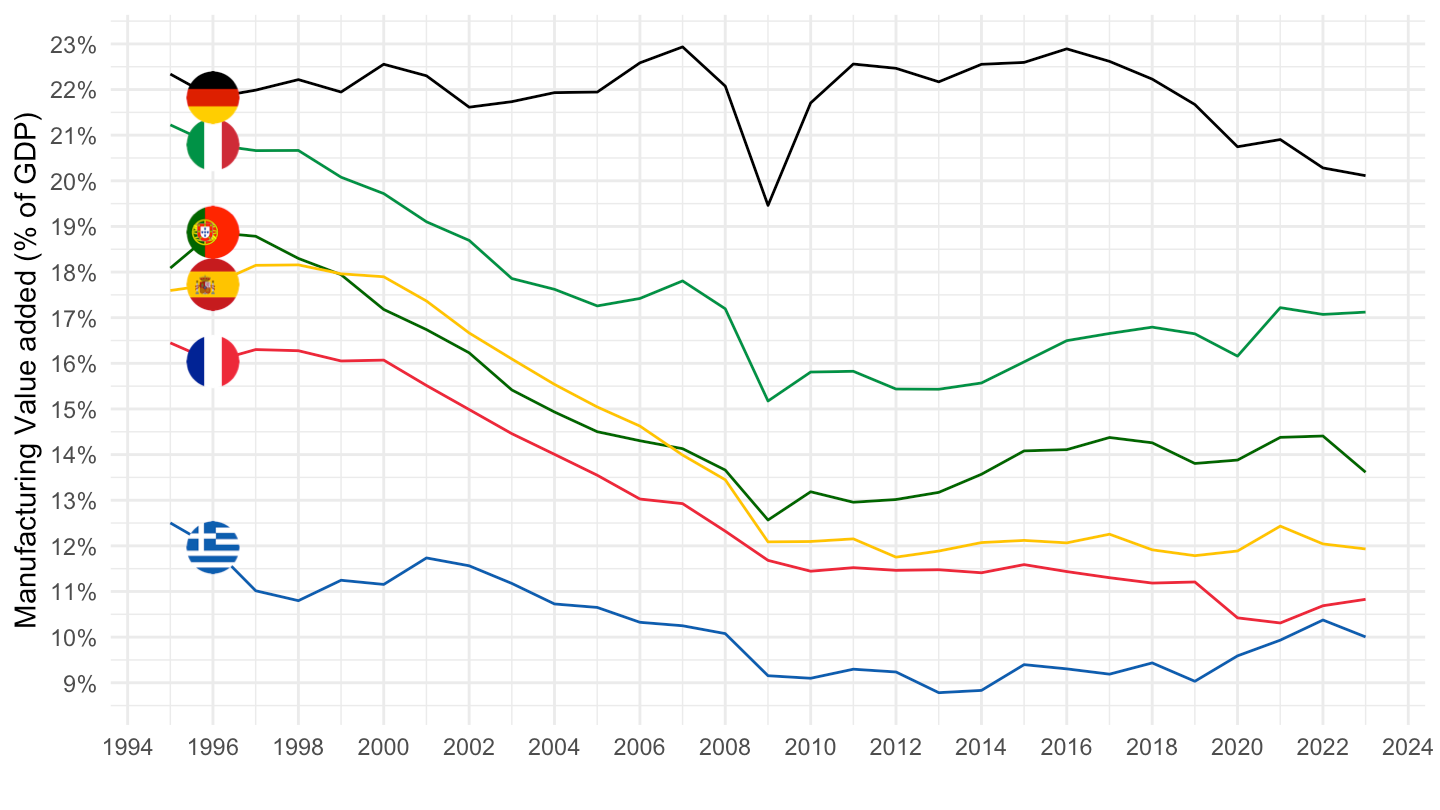
1995-
Code
nama_10_a64 %>%
  filter(na_item == "B1G",
         nace_r2 %in% c("C", "TOTAL"),
         geo %in% c("FR", "DE", "EL", "ES", "IT", "PT"),
         unit == "CP_MNAC") %>%
  year_to_date() %>%
  filter(date >= as.Date("1995-01-01")) %>%
  left_join(geo, by = "geo") %>%
  select(geo,  Geo, nace_r2, date, values) %>%
  spread(nace_r2, values) %>%
  left_join(colors, by = c("Geo" = "country")) %>%
  mutate(values = C/TOTAL) %>%
  ggplot(.) + geom_line(aes(x = date, y = values, color = color)) +
  theme_minimal() + xlab("") + ylab("Manufacturing Value added (% of GDP)") +
  scale_color_identity() +
  scale_x_date(breaks = seq(1960, 2100, 5) %>% paste0("-01-01") %>% as.Date,
               labels = date_format("%Y")) +
  add_6flags +
  theme(legend.position = "none") +
  scale_y_continuous(breaks = 0.01*seq(-500, 200, 1),
                     labels = percent_format(accuracy = 1))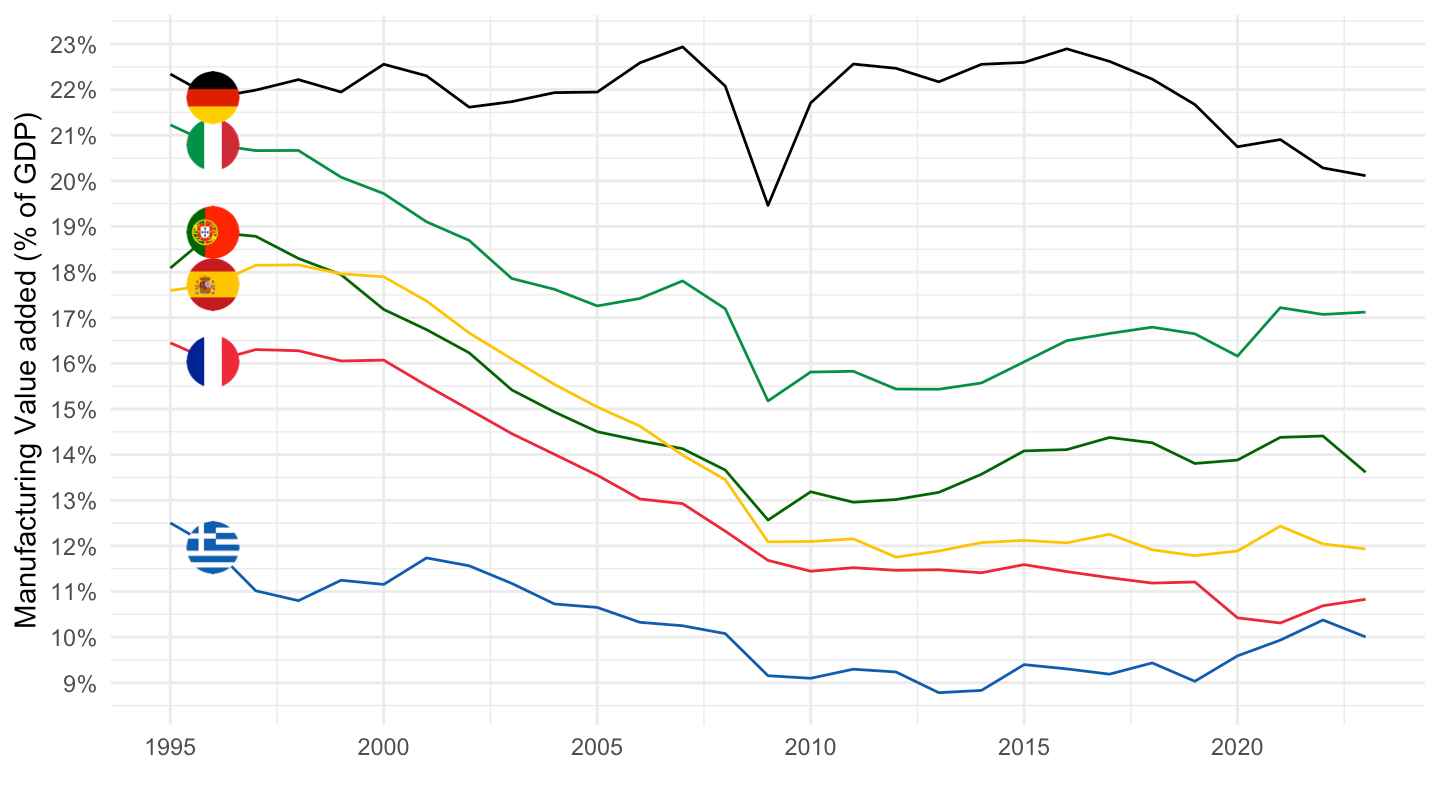
All
Code
nama_10_a64 %>%
  filter(na_item == "B1G",
         nace_r2 %in% c("C", "TOTAL"),
         unit == "CP_MNAC") %>%
  year_to_date() %>%
  filter(date >= as.Date("1995-01-01")) %>%
  arrange(date) %>%
  left_join(geo, by = "geo") %>%
  select(geo,  Geo, nace_r2, date, values) %>%
  spread(nace_r2, values) %>%
  left_join(colors, by = c("Geo" = "country")) %>%
  mutate(values = C/TOTAL) %>%
  ggplot(.) + geom_line(aes(x = date, y = values, color = color, group = geo)) +
  theme_minimal() + xlab("") + ylab("Manufacturing Value added (% of GDP)") +
  scale_color_identity() +
  scale_x_date(breaks = seq(1960, 2100, 5) %>% paste0("-01-01") %>% as.Date,
               labels = date_format("%Y")) +
  add_6flags +
  theme(legend.position = "none") +
  scale_y_continuous(breaks = 0.01*seq(-500, 200, 1),
                     labels = percent_format(accuracy = 1)) +
  geom_label_repel(data = . %>% group_by(geo)
                   %>% filter(date %in% c(max(date), min(date))),
                   aes(x = date, y = values, label = geo, color = color)) +
  geom_line(data = . %>% filter(geo == "FR"),
            aes(x = date, y = values, color = color), size = 2) +
  geom_line(data = . %>% filter(geo == "EL"),
            aes(x = date, y = values, color = color), size = 2)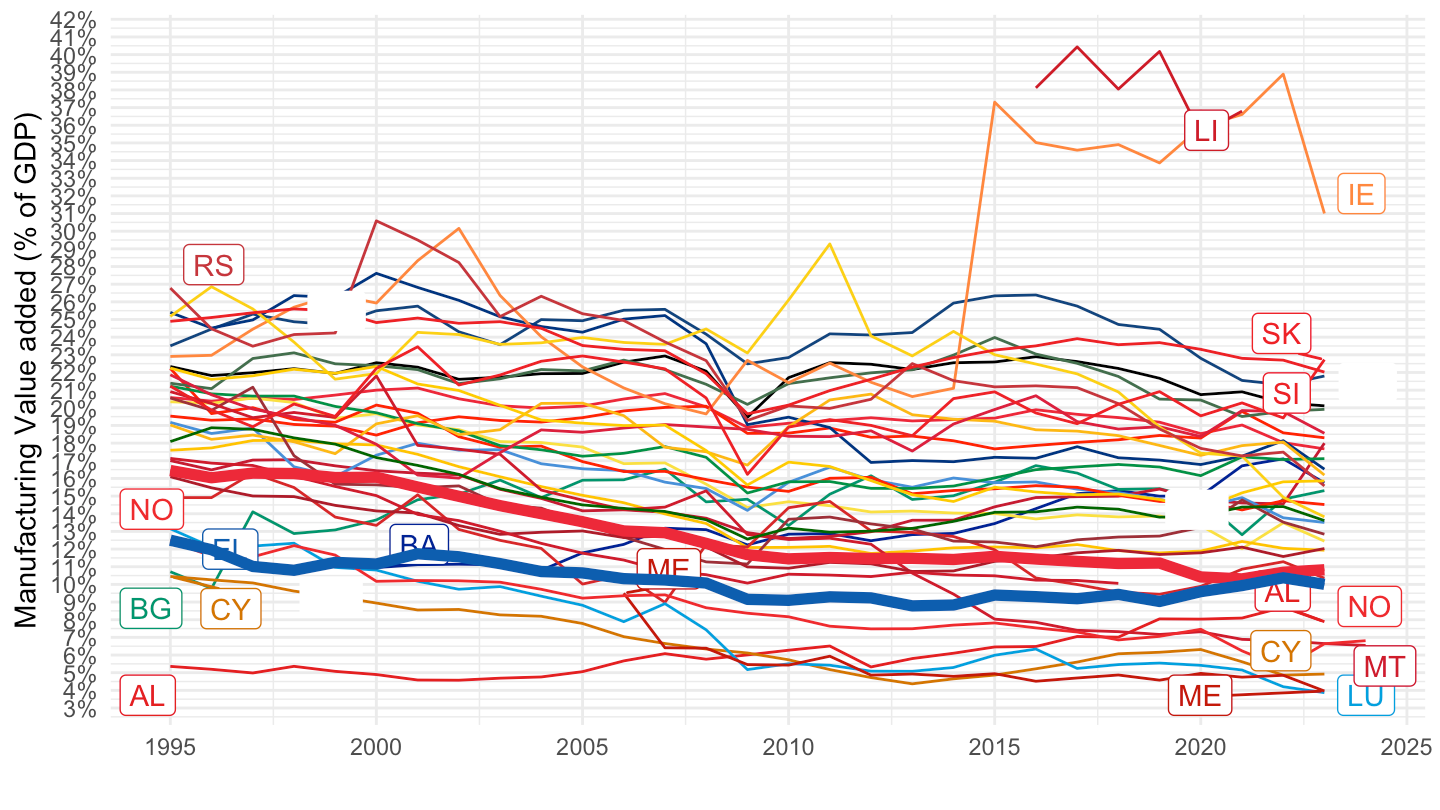
France, Luxembourg, Cyprus
1995-
Code
nama_10_a64 %>%
  filter(na_item == "B1G",
         nace_r2 %in% c("C", "TOTAL"),
         geo %in% c("FR", "ME", "LU", "CY", "MT", "EL"),
         unit == "CP_MNAC") %>%
  year_to_date() %>%
  filter(date >= as.Date("1995-01-01")) %>%
  left_join(geo, by = "geo") %>%
  select(geo,  Geo, nace_r2, date, values) %>%
  spread(nace_r2, values) %>%
  left_join(colors, by = c("Geo" = "country")) %>%
  mutate(values = C/TOTAL) %>%
  ggplot(.) + geom_line(aes(x = date, y = values, color = color)) +
  theme_minimal() + xlab("") + ylab("Manufacturing Value added (% of GDP)") +
  scale_color_identity() +
  scale_x_date(breaks = seq(1960, 2100, 5) %>% paste0("-01-01") %>% as.Date,
               labels = date_format("%Y")) +
  add_6flags +
  theme(legend.position = "none") +
  scale_y_continuous(breaks = 0.01*seq(-500, 200, 1),
                     labels = percent_format(accuracy = 1))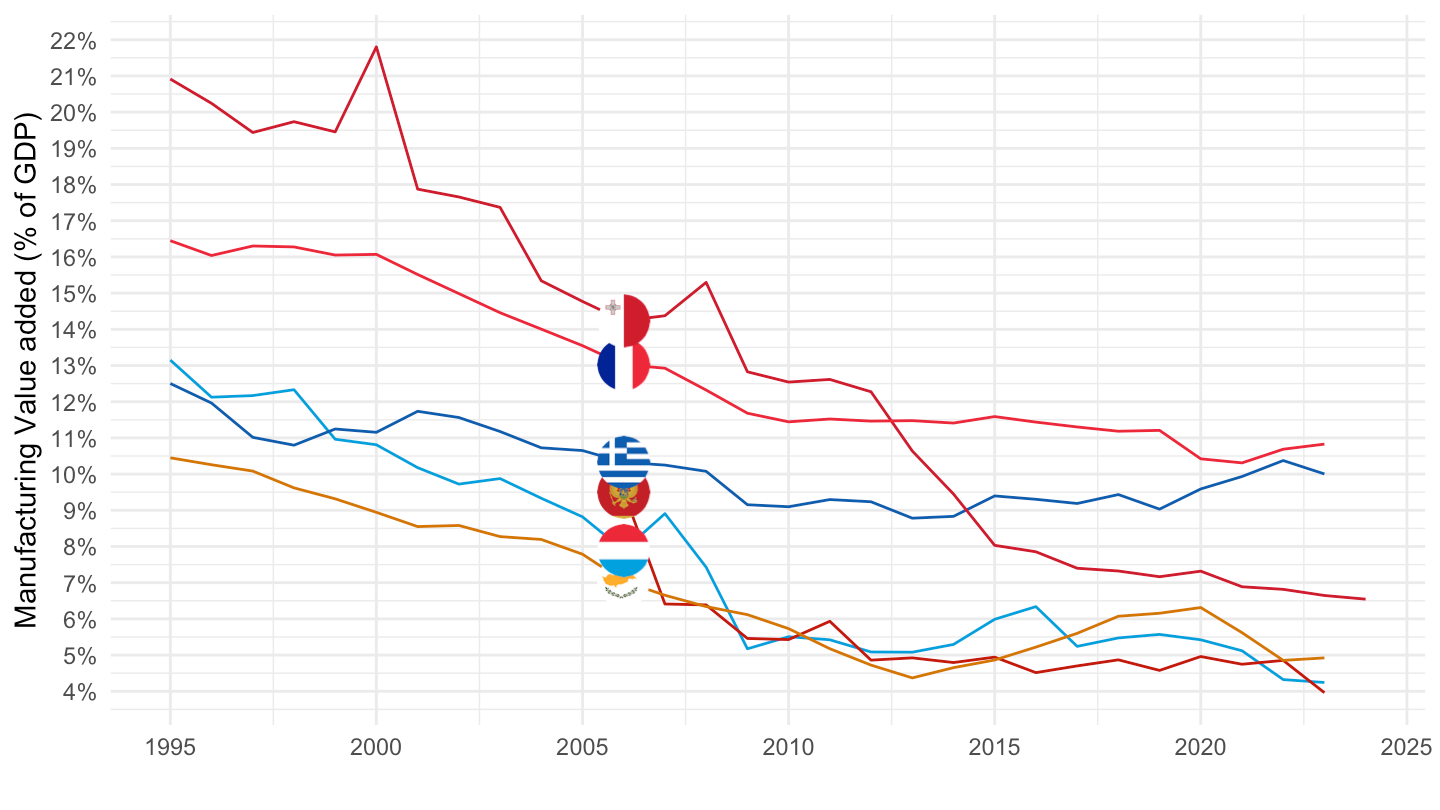
Greece, Portugal, Spain
Code
nama_10_a64 %>%
  filter(na_item == "B1G",
         nace_r2 %in% c("C", "TOTAL"),
         geo %in% c("EL", "PT", "ES"),
         unit == "CP_MNAC") %>%
  year_to_date() %>%
  left_join(geo, by = "geo") %>%
  select(Geo, nace_r2, date, values) %>%
  spread(nace_r2, values) %>%
  ggplot(.) + geom_line(aes(x = date, y = C/TOTAL, color = Geo)) +
  theme_minimal() + xlab("") + ylab("Manufacturing Value added (% of GDP)") +
  scale_color_manual(values = c("#0D5EAF", "#006600", "#C60B1E")) +
  scale_x_date(breaks = seq(1960, 2100, 5) %>% paste0("-01-01") %>% as.Date,
               labels = date_format("%Y")) +
  geom_image(data = . %>%
               filter(date == as.Date("2016-01-01")) %>%
               mutate(date = as.Date("2016-01-01"),
                      image = paste0("../../icon/flag/round/", str_to_lower(Geo), ".png")),
             aes(x = date, y = C/TOTAL, image = image), asp = 1.5) +
  theme(legend.position = "none") +
  scale_y_continuous(breaks = 0.01*seq(-500, 200, 1),
                     labels = percent_format(accuracy = 1))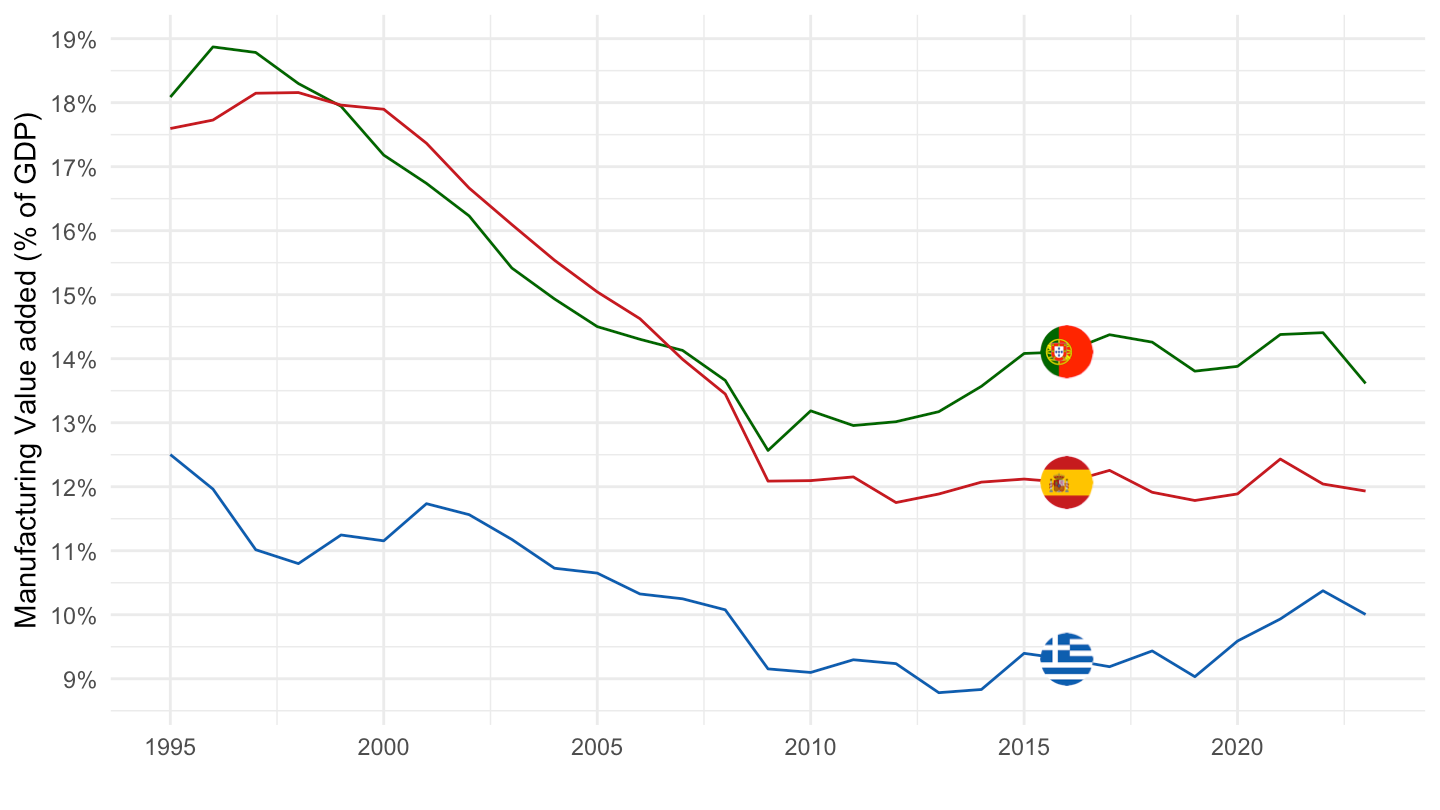
1995-2018
Code
nama_10_a64 %>%
  filter(na_item == "B1G",
         nace_r2 %in% c("C", "TOTAL"),
         geo %in% c("EA", "FR", "DE", "IT", "ES", "NL", "AT", "FI"),
         unit == "CP_MNAC") %>%
  year_to_date() %>%
  filter(date >= as.Date("1995-01-01"),
         date <= as.Date("2019-01-01")) %>%
  left_join(geo, by = "geo") %>%
  select(geo, Geo, nace_r2, date, values) %>%
  spread(nace_r2, values) %>%
  mutate(values = C/TOTAL) %>%
  group_by(date) %>%
  mutate(values = values /values[geo == "EA"]) %>%
  filter(geo != "EA") %>%
  group_by(geo) %>%
  mutate(values = 100*values / values[date == as.Date("1995-01-01")]) %>%
  left_join(colors, by = c("Geo" = "country")) %>%
  mutate(color = ifelse(geo == "FR", color2, color)) %>%
  ggplot(.) + geom_line(aes(x = date, y = values, color = color)) +
  theme_minimal() + xlab("") + ylab("Valeur ajoutée manuf. par rapport à la Zone €") +
  scale_color_identity() + add_7flags +
  theme(legend.position = "none") +
  scale_x_date(breaks = seq(1995, 2100, 5) %>% paste0("-01-01") %>% as.Date,
               labels = date_format("%Y")) +
  scale_y_continuous(breaks = seq(0, 200, 5)) +
  theme(legend.position = "none") +
  geom_hline(yintercept = 100, linetype = "dashed")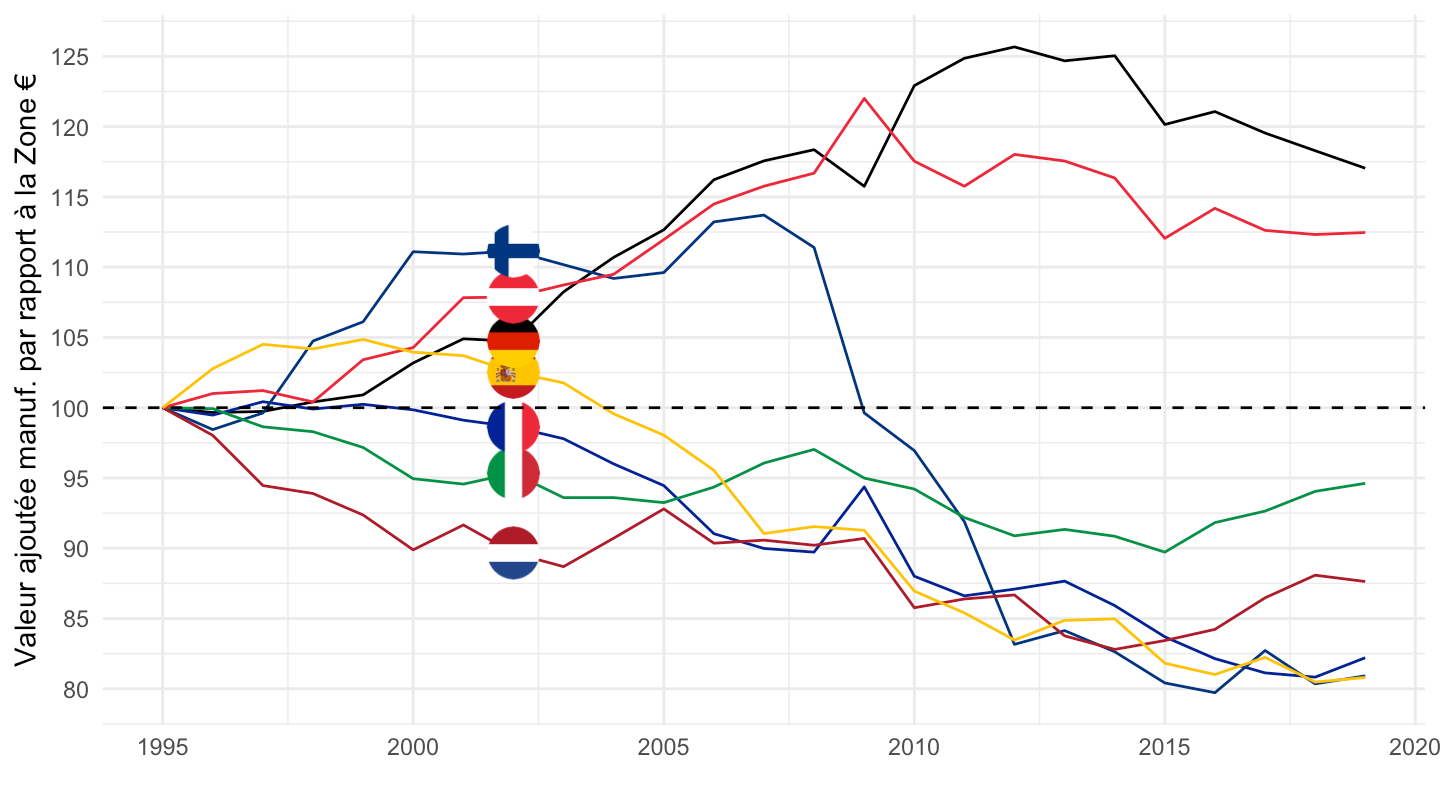
1995-
Code
nama_10_a64 %>%
  filter(na_item == "B1G",
         nace_r2 %in% c("C", "TOTAL"),
         geo %in% c("EA", "FR", "DE", "IT", "ES", "NL", "AT", "PL", "CZ"),
         unit == "CP_MNAC") %>%
  year_to_date() %>%
  filter(date >= as.Date("1995-01-01"),
         date <= as.Date("2019-01-01")) %>%
  left_join(geo, by = "geo") %>%
  select(geo, Geo, nace_r2, date, values) %>%
  spread(nace_r2, values) %>%
  mutate(values = C/TOTAL) %>%
  group_by(date) %>%
  mutate(values = values /values[geo == "EA"]) %>%
  filter(geo != "EA") %>%
  group_by(geo) %>%
  mutate(values = 100*values / values[date == as.Date("1995-01-01")]) %>%
  left_join(colors, by = c("Geo" = "country")) %>%
  mutate(color = ifelse(geo == "FR", color2, color)) %>%
  ggplot(.) + geom_line(aes(x = date, y = values, color = color)) +
  theme_minimal() + xlab("") + ylab("Valeur ajoutée manuf. par rapport à la Zone €") +
  scale_color_identity() +
  add_8flags +
  theme(legend.position = "none") +
  scale_x_date(breaks = seq(1995, 2100, 5) %>% paste0("-01-01") %>% as.Date,
               labels = date_format("%Y")) +
  scale_y_log10(breaks = seq(0, 200, 5)) +
  theme(legend.position = "none") +
  geom_hline(yintercept = 100, linetype = "dashed")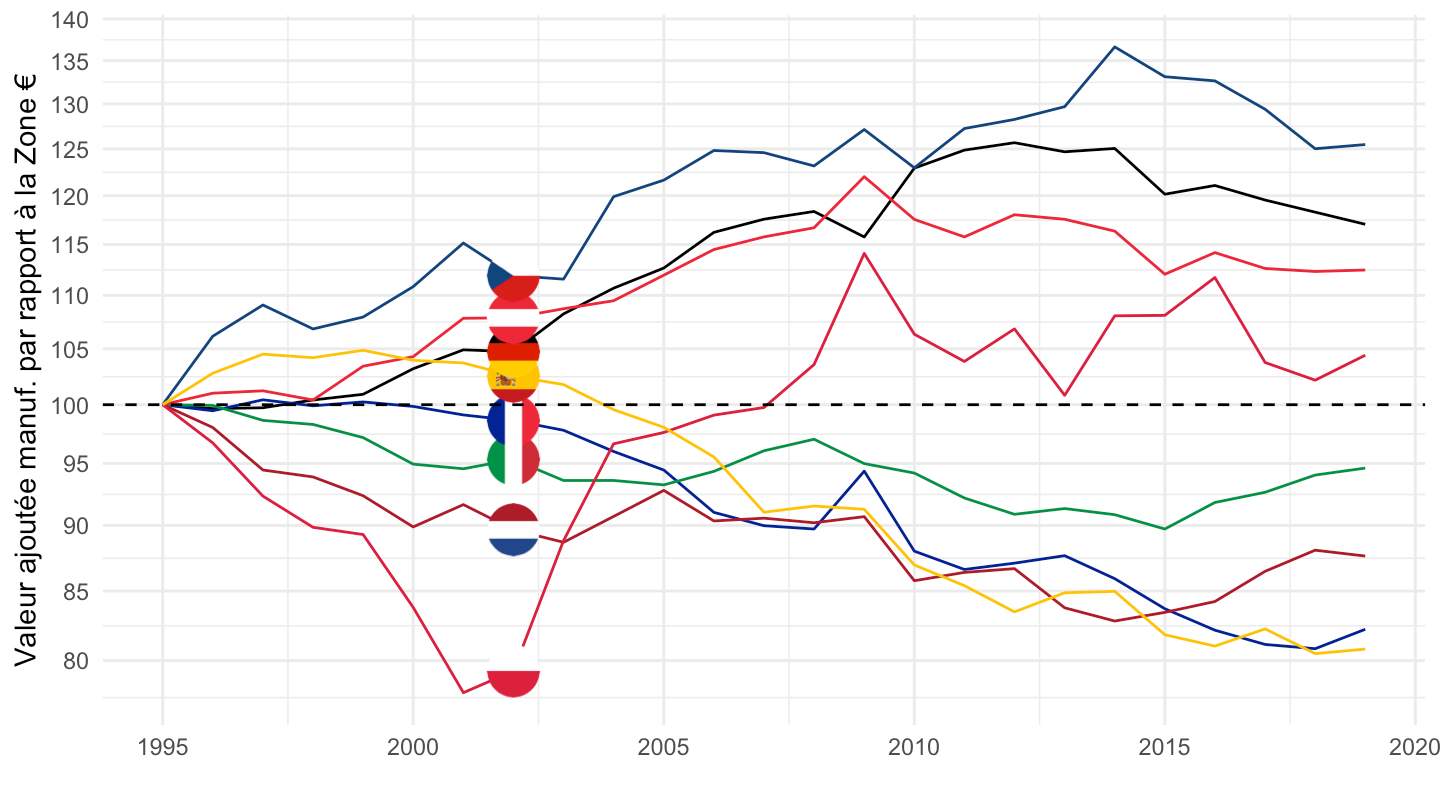
2000-2018
Code
nama_10_a64 %>%
  filter(na_item == "B1G",
         nace_r2 %in% c("C", "TOTAL"),
         geo %in% c("EA", "FR", "DE", "IT", "ES", "NL", "AT", "FI"),
         unit == "CP_MNAC") %>%
  year_to_date() %>%
  filter(date >= as.Date("2000-01-01"),
         date <= as.Date("2019-01-01")) %>%
  left_join(geo, by = "geo") %>%
  select(geo, Geo, nace_r2, date, values) %>%
  spread(nace_r2, values) %>%
  mutate(values = C/TOTAL) %>%
  group_by(date) %>%
  mutate(values = values /values[geo == "EA"]) %>%
  filter(geo != "EA") %>%
  group_by(geo) %>%
  mutate(values = 100*values / values[date == as.Date("2000-01-01")]) %>%
  left_join(colors, by = c("Geo" = "country")) %>%
  mutate(color = ifelse(geo == "FR", color2, color)) %>%
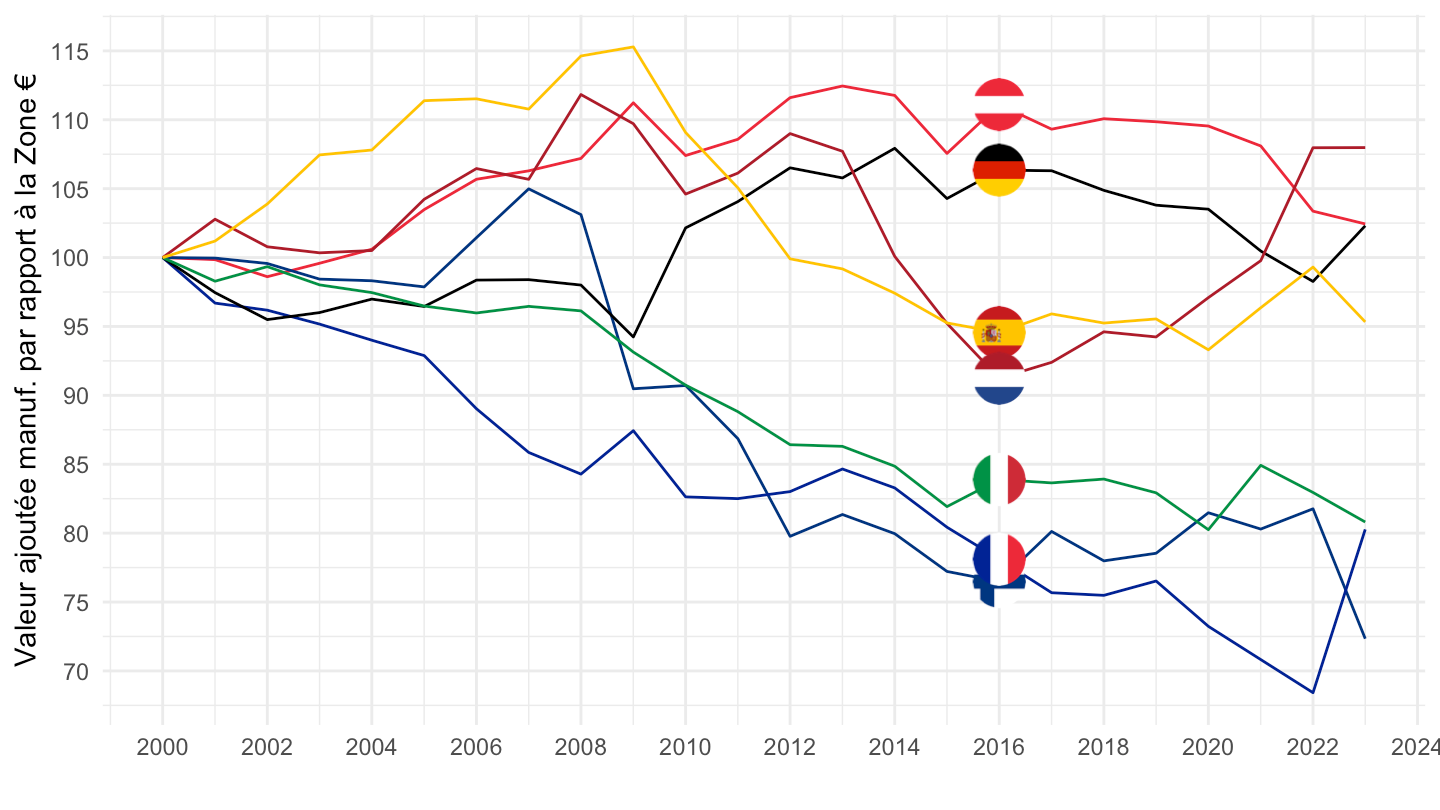
  ggplot(.) + geom_line(aes(x = date, y = values, color = color)) +
  theme_minimal() + xlab("") + ylab("Valeur ajoutée manuf. par rapport à la Zone €") +
  scale_color_identity() + add_7flags +
  scale_x_date(breaks = seq(1960, 2020, 1) %>% paste0("-01-01") %>% as.Date,
               labels = date_format("%Y")) +
  scale_y_continuous(breaks = seq(0, 200, 5)) +
  theme(legend.position = "none") +
  geom_hline(yintercept = 100, linetype = "dashed")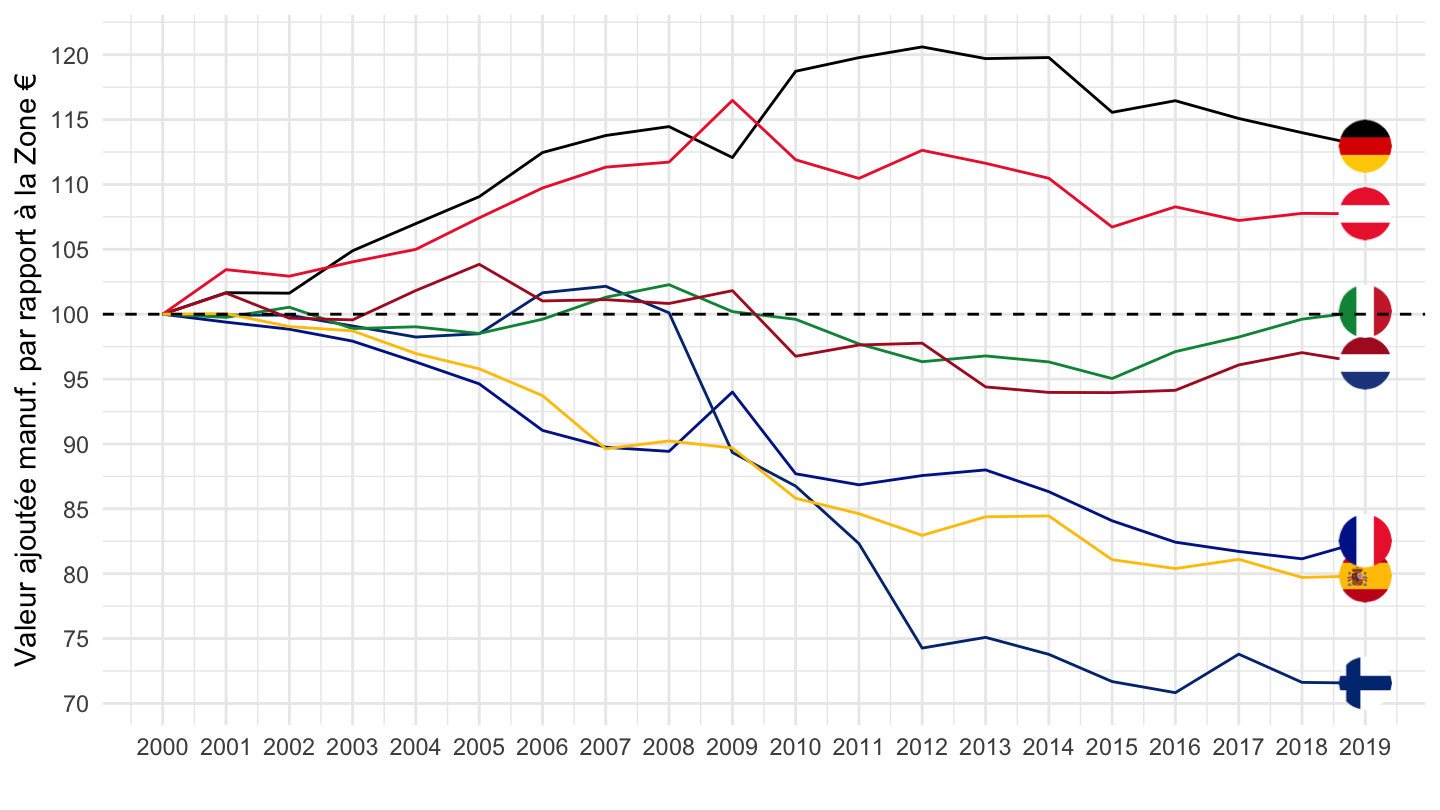
Comparing Deflators
Germany, France, Italy, Spain
Code
nama_10_a64 %>%
  filter(na_item == "B1G",
         geo %in% c("FR", "DE", "IT", "ES"),
         unit == "PD10_NAC",
         time %in% c("1995", "2019")) %>%
  select_if(~ n_distinct(.) > 1) %>%
  spread(time, values) %>%
  left_join(geo, by = "geo") %>%
  left_join(nace_r2, by = "nace_r2") %>%
  select(-geo) %>%
  mutate(values = round(100*((`2019`/`1995`)^(1/24)-1),2)) %>%
  select(-`1995`, -`2019`) %>%
  spread(Geo, values) %>%
  print_table_conditional
C - Manufacturing
Table - PD10_NAC
Code
nama_10_a64 %>%
  filter(na_item == "B1G",
         unit == "PD10_NAC",
         nace_r2 %in% c("C", "TOTAL"),
         time %in% c("1995", "2019")) %>%
  select_if(~ n_distinct(.) > 1) %>%
  spread(time, values) %>%
  left_join(geo, by = "geo") %>%
  mutate(values = round(100*((`2019`/`1995`)^(1/24)-1),2)) %>%
  select(-`1995`, -`2019`) %>%
  spread(nace_r2, values) %>%
  arrange(`C`) %>%
  mutate(Flag = gsub(" ", "-", str_to_lower(Geo)),
         Flag = paste0('<img src="../../bib/flags/vsmall/', Flag, '.png" alt="Flag">')) %>%
  select(Flag, everything()) %>%
  {if (is_html_output()) datatable(., filter = 'top', rownames = F, escape = F) else .}
Table - PD10_EUR
Code
nama_10_a64 %>%
  filter(na_item == "B1G",
         unit == "PD10_EUR",
         nace_r2 %in% c("C", "TOTAL"),
         time %in% c("1995", "2019")) %>%
  select_if(~ n_distinct(.) > 1) %>%
  spread(time, values) %>%
  left_join(geo, by = "geo") %>%
  mutate(values = round(100*((`2019`/`1995`)^(1/24)-1),2)) %>%
  select(-`1995`, -`2019`) %>%
  spread(nace_r2, values) %>%
  arrange(`C`) %>%
  mutate(Flag = gsub(" ", "-", str_to_lower(Geo)),
         Flag = paste0('<img src="../../bib/flags/vsmall/', Flag, '.png" alt="Flag">')) %>%
  select(Flag, everything()) %>%
  {if (is_html_output()) datatable(., filter = 'top', rownames = F, escape = F) else .}
C10-C12 - Food products
Code
nama_10_a64 %>%
  filter(na_item == "B1G",
         unit == "PD10_EUR",
         nace_r2 %in% c("C10-C12", "TOTAL"),
         time %in% c("1995", "2020")) %>%
  select_if(~ n_distinct(.) > 1) %>%
  spread(time, values) %>%
  left_join(geo, by = "geo") %>%
  mutate(values = round(100*((`2020`/`1995`)^(1/24)-1),2)) %>%
  select(-`1995`, -`2020`) %>%
  spread(nace_r2, values) %>%
  arrange(`C10-C12`) %>%
  mutate(Flag = gsub(" ", "-", str_to_lower(Geo)),
         Flag = paste0('<img src="../../bib/flags/vsmall/', Flag, '.png" alt="Flag">')) %>%
  select(Flag, everything()) %>%
  {if (is_html_output()) datatable(., filter = 'top', rownames = F, escape = F) else .}
C13-C15 - Textiles
Code
nama_10_a64 %>%
  filter(na_item == "B1G",
         unit == "PD10_NAC",
         nace_r2 %in% c("C13-C15", "TOTAL"),
         time %in% c("1995", "2020")) %>%
  select_if(~ n_distinct(.) > 1) %>%
  spread(time, values) %>%
  left_join(geo, by = "geo") %>%
  mutate(values = round(100*((`2020`/`1995`)^(1/24)-1),2)) %>%
  select(-`1995`, -`2020`) %>%
  spread(nace_r2, values) %>%
  arrange(`C13-C15`) %>%
  mutate(Flag = gsub(" ", "-", str_to_lower(Geo)),
         Flag = paste0('<img src="../../bib/flags/vsmall/', Flag, '.png" alt="Flag">')) %>%
  select(Flag, everything()) %>%
  {if (is_html_output()) datatable(., filter = 'top', rownames = F, escape = F) else .}
C27 - Manufacture of electrical equipment
Table - PD10_NAC
Code
nama_10_a64 %>%
  filter(na_item == "B1G",
         unit == "PD10_NAC",
         nace_r2 %in% c("C27", "TOTAL"),
         time %in% c("1995", "2020")) %>%
  select_if(~ n_distinct(.) > 1) %>%
  spread(time, values) %>%
  left_join(geo, by = "geo") %>%
  mutate(values = round(100*((`2020`/`1995`)^(1/24)-1),2)) %>%
  select(-`1995`, -`2020`) %>%
  spread(nace_r2, values) %>%
  arrange(`C27`) %>%
  mutate(Flag = gsub(" ", "-", str_to_lower(Geo)),
         Flag = paste0('<img src="../../bib/flags/vsmall/', Flag, '.png" alt="Flag">')) %>%
  select(Flag, everything()) %>%
  {if (is_html_output()) datatable(., filter = 'top', rownames = F, escape = F) else .}
Table - PD10_EUR
Code
nama_10_a64 %>%
  filter(na_item == "B1G",
         unit == "PD10_EUR",
         nace_r2 %in% c("C26", "TOTAL"),
         time %in% c("1995", "2019")) %>%
  select_if(~ n_distinct(.) > 1) %>%
  spread(time, values) %>%
  left_join(geo, by = "geo") %>%
  mutate(values = round(100*((`2019`/`1995`)^(1/24)-1),2)) %>%
  select(-`1995`, -`2019`) %>%
  spread(nace_r2, values) %>%
  arrange(`C26`) %>%
  mutate(Flag = gsub(" ", "-", str_to_lower(Geo)),
         Flag = paste0('<img src="../../bib/flags/vsmall/', Flag, '.png" alt="Flag">')) %>%
  select(Flag, everything()) %>%
  {if (is_html_output()) datatable(., filter = 'top', rownames = F, escape = F) else .}
Graph
Code
nama_10_a64 %>%
  filter(na_item == "B1G",
         nace_r2 %in% c("C27", "TOTAL"),
         geo %in% c("FR", "DE", "IT", "ES"),
         unit == "PD10_NAC") %>%
  year_to_date() %>%
  filter(date >= as.Date("1995-01-01")) %>%
  left_join(geo, by = "geo") %>%
  select(geo,  Geo, nace_r2, date, values) %>%
  spread(nace_r2, values) %>%
  mutate(values = C27/TOTAL)  %>%
  left_join(colors, by = c("Geo" = "country")) %>%
  group_by(Geo) %>%
  mutate(values = values/ values[1]) %>%
  ggplot(.) + geom_line(aes(x = date, y = values, color = color)) +
  theme_minimal() + xlab("") + ylab("Price Deflator (C27)") +
  scale_color_identity() + add_4flags +
  scale_x_date(breaks = seq(1960, 2100, 5) %>% paste0("-01-01") %>% as.Date,
               labels = date_format("%Y")) +
  scale_y_continuous(breaks = 0.01*seq(-500, 200, 10))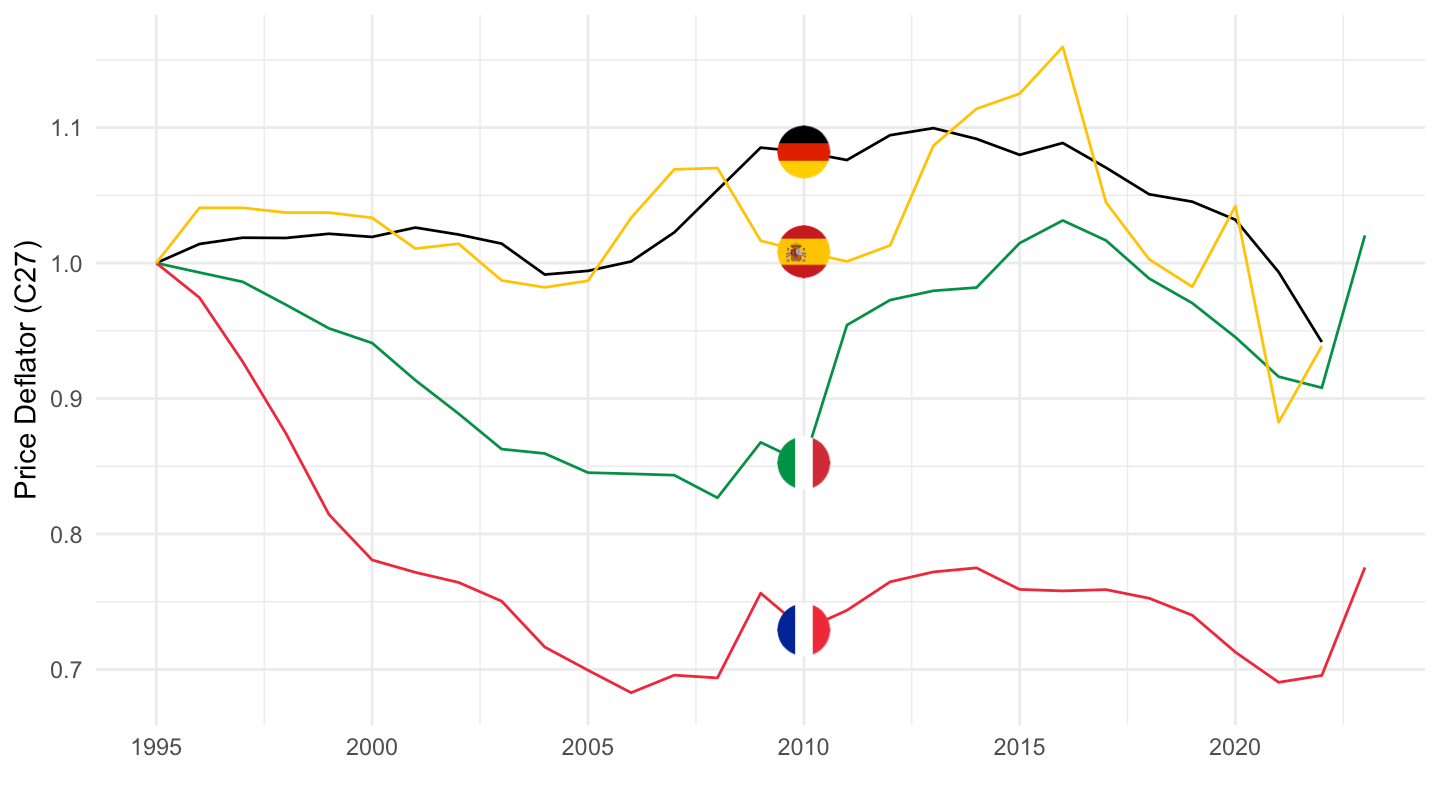
C26 - Computer, electronics
Table - PD10_NAC
Code
nama_10_a64 %>%
  filter(na_item == "B1G",
         unit == "PD10_NAC",
         nace_r2 %in% c("C26", "TOTAL"),
         time %in% c("1995", "2019")) %>%
  select_if(~ n_distinct(.) > 1) %>%
  spread(time, values) %>%
  left_join(geo, by = "geo") %>%
  mutate(values = round(100*((`2019`/`1995`)^(1/24)-1),2)) %>%
  select(-`1995`, -`2019`) %>%
  spread(nace_r2, values) %>%
  arrange(`C26`) %>%
  mutate(Flag = gsub(" ", "-", str_to_lower(Geo)),
         Flag = paste0('<img src="../../bib/flags/vsmall/', Flag, '.png" alt="Flag">')) %>%
  select(Flag, everything()) %>%
  {if (is_html_output()) datatable(., filter = 'top', rownames = F, escape = F) else .}
Table - PD10_EUR
Code
nama_10_a64 %>%
  filter(na_item == "B1G",
         unit == "PD10_EUR",
         nace_r2 %in% c("C26", "TOTAL"),
         time %in% c("1995", "2019")) %>%
  select_if(~ n_distinct(.) > 1) %>%
  spread(time, values) %>%
  left_join(geo, by = "geo") %>%
  mutate(values = round(100*((`2019`/`1995`)^(1/24)-1),2)) %>%
  select(-`1995`, -`2019`) %>%
  spread(nace_r2, values) %>%
  arrange(`C26`) %>%
  mutate(Flag = gsub(" ", "-", str_to_lower(Geo)),
         Flag = paste0('<img src="../../bib/flags/vsmall/', Flag, '.png" alt="Flag">')) %>%
  select(Flag, everything()) %>%
  {if (is_html_output()) datatable(., filter = 'top', rownames = F, escape = F) else .}
Graph
Code
nama_10_a64 %>%
  filter(na_item == "B1G",
         nace_r2 %in% c("C26", "TOTAL"),
         geo %in% c("FR", "DE", "IT", "ES"),
         unit == "PD10_NAC") %>%
  year_to_date() %>%
  filter(date >= as.Date("1995-01-01")) %>%
  left_join(geo, by = "geo") %>%
  select(geo,  Geo, nace_r2, date, values) %>%
  spread(nace_r2, values) %>%
  mutate(values = C26/TOTAL)  %>%
  left_join(colors, by = c("Geo" = "country")) %>%
  group_by(Geo) %>%
  mutate(values = values/ values[1]) %>%
  ggplot(.) + geom_line(aes(x = date, y = values, color = color)) +
  theme_minimal() + xlab("") + ylab("Price Deflator (C26)") +
  scale_color_identity() + add_4flags +
  scale_x_date(breaks = seq(1960, 2100, 5) %>% paste0("-01-01") %>% as.Date,
               labels = date_format("%Y")) +
  scale_y_continuous(breaks = 0.01*seq(-500, 200, 10))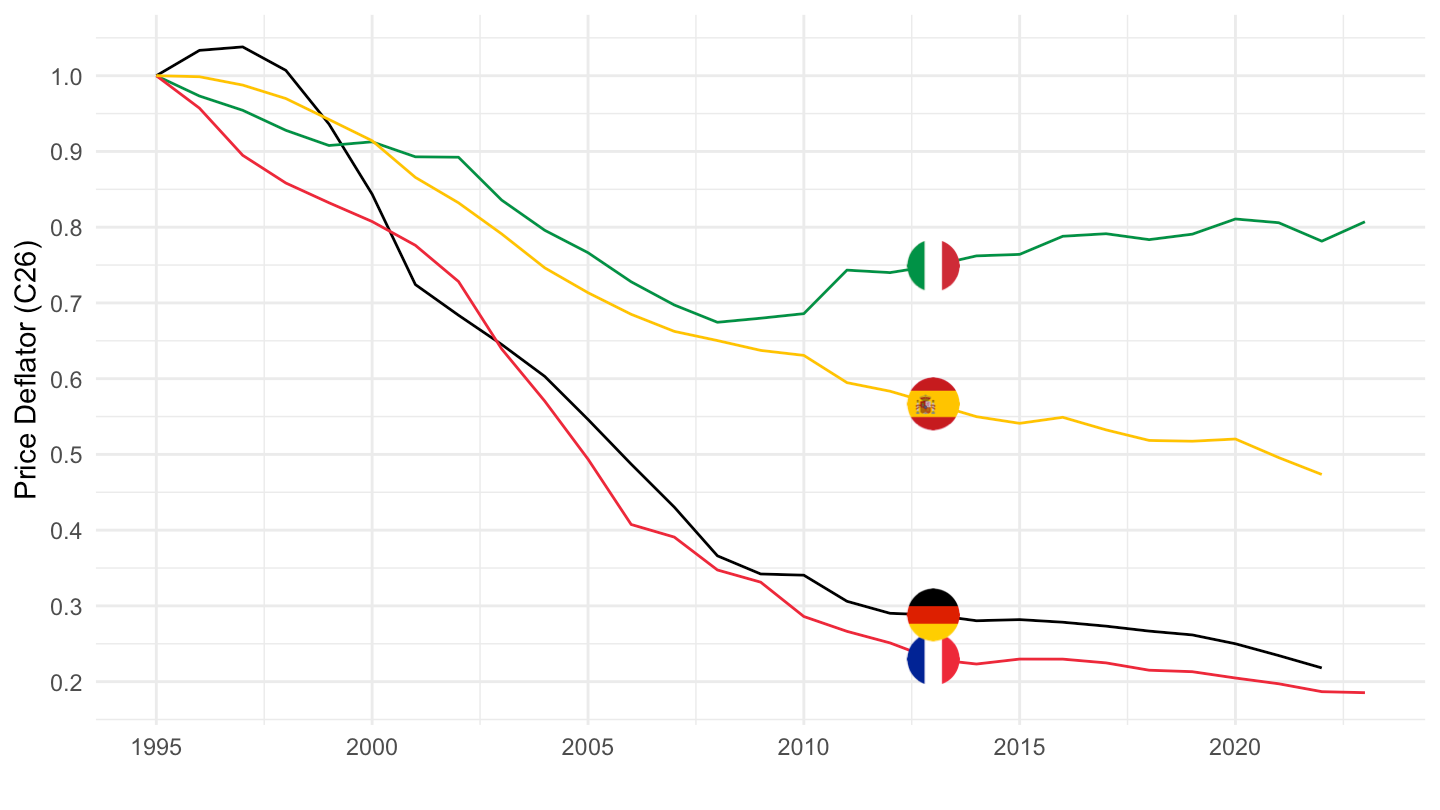
C33 - Repair and installation of machinery and equipment
Table - PD10_NAC
Code
nama_10_a64 %>%
  filter(na_item == "B1G",
         unit == "PD10_NAC",
         nace_r2 %in% c("C33", "TOTAL"),
         time %in% c("1995", "2019")) %>%
  select_if(~ n_distinct(.) > 1) %>%
  spread(time, values) %>%
  left_join(geo, by = "geo") %>%
  mutate(values = round(100*((`2019`/`1995`)^(1/24)-1),2)) %>%
  select(-`1995`, -`2019`) %>%
  spread(nace_r2, values) %>%
  arrange(`C33`) %>%
  mutate(Flag = gsub(" ", "-", str_to_lower(Geo)),
         Flag = paste0('<img src="../../bib/flags/vsmall/', Flag, '.png" alt="Flag">')) %>%
  select(Flag, everything()) %>%
  {if (is_html_output()) datatable(., filter = 'top', rownames = F, escape = F) else .}
Table - PD10_EUR
Code
nama_10_a64 %>%
  filter(na_item == "B1G",
         unit == "PD10_EUR",
         nace_r2 %in% c("C33", "TOTAL"),
         time %in% c("1995", "2019")) %>%
  select_if(~ n_distinct(.) > 1) %>%
  spread(time, values) %>%
  left_join(geo, by = "geo") %>%
  mutate(values = round(100*((`2019`/`1995`)^(1/24)-1),2)) %>%
  select(-`1995`, -`2019`) %>%
  spread(nace_r2, values) %>%
  arrange(`C33`) %>%
  mutate(Flag = gsub(" ", "-", str_to_lower(Geo)),
         Flag = paste0('<img src="../../bib/flags/vsmall/', Flag, '.png" alt="Flag">')) %>%
  select(Flag, everything()) %>%
  {if (is_html_output()) datatable(., filter = 'top', rownames = F, escape = F) else .}
Graph
Code
nama_10_a64 %>%
  filter(na_item == "B1G",
         nace_r2 %in% c("C33", "TOTAL"),
         geo %in% c("FR", "DE", "IT", "ES"),
         unit == "PD10_NAC") %>%
  year_to_date() %>%
  filter(date >= as.Date("1995-01-01")) %>%
  left_join(geo, by = "geo") %>%
  select(geo,  Geo, nace_r2, date, values) %>%
  spread(nace_r2, values) %>%
  mutate(values = C33/TOTAL)  %>%
  left_join(colors, by = c("Geo" = "country")) %>%
  group_by(Geo) %>%
  mutate(values = values/ values[1]) %>%
  ggplot(.) + geom_line(aes(x = date, y = values, color = color)) +
  theme_minimal() + xlab("") + ylab("Price Deflator (C33)") +
  scale_color_identity() + add_4flags +
  scale_x_date(breaks = seq(1960, 2100, 5) %>% paste0("-01-01") %>% as.Date,
               labels = date_format("%Y")) +
  scale_y_continuous(breaks = 0.01*seq(-500, 200, 10))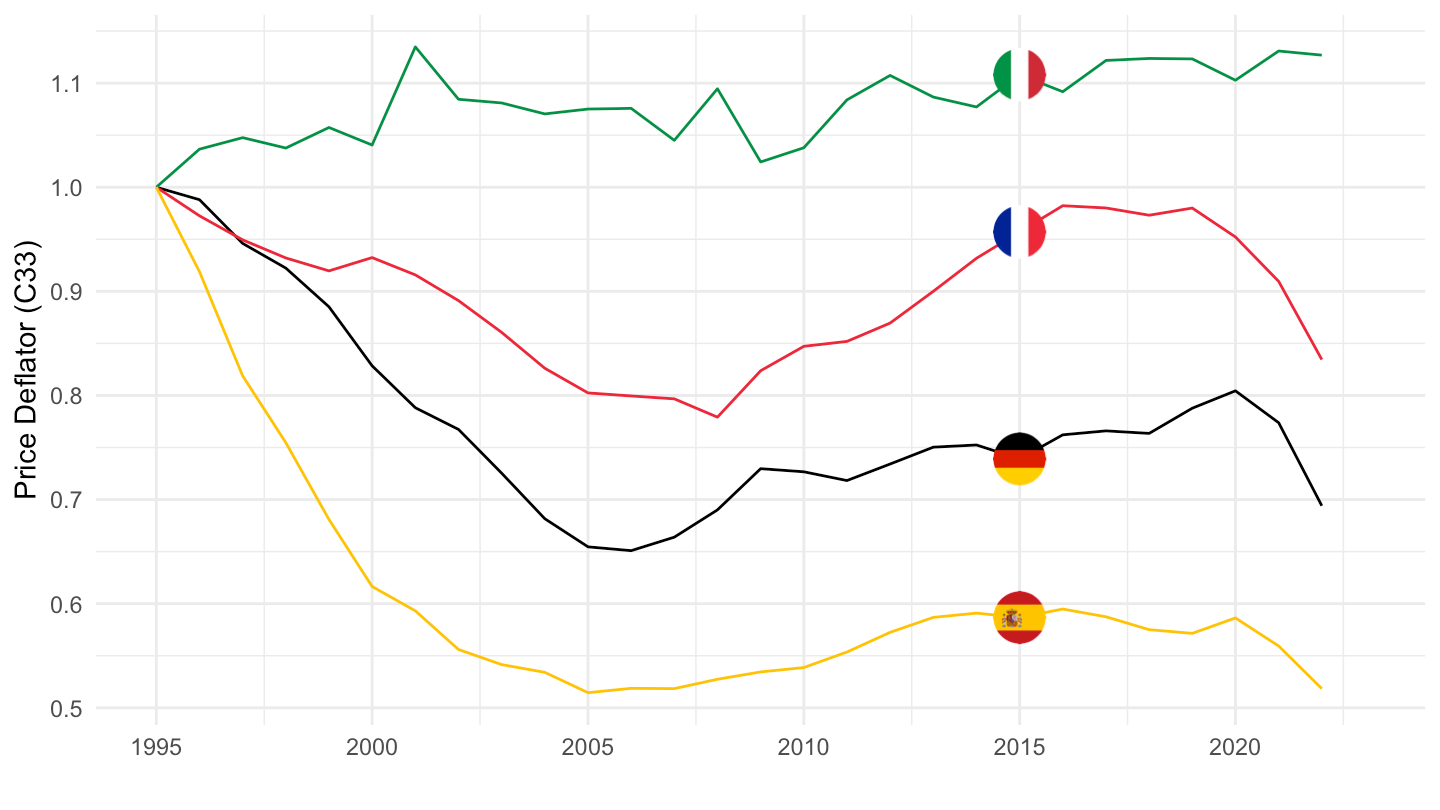
Germany, Italy, France, Spain, Netherlands
Table
Code
load_data("eurostat/nace_r2_fr.RData")
nama_10_a64 %>%
  filter(na_item == "B1G",
         geo %in% c("FR", "DE", "IT", "ES"),
         unit == "CP_MNAC",
         time %in% c("2018")) %>%
  filter(!grepl("C", nace_r2) | nace_r2 == "TOTAL") %>%
  select(-na_item, -unit, -time) %>%
  left_join(nace_r2, by = "nace_r2") %>%
  left_join(geo, by = "geo") %>%
  mutate(Flag = gsub(" ", "-", str_to_lower(Geo)),
         Flag = paste0('<img src="../../bib/flags/vsmall/', Flag, '.png" alt="Flag">')) %>%
  select(nace_r2, Nace_r2, Flag, values) %>%
  group_by(Flag) %>%
  mutate(values = round(100*values/ values[nace_r2 == "TOTAL"], 1)) %>%
  filter(nace_r2 != "TOTAL")  %>%
  spread(Flag, values) %>%
  {if (is_html_output()) datatable(., filter = 'top', rownames = F, escape = F) else .}
Table - Manufacturing
Code
load_data("eurostat/nace_r2_fr.RData")
nama_10_a64 %>%
  filter(na_item == "B1G",
         geo %in% c("FR", "DE", "IT", "ES"),
         unit == "CP_MNAC",
         time %in% c("2018")) %>%
  filter(grepl("C", nace_r2) | nace_r2 == "TOTAL") %>%
  select(-na_item, -unit, -time) %>%
  left_join(nace_r2, by = "nace_r2") %>%
  left_join(geo, by = "geo") %>%
  mutate(Flag = gsub(" ", "-", str_to_lower(Geo)),
         Flag = paste0('<img src="../../bib/flags/vsmall/', Flag, '.png" alt="Flag">')) %>%
  select(nace_r2, Nace_r2, Flag, values) %>%
  group_by(Flag) %>%
  mutate(values = round(100*values/ values[nace_r2 == "TOTAL"], 1)) %>%
  filter(nace_r2 != "TOTAL")  %>%
  spread(Flag, values) %>%
  {if (is_html_output()) datatable(., filter = 'top', rownames = F, escape = F) else .}
B - Mining and quarrying
Code
nama_10_a64 %>%
  filter(na_item == "B1G",
         nace_r2 %in% c("B", "TOTAL"),
         geo %in% c("FR", "DE", "IT", "ES", "EL"),
         unit == "CP_MNAC") %>%
  year_to_date() %>%
  filter(date >= as.Date("1995-01-01")) %>%
  left_join(geo, by = "geo") %>%
  select(geo,  Geo, nace_r2, date, values) %>%
  spread(nace_r2, values) %>%
  mutate(values = `B`/TOTAL) %>%
  left_join(colors, by = c("Geo" = "country")) %>%
  ggplot(.) + geom_line(aes(x = date, y = values, color = color)) +
  theme_minimal() + xlab("") + ylab("Mining and quarrying (% of GDP)") +
  scale_color_identity() + add_5flags +
  scale_x_date(breaks = seq(1960, 2100, 2) %>% paste0("-01-01") %>% as.Date,
               labels = date_format("%Y")) +
  scale_y_continuous(breaks = 0.01*seq(-500, 200, .1),
                     labels = percent_format(accuracy = .1))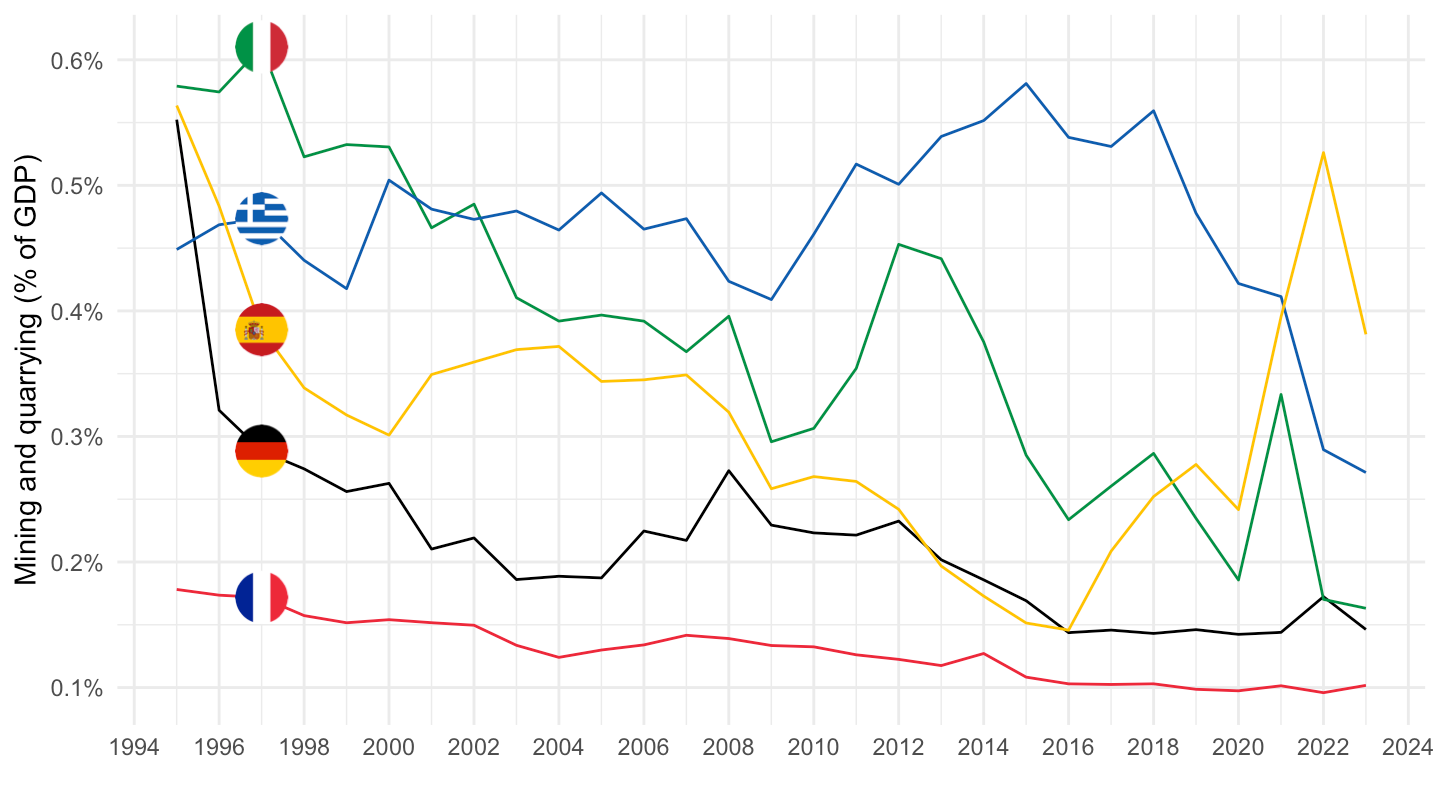
D - Electricity, gas, steam and air conditioning supply
Value
Code
nama_10_a64 %>%
  filter(na_item == "B1G",
         nace_r2 %in% c("D", "TOTAL"),
         geo %in% c("FR", "DE", "IT", "ES", "EL"),
         unit == "CP_MNAC") %>%
  year_to_date() %>%
  filter(date >= as.Date("1995-01-01")) %>%
  left_join(geo, by = "geo") %>%
  select(geo,  Geo, nace_r2, date, values) %>%
  spread(nace_r2, values) %>%
  mutate(values = `D`/TOTAL) %>%
  left_join(colors, by = c("Geo" = "country")) %>%
  ggplot(.) + geom_line(aes(x = date, y = values, color = color)) +
  theme_minimal() + xlab("") + ylab("Electricity, gas, steam and air conditioning supply (% of GDP)") +
  scale_color_identity() + add_5flags +
  scale_x_date(breaks = seq(1961, 2100, 2) %>% paste0("-01-01") %>% as.Date,
               labels = date_format("%Y")) +
  scale_y_continuous(breaks = 0.01*seq(-500, 200, .5),
                     labels = percent_format(accuracy = .1))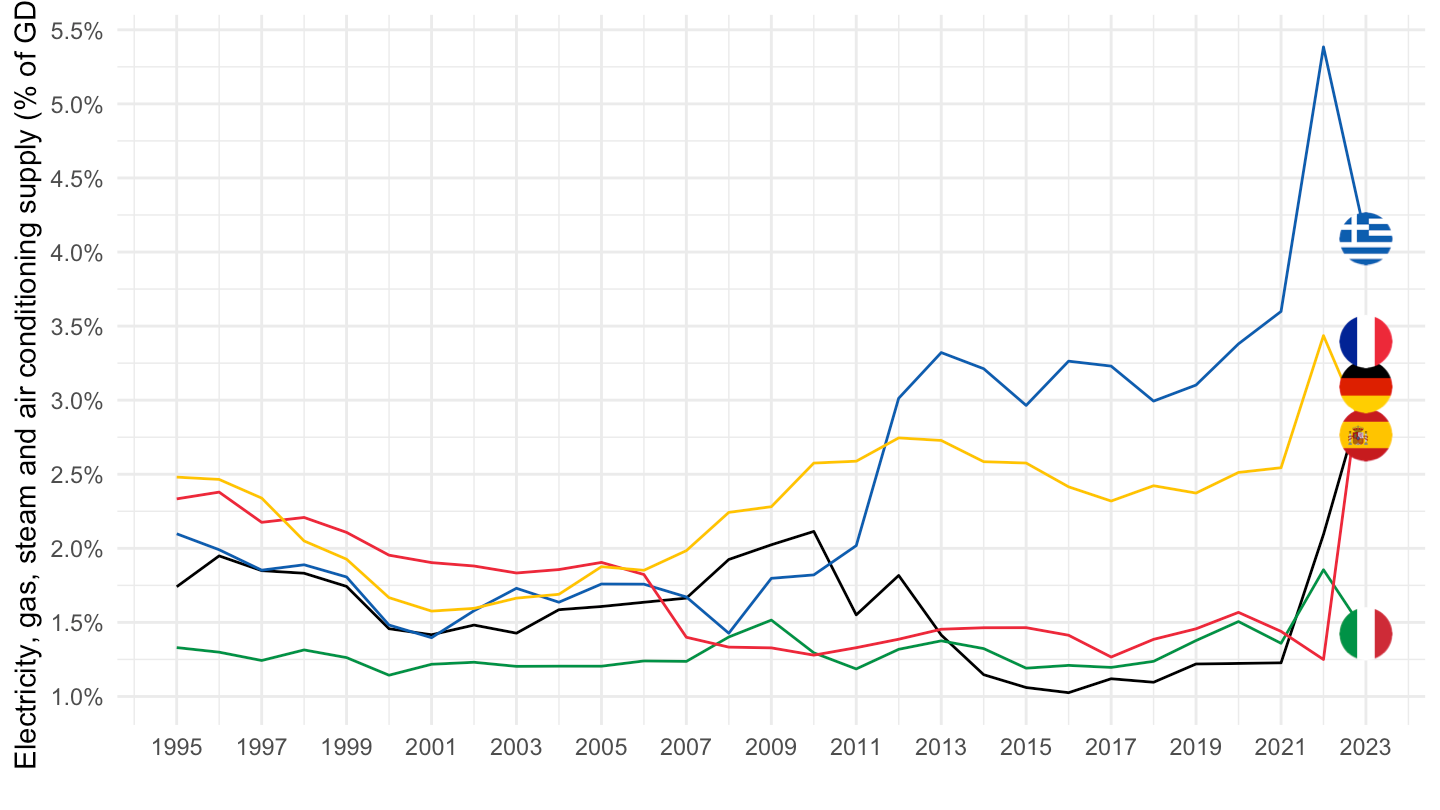
Volume
Code
nama_10_a64 %>%
  filter(na_item == "B1G",
         nace_r2 %in% c("D", "TOTAL"),
         geo %in% c("FR", "DE", "IT", "ES", "EL"),
         unit == "CLV10_MEUR") %>%
  year_to_date() %>%
  filter(date >= as.Date("1995-01-01")) %>%
  left_join(geo, by = "geo") %>%
  select(geo,  Geo, nace_r2, date, values) %>%
  spread(nace_r2, values) %>%
  mutate(values = `D`/TOTAL) %>%
  left_join(colors, by = c("Geo" = "country")) %>%
  ggplot(.) + geom_line(aes(x = date, y = values, color = color)) +
  theme_minimal() + xlab("") + ylab("Electricity, gas, steam - Volume (% of GDP)") +
  scale_color_identity() + add_5flags +
  scale_x_date(breaks = seq(1960, 2100, 5) %>% paste0("-01-01") %>% as.Date,
               labels = date_format("%Y")) +
  scale_y_continuous(breaks = 0.01*seq(-500, 200, .2),
                     labels = percent_format(accuracy = .1))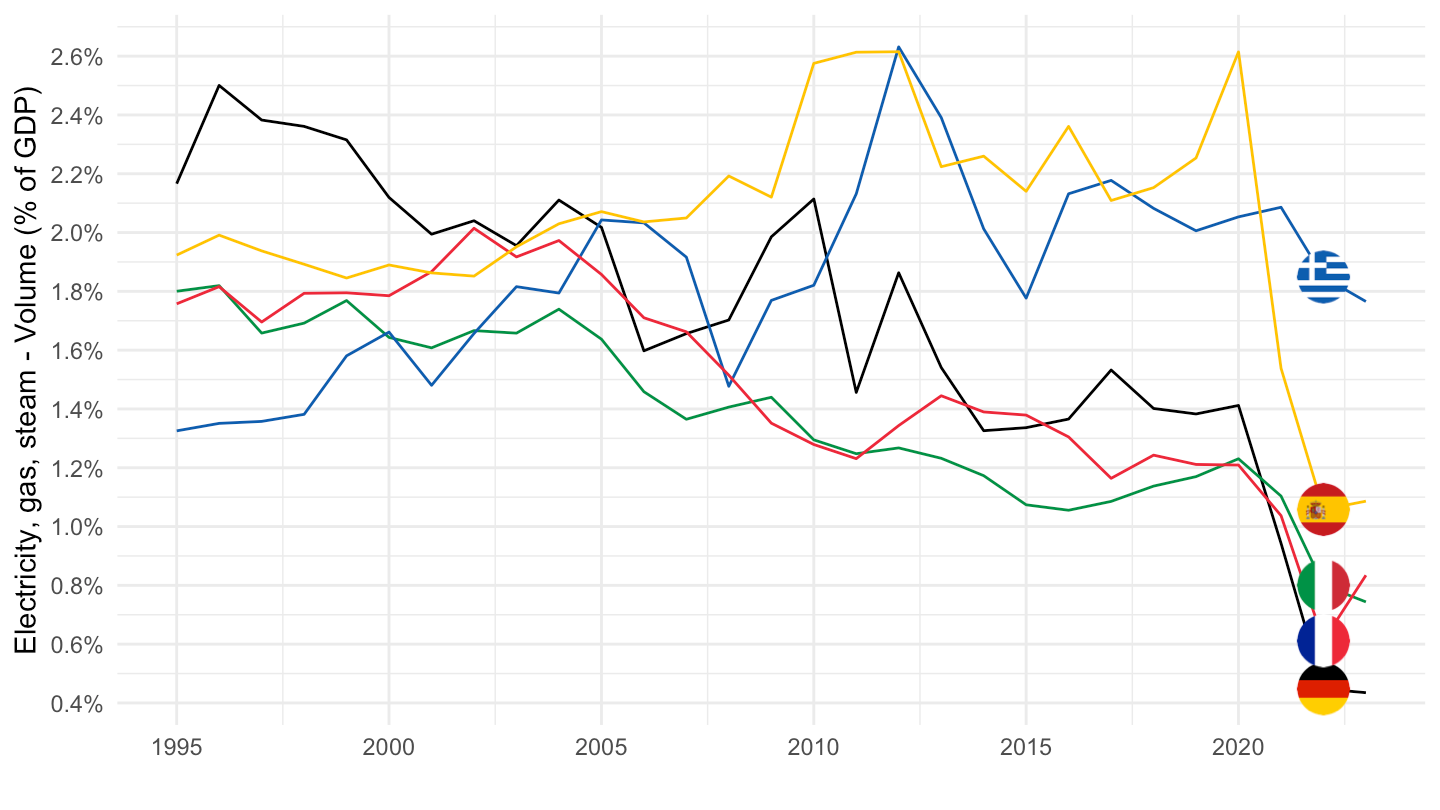
1995-
Code
nama_10_a64 %>%
  filter(na_item == "B1G",
         nace_r2 %in% c("D", "TOTAL"),
         geo %in% c("FR", "DE", "IT", "ES", "EL"),
         unit == "PD10_NAC") %>%
  year_to_date() %>%
  left_join(geo, by = "geo") %>%
  select(geo,  Geo, nace_r2, date, values) %>%
  spread(nace_r2, values) %>%
  mutate(values = D/TOTAL)  %>%
  filter(date >= as.Date("1995-01-01")) %>%
  left_join(colors, by = c("Geo" = "country")) %>%
  ggplot(.) + geom_line(aes(x = date, y = values, color = color)) +
  theme_minimal() + xlab("") + ylab("Price Deflator") +
  scale_color_identity() + add_5flags +
  scale_x_date(breaks = seq(1960, 2100, 5) %>% paste0("-01-01") %>% as.Date,
               labels = date_format("%Y")) +
  scale_y_continuous(breaks = 0.01*seq(-500, 200, 10))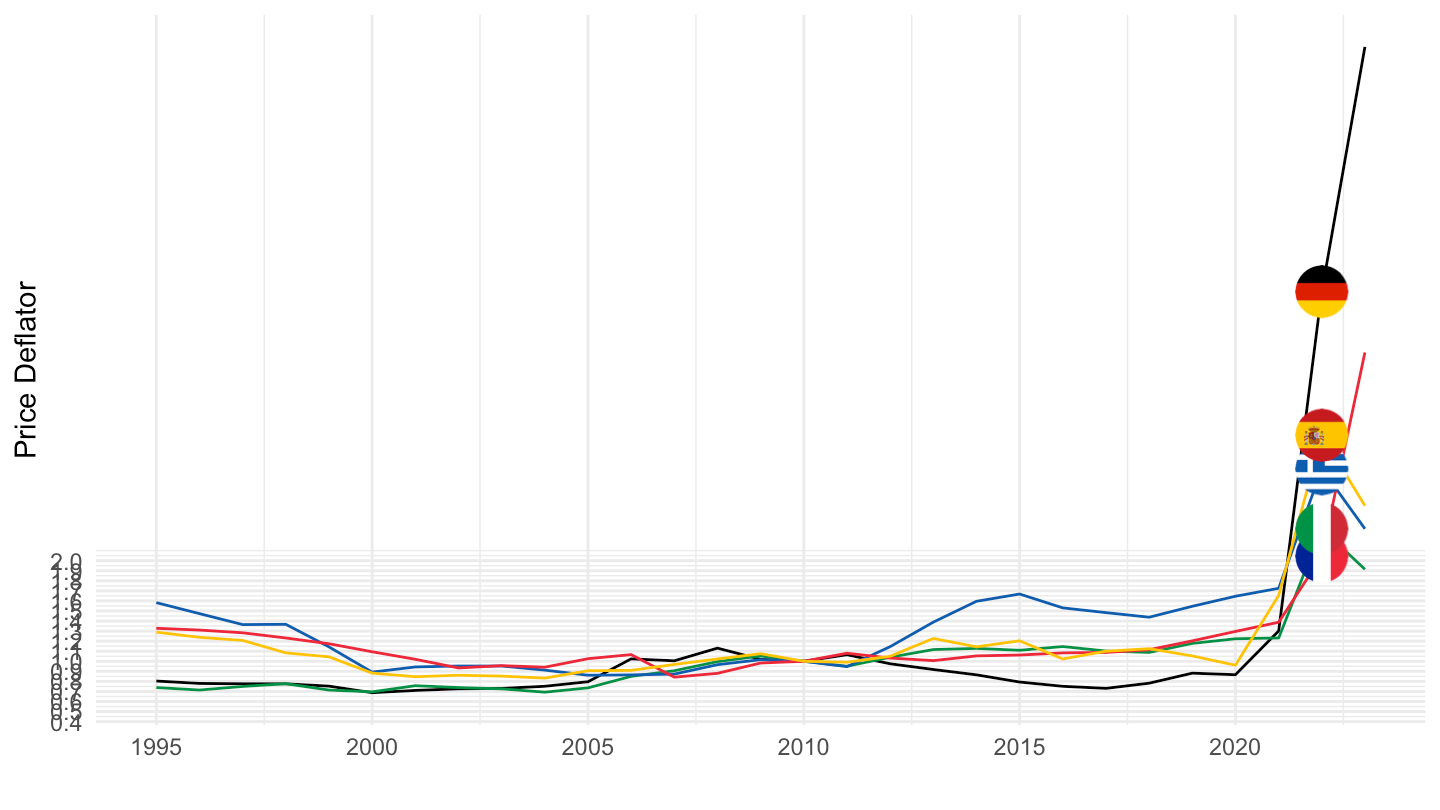
C - Manufacturing
Value
All
Code
nama_10_a64 %>%
  filter(na_item == "B1G",
         nace_r2 %in% c("C", "TOTAL"),
         geo %in% c("FR", "DE", "IT", "ES", "NL", "EL"),
         unit == "CP_MNAC") %>%
  year_to_date() %>%
  left_join(geo, by = "geo") %>%
  select(geo,  Geo, nace_r2, date, values) %>%
  spread(nace_r2, values) %>%
  mutate(values = `C`/TOTAL) %>%
  left_join(colors, by = c("Geo" = "country")) %>%
  ggplot(.) + geom_line(aes(x = date, y = values, color = color)) +
  theme_minimal() + xlab("") + ylab("Manufacturing (% of GDP)") +
  scale_color_identity() + add_6flags +
  scale_x_date(breaks = seq(1960, 2100, 5) %>% paste0("-01-01") %>% as.Date,
               labels = date_format("%Y")) +
  scale_y_continuous(breaks = 0.01*seq(-500, 200, 1),
                     labels = percent_format(accuracy = 1))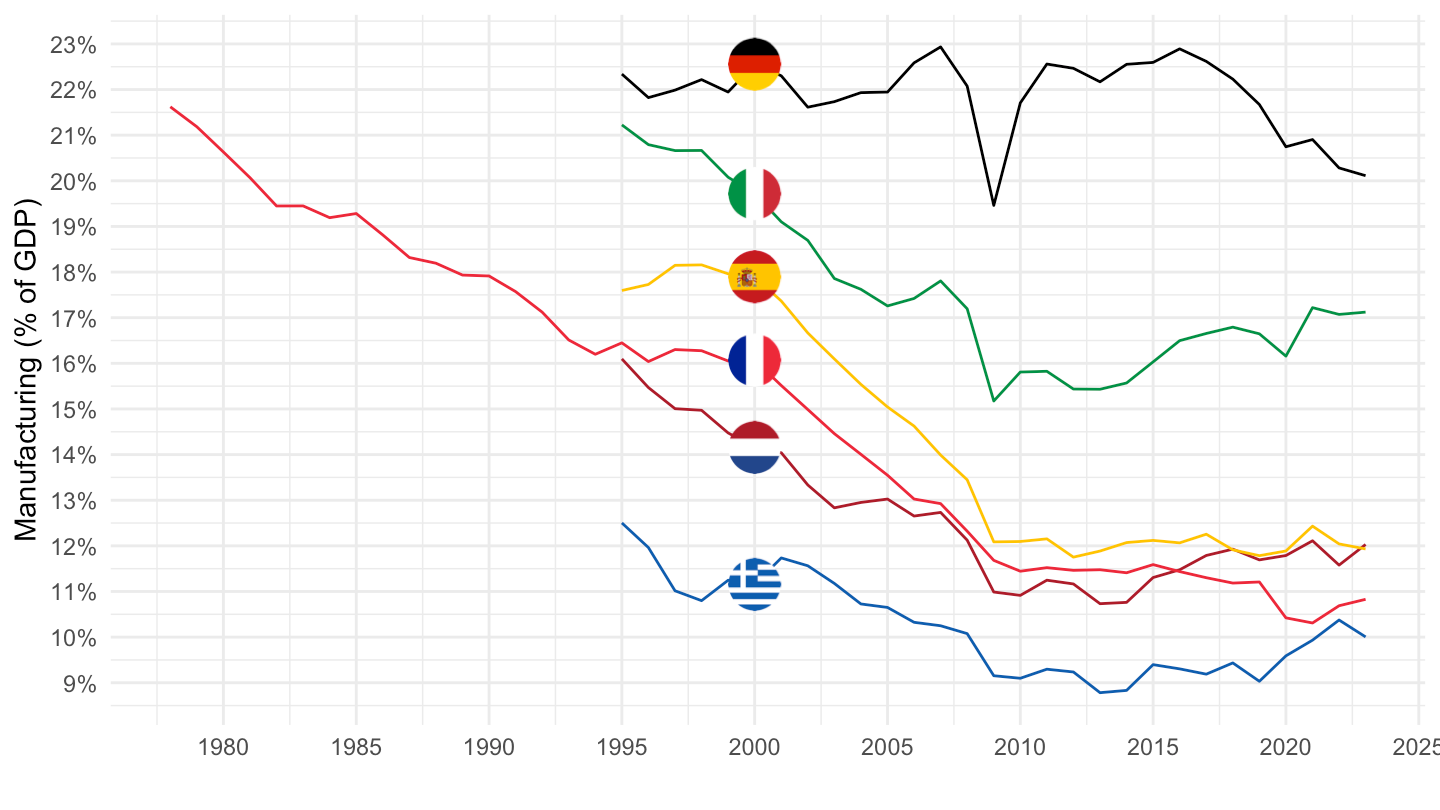
1995-
Code
nama_10_a64 %>%
  filter(na_item == "B1G",
         nace_r2 %in% c("C", "TOTAL"),
         geo %in% c("FR", "DE", "IT", "ES", "NL", "EL"),
         unit == "CP_MNAC") %>%
  year_to_date() %>%
  filter(date >= as.Date("1995-01-01")) %>%
  left_join(geo, by = "geo") %>%
  select(geo,  Geo, nace_r2, date, values) %>%
  spread(nace_r2, values) %>%
  mutate(values = `C`/TOTAL) %>%
  left_join(colors, by = c("Geo" = "country")) %>%
  ggplot(.) + geom_line(aes(x = date, y = values, color = color)) +
  theme_minimal() + xlab("") + ylab("Manufacturing (% of GDP)") +
  scale_color_identity() + add_6flags +
  scale_x_date(breaks = seq(1995, 2100, 2) %>% paste0("-01-01") %>% as.Date,
               labels = date_format("%Y")) +
  scale_y_continuous(breaks = 0.01*seq(-500, 200, 1),
                     labels = percent_format(accuracy = 1))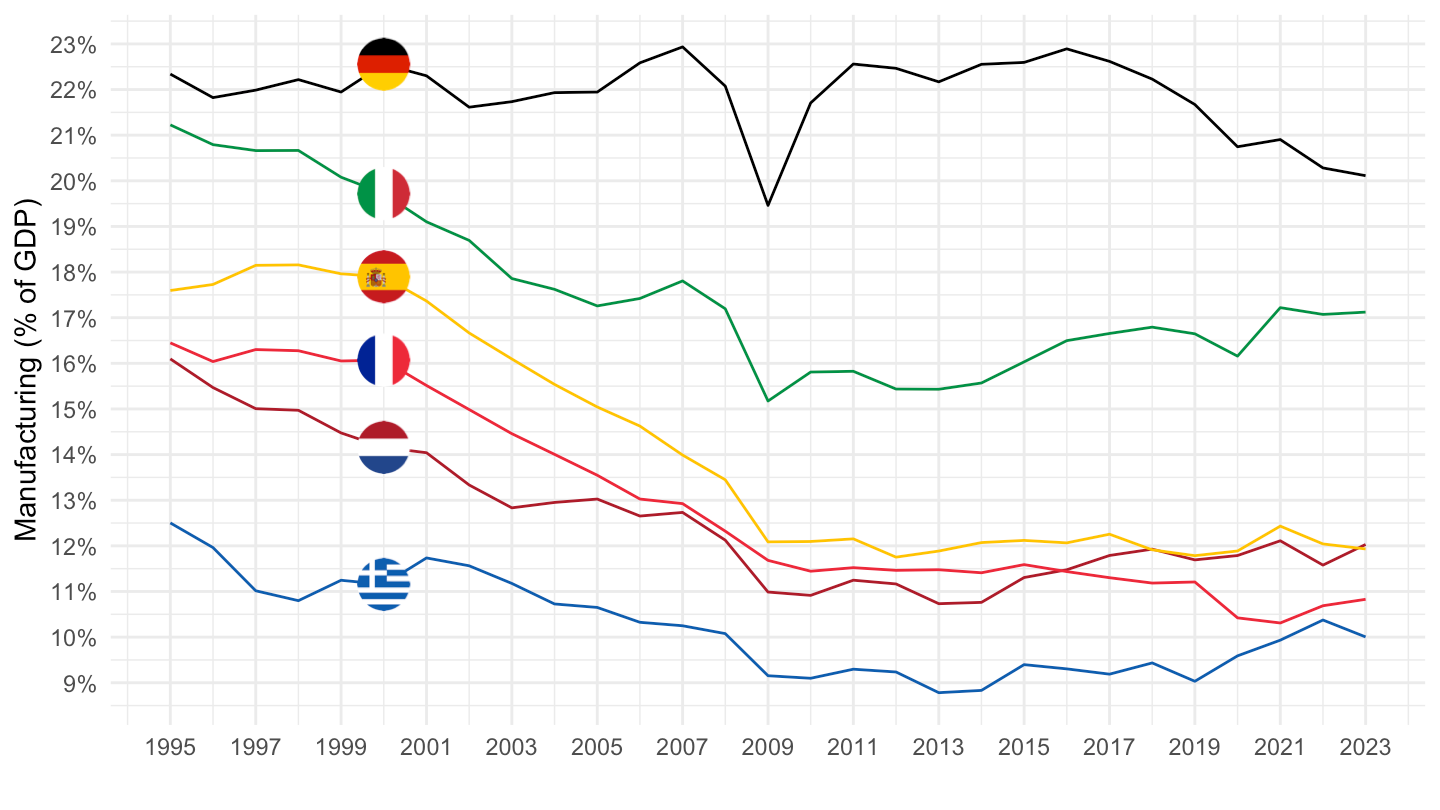
Volume
Code
nama_10_a64 %>%
  filter(na_item == "B1G",
         nace_r2 %in% c("C", "TOTAL"),
         geo %in% c("FR", "DE", "IT", "ES"),
         unit == "CLV10_MEUR") %>%
  year_to_date() %>%
  left_join(geo, by = "geo") %>%
  select(geo,  Geo, nace_r2, date, values) %>%
  spread(nace_r2, values) %>%
  mutate(values = `C`/TOTAL) %>%
  left_join(colors, by = c("Geo" = "country")) %>%
  ggplot(.) + geom_line(aes(x = date, y = values, color = color)) +
  theme_minimal() + xlab("") + ylab("Manufacturing (% of GDP)") +
  scale_color_identity() + add_4flags +
  scale_x_date(breaks = seq(1960, 2100, 5) %>% paste0("-01-01") %>% as.Date,
               labels = date_format("%Y")) +
  scale_y_continuous(breaks = 0.01*seq(-500, 200, 1),
                     labels = percent_format(accuracy = 1))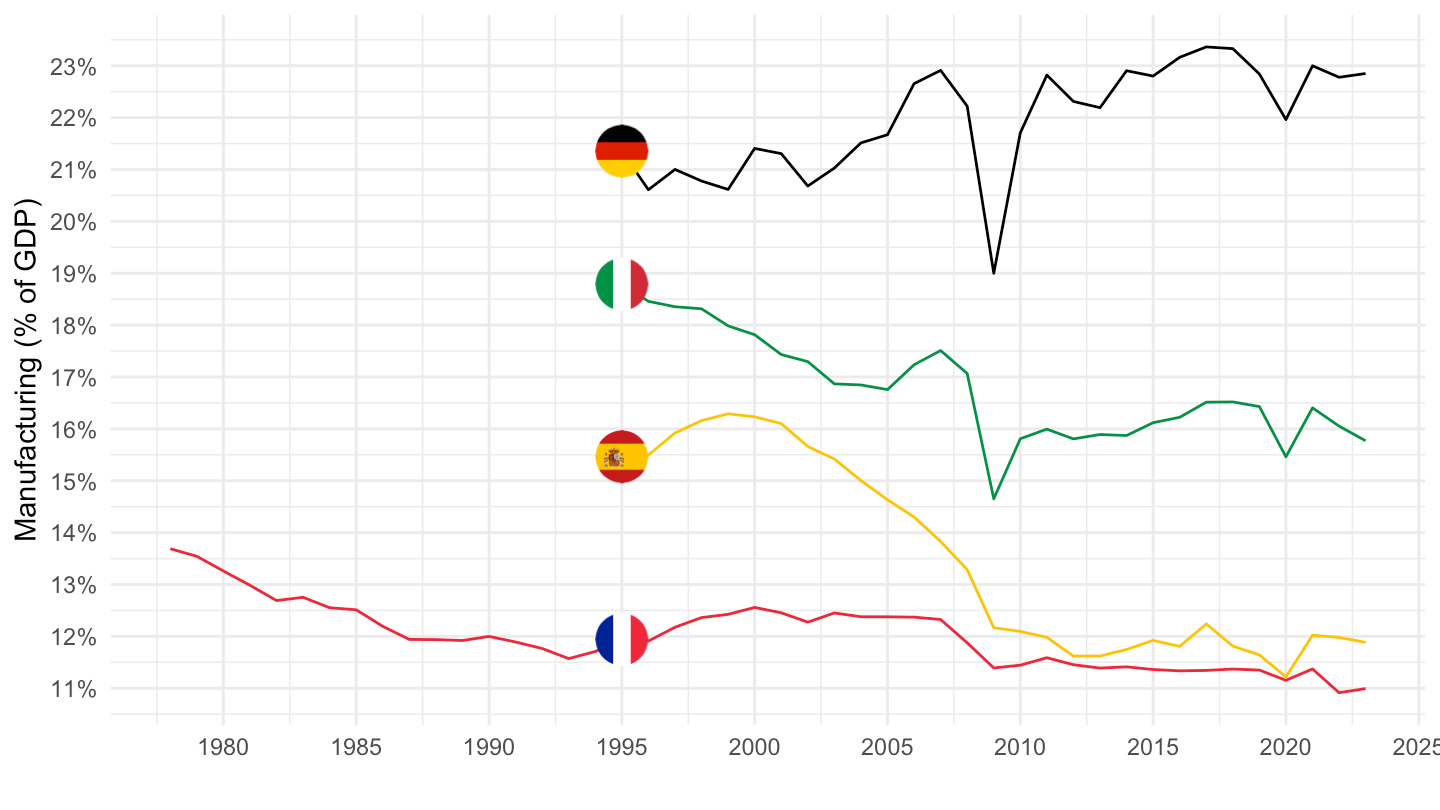
Price Deflator
All
Code
nama_10_a64 %>%
  filter(na_item == "B1G",
         nace_r2 %in% c("C", "TOTAL"),
         geo %in% c("FR", "DE", "IT", "ES"),
         unit == "PD10_NAC") %>%
  year_to_date() %>%
  left_join(geo, by = "geo") %>%
  select(geo,  Geo, nace_r2, date, values) %>%
  spread(nace_r2, values) %>%
  mutate(values = C/TOTAL)  %>%
  left_join(colors, by = c("Geo" = "country")) %>%
  ggplot(.) + geom_line(aes(x = date, y = values, color = color)) +
  theme_minimal() + xlab("") + ylab("Price Deflator") +
  scale_color_identity() + add_4flags +
  scale_x_date(breaks = seq(1960, 2100, 5) %>% paste0("-01-01") %>% as.Date,
               labels = date_format("%Y")) +
  scale_y_continuous(breaks = 0.01*seq(-500, 200, 10))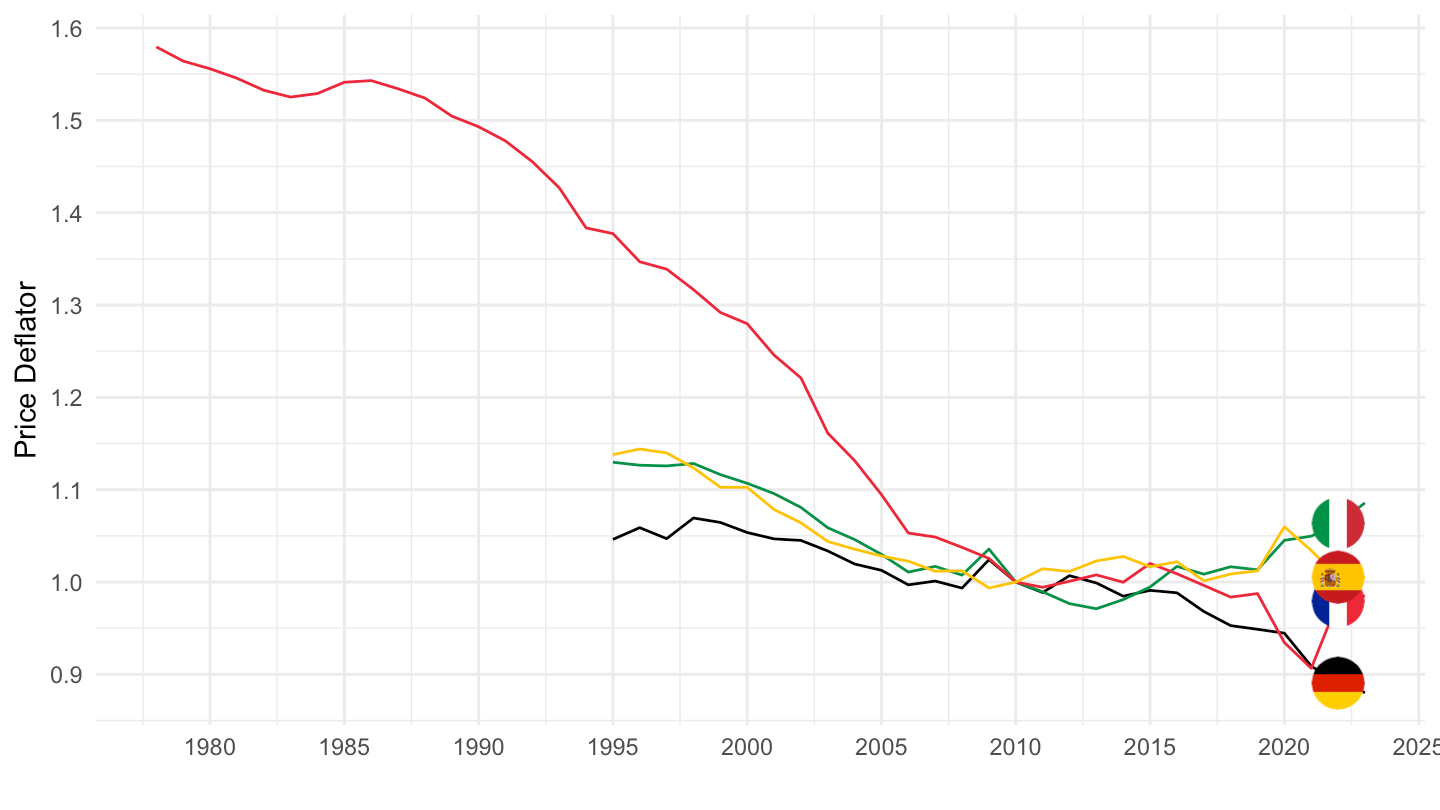
1995-
Code
nama_10_a64 %>%
  filter(na_item == "B1G",
         nace_r2 %in% c("C", "TOTAL"),
         geo %in% c("FR", "DE", "IT", "ES"),
         unit == "PD10_NAC") %>%
  year_to_date() %>%
  left_join(geo, by = "geo") %>%
  select(geo,  Geo, nace_r2, date, values) %>%
  spread(nace_r2, values) %>%
  mutate(values = C/TOTAL)  %>%
  filter(date >= as.Date("1995-01-01")) %>%
  left_join(colors, by = c("Geo" = "country")) %>%
  ggplot(.) + geom_line(aes(x = date, y = values, color = color)) +
  theme_minimal() + xlab("") + ylab("Price Deflator") +
  scale_color_identity() + add_4flags +
  scale_x_date(breaks = seq(1960, 2100, 5) %>% paste0("-01-01") %>% as.Date,
               labels = date_format("%Y")) +
  scale_y_continuous(breaks = 0.01*seq(-500, 200, 10))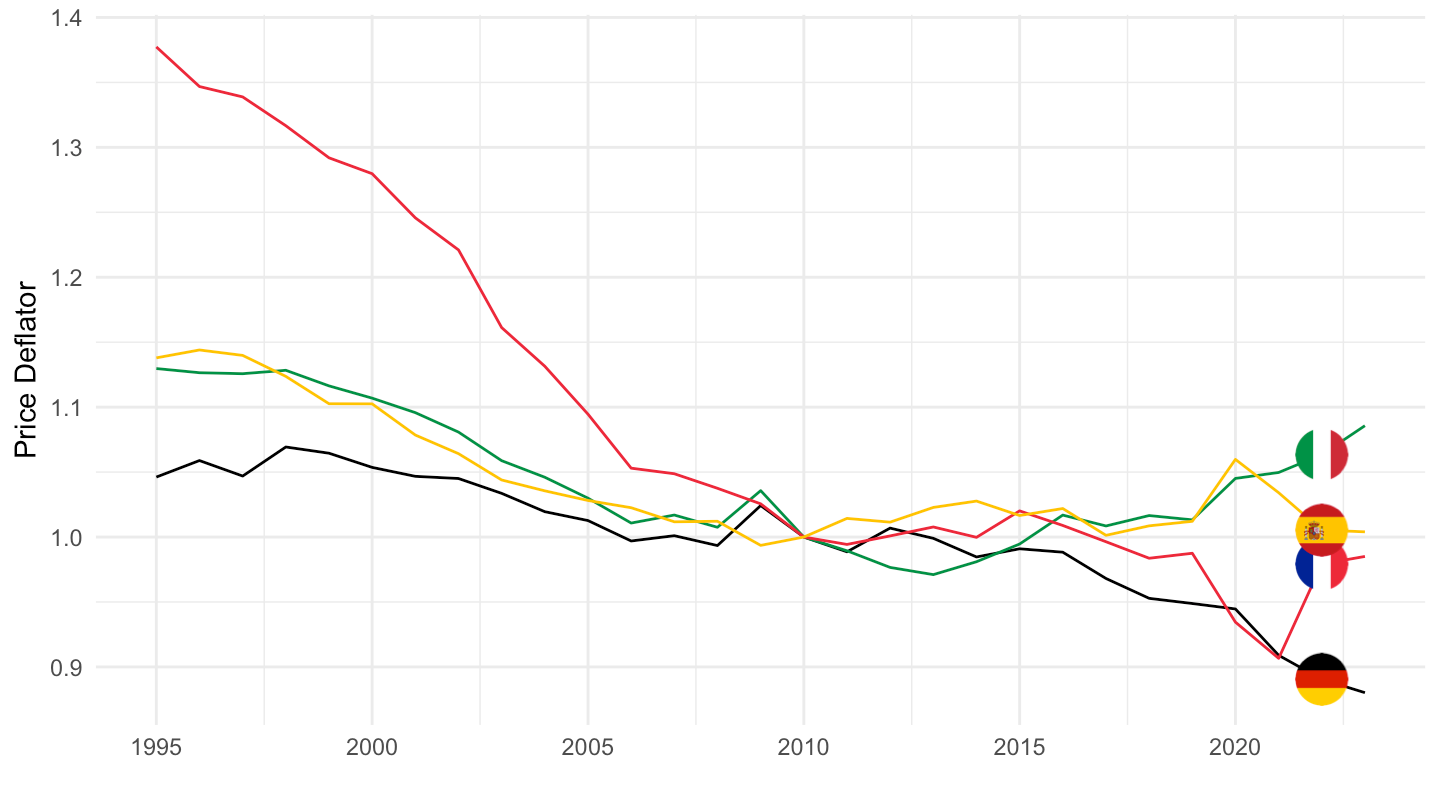
C10-C12 - Food products
Value
All
Code
nama_10_a64 %>%
  filter(na_item == "B1G",
         nace_r2 %in% c("C10-C12", "TOTAL"),
         geo %in% c("FR", "DE", "IT", "ES"),
         unit == "CP_MNAC") %>%
  year_to_date() %>%
  left_join(geo, by = "geo") %>%
  select(geo,  Geo, nace_r2, date, values) %>%
  spread(nace_r2, values) %>%
  mutate(values = `C10-C12`/TOTAL) %>%
  left_join(colors, by = c("Geo" = "country")) %>%
  ggplot(.) + geom_line(aes(x = date, y = values, color = color)) +
  theme_minimal() + xlab("") + ylab("Food products (% of GDP)") +
  scale_color_identity() + add_4flags +
  scale_x_date(breaks = seq(1960, 2100, 5) %>% paste0("-01-01") %>% as.Date,
               labels = date_format("%Y")) +
  scale_y_continuous(breaks = 0.01*seq(-500, 200, 0.1),
                     labels = percent_format(accuracy = .1))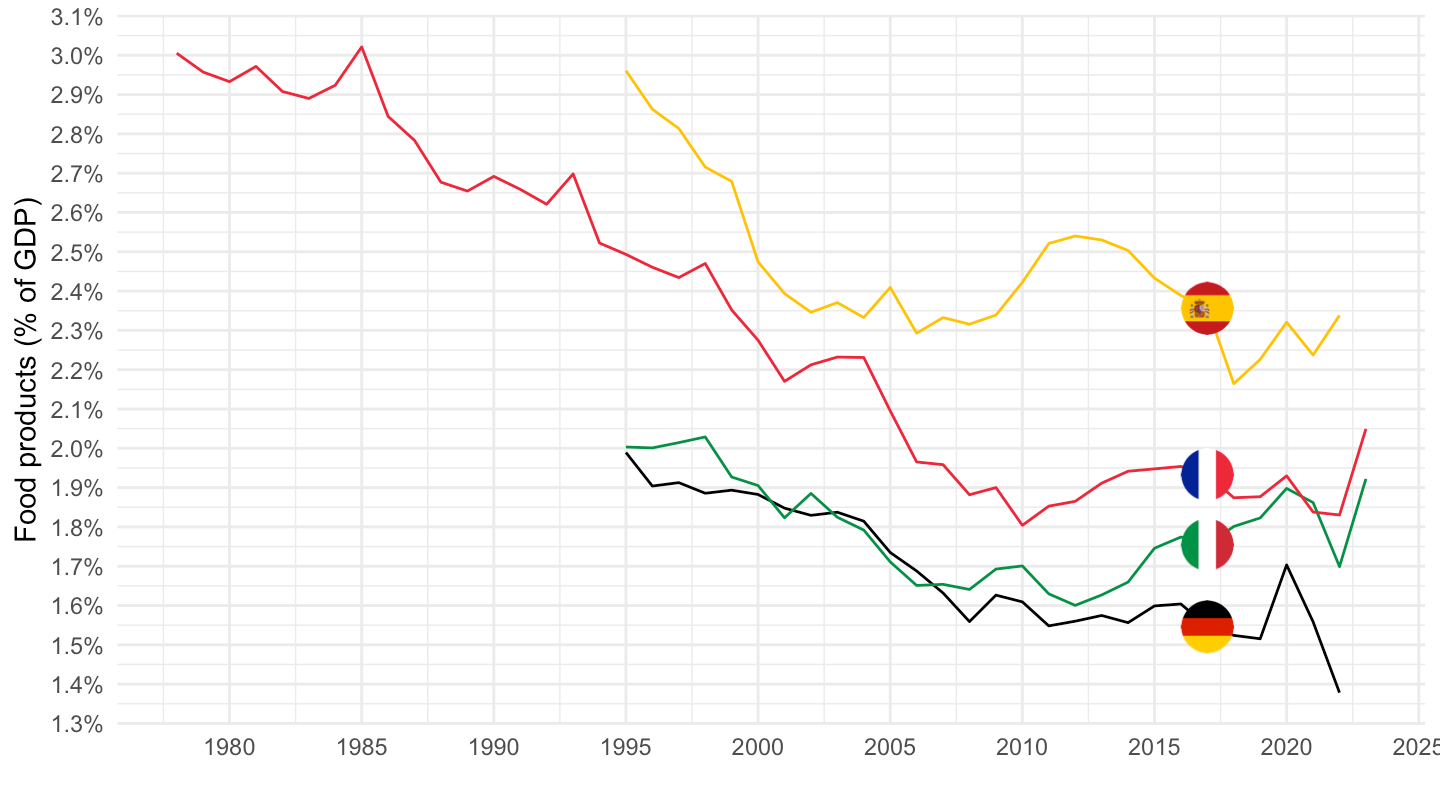
1995-
Code
nama_10_a64 %>%
  filter(na_item == "B1G",
         nace_r2 %in% c("C10-C12", "TOTAL"),
         geo %in% c("FR", "DE", "IT", "ES", "NL"),
         unit == "CP_MNAC") %>%
  year_to_date() %>%
  filter(date >= as.Date("1995-01-01")) %>%
  left_join(geo, by = "geo") %>%
  select(geo,  Geo, nace_r2, date, values) %>%
  spread(nace_r2, values) %>%
  left_join(colors, by = c("Geo" = "country")) %>%
  mutate(color = ifelse(geo == "NL", color2, color)) %>%
  mutate(values = `C10-C12`/TOTAL) %>%
  ggplot(.) + geom_line(aes(x = date, y = values, color = color)) +
  theme_minimal() + xlab("") + ylab("Food products (% of GDP)") +
  scale_color_identity() + add_5flags +
  scale_x_date(breaks = seq(1960, 2026, 2) %>% paste0("-01-01") %>% as.Date,
               labels = date_format("%Y")) +
  theme(legend.position = "none") +
  scale_y_continuous(breaks = 0.01*seq(-500, 200, 0.1),
                     labels = percent_format(accuracy = .1))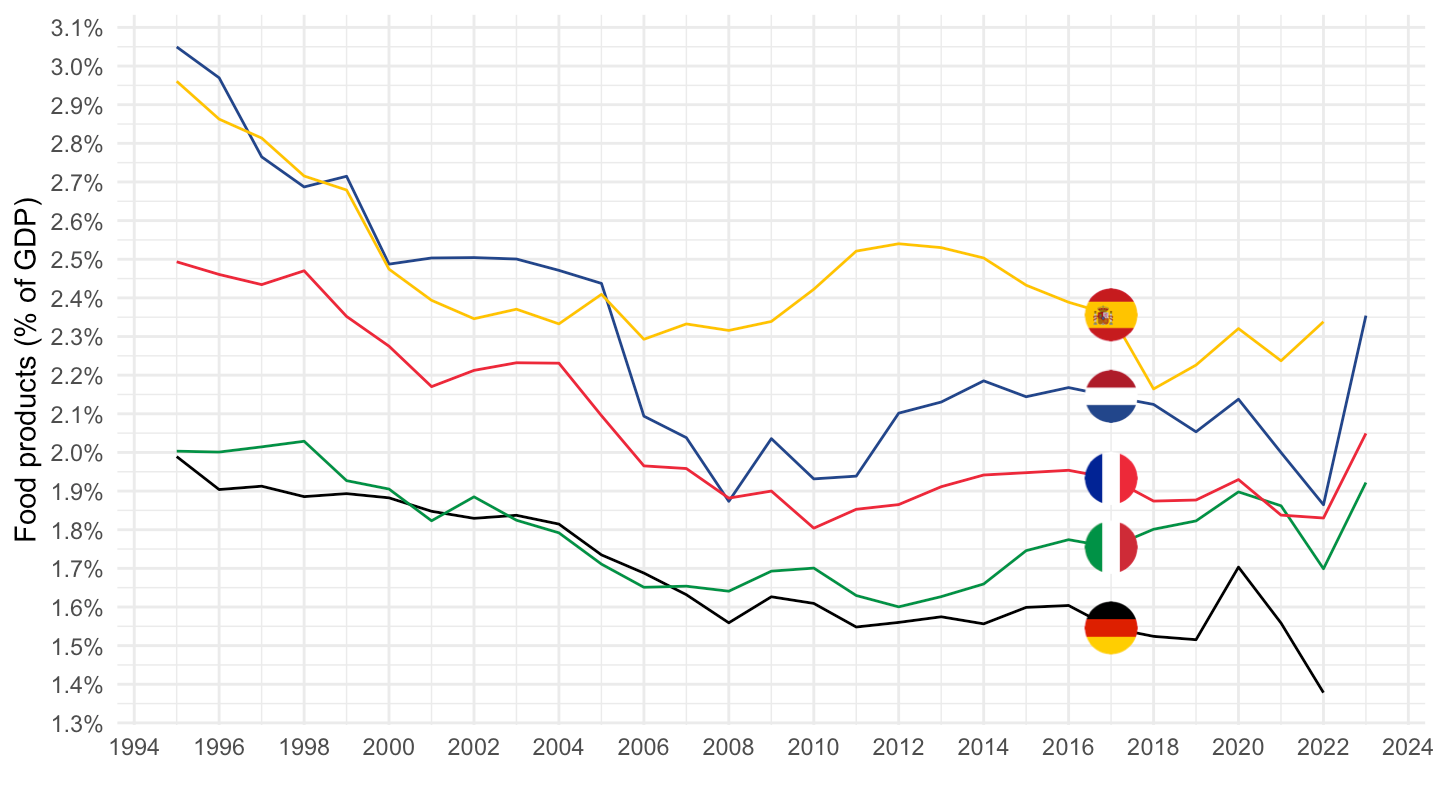
Volume
Code
nama_10_a64 %>%
  filter(na_item == "B1G",
         nace_r2 %in% c("C10-C12", "TOTAL"),
         geo %in% c("FR", "DE", "IT", "ES"),
         unit == "CLV10_MEUR") %>%
  year_to_date() %>%
  left_join(geo, by = "geo") %>%
  select(geo,  Geo, nace_r2, date, values) %>%
  spread(nace_r2, values) %>%
  mutate(values = `C10-C12`/TOTAL) %>%
  left_join(colors, by = c("Geo" = "country")) %>%
  ggplot(.) + geom_line(aes(x = date, y = values, color = color)) +
  theme_minimal() + xlab("") + ylab("Food products (% of GDP)") +
  scale_color_identity() + add_4flags +
  scale_x_date(breaks = seq(1960, 2100, 5) %>% paste0("-01-01") %>% as.Date,
               labels = date_format("%Y")) +
  scale_y_continuous(breaks = 0.01*seq(-500, 200, 0.1),
                     labels = percent_format(accuracy = .1))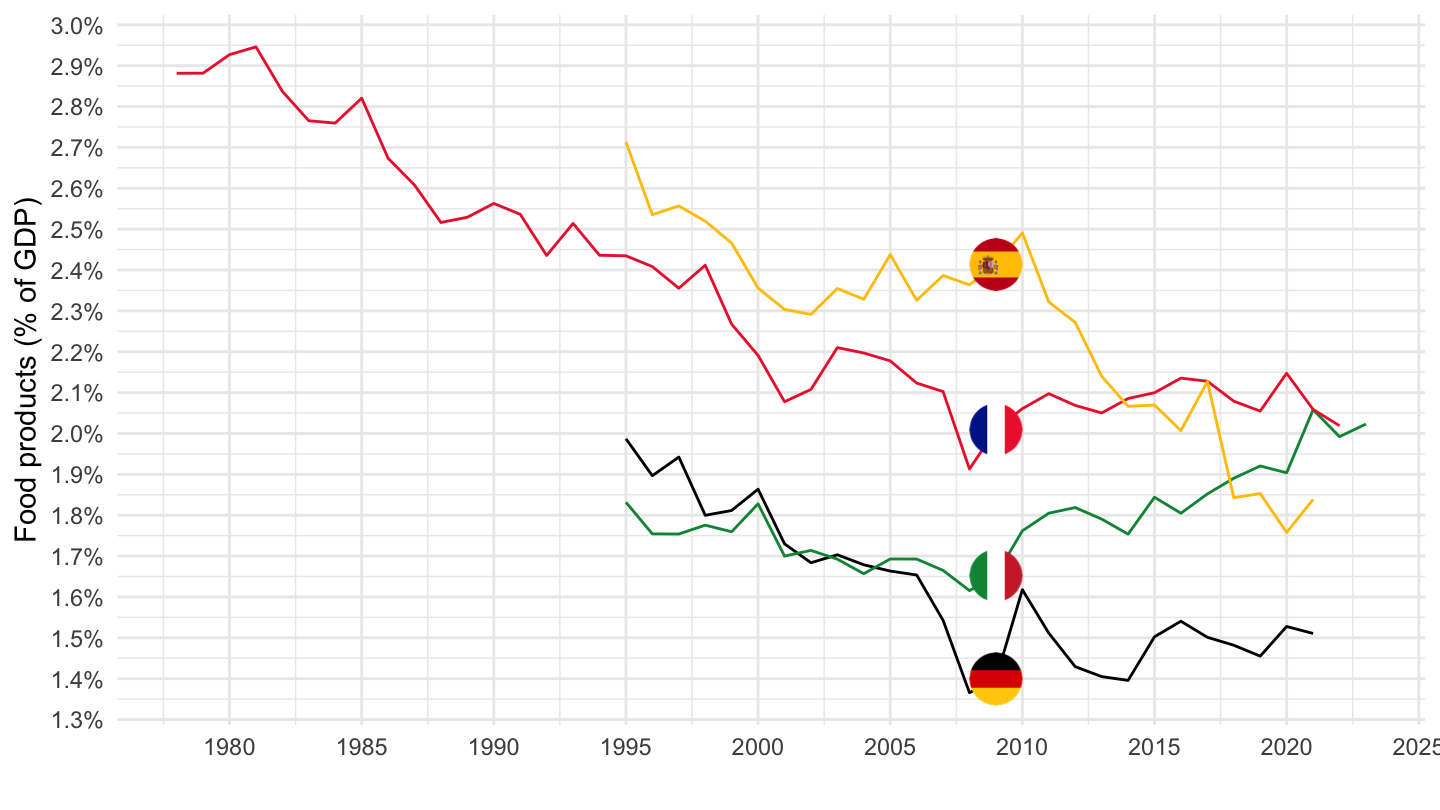
Price Deflator
Code
nama_10_a64 %>%
  filter(na_item == "B1G",
         nace_r2 %in% c("C10-C12", "TOTAL"),
         geo %in% c("FR", "DE", "IT", "ES"),
         unit == "PD10_NAC") %>%
  year_to_date() %>%
  left_join(geo, by = "geo") %>%
  select(geo,  Geo, nace_r2, date, values) %>%
  spread(nace_r2, values) %>%
  mutate(values = `C10-C12`/TOTAL)  %>%
  left_join(colors, by = c("Geo" = "country")) %>%
  ggplot(.) + geom_line(aes(x = date, y = values, color = color)) +
  theme_minimal() + xlab("") + ylab("Price Deflator") +
  scale_color_identity() + add_4flags +
  scale_x_date(breaks = seq(1960, 2100, 5) %>% paste0("-01-01") %>% as.Date,
               labels = date_format("%Y")) +
  scale_y_continuous(breaks = 0.01*seq(-500, 200, 10))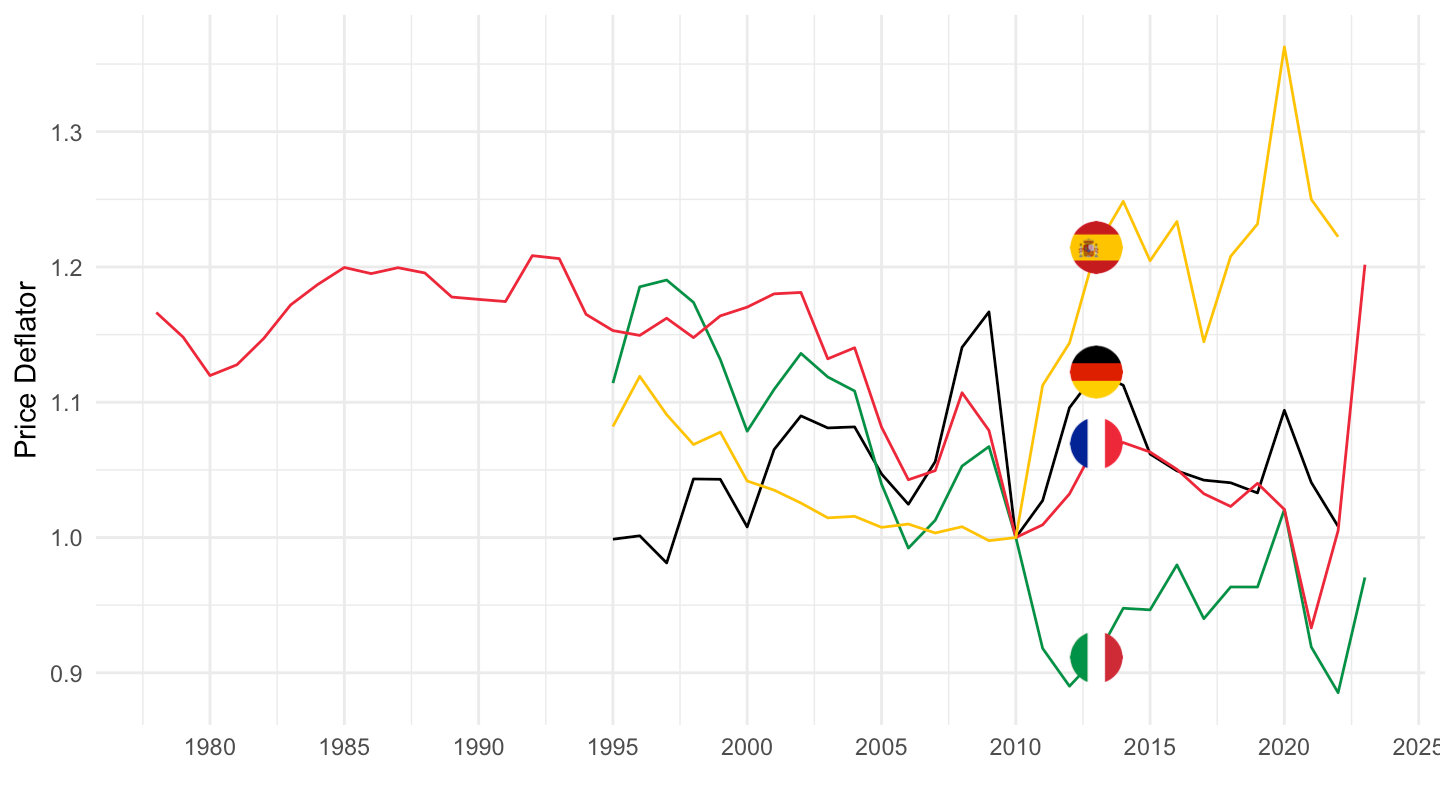
C13-C15 - Textiles
Value
All
Code
nama_10_a64 %>%
  filter(na_item == "B1G",
         nace_r2 %in% c("C13-C15", "TOTAL"),
         geo %in% c("FR", "DE", "IT", "ES"),
         unit == "CP_MNAC") %>%
  year_to_date() %>%
  left_join(geo, by = "geo") %>%
  select(geo,  Geo, nace_r2, date, values) %>%
  spread(nace_r2, values) %>%
  mutate(values = `C13-C15`/TOTAL) %>%
  left_join(colors, by = c("Geo" = "country")) %>%
  ggplot(.) + geom_line(aes(x = date, y = values, color = color)) +
  theme_minimal() + xlab("") + ylab("Textiles (% of GDP)") +
  scale_color_identity() + add_4flags +
  scale_x_date(breaks = seq(1960, 2100, 5) %>% paste0("-01-01") %>% as.Date,
               labels = date_format("%Y")) +
  theme(legend.position = "none") +
  scale_y_continuous(breaks = 0.01*seq(-500, 200, 0.1),
                     labels = percent_format(accuracy = .1))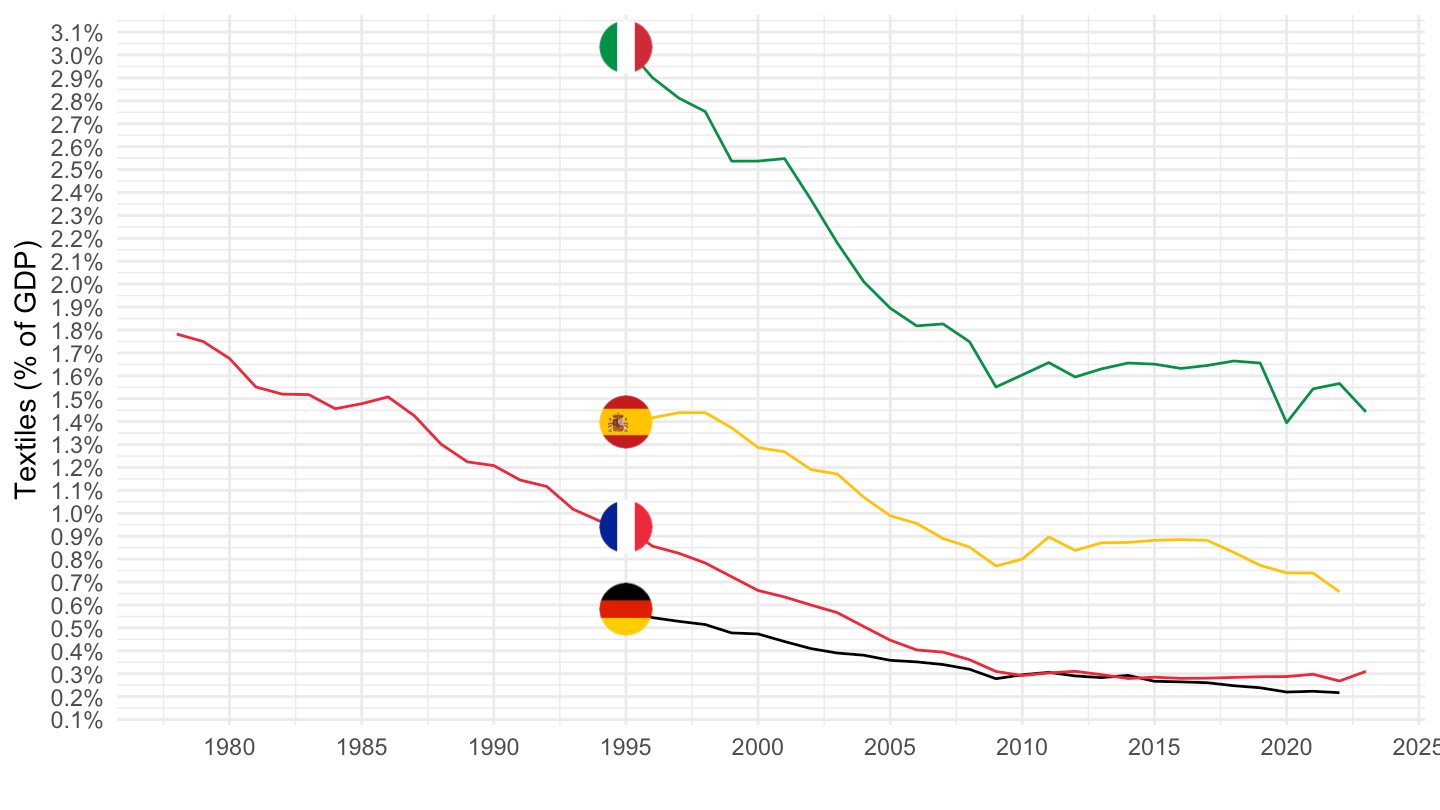
1995-
Code
nama_10_a64 %>%
  filter(na_item == "B1G",
         nace_r2 %in% c("C13-C15", "TOTAL"),
         geo %in% c("FR", "DE", "IT", "ES", "NL"),
         unit == "CP_MNAC") %>%
  year_to_date() %>%
  filter(date >= as.Date("1995-01-01")) %>%
  left_join(geo, by = "geo") %>%
  select(geo,  Geo, nace_r2, date, values) %>%
  spread(nace_r2, values) %>%
  mutate(values = `C13-C15`/TOTAL) %>%
  left_join(colors, by = c("Geo" = "country")) %>%
  mutate(color = ifelse(geo == "NL", color2, color)) %>%
  ggplot(.) + geom_line(aes(x = date, y = values, color = color)) +
  theme_minimal() + xlab("") + ylab("Textiles (% of GDP)") +
  scale_color_identity() + add_5flags +
  scale_x_date(breaks = seq(1960, 2100, 5) %>% paste0("-01-01") %>% as.Date,
               labels = date_format("%Y")) +
  theme(legend.position = "none") +
  scale_y_continuous(breaks = 0.01*seq(-500, 200, 0.1),
                     labels = percent_format(accuracy = .1))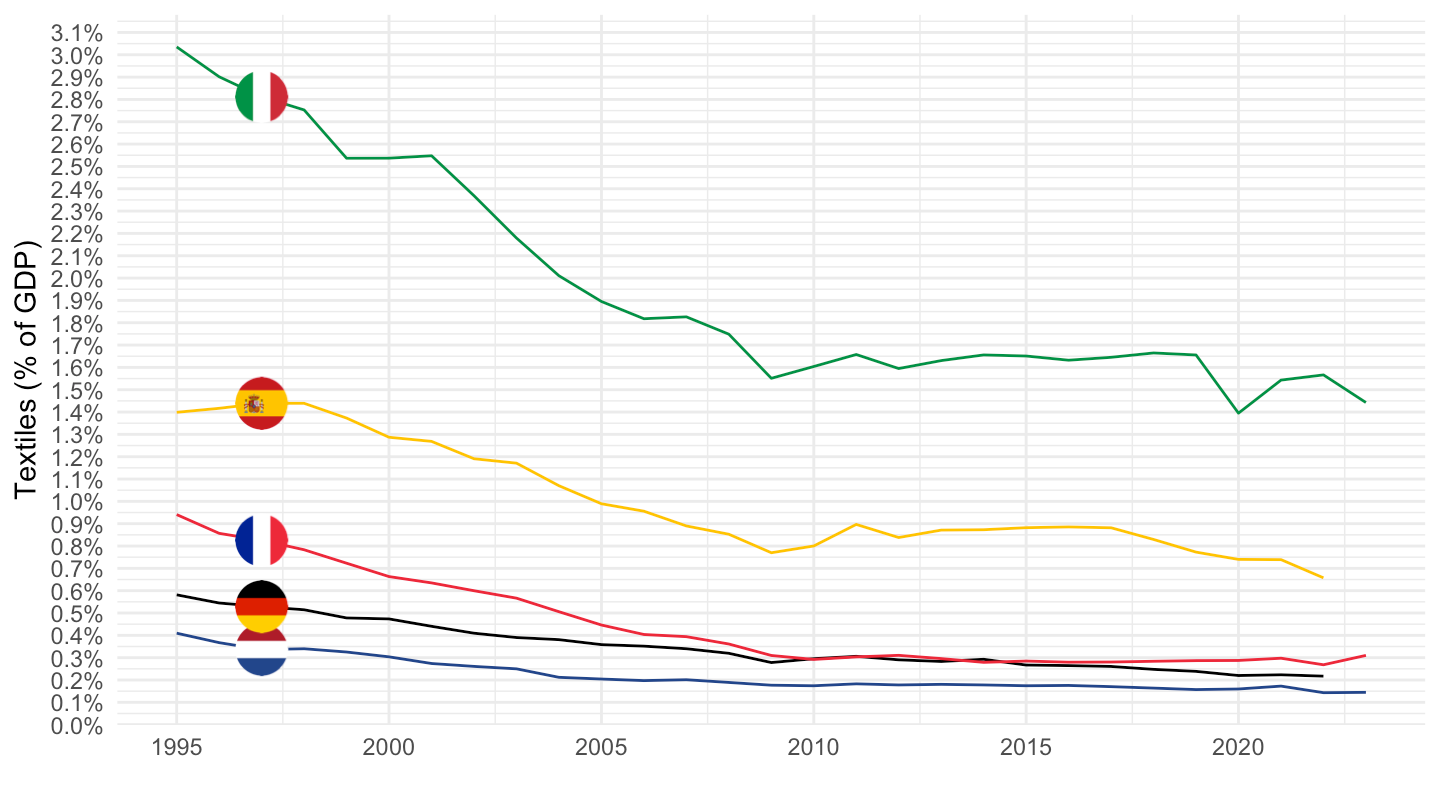
Volume
Code
nama_10_a64 %>%
  filter(na_item == "B1G",
         nace_r2 %in% c("C13-C15", "TOTAL"),
         geo %in% c("FR", "DE", "IT", "ES"),
         unit == "CLV10_MEUR") %>%
  year_to_date() %>%
  left_join(geo, by = "geo") %>%
  select(geo,  Geo, nace_r2, date, values) %>%
  spread(nace_r2, values) %>%
  mutate(values = `C13-C15`/TOTAL) %>%
  left_join(colors, by = c("Geo" = "country")) %>%
  ggplot(.) + geom_line(aes(x = date, y = values, color = color)) +
  theme_minimal() + xlab("") + ylab("Textiles (% of GDP)") +
  scale_color_identity() + add_4flags +
  scale_x_date(breaks = seq(1960, 2100, 5) %>% paste0("-01-01") %>% as.Date,
               labels = date_format("%Y")) +
  theme(legend.position = "none") +
  scale_y_continuous(breaks = 0.01*seq(-500, 200, 0.1),
                     labels = percent_format(accuracy = .1))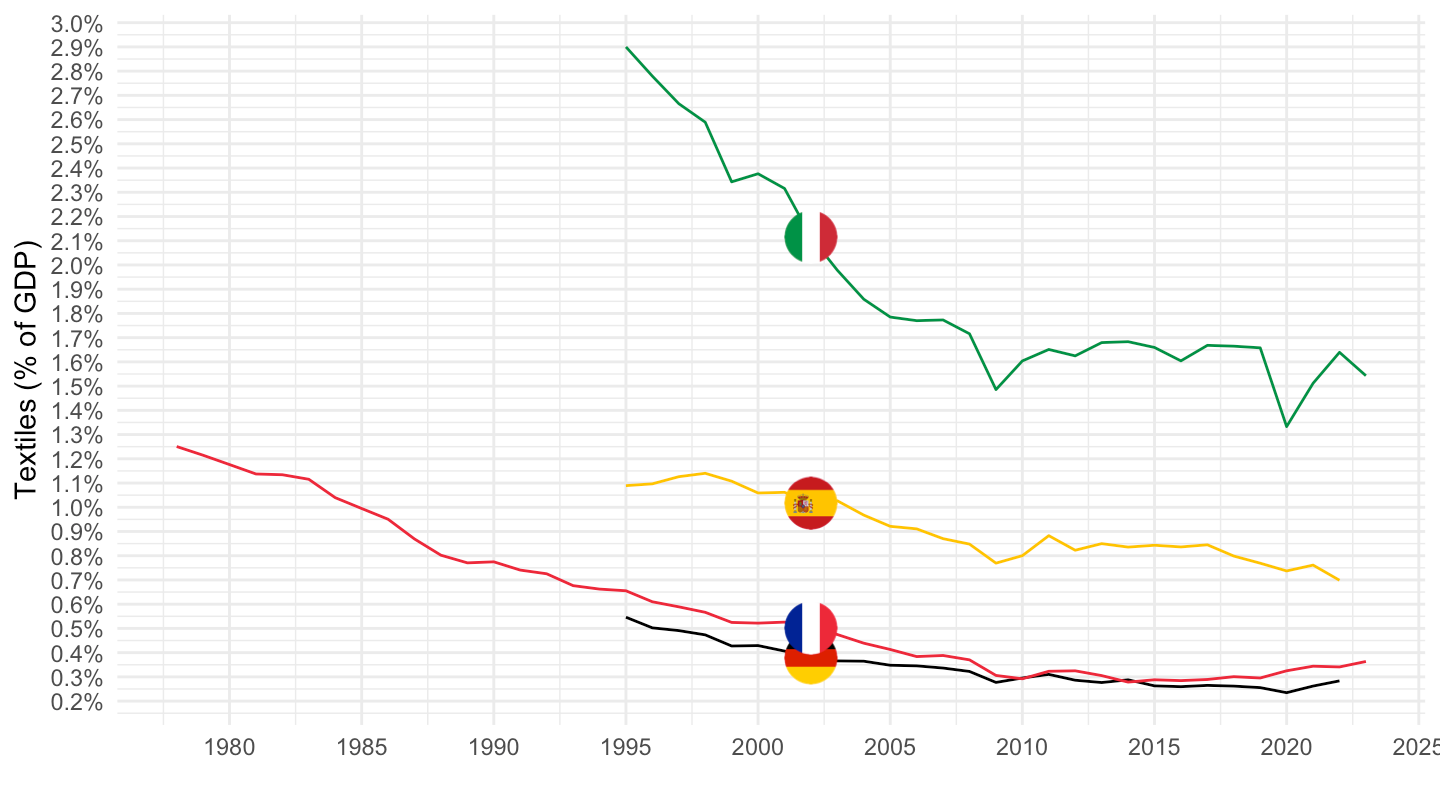
Price Deflator
All
Code
nama_10_a64 %>%
  filter(na_item == "B1G",
         nace_r2 %in% c("C13-C15", "TOTAL"),
         geo %in% c("FR", "DE", "IT", "ES"),
         unit == "PD10_NAC") %>%
  year_to_date() %>%
  left_join(geo, by = "geo") %>%
  select(geo,  Geo, nace_r2, date, values) %>%
  spread(nace_r2, values) %>%
  mutate(values = `C13-C15`/TOTAL)  %>%
  left_join(colors, by = c("Geo" = "country")) %>%
  ggplot(.) + geom_line(aes(x = date, y = values, color = color)) +
  theme_minimal() + xlab("") + ylab("Price Deflator") +
  scale_color_identity() + add_4flags +
  scale_x_date(breaks = seq(1960, 2100, 5) %>% paste0("-01-01") %>% as.Date,
               labels = date_format("%Y")) +
  scale_y_continuous(breaks = 0.01*seq(-500, 200, 10))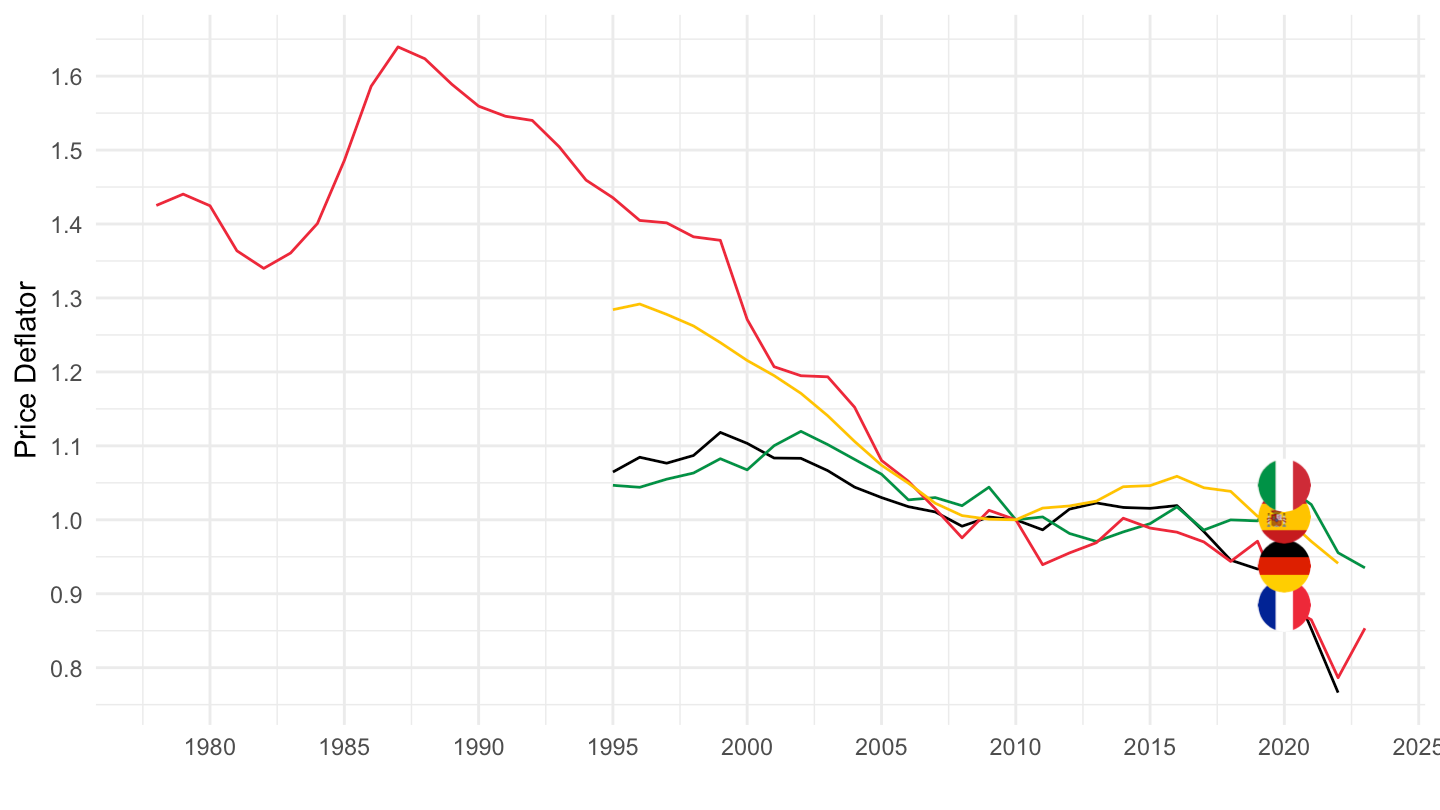
1995-
Code
nama_10_a64 %>%
  filter(na_item == "B1G",
         nace_r2 %in% c("C13-C15", "TOTAL"),
         geo %in% c("FR", "DE", "IT", "ES"),
         unit == "PD10_NAC") %>%
  year_to_date() %>%
  left_join(geo, by = "geo") %>%
  filter(date >= as.Date("1995-01-01")) %>%
  select(geo,  Geo, nace_r2, date, values) %>%
  spread(nace_r2, values) %>%
  mutate(values = `C13-C15`/TOTAL)  %>%
  left_join(colors, by = c("Geo" = "country")) %>%
  group_by(Geo) %>%
  mutate(values = values/ values[1]) %>%
  ggplot(.) + geom_line(aes(x = date, y = values, color = color)) +
  theme_minimal() + xlab("") + ylab("Price Deflator") +
  scale_color_identity() + add_4flags +
  scale_x_date(breaks = seq(1960, 2100, 5) %>% paste0("-01-01") %>% as.Date,
               labels = date_format("%Y")) +
  scale_y_continuous(breaks = 0.01*seq(-500, 200, 10))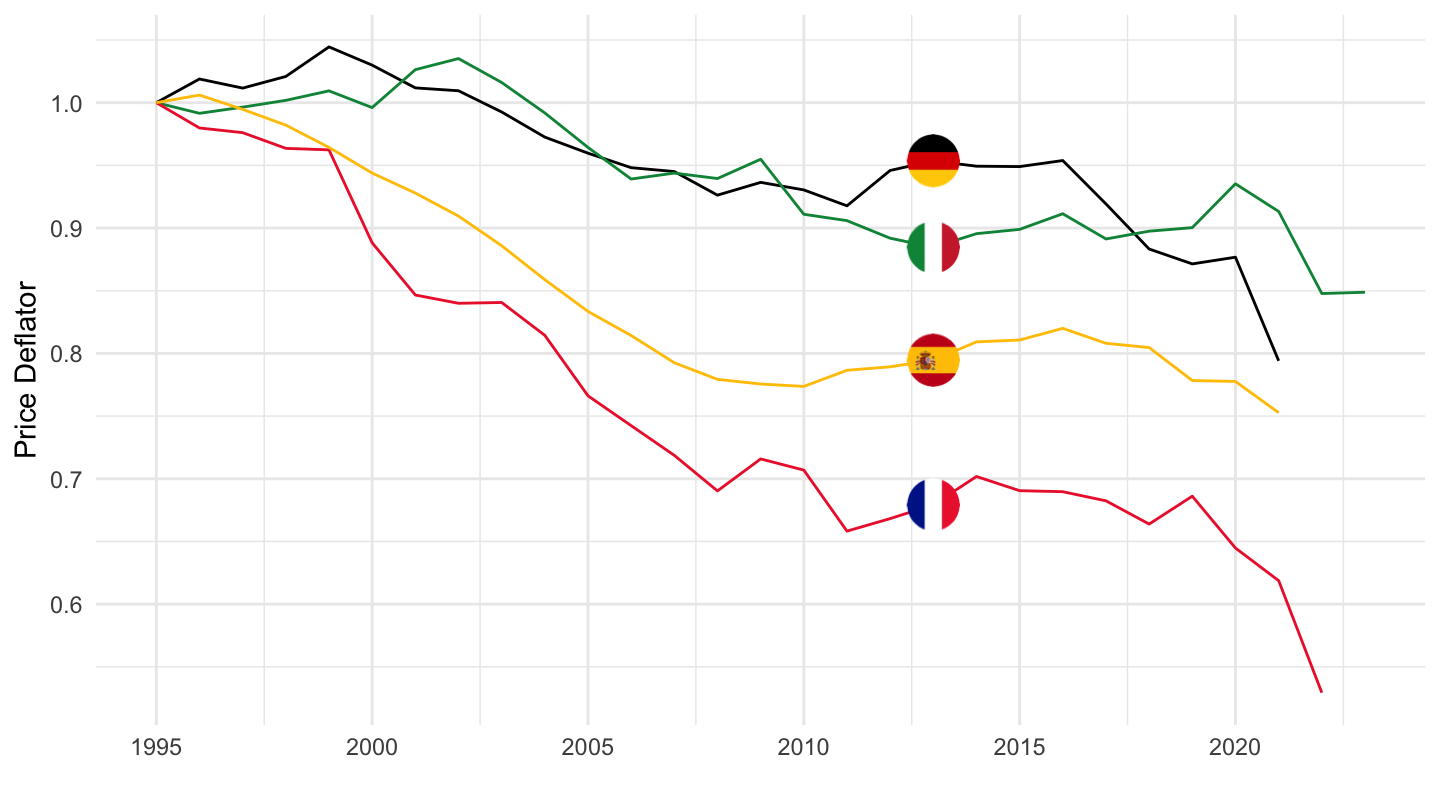
C16 - Manufacture of paper and paper products
Value
All
Code
nama_10_a64 %>%
  filter(na_item == "B1G",
         nace_r2 %in% c("C16", "TOTAL"),
         geo %in% c("FR", "DE", "IT", "ES"),
         unit == "CP_MNAC") %>%
  year_to_date() %>%
  left_join(geo, by = "geo") %>%
  select(geo,  Geo, nace_r2, date, values) %>%
  spread(nace_r2, values) %>%
  mutate(values = `C16`/TOTAL) %>%
  left_join(colors, by = c("Geo" = "country")) %>%
  ggplot(.) + geom_line(aes(x = date, y = values, color = color)) +
  theme_minimal() + xlab("") + ylab("Textiles (% of GDP)") +
  scale_color_identity() + add_4flags +
  scale_x_date(breaks = seq(1960, 2100, 5) %>% paste0("-01-01") %>% as.Date,
               labels = date_format("%Y")) +
  theme(legend.position = "none") +
  scale_y_continuous(breaks = 0.01*seq(-500, 200, 0.1),
                     labels = percent_format(accuracy = .1))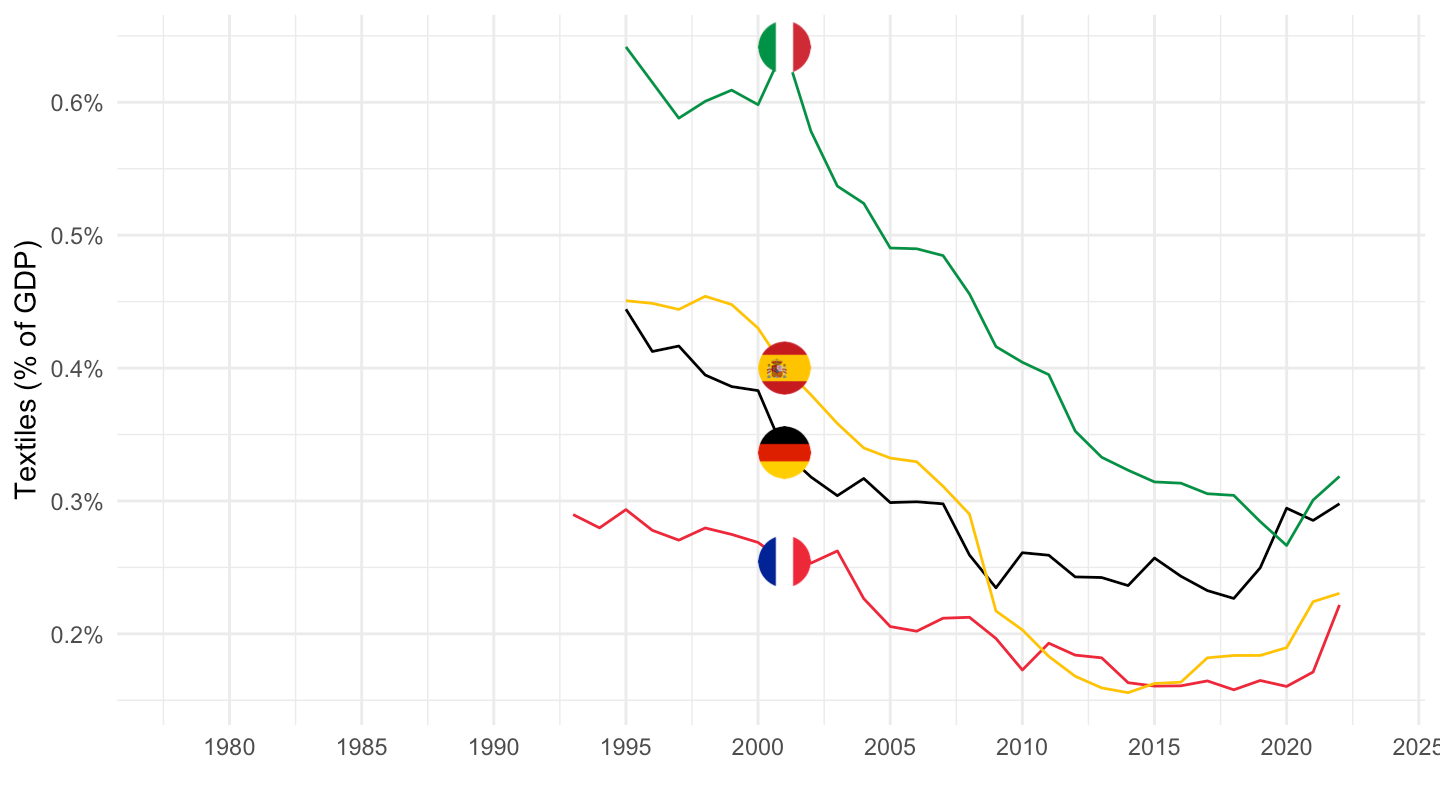
1995-
Code
nama_10_a64 %>%
  filter(na_item == "B1G",
         nace_r2 %in% c("C16", "TOTAL"),
         geo %in% c("FR", "DE", "IT", "ES", "NL"),
         unit == "CP_MNAC") %>%
  year_to_date() %>%
  filter(date >= as.Date("1995-01-01")) %>%
  left_join(geo, by = "geo") %>%
  select(geo,  Geo, nace_r2, date, values) %>%
  spread(nace_r2, values) %>%
  mutate(values = `C16`/TOTAL) %>%
  left_join(colors, by = c("Geo" = "country")) %>%
  mutate(color = ifelse(geo == "NL", color2, color)) %>%
  ggplot(.) + geom_line(aes(x = date, y = values, color = color)) +
  theme_minimal() + xlab("") + ylab("Textiles (% of GDP)") +
  scale_color_identity() + add_5flags +
  scale_x_date(breaks = seq(1960, 2100, 5) %>% paste0("-01-01") %>% as.Date,
               labels = date_format("%Y")) +
  theme(legend.position = "none") +
  scale_y_continuous(breaks = 0.01*seq(-500, 200, 0.1),
                     labels = percent_format(accuracy = .1))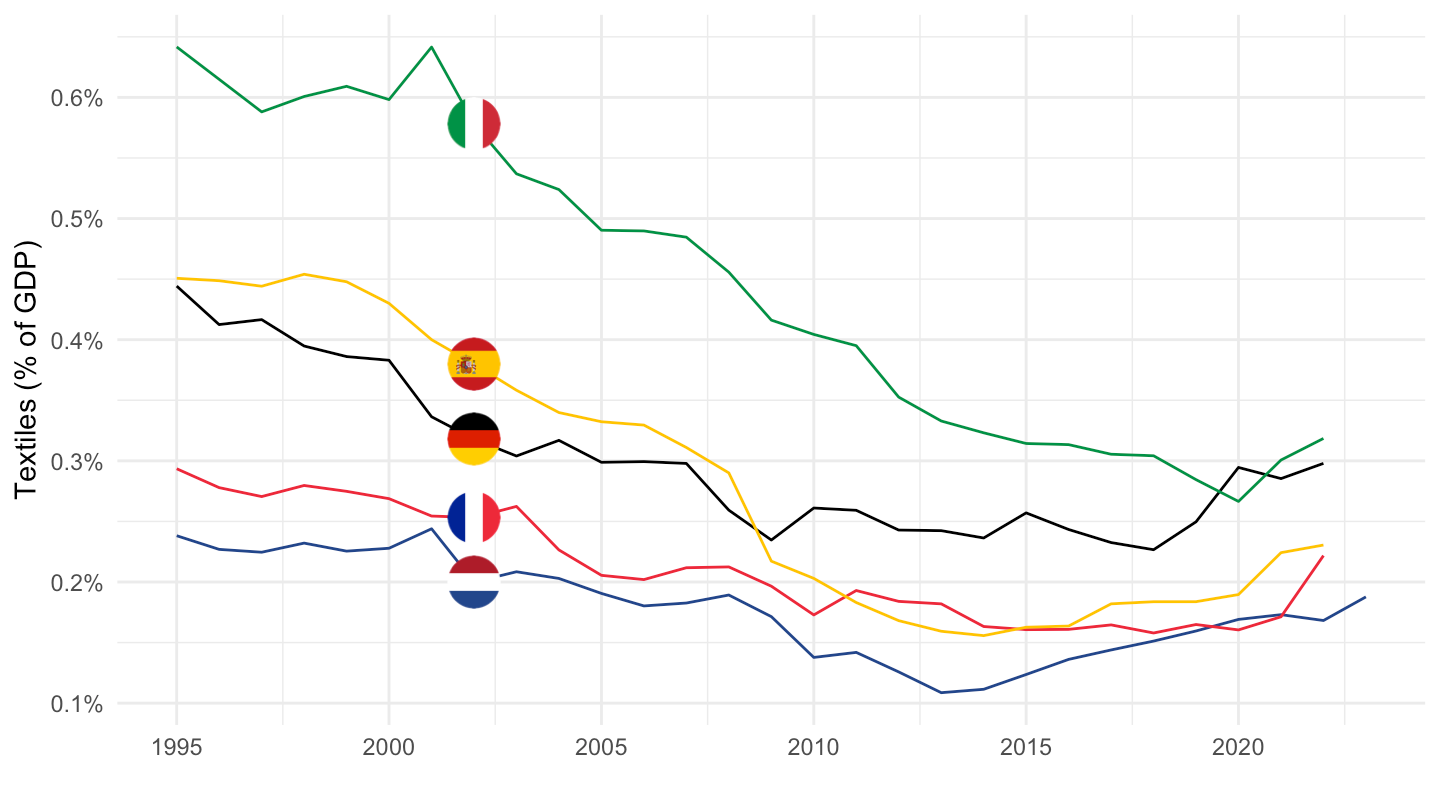
Volume
Code
nama_10_a64 %>%
  filter(na_item == "B1G",
         nace_r2 %in% c("C16", "TOTAL"),
         geo %in% c("FR", "DE", "IT", "ES"),
         unit == "CLV10_MEUR") %>%
  year_to_date() %>%
  left_join(geo, by = "geo") %>%
  select(geo,  Geo, nace_r2, date, values) %>%
  spread(nace_r2, values) %>%
  mutate(values = `C16`/TOTAL) %>%
  left_join(colors, by = c("Geo" = "country")) %>%
  ggplot(.) + geom_line(aes(x = date, y = values, color = color)) +
  theme_minimal() + xlab("") + ylab("Textiles (% of GDP)") +
  scale_color_identity() + add_4flags +
  scale_x_date(breaks = seq(1960, 2100, 5) %>% paste0("-01-01") %>% as.Date,
               labels = date_format("%Y")) +
  theme(legend.position = "none") +
  scale_y_continuous(breaks = 0.01*seq(-500, 200, 0.1),
                     labels = percent_format(accuracy = .1))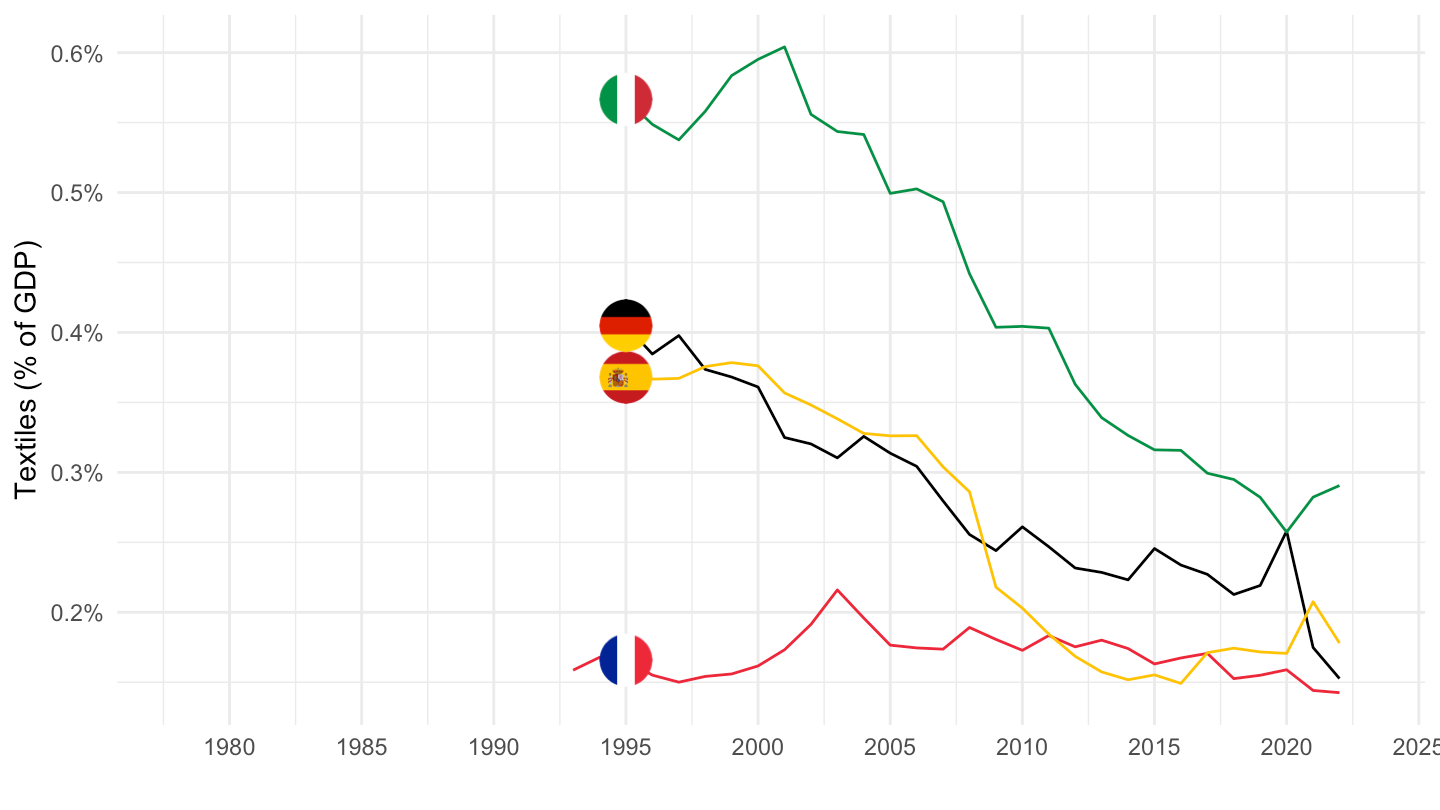
Price Deflator
All
Code
nama_10_a64 %>%
  filter(na_item == "B1G",
         nace_r2 %in% c("C16", "TOTAL"),
         geo %in% c("FR", "DE", "IT", "ES"),
         unit == "PD10_NAC") %>%
  year_to_date() %>%
  left_join(geo, by = "geo") %>%
  select(geo,  Geo, nace_r2, date, values) %>%
  spread(nace_r2, values) %>%
  mutate(values = `C16`/TOTAL)  %>%
  left_join(colors, by = c("Geo" = "country")) %>%
  ggplot(.) + geom_line(aes(x = date, y = values, color = color)) +
  theme_minimal() + xlab("") + ylab("Price Deflator") +
  scale_color_identity() + add_4flags +
  scale_x_date(breaks = seq(1960, 2100, 5) %>% paste0("-01-01") %>% as.Date,
               labels = date_format("%Y")) +
  scale_y_continuous(breaks = 0.01*seq(-500, 200, 10))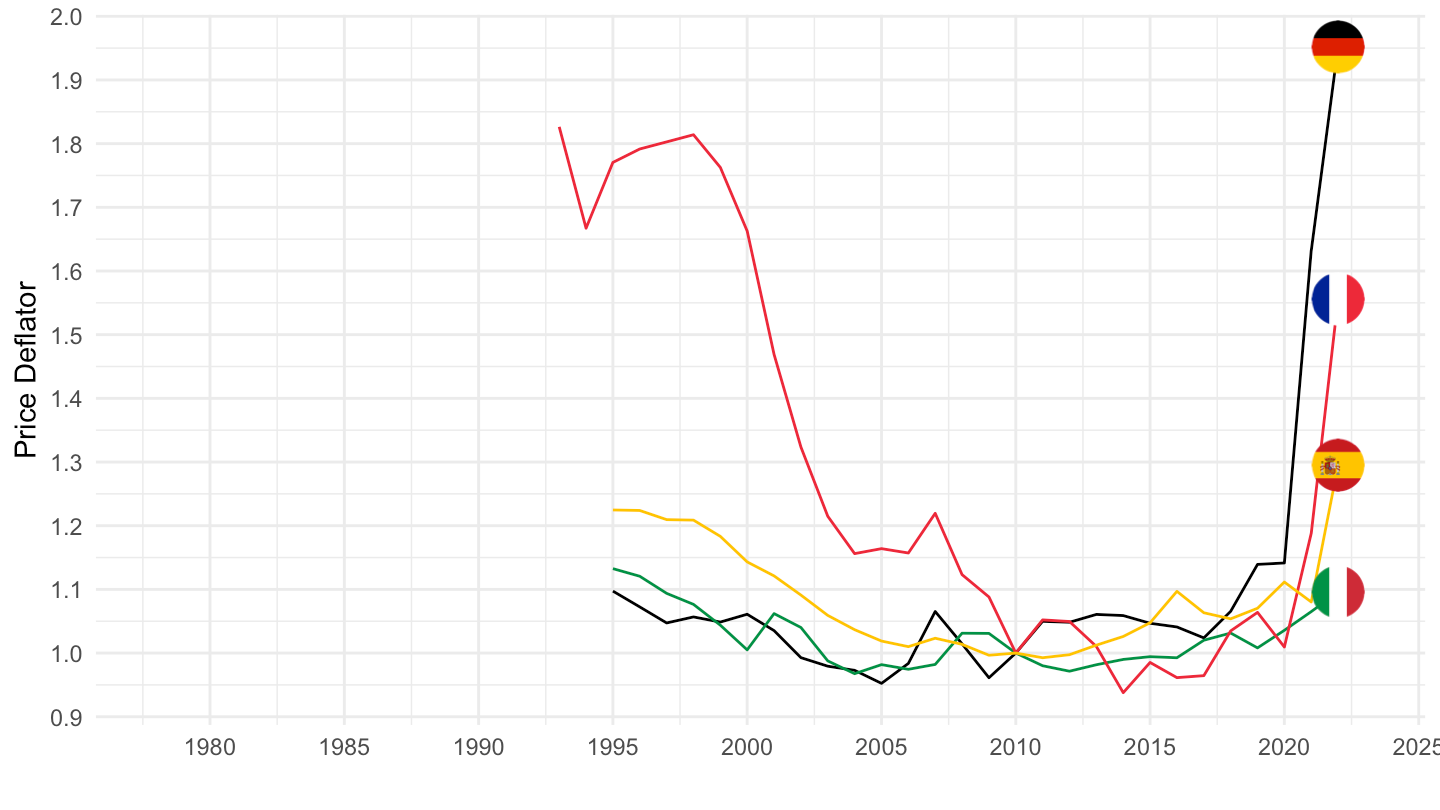
1995-
Code
nama_10_a64 %>%
  filter(na_item == "B1G",
         nace_r2 %in% c("C16", "TOTAL"),
         geo %in% c("FR", "DE", "IT", "ES"),
         unit == "PD10_NAC") %>%
  year_to_date() %>%
  left_join(geo, by = "geo") %>%
  filter(date >= as.Date("1995-01-01")) %>%
  select(geo,  Geo, nace_r2, date, values) %>%
  spread(nace_r2, values) %>%
  mutate(values = `C16`/TOTAL)  %>%
  left_join(colors, by = c("Geo" = "country")) %>%
  group_by(Geo) %>%
  mutate(values = values/ values[1]) %>%
  ggplot(.) + geom_line(aes(x = date, y = values, color = color)) +
  theme_minimal() + xlab("") + ylab("Price Deflator") +
  scale_color_identity() + add_4flags +
  scale_x_date(breaks = seq(1960, 2100, 5) %>% paste0("-01-01") %>% as.Date,
               labels = date_format("%Y")) +
  scale_y_continuous(breaks = 0.01*seq(-500, 200, 10))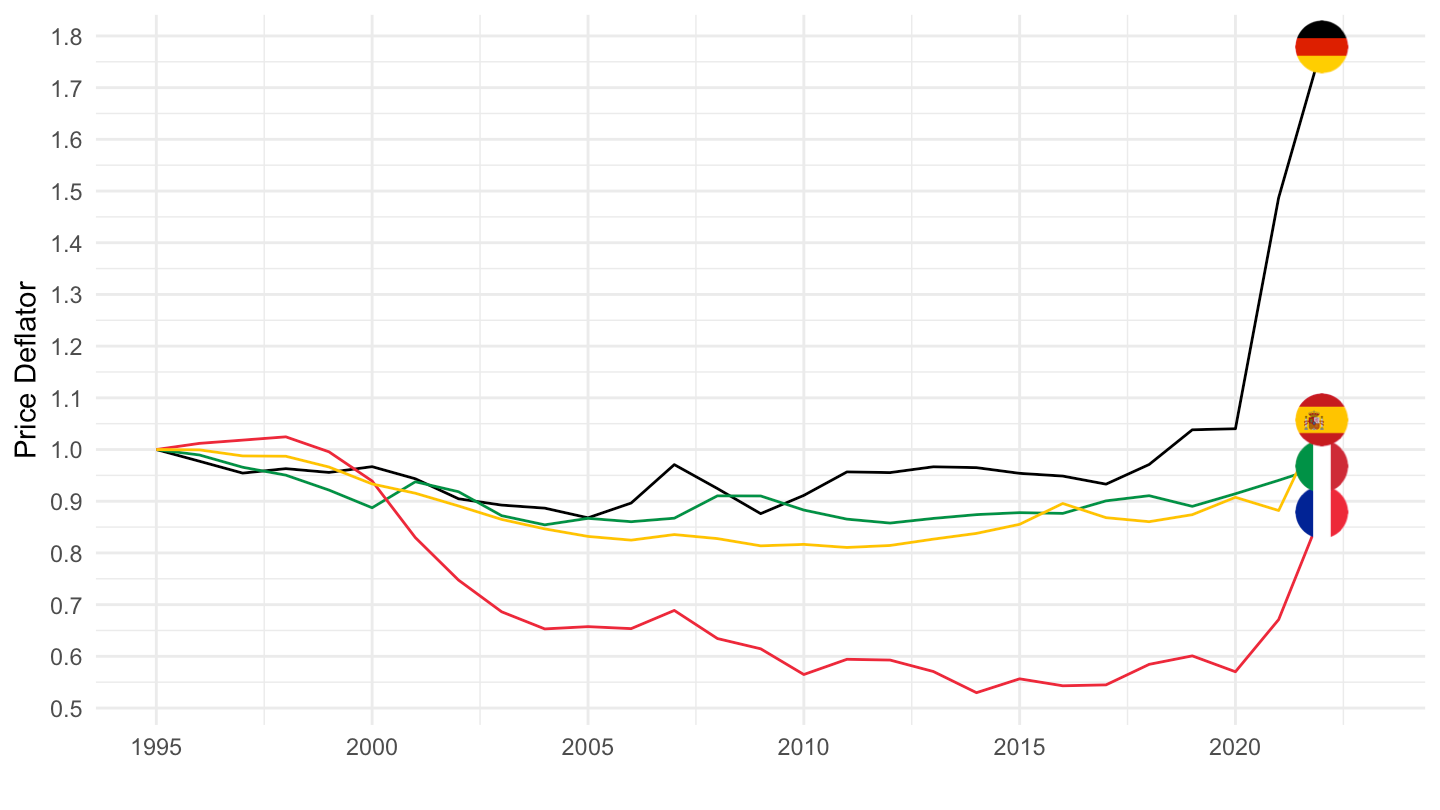
C16-C18 - Wood, Paper, Printing
All
Code
nama_10_a64 %>%
  filter(na_item == "B1G",
         nace_r2 %in% c("C16-C18", "TOTAL"),
         geo %in% c("FR", "DE", "IT", "ES"),
         unit == "CP_MNAC") %>%
  year_to_date() %>%
  left_join(geo, by = "geo") %>%
  select(geo,  Geo, nace_r2, date, values) %>%
  spread(nace_r2, values) %>%
  ggplot(.) + geom_line(aes(x = date, y = `C16-C18`/TOTAL, color = Geo)) +
  theme_minimal() + xlab("") + ylab("Wood, Paper, Printing (% of GDP)") +
  scale_color_manual(values = c("#002395", "#000000", "#009246", "#C60B1E")) +
  scale_x_date(breaks = seq(1960, 2100, 5) %>% paste0("-01-01") %>% as.Date,
               labels = date_format("%Y")) +
  geom_image(data = . %>%
               filter(date == as.Date("2017-01-01")) %>%
               mutate(image = paste0("../../icon/flag/round/", str_to_lower(Geo), ".png")),
             aes(x = date, y = `C16-C18`/TOTAL, image = image), asp = 1.5) +
  theme(legend.position = "none") +
  scale_y_continuous(breaks = 0.01*seq(-500, 200, 0.1),
                     labels = percent_format(accuracy = .1))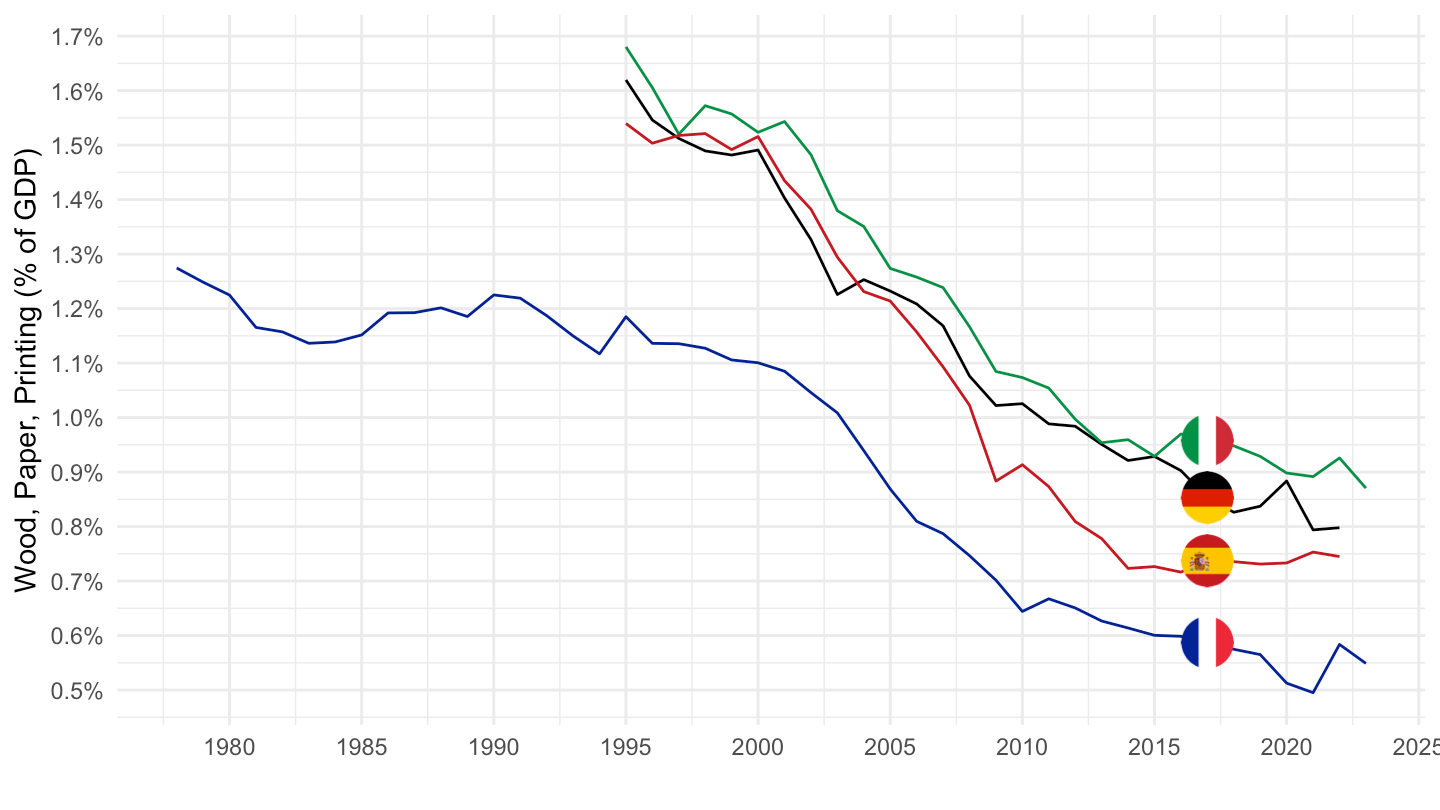
1995-
Code
nama_10_a64 %>%
  filter(na_item == "B1G",
         nace_r2 %in% c("C16-C18", "TOTAL"),
         geo %in% c("FR", "DE", "IT", "ES"),
         unit == "CP_MNAC") %>%
  year_to_date() %>%
  filter(date >= as.Date("1995-01-01")) %>%
  left_join(geo, by = "geo") %>%
  select(geo,  Geo, nace_r2, date, values) %>%
  spread(nace_r2, values) %>%
  ggplot(.) + geom_line(aes(x = date, y = `C16-C18`/TOTAL, color = Geo)) +
  theme_minimal() + xlab("") + ylab("Wood, Paper, Printing (% of GDP)") +
  scale_color_manual(values = c("#002395", "#000000", "#009246", "#C60B1E")) +
  scale_x_date(breaks = seq(1960, 2026, 2) %>% paste0("-01-01") %>% as.Date,
               labels = date_format("%Y")) +
  geom_image(data = . %>%
               filter(date == as.Date("2017-01-01")) %>%
               mutate(image = paste0("../../icon/flag/round/", str_to_lower(Geo), ".png")),
             aes(x = date, y = `C16-C18`/TOTAL, image = image), asp = 1.5) +
  theme(legend.position = "none") +
  scale_y_continuous(breaks = 0.01*seq(-500, 200, 0.1),
                     labels = percent_format(accuracy = .1))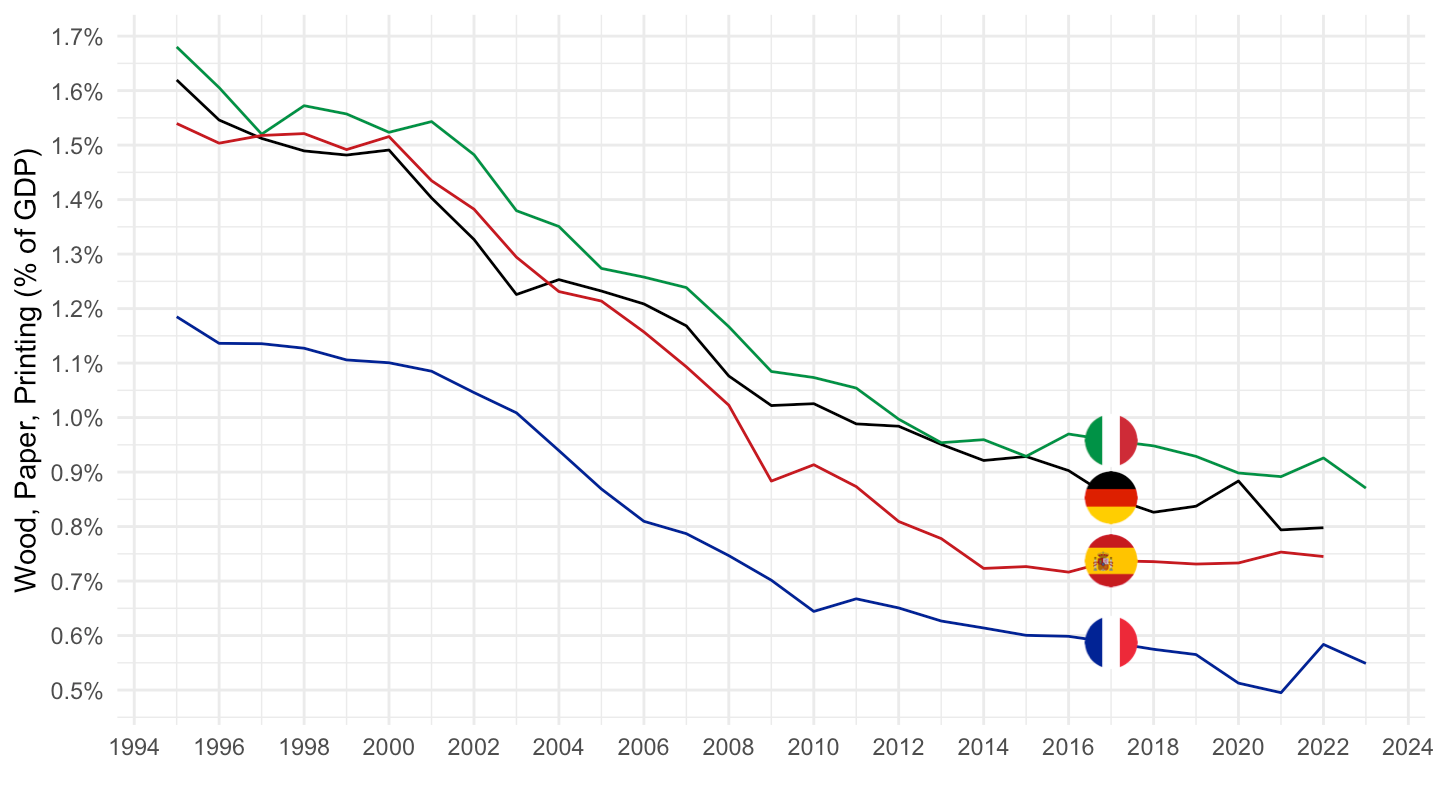
C17 - Textiles
Value
All
Code
nama_10_a64 %>%
  filter(na_item == "B1G",
         nace_r2 %in% c("C17", "TOTAL"),
         geo %in% c("FR", "DE", "IT", "ES"),
         unit == "CP_MNAC") %>%
  year_to_date() %>%
  left_join(geo, by = "geo") %>%
  select(geo,  Geo, nace_r2, date, values) %>%
  spread(nace_r2, values) %>%
  mutate(values = `C17`/TOTAL) %>%
  left_join(colors, by = c("Geo" = "country")) %>%
  ggplot(.) + geom_line(aes(x = date, y = values, color = color)) +
  theme_minimal() + xlab("") + ylab("Textiles (% of GDP)") +
  scale_color_identity() + add_4flags +
  scale_x_date(breaks = seq(1960, 2100, 5) %>% paste0("-01-01") %>% as.Date,
               labels = date_format("%Y")) +
  theme(legend.position = "none") +
  scale_y_continuous(breaks = 0.01*seq(-500, 200, 0.1),
                     labels = percent_format(accuracy = .1))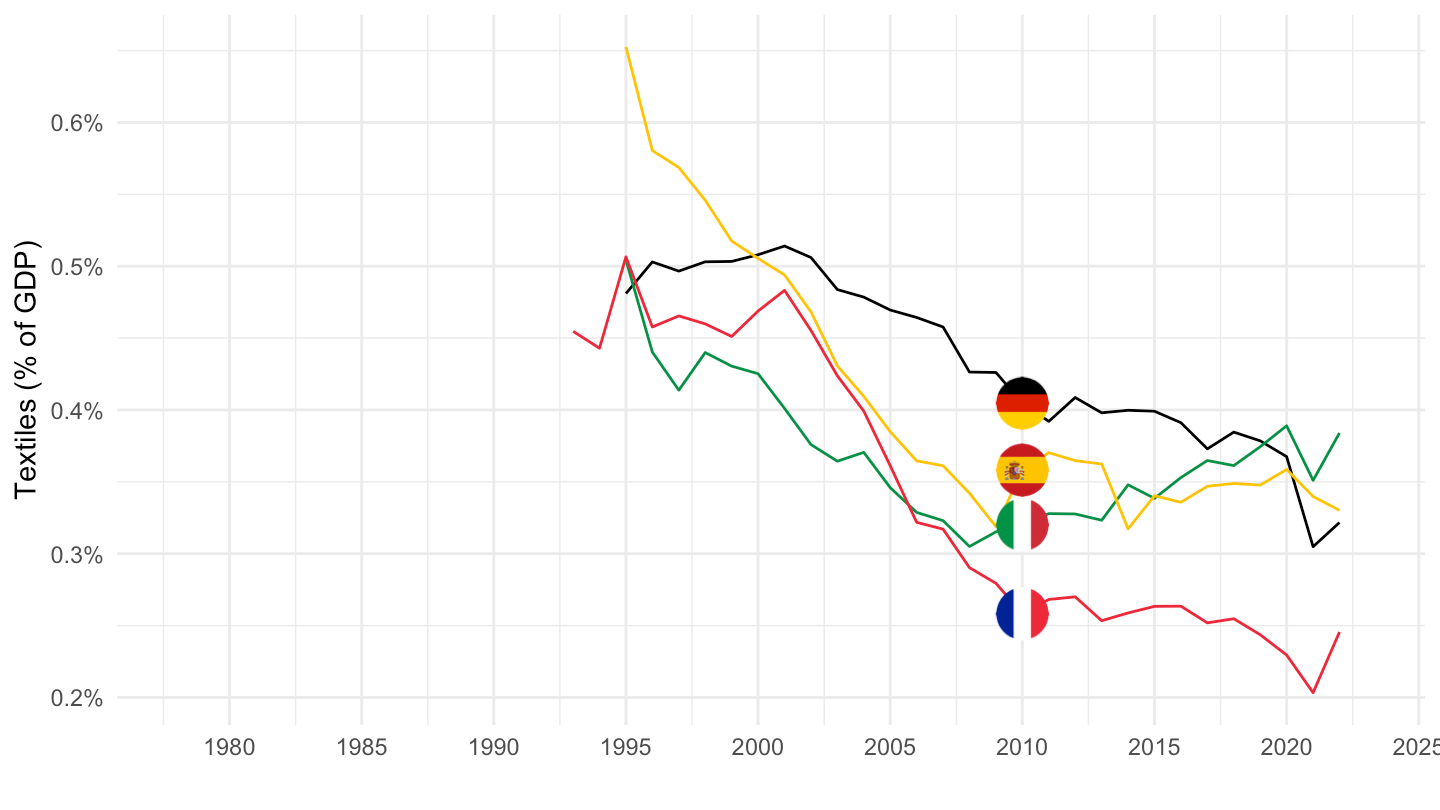
1995-
Code
nama_10_a64 %>%
  filter(na_item == "B1G",
         nace_r2 %in% c("C17", "TOTAL"),
         geo %in% c("FR", "DE", "IT", "ES", "NL"),
         unit == "CP_MNAC") %>%
  year_to_date() %>%
  filter(date >= as.Date("1995-01-01")) %>%
  left_join(geo, by = "geo") %>%
  select(geo,  Geo, nace_r2, date, values) %>%
  spread(nace_r2, values) %>%
  mutate(values = `C17`/TOTAL) %>%
  left_join(colors, by = c("Geo" = "country")) %>%
  mutate(color = ifelse(geo == "NL", color2, color)) %>%
  ggplot(.) + geom_line(aes(x = date, y = values, color = color)) +
  theme_minimal() + xlab("") + ylab("Textiles (% of GDP)") +
  scale_color_identity() + add_5flags +
  scale_x_date(breaks = seq(1960, 2100, 5) %>% paste0("-01-01") %>% as.Date,
               labels = date_format("%Y")) +
  theme(legend.position = "none") +
  scale_y_continuous(breaks = 0.01*seq(-500, 200, 0.1),
                     labels = percent_format(accuracy = .1))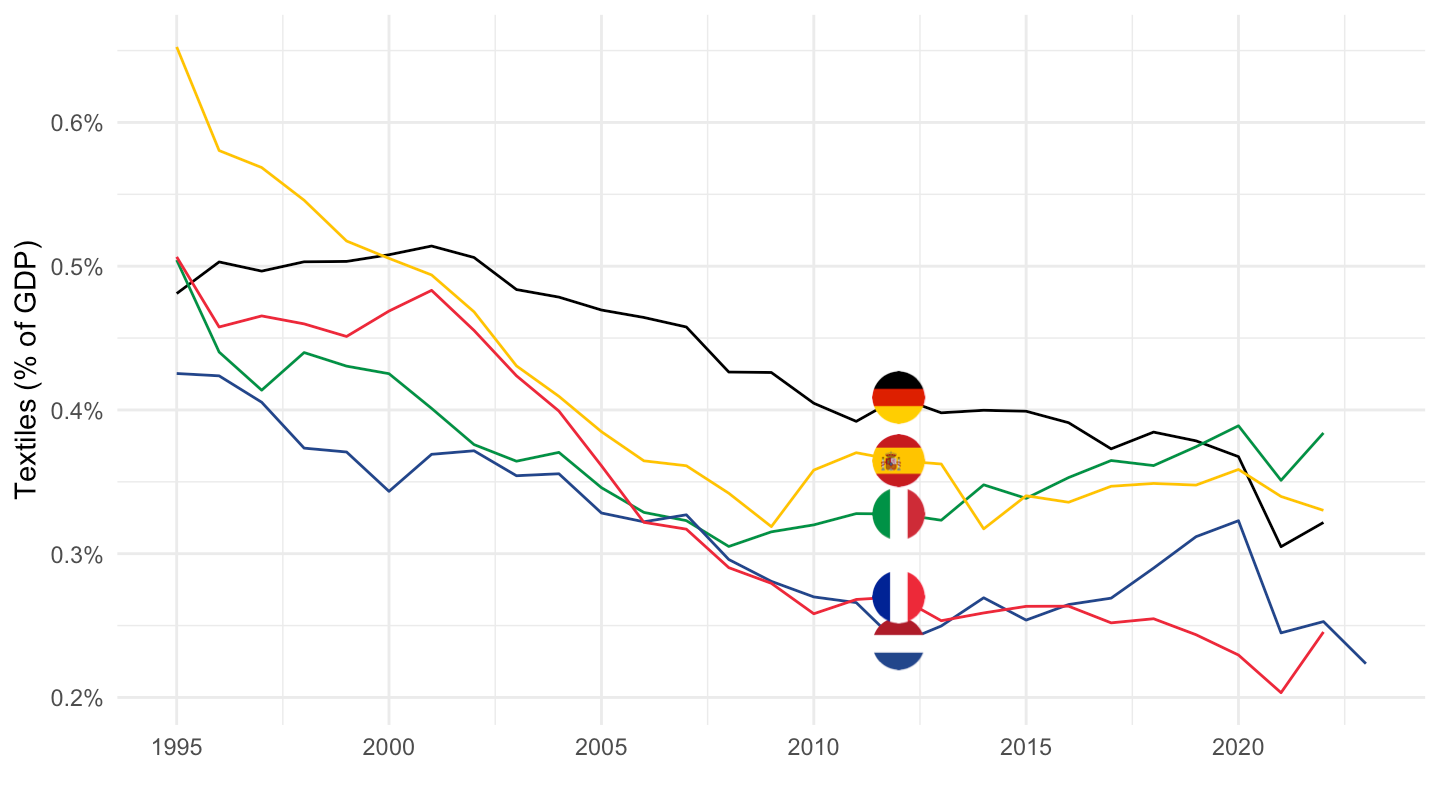
Volume
Code
nama_10_a64 %>%
  filter(na_item == "B1G",
         nace_r2 %in% c("C17", "TOTAL"),
         geo %in% c("FR", "DE", "IT", "ES"),
         unit == "CLV10_MEUR") %>%
  year_to_date() %>%
  left_join(geo, by = "geo") %>%
  select(geo,  Geo, nace_r2, date, values) %>%
  spread(nace_r2, values) %>%
  mutate(values = `C17`/TOTAL) %>%
  left_join(colors, by = c("Geo" = "country")) %>%
  ggplot(.) + geom_line(aes(x = date, y = values, color = color)) +
  theme_minimal() + xlab("") + ylab("Textiles (% of GDP)") +
  scale_color_identity() + add_4flags +
  scale_x_date(breaks = seq(1960, 2100, 5) %>% paste0("-01-01") %>% as.Date,
               labels = date_format("%Y")) +
  theme(legend.position = "none") +
  scale_y_continuous(breaks = 0.01*seq(-500, 200, 0.1),
                     labels = percent_format(accuracy = .1))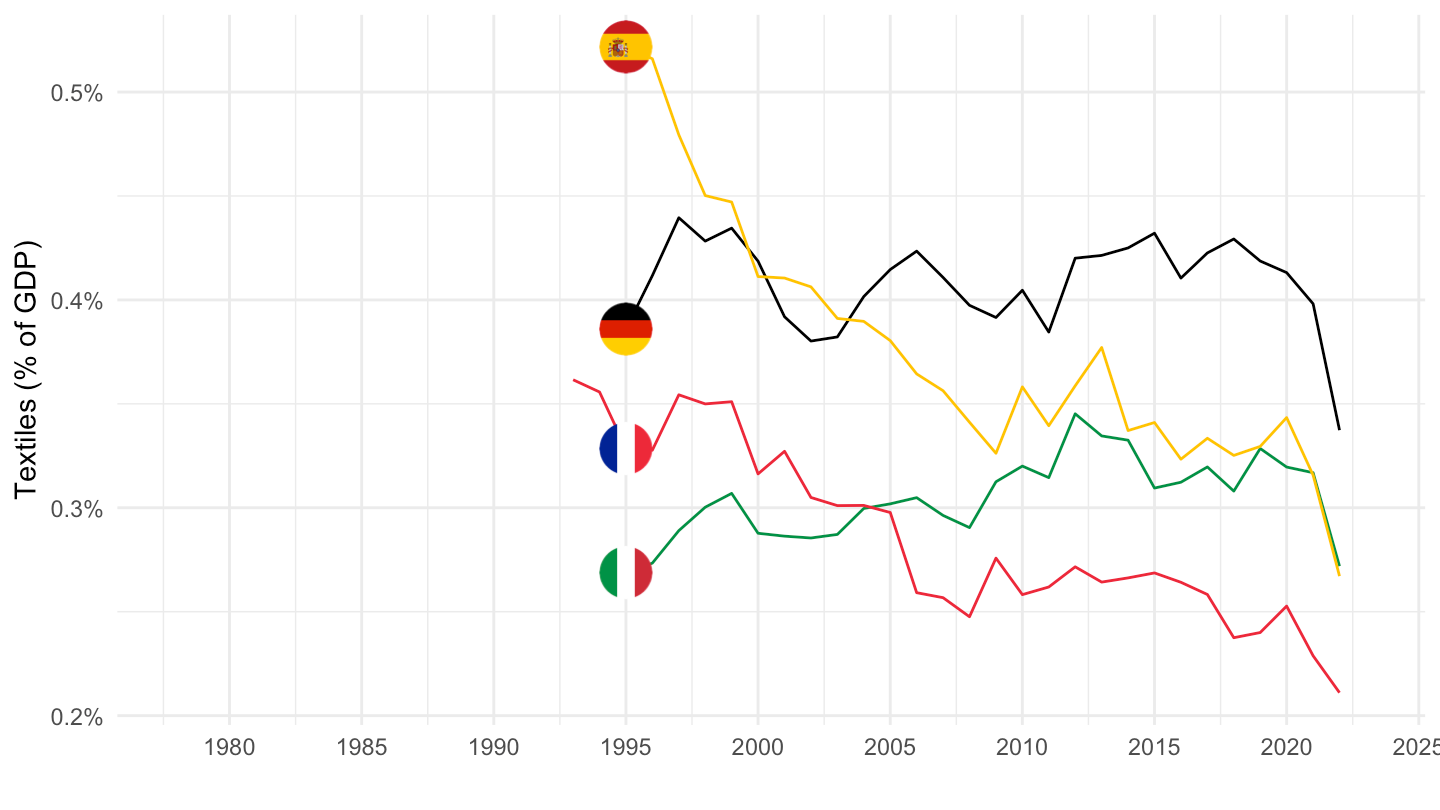
Price Deflator
All
Code
nama_10_a64 %>%
  filter(na_item == "B1G",
         nace_r2 %in% c("C17", "TOTAL"),
         geo %in% c("FR", "DE", "IT", "ES"),
         unit == "PD10_NAC") %>%
  year_to_date() %>%
  left_join(geo, by = "geo") %>%
  select(geo,  Geo, nace_r2, date, values) %>%
  spread(nace_r2, values) %>%
  mutate(values = `C17`/TOTAL)  %>%
  left_join(colors, by = c("Geo" = "country")) %>%
  ggplot(.) + geom_line(aes(x = date, y = values, color = color)) +
  theme_minimal() + xlab("") + ylab("Price Deflator") +
  scale_color_identity() + add_4flags +
  scale_x_date(breaks = seq(1960, 2100, 5) %>% paste0("-01-01") %>% as.Date,
               labels = date_format("%Y")) +
  scale_y_continuous(breaks = 0.01*seq(-500, 200, 10))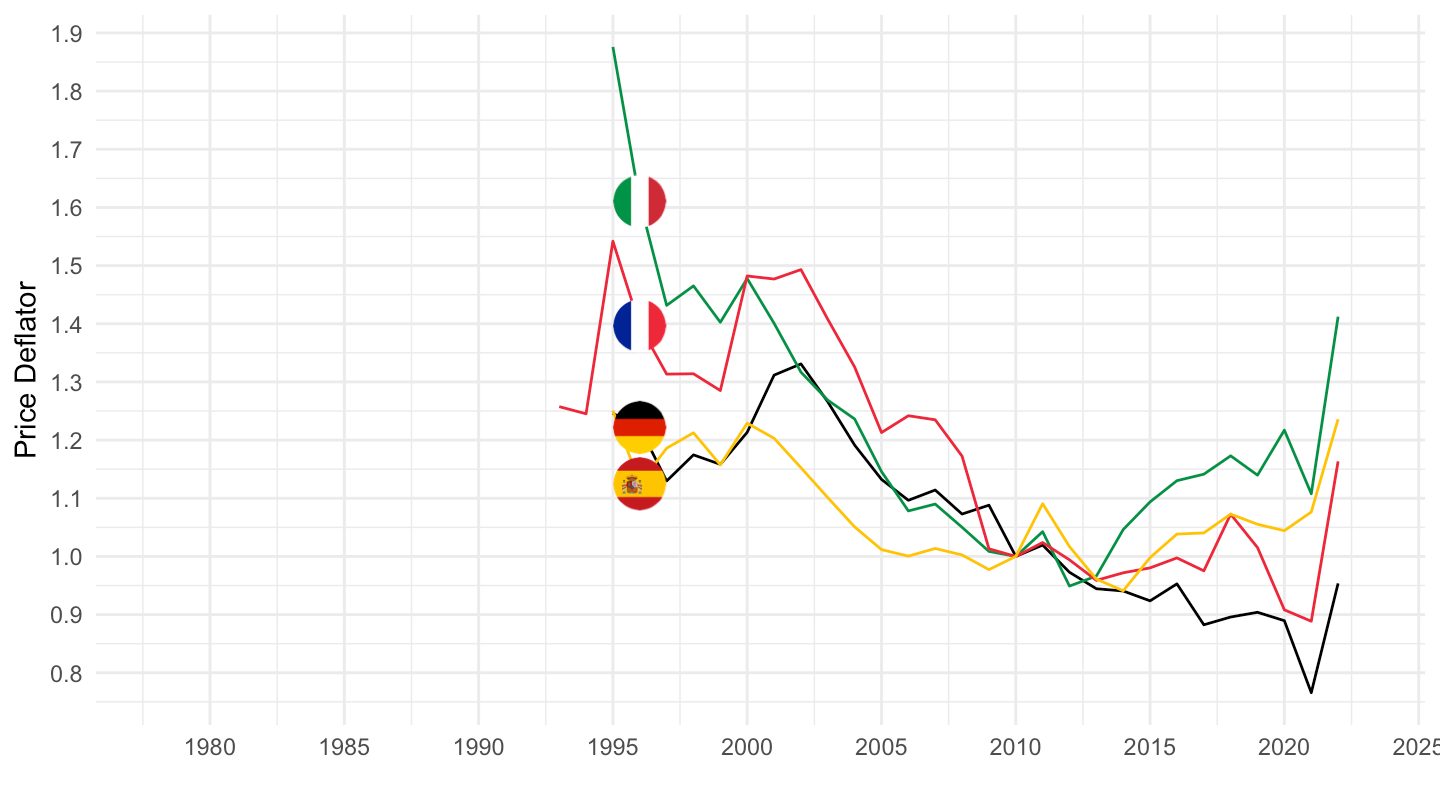
1995-
Code
nama_10_a64 %>%
  filter(na_item == "B1G",
         nace_r2 %in% c("C17", "TOTAL"),
         geo %in% c("FR", "DE", "IT", "ES"),
         unit == "PD10_NAC") %>%
  year_to_date() %>%
  left_join(geo, by = "geo") %>%
  filter(date >= as.Date("1995-01-01")) %>%
  select(geo,  Geo, nace_r2, date, values) %>%
  spread(nace_r2, values) %>%
  mutate(values = `C17`/TOTAL)  %>%
  left_join(colors, by = c("Geo" = "country")) %>%
  group_by(Geo) %>%
  mutate(values = values/ values[1]) %>%
  ggplot(.) + geom_line(aes(x = date, y = values, color = color)) +
  theme_minimal() + xlab("") + ylab("Price Deflator") +
  scale_color_identity() + add_4flags +
  scale_x_date(breaks = seq(1960, 2100, 5) %>% paste0("-01-01") %>% as.Date,
               labels = date_format("%Y")) +
  scale_y_continuous(breaks = 0.01*seq(-500, 200, 10))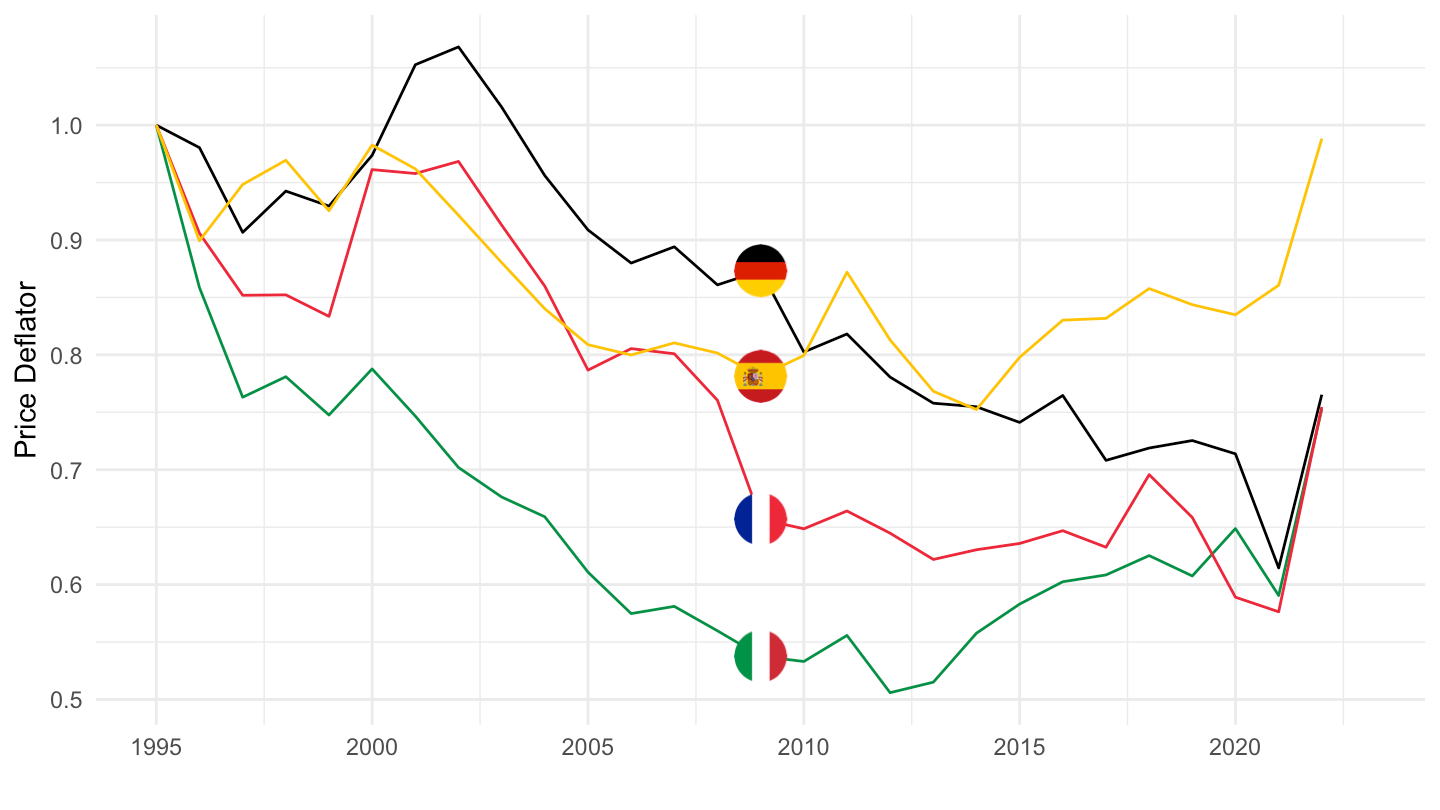
C18 - Printing and reproduction of recorded media
Value
All
Code
nama_10_a64 %>%
  filter(na_item == "B1G",
         nace_r2 %in% c("C18", "TOTAL"),
         geo %in% c("FR", "DE", "IT", "ES"),
         unit == "CP_MNAC") %>%
  year_to_date() %>%
  left_join(geo, by = "geo") %>%
  select(geo,  Geo, nace_r2, date, values) %>%
  spread(nace_r2, values) %>%
  mutate(values = `C18`/TOTAL) %>%
  left_join(colors, by = c("Geo" = "country")) %>%
  ggplot(.) + geom_line(aes(x = date, y = values, color = color)) +
  theme_minimal() + xlab("") + ylab("Textiles (% of GDP)") +
  scale_color_identity() + add_4flags +
  scale_x_date(breaks = seq(1960, 2100, 5) %>% paste0("-01-01") %>% as.Date,
               labels = date_format("%Y")) +
  theme(legend.position = "none") +
  scale_y_continuous(breaks = 0.01*seq(-500, 200, 0.1),
                     labels = percent_format(accuracy = .1))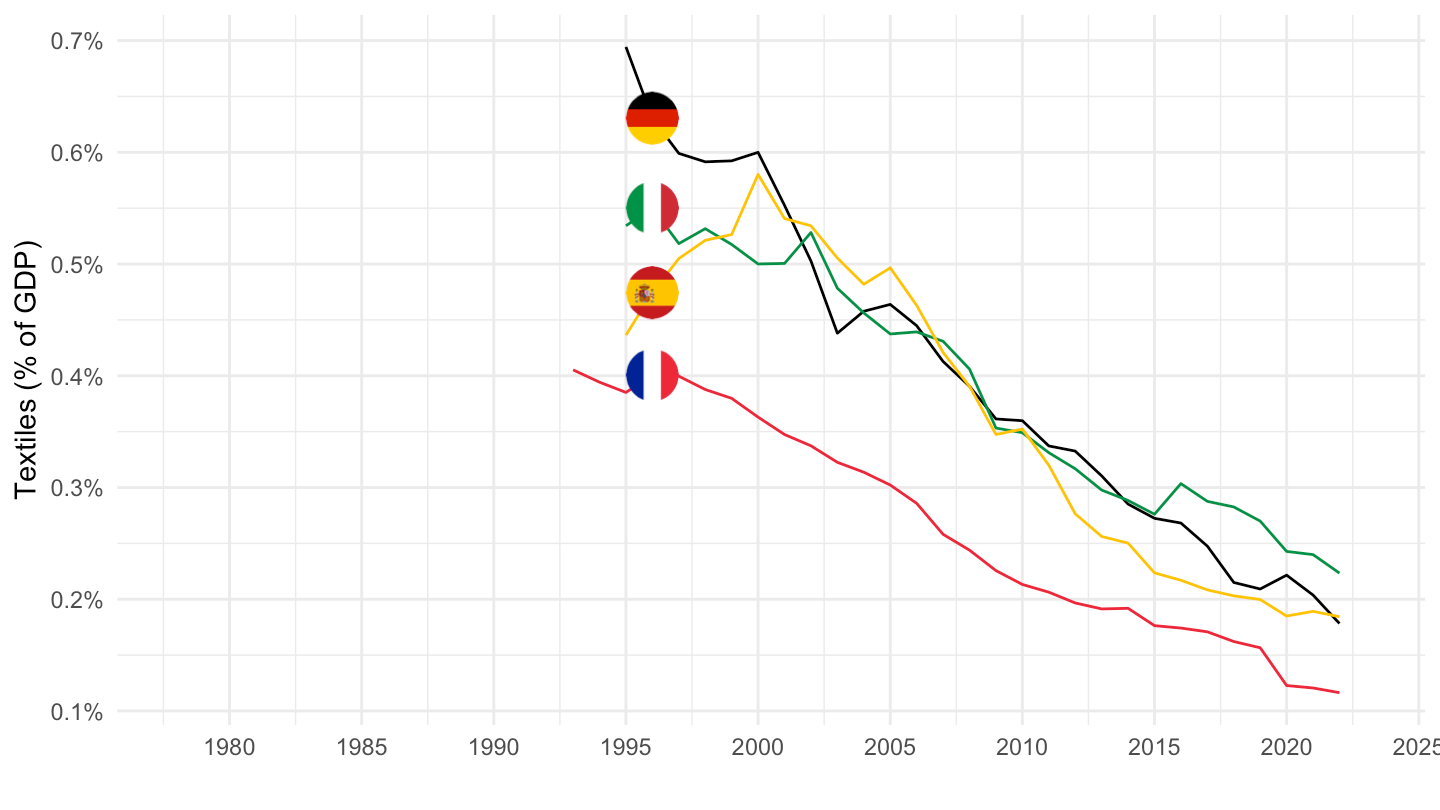
1995-
Code
nama_10_a64 %>%
  filter(na_item == "B1G",
         nace_r2 %in% c("C18", "TOTAL"),
         geo %in% c("FR", "DE", "IT", "ES", "NL"),
         unit == "CP_MNAC") %>%
  year_to_date() %>%
  filter(date >= as.Date("1995-01-01")) %>%
  left_join(geo, by = "geo") %>%
  select(geo,  Geo, nace_r2, date, values) %>%
  spread(nace_r2, values) %>%
  mutate(values = `C18`/TOTAL) %>%
  left_join(colors, by = c("Geo" = "country")) %>%
  mutate(color = ifelse(geo == "NL", color2, color)) %>%
  ggplot(.) + geom_line(aes(x = date, y = values, color = color)) +
  theme_minimal() + xlab("") + ylab("Textiles (% of GDP)") +
  scale_color_identity() + add_5flags +
  scale_x_date(breaks = seq(1960, 2100, 5) %>% paste0("-01-01") %>% as.Date,
               labels = date_format("%Y")) +
  theme(legend.position = "none") +
  scale_y_continuous(breaks = 0.01*seq(-500, 200, 0.1),
                     labels = percent_format(accuracy = .1))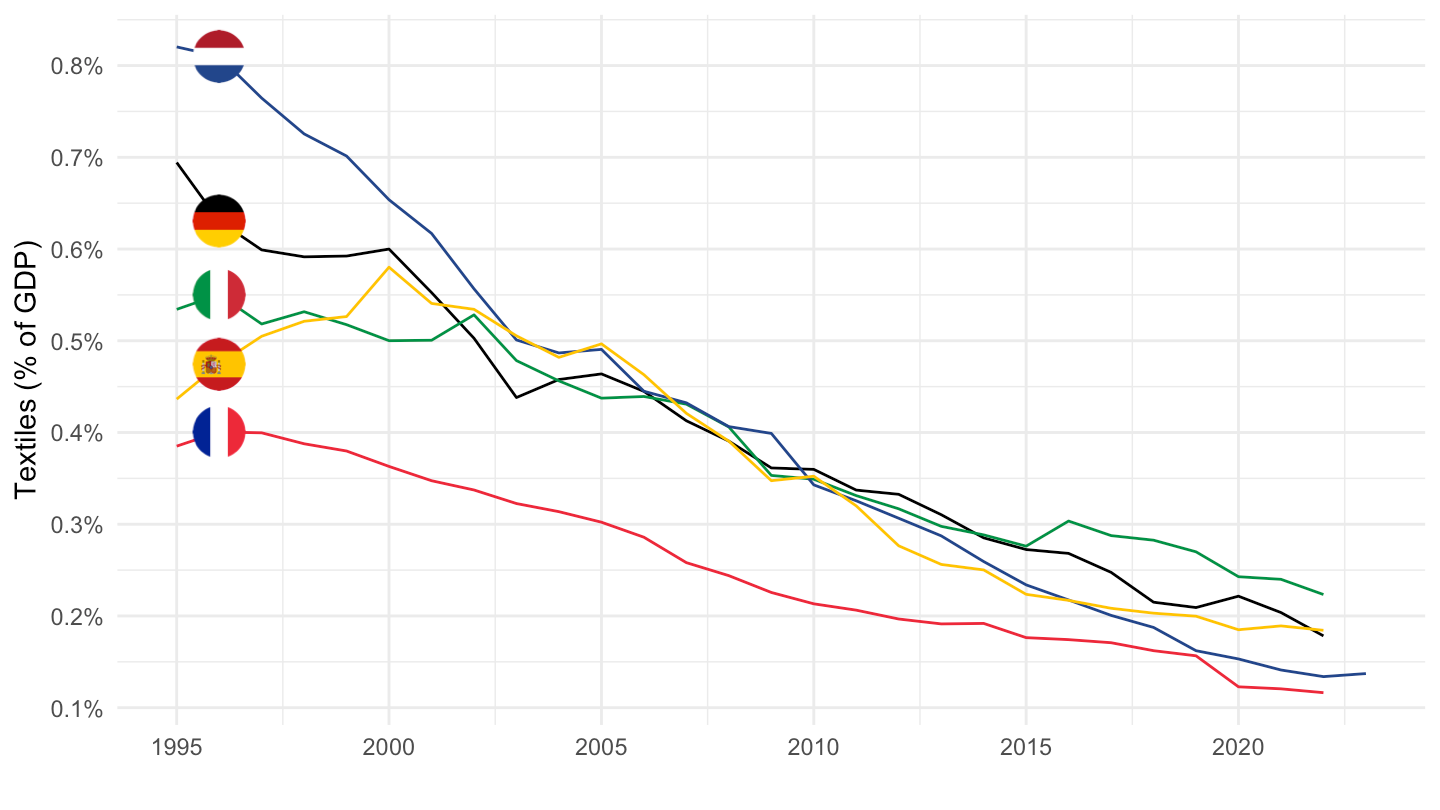
Volume
Code
nama_10_a64 %>%
  filter(na_item == "B1G",
         nace_r2 %in% c("C18", "TOTAL"),
         geo %in% c("FR", "DE", "IT", "ES"),
         unit == "CLV10_MEUR") %>%
  year_to_date() %>%
  left_join(geo, by = "geo") %>%
  select(geo,  Geo, nace_r2, date, values) %>%
  spread(nace_r2, values) %>%
  mutate(values = `C18`/TOTAL) %>%
  left_join(colors, by = c("Geo" = "country")) %>%
  ggplot(.) + geom_line(aes(x = date, y = values, color = color)) +
  theme_minimal() + xlab("") + ylab("Textiles (% of GDP)") +
  scale_color_identity() + add_4flags +
  scale_x_date(breaks = seq(1960, 2100, 5) %>% paste0("-01-01") %>% as.Date,
               labels = date_format("%Y")) +
  theme(legend.position = "none") +
  scale_y_continuous(breaks = 0.01*seq(-500, 200, 0.1),
                     labels = percent_format(accuracy = .1))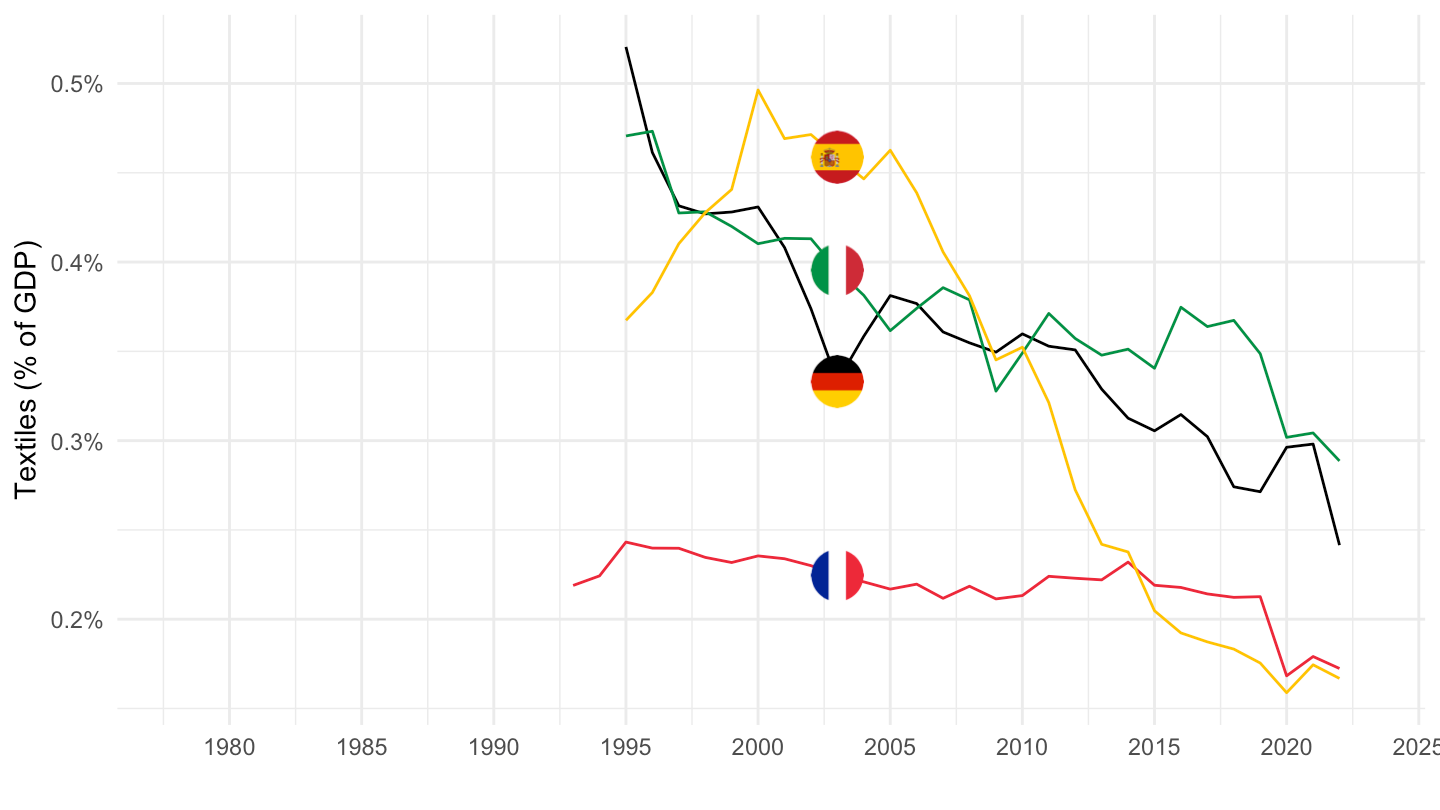
Price Deflator
All
Code
nama_10_a64 %>%
  filter(na_item == "B1G",
         nace_r2 %in% c("C18", "TOTAL"),
         geo %in% c("FR", "DE", "IT", "ES"),
         unit == "PD10_NAC") %>%
  year_to_date() %>%
  left_join(geo, by = "geo") %>%
  select(geo,  Geo, nace_r2, date, values) %>%
  spread(nace_r2, values) %>%
  mutate(values = `C18`/TOTAL)  %>%
  left_join(colors, by = c("Geo" = "country")) %>%
  ggplot(.) + geom_line(aes(x = date, y = values, color = color)) +
  theme_minimal() + xlab("") + ylab("Price Deflator") +
  scale_color_identity() + add_4flags +
  scale_x_date(breaks = seq(1960, 2100, 5) %>% paste0("-01-01") %>% as.Date,
               labels = date_format("%Y")) +
  scale_y_continuous(breaks = 0.01*seq(-500, 200, 10))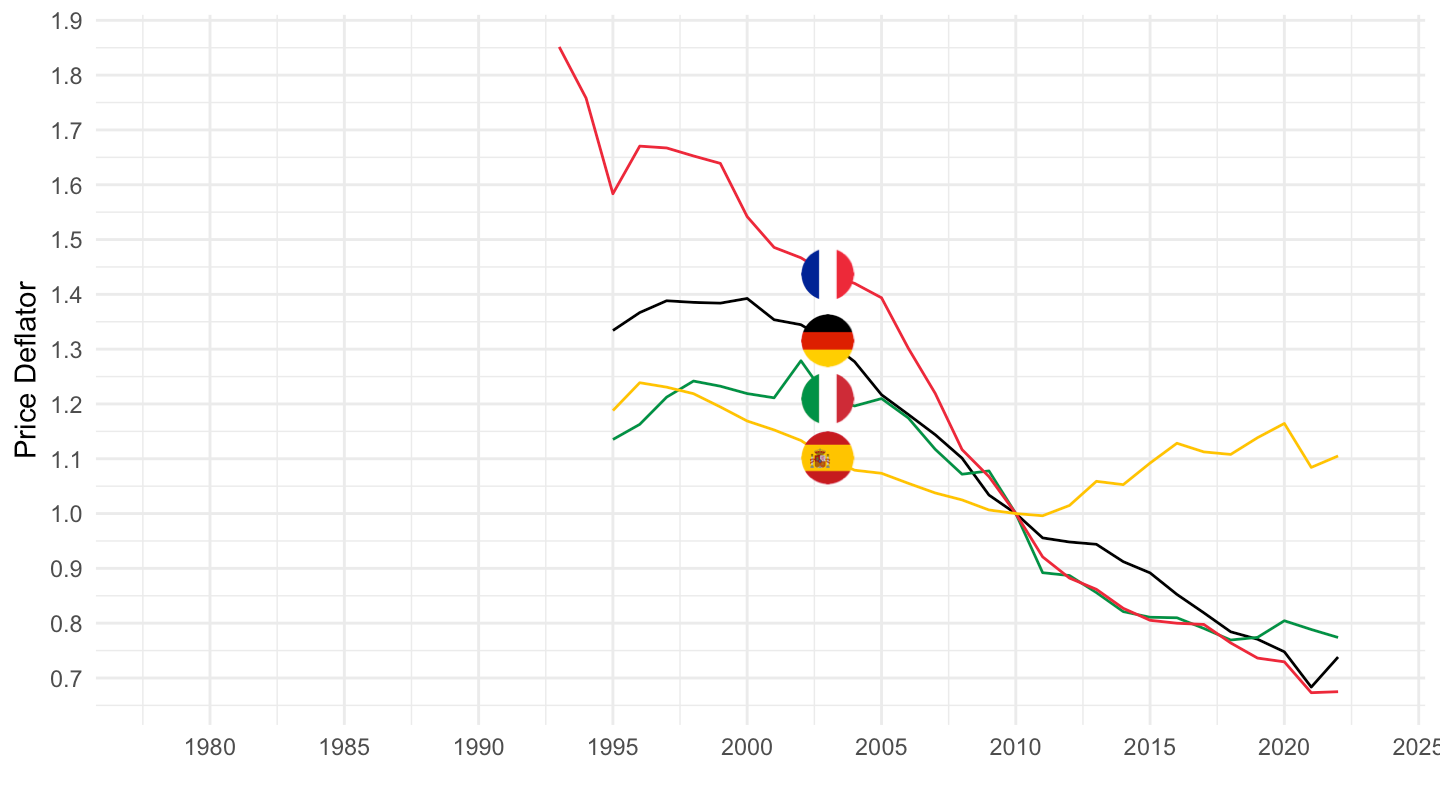
1995-
Code
nama_10_a64 %>%
  filter(na_item == "B1G",
         nace_r2 %in% c("C18", "TOTAL"),
         geo %in% c("FR", "DE", "IT", "ES"),
         unit == "PD10_NAC") %>%
  year_to_date() %>%
  left_join(geo, by = "geo") %>%
  filter(date >= as.Date("1995-01-01")) %>%
  select(geo,  Geo, nace_r2, date, values) %>%
  spread(nace_r2, values) %>%
  mutate(values = `C18`/TOTAL)  %>%
  left_join(colors, by = c("Geo" = "country")) %>%
  group_by(Geo) %>%
  mutate(values = values/ values[1]) %>%
  ggplot(.) + geom_line(aes(x = date, y = values, color = color)) +
  theme_minimal() + xlab("") + ylab("Price Deflator") +
  scale_color_identity() + add_4flags +
  scale_x_date(breaks = seq(1960, 2100, 5) %>% paste0("-01-01") %>% as.Date,
               labels = date_format("%Y")) +
  scale_y_continuous(breaks = 0.01*seq(-500, 200, 10))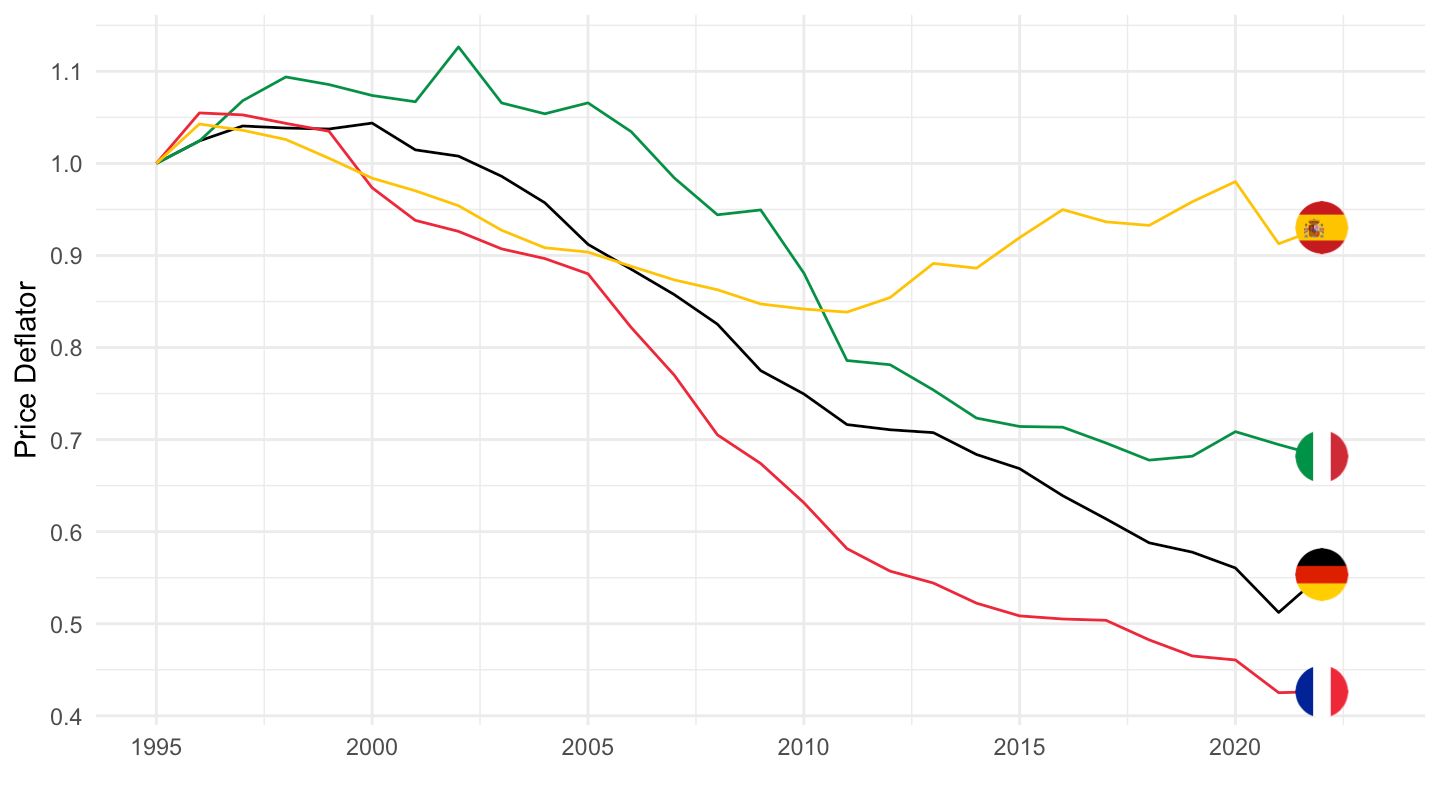
C19 - Manufacture of coke and refined petroleum products
Value
All
Code
nama_10_a64 %>%
  filter(na_item == "B1G",
         nace_r2 %in% c("C19", "TOTAL"),
         geo %in% c("FR", "DE", "IT", "ES"),
         unit == "CP_MNAC") %>%
  year_to_date() %>%
  left_join(geo, by = "geo") %>%
  select(geo,  Geo, nace_r2, date, values) %>%
  spread(nace_r2, values) %>%
  mutate(values = `C19`/TOTAL) %>%
  left_join(colors, by = c("Geo" = "country")) %>%
  ggplot(.) + geom_line(aes(x = date, y = values, color = color)) +
  theme_minimal() + xlab("") + ylab("Textiles (% of GDP)") +
  scale_color_identity() + add_4flags +
  scale_x_date(breaks = seq(1960, 2100, 5) %>% paste0("-01-01") %>% as.Date,
               labels = date_format("%Y")) +
  theme(legend.position = "none") +
  scale_y_continuous(breaks = 0.01*seq(-500, 200, 0.1),
                     labels = percent_format(accuracy = .1))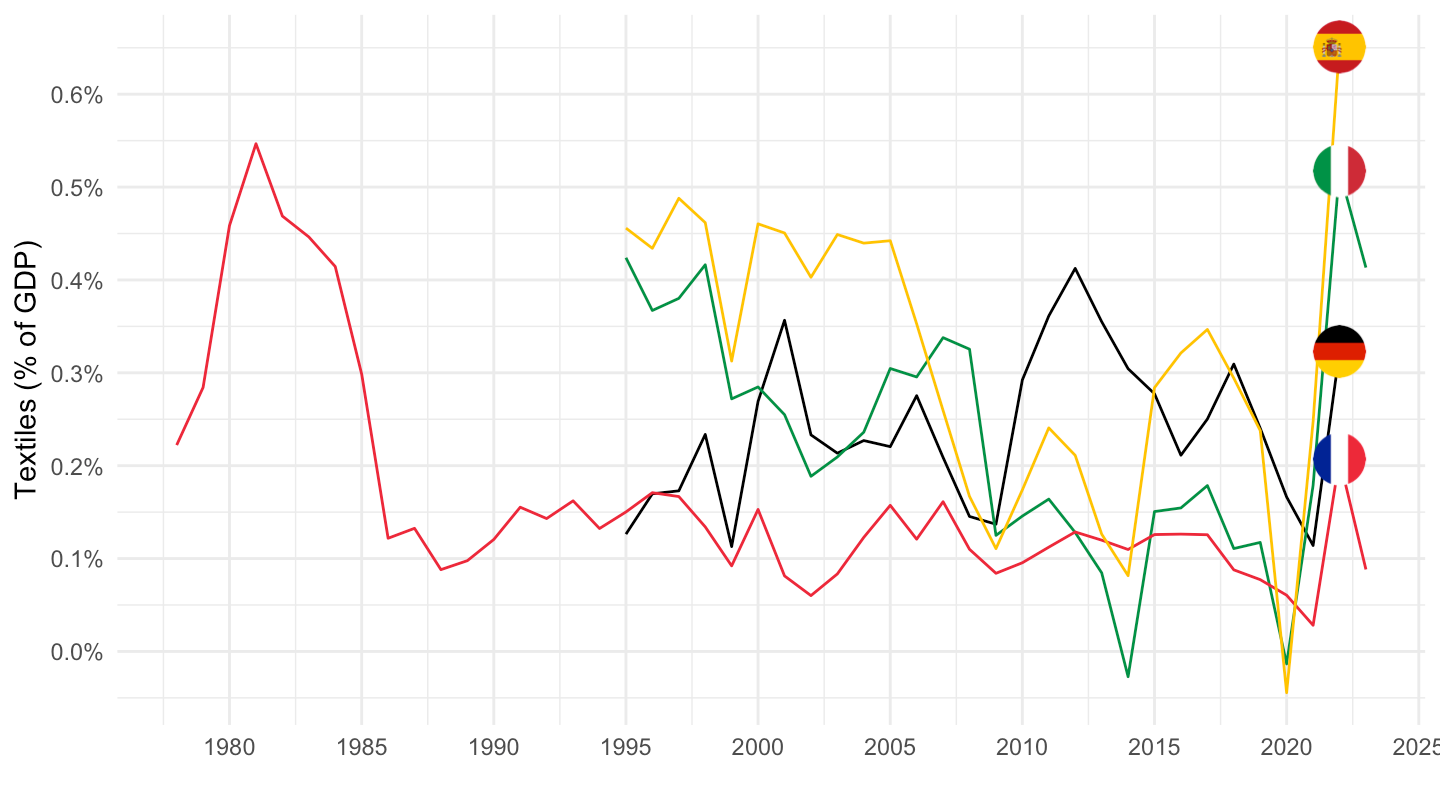
1995-
Code
nama_10_a64 %>%
  filter(na_item == "B1G",
         nace_r2 %in% c("C19", "TOTAL"),
         geo %in% c("FR", "DE", "IT", "ES", "NL"),
         unit == "CP_MNAC") %>%
  year_to_date() %>%
  filter(date >= as.Date("1995-01-01")) %>%
  left_join(geo, by = "geo") %>%
  select(geo,  Geo, nace_r2, date, values) %>%
  spread(nace_r2, values) %>%
  mutate(values = `C19`/TOTAL) %>%
  left_join(colors, by = c("Geo" = "country")) %>%
  mutate(color = ifelse(geo == "NL", color2, color)) %>%
  ggplot(.) + geom_line(aes(x = date, y = values, color = color)) +
  theme_minimal() + xlab("") + ylab("Textiles (% of GDP)") +
  scale_color_identity() + add_5flags +
  scale_x_date(breaks = seq(1960, 2100, 5) %>% paste0("-01-01") %>% as.Date,
               labels = date_format("%Y")) +
  theme(legend.position = "none") +
  scale_y_continuous(breaks = 0.01*seq(-500, 200, 0.1),
                     labels = percent_format(accuracy = .1))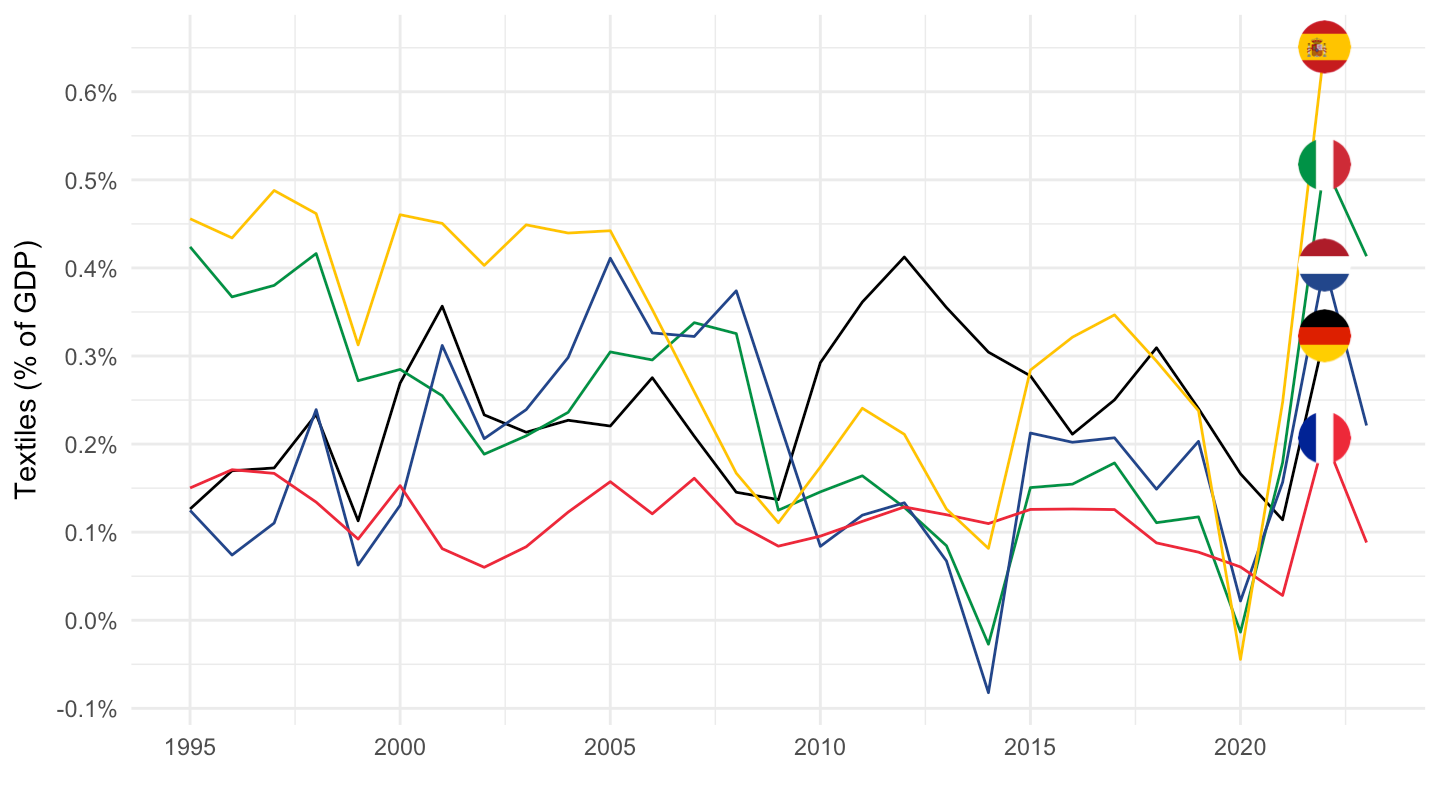
Volume
Code
nama_10_a64 %>%
  filter(na_item == "B1G",
         nace_r2 %in% c("C19", "TOTAL"),
         geo %in% c("FR", "DE", "IT", "ES"),
         unit == "CLV10_MEUR") %>%
  year_to_date() %>%
  left_join(geo, by = "geo") %>%
  select(geo,  Geo, nace_r2, date, values) %>%
  spread(nace_r2, values) %>%
  mutate(values = `C19`/TOTAL) %>%
  left_join(colors, by = c("Geo" = "country")) %>%
  ggplot(.) + geom_line(aes(x = date, y = values, color = color)) +
  theme_minimal() + xlab("") + ylab("Textiles (% of GDP)") +
  scale_color_identity() + add_4flags +
  scale_x_date(breaks = seq(1960, 2100, 5) %>% paste0("-01-01") %>% as.Date,
               labels = date_format("%Y")) +
  theme(legend.position = "none") +
  scale_y_continuous(breaks = 0.01*seq(-500, 200, 0.1),
                     labels = percent_format(accuracy = .1))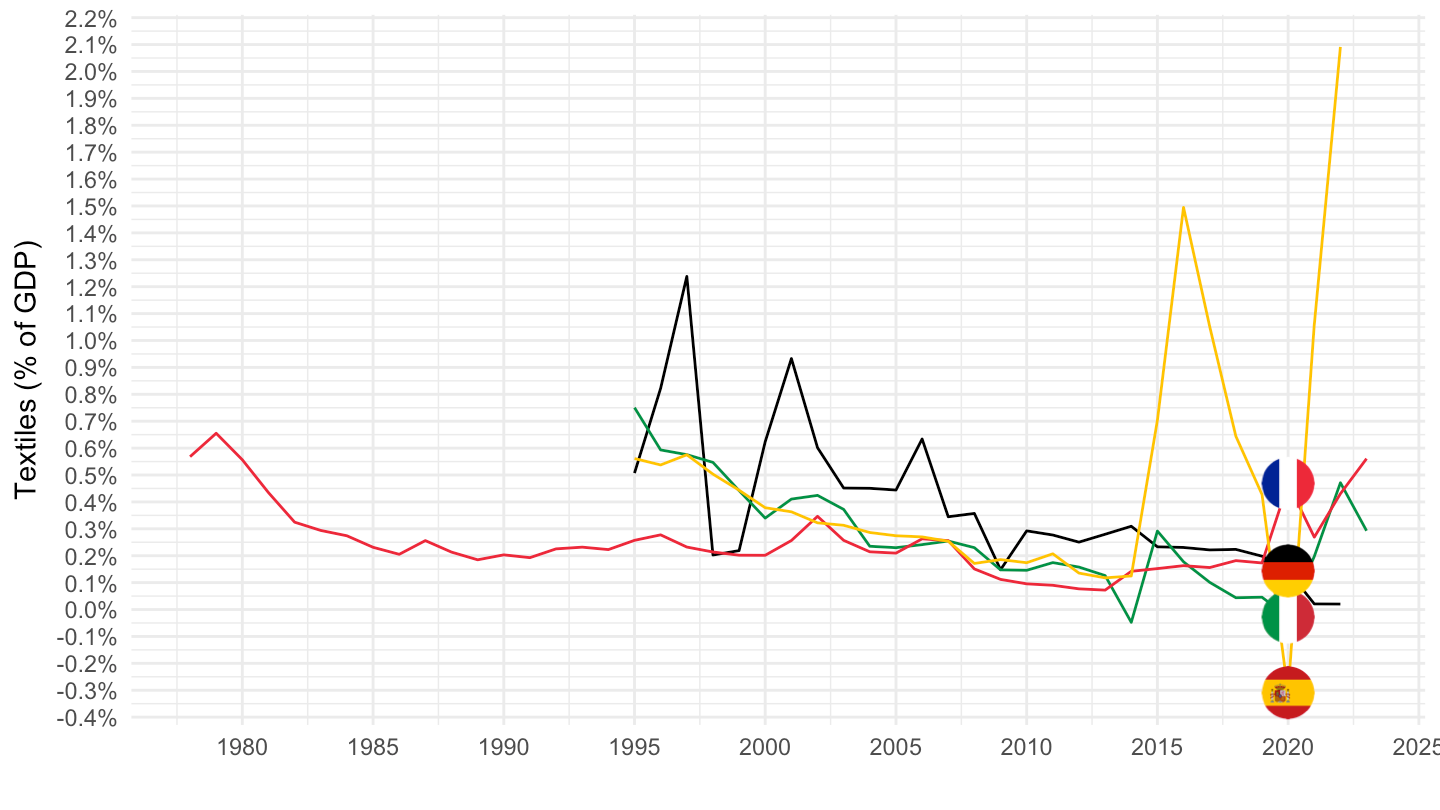
Price Deflator
All
Code
nama_10_a64 %>%
  filter(na_item == "B1G",
         nace_r2 %in% c("C19", "TOTAL"),
         geo %in% c("FR", "DE", "IT", "ES"),
         unit == "PD10_NAC") %>%
  year_to_date() %>%
  left_join(geo, by = "geo") %>%
  select(geo,  Geo, nace_r2, date, values) %>%
  spread(nace_r2, values) %>%
  mutate(values = `C19`/TOTAL)  %>%
  left_join(colors, by = c("Geo" = "country")) %>%
  ggplot(.) + geom_line(aes(x = date, y = values, color = color)) +
  theme_minimal() + xlab("") + ylab("Price Deflator") +
  scale_color_identity() + add_4flags +
  scale_x_date(breaks = seq(1960, 2100, 5) %>% paste0("-01-01") %>% as.Date,
               labels = date_format("%Y")) +
  scale_y_continuous(breaks = 0.01*seq(-500, 200, 10))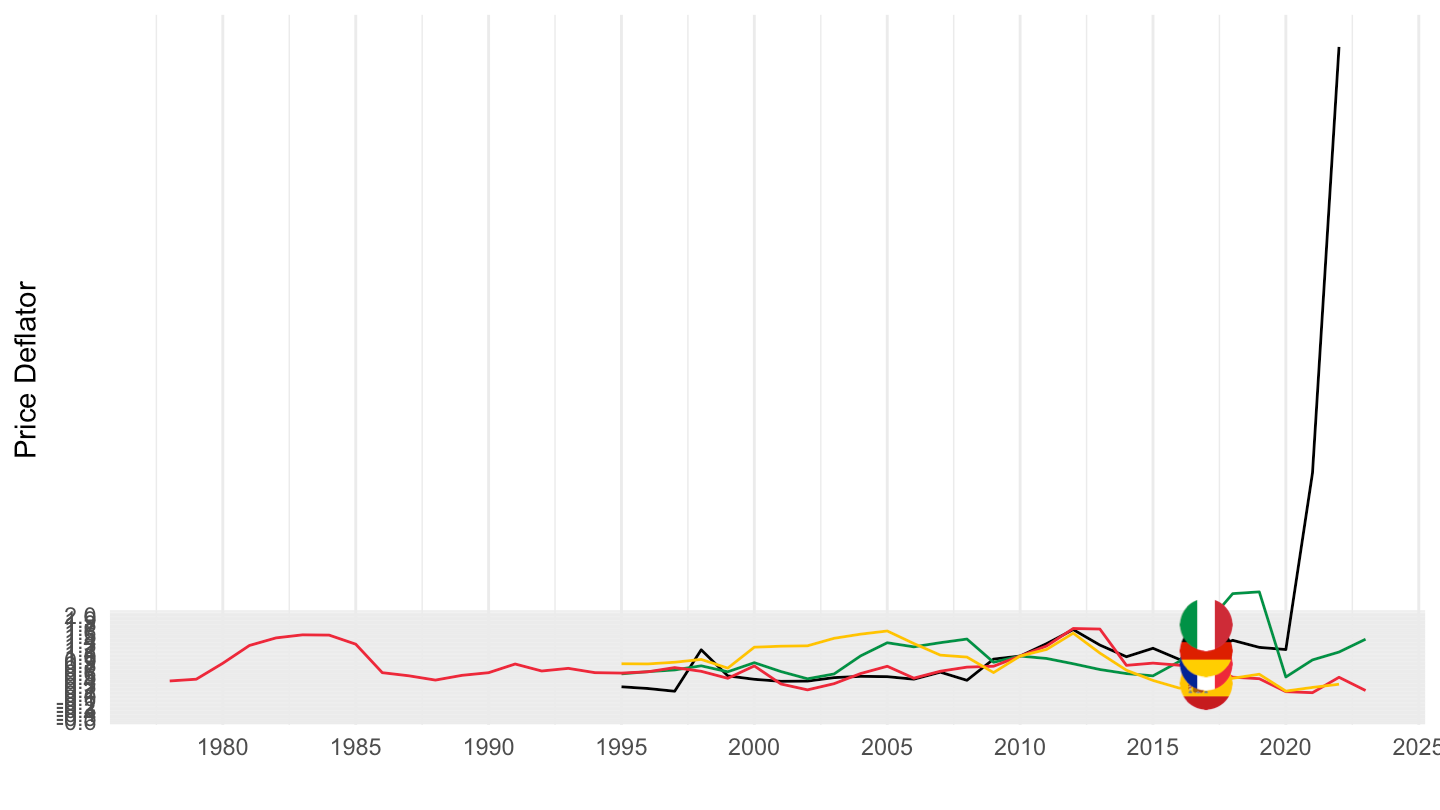
1995-
Code
nama_10_a64 %>%
  filter(na_item == "B1G",
         nace_r2 %in% c("C19", "TOTAL"),
         geo %in% c("FR", "DE", "IT", "ES"),
         unit == "PD10_NAC") %>%
  year_to_date() %>%
  left_join(geo, by = "geo") %>%
  filter(date >= as.Date("1995-01-01")) %>%
  select(geo,  Geo, nace_r2, date, values) %>%
  spread(nace_r2, values) %>%
  mutate(values = `C19`/TOTAL)  %>%
  left_join(colors, by = c("Geo" = "country")) %>%
  group_by(Geo) %>%
  mutate(values = values/ values[1]) %>%
  ggplot(.) + geom_line(aes(x = date, y = values, color = color)) +
  theme_minimal() + xlab("") + ylab("Price Deflator") +
  scale_color_identity() + add_4flags +
  scale_x_date(breaks = seq(1960, 2100, 5) %>% paste0("-01-01") %>% as.Date,
               labels = date_format("%Y")) +
  scale_y_continuous(breaks = 0.01*seq(-500, 200, 10))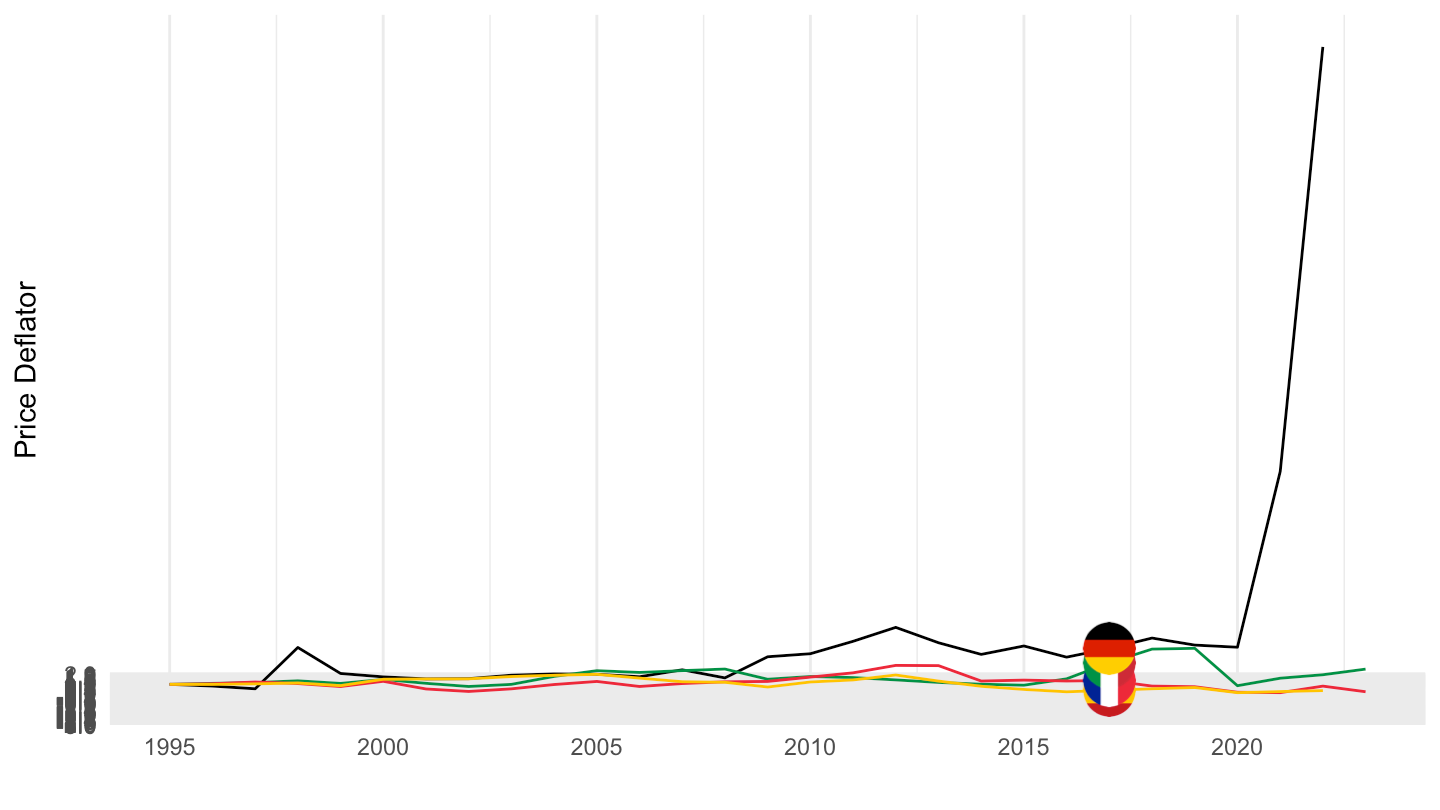
C20 - Manufacture of chemicals and chemical products
Value
All
Code
nama_10_a64 %>%
  filter(na_item == "B1G",
         nace_r2 %in% c("C20", "TOTAL"),
         geo %in% c("FR", "DE", "IT", "ES"),
         unit == "CP_MNAC") %>%
  year_to_date() %>%
  left_join(geo, by = "geo") %>%
  select(geo,  Geo, nace_r2, date, values) %>%
  spread(nace_r2, values) %>%
  mutate(values = `C20`/TOTAL) %>%
  left_join(colors, by = c("Geo" = "country")) %>%
  ggplot(.) + geom_line(aes(x = date, y = values, color = color)) +
  theme_minimal() + xlab("") + ylab("Textiles (% of GDP)") +
  scale_color_identity() + add_4flags +
  scale_x_date(breaks = seq(1960, 2100, 5) %>% paste0("-01-01") %>% as.Date,
               labels = date_format("%Y")) +
  theme(legend.position = "none") +
  scale_y_continuous(breaks = 0.01*seq(-500, 200, 0.1),
                     labels = percent_format(accuracy = .1))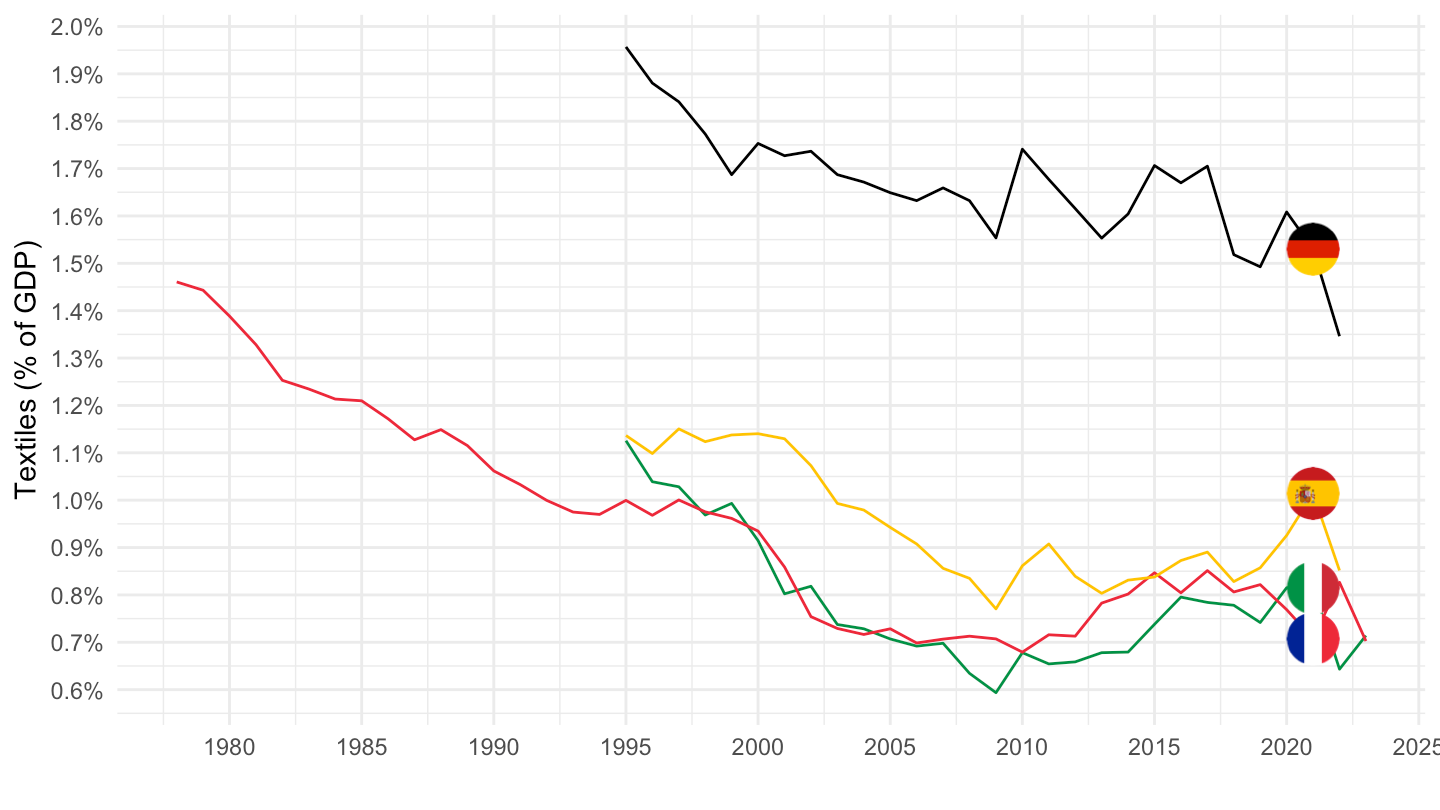
1995-
Code
nama_10_a64 %>%
  filter(na_item == "B1G",
         nace_r2 %in% c("C20", "TOTAL"),
         geo %in% c("FR", "DE", "IT", "ES", "NL"),
         unit == "CP_MNAC") %>%
  year_to_date() %>%
  filter(date >= as.Date("1995-01-01")) %>%
  left_join(geo, by = "geo") %>%
  select(geo,  Geo, nace_r2, date, values) %>%
  spread(nace_r2, values) %>%
  mutate(values = `C20`/TOTAL) %>%
  left_join(colors, by = c("Geo" = "country")) %>%
  mutate(color = ifelse(geo == "NL", color2, color)) %>%
  ggplot(.) + geom_line(aes(x = date, y = values, color = color)) +
  theme_minimal() + xlab("") + ylab("Textiles (% of GDP)") +
  scale_color_identity() + add_5flags +
  scale_x_date(breaks = seq(1960, 2100, 5) %>% paste0("-01-01") %>% as.Date,
               labels = date_format("%Y")) +
  theme(legend.position = "none") +
  scale_y_continuous(breaks = 0.01*seq(-500, 200, 0.1),
                     labels = percent_format(accuracy = .1))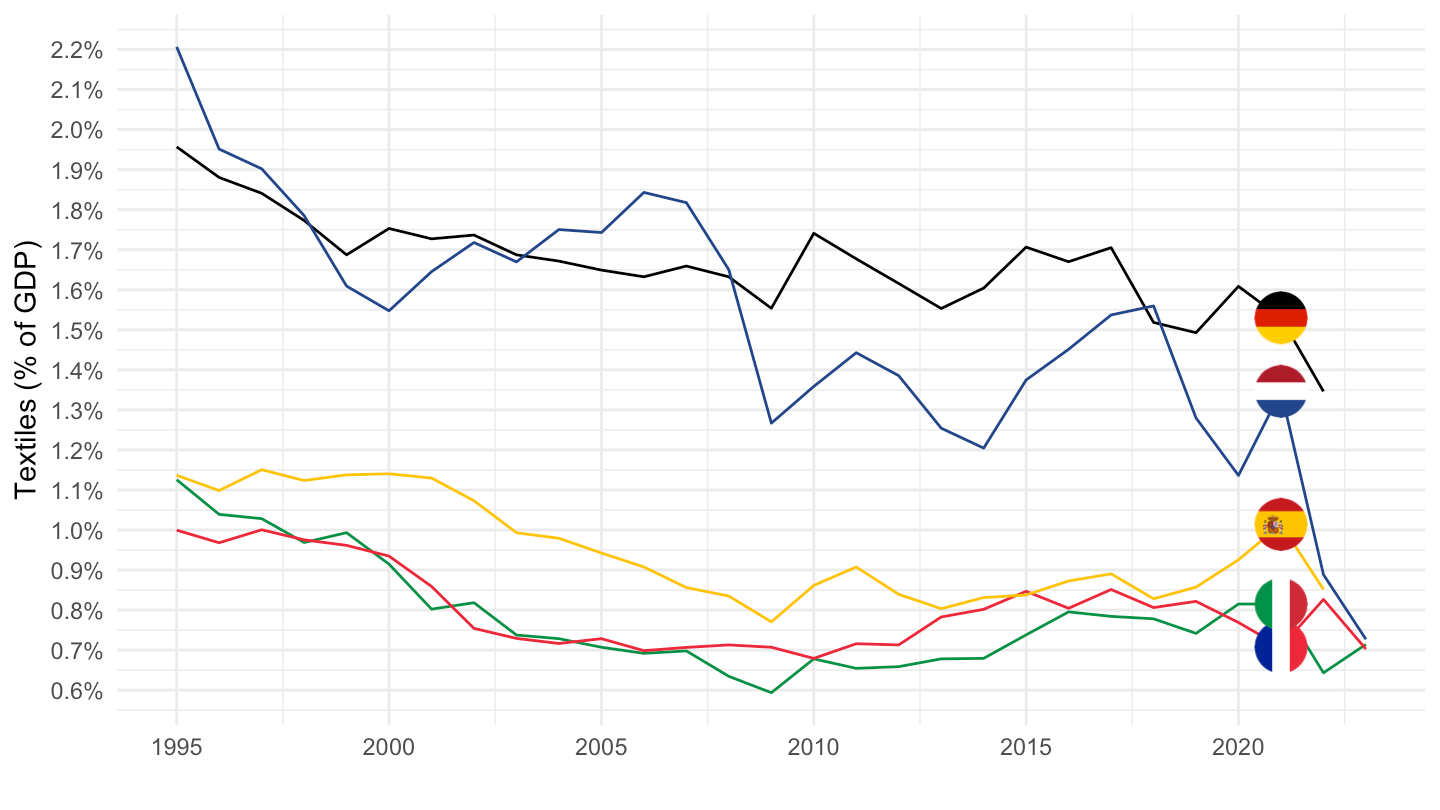
Volume
Code
nama_10_a64 %>%
  filter(na_item == "B1G",
         nace_r2 %in% c("C20", "TOTAL"),
         geo %in% c("FR", "DE", "IT", "ES"),
         unit == "CLV10_MEUR") %>%
  year_to_date() %>%
  left_join(geo, by = "geo") %>%
  select(geo,  Geo, nace_r2, date, values) %>%
  spread(nace_r2, values) %>%
  mutate(values = `C20`/TOTAL) %>%
  left_join(colors, by = c("Geo" = "country")) %>%
  ggplot(.) + geom_line(aes(x = date, y = values, color = color)) +
  theme_minimal() + xlab("") + ylab("Textiles (% of GDP)") +
  scale_color_identity() + add_4flags +
  scale_x_date(breaks = seq(1960, 2100, 5) %>% paste0("-01-01") %>% as.Date,
               labels = date_format("%Y")) +
  theme(legend.position = "none") +
  scale_y_continuous(breaks = 0.01*seq(-500, 200, 0.1),
                     labels = percent_format(accuracy = .1))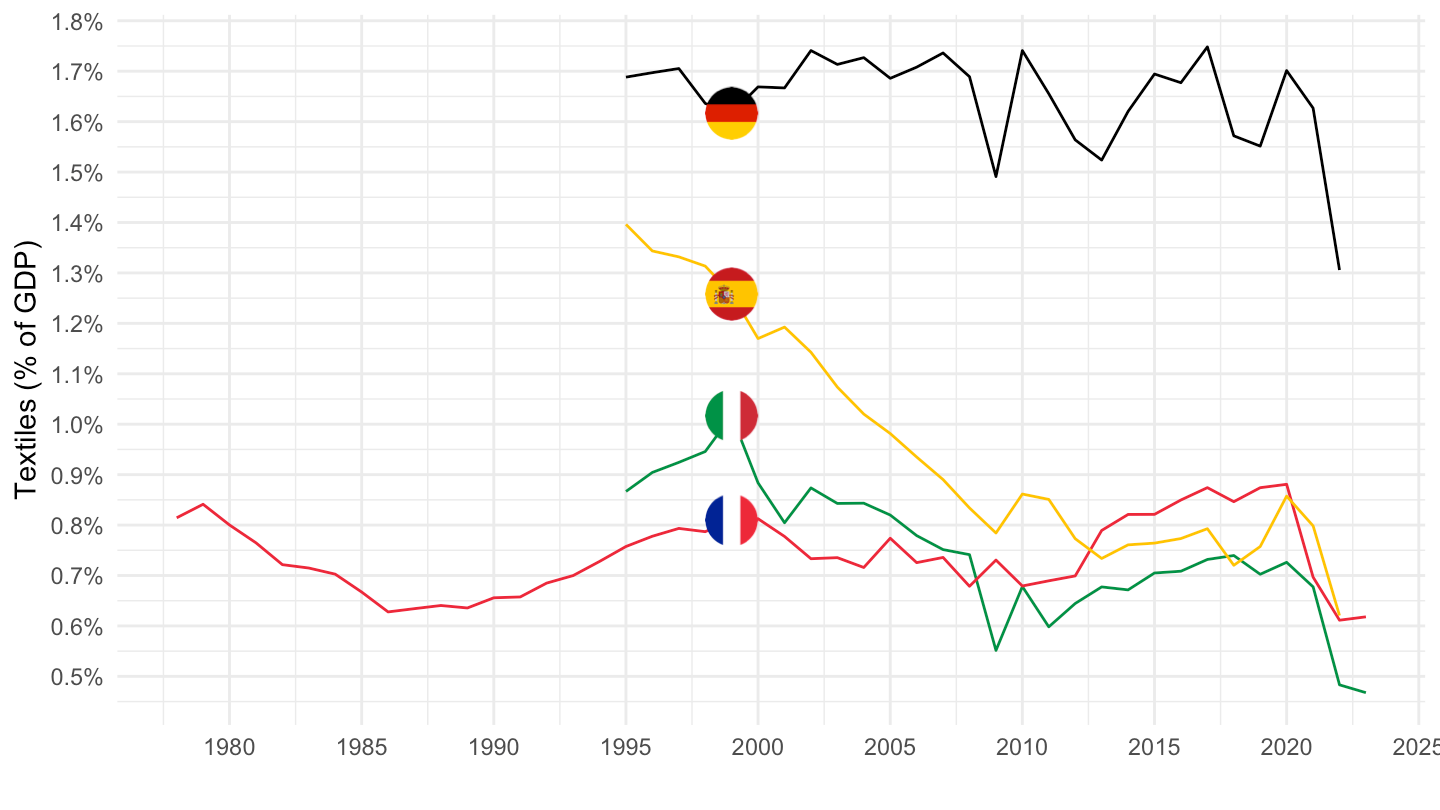
Price Deflator
All
Code
nama_10_a64 %>%
  filter(na_item == "B1G",
         nace_r2 %in% c("C20", "TOTAL"),
         geo %in% c("FR", "DE", "IT", "ES"),
         unit == "PD10_NAC") %>%
  year_to_date() %>%
  left_join(geo, by = "geo") %>%
  select(geo,  Geo, nace_r2, date, values) %>%
  spread(nace_r2, values) %>%
  mutate(values = `C20`/TOTAL)  %>%
  left_join(colors, by = c("Geo" = "country")) %>%
  ggplot(.) + geom_line(aes(x = date, y = values, color = color)) +
  theme_minimal() + xlab("") + ylab("Price Deflator") +
  scale_color_identity() + add_4flags +
  scale_x_date(breaks = seq(1960, 2100, 5) %>% paste0("-01-01") %>% as.Date,
               labels = date_format("%Y")) +
  scale_y_continuous(breaks = 0.01*seq(-500, 200, 10))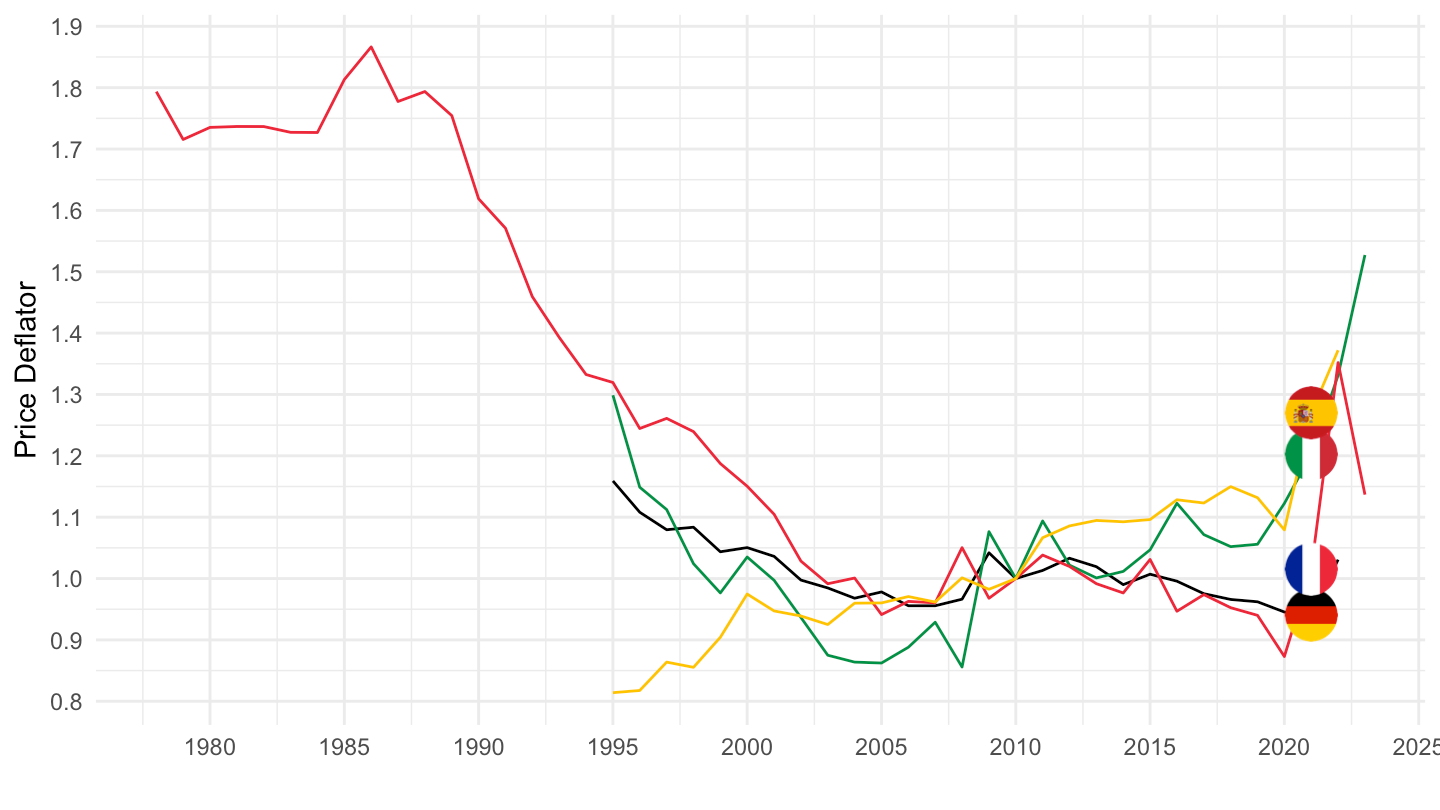
1995-
Code
nama_10_a64 %>%
  filter(na_item == "B1G",
         nace_r2 %in% c("C20", "TOTAL"),
         geo %in% c("FR", "DE", "IT", "ES"),
         unit == "PD10_NAC") %>%
  year_to_date() %>%
  left_join(geo, by = "geo") %>%
  filter(date >= as.Date("1995-01-01")) %>%
  select(geo,  Geo, nace_r2, date, values) %>%
  spread(nace_r2, values) %>%
  mutate(values = `C20`/TOTAL)  %>%
  left_join(colors, by = c("Geo" = "country")) %>%
  group_by(Geo) %>%
  mutate(values = values/ values[1]) %>%
  ggplot(.) + geom_line(aes(x = date, y = values, color = color)) +
  theme_minimal() + xlab("") + ylab("Price Deflator") +
  scale_color_identity() + add_4flags +
  scale_x_date(breaks = seq(1960, 2100, 5) %>% paste0("-01-01") %>% as.Date,
               labels = date_format("%Y")) +
  scale_y_continuous(breaks = 0.01*seq(-500, 200, 10))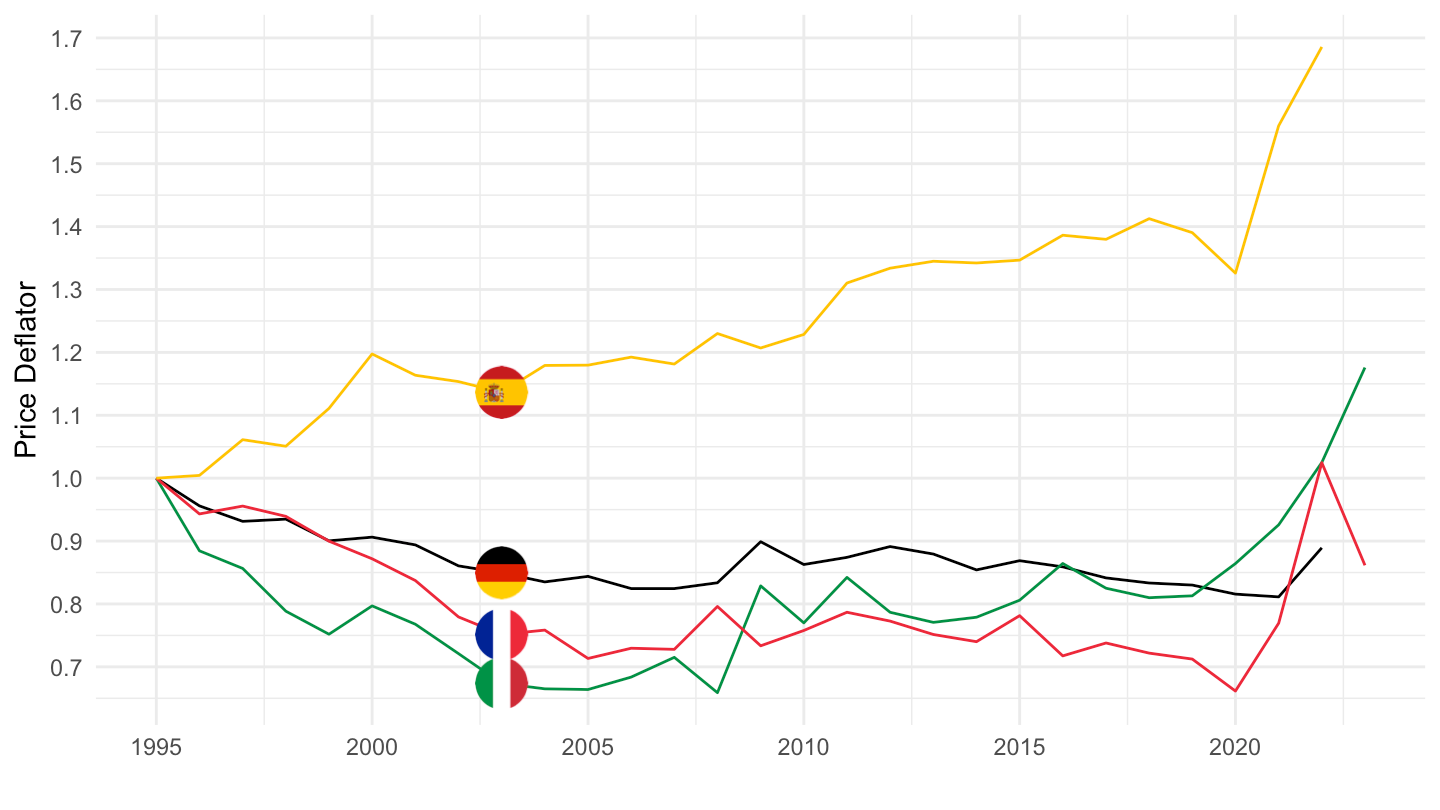
C21 - Manufacture of basic pharmaceutical products and pharmaceutical preparations
Value
All
Code
nama_10_a64 %>%
  filter(na_item == "B1G",
         nace_r2 %in% c("C21", "TOTAL"),
         geo %in% c("FR", "DE", "IT", "ES"),
         unit == "CP_MNAC") %>%
  year_to_date() %>%
  left_join(geo, by = "geo") %>%
  select(geo,  Geo, nace_r2, date, values) %>%
  spread(nace_r2, values) %>%
  mutate(values = `C21`/TOTAL) %>%
  left_join(colors, by = c("Geo" = "country")) %>%
  ggplot(.) + geom_line(aes(x = date, y = values, color = color)) +
  theme_minimal() + xlab("") + ylab("Manufacture of basic pharmaceutical products (% of GDP)") +
  scale_color_identity() + add_4flags +
  scale_x_date(breaks = seq(1960, 2100, 5) %>% paste0("-01-01") %>% as.Date,
               labels = date_format("%Y")) +
  theme(legend.position = "none") +
  scale_y_continuous(breaks = 0.01*seq(-500, 200, 0.1),
                     labels = percent_format(accuracy = .1))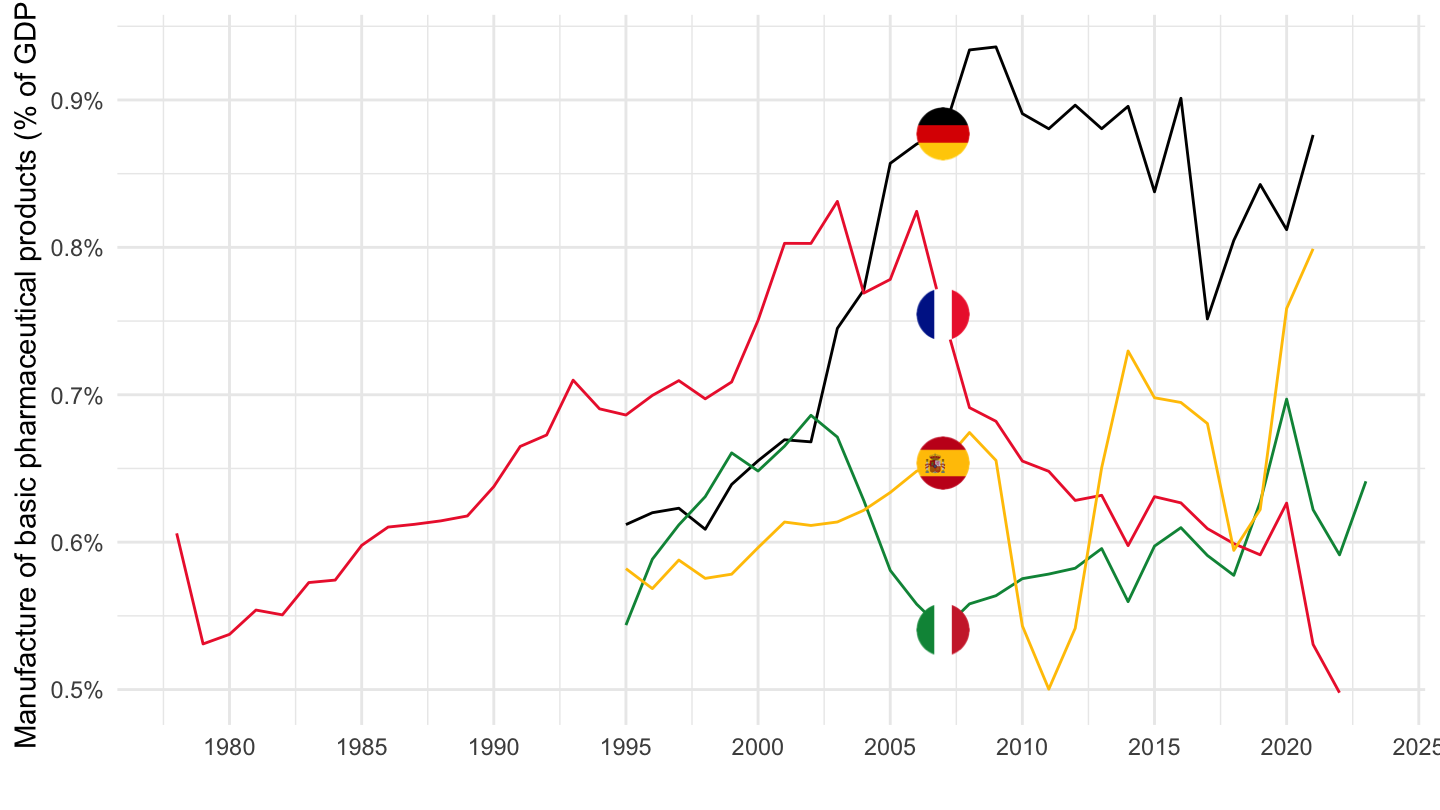
1995-
Code
nama_10_a64 %>%
  filter(na_item == "B1G",
         nace_r2 %in% c("C21", "TOTAL"),
         geo %in% c("FR", "DE", "IT", "ES", "NL"),
         unit == "CP_MNAC") %>%
  year_to_date() %>%
  filter(date >= as.Date("1995-01-01")) %>%
  left_join(geo, by = "geo") %>%
  select(geo,  Geo, nace_r2, date, values) %>%
  spread(nace_r2, values) %>%
  mutate(values = `C21`/TOTAL) %>%
  left_join(colors, by = c("Geo" = "country")) %>%
  mutate(color = ifelse(geo == "NL", color2, color)) %>%
  ggplot(.) + geom_line(aes(x = date, y = values, color = color)) +
  theme_minimal() + xlab("") + ylab("Manufacture of basic pharmaceutical products (% of GDP)") +
  scale_color_identity() + add_5flags +
  scale_x_date(breaks = seq(1960, 2100, 5) %>% paste0("-01-01") %>% as.Date,
               labels = date_format("%Y")) +
  theme(legend.position = "none") +
  scale_y_continuous(breaks = 0.01*seq(-500, 200, 0.1),
                     labels = percent_format(accuracy = .1))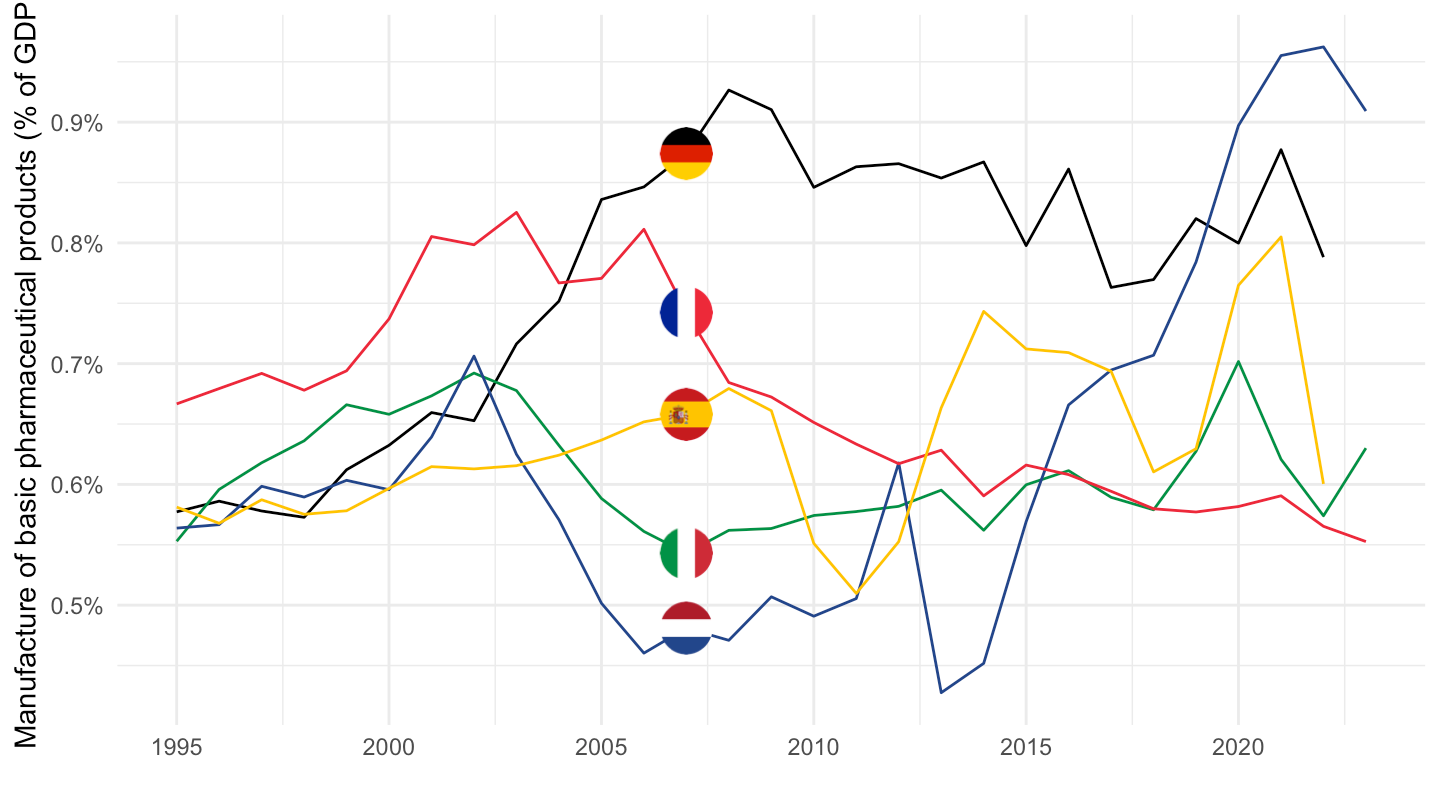
Volume
All
Code
nama_10_a64 %>%
  filter(na_item == "B1G",
         nace_r2 %in% c("C21", "TOTAL"),
         geo %in% c("FR", "DE", "IT", "ES"),
         unit == "CLV10_MEUR") %>%
  year_to_date() %>%
  left_join(geo, by = "geo") %>%
  select(geo,  Geo, nace_r2, date, values) %>%
  spread(nace_r2, values) %>%
  mutate(values = `C21`/TOTAL) %>%
  left_join(colors, by = c("Geo" = "country")) %>%
  ggplot(.) + geom_line(aes(x = date, y = values, color = color)) +
  theme_minimal() + xlab("") + ylab("Manufacture of basic pharmaceutical products (% of GDP)") +
  scale_color_identity() + add_4flags +
  scale_x_date(breaks = seq(1960, 2100, 5) %>% paste0("-01-01") %>% as.Date,
               labels = date_format("%Y")) +
  theme(legend.position = "none") +
  scale_y_continuous(breaks = 0.01*seq(-500, 200, 0.1),
                     labels = percent_format(accuracy = .1))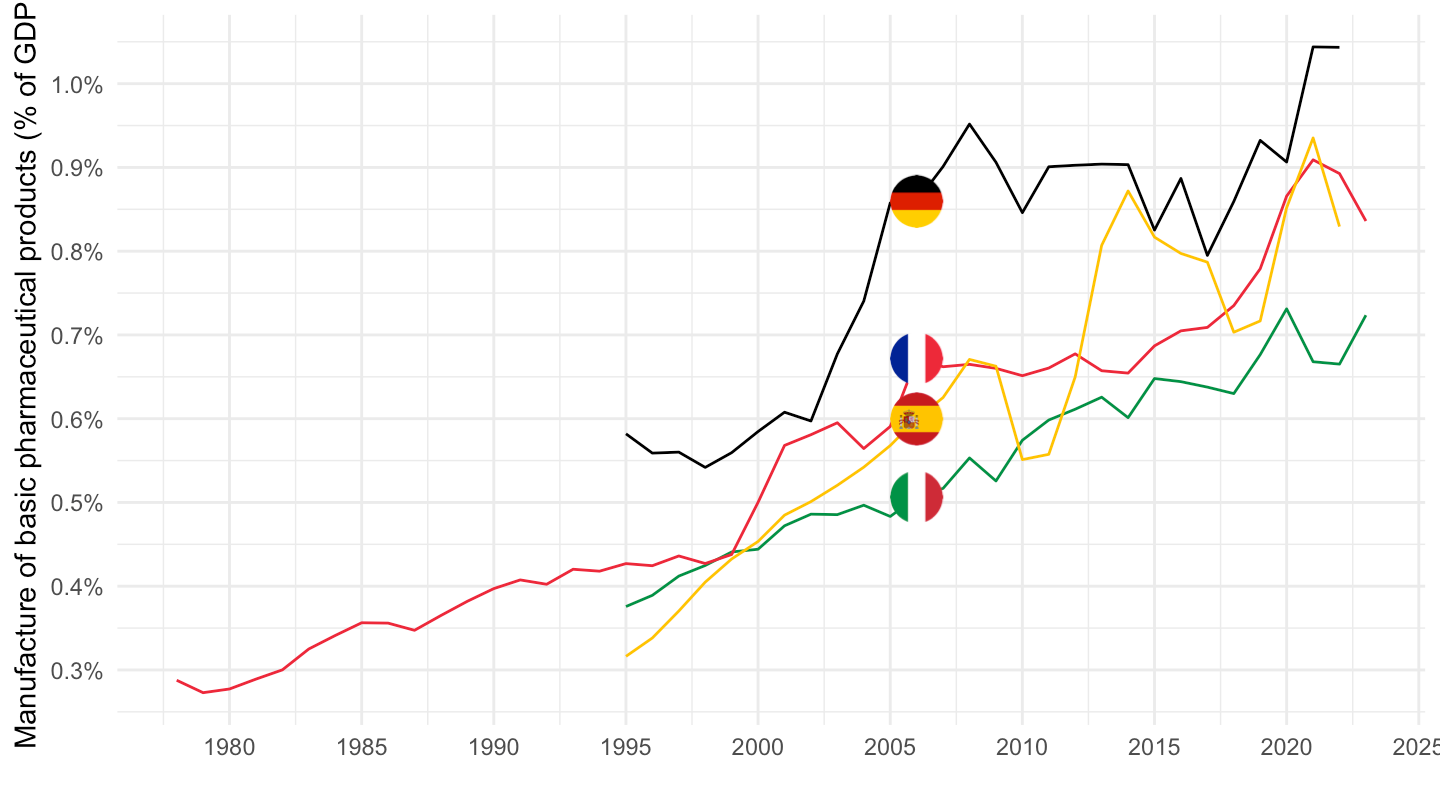
1995-
Code
nama_10_a64 %>%
  filter(na_item == "B1G",
         nace_r2 %in% c("C21", "TOTAL"),
         geo %in% c("FR", "DE", "IT", "ES", "NL"),
         unit == "CLV10_MEUR") %>%
  year_to_date() %>%
  filter(date >= as.Date("1995-01-01")) %>%
  left_join(geo, by = "geo") %>%
  select(geo,  Geo, nace_r2, date, values) %>%
  spread(nace_r2, values) %>%
  mutate(values = `C21`/TOTAL) %>%
  left_join(colors, by = c("Geo" = "country")) %>%
  ggplot(.) + geom_line(aes(x = date, y = values, color = color)) +
  theme_minimal() + xlab("") + ylab("Manufacture of basic pharmaceutical products (% of GDP)") +
  scale_color_identity() + add_5flags +
  scale_x_date(breaks = seq(1960, 2100, 5) %>% paste0("-01-01") %>% as.Date,
               labels = date_format("%Y")) +
  theme(legend.position = "none") +
  scale_y_continuous(breaks = 0.01*seq(-500, 200, 0.1),
                     labels = percent_format(accuracy = .1))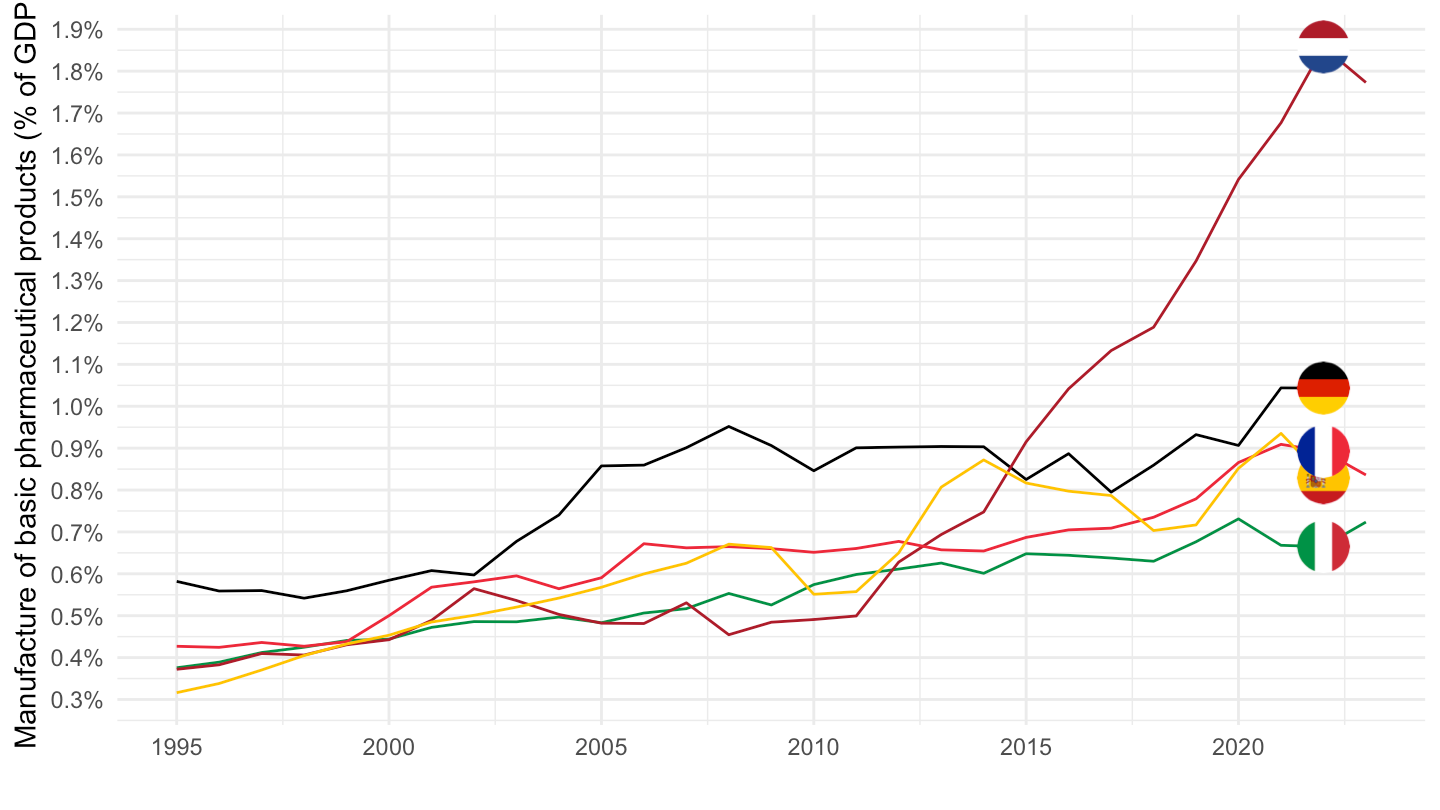
Price Deflator
All
Code
nama_10_a64 %>%
  filter(na_item == "B1G",
         nace_r2 %in% c("C21", "TOTAL"),
         geo %in% c("FR", "DE", "IT", "ES"),
         unit == "PD10_NAC") %>%
  year_to_date() %>%
  left_join(geo, by = "geo") %>%
  select(geo,  Geo, nace_r2, date, values) %>%
  spread(nace_r2, values) %>%
  mutate(values = `C21`/TOTAL)  %>%
  left_join(colors, by = c("Geo" = "country")) %>%
  ggplot(.) + geom_line(aes(x = date, y = values, color = color)) +
  theme_minimal() + xlab("") + ylab("Price Deflator") +
  scale_color_identity() + add_4flags +
  scale_x_date(breaks = seq(1960, 2100, 5) %>% paste0("-01-01") %>% as.Date,
               labels = date_format("%Y")) +
  scale_y_continuous(breaks = 0.01*seq(-500, 200, 10))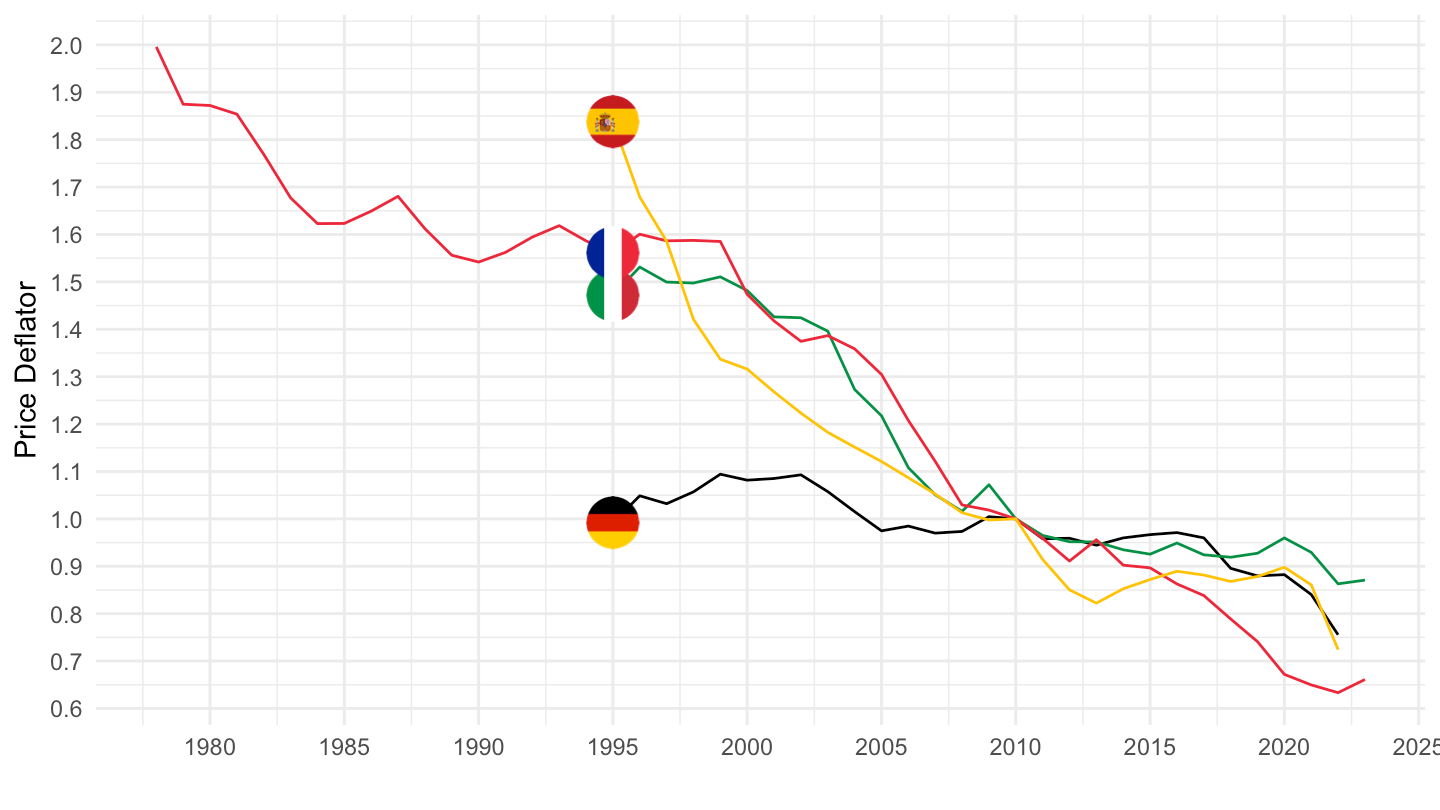
1995-
Code
nama_10_a64 %>%
  filter(na_item == "B1G",
         nace_r2 %in% c("C21", "TOTAL"),
         geo %in% c("FR", "DE", "IT", "ES", "NL"),
         unit == "PD10_NAC") %>%
  year_to_date() %>%
  left_join(geo, by = "geo") %>%
  filter(date >= as.Date("1995-01-01")) %>%
  select(geo,  Geo, nace_r2, date, values) %>%
  spread(nace_r2, values) %>%
  mutate(values = `C21`/TOTAL)  %>%
  left_join(colors, by = c("Geo" = "country")) %>%
  group_by(Geo) %>%
  mutate(values = values/ values[1],
         color = ifelse(geo== "NL", color2, color)) %>%
  ggplot(.) + geom_line(aes(x = date, y = values, color = color)) +
  theme_minimal() + xlab("") + ylab("Price Deflator") +
  scale_color_identity() + add_5flags +
  scale_x_date(breaks = seq(1960, 2100, 5) %>% paste0("-01-01") %>% as.Date,
               labels = date_format("%Y")) +
  scale_y_log10(breaks = 0.01*seq(-500, 200, 10))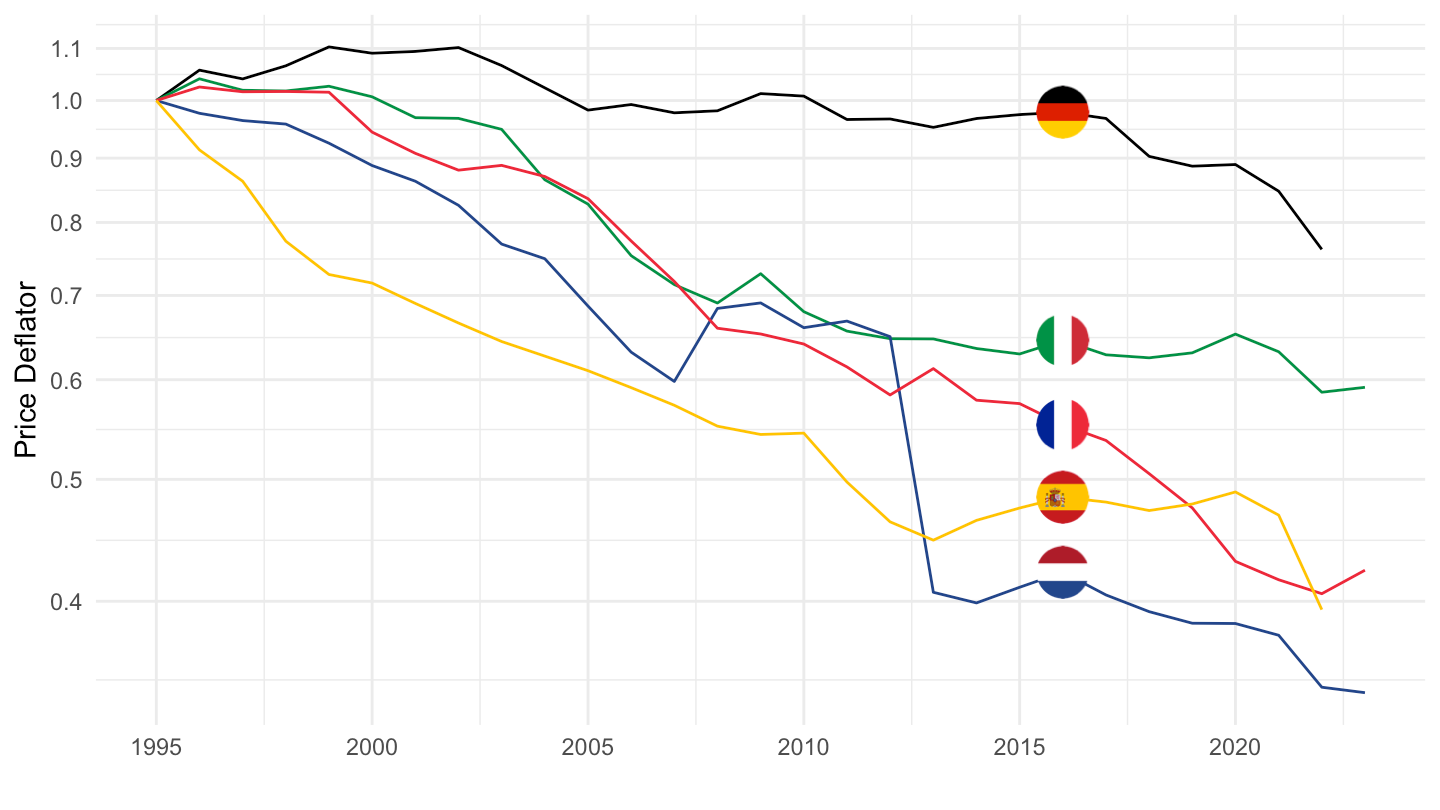
C29 - Motor vehicles
All
Code
nama_10_a64 %>%
  filter(na_item == "B1G",
         nace_r2 %in% c("C29", "TOTAL"),
         geo %in% c("FR", "DE", "IT", "ES", "EA"),
         unit == "CP_MNAC") %>%
  year_to_date() %>%
  left_join(geo, by = "geo") %>%
  mutate(Geo = ifelse(geo == "EA", "Europe", Geo)) %>%
  select(geo,  Geo, nace_r2, date, values) %>%
  spread(nace_r2, values) %>%
  mutate(values = `C29`/TOTAL) %>%
  filter(!is.na(values)) %>%
  left_join(colors, by = c("Geo" = "country")) %>%
  ggplot(.) + geom_line(aes(x = date, y = values, color = color)) +
  theme_minimal() + xlab("") + ylab("Motor vehicles (% of GDP)") +
  scale_color_identity() +
  scale_x_date(breaks = seq(1960, 2100, 5) %>% paste0("-01-01") %>% as.Date,
               labels = date_format("%Y")) + add_5flags +
  theme(legend.position = "none") +
  scale_y_continuous(breaks = 0.01*seq(-500, 200, 0.5),
                     labels = percent_format(accuracy = .1))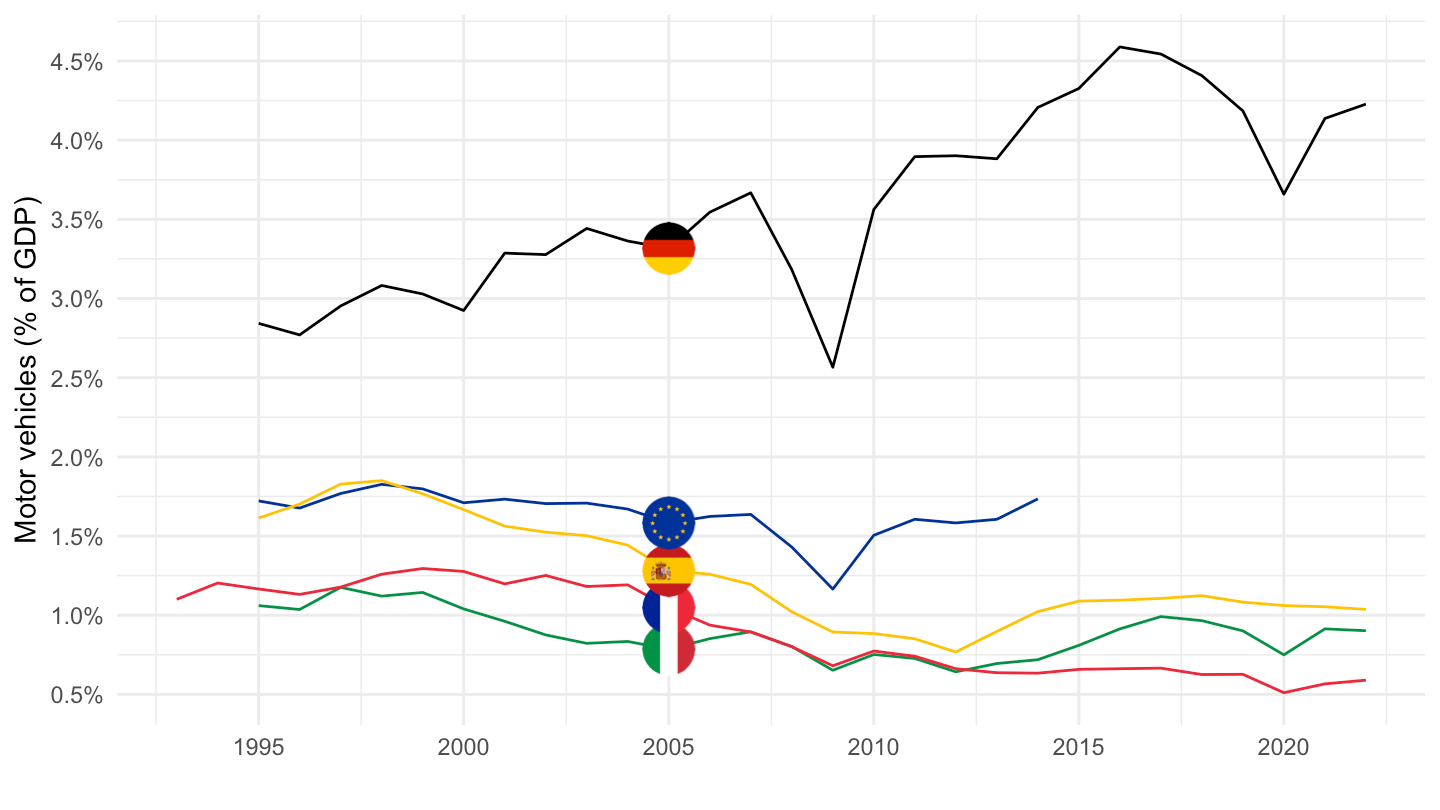
1995-
Code
nama_10_a64 %>%
  filter(na_item == "B1G",
         nace_r2 %in% c("C29", "TOTAL"),
         geo %in% c("FR", "DE", "IT", "ES", "EA"),
         unit == "CP_MNAC") %>%
  year_to_date() %>%
  filter(date >= as.Date("1995-01-01")) %>%
  left_join(geo, by = "geo") %>%
  mutate(Geo = ifelse(geo == "EA", "Europe", Geo)) %>%
  select(geo,  Geo, nace_r2, date, values) %>%
  spread(nace_r2, values) %>%
  mutate(values = `C29`/TOTAL) %>%
  filter(!is.na(values)) %>%
  left_join(colors, by = c("Geo" = "country")) %>%
  ggplot(.) + geom_line(aes(x = date, y = values, color = color)) +
  theme_minimal() + xlab("") + ylab("Motor vehicles (% of GDP)") +
  scale_color_identity() +
  scale_x_date(breaks = seq(1960, 2100, 5) %>% paste0("-01-01") %>% as.Date,
               labels = date_format("%Y")) + add_5flags +
  theme(legend.position = "none") +
  scale_y_continuous(breaks = 0.01*seq(-500, 200, 0.5),
                     labels = percent_format(accuracy = .1))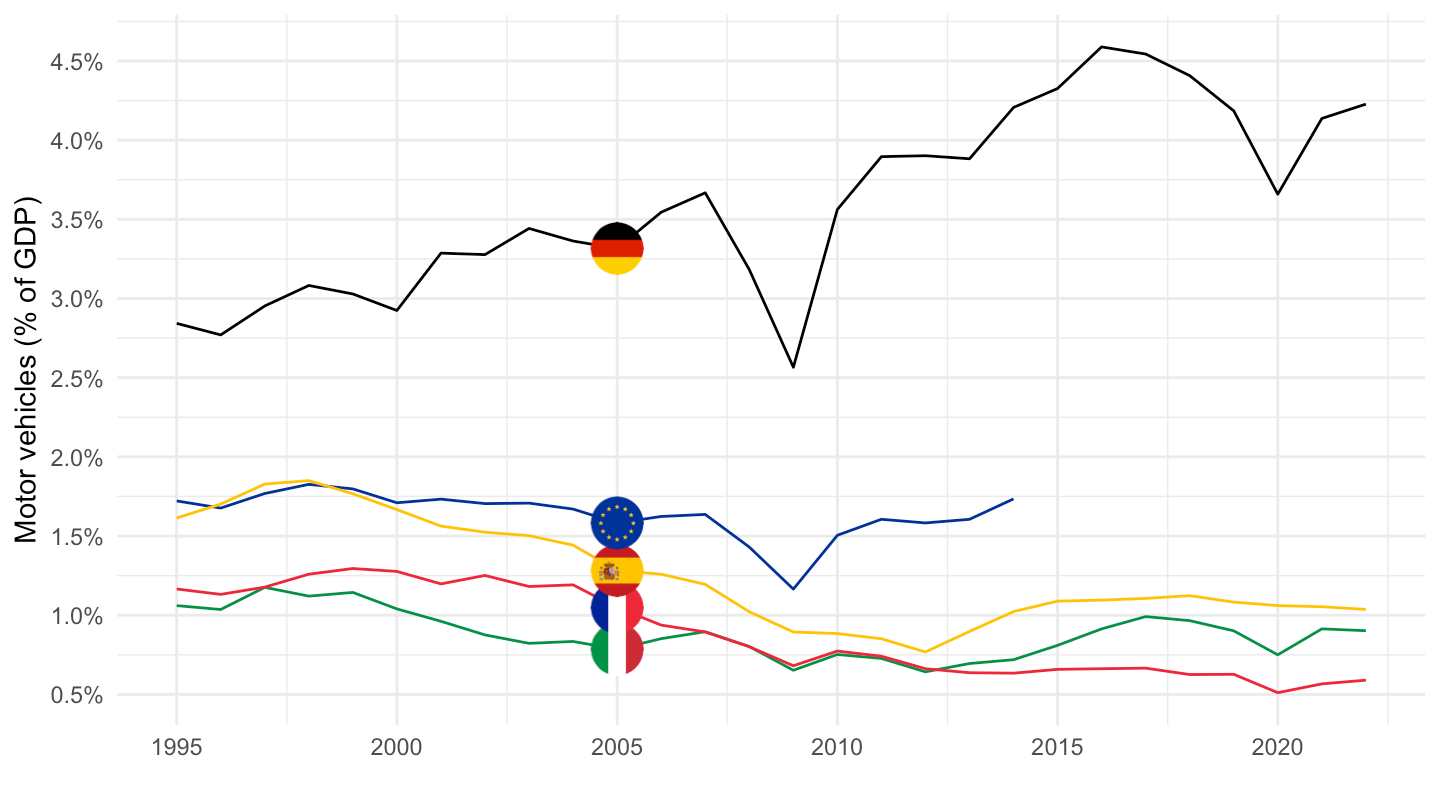
2000-
Code
nama_10_a64 %>%
  filter(na_item == "B1G",
         nace_r2 %in% c("C29", "TOTAL"),
         geo %in% c("FR", "DE", "IT", "ES"),
         unit == "CP_MNAC") %>%
  year_to_date() %>%
  filter(date >= as.Date("2000-01-01")) %>%
  left_join(geo, by = "geo") %>%
  select(geo,  Geo, nace_r2, date, values) %>%
  spread(nace_r2, values) %>%
  mutate(values = `C29`/TOTAL) %>%
  left_join(colors, by = c("Geo" = "country")) %>%
  mutate(color = ifelse(geo == "NL", color2, color)) %>%
  ggplot(.) + geom_line(aes(x = date, y = values, color = color)) +
  theme_minimal() + xlab("") + ylab("Industrie automobile (% du PIB)") +
  scale_color_identity() + add_4flags +
  scale_x_date(breaks = seq(1995, 2026, 5) %>% paste0("-01-01") %>% as.Date,
               labels = date_format("%Y")) +
  theme(legend.position = "none") +
  scale_y_continuous(breaks = 0.01*seq(-500, 200, 0.5),
                     labels = percent_format(accuracy = .1))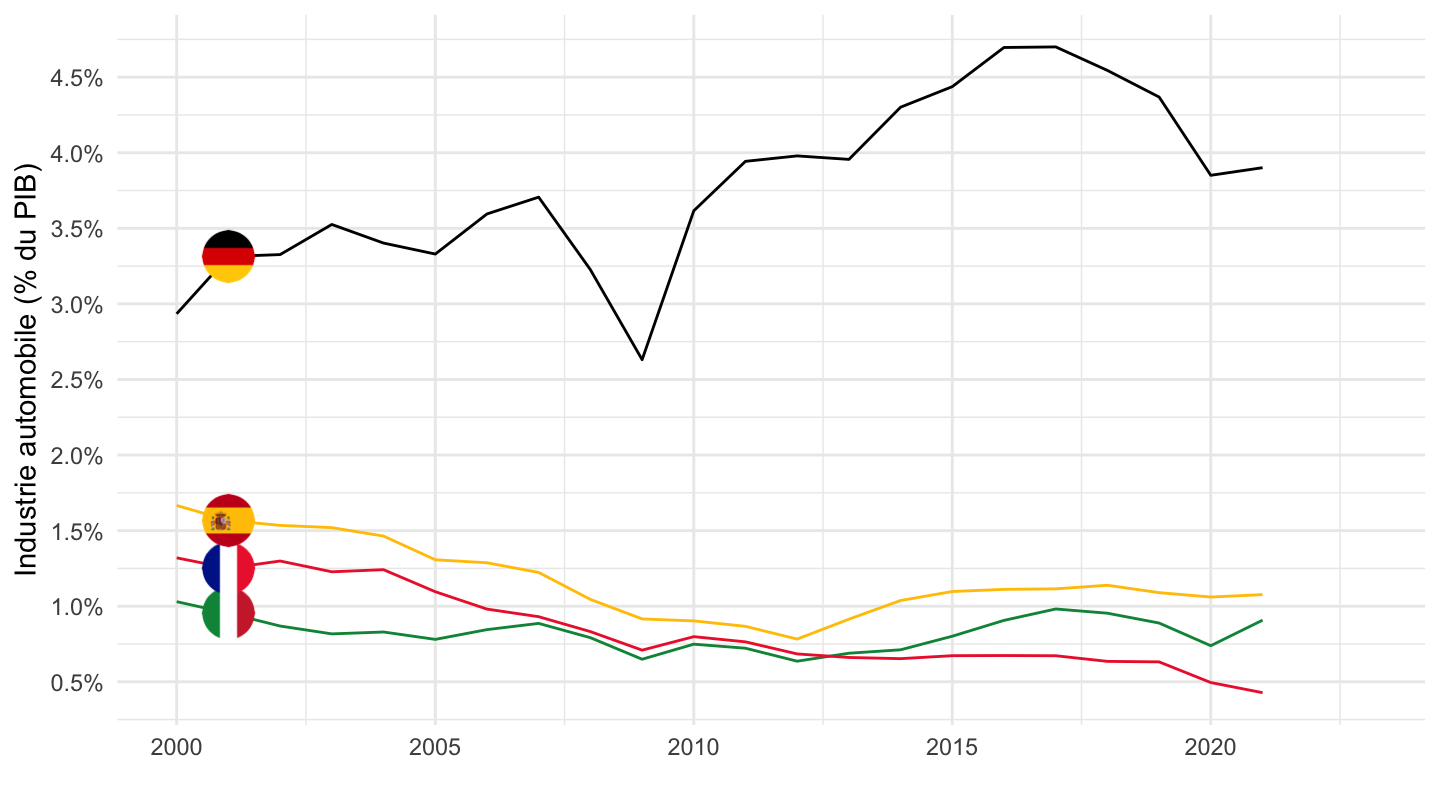
France, Europe
B1G
Code
# load_data("eurostat/nace_r2_fr.RData")
nama_10_a64 %>%
  filter(na_item == "B1G",
         nace_r2 %in% c("C29", "TOTAL"),
         geo %in% c("FR", "EA20"),
         unit == "CP_MNAC") %>%
  year_to_date() %>%
  #filter(date >= as.Date("1995-01-01")) %>%
  left_join(geo, by = "geo") %>%
  mutate(Geo = ifelse(geo == "EA20", "Europe", Geo)) %>%
  select(geo,  Geo, nace_r2, date, values) %>%
  spread(nace_r2, values) %>%
  mutate(values = `C29`/TOTAL) %>%
  filter(!is.na(values)) %>%
  left_join(colors, by = c("Geo" = "country")) %>%
  ggplot(.) + geom_line(aes(x = date, y = values, color = color)) +
  theme_minimal() + xlab("") + ylab("Industrie automobile (% du PIB)") +
  scale_color_identity() +
  scale_x_date(breaks = seq(1960, 2100, 5) %>% paste0("-01-01") %>% as.Date,
               labels = date_format("%Y")) + add_2flags +
  theme(legend.position = "none") +
  scale_y_continuous(breaks = 0.01*seq(-500, 200, 0.1),
                     labels = percent_format(accuracy = .1))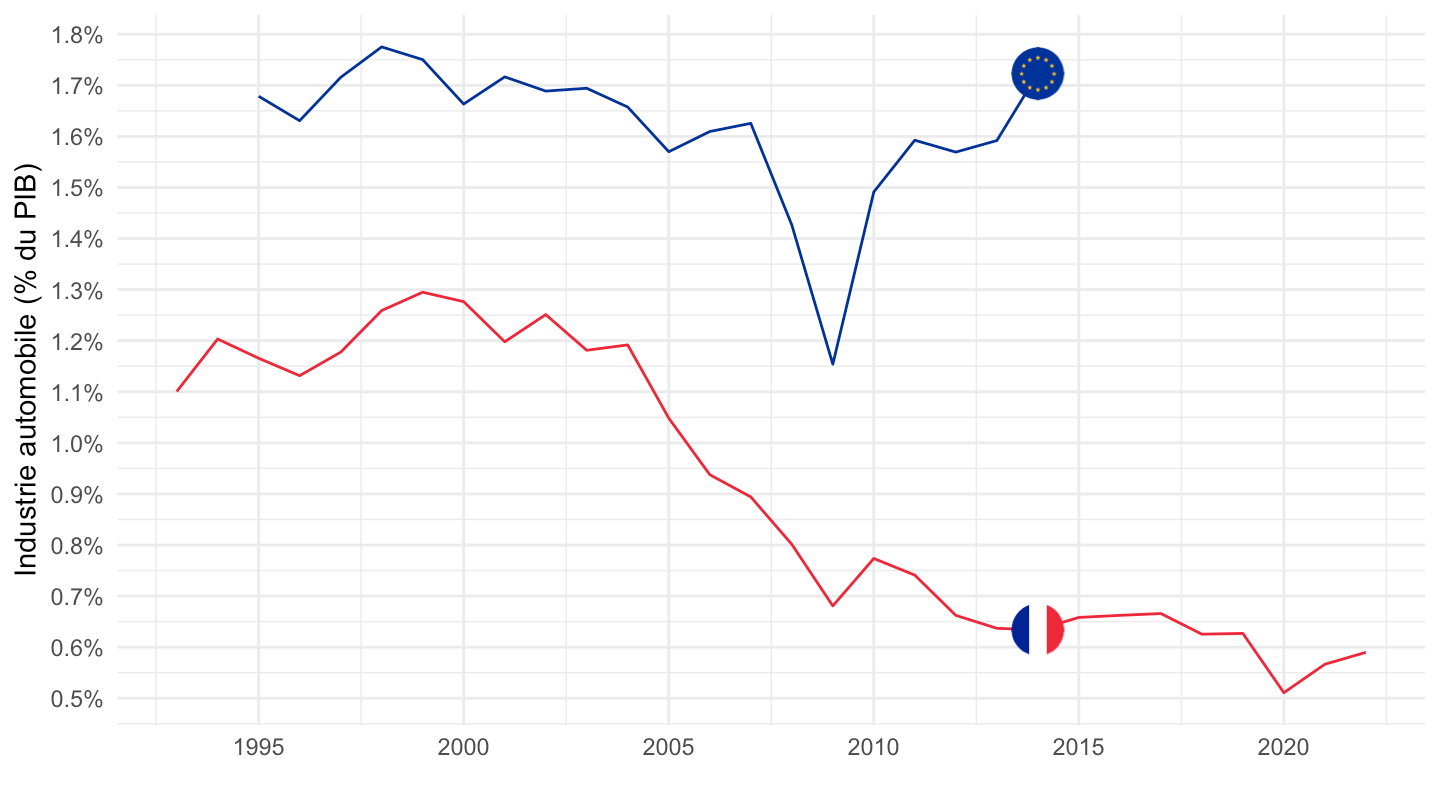
P1
Code
# load_data("eurostat/nace_r2_fr.RData")
nama_10_a64 %>%
  filter(na_item == "P1",
         nace_r2 %in% c("C29", "TOTAL"),
         geo %in% c("FR", "EA20"),
         unit == "CP_MNAC") %>%
  year_to_date() %>%
  #filter(date >= as.Date("1995-01-01")) %>%
  left_join(geo, by = "geo") %>%
  mutate(Geo = ifelse(geo == "EA20", "Europe", Geo)) %>%
  select(geo,  Geo, nace_r2, date, values) %>%
  spread(nace_r2, values) %>%
  mutate(values = `C29`/TOTAL) %>%
  filter(!is.na(values)) %>%
  left_join(colors, by = c("Geo" = "country")) %>%
  ggplot(.) + geom_line(aes(x = date, y = values, color = color)) +
  theme_minimal() + xlab("") + ylab("Production, industrie automobile (% de la production)") +
  scale_color_identity() +
  scale_x_date(breaks = seq(1960, 2100, 5) %>% paste0("-01-01") %>% as.Date,
               labels = date_format("%Y")) + add_2flags +
  theme(legend.position = "none") +
  scale_y_continuous(breaks = 0.01*seq(-500, 200, 0.1),
                     labels = percent_format(accuracy = .1))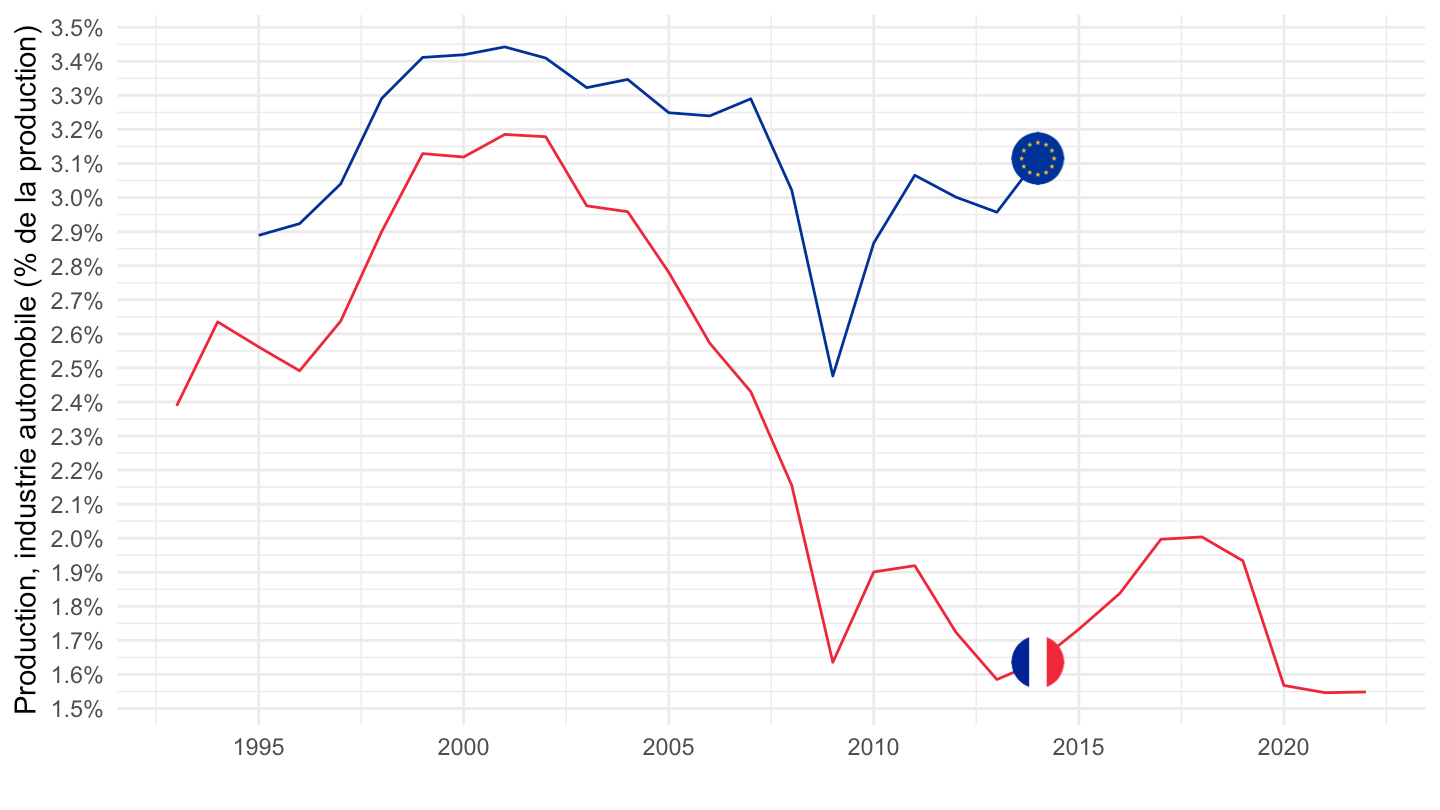
C29_C30 - Motor vehicles and other transport equipment
All
Code
nama_10_a64 %>%
  filter(na_item == "B1G",
         nace_r2 %in% c("C29_C30", "TOTAL"),
         geo %in% c("FR", "DE", "IT", "ES"),
         unit == "CP_MNAC") %>%
  year_to_date() %>%
  left_join(geo, by = "geo") %>%
  select(geo,  Geo, nace_r2, date, values) %>%
  spread(nace_r2, values) %>%
  mutate(values = `C29_C30`/TOTAL) %>%
  ggplot(.) + geom_line(aes(x = date, y = values, color = Geo)) +
  theme_minimal() + xlab("") + ylab("Motor vehicles and other transport equipment (% of GDP)") +
  scale_color_manual(values = c("#002395", "#000000", "#009246", "#C60B1E")) +
  scale_x_date(breaks = seq(1960, 2100, 5) %>% paste0("-01-01") %>% as.Date,
               labels = date_format("%Y")) + add_4flags +
  theme(legend.position = "none") +
  scale_y_continuous(breaks = 0.01*seq(-500, 200, 0.5),
                     labels = percent_format(accuracy = .1))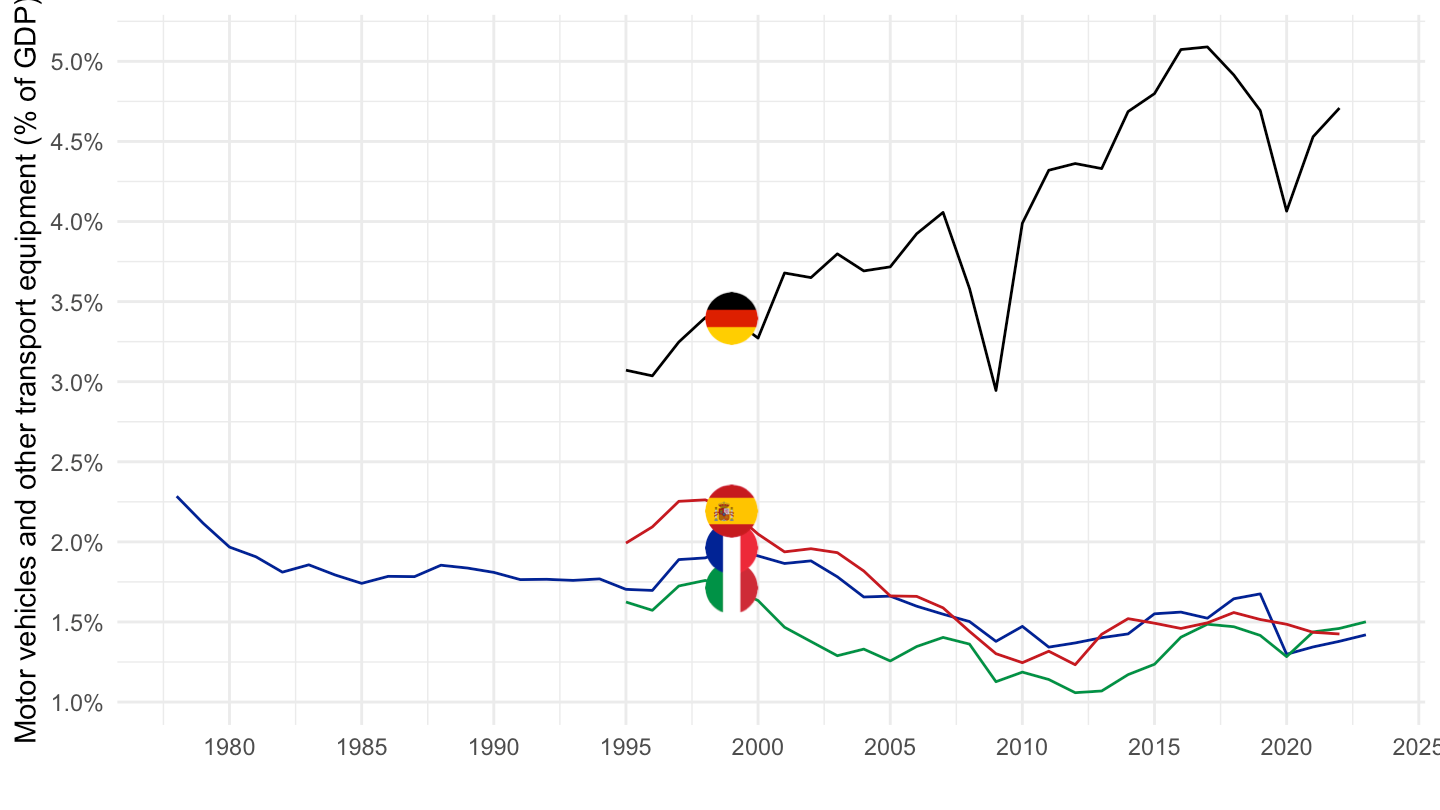
1995-
Code
nama_10_a64 %>%
  filter(na_item == "B1G",
         nace_r2 %in% c("C29_C30", "TOTAL"),
         geo %in% c("FR", "DE", "IT", "ES"),
         unit == "CP_MNAC") %>%
  year_to_date() %>%
  filter(date >= as.Date("1995-01-01")) %>%
  left_join(geo, by = "geo") %>%
  select(geo,  Geo, nace_r2, date, values) %>%
  spread(nace_r2, values) %>%
  mutate(values = `C29_C30`/TOTAL) %>%
  ggplot(.) + geom_line(aes(x = date, y = values, color = Geo)) +
  theme_minimal() + xlab("") + ylab("Motor vehicles and other transport equipment (% of GDP)") +
  scale_color_manual(values = c("#002395", "#000000", "#009246", "#C60B1E")) +
  scale_x_date(breaks = seq(1960, 2026, 2) %>% paste0("-01-01") %>% as.Date,
               labels = date_format("%Y")) +
  add_4flags +
  theme(legend.position = "none") +
  scale_y_continuous(breaks = 0.01*seq(-500, 200, 0.5),
                     labels = percent_format(accuracy = .1))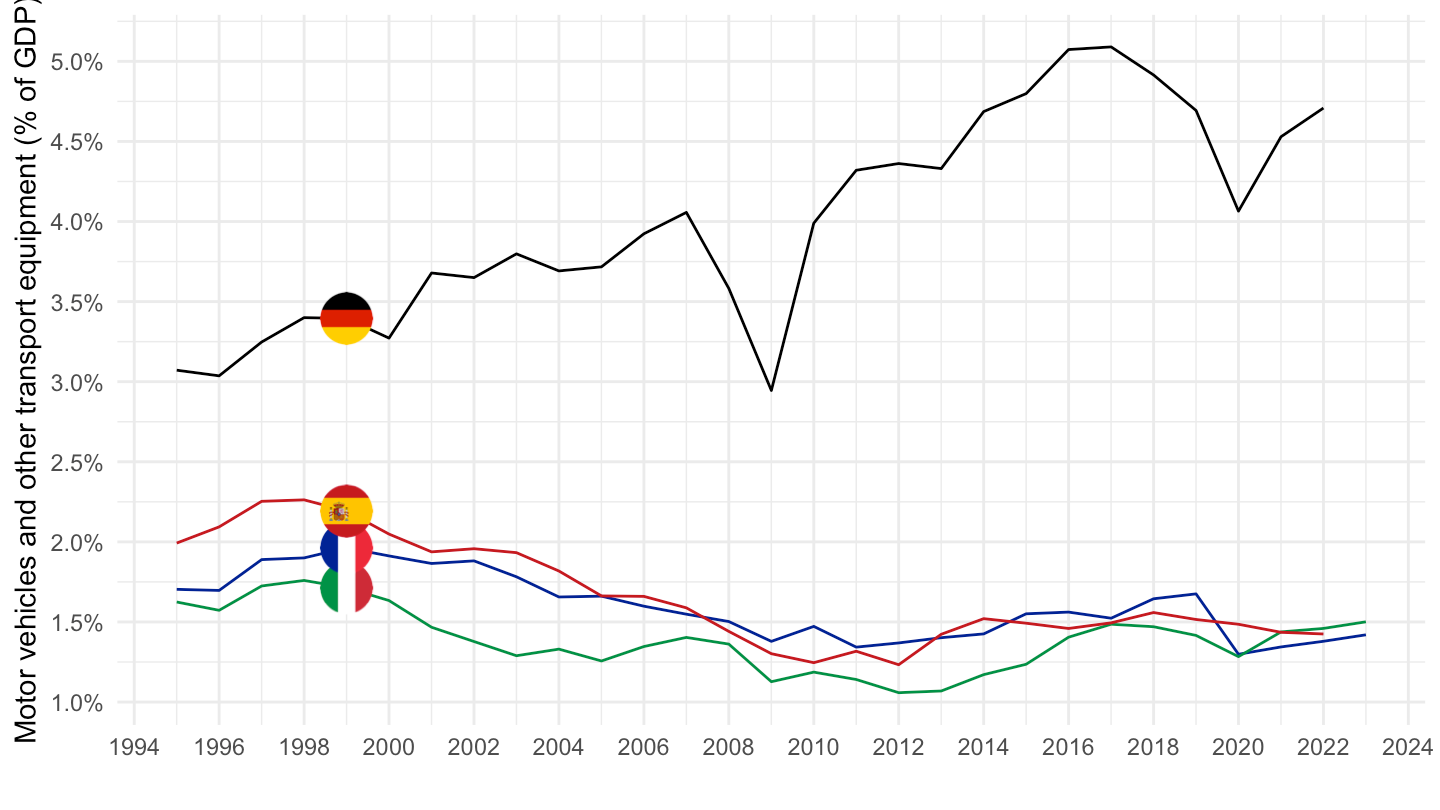
C28 - Machinery and equipment
All
Code
nama_10_a64 %>%
  filter(na_item == "B1G",
         nace_r2 %in% c("C28", "TOTAL"),
         geo %in% c("FR", "DE", "IT", "ES"),
         unit == "CP_MNAC") %>%
  year_to_date() %>%
  left_join(geo, by = "geo") %>%
  select(geo,  Geo, nace_r2, date, values) %>%
  spread(nace_r2, values) %>%
  mutate(values = `C28`/TOTAL) %>%
  left_join(colors, by = c("Geo" = "country")) %>%
  ggplot(.) + geom_line(aes(x = date, y = values, color = color)) +
  theme_minimal() + xlab("") + ylab("Machinery and equipment (% of GDP)") +
  scale_color_identity() + add_4flags +
  scale_x_date(breaks = seq(1960, 2100, 5) %>% paste0("-01-01") %>% as.Date,
               labels = date_format("%Y")) +
  theme(legend.position = "none") +
  scale_y_continuous(breaks = 0.01*seq(-500, 200, 0.1),
                     labels = percent_format(accuracy = .1))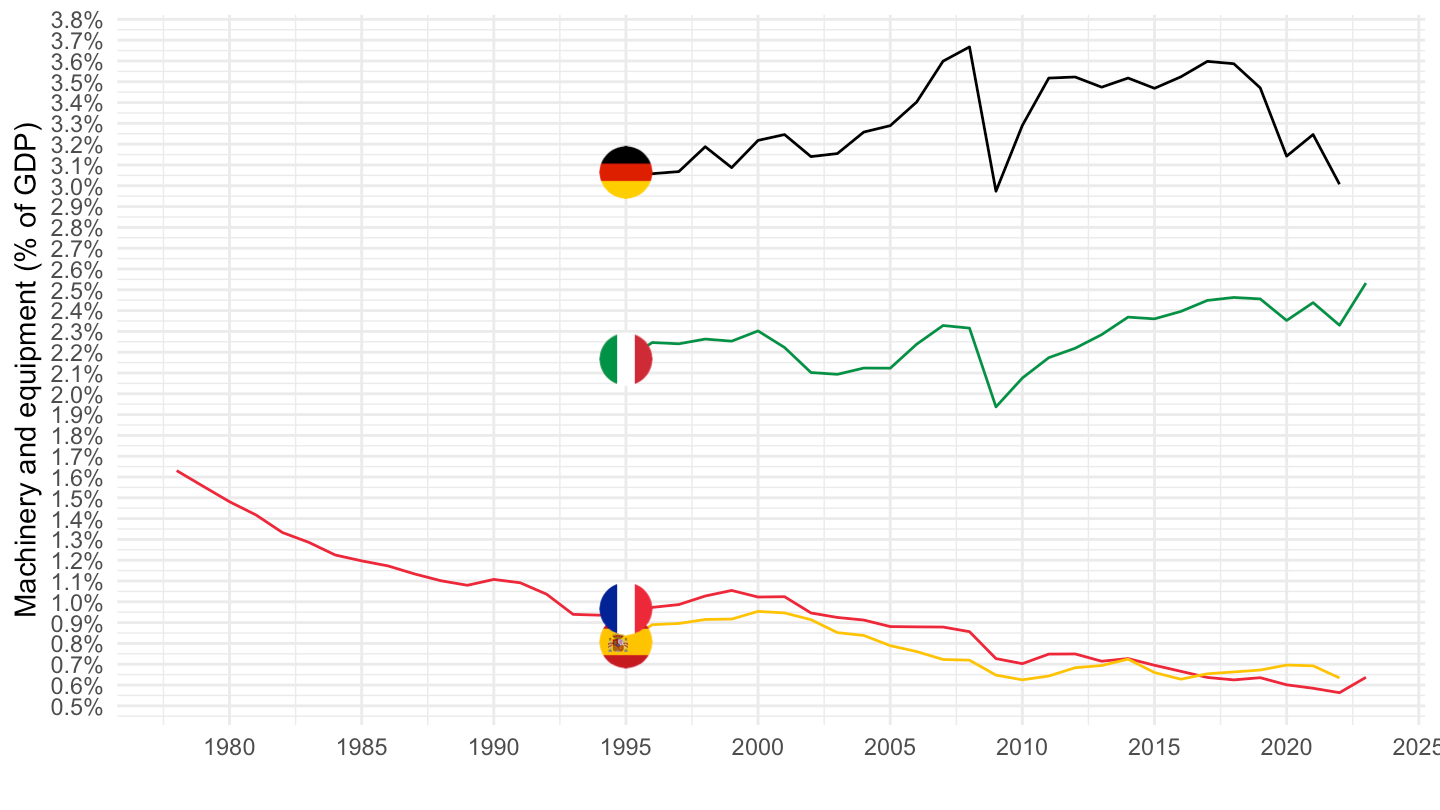
1995-
Code
nama_10_a64 %>%
  filter(na_item == "B1G",
         nace_r2 %in% c("C28", "TOTAL"),
         geo %in% c("FR", "DE", "IT", "ES"),
         unit == "CP_MNAC") %>%
  year_to_date() %>%
  filter(date >= as.Date("1995-01-01")) %>%
  left_join(geo, by = "geo") %>%
  select(geo,  Geo, nace_r2, date, values) %>%
  spread(nace_r2, values) %>%
  mutate(values = `C28`/TOTAL) %>%
  left_join(colors, by = c("Geo" = "country")) %>%
  ggplot(.) + geom_line(aes(x = date, y = values, color = color)) +
  theme_minimal() + xlab("") + ylab("Machinery and equipment (% of GDP)") +
  scale_color_identity() + add_4flags +
  scale_x_date(breaks = seq(1960, 2026, 2) %>% paste0("-01-01") %>% as.Date,
               labels = date_format("%Y")) +
  theme(legend.position = "none") +
  scale_y_continuous(breaks = 0.01*seq(-500, 200, 0.1),
                     labels = percent_format(accuracy = .1))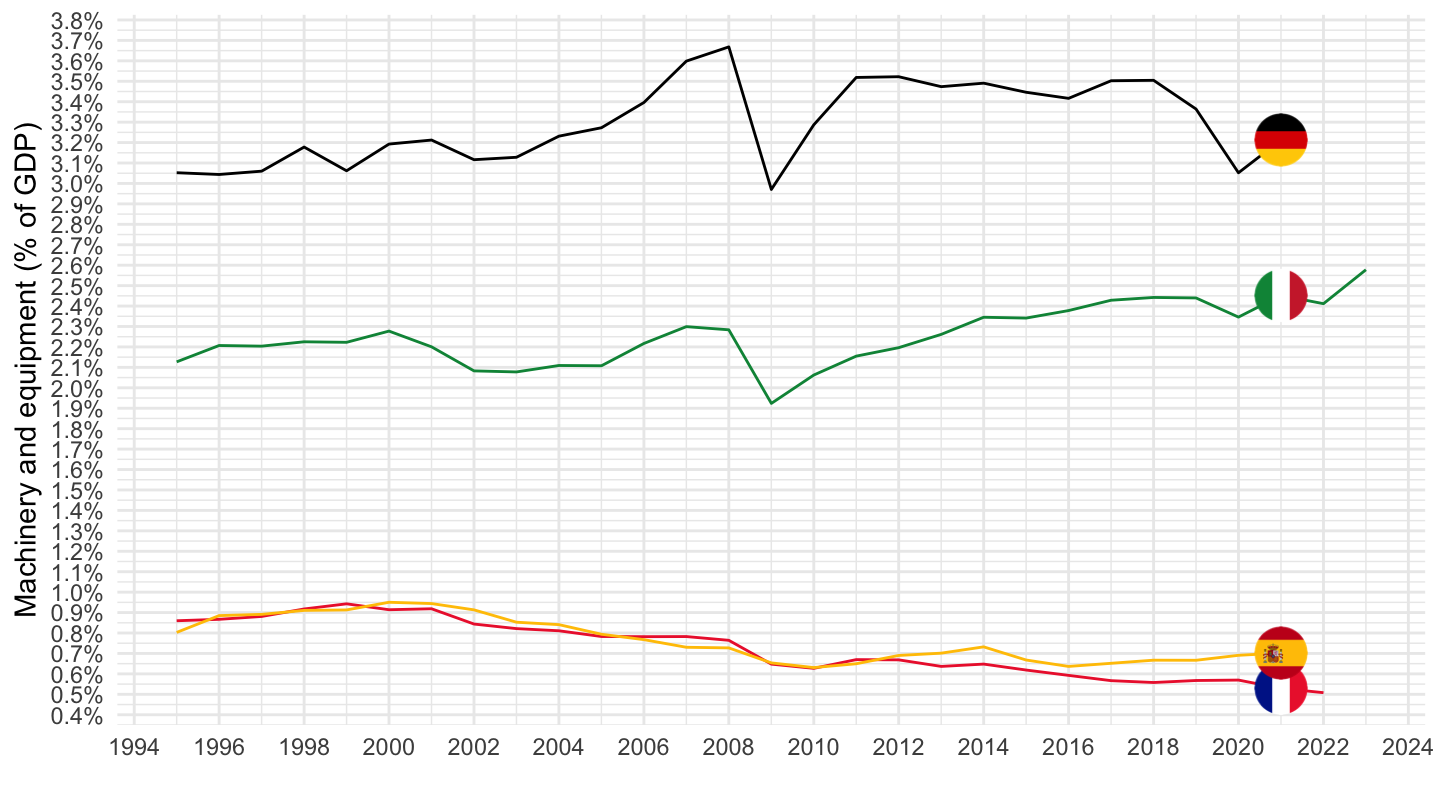
L - Real Estate
Value
All
Code
nama_10_a64 %>%
  filter(na_item == "B1G",
         nace_r2 %in% c("L", "TOTAL"),
         geo %in% c("FR", "DE", "IT", "ES", "NL"),
         unit == "CP_MNAC") %>%
  year_to_date() %>%
  left_join(geo, by = "geo") %>%
  select(geo,  Geo, nace_r2, date, values) %>%
  spread(nace_r2, values) %>%
  mutate(values = `L`/TOTAL) %>%
  left_join(colors, by = c("Geo" = "country")) %>%
  ggplot(.) + geom_line(aes(x = date, y = values, color = color)) +
  theme_minimal() + xlab("") + ylab("Real Estate (% of GDP)") +
  scale_color_identity() + add_5flags +
  scale_x_date(breaks = seq(1960, 2100, 5) %>% paste0("-01-01") %>% as.Date,
               labels = date_format("%Y")) +
  scale_y_continuous(breaks = 0.01*seq(-500, 200, 1),
                     labels = percent_format(accuracy = 1))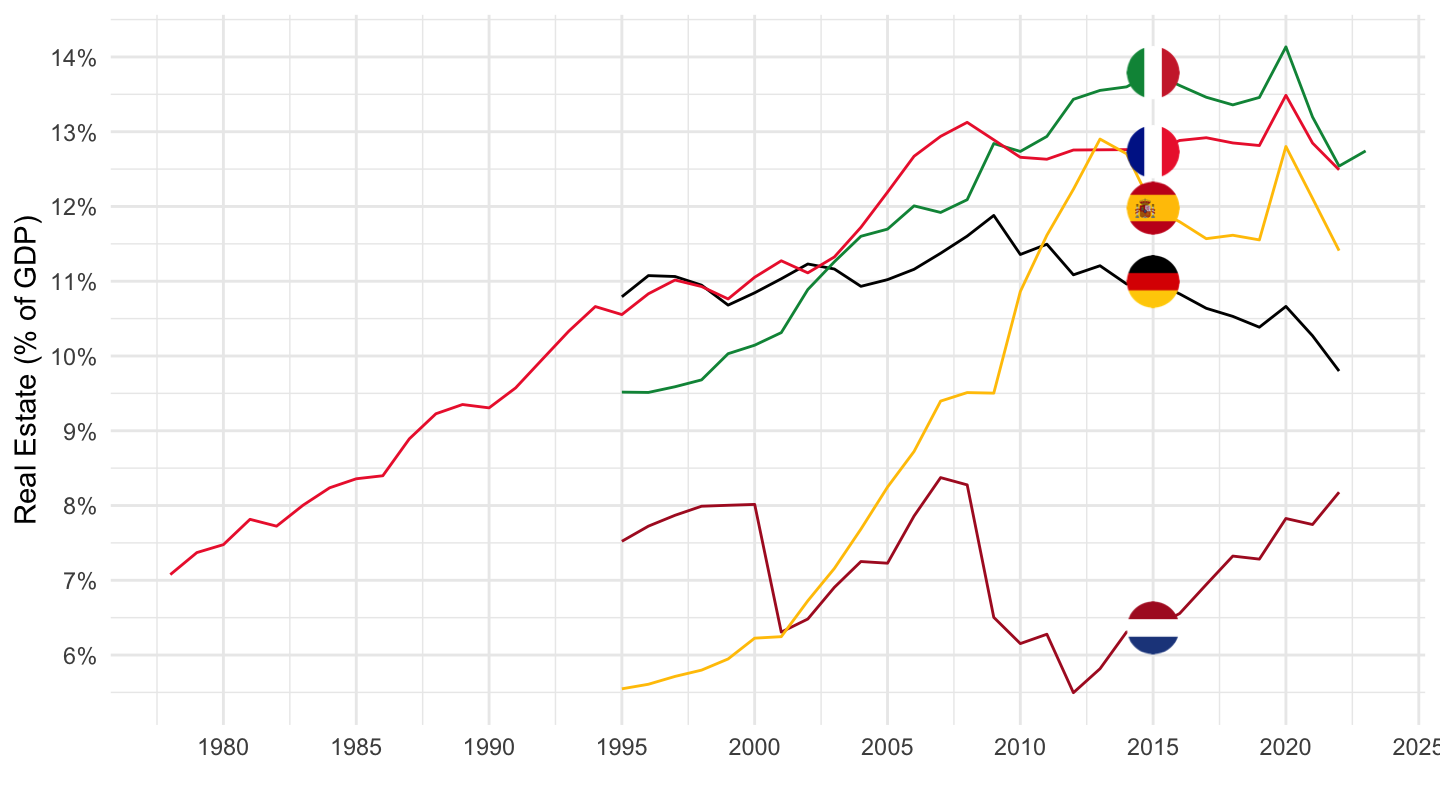
1995-
Code
nama_10_a64 %>%
  filter(na_item == "B1G",
         nace_r2 %in% c("L", "TOTAL"),
         geo %in% c("FR", "DE", "IT", "ES", "NL"),
         unit == "CP_MNAC") %>%
  year_to_date() %>%
  filter(date >= as.Date("1995-01-01")) %>%
  left_join(geo, by = "geo") %>%
  select(geo,  Geo, nace_r2, date, values) %>%
  spread(nace_r2, values) %>%
  mutate(values = `L`/TOTAL) %>%
  left_join(colors, by = c("Geo" = "country")) %>%
  ggplot(.) + geom_line(aes(x = date, y = values, color = color)) +
  theme_minimal() + xlab("") + ylab("Real Estate (% of GDP)") +
  scale_color_identity() + add_5flags +
  scale_x_date(breaks = seq(1960, 2100, 5) %>% paste0("-01-01") %>% as.Date,
               labels = date_format("%Y")) +
  scale_y_continuous(breaks = 0.01*seq(-500, 200, 1),
                     labels = percent_format(accuracy = 1))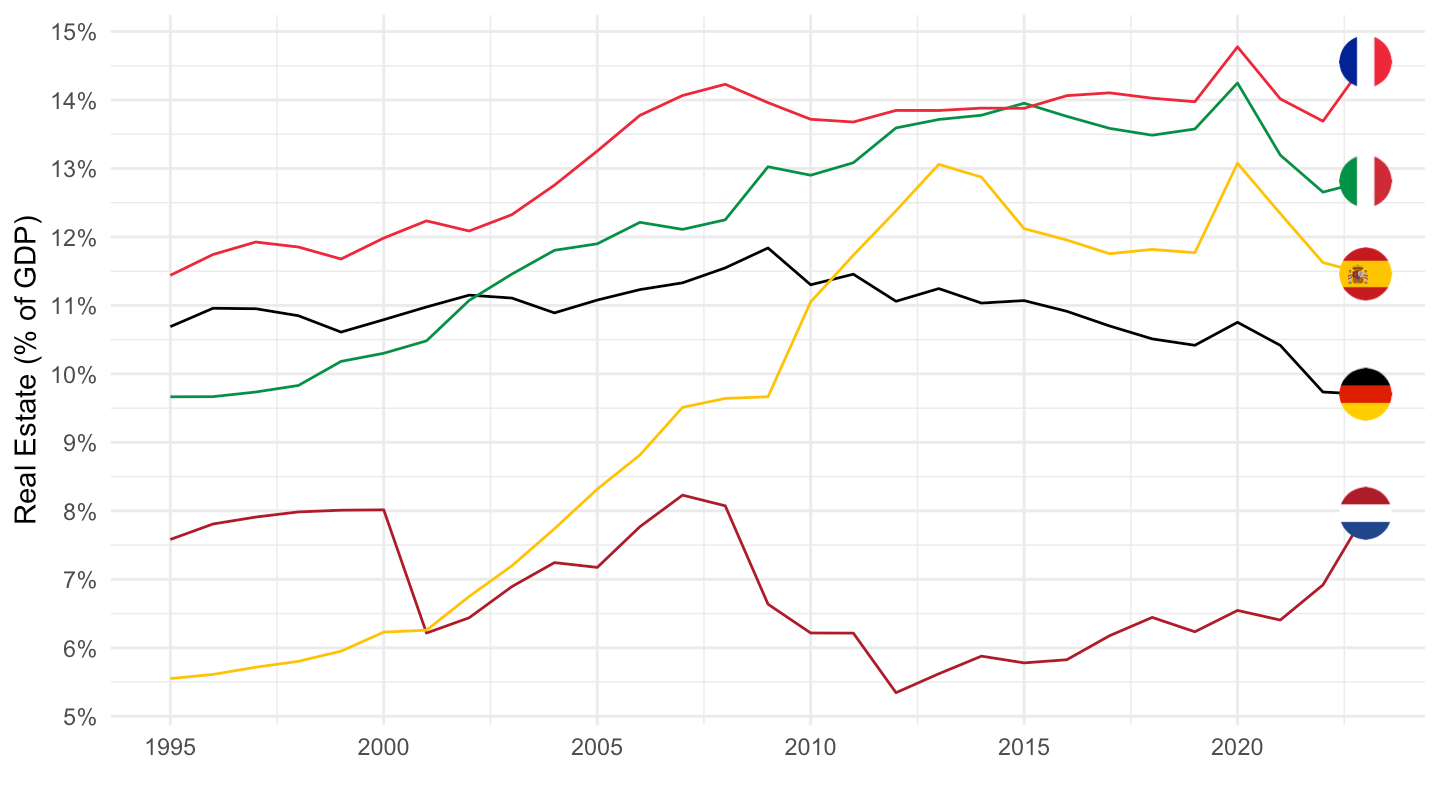
Volume
All
Code
nama_10_a64 %>%
  filter(na_item == "B1G",
         nace_r2 %in% c("L", "TOTAL"),
         geo %in% c("FR", "DE", "IT", "ES"),
         unit == "CLV10_MEUR") %>%
  year_to_date() %>%
  left_join(geo, by = "geo") %>%
  select(geo,  Geo, nace_r2, date, values) %>%
  spread(nace_r2, values) %>%
  mutate(values = `L`/TOTAL) %>%
  left_join(colors, by = c("Geo" = "country")) %>%
  ggplot(.) + geom_line(aes(x = date, y = values, color = color)) +
  theme_minimal() + xlab("") + ylab("Real Estate (% of GDP)") +
  scale_color_identity() + add_4flags +
  scale_x_date(breaks = seq(1960, 2100, 5) %>% paste0("-01-01") %>% as.Date,
               labels = date_format("%Y")) +
  scale_y_continuous(breaks = 0.01*seq(-500, 200, 1),
                     labels = percent_format(accuracy = 1))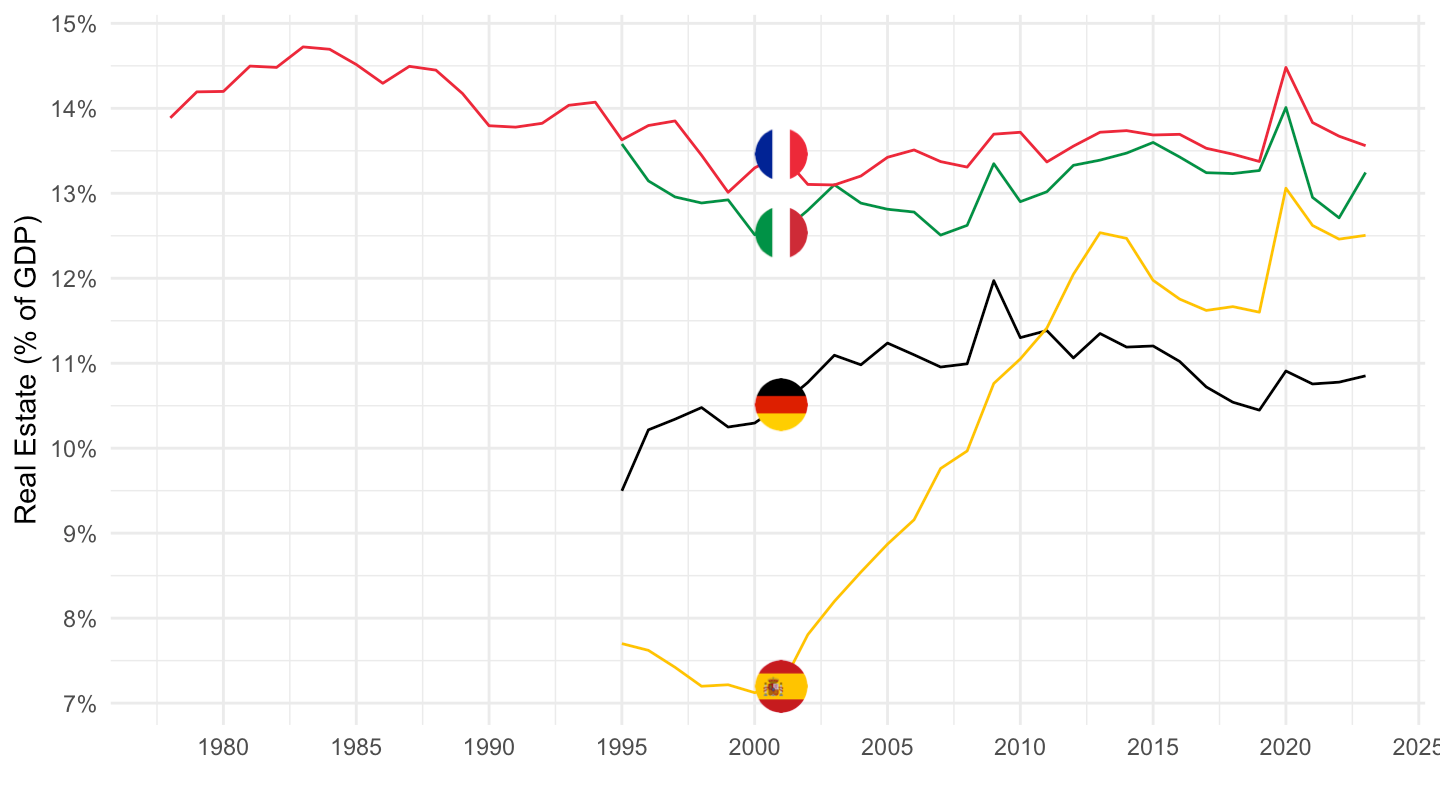
1995-
Code
nama_10_a64 %>%
  filter(na_item == "B1G",
         nace_r2 %in% c("L", "TOTAL"),
         geo %in% c("FR", "DE", "IT", "ES", "NL"),
         unit == "CLV10_MEUR") %>%
  year_to_date() %>%
  filter(date >= as.Date("1995-01-01")) %>%
  left_join(geo, by = "geo") %>%
  select(geo,  Geo, nace_r2, date, values) %>%
  spread(nace_r2, values) %>%
  mutate(values = `L`/TOTAL) %>%
  left_join(colors, by = c("Geo" = "country")) %>%
  ggplot(.) + geom_line(aes(x = date, y = values, color = color)) +
  theme_minimal() + xlab("") + ylab("Real Estate (% of GDP)") +
  scale_color_identity() + add_5flags +
  scale_x_date(breaks = seq(1960, 2100, 5) %>% paste0("-01-01") %>% as.Date,
               labels = date_format("%Y")) +
  scale_y_continuous(breaks = 0.01*seq(-500, 200, 1),
                     labels = percent_format(accuracy = 1))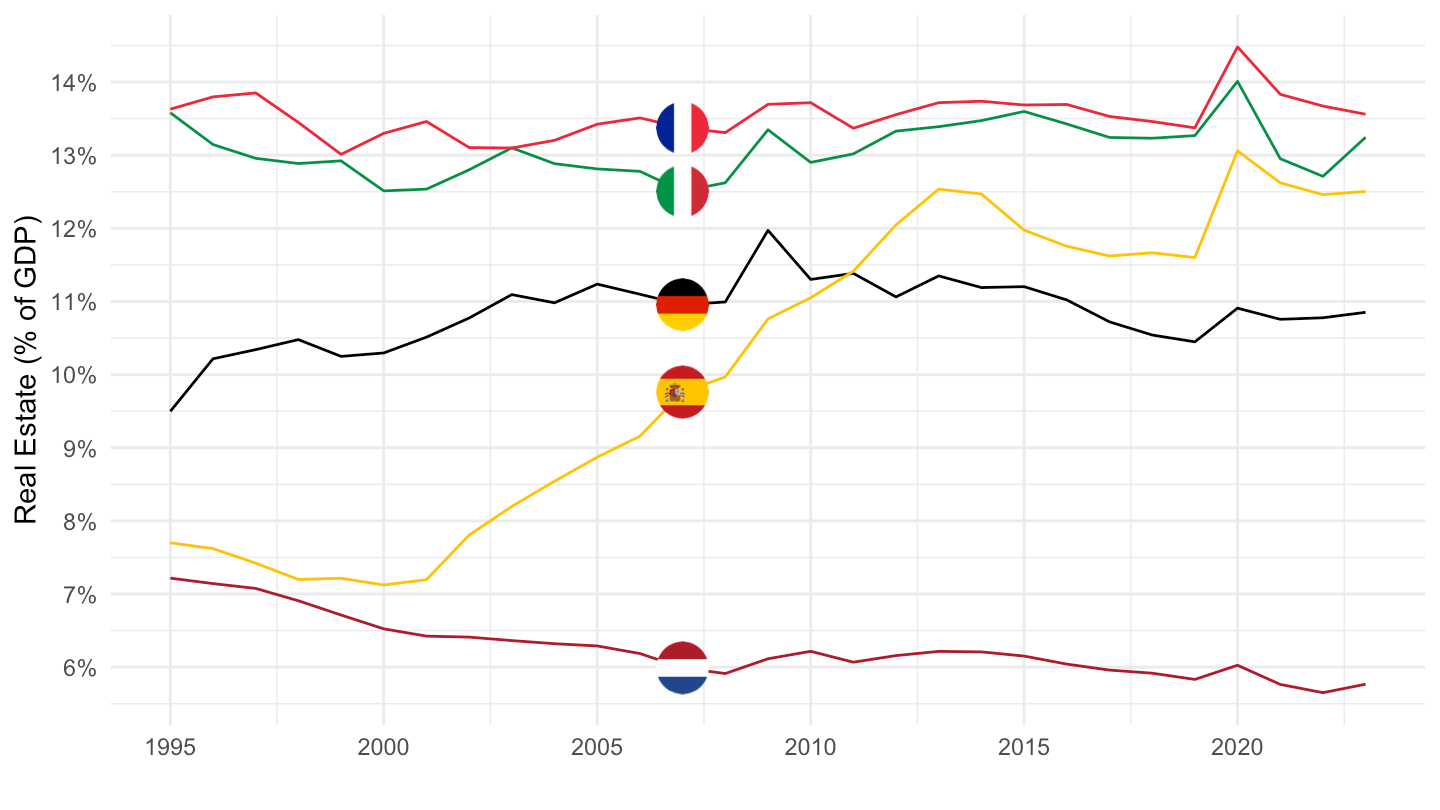
Price Deflator
Code
nama_10_a64 %>%
  filter(na_item == "B1G",
         nace_r2 %in% c("L", "TOTAL"),
         geo %in% c("FR", "DE", "IT", "ES", "NL"),
         unit == "PD10_NAC") %>%
  year_to_date() %>%
  left_join(geo, by = "geo") %>%
  select(geo,  Geo, nace_r2, date, values) %>%
  spread(nace_r2, values) %>%
  mutate(values = L/TOTAL)  %>%
  left_join(colors, by = c("Geo" = "country")) %>%
  ggplot(.) + geom_line(aes(x = date, y = values, color = color)) +
  theme_minimal() + xlab("") + ylab("Price Deflator") +
  scale_color_identity() + add_5flags +
  scale_x_date(breaks = seq(1960, 2100, 5) %>% paste0("-01-01") %>% as.Date,
               labels = date_format("%Y")) +
  scale_y_log10(breaks = 0.01*seq(-500, 200, 10))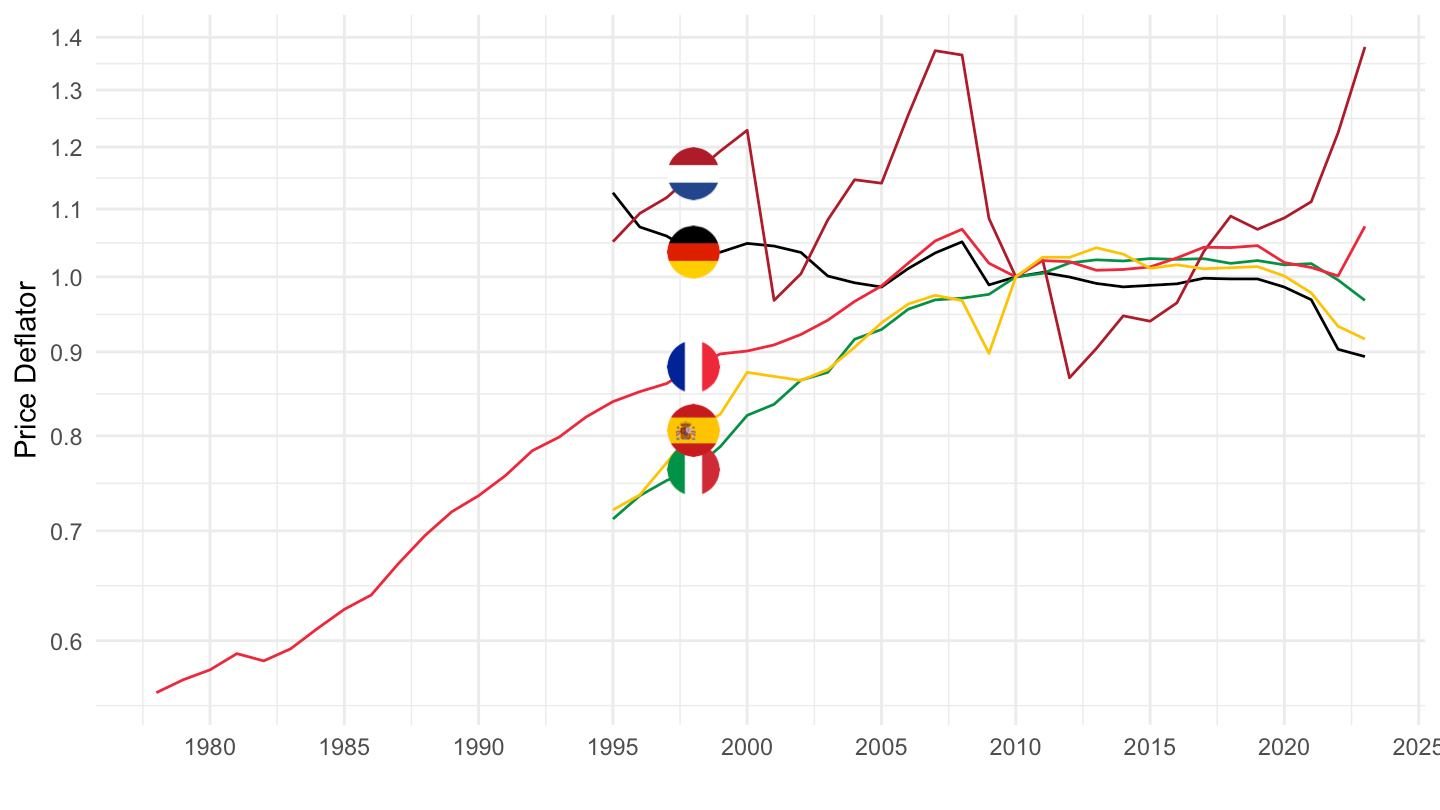
Individual Countries
France
Table
All
Code
nama_10_a64 %>%
  filter(na_item == "B1G",
         geo %in% c("FR"),
         unit == "CP_MNAC",
         time %in% c("1978", "1998",  "2008", "2018")) %>%
  left_join(nace_r2, by = "nace_r2") %>%
  select(nace_r2, Nace_r2, time, values) %>%
  group_by(time) %>%
  mutate(values = round(100*values/ values[nace_r2 == "TOTAL"], 1)) %>%
  filter(nace_r2 != "TOTAL")  %>%
  spread(time, values) %>%
  print_table_conditional
Manufacturing
Code
nama_10_a64 %>%
  filter(na_item == "B1G",
         geo %in% c("FR"),
         unit == "CP_MNAC",
         time %in% c("1978", "1998",  "2008", "2018")) %>%
  filter(grepl("C", nace_r2) | nace_r2 == "TOTAL") %>%
  left_join(nace_r2, by = "nace_r2") %>%
  select(nace_r2, Nace_r2, time, values) %>%
  group_by(time) %>%
  mutate(values = round(100*values/ values[nace_r2 == "TOTAL"], 1)) %>%
  filter(nace_r2 != "TOTAL")  %>%
  spread(time, values) %>%
  arrange(-`2018`) %>%
print_table_conditional| nace_r2 | Nace_r2 | 1978 | 1998 | 2008 | 2018 |
|---|---|---|---|---|---|
| C | Industrie manufacturière | 21.6 | 16.3 | 12.3 | 11.2 |
| C10-C12 | Industries alimentaires; fabrication de boissons et de produits à base de tabac | 3.0 | 2.5 | 1.9 | 1.9 |
| C29_C30 | Industrie automobile et construction navale | 2.3 | 1.9 | 1.5 | 1.6 |
| C31-C33 | Fabrication de meubles, bijouterie, instruments de musique, jouets, réparation et installation de machines et équipements | 2.8 | 1.9 | 1.6 | 1.6 |
| C24_C25 | Métallurgie et fabrication de produits métalliques, à l'exception des machines et des équipements | 2.2 | 2.1 | 1.7 | 1.4 |
| C33 | Réparation et installation de machines et d'équipements | NA | 1.4 | 1.1 | 1.3 |
| C25 | Fabrication de produits métalliques, à l'exception des machines et des équipements | NA | 1.5 | 1.2 | 1.1 |
| C30 | Fabrication d'autres matériels de transport | NA | 0.6 | 0.7 | 1.0 |
| C22_C23 | Fabrication de produits en caoutchouc et en plastique et autres produits minéraux non métalliques | 2.1 | 1.5 | 1.1 | 0.9 |
| C20 | Industrie chimique | 1.5 | 1.0 | 0.7 | 0.8 |
| C16-C18 | Travail du bois et du papier, imprimerie et reproduction | 1.3 | 1.1 | 0.7 | 0.6 |
| C21 | Industrie pharmaceutique | 0.6 | 0.7 | 0.7 | 0.6 |
| C28 | Fabrication de machines et équipements n.c.a. | 1.6 | 1.0 | 0.9 | 0.6 |
| C29 | Industrie automobile | NA | 1.3 | 0.8 | 0.6 |
| C22 | Fabrication de produits en caoutchouc et en plastique | NA | 0.9 | 0.6 | 0.5 |
| C26 | Fabrication de produits informatiques, électroniques et optiques | 1.3 | 0.9 | 0.6 | 0.5 |
| C23 | Fabrication d'autres produits minéraux non métalliques | NA | 0.6 | 0.5 | 0.4 |
| C27 | Fabrication d'équipements électriques | 1.0 | 0.7 | 0.5 | 0.4 |
| C31_C32 | Fabrication de meubles; autres industries manufacturières | NA | 0.6 | 0.4 | 0.4 |
| C13-C15 | Fabrication de textiles, industrie de l'habillement, du cuir et de la chaussure | 1.8 | 0.8 | 0.4 | 0.3 |
| C17 | Industrie du papier et du carton | NA | 0.5 | 0.3 | 0.3 |
| C24 | Métallurgie | NA | 0.6 | 0.5 | 0.3 |
| C16 | Travail du bois et fabrication d'articles en bois et en liège, à l'exception des meubles; fabrication d'articles en vannerie et sparterie | NA | 0.3 | 0.2 | 0.2 |
| C18 | Imprimerie et reproduction d'enregistrements | NA | 0.4 | 0.2 | 0.2 |
| C19 | Cokéfaction et raffinage | 0.2 | 0.1 | 0.1 | 0.1 |
Construction, Human health, Manufacturing, Real estate
All
Code
nama_10_a64 %>%
  filter(na_item == "B1G",
         nace_r2 %in% c("C", "TOTAL", "L", "Q", "F"),
         geo %in% c("FR"),
         unit == "CP_MNAC") %>%
  year_to_date() %>%
  left_join(nace_r2, by = "nace_r2") %>%
  select(nace_r2, Nace_r2, date, values) %>%
  group_by(date) %>%
  mutate(values = values/ values[nace_r2 == "TOTAL"]) %>%
  filter(nace_r2 != "TOTAL")  %>%
  ggplot(.) + geom_line(aes(x = date, y = values, color = Nace_r2)) +
  theme_minimal() + xlab("") + ylab("% of GDP") +
  scale_color_manual(values = viridis(5)[1:4]) +
  scale_x_date(breaks = seq(1960, 2100, 5) %>% paste0("-01-01") %>% as.Date,
               labels = date_format("%Y")) +
  scale_y_continuous(breaks = 0.01*seq(-500, 200, 1),
                     labels = percent_format(accuracy = 1)) +
  theme(legend.position = c(0.75, 0.85),
        legend.title = element_blank())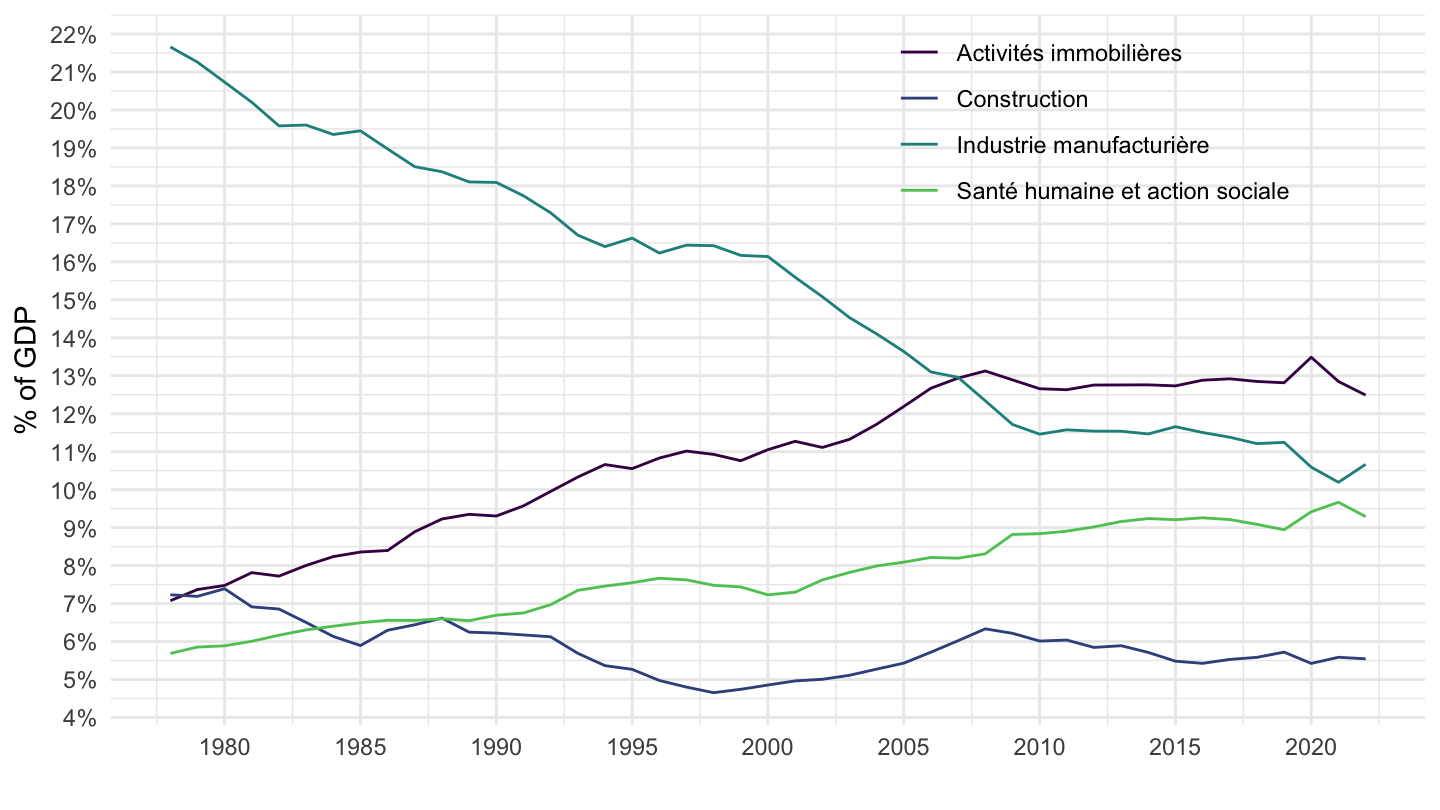
1995-
Code
nama_10_a64 %>%
  filter(na_item == "B1G",
         nace_r2 %in% c("C", "TOTAL", "L", "Q", "F"),
         geo %in% c("FR"),
         unit == "CP_MNAC") %>%
  year_to_date() %>%
  filter(date >= as.Date("1995-01-01")) %>%
  left_join(nace_r2, by = "nace_r2") %>%
  select(nace_r2, Nace_r2, date, values) %>%
  group_by(date) %>%
  mutate(values = values/ values[nace_r2 == "TOTAL"]) %>%
  filter(nace_r2 != "TOTAL")  %>%
  ggplot(.) + geom_line(aes(x = date, y = values, color = Nace_r2)) +
  theme_minimal() + xlab("") + ylab("% of GDP") +
  scale_color_manual(values = viridis(5)[1:4]) +
  scale_x_date(breaks = seq(1960, 2100, 5) %>% paste0("-01-01") %>% as.Date,
               labels = date_format("%Y")) +
  scale_y_continuous(breaks = 0.01*seq(0, 30, 2),
                     labels = percent_format(accuracy = 1),
                     limits = c(0, 0.3)) +
  theme(legend.position = c(0.75, 0.85),
        legend.title = element_blank())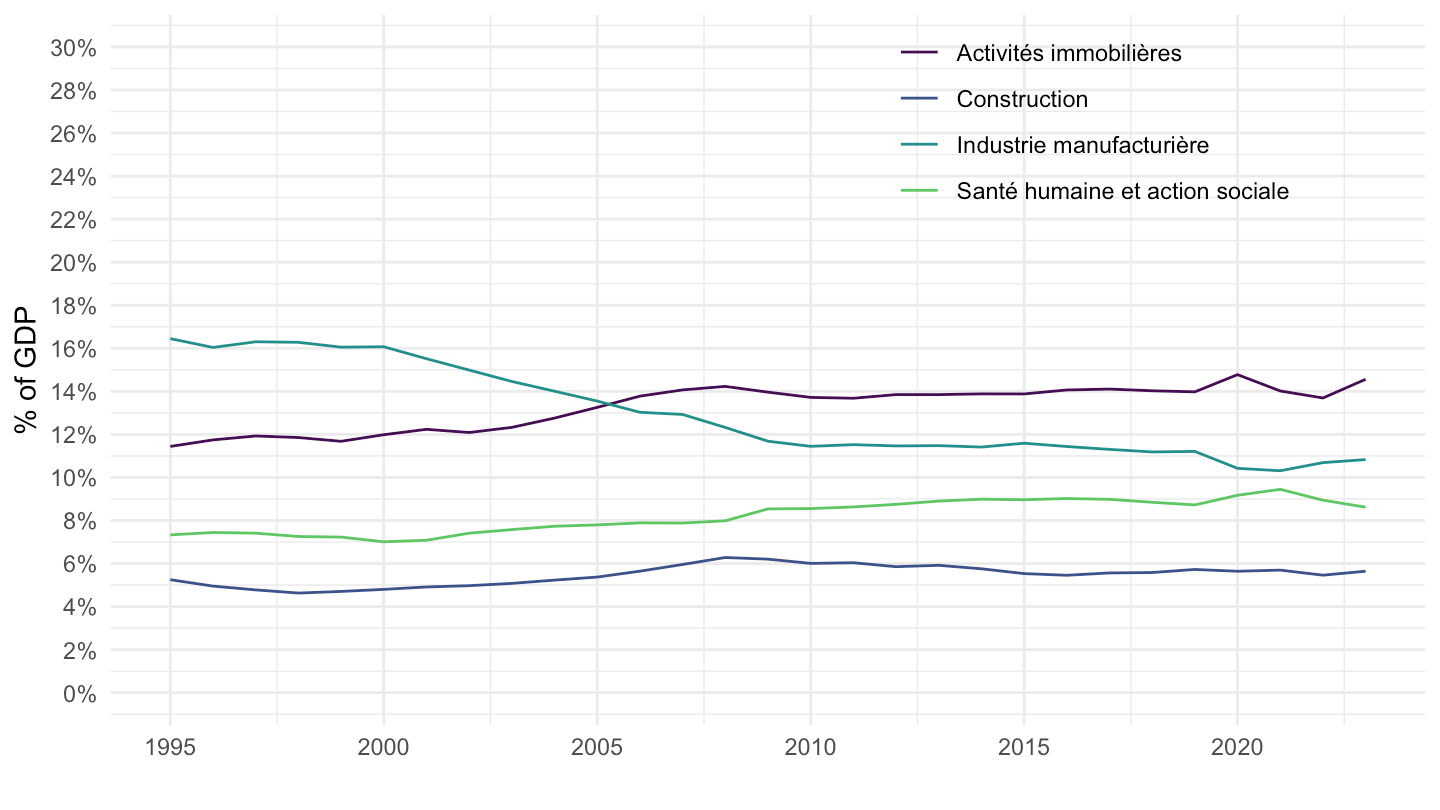
Germany
Table
All
Code
nama_10_a64 %>%
  filter(na_item == "B1G",
         geo %in% c("DE"),
         unit == "CP_MNAC",
         time %in% c("1978", "1998",  "2008", "2018")) %>%
  left_join(nace_r2, by = "nace_r2") %>%
  select(nace_r2, Nace_r2, time, values) %>%
  group_by(time) %>%
  mutate(values = round(100*values/ values[nace_r2 == "TOTAL"], 1)) %>%
  filter(nace_r2 != "TOTAL")  %>%
  spread(time, values) %>%
  print_table_conditional
Manufacturing
Code
nama_10_a64 %>%
  filter(na_item == "B1G",
         geo %in% c("DE"),
         unit == "CP_MNAC",
         time %in% c("1978", "1998",  "2008", "2018")) %>%
  filter(grepl("C", nace_r2) | nace_r2 == "TOTAL") %>%
  left_join(nace_r2, by = "nace_r2") %>%
  select(nace_r2, Nace_r2, time, values) %>%
  group_by(time) %>%
  mutate(values = round(100*values/ values[nace_r2 == "TOTAL"], 1)) %>%
  filter(nace_r2 != "TOTAL")  %>%
  spread(time, values) %>%
  arrange(-`2018`) %>%
print_table_conditional| nace_r2 | Nace_r2 | 1998 | 2008 | 2018 |
|---|---|---|---|---|
| C | Industrie manufacturière | 22.2 | 22.1 | 22.2 |
| C29_C30 | Industrie automobile et construction navale | 3.4 | 3.6 | 4.9 |
| C29 | Industrie automobile | 3.1 | 3.2 | 4.4 |
| C28 | Fabrication de machines et équipements n.c.a. | 3.2 | 3.7 | 3.5 |
| C24_C25 | Métallurgie et fabrication de produits métalliques, à l'exception des machines et des équipements | 2.8 | 3.1 | 2.7 |
| C25 | Fabrication de produits métalliques, à l'exception des machines et des équipements | 1.9 | 2.0 | 1.9 |
| C22_C23 | Fabrication de produits en caoutchouc et en plastique et autres produits minéraux non métalliques | 2.0 | 1.7 | 1.6 |
| C10-C12 | Industries alimentaires; fabrication de boissons et de produits à base de tabac | 1.9 | 1.6 | 1.5 |
| C20 | Industrie chimique | 1.8 | 1.6 | 1.5 |
| C26 | Fabrication de produits informatiques, électroniques et optiques | 1.3 | 1.4 | 1.5 |
| C27 | Fabrication d'équipements électriques | 1.7 | 1.6 | 1.5 |
| C31-C33 | Fabrication de meubles, bijouterie, instruments de musique, jouets, réparation et installation de machines et équipements | 1.4 | 1.4 | 1.3 |
| C22 | Fabrication de produits en caoutchouc et en plastique | 1.1 | 1.0 | 1.0 |
| C16-C18 | Travail du bois et du papier, imprimerie et reproduction | 1.5 | 1.1 | 0.8 |
| C24 | Métallurgie | 0.9 | 1.1 | 0.8 |
| C31_C32 | Fabrication de meubles; autres industries manufacturières | 0.9 | 0.8 | 0.8 |
| C21 | Industrie pharmaceutique | 0.6 | 0.9 | 0.7 |
| C23 | Fabrication d'autres produits minéraux non métalliques | 0.9 | 0.6 | 0.6 |
| C30 | Fabrication d'autres matériels de transport | 0.3 | 0.4 | 0.5 |
| C33 | Réparation et installation de machines et d'équipements | 0.5 | 0.6 | 0.5 |
| C17 | Industrie du papier et du carton | 0.5 | 0.4 | 0.4 |
| C19 | Cokéfaction et raffinage | 0.2 | 0.1 | 0.4 |
| C13-C15 | Fabrication de textiles, industrie de l'habillement, du cuir et de la chaussure | 0.5 | 0.3 | 0.3 |
| C16 | Travail du bois et fabrication d'articles en bois et en liège, à l'exception des meubles; fabrication d'articles en vannerie et sparterie | 0.4 | 0.3 | 0.2 |
| C18 | Imprimerie et reproduction d'enregistrements | 0.6 | 0.4 | 0.2 |
Construction, Human health, Manufacturing, Real estate
Code
nama_10_a64 %>%
  filter(na_item == "B1G",
         nace_r2 %in% c("C", "TOTAL", "L", "Q", "F"),
         geo %in% c("DE"),
         unit == "CP_MNAC") %>%
  year_to_date() %>%
  left_join(nace_r2, by = "nace_r2") %>%
  select(nace_r2, Nace_r2, date, values) %>%
  group_by(date) %>%
  mutate(values = values/ values[nace_r2 == "TOTAL"]) %>%
  filter(nace_r2 != "TOTAL")  %>%
  ggplot(.) + geom_line(aes(x = date, y = values, color = Nace_r2)) +
  theme_minimal() + xlab("") + ylab("% of GDP") +
  scale_color_manual(values = viridis(5)[1:4]) +
  scale_x_date(breaks = seq(1960, 2100, 5) %>% paste0("-01-01") %>% as.Date,
               labels = date_format("%Y")) +
  scale_y_continuous(breaks = 0.01*seq(0, 30, 2),
                     labels = percent_format(accuracy = 1),
                     limits = c(0, 0.3)) +
  theme(legend.position = c(0.75, 0.85),
        legend.title = element_blank())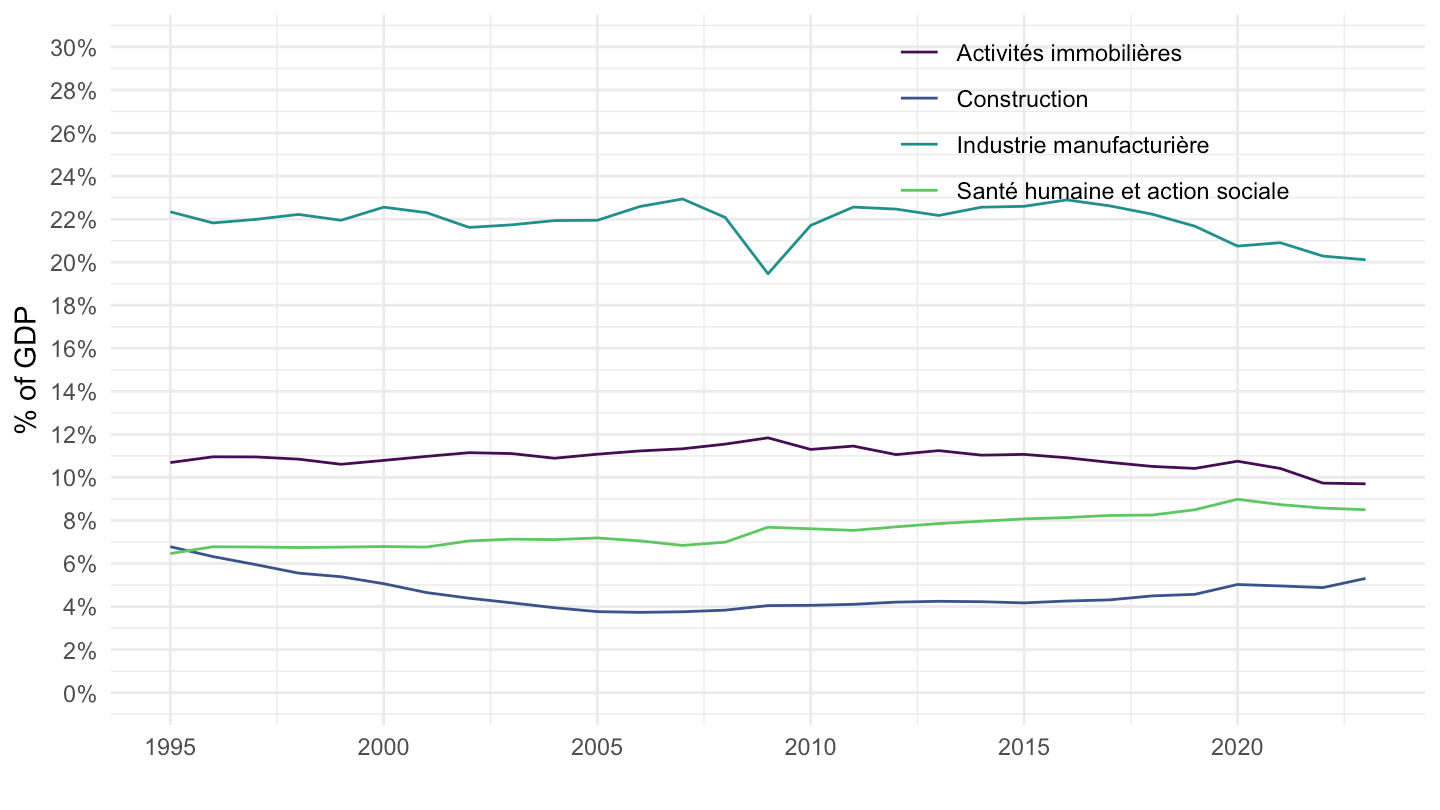
Italy
Code
nama_10_a64 %>%
  filter(na_item == "B1G",
         nace_r2 %in% c("C", "TOTAL", "L", "Q", "F"),
         geo %in% c("IT"),
         unit == "CP_MNAC") %>%
  year_to_date() %>%
  left_join(nace_r2, by = "nace_r2") %>%
  select(nace_r2, Nace_r2, date, values) %>%
  group_by(date) %>%
  mutate(values = values/ values[nace_r2 == "TOTAL"]) %>%
  filter(nace_r2 != "TOTAL")  %>%
  ggplot(.) + geom_line(aes(x = date, y = values, color = Nace_r2)) +
  theme_minimal() + xlab("") + ylab("% of GDP") +
  scale_color_manual(values = viridis(5)[1:4]) +
  scale_x_date(breaks = seq(1960, 2100, 5) %>% paste0("-01-01") %>% as.Date,
               labels = date_format("%Y")) +
  scale_y_continuous(breaks = 0.01*seq(-500, 200, 1),
                     labels = percent_format(accuracy = 1)) +
  theme(legend.position = c(0.75, 0.85),
        legend.title = element_blank())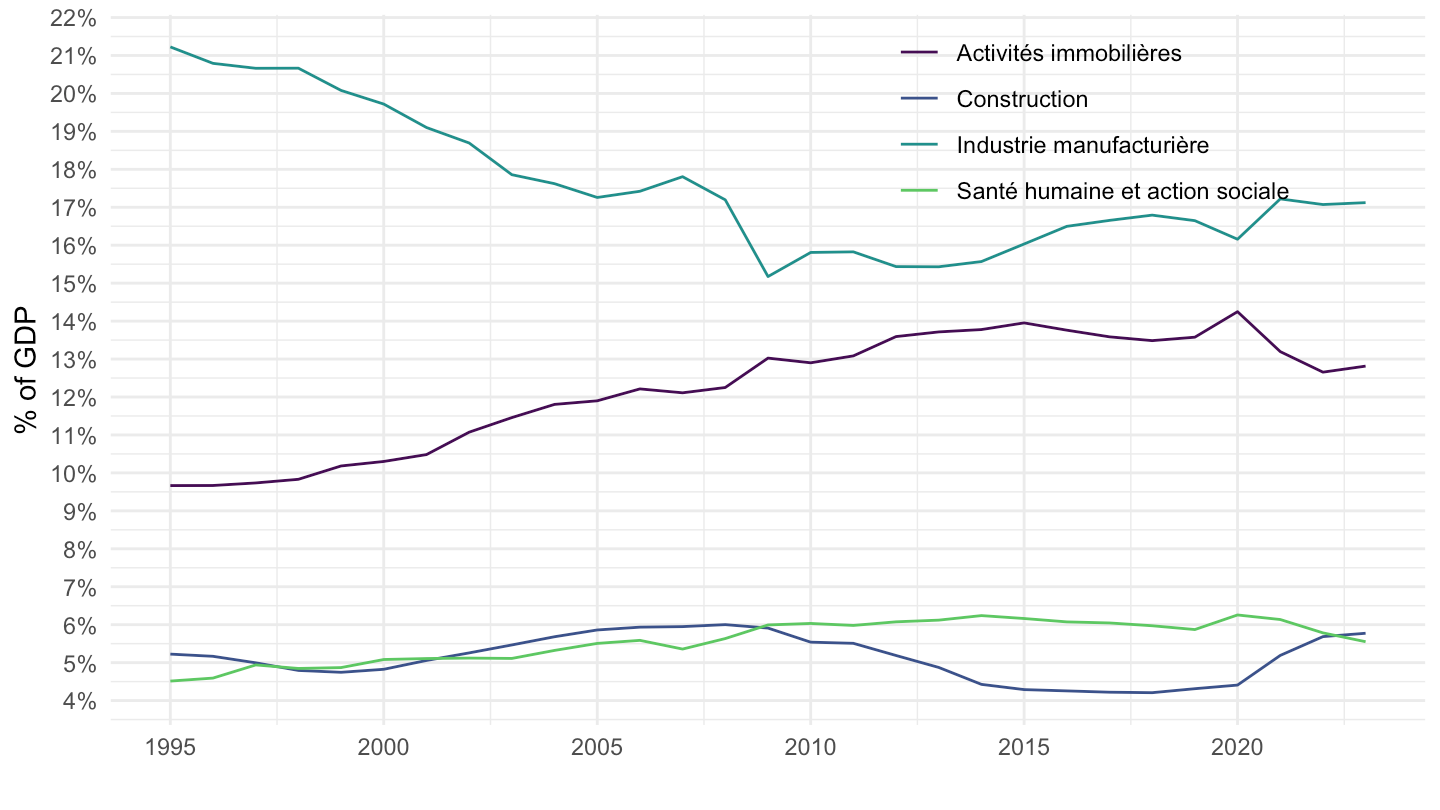
Spain
Code
nama_10_a64 %>%
  filter(na_item == "B1G",
         nace_r2 %in% c("C", "TOTAL", "L", "Q", "F"),
         geo %in% c("ES"),
         unit == "CP_MNAC") %>%
  year_to_date() %>%
  left_join(nace_r2, by = "nace_r2") %>%
  select(nace_r2, Nace_r2, date, values) %>%
  group_by(date) %>%
  mutate(values = values/ values[nace_r2 == "TOTAL"]) %>%
  filter(nace_r2 != "TOTAL")  %>%
  ggplot(.) + geom_line(aes(x = date, y = values, color = Nace_r2)) +
  theme_minimal() + xlab("") + ylab("% of GDP") +
  scale_color_manual(values = viridis(5)[1:4]) +
  scale_x_date(breaks = seq(1960, 2100, 5) %>% paste0("-01-01") %>% as.Date,
               labels = date_format("%Y")) +
  scale_y_continuous(breaks = 0.01*seq(-500, 200, 1),
                     labels = percent_format(accuracy = 1)) +
  theme(legend.position = c(0.75, 0.85),
        legend.title = element_blank())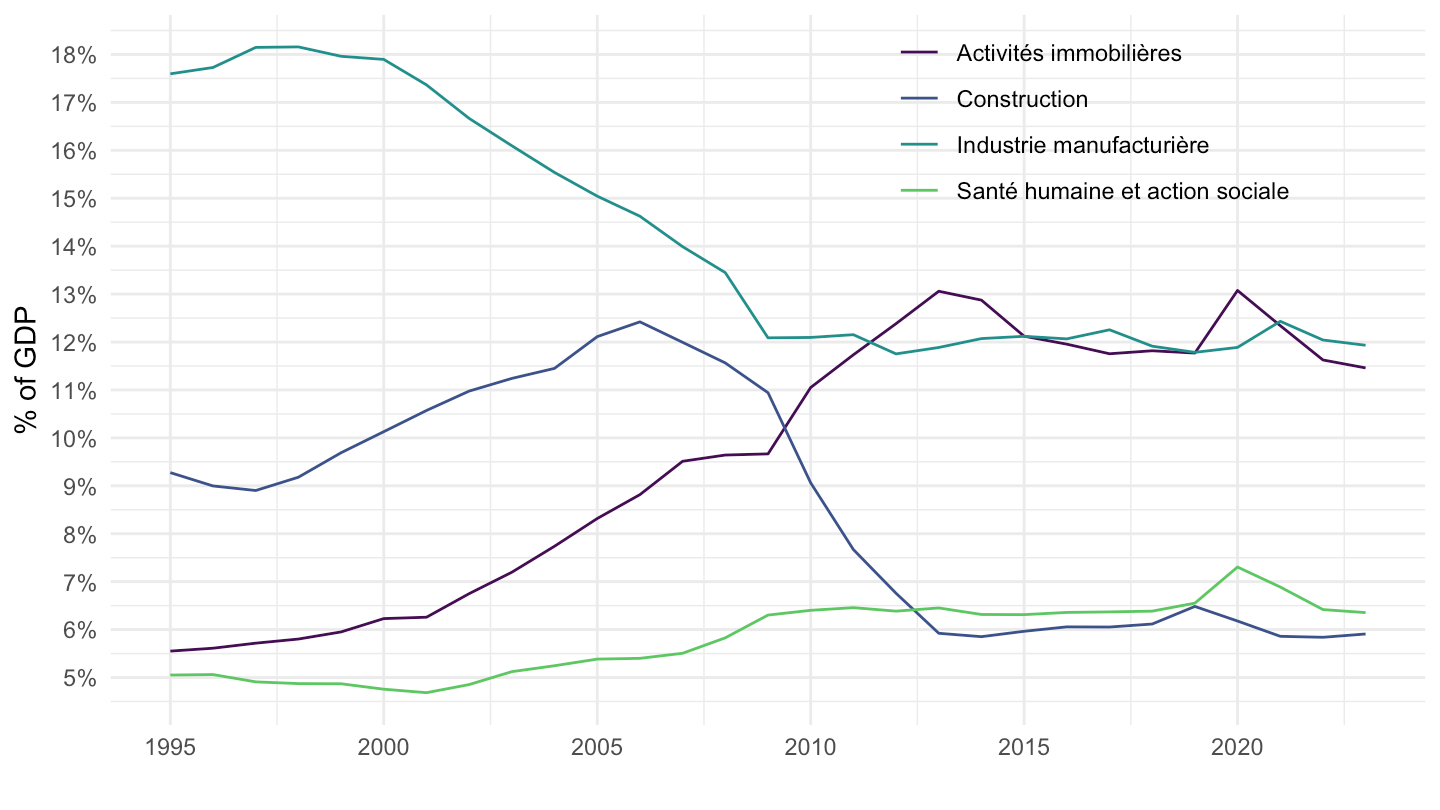
Netherlands
Code
nama_10_a64 %>%
  filter(na_item == "B1G",
         nace_r2 %in% c("C", "TOTAL", "L", "Q", "F"),
         geo %in% c("NL"),
         unit == "CP_MNAC") %>%
  year_to_date() %>%
  left_join(nace_r2, by = "nace_r2") %>%
  select(nace_r2, Nace_r2, date, values) %>%
  group_by(date) %>%
  mutate(values = values/ values[nace_r2 == "TOTAL"]) %>%
  filter(nace_r2 != "TOTAL")  %>%
  ggplot(.) + geom_line(aes(x = date, y = values, color = Nace_r2)) +
  theme_minimal() + xlab("") + ylab("% of GDP") +
  scale_color_manual(values = viridis(5)[1:4]) +
  scale_x_date(breaks = seq(1960, 2100, 5) %>% paste0("-01-01") %>% as.Date,
               labels = date_format("%Y")) +
  scale_y_continuous(breaks = 0.01*seq(-500, 200, 1),
                     labels = percent_format(accuracy = 1)) +
  theme(legend.position = c(0.75, 0.85),
        legend.title = element_blank())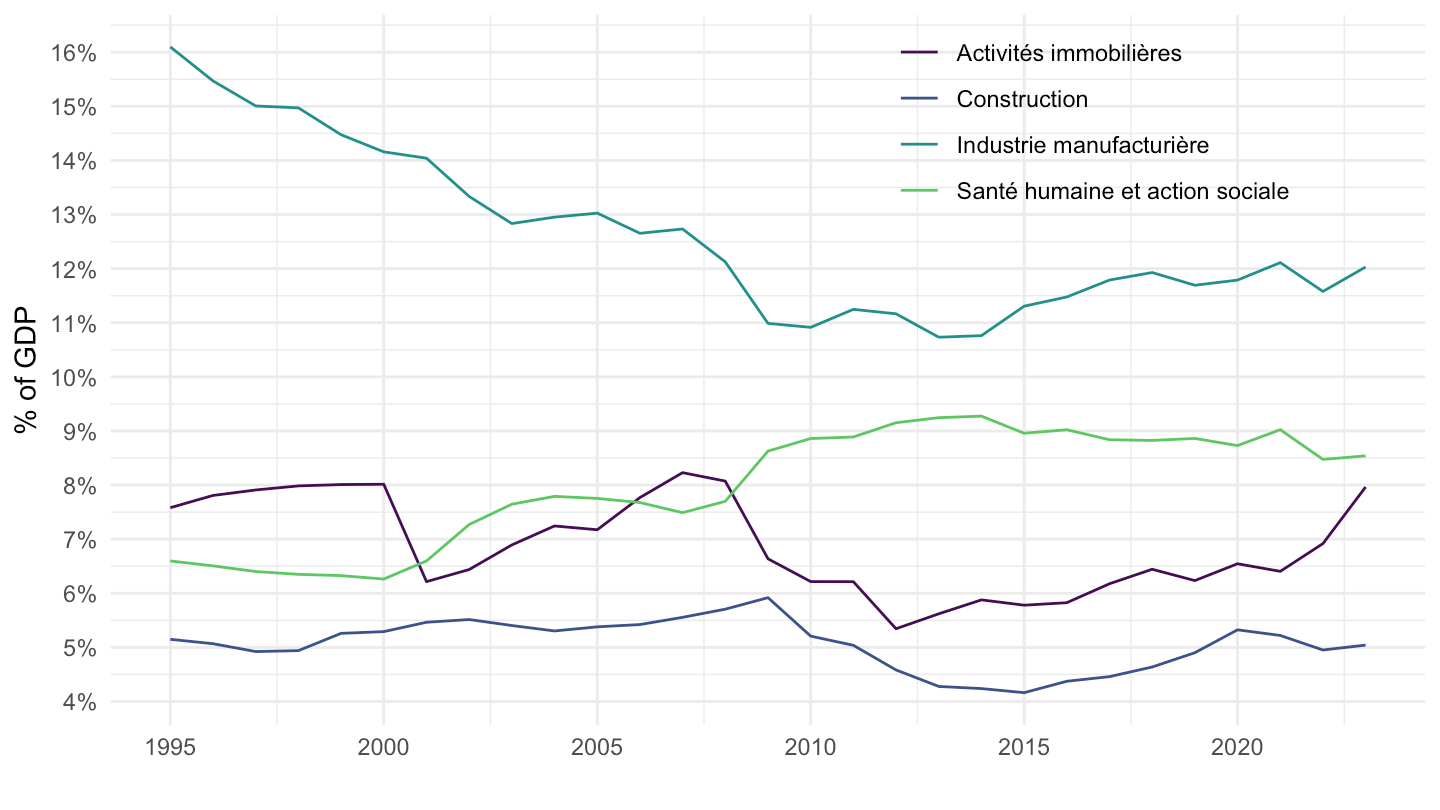
Danemark
Code
nama_10_a64 %>%
  filter(na_item == "B1G",
         nace_r2 %in% c("C", "TOTAL", "L", "Q", "F"),
         geo %in% c("DK"),
         unit == "CP_MNAC") %>%
  year_to_date() %>%
  left_join(nace_r2, by = "nace_r2") %>%
  select(nace_r2, Nace_r2, date, values) %>%
  group_by(date) %>%
  mutate(values = values/ values[nace_r2 == "TOTAL"]) %>%
  filter(nace_r2 != "TOTAL")  %>%
  ggplot(.) + geom_line(aes(x = date, y = values, color = Nace_r2)) +
  theme_minimal() + xlab("") + ylab("% of GDP") +
  scale_color_manual(values = viridis(5)[1:4]) +
  scale_x_date(breaks = seq(1960, 2100, 5) %>% paste0("-01-01") %>% as.Date,
               labels = date_format("%Y")) +
  scale_y_continuous(breaks = 0.01*seq(-500, 200, 1),
                     labels = percent_format(accuracy = 1)) +
  theme(legend.position = c(0.75, 0.85),
        legend.title = element_blank())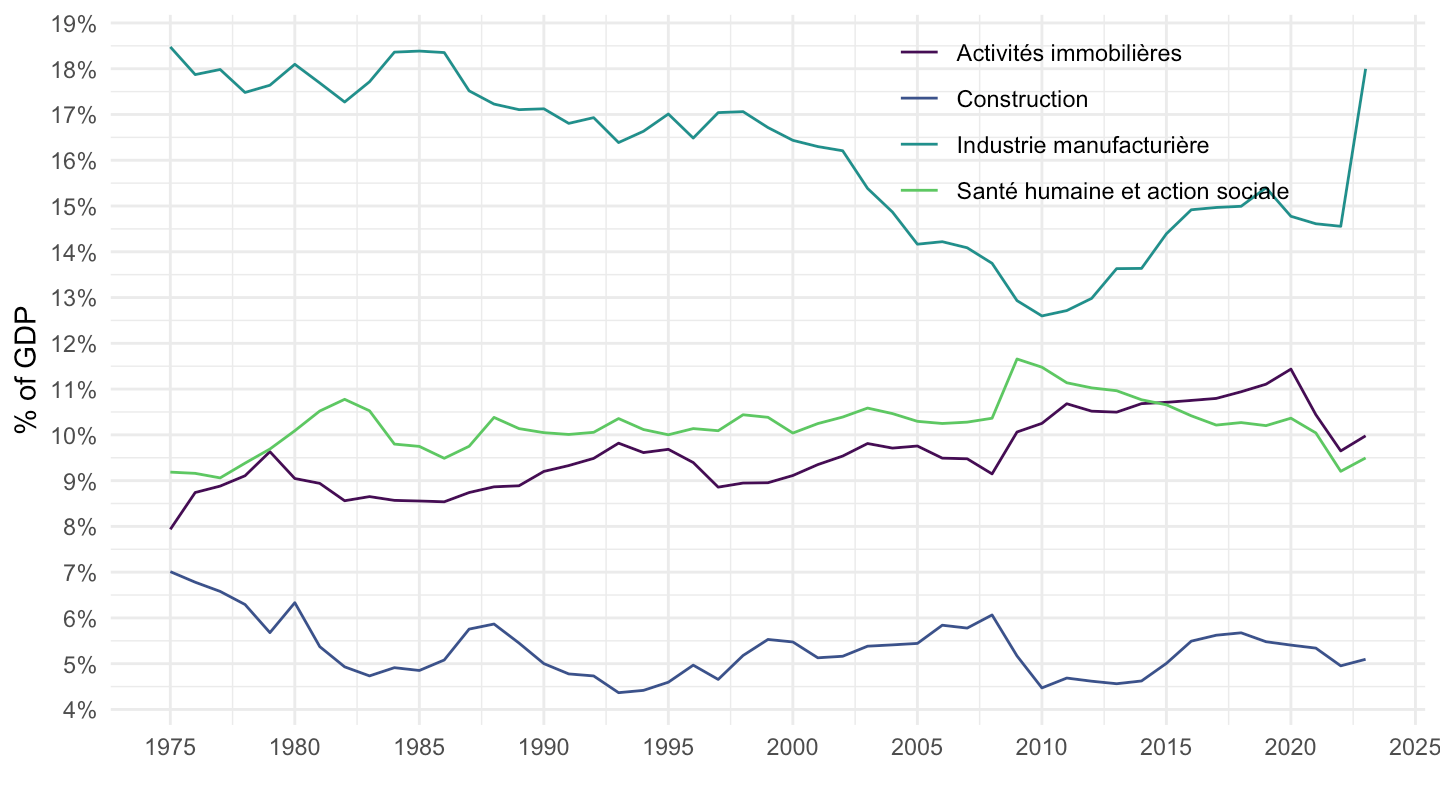
Belgium
Code
nama_10_a64 %>%
  filter(na_item == "B1G",
         nace_r2 %in% c("C", "TOTAL", "L", "Q", "F"),
         geo %in% c("BE"),
         unit == "CP_MNAC") %>%
  year_to_date() %>%
  left_join(nace_r2, by = "nace_r2") %>%
  select(nace_r2, Nace_r2, date, values) %>%
  group_by(date) %>%
  mutate(values = values/ values[nace_r2 == "TOTAL"]) %>%
  filter(nace_r2 != "TOTAL")  %>%
  ggplot(.) + geom_line(aes(x = date, y = values, color = Nace_r2)) +
  theme_minimal() + xlab("") + ylab("% of GDP") +
  scale_color_manual(values = viridis(5)[1:4]) +
  scale_x_date(breaks = seq(1960, 2100, 5) %>% paste0("-01-01") %>% as.Date,
               labels = date_format("%Y")) +
  scale_y_continuous(breaks = 0.01*seq(-500, 200, 1),
                     labels = percent_format(accuracy = 1)) +
  theme(legend.position = c(0.75, 0.85),
        legend.title = element_blank())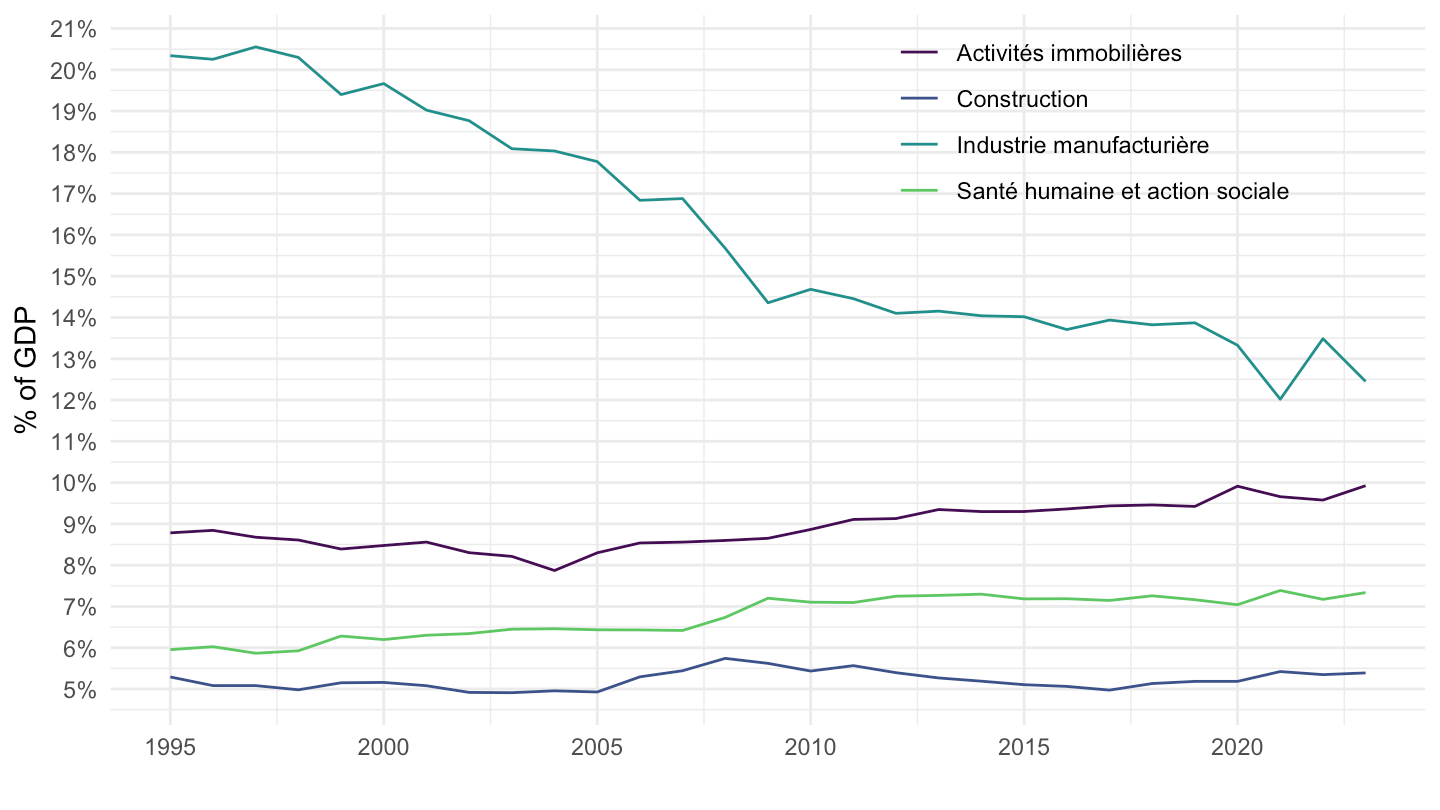
Finland
Code
nama_10_a64 %>%
  filter(na_item == "B1G",
         nace_r2 %in% c("C", "TOTAL", "L", "Q", "F"),
         geo %in% c("FI"),
         unit == "CP_MNAC") %>%
  year_to_date() %>%
  left_join(nace_r2, by = "nace_r2") %>%
  select(nace_r2, Nace_r2, date, values) %>%
  group_by(date) %>%
  mutate(values = values/ values[nace_r2 == "TOTAL"]) %>%
  filter(nace_r2 != "TOTAL")  %>%
  ggplot(.) + geom_line(aes(x = date, y = values, color = Nace_r2)) +
  theme_minimal() + xlab("") + ylab("% of GDP") +
  scale_color_manual(values = viridis(5)[1:4]) +
  scale_x_date(breaks = seq(1960, 2100, 5) %>% paste0("-01-01") %>% as.Date,
               labels = date_format("%Y")) +
  scale_y_continuous(breaks = 0.01*seq(-500, 200, 1),
                     labels = percent_format(accuracy = 1)) +
  theme(legend.position = c(0.75, 0.85),
        legend.title = element_blank())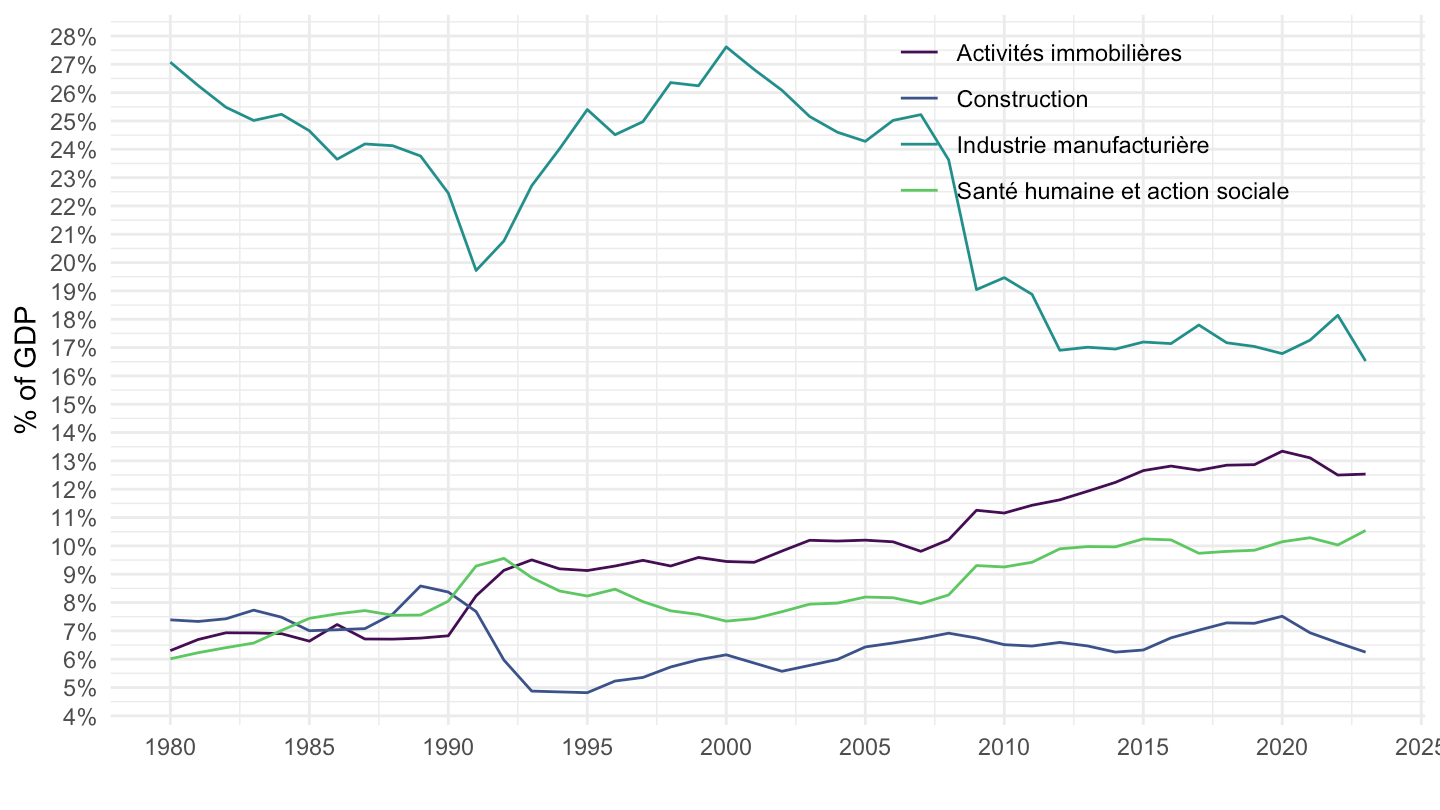
Portugal
Code
nama_10_a64 %>%
  filter(na_item == "B1G",
         nace_r2 %in% c("C", "TOTAL", "L", "Q", "F"),
         geo %in% c("PT"),
         unit == "CP_MNAC") %>%
  year_to_date() %>%
  left_join(nace_r2, by = "nace_r2") %>%
  select(nace_r2, Nace_r2, date, values) %>%
  group_by(date) %>%
  mutate(values = values/ values[nace_r2 == "TOTAL"]) %>%
  filter(nace_r2 != "TOTAL")  %>%
  ggplot(.) + geom_line(aes(x = date, y = values, color = Nace_r2)) +
  theme_minimal() + xlab("") + ylab("% of GDP") +
  scale_color_manual(values = viridis(5)[1:4]) +
  scale_x_date(breaks = seq(1960, 2100, 5) %>% paste0("-01-01") %>% as.Date,
               labels = date_format("%Y")) +
  scale_y_continuous(breaks = 0.01*seq(-500, 200, 1),
                     labels = percent_format(accuracy = 1)) +
  theme(legend.position = c(0.75, 0.85),
        legend.title = element_blank())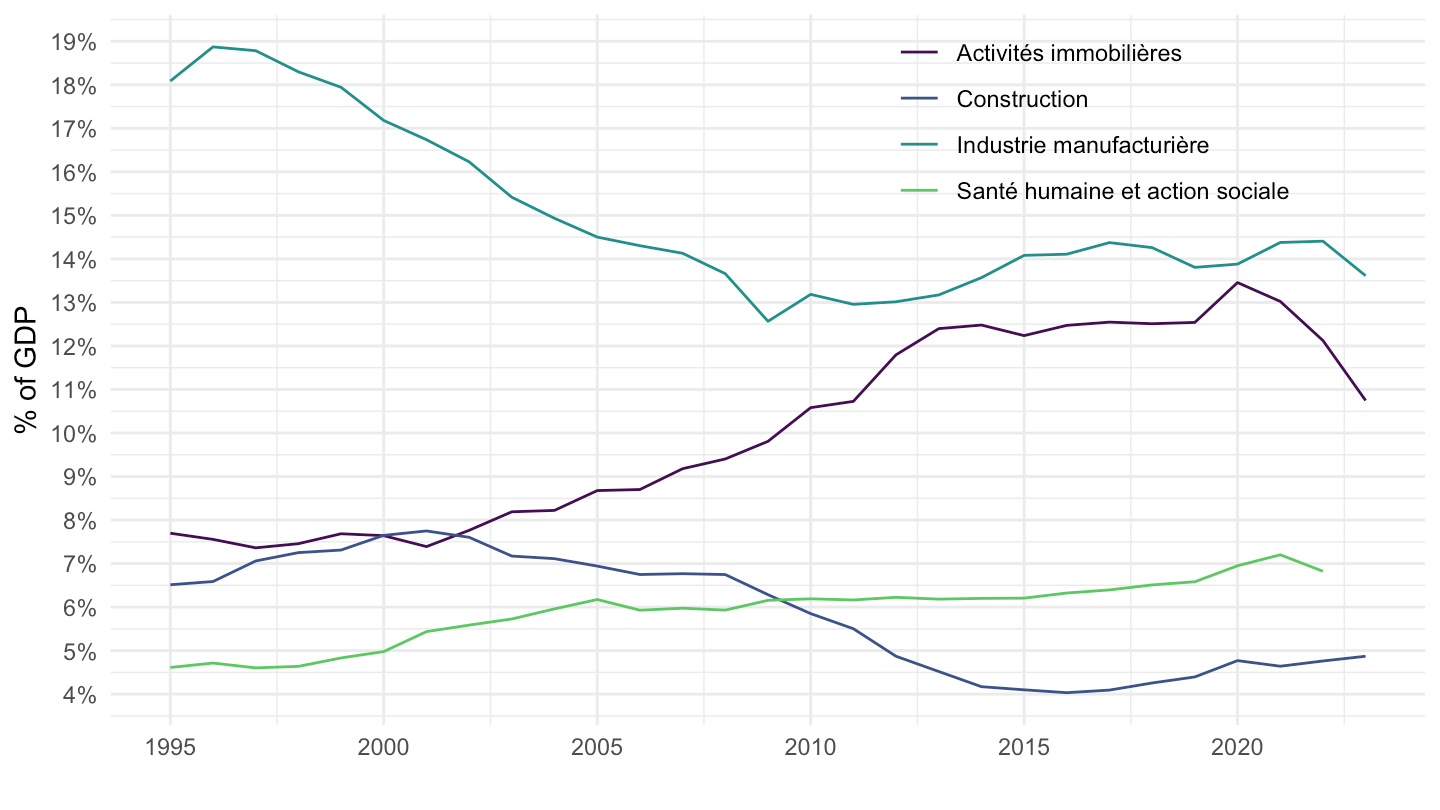
Austria
Code
nama_10_a64 %>%
  filter(na_item == "B1G",
         nace_r2 %in% c("C", "TOTAL", "L", "Q", "F"),
         geo %in% c("AT"),
         unit == "CP_MNAC") %>%
  year_to_date() %>%
  left_join(nace_r2, by = "nace_r2") %>%
  select(nace_r2, Nace_r2, date, values) %>%
  group_by(date) %>%
  mutate(values = values/ values[nace_r2 == "TOTAL"]) %>%
  filter(nace_r2 != "TOTAL")  %>%
  ggplot(.) + geom_line(aes(x = date, y = values, color = Nace_r2)) +
  theme_minimal() + xlab("") + ylab("% of GDP") +
  scale_color_manual(values = viridis(5)[1:4]) +
  scale_x_date(breaks = seq(1960, 2100, 5) %>% paste0("-01-01") %>% as.Date,
               labels = date_format("%Y")) +
  scale_y_continuous(breaks = 0.01*seq(-500, 200, 1),
                     labels = percent_format(accuracy = 1)) +
  theme(legend.position = c(0.75, 0.85),
        legend.title = element_blank())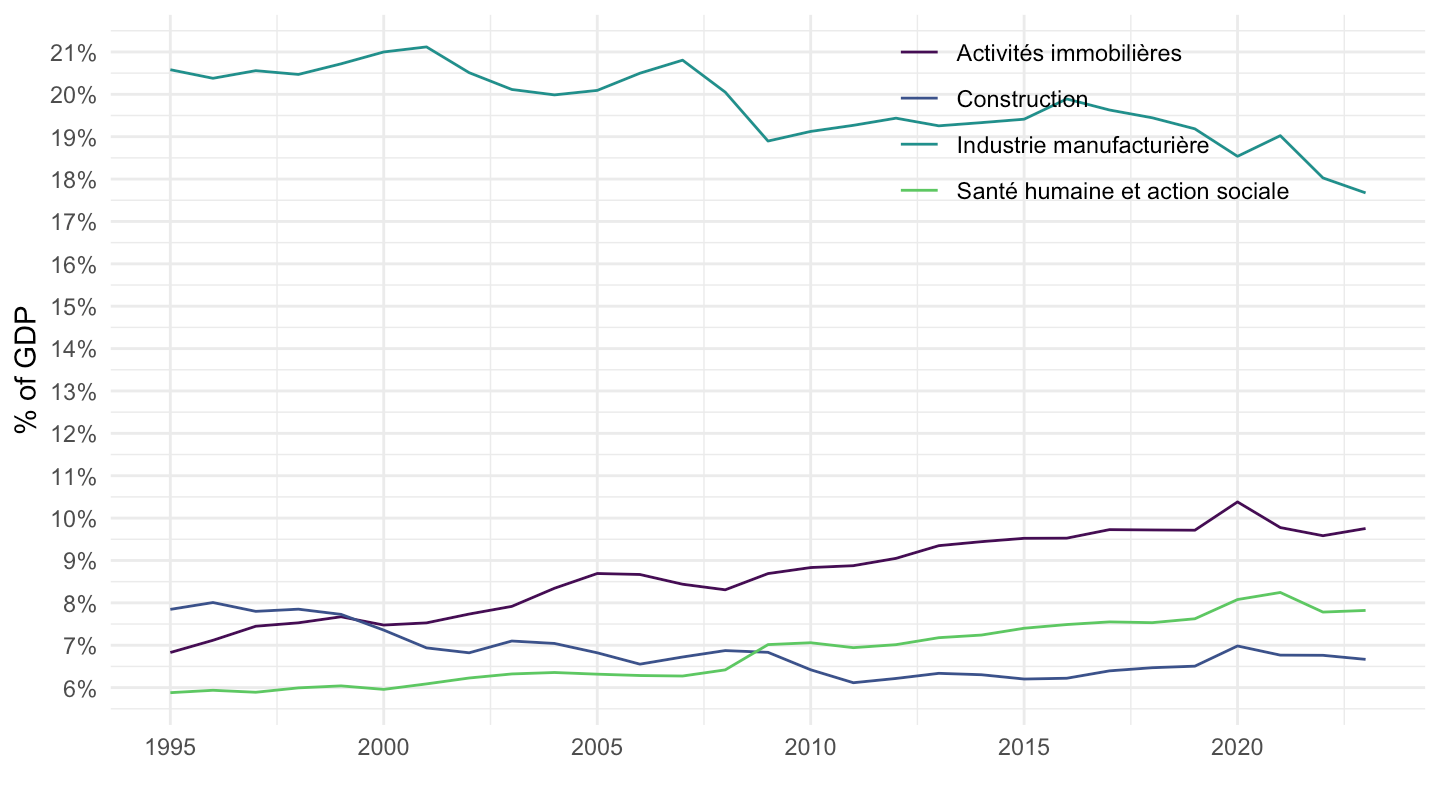
Sweden
Code
nama_10_a64 %>%
  filter(na_item == "B1G",
         nace_r2 %in% c("C", "TOTAL", "L", "Q", "F"),
         geo %in% c("SE"),
         unit == "CP_MNAC") %>%
  year_to_date() %>%
  left_join(nace_r2, by = "nace_r2") %>%
  select(nace_r2, Nace_r2, date, values) %>%
  group_by(date) %>%
  mutate(values = values/ values[nace_r2 == "TOTAL"]) %>%
  filter(nace_r2 != "TOTAL")  %>%
  ggplot(.) + geom_line(aes(x = date, y = values, color = Nace_r2)) +
  theme_minimal() + xlab("") + ylab("% of GDP") +
  scale_color_manual(values = viridis(5)[1:4]) +
  scale_x_date(breaks = seq(1960, 2100, 5) %>% paste0("-01-01") %>% as.Date,
               labels = date_format("%Y")) +
  scale_y_continuous(breaks = 0.01*seq(-500, 200, 1),
                     labels = percent_format(accuracy = 1)) +
  theme(legend.position = c(0.75, 0.85),
        legend.title = element_blank())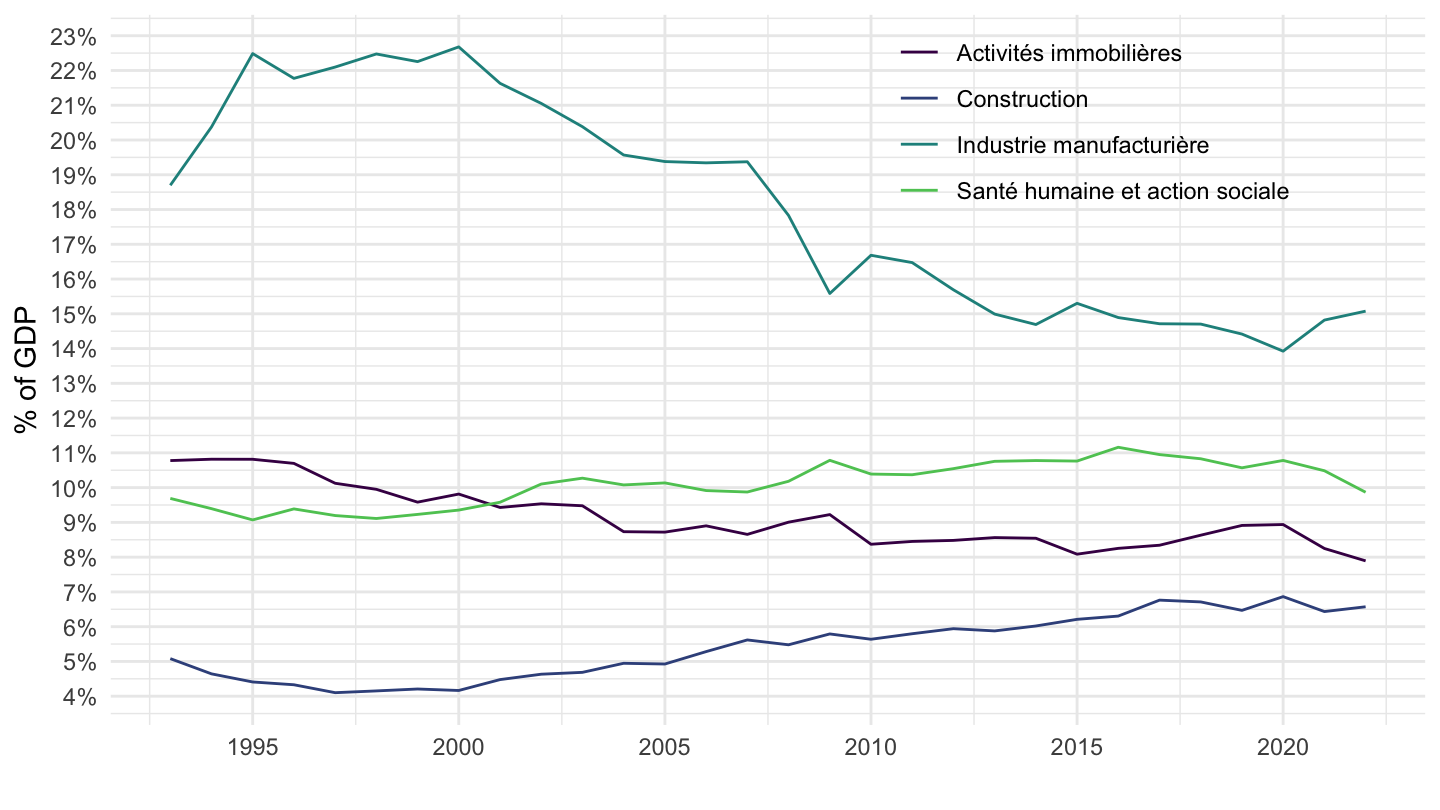
United Kingdom
Code
nama_10_a64 %>%
  filter(na_item == "B1G",
         nace_r2 %in% c("C", "TOTAL", "L", "Q", "F"),
         geo %in% c("UK"),
         unit == "CP_MNAC") %>%
  year_to_date() %>%
  left_join(nace_r2, by = "nace_r2") %>%
  select(nace_r2, Nace_r2, date, values) %>%
  group_by(date) %>%
  mutate(values = values/ values[nace_r2 == "TOTAL"]) %>%
  filter(nace_r2 != "TOTAL")  %>%
  ggplot(.) + geom_line(aes(x = date, y = values, color = Nace_r2)) +
  theme_minimal() + xlab("") + ylab("% of GDP") +
  scale_color_manual(values = viridis(5)[1:4]) +
  scale_x_date(breaks = seq(1960, 2100, 5) %>% paste0("-01-01") %>% as.Date,
               labels = date_format("%Y")) +
  scale_y_continuous(breaks = 0.01*seq(-500, 200, 1),
                     labels = percent_format(accuracy = 1)) +
  theme(legend.position = c(0.75, 0.85),
        legend.title = element_blank())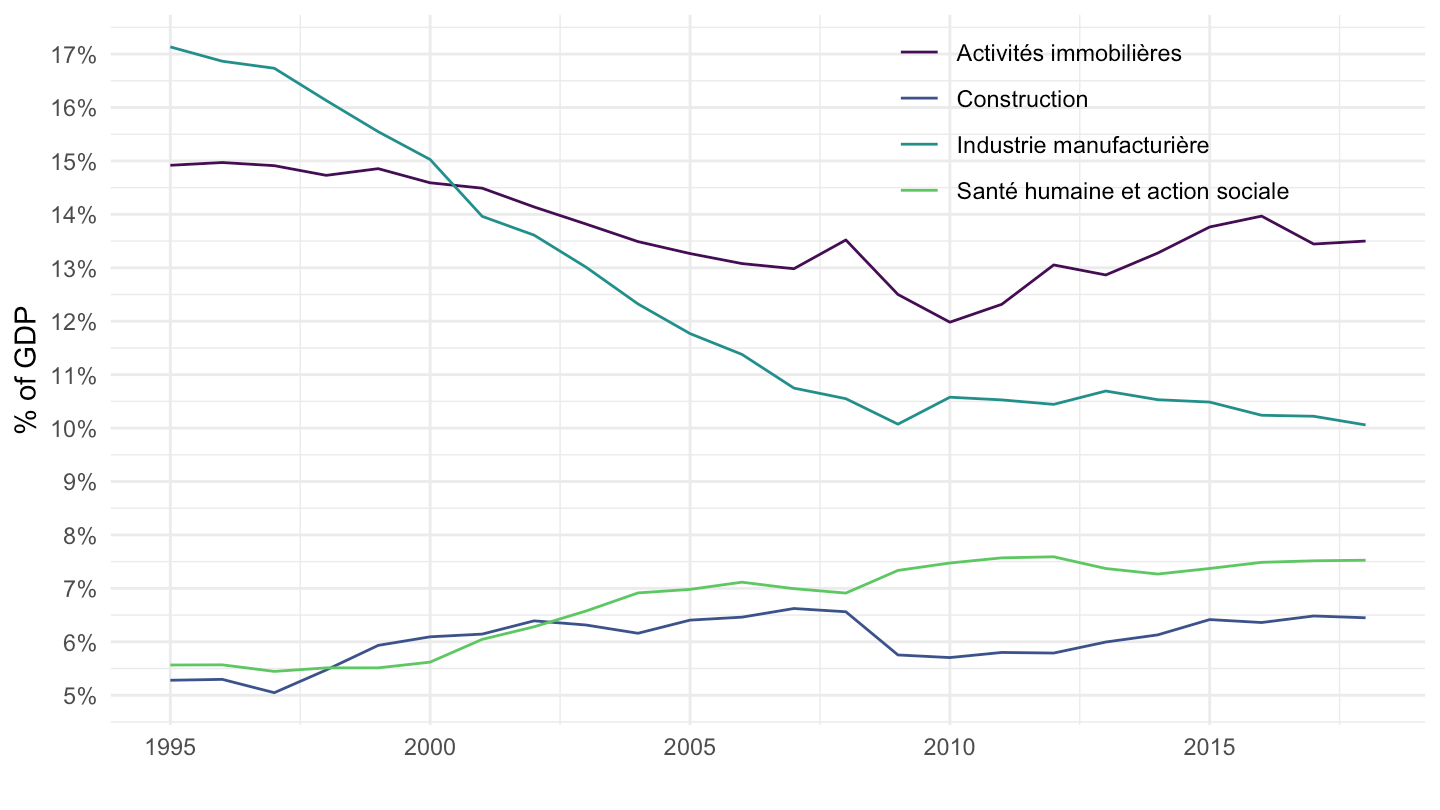
Iceland
Code
nama_10_a64 %>%
  filter(na_item == "B1G",
         nace_r2 %in% c("C", "TOTAL", "L", "Q", "F"),
         geo %in% c("IS"),
         unit == "CP_MNAC") %>%
  year_to_date() %>%
  left_join(nace_r2, by = "nace_r2") %>%
  select(nace_r2, Nace_r2, date, values) %>%
  group_by(date) %>%
  mutate(values = values/ values[nace_r2 == "TOTAL"]) %>%
  filter(nace_r2 != "TOTAL")  %>%
  ggplot(.) + geom_line(aes(x = date, y = values, color = Nace_r2)) +
  theme_minimal() + xlab("") + ylab("% of GDP") +
  scale_color_manual(values = viridis(5)[1:4]) +
  scale_x_date(breaks = seq(1960, 2100, 5) %>% paste0("-01-01") %>% as.Date,
               labels = date_format("%Y")) +
  scale_y_continuous(breaks = 0.01*seq(-500, 200, 1),
                     labels = percent_format(accuracy = 1)) +
  theme(legend.position = c(0.75, 0.85),
        legend.title = element_blank())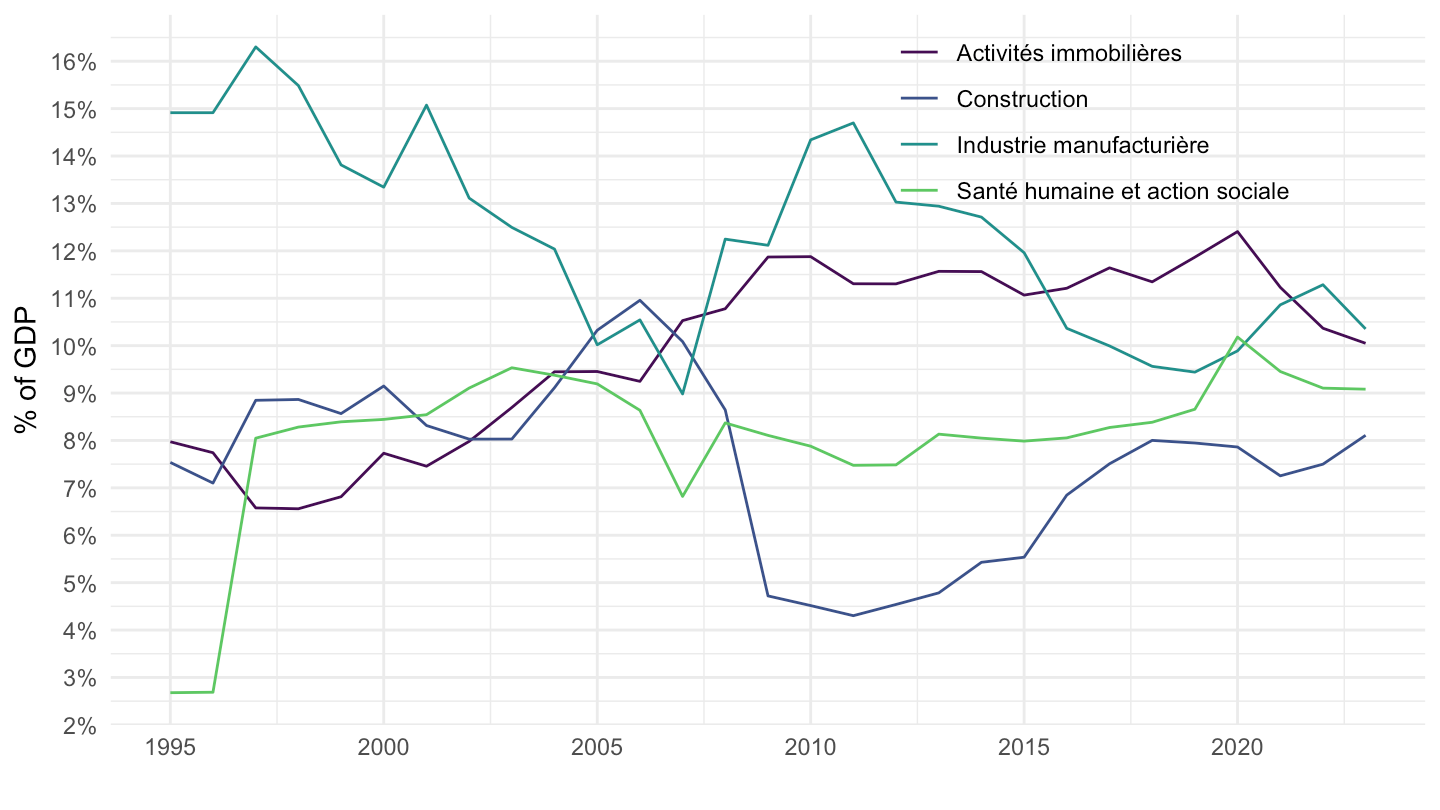
Relative to EA Manufacturing Value Added
1995-
Code
nama_10_a64 %>%
  filter(na_item == "B1G",
         nace_r2 == "C",
         geo %in% c("EA", "FR", "DE", "IT", "ES", "NL", "AT", "FI"),
         unit == "CP_MNAC") %>%
  year_to_date() %>%
  filter(date >= as.Date("1995-01-01")) %>%
  #filter(date <= as.Date("2019-01-01")) %>%
  left_join(geo, by = "geo") %>%
  group_by(date) %>%
  filter(n() == 8) %>%
  mutate(values = values /values[geo == "EA"]) %>%
  filter(geo != "EA") %>%
  group_by(geo) %>%
  mutate(values = 100*values / values[date == as.Date("1995-01-01")]) %>%
  left_join(colors, by = c("Geo" = "country")) %>%
  mutate(color = ifelse(geo == "FR", color2, color)) %>%
  ggplot(.) + geom_line(aes(x = date, y = values, color = color)) +
  theme_minimal() + xlab("") + ylab("Valeur ajoutée manuf. par rapport à la Zone €") +
  scale_color_identity() + add_7flags +
  scale_x_date(breaks = seq(1960, 2023, 5) %>% paste0("-01-01") %>% as.Date,
               labels = date_format("%Y")) +
  scale_y_continuous(breaks = seq(0, 200, 5)) +
  theme(legend.position = "none")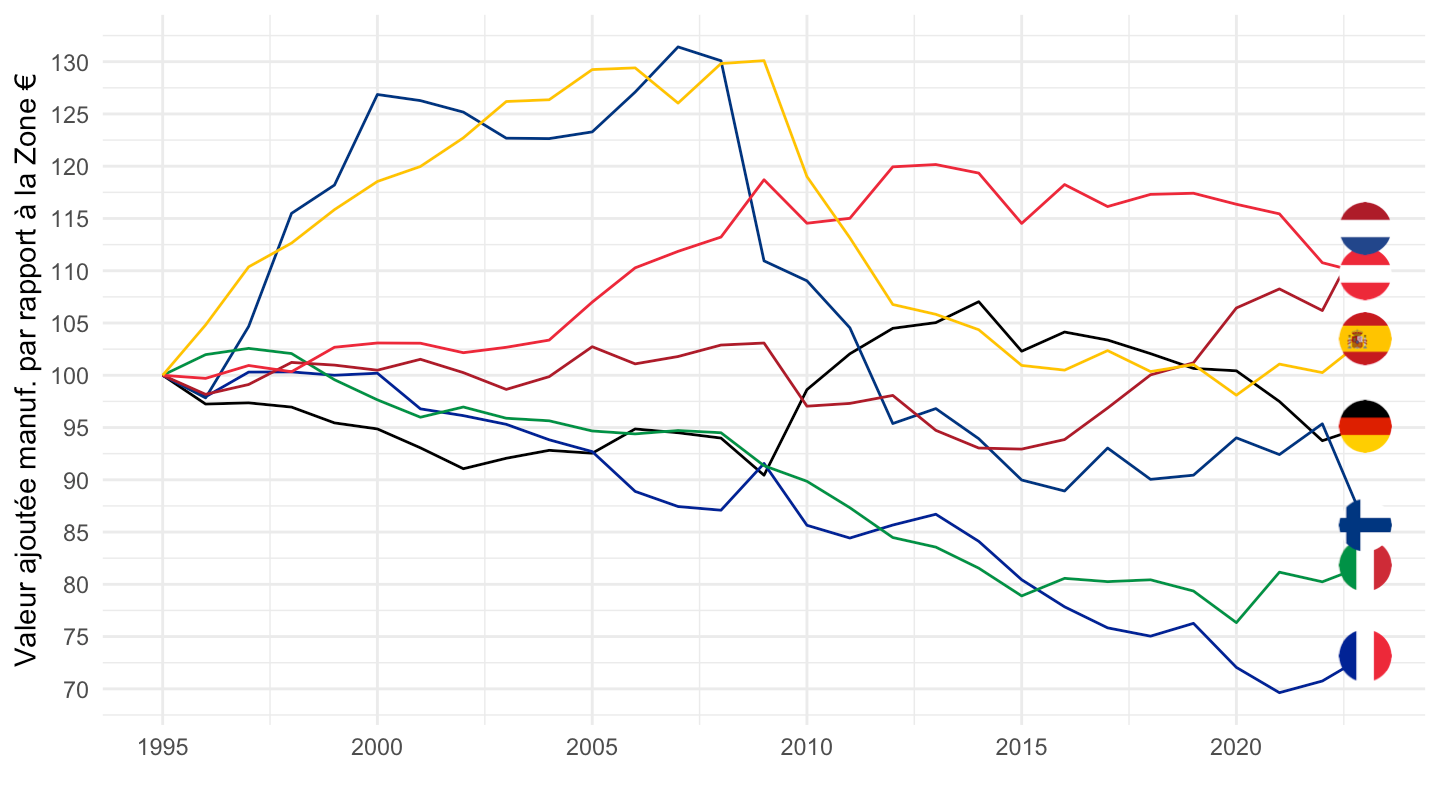
All-
Code
nama_10_a64 %>%
  filter(na_item == "B1G",
         nace_r2 == "C",
         unit == "CP_MNAC",
         !(geo %in% c("BG", "RO", "RS"))) %>%
  year_to_date() %>%
  filter(date >= as.Date("1995-01-01"),
         date <= as.Date("2023-01-01")) %>%
  left_join(geo, by = "geo") %>%
  group_by(geo) %>%
  filter(n() == 29) %>%
  group_by(date) %>%
  filter(!is.na(values)) %>%
  mutate(values = values /values[geo == "EA"]) %>%
  filter(geo != "EA") %>%
  group_by(geo) %>%
  mutate(values = 100*values / values[date == as.Date("1995-01-01")]) %>%
  left_join(colors, by = c("Geo" = "country")) %>%
  ggplot(.) + geom_line(aes(x = date, y = values, color = color, group = geo)) +
  theme_minimal() + xlab("") + ylab("Valeur ajoutée manuf. par rapport à la Zone €") +
  scale_color_identity() +
  scale_x_date(breaks = seq(1960, 2023, 5) %>% paste0("-01-01") %>% as.Date,
               labels = date_format("%Y")) +
  scale_y_log10(breaks = c(seq(0, 1000, 100), seq(10, 100, 10))) +
  theme(legend.position = "none") +
  geom_label_repel(data = . %>% group_by(geo)
                   %>% filter(date %in% c(max(date), min(date))),
                   aes(x = date, y = values, label = geo, color = color)) +
  geom_line(data = . %>% filter(geo == "FR"),
            aes(x = date, y = values, color = color), size = 2) +
  geom_line(data = . %>% filter(geo == "EL"),
            aes(x = date, y = values, color = color), size = 2)
2000-2019
Code
nama_10_a64 %>%
  filter(na_item == "B1G",
         nace_r2 == "C",
         geo %in% c("EA", "FR", "DE", "IT", "ES", "NL", "AT", "FI"),
         unit == "CP_MNAC") %>%
  year_to_date() %>%
  filter(date >= as.Date("2000-01-01"),
         date <= as.Date("2019-01-01")) %>%
  left_join(geo, by = "geo") %>%
  group_by(date) %>%
  mutate(values = values /values[geo == "EA"]) %>%
  filter(geo != "EA") %>%
  group_by(geo) %>%
  mutate(values = 100*values / values[date == as.Date("2000-01-01")]) %>%
  left_join(colors, by = c("Geo" = "country")) %>%
  mutate(color = ifelse(geo == "FR", color2, color)) %>%
  ggplot(.) + geom_line(aes(x = date, y = values, color = color)) +
  theme_minimal() + xlab("") + ylab("Valeur ajoutée manuf. par rapport à la Zone €") +
  scale_color_identity() + add_7flags +
  scale_x_date(breaks = seq(1960, 2023, 5) %>% paste0("-01-01") %>% as.Date,
               labels = date_format("%Y")) +
  scale_y_continuous(breaks = seq(0, 200, 5)) +
  theme(legend.position = "none")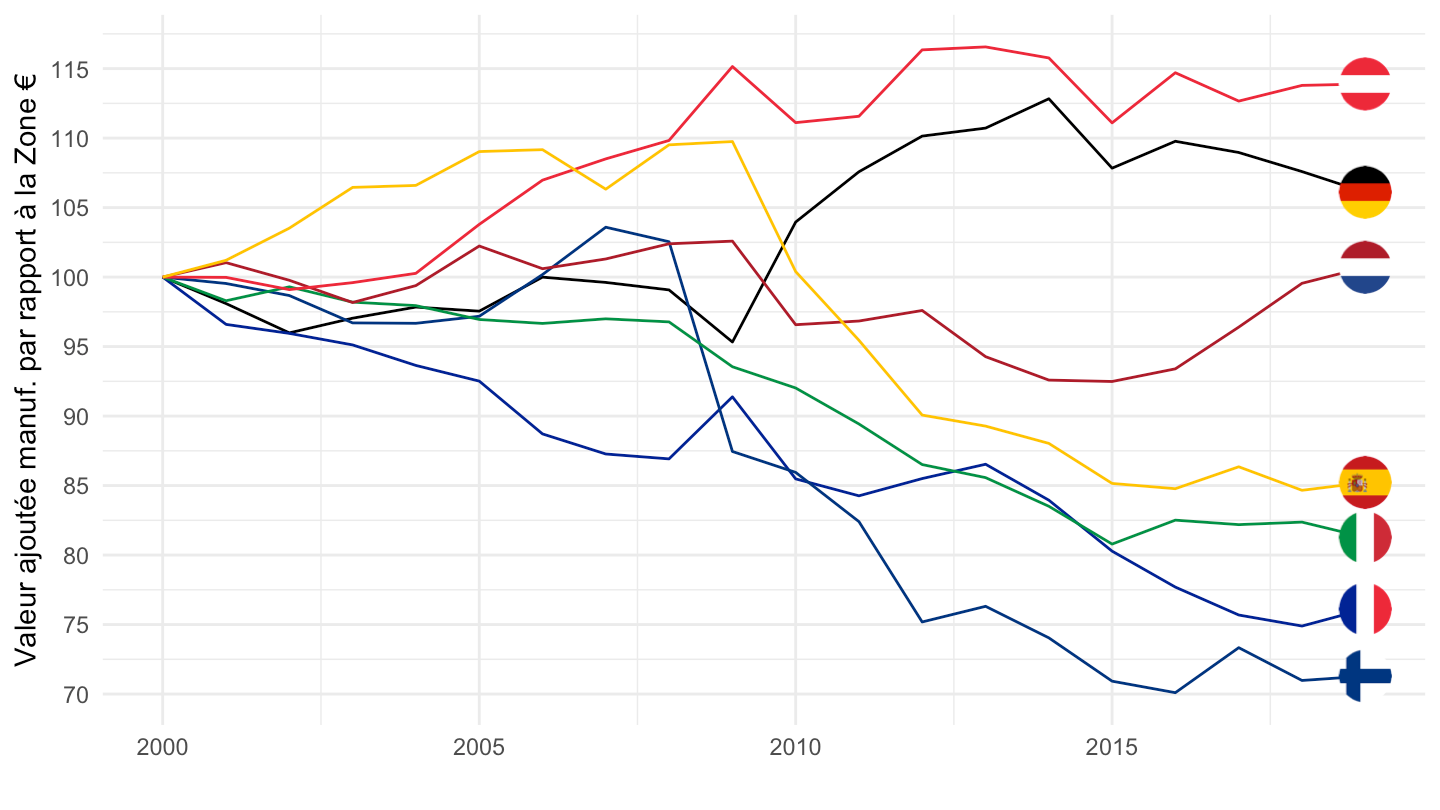
2000-2018 + Grèce
Code
nama_10_a64 %>%
  filter(na_item == "B1G",
         nace_r2 == "C",
         geo %in% c("EA", "FR", "DE", "IT", "EL", "NL", "AT", "FI"),
         unit == "CP_MNAC") %>%
  year_to_date() %>%
  filter(date >= as.Date("2000-01-01")) %>%
  filter(date <= as.Date("2018-01-01")) %>%
  left_join(geo, by = "geo") %>%
  group_by(date) %>%
  mutate(values = values /values[geo == "EA"]) %>%
  filter(geo != "EA") %>%
  group_by(geo) %>%
  mutate(values = 100*values / values[date == as.Date("2000-01-01")]) %>%
  ggplot(.) + geom_line(aes(x = date, y = values, color = Geo)) +
  theme_minimal() + xlab("") + ylab("Valeur ajoutée manuf. par rapport à la Zone €") +
  scale_color_manual(values = c("#ED2939", "#003580", "#002395", "#000000",
                                "#0D5EAF", "#009246", "#AE1C28")) +
  scale_x_date(breaks = seq(1960, 2020, 1) %>% paste0("-01-01") %>% as.Date,
               labels = date_format("%Y")) +
  geom_image(data = . %>%
               filter(date == as.Date("2012-01-01")) %>%
               mutate(image = paste0("../../icon/flag/round/", str_to_lower(Geo), ".png")),
             aes(x = date, y = values, image = image), asp = 1.5) +
  scale_y_continuous(breaks = seq(0, 200, 5)) +
  theme(legend.position = "none")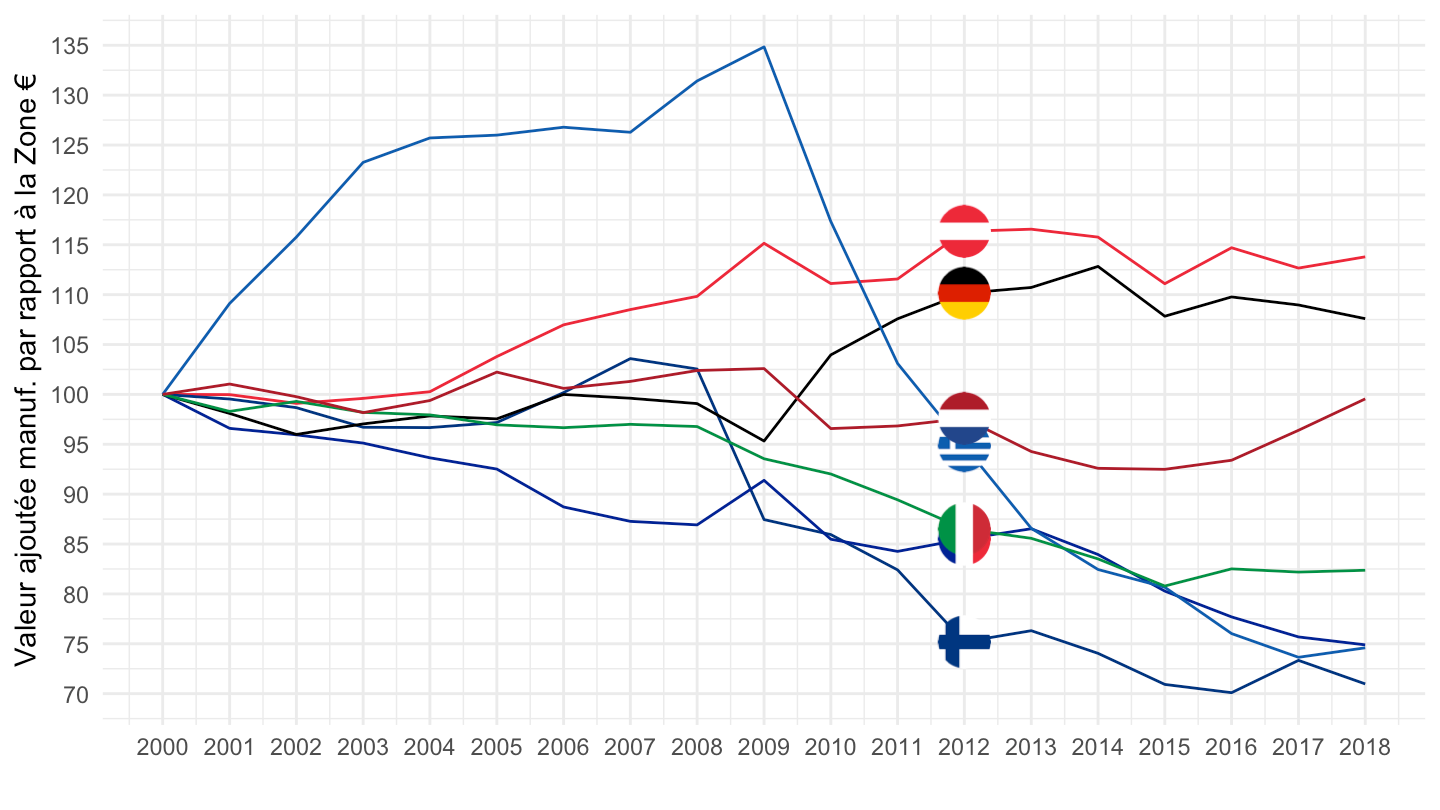
Industry
1995-2018
Code
nama_10_a64 %>%
  filter(na_item == "B1G",
         nace_r2 == "B-E",
         geo %in% c("EA", "FR", "DE", "IT", "ES", "NL", "AT", "FI"),
         unit == "CP_MNAC") %>%
  year_to_date() %>%
  filter(date >= as.Date("1995-01-01"),
         date <= as.Date("2019-01-01")) %>%
  left_join(geo, by = "geo") %>%
  group_by(date) %>%
  mutate(values = values /values[geo == "EA"]) %>%
  filter(geo != "EA") %>%
  group_by(geo) %>%
  mutate(values = 100*values/values[date == as.Date("1995-01-01")]) %>%
  ggplot(.) + geom_line(aes(x = date, y = values, color = Geo)) +
  theme_minimal() + xlab("") + ylab("Valeur ajoutée manuf. par rapport à la Zone €") +
  scale_color_manual(values = c("#ED2939", "#003580", "#002395", "#000000",
                                "#009246", "#AE1C28", "#FFC400")) +
  scale_x_date(breaks = seq(1960, 2020, 5) %>% paste0("-01-01") %>% as.Date,
               labels = date_format("%Y")) +
  geom_image(data = . %>%
               filter(date == as.Date("2008-01-01")) %>%
               mutate(image = paste0("../../icon/flag/round/", str_to_lower(Geo), ".png")),
             aes(x = date, y = values, image = image), asp = 1.5) +
  scale_y_continuous(breaks = seq(0, 200, 5)) +
  theme(legend.position = "none")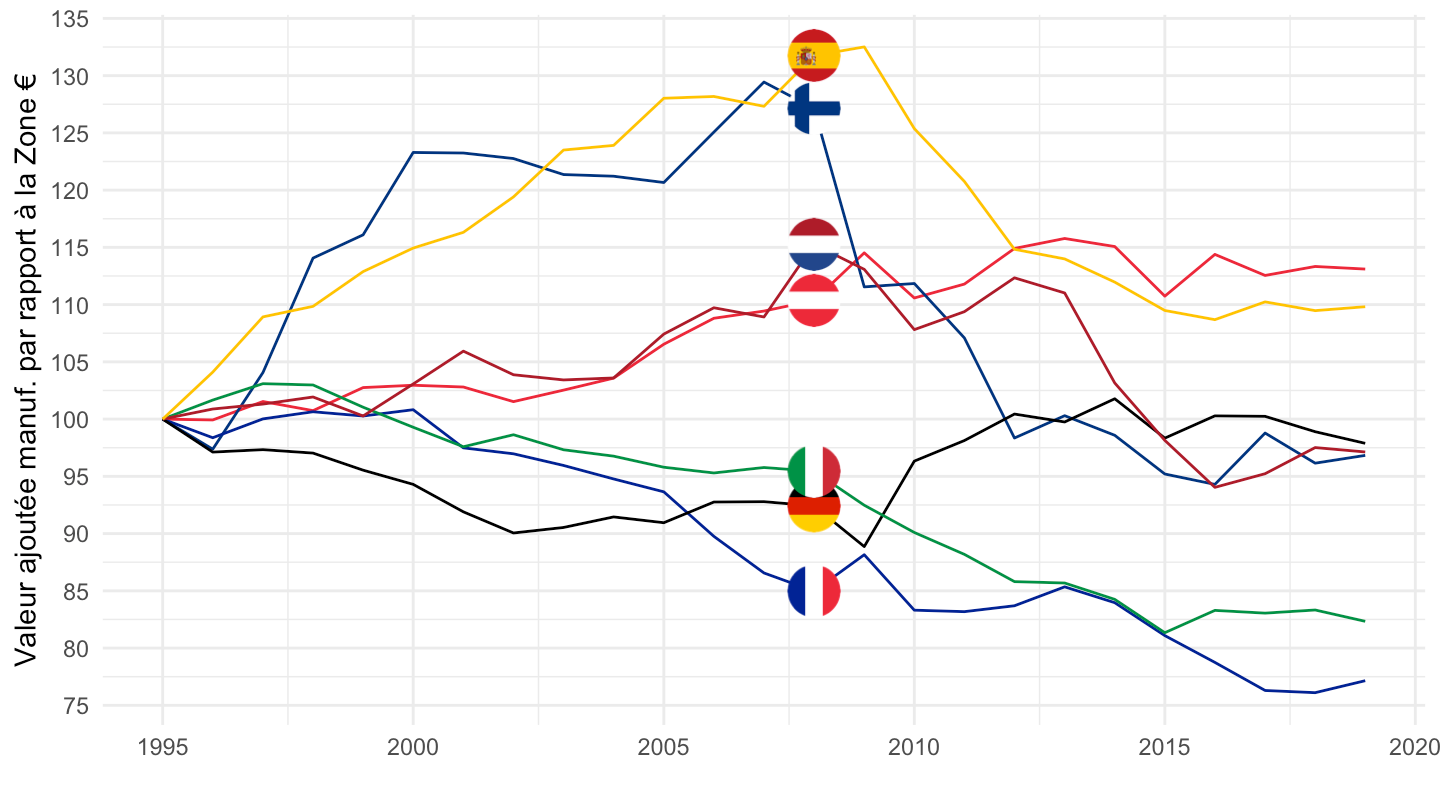
2000-2018
Code
nama_10_a64 %>%
  filter(na_item == "B1G",
         nace_r2 == "B-E",
         geo %in% c("EA", "FR", "DE", "IT", "ES", "NL", "AT", "FI"),
         unit == "CP_MNAC") %>%
  year_to_date() %>%
  filter(date >= as.Date("2000-01-01")) %>%
  #filter(date <= as.Date("2018-01-01")) %>%
  left_join(geo, by = "geo") %>%
  group_by(date) %>%
  filter(n() == 8) %>%
  mutate(values = values /values[geo == "EA"]) %>%
  filter(geo != "EA") %>%
  group_by(geo) %>%
  mutate(values = 100*values/values[date == as.Date("2000-01-01")]) %>%
  ggplot(.) + geom_line(aes(x = date, y = values, color = Geo)) +
  theme_minimal() + xlab("") + ylab("Valeur ajoutée manuf. par rapport à la Zone €") +
  scale_color_manual(values = c("#ED2939", "#003580", "#002395", "#000000",
                                "#009246", "#AE1C28", "#FFC400")) +
  geom_image(data = . %>%
               filter(date == as.Date("2016-01-01")) %>%
               mutate(image = paste0("../../icon/flag/round/", str_to_lower(Geo), ".png")),
             aes(x = date, y = values, image = image), asp = 1.5) +
  scale_x_date(breaks = seq(1960, 2030, 2) %>% paste0("-01-01") %>% as.Date,
               labels = date_format("%Y")) +
  scale_y_continuous(breaks = seq(0, 200, 5)) +
  theme(legend.position = "none")