New registrations of passenger cars by type of motor energy and engine size - road_eqr_carmot
Data - Eurostat
Info
Last observation: Annual: 2024 (N = 316)
First observation: Annual: 1970 (N = 15)
Last data update: 23 jul 2026, 23:02. Last compile: 24 jul 2026, 03:47
Structure
Diesel Share of New Registrations
France, Germany, Italy
Code
road_eqr_carmot %>%
  filter(geo %in% c("FR", "DE", "IT"),
         engine == "TOTAL",
         mot_nrg %in% c("DIE", "TOTAL")) %>%
  select(geo, Geo, mot_nrg, time, values) %>%
  spread(mot_nrg, values) %>%
  mutate(values = DIE / TOTAL) %>%
  year_to_date() %>%
  arrange(date) %>%

  left_join(colors, by = c("Geo" = "country")) %>%
  ggplot + geom_line(aes(x = date, y = values, color = color)) +
  theme_minimal() + scale_color_identity() + add_3flags +
  scale_x_date(breaks = seq(1960, 2100, 5) %>% paste0("-01-01") %>% as.Date,
               labels = date_format("%Y")) +
  xlab("") + ylab("Diesel share of new car registrations") +
  scale_y_continuous(labels = scales::percent_format(accuracy = 1))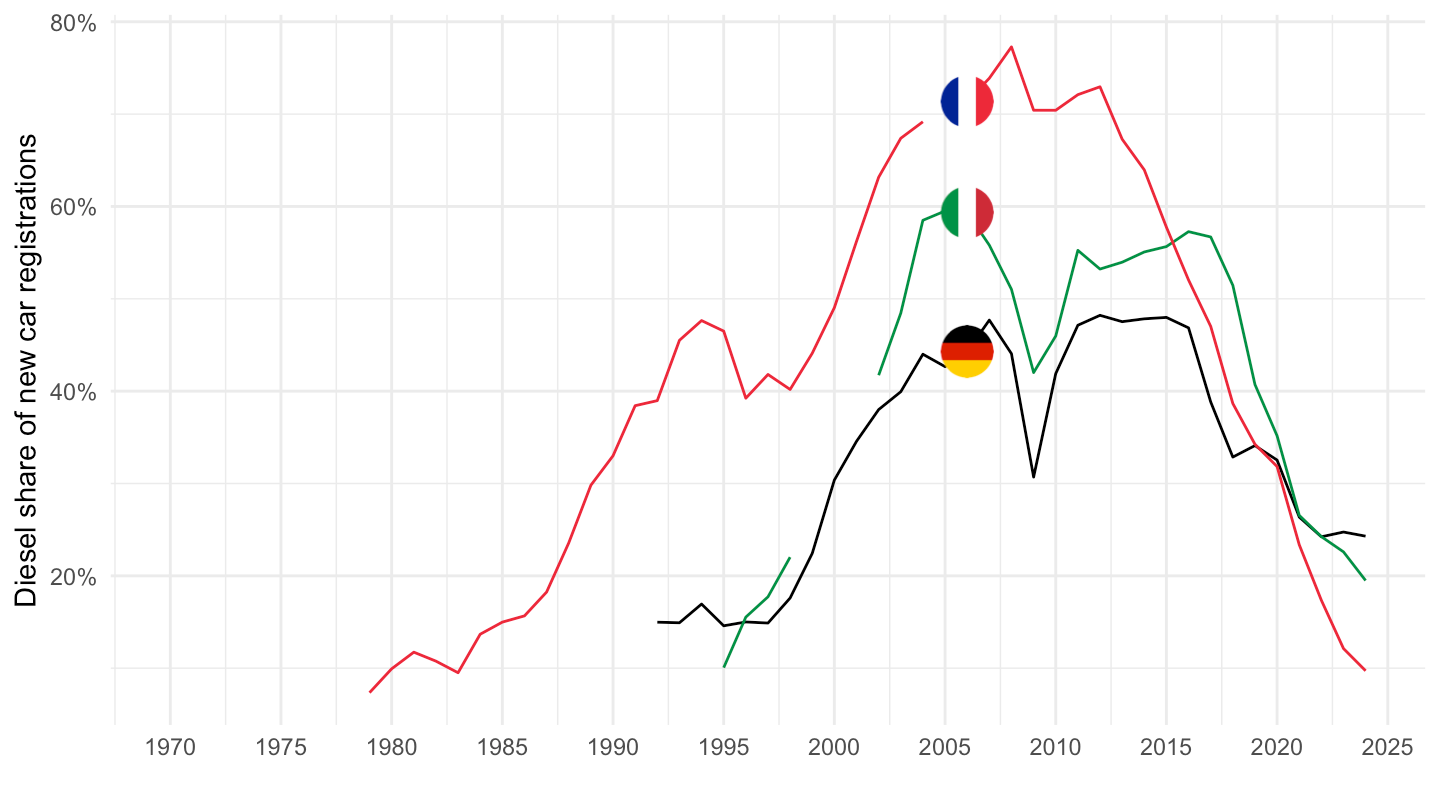
France: Petrol Cars by Engine Size
Less than 1400cc, 1400-1999cc, 2000cc or over
Code
road_eqr_carmot %>%
  filter(geo == "FR",
         mot_nrg == "PET",
         engine != "TOTAL") %>%
  year_to_date() %>%
  arrange(date) %>%
  mutate(values = values/1000) %>%

  ggplot + geom_line(aes(x = date, y = values, color = Engine)) +
  theme_minimal() +
  scale_x_date(breaks = seq(1960, 2100, 5) %>% paste0("-01-01") %>% as.Date,
               labels = date_format("%Y")) +
  theme(legend.position = c(0.25, 0.85),
        legend.title = element_blank()) +
  xlab("") + ylab("New petrol car registrations") +
  scale_y_continuous(labels = dollar_format(accuracy = 1, prefix = "", suffix = "K"))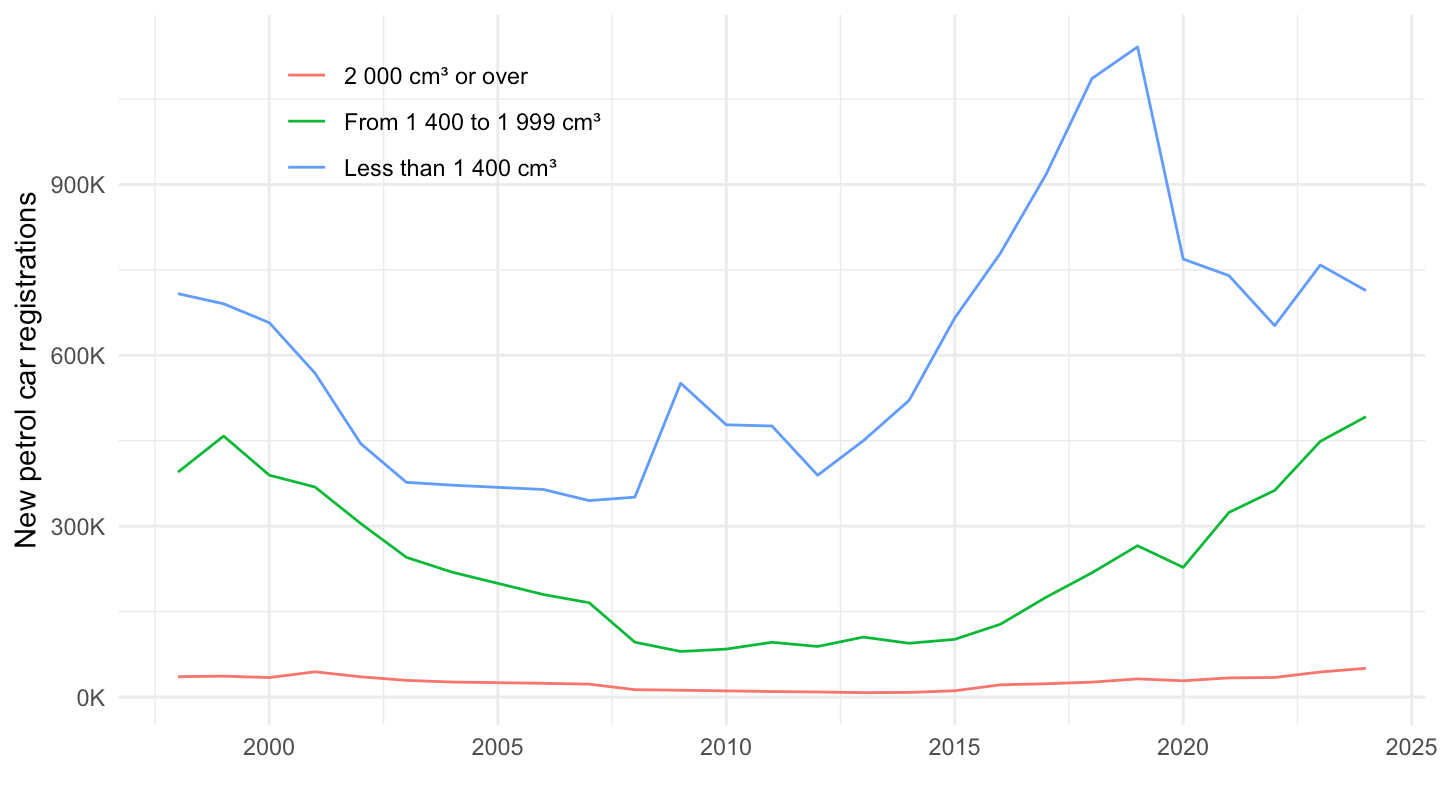
Latest Year by Country
Code
latest_y <- road_eqr_carmot %>%
  filter(geo == "FR",
         engine == "TOTAL",
         mot_nrg == "TOTAL",
         !is.na(values)) %>%
  summarise(m = max(time)) %>%
  pull(m)

road_eqr_carmot %>%
  filter(geo %in% c("FR", "DE", "IT", "ES", "PT", "EU27_2020"),
         engine == "TOTAL",
         mot_nrg %in% c("DIE", "PET", "TOTAL"),
         time == latest_y) %>%
  mutate(values = values/1000) %>%
  select(Geo, Mot_nrg, values) %>%
  spread(Mot_nrg, values) %>%
  arrange(-Total) %>%
print_table_conditional()| Geo | Diesel | Petrol | Total |
|---|---|---|---|
| European Union - 27 countries (from 2020) | 1818.403 | 7161.137 | 10759.959 |
| Germany | 684.509 | 1738.089 | 2817.331 |
| France | 173.114 | 1256.157 | 1781.580 |
| Italy | 310.312 | 1067.243 | 1592.098 |
| Spain | 184.510 | 788.727 | 1067.172 |
| Portugal | 24.072 | 129.437 | 210.411 |
New registrations of passenger cars in Germany, France, Italy
France, Germany, Italy
Code
road_eqr_carmot %>%

  filter(geo %in% c("FR", "DE", "IT"),
         engine == "TOTAL",
         mot_nrg == "TOTAL") %>%
  year_to_date() %>%
  arrange(date) %>%
  mutate(values = values/1000) %>%
  left_join(colors, by = c("Geo" = "country")) %>%
  ggplot(.) + geom_line(aes(x = date, y = values, color = color)) +
  theme_minimal() + xlab("") + ylab("New registrations of passenger cars") +
  scale_x_date(breaks = seq(1960, 2100, 5) %>% paste0("-01-01") %>% as.Date,
               labels = date_format("%Y")) +
  add_3flags + scale_color_identity() +
  scale_y_continuous(breaks = seq(0, 10000, 500),
                     labels = dollar_format(accuracy = 1, prefix = "", suffix = "K"))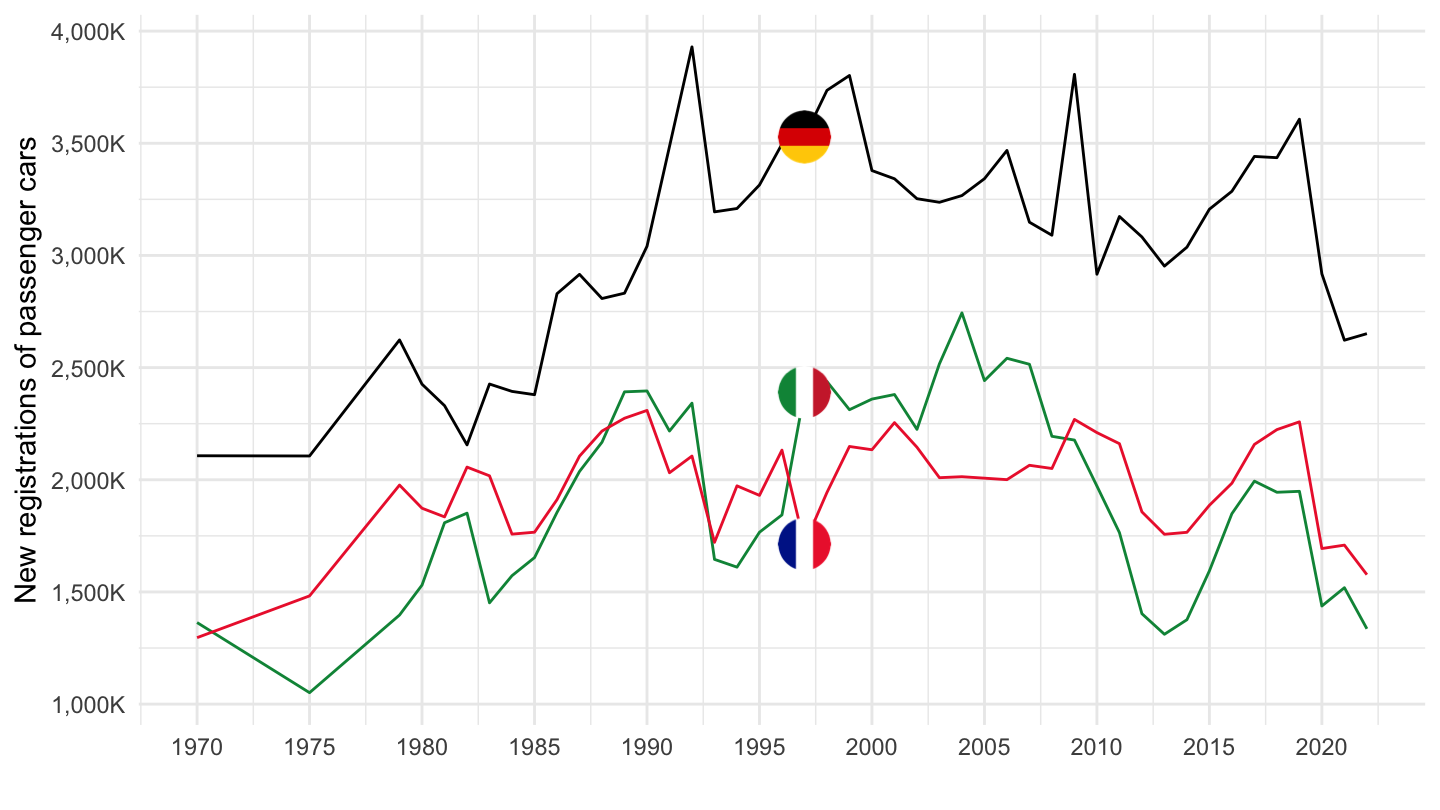
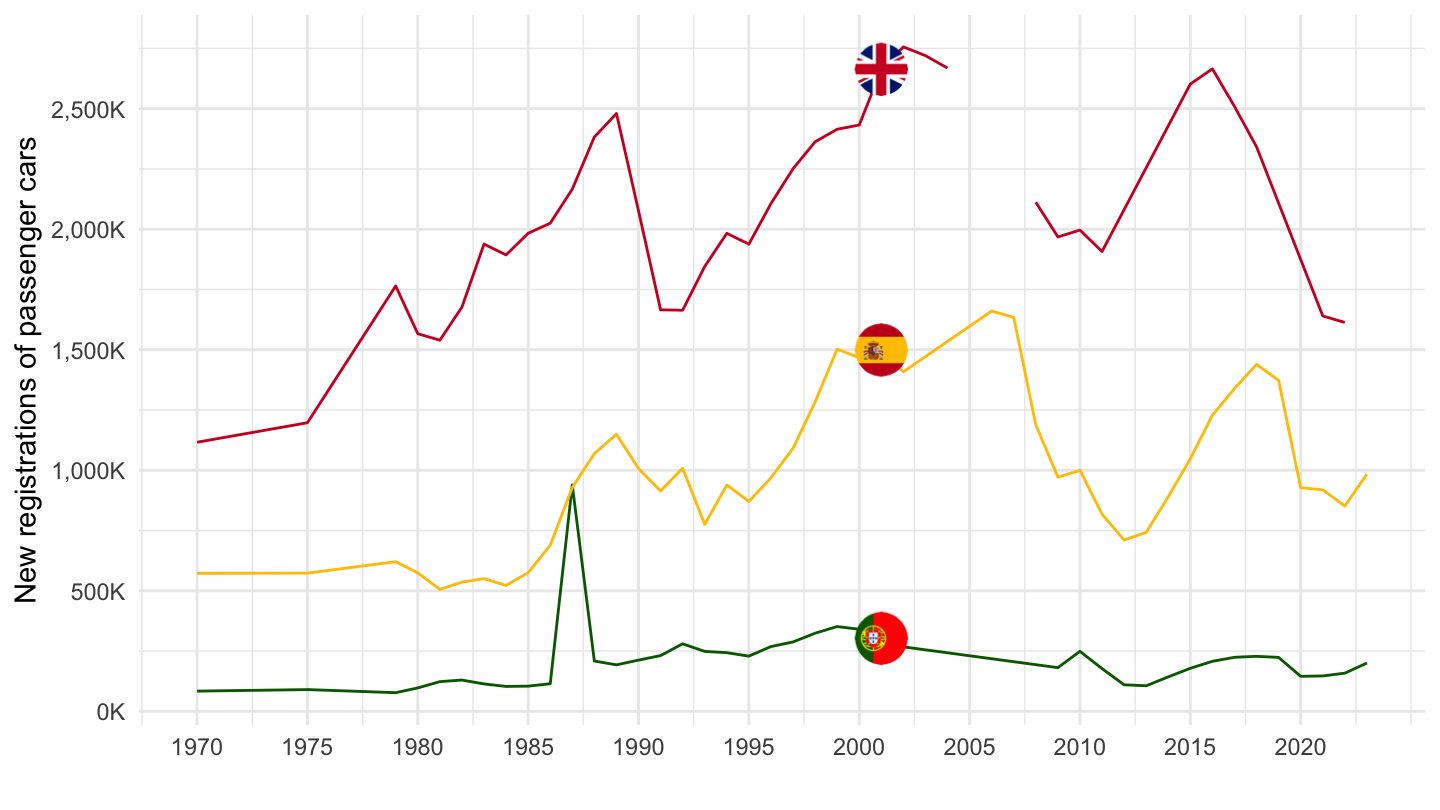
Spain, Portugal, Italy
Code
road_eqr_carmot %>%

  filter(geo %in% c("ES", "PT", "UK"),
         engine == "TOTAL",
         mot_nrg == "TOTAL") %>%
  year_to_date() %>%
  arrange(date) %>%
  mutate(values = values/1000) %>%
  left_join(colors, by = c("Geo" = "country")) %>%
  ggplot(.) + geom_line(aes(x = date, y = values, color = color)) +
  theme_minimal() + xlab("") + ylab("New registrations of passenger cars") +
  scale_x_date(breaks = seq(1960, 2100, 5) %>% paste0("-01-01") %>% as.Date,
               labels = date_format("%Y")) +
  add_3flags + scale_color_identity() +
  scale_y_continuous(breaks = seq(0, 10000, 500),
                     labels = dollar_format(accuracy = 1, prefix = "", suffix = "K"))