Turnover in industry, non domestic market - monthly data - sts_intvnd_m
Data - Eurostat
Info
Last observation: Monthly: 2026M05 (N = 8,432)
First observation: Monthly: 1990M01 (N = 212)
Last data update: 23 jul 2026, 22:09. Last compile: 24 jul 2026, 03:55
Structure
EA20
C
Code
sts_intvnd_m %>%
  bind_rows(sts_intvd_m) %>%
  filter(nace_r2 == "C",
         unit == "I21",
         s_adj == "SCA",
         geo %in% c("EA20")) %>%
  group_by(indic_bt) %>%
  mutate(values = 100*values/values[time == "2005M01"]) %>%

  month_to_date %>%
  filter(date >= as.Date("2005-01-01")) %>%
  ggplot() + ylab("Index of turnover") + xlab("") + theme_minimal() +
  geom_line(aes(x = date, y = values, color = Indic_bt)) +
  scale_x_date(breaks = seq(1920, 2100,2) %>% paste0("-01-01") %>% as.Date,
               labels = date_format("%Y")) +
  theme(legend.position = c(0.3, 0.85),
        legend.title = element_blank()) +
  scale_y_log10(breaks = seq(-60, 300, 10))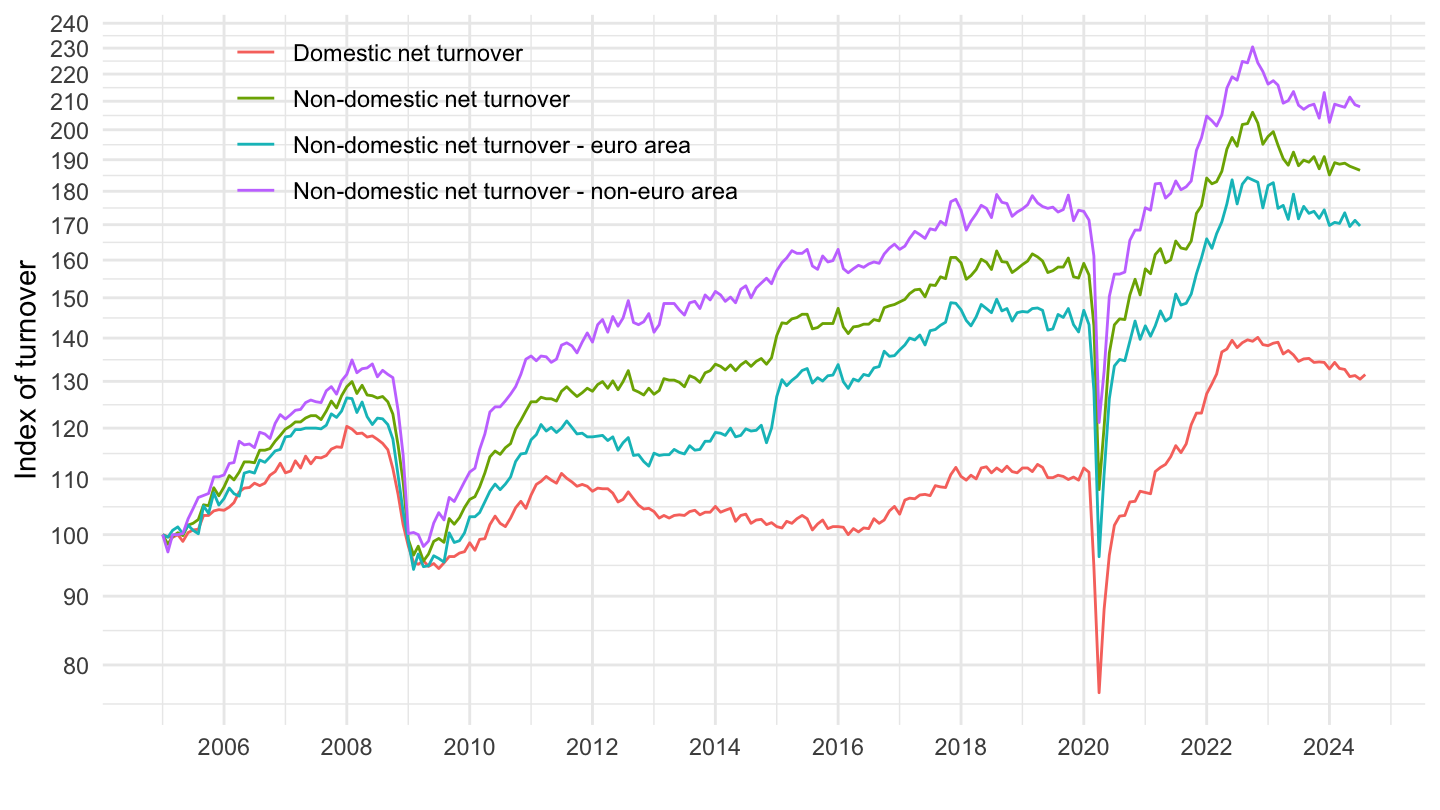
Germany - Different Industries
C10 - Manufacture of food products
Code
sts_intvnd_m %>%
  bind_rows(sts_intvd_m) %>%
  filter(nace_r2 == "C10",
         unit == "I21",
         s_adj == "SCA",
         geo %in% c("DE")) %>%
  group_by(indic_bt) %>%
  mutate(values = 100*values/values[time == "2004M01"]) %>%

  month_to_date %>%
  filter(date <= as.Date("2020-07-01"),
         date >= as.Date("2000-01-01")) %>%
  ggplot() + ylab("Index of turnover - Non domestic market") + xlab("") + theme_minimal() +
  geom_line(aes(x = date, y = values, color = Indic_bt)) +

  scale_x_date(breaks = seq(1920, 2100,2) %>% paste0("-01-01") %>% as.Date,
               labels = date_format("%Y")) +
  theme(legend.position = c(0.3, 0.85),
        legend.title = element_blank()) +
  scale_y_log10(breaks = seq(-60, 300, 10))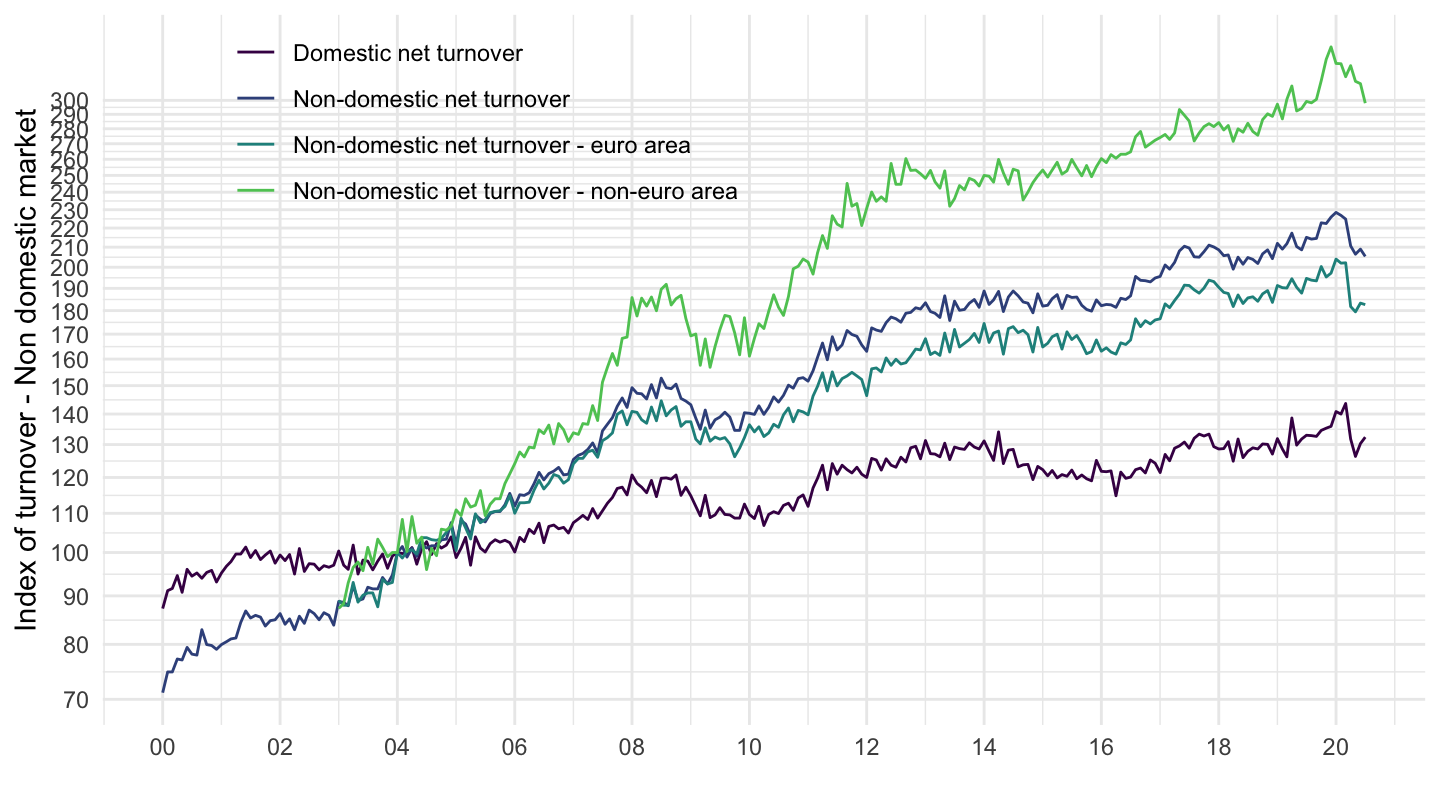
C29 - Manufacture of motor vehicles, trailers and semi-trailers
Code
sts_intvnd_m %>%
  bind_rows(sts_intvd_m) %>%
  filter(nace_r2 == "C29",
         unit == "I21",
         s_adj == "SCA",
         geo %in% c("DE")) %>%
  group_by(indic_bt) %>%
  mutate(values = 100*values/values[time == "2004M01"]) %>%

  month_to_date %>%
  filter(date <= as.Date("2020-07-01"),
         date >= as.Date("2000-01-01")) %>%
  ggplot() + ylab("Index of turnover - Non domestic market") + xlab("") + theme_minimal() +
  geom_line(aes(x = date, y = values, color = Indic_bt)) +

  scale_x_date(breaks = seq(1920, 2100,2) %>% paste0("-01-01") %>% as.Date,
               labels = date_format("%Y")) +
  theme(legend.position = c(0.3, 0.35),
        legend.title = element_blank()) +
  scale_y_log10(breaks = seq(-60, 300, 10))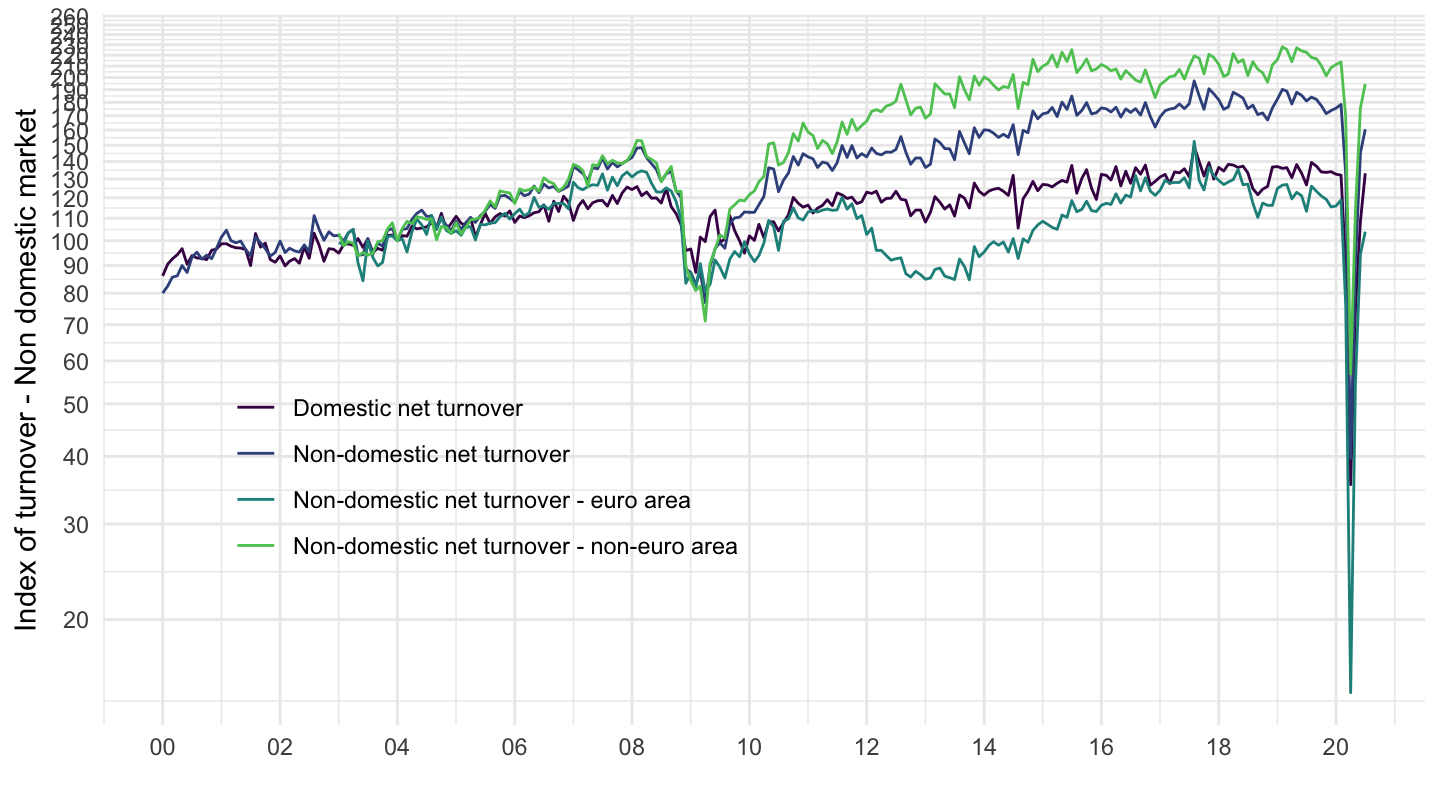
C13-C15 - Manufacture of textiles, wearing apparel, leather and related products
Code
sts_intvnd_m %>%
  bind_rows(sts_intvd_m) %>%
  filter(nace_r2 == "C13-C15",
         unit == "I21",
         s_adj == "SCA",
         geo %in% c("DE")) %>%
  group_by(indic_bt) %>%

  month_to_date %>%
  filter(date <= as.Date("2020-07-01"),
         date >= as.Date("2000-01-01")) %>%
  ggplot() + ylab("Index of turnover - Non domestic market") + xlab("") + theme_minimal() +
  geom_line(aes(x = date, y = values, color = Indic_bt)) +

  scale_x_date(breaks = seq(1920, 2100,2) %>% paste0("-01-01") %>% as.Date,
               labels = date_format("%Y")) +
  theme(legend.position = c(0.3, 0.25),
        legend.title = element_blank()) +
  scale_y_log10(breaks = seq(-60, 300, 10))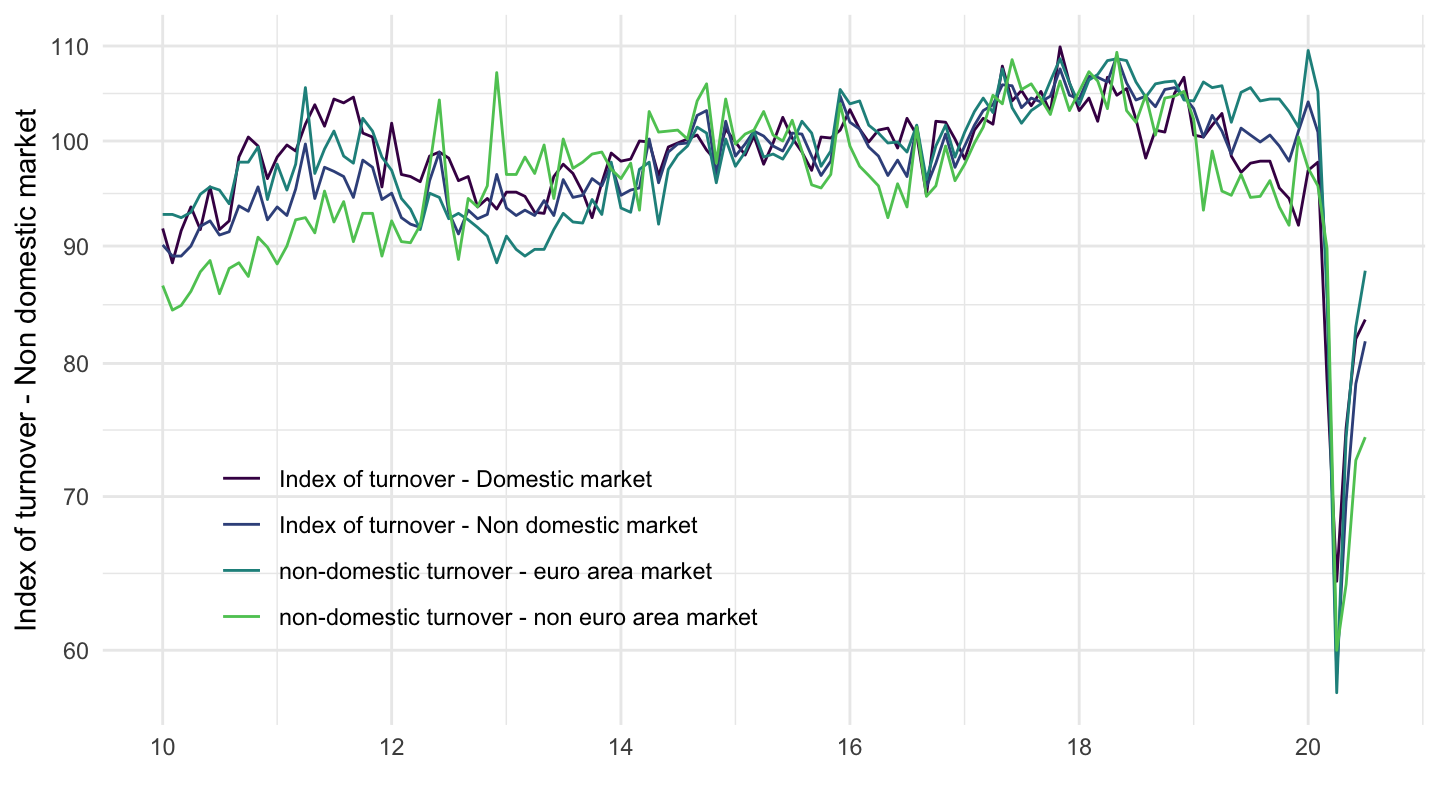
C20 - Manufacture of chemicals and chemical products
Code
sts_intvnd_m %>%
  bind_rows(sts_intvd_m) %>%
  filter(nace_r2 == "C20",
         unit == "I21",
         s_adj == "SCA",
         geo %in% c("DE")) %>%
  group_by(indic_bt) %>%
  mutate(values = 100*values/values[time == "2004M01"]) %>%

  month_to_date %>%
  filter(date <= as.Date("2020-07-01"),
         date >= as.Date("2000-01-01")) %>%
  ggplot() + ylab("Index of turnover - Non domestic market") + xlab("") + theme_minimal() +
  geom_line(aes(x = date, y = values, color = Indic_bt)) +

  scale_x_date(breaks = seq(1920, 2100,2) %>% paste0("-01-01") %>% as.Date,
               labels = date_format("%Y")) +
  theme(legend.position = c(0.3, 0.85),
        legend.title = element_blank()) +
  scale_y_log10(breaks = seq(-60, 300, 10))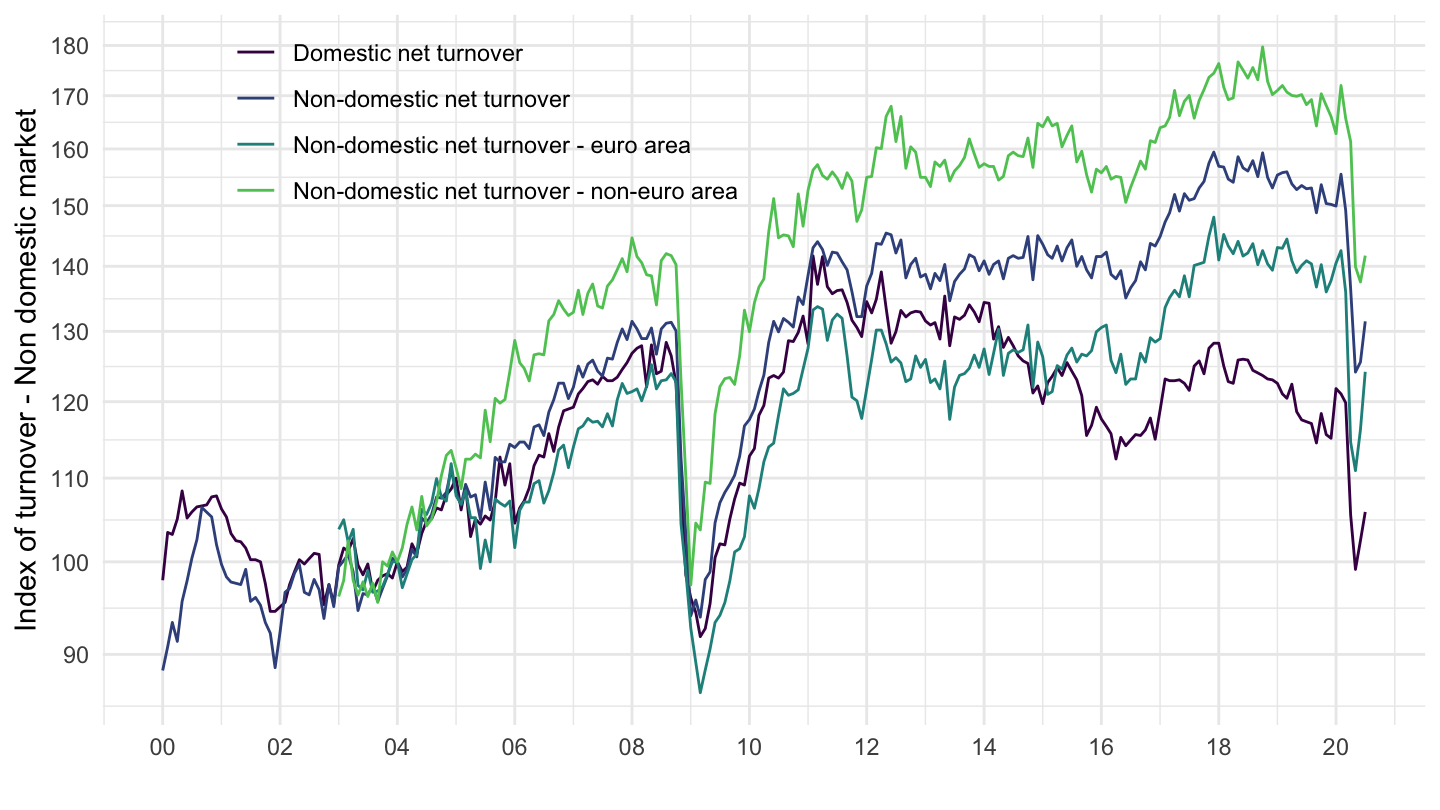
C30 - Manufacture of other transport equipment
Code
sts_intvnd_m %>%
  bind_rows(sts_intvd_m) %>%
  filter(nace_r2 == "C30",
         unit == "I21",
         s_adj == "SCA",
         geo %in% c("DE")) %>%
  group_by(indic_bt) %>%
  mutate(values = 100*values/values[time == "2004M01"]) %>%

  month_to_date %>%
  filter(date <= as.Date("2020-07-01"),
         date >= as.Date("2000-01-01")) %>%
  ggplot() + ylab("Index of turnover - Non domestic market") + xlab("") + theme_minimal() +
  geom_line(aes(x = date, y = values, color = Indic_bt)) +

  scale_x_date(breaks = seq(1920, 2100,2) %>% paste0("-01-01") %>% as.Date,
               labels = date_format("%Y")) +
  theme(legend.position = c(0.3, 0.85),
        legend.title = element_blank()) +
  scale_y_log10(breaks = seq(-60, 300, 10))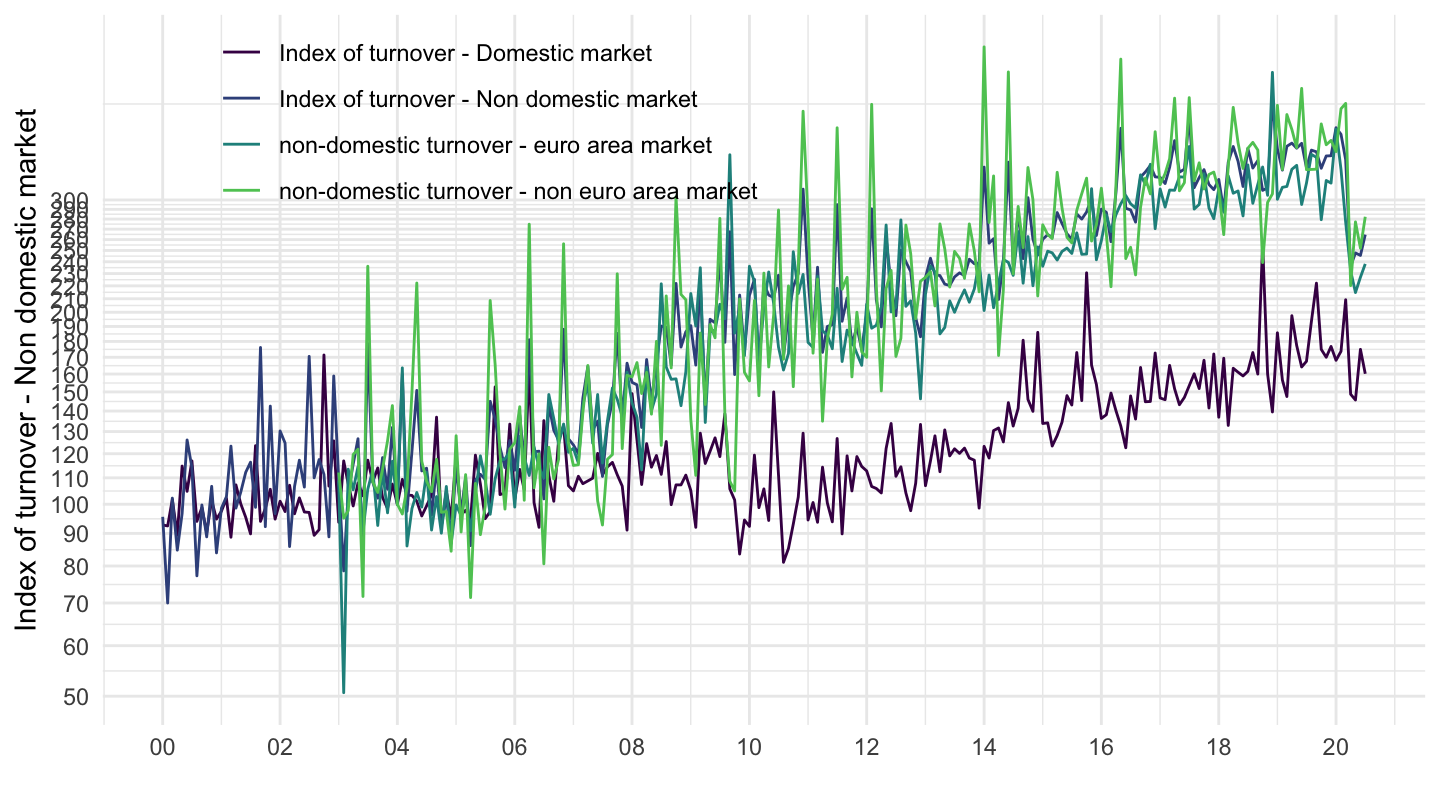
Individual Countries
France
Code
sts_intvnd_m %>%
  bind_rows(sts_intvd_m) %>%
  filter(nace_r2 == "C",
         unit == "I21",
         s_adj == "SCA",
         geo %in% c("FR")) %>%
  group_by(indic_bt) %>%
  mutate(values = 100*values/values[time == "2000M01"]) %>%

  month_to_date %>%
  filter(date <= as.Date("2020-07-01")) %>%
  ggplot() + ylab("Index of turnover") + xlab("") + theme_minimal() +
  geom_line(aes(x = date, y = values, color = Indic_bt)) +

  scale_x_date(breaks = seq(1920, 2100,2) %>% paste0("-01-01") %>% as.Date,
               labels = date_format("%Y")) +
  theme(legend.position = c(0.3, 0.85),
        legend.title = element_blank()) +
  scale_y_log10(breaks = seq(-60, 300, 10))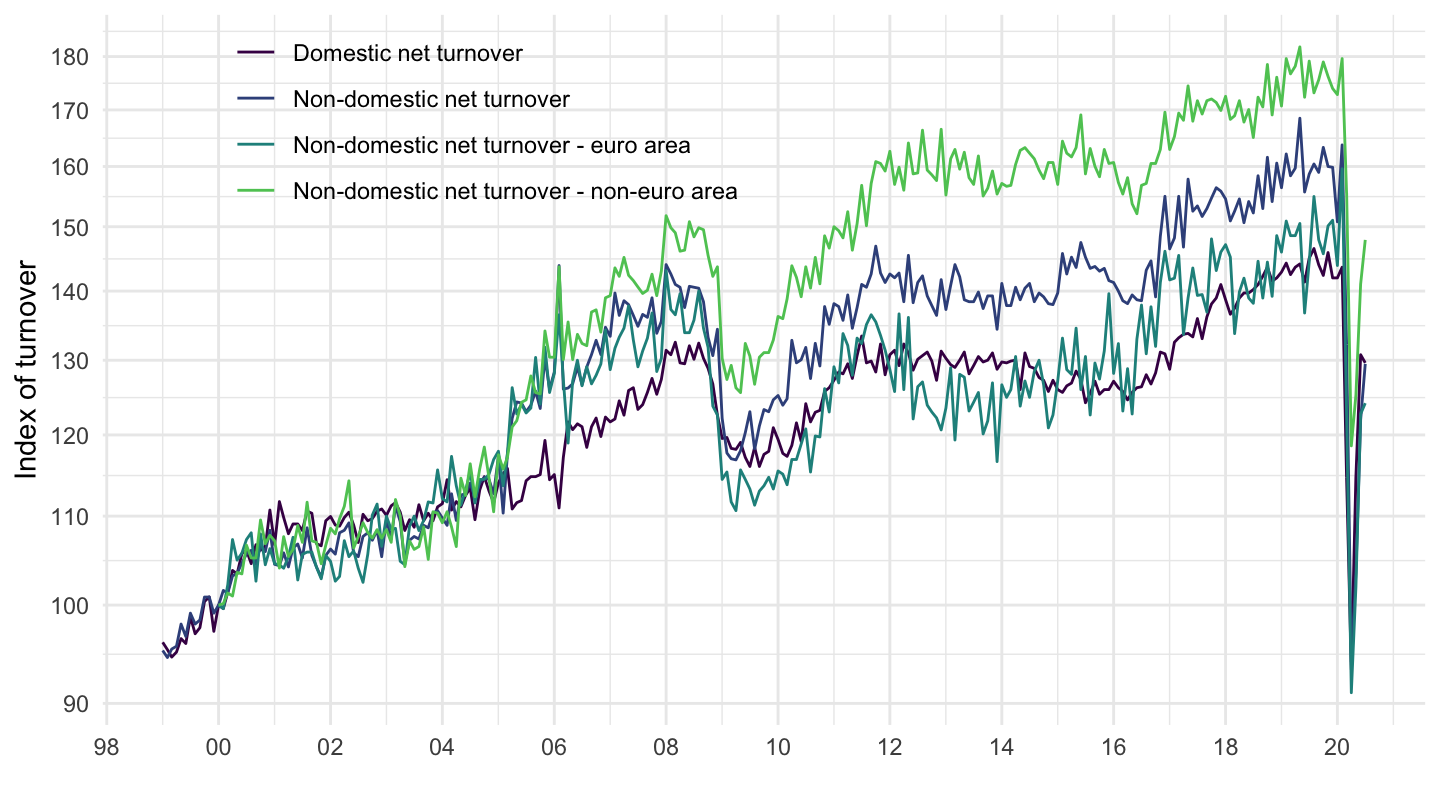
Germany
All
Code
sts_intvnd_m %>%
  bind_rows(sts_intvd_m) %>%
  filter(nace_r2 == "C",
         unit == "I21",
         s_adj == "SCA",
         geo %in% c("DE")) %>%
  group_by(indic_bt) %>%
  mutate(values = 100*values/values[time == "2003M01"]) %>%

  month_to_date %>%
  ggplot() + ylab("Index of turnover - Non domestic market") + xlab("") + theme_minimal() +
  geom_line(aes(x = date, y = values, color = Indic_bt)) +

  scale_x_date(breaks = seq(1920, 2100,2) %>% paste0("-01-01") %>% as.Date,
               labels = date_format("%Y")) +
  theme(legend.position = c(0.3, 0.85),
        legend.title = element_blank()) +
  scale_y_log10(breaks = seq(-60, 300, 10))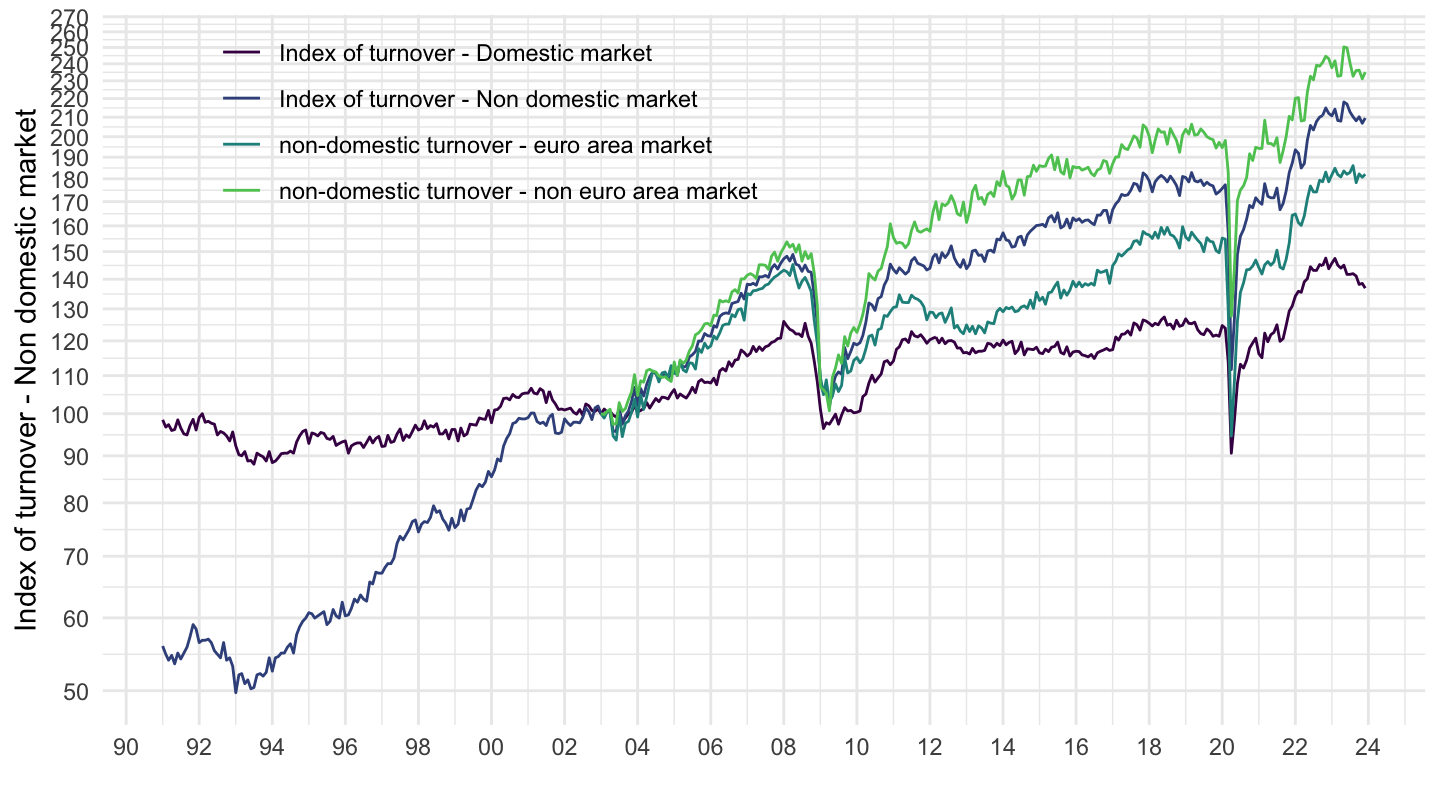
1995-
Code
sts_intvnd_m %>%
  bind_rows(sts_intvd_m) %>%
  filter(nace_r2 == "C",
         unit == "I21",
         s_adj == "SCA",
         geo %in% c("DE")) %>%
  group_by(indic_bt) %>%
  mutate(values = 100*values/values[time == "2004M01"]) %>%

  month_to_date %>%
  filter(date >= as.Date("1995-01-01")) %>%
  ggplot() + ylab("Index of turnover - Non domestic market") + xlab("") + theme_minimal() +
  geom_line(aes(x = date, y = values, color = Indic_bt)) +

  scale_x_date(breaks = seq(1920, 2100,2) %>% paste0("-01-01") %>% as.Date,
               labels = date_format("%Y")) +
  theme(legend.position = c(0.3, 0.85),
        legend.title = element_blank()) +
  scale_y_log10(breaks = seq(-60, 300, 10))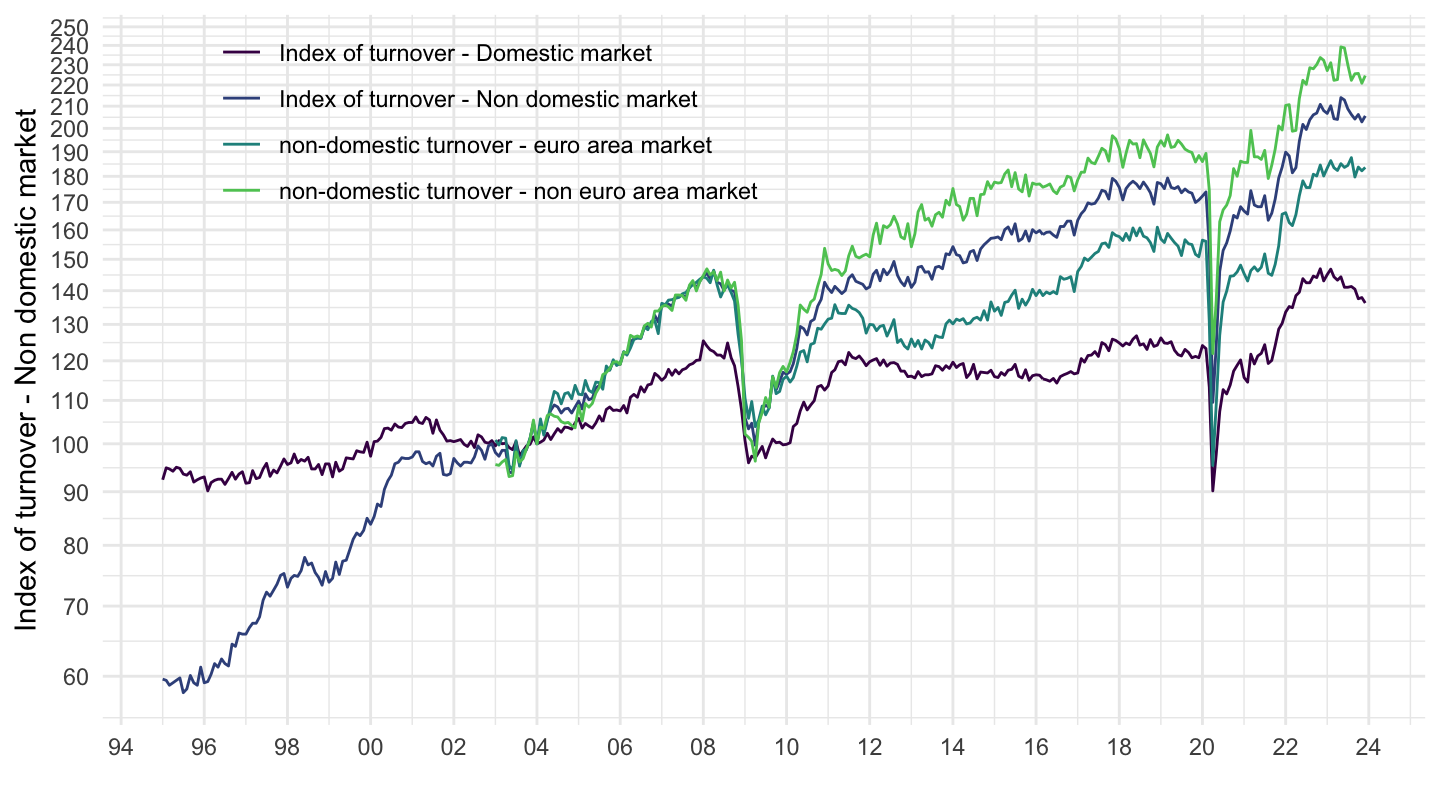
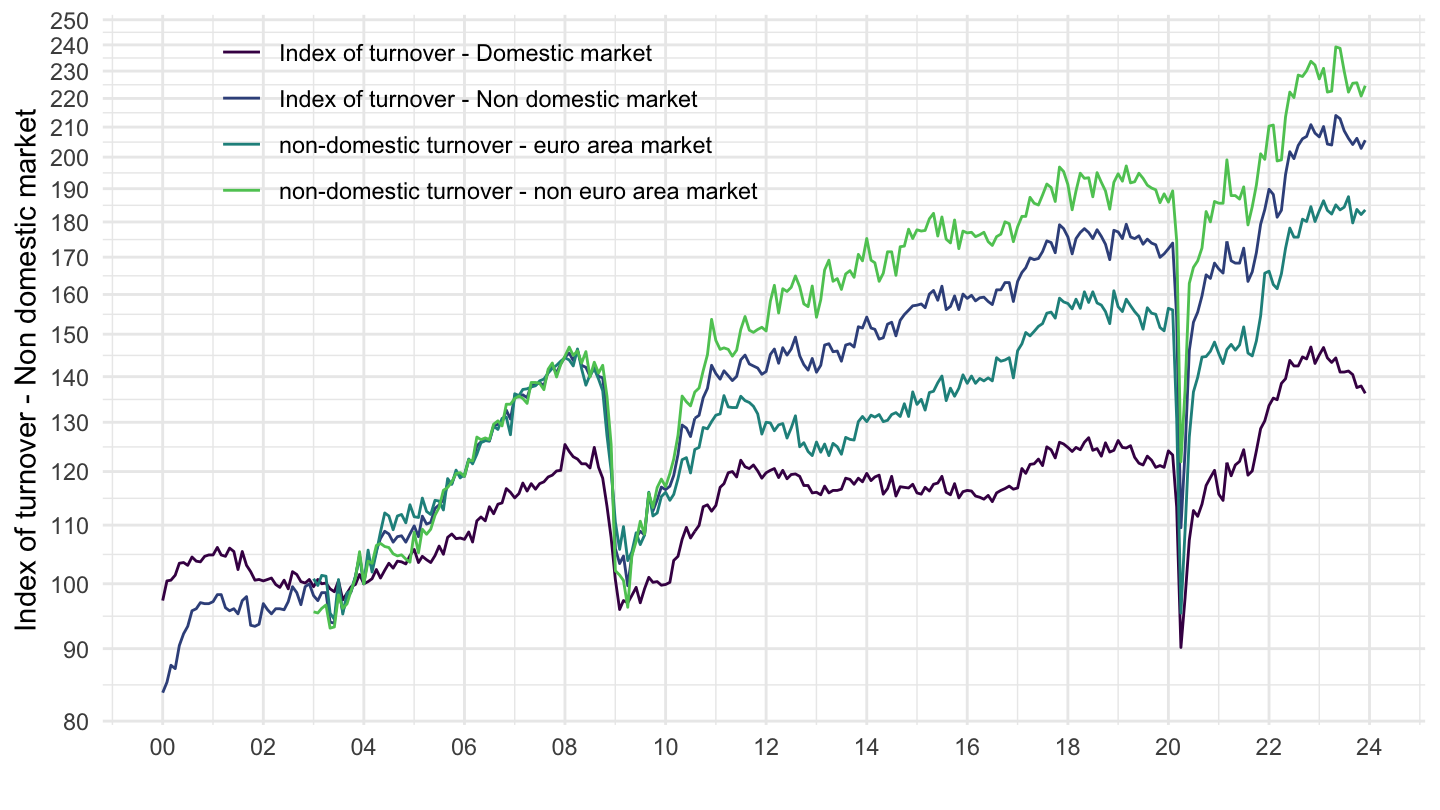
2000-
Code
sts_intvnd_m %>%
  bind_rows(sts_intvd_m) %>%
  filter(nace_r2 == "C",
         unit == "I21",
         s_adj == "SCA",
         geo %in% c("DE")) %>%
  group_by(indic_bt) %>%
  mutate(values = 100*values/values[time == "2004M01"]) %>%

  month_to_date %>%
  filter(date >= as.Date("2000-01-01")) %>%
  ggplot() + ylab("Index of turnover - Non domestic market") + xlab("") + theme_minimal() +
  geom_line(aes(x = date, y = values, color = Indic_bt)) +

  scale_x_date(breaks = seq(1920, 2100,2) %>% paste0("-01-01") %>% as.Date,
               labels = date_format("%Y")) +
  theme(legend.position = c(0.3, 0.85),
        legend.title = element_blank()) +
  scale_y_log10(breaks = seq(-60, 300, 10))