| source | dataset | Title | .html | .rData |
|---|---|---|---|---|
| eurostat | nama_10_lp_ulc | Labour productivity and unit labour costs | 2026-02-03 | 2026-02-04 |
| eurostat | earn_mw_cur | Monthly minimum wages - bi-annual data | 2026-02-03 | 2026-02-03 |
| eurostat | ei_lmlc_q | Labour cost index, nominal value - quarterly data | 2026-02-03 | 2026-02-03 |
| eurostat | lc_lci_lev | Labour cost levels by NACE Rev. 2 activity | 2026-02-03 | 2026-02-04 |
| eurostat | lc_lci_r2_q | Labour cost index by NACE Rev. 2 activity - nominal value, quarterly data | 2026-02-03 | 2026-02-04 |
| eurostat | namq_10_lp_ulc | Labour productivity and unit labour costs | 2026-02-03 | 2026-02-04 |
| eurostat | tps00155 | Minimum wages | 2026-02-03 | 2026-02-03 |
| fred | wage | Wage | 2026-02-04 | 2026-02-04 |
| ilo | EAR_4MTH_SEX_ECO_CUR_NB_A | Mean nominal monthly earnings of employees by sex and economic activity -- Harmonized series | 2024-06-20 | 2023-06-01 |
| ilo | EAR_XEES_SEX_ECO_NB_Q | Mean nominal monthly earnings of employees by sex and economic activity -- Harmonized series | 2024-06-20 | 2023-06-01 |
| oecd | AV_AN_WAGE | Average annual wages | 2026-01-16 | 2026-01-10 |
| oecd | AWCOMP | Taxing Wages - Comparative tables | 2026-01-16 | 2023-09-09 |
| oecd | EAR_MEI | Hourly Earnings (MEI) | 2024-04-16 | 2024-04-16 |
| oecd | HH_DASH | Household Dashboard | 2026-01-16 | 2023-09-09 |
| oecd | MIN2AVE | Minimum relative to average wages of full-time workers - MIN2AVE | 2026-01-16 | 2023-09-09 |
| oecd | RMW | Real Minimum Wages - RMW | 2026-01-16 | 2024-03-12 |
| oecd | ULC_EEQ | Unit labour costs and labour productivity (employment based), Total economy | 2026-01-16 | 2024-04-15 |
Labour productivity and unit labour costs
Data - Eurostat
Info
Data on wages
LAST_COMPILE
| LAST_COMPILE |
|---|
| 2026-02-05 |
Last
Code
nama_10_lp_ulc %>%
  group_by(time) %>%
  summarise(Nobs = n()) %>%
  arrange(desc(time)) %>%
  head(1) %>%
print_table_conditional()| time | Nobs |
|---|---|
| 2025 | 70 |
na_item
Code
nama_10_lp_ulc %>%
  left_join(na_item, by = "na_item") %>%
  group_by(na_item, Na_item) %>%
  summarise(Nobs = n()) %>%
  arrange(-Nobs) %>%
{if (is_html_output()) print_table(.) else .}| na_item | Na_item | Nobs |
|---|---|---|
| RLPR_PER | Real labour productivity per person | 7974 |
| NULC_PER | Nominal unit labour cost based on persons | 7816 |
| RLPR_HW | Real labour productivity per hour worked | 7792 |
| NULC_HW | Nominal unit labour cost based on hours worked | 7785 |
| EMP_HAB | Total employment (employed persons) per capita | 6138 |
| HW_EMP | Hours worked per employed person | 5966 |
| HW_HAB | Hours worked per capita | 5958 |
| D1_SAL_PER | Compensation per employee | 5619 |
| D1_SAL_HW | Compensation of employees per hour worked | 5596 |
| NLPR_PER | Nominal labour productivity per person | 971 |
| NLPR_HW | Nominal labour productivity per hour worked | 947 |
unit
Code
nama_10_lp_ulc %>%
  left_join(unit, by = "unit") %>%
  group_by(unit, Unit) %>%
  summarise(Nobs = n()) %>%
  arrange(-Nobs) %>%
  {if (is_html_output()) datatable(., filter = 'top', rownames = F) else .}
geo
Code
nama_10_lp_ulc %>%
  left_join(geo, by = "geo") %>%
  group_by(geo, Geo) %>%
  summarise(Nobs = n()) %>%
  arrange(-Nobs) %>%
  mutate(Geo = ifelse(geo == "DE", "Germany", Geo)) %>%
  mutate(Flag = gsub(" ", "-", str_to_lower(Geo)),
         Flag = paste0('<img src="../../bib/flags/vsmall/', Flag, '.png" alt="Flag">')) %>%
  select(Flag, everything()) %>%
  {if (is_html_output()) datatable(., filter = 'top', rownames = F, escape = F) else .}
na_item: Glance
Code
nama_10_lp_ulc %>%
  filter(geo %in% c("FR", "DE"),
         time == "2019") %>%
  year_to_date %>%
  left_join(na_item, by = "na_item") %>%
  left_join(geo, by = "geo") %>%
  mutate(Geo = ifelse(geo == "DE", "Germany", Geo)) %>%
  select(na_item, Na_item, values, unit, Geo) %>%
  mutate(Geo = gsub(" ", "-", str_to_lower(Geo)),
         Geo = paste0('<img src="../../bib/flags/vsmall/', Geo, '.png" alt="Flag">')) %>%
  spread(Geo, values) %>%
  {if (is_html_output()) datatable(., filter = 'top', rownames = F, escape = F) else .}
France
Compare per person
All
Code
nama_10_lp_ulc %>%
  filter(geo %in% c("FR"),
         na_item %in% c("RLPR_PER", "D1_SAL_PER", "NULC_PER"),
         unit %in% c("EUR", "I15")) %>%
  year_to_date %>%
  left_join(na_item, by = "na_item") %>%
  group_by(na_item) %>%
  arrange(date) %>%
  mutate(values = 100*values/values[1]) %>%
  ggplot + theme_minimal() + xlab("") + ylab("Per person") +
  geom_line(aes(x = date, y = values, color = Na_item)) +
  #scale_color_manual(values = viridis(6)[1:5]) +
  theme(legend.position = c(0.26, 0.9),
        legend.title = element_blank()) +
  scale_x_date(breaks = as.Date(paste0(seq(1960, 2100, 5), "-01-01")),
               labels = date_format("%Y")) +
  scale_y_log10(breaks = seq(100, 1000, 100))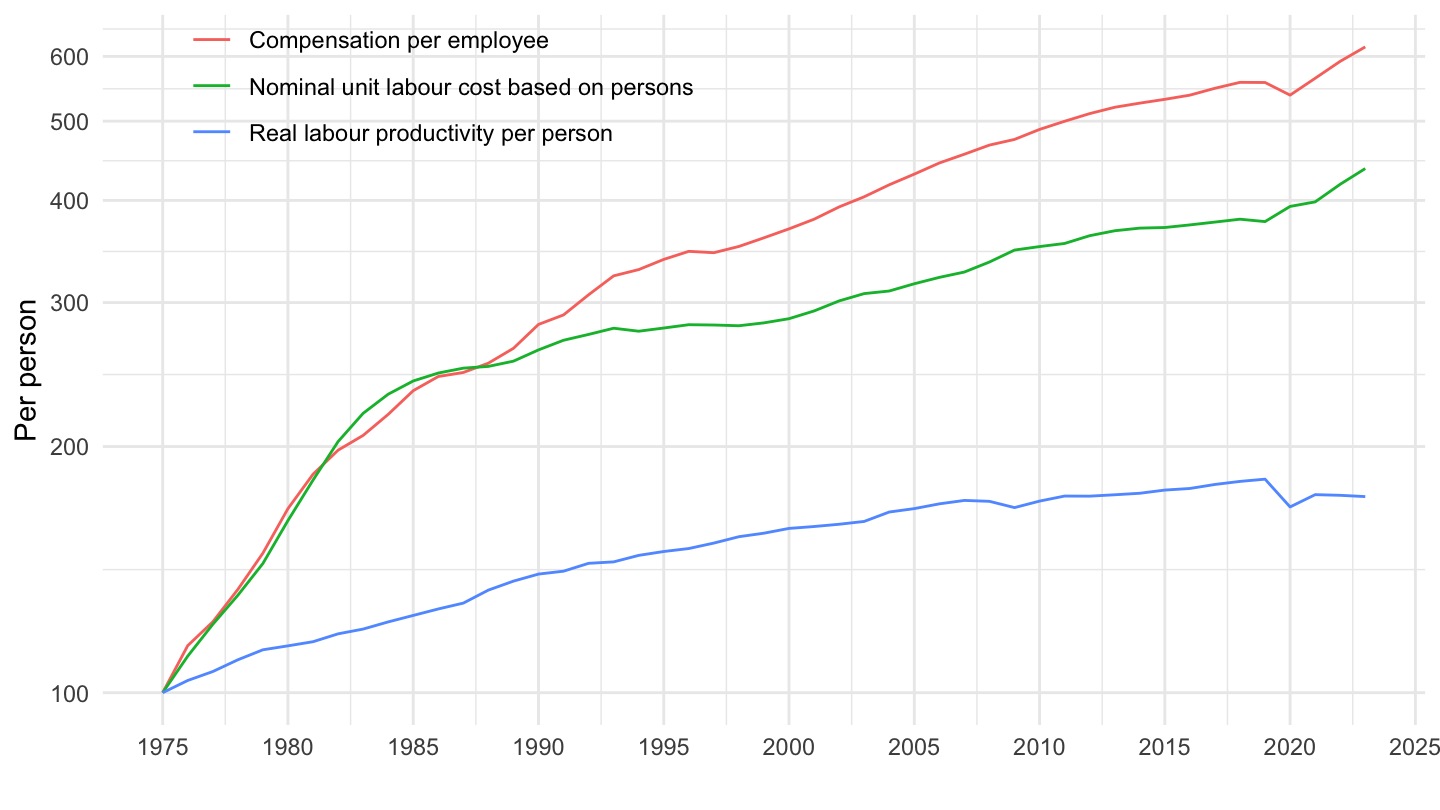
1995-
Code
nama_10_lp_ulc %>%
  filter(geo %in% c("FR"),
         na_item %in% c("RLPR_PER", "D1_SAL_PER", "NULC_PER"),
         unit %in% c("EUR", "I15")) %>%
  year_to_date %>%
  left_join(na_item, by = "na_item") %>%
  group_by(na_item) %>%
  arrange(date) %>%
  filter(date >= as.Date("1995-01-01")) %>%
  mutate(values = 100*values/values[1]) %>%
  ggplot + theme_minimal() + xlab("") + ylab("Per Person") +
  geom_line(aes(x = date, y = values, color = Na_item)) +
  #scale_color_manual(values = viridis(6)[1:5]) +
  theme(legend.position = c(0.26, 0.9),
        legend.title = element_blank()) +
  scale_x_date(breaks = as.Date(paste0(seq(1960, 2100, 5), "-01-01")),
               labels = date_format("%Y")) +
  scale_y_log10(breaks = seq(100, 1000, 10))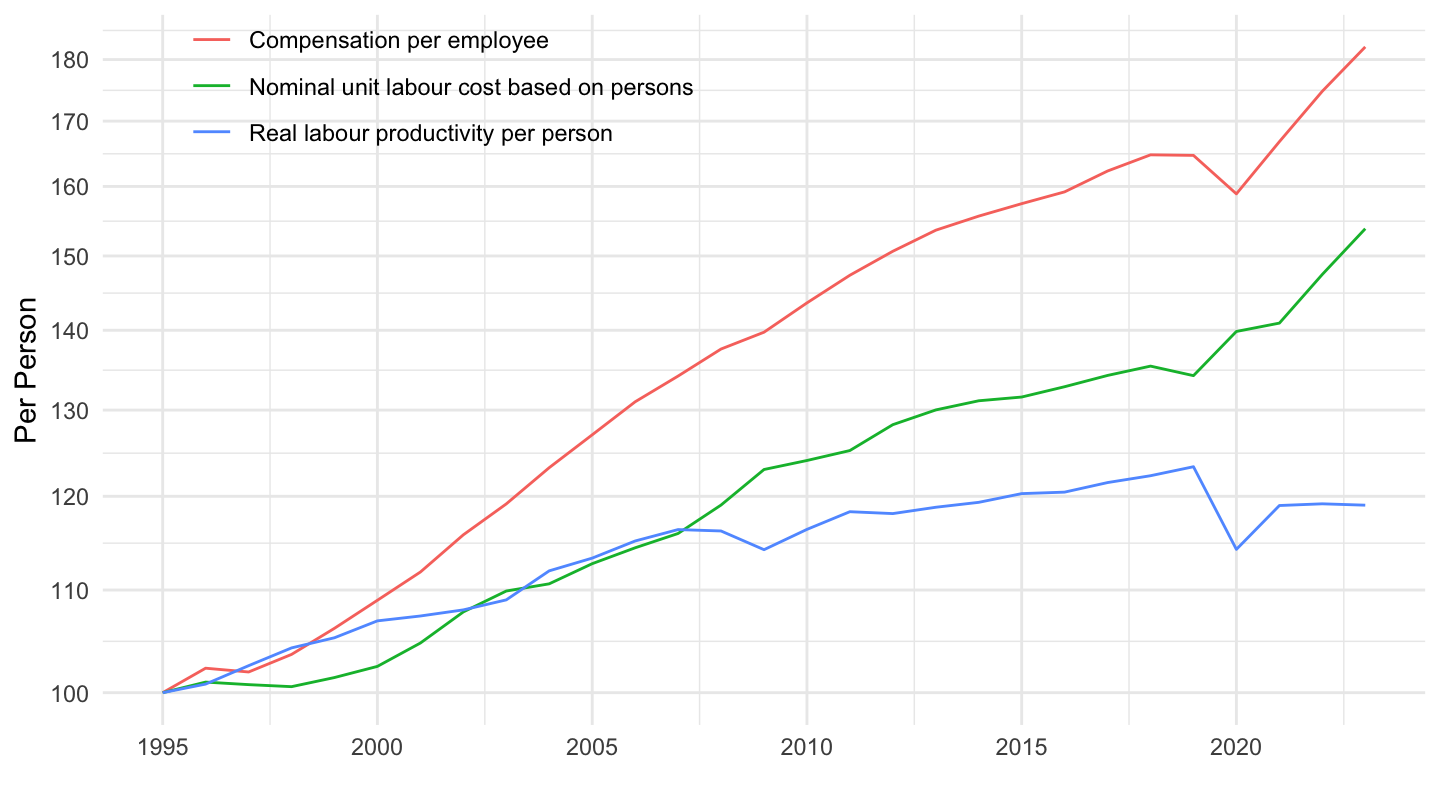
D1_SAL_HW - Values
All
Code
nama_10_lp_ulc %>%
  filter(geo %in% c("FR"),
         na_item == "D1_SAL_HW",
         unit %in% c("EUR", "NAC", "PPS_EU27_2020")) %>%
  year_to_date %>%
  left_join(unit, by = "unit") %>%
  ggplot + theme_minimal() + xlab("") + ylab("Compensation of employees per hour worked") +
  geom_line(aes(x = date, y = values, color = Unit)) +
  #scale_color_manual(values = viridis(6)[1:5]) +
  theme(legend.position = c(0.26, 0.9),
        legend.title = element_blank()) +
  scale_x_date(breaks = as.Date(paste0(seq(1960, 2100, 5), "-01-01")),
               labels = date_format("%Y")) +
  scale_y_log10(breaks = seq(0, 200, 5),
                     labels = scales::dollar_format(a= 1, su = "€", p = ""))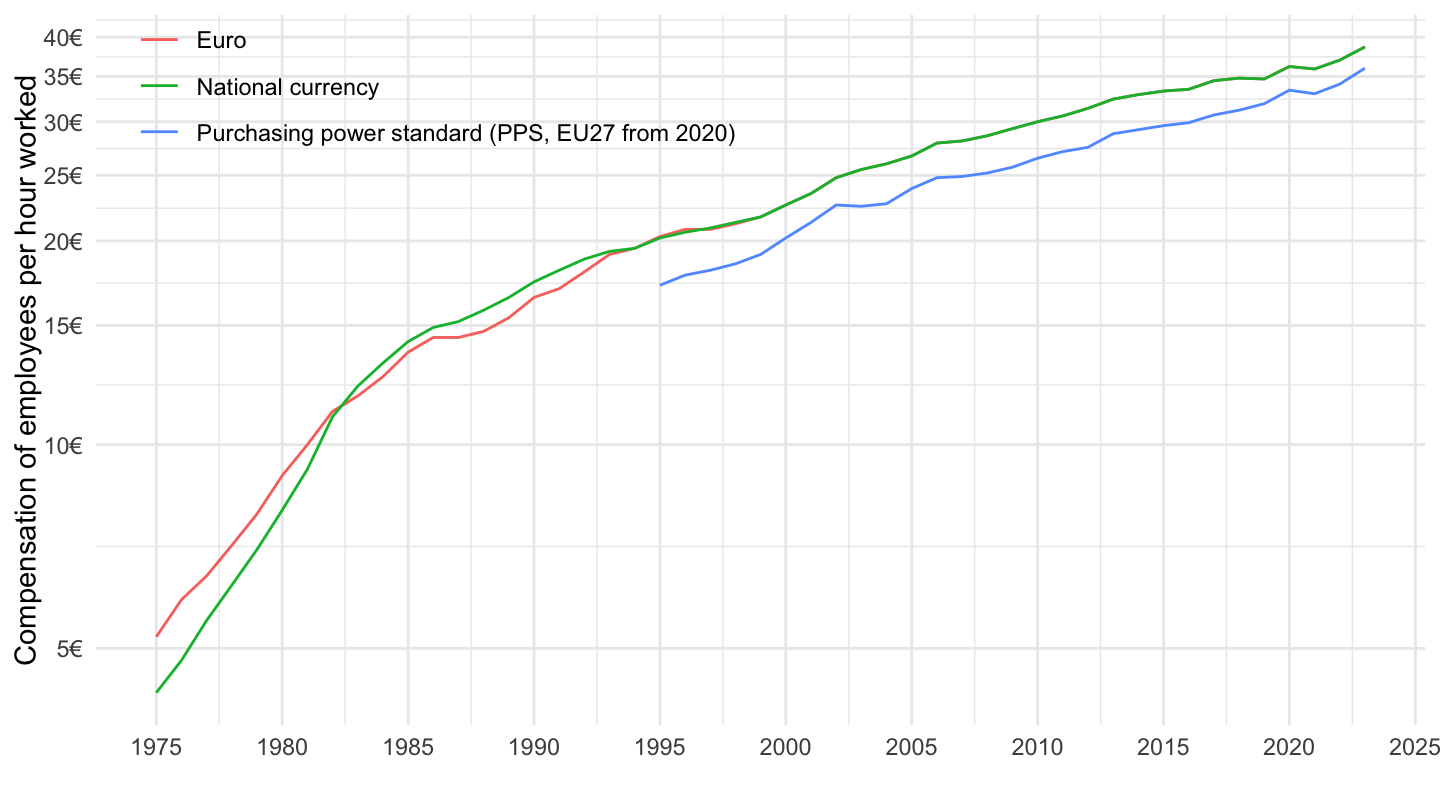
1995-
Code
nama_10_lp_ulc %>%
  filter(geo %in% c("FR"),
         na_item == "D1_SAL_HW",
         unit %in% c("EUR", "NAC", "PPS_EU27_2020")) %>%
  year_to_date %>%
  filter(date >= as.Date("1995-01-01")) %>%
  left_join(unit, by = "unit") %>%
  ggplot + theme_minimal() + xlab("") + ylab("Compensation of employees per hour worked") +
  geom_line(aes(x = date, y = values, color = Unit, linetype = Unit)) +
  theme(legend.position = c(0.3, 0.85),
        legend.title = element_blank()) +
  scale_x_date(breaks = as.Date(paste0(seq(1960, 2100, 5), "-01-01")),
               labels = date_format("%Y")) +
  scale_y_log10(breaks = seq(0, 200, 5),
                     labels = scales::dollar_format(a= 1, su = "€", p = ""))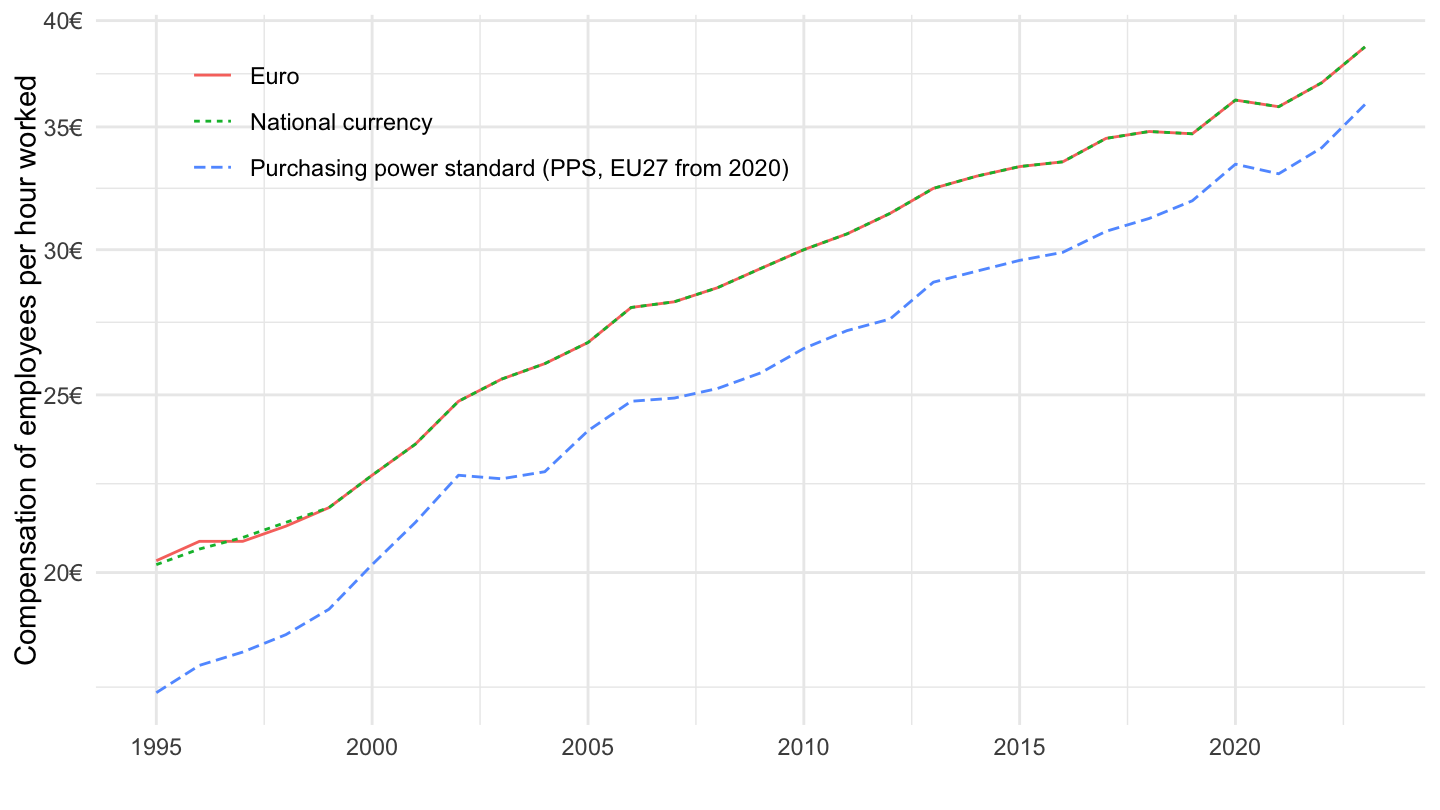
D1_SAL_PER - Index
All
Code
nama_10_lp_ulc %>%
  filter(geo %in% c("FR"),
         na_item == "D1_SAL_PER") %>%
  year_to_date %>%
  left_join(unit, by = "unit") %>%
  group_by(Unit) %>%
  arrange(date) %>%
  mutate(values = 100*values / values[1]) %>%
  ggplot + theme_minimal() + xlab("") + ylab("Compensation of employees per hour worked") +
  geom_line(aes(x = date, y = values, color = Unit)) +
  theme(legend.position = c(0.45, 0.85),
        legend.title = element_blank()) +
  scale_x_date(breaks = as.Date(paste0(seq(1960, 2100, 5), "-01-01")),
               labels = date_format("%Y")) +
  scale_y_log10(breaks = c(seq(0, 2000, 100), seq(100, 200, 10)),
                     labels = scales::dollar_format(a= 1, su = "", p = ""))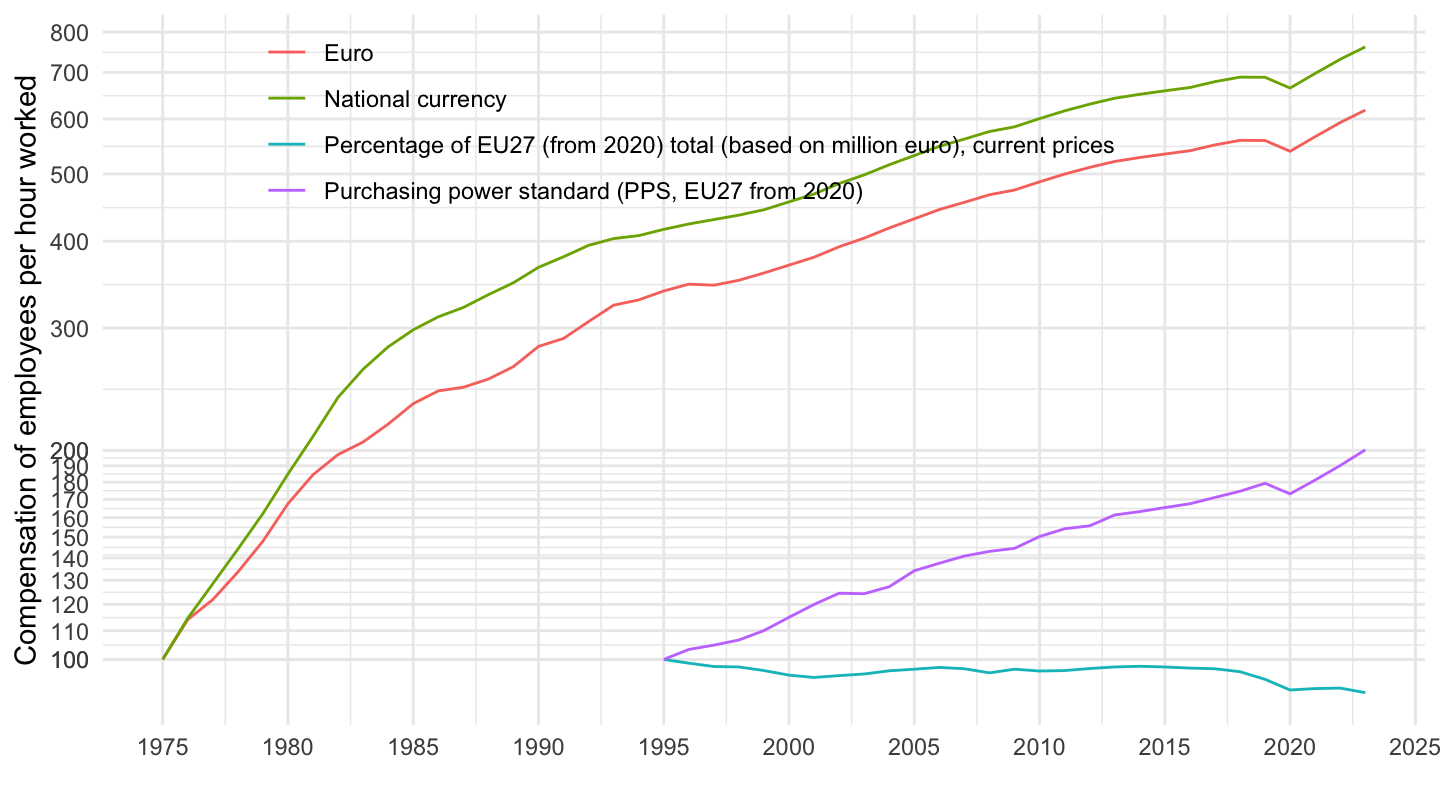
1995-
Code
nama_10_lp_ulc %>%
  filter(geo %in% c("FR"),
         na_item == "D1_SAL_PER") %>%
  year_to_date %>%
  group_by(date) %>%
  filter(n() == 5) %>%
  filter(date >= as.Date("1995-01-01")) %>%
  left_join(unit, by = "unit") %>%
  group_by(Unit) %>%
  mutate(values = 100*values / values[date == as.Date("1995-01-01")]) %>%
  ggplot + theme_minimal() + xlab("") + ylab("Compensation of employees, Per Person (1995 = 100)") +
  geom_line(aes(x = date, y = values, color = Unit)) +
  theme(legend.position = c(0.45, 0.85),
        legend.title = element_blank()) +
  scale_x_date(breaks = as.Date(paste0(seq(1960, 2100, 5), "-01-01")),
               labels = date_format("%Y")) +
  scale_y_log10(breaks = seq(0, 200, 5),
                     labels = scales::dollar_format(a= 1, su = "", p = ""))
D1_SAL_HW - Index
All
Code
nama_10_lp_ulc %>%
  filter(geo %in% c("FR"),
         na_item == "D1_SAL_HW") %>%
  year_to_date %>%
  left_join(unit, by = "unit") %>%
  group_by(Unit) %>%
  arrange(date) %>%
  mutate(values = 100*values / values[1]) %>%
  ggplot + theme_minimal() + xlab("") + ylab("Compensation of employees per hour worked") +
  geom_line(aes(x = date, y = values, color = Unit)) +
  theme(legend.position = c(0.45, 0.85),
        legend.title = element_blank()) +
  scale_x_date(breaks = as.Date(paste0(seq(1960, 2100, 5), "-01-01")),
               labels = date_format("%Y")) +
  scale_y_log10(breaks = c(seq(0, 2000, 100), seq(100, 200, 10)),
                     labels = scales::dollar_format(a= 1, su = "", p = ""))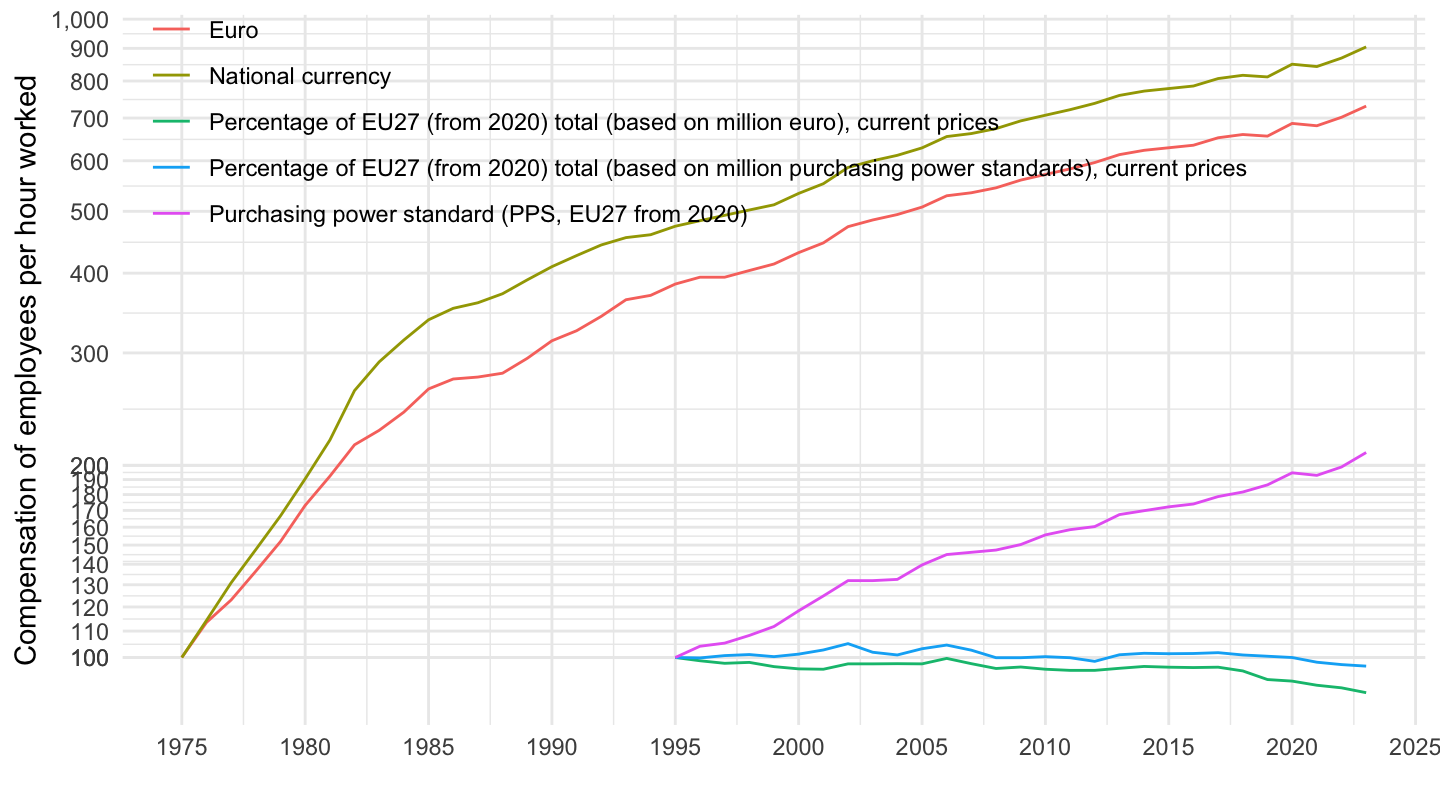
1995-
Code
nama_10_lp_ulc %>%
  filter(geo %in% c("FR"),
         na_item == "D1_SAL_HW") %>%
  year_to_date %>%
  group_by(date) %>%
  filter(n() == 5) %>%
  filter(date >= as.Date("1995-01-01")) %>%
  left_join(unit, by = "unit") %>%
  group_by(Unit) %>%
  mutate(values = 100*values / values[date == as.Date("1995-01-01")]) %>%
  ggplot + theme_minimal() + xlab("") + ylab("Compensation of employees, Per Person (1995 = 100)") +
  geom_line(aes(x = date, y = values, color = Unit)) +
  theme(legend.position = c(0.45, 0.85),
        legend.title = element_blank()) +
  scale_x_date(breaks = as.Date(paste0(seq(1960, 2100, 5), "-01-01")),
               labels = date_format("%Y")) +
  scale_y_log10(breaks = seq(0, 200, 5),
                     labels = scales::dollar_format(a= 1, su = "", p = ""))
RLPR_PER - Real labour productivity per person
All
Code
nama_10_lp_ulc %>%
  filter(geo %in% c("FR"),
         na_item == "RLPR_PER",
         unit %in% c("I10", "I15")) %>%
  year_to_date %>%
  left_join(unit, by = "unit") %>%
  group_by(Unit) %>%
  arrange(date) %>%
  mutate(values = 100*values / values[1]) %>%
  ggplot + theme_minimal() + xlab("") + ylab("Real labour productivity per person") +
  geom_line(aes(x = date, y = values, color = Unit)) +
  theme(legend.position = c(0.25, 0.85),
        legend.title = element_blank()) +
  scale_x_date(breaks = as.Date(paste0(seq(1960, 2100, 5), "-01-01")),
               labels = date_format("%Y")) +
  scale_y_log10(breaks = c(seq(0, 2000, 100), seq(100, 200, 10)),
                     labels = scales::dollar_format(a= 1, su = "", p = ""))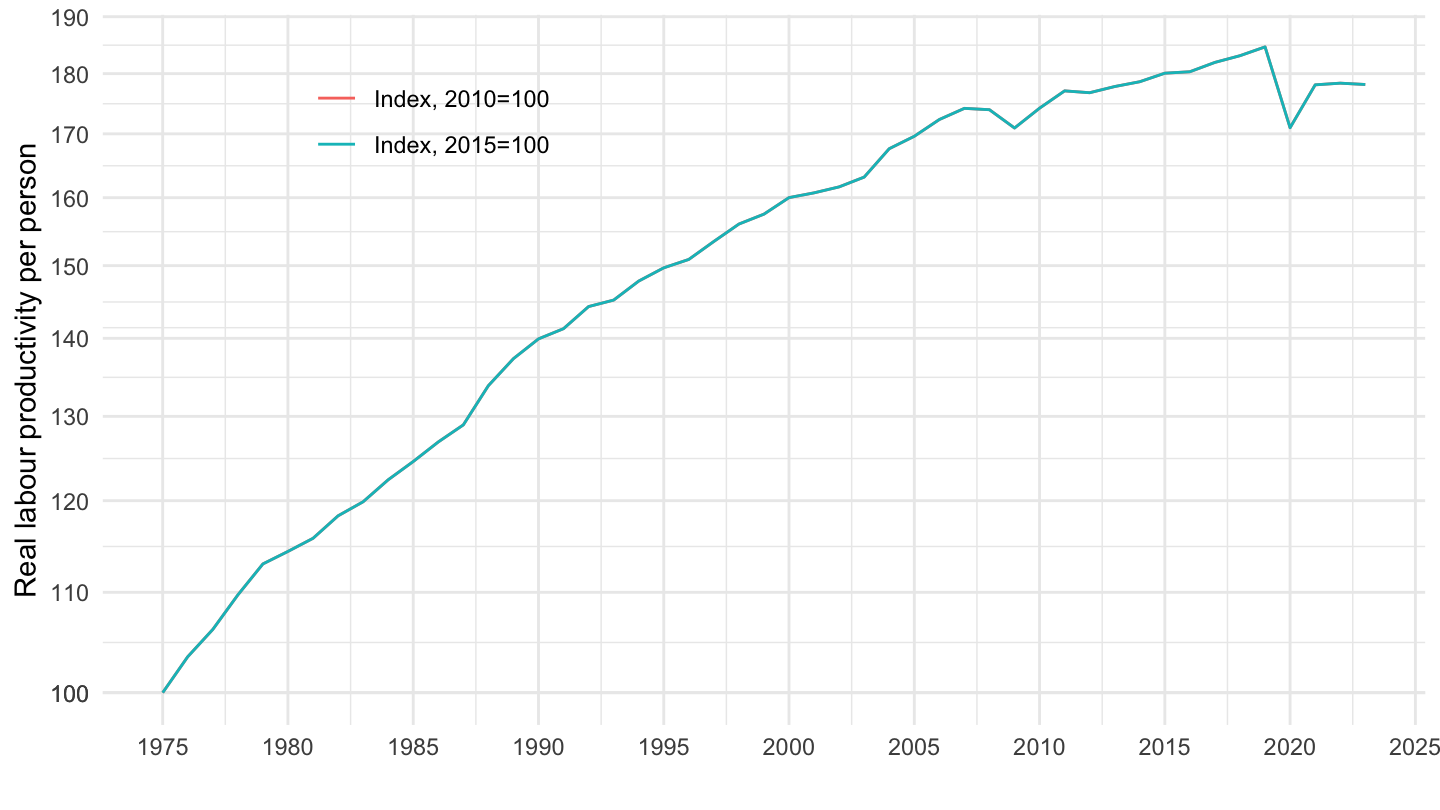
1995-
Code
nama_10_lp_ulc %>%
  filter(geo %in% c("FR"),
         na_item == "RLPR_PER",
         unit %in% c("I10", "I15")) %>%
  year_to_date %>%
  filter(date >= as.Date("1995-01-01")) %>%
  left_join(unit, by = "unit") %>%
  group_by(Unit) %>%
  arrange(date) %>%
  mutate(values = 100*values / values[1]) %>%
  ggplot + theme_minimal() + xlab("") + ylab("Real labour productivity per person") +
  geom_line(aes(x = date, y = values, color = Unit)) +
  theme(legend.position = c(0.25, 0.85),
        legend.title = element_blank()) +
  scale_x_date(breaks = as.Date(paste0(seq(1960, 2100, 5), "-01-01")),
               labels = date_format("%Y")) +
  scale_y_log10(breaks = c(seq(0, 2000, 100), seq(100, 200, 2)),
                     labels = scales::dollar_format(a= 1, su = "", p = ""))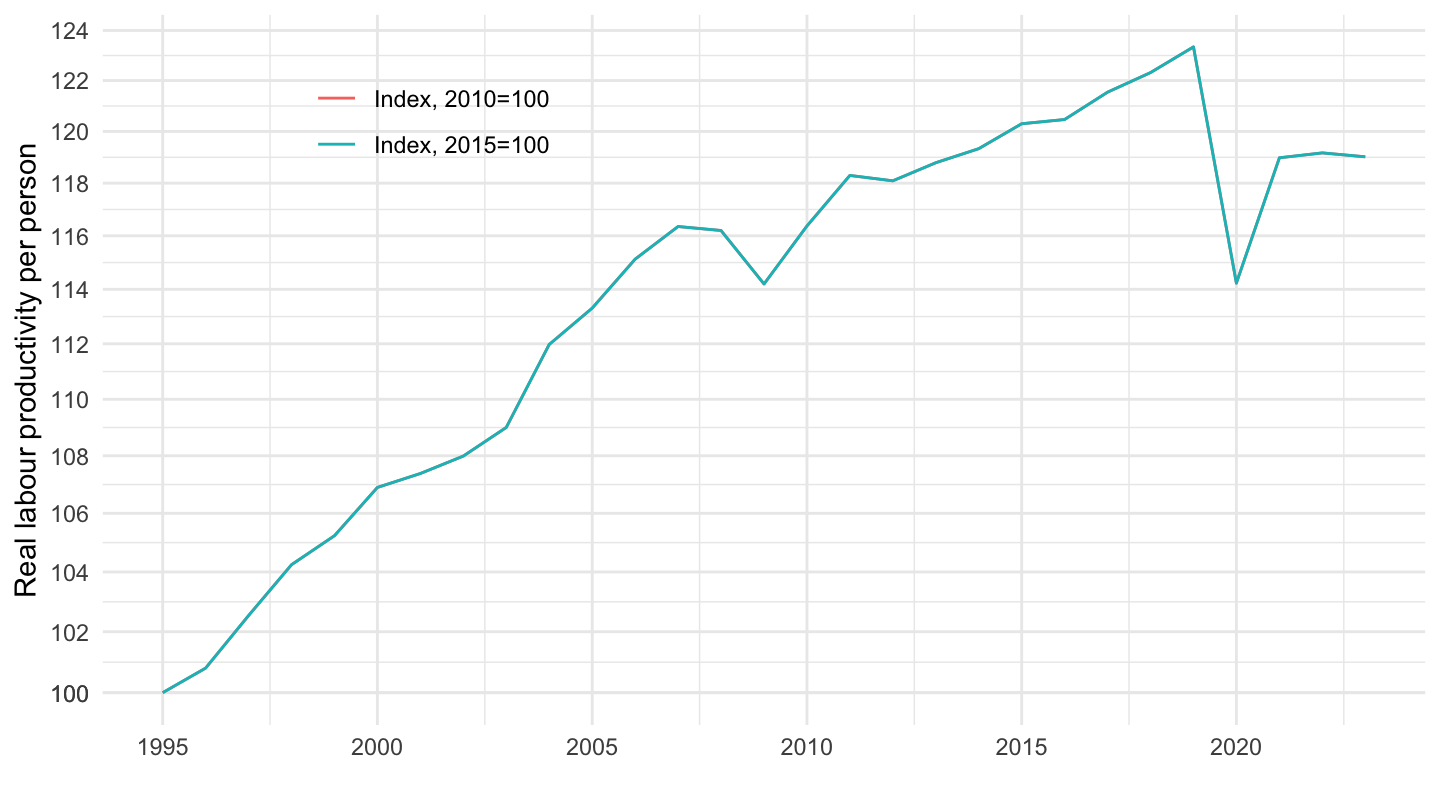
D1_SAL_HW - Wage inflation (%)
France, Germany, Italy
All
Code
nama_10_lp_ulc %>%
  filter(geo %in% c("FR", "DE", "IT"),
         na_item == "D1_SAL_PER",
         unit == "EUR") %>%
  year_to_date %>%
  left_join(geo, by = "geo") %>%
  left_join(colors, by = c("Geo" = "country")) %>%
  mutate(values = values/1000) %>%
  ggplot + theme_minimal() + xlab("") + ylab("Nominal unit labour cost based on persons") +
  geom_line(aes(x = date, y = values, color = color)) +
  scale_color_identity() + add_flags +
  theme(legend.position = c(0.3, 0.85),
        legend.title = element_blank()) +
  scale_x_date(breaks = as.Date(paste0(seq(1960, 2100, 5), "-01-01")),
               labels = date_format("%Y")) +
  scale_y_log10(breaks = seq(0, 200, 10),
                     labels = scales::dollar_format(su = "k€", p = "", a = 1))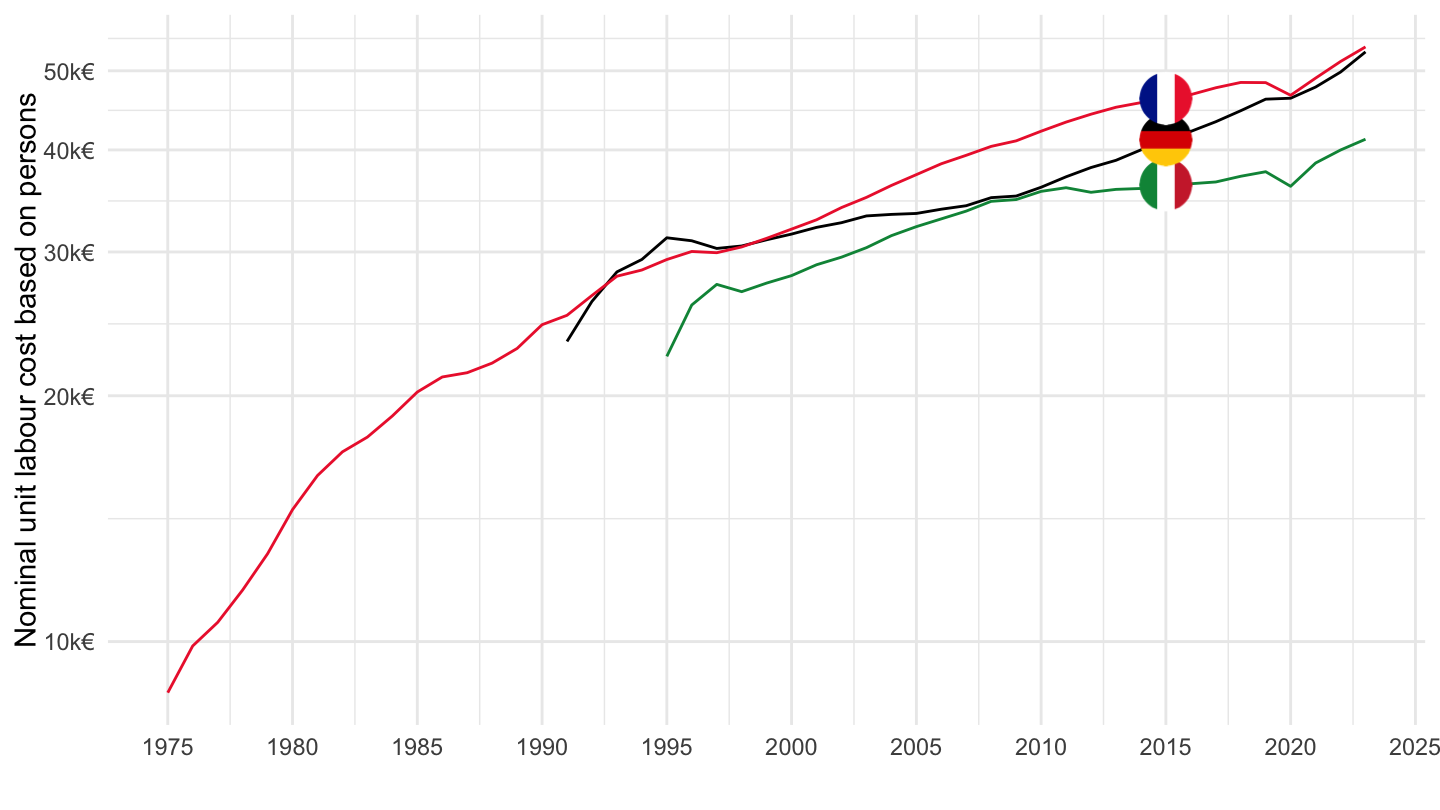
1995-
Values
Code
nama_10_lp_ulc %>%
  filter(geo %in% c("FR", "DE", "IT", "EA19"),
         na_item == "D1_SAL_PER",
         unit == "EUR") %>%
  year_to_date %>%
  filter(date >= as.Date("1995-01-01")) %>%
  left_join(geo, by = "geo") %>%
  mutate(Geo = ifelse(geo == "EA19", "Europe", Geo)) %>%
  left_join(colors, by = c("Geo" = "country")) %>%
  mutate(values = values/1000) %>%
  ggplot + theme_minimal() + xlab("") + ylab("Nominal unit labour cost based on persons") +
  geom_line(aes(x = date, y = values, color = color)) +
  scale_color_identity() + add_flags +
  theme(legend.position = c(0.3, 0.85),
        legend.title = element_blank()) +
  scale_x_date(breaks = as.Date(paste0(seq(1960, 2100, 5), "-01-01")),
               labels = date_format("%Y")) +
  scale_y_log10(breaks = seq(0, 200, 5),
                     labels = scales::dollar_format(su = "k€", p = "", a = 1))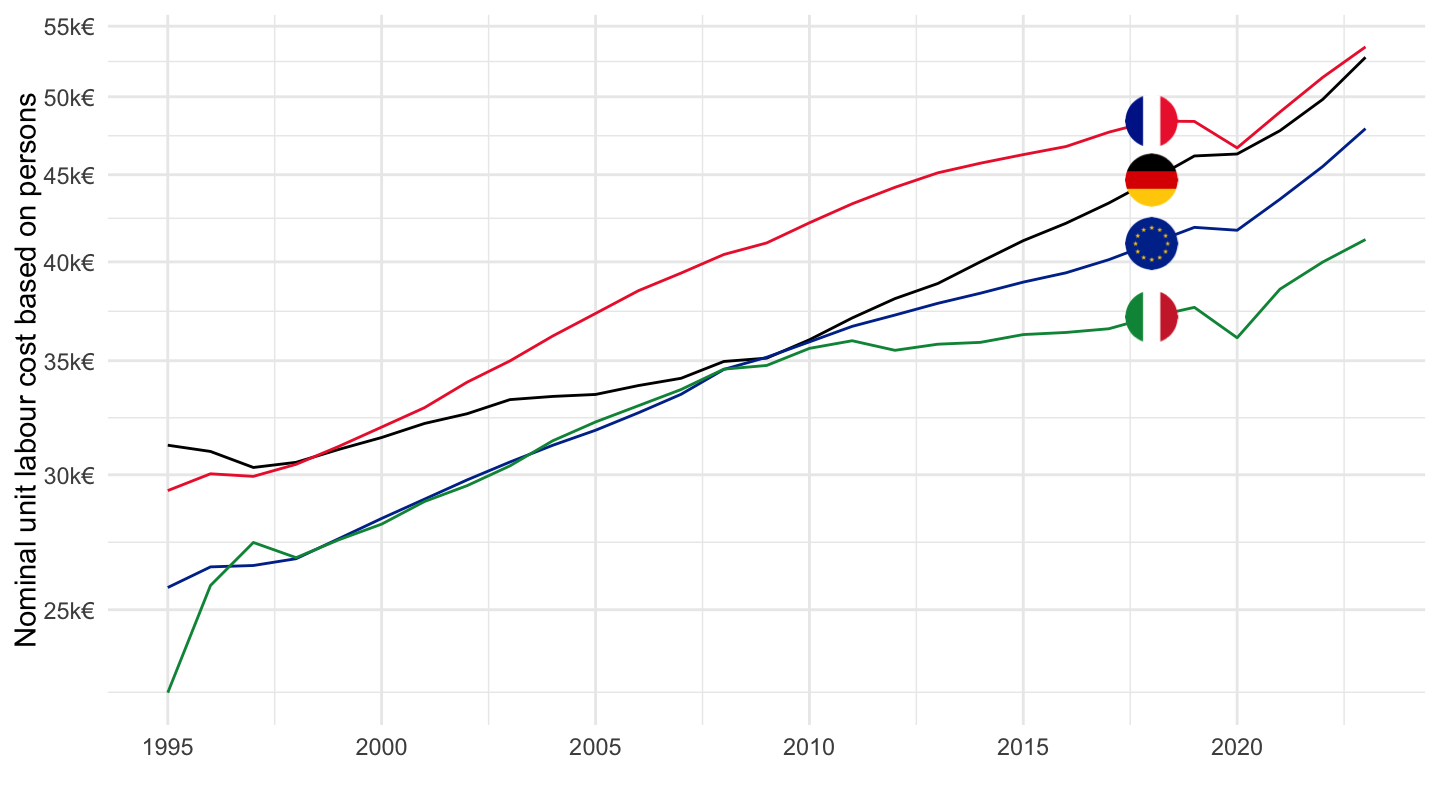
Index = 100
Code
nama_10_lp_ulc %>%
  filter(geo %in% c("FR", "DE", "IT", "EA19"),
         na_item == "D1_SAL_PER",
         unit == "EUR") %>%
  year_to_date %>%
  filter(date >= as.Date("1995-01-01")) %>%
  left_join(geo, by = "geo") %>%
  mutate(Geo = ifelse(geo == "EA19", "Europe", Geo)) %>%
  left_join(colors, by = c("Geo" = "country")) %>%
  group_by(Geo) %>%
  mutate(values = 100*values/values[date == as.Date("1995-01-01")]) %>%
  ggplot + theme_minimal() + xlab("") + ylab("Nominal unit labour cost based on persons") +
  geom_line(aes(x = date, y = values, color = color)) +
  scale_color_identity() + add_flags +
  theme(legend.position = c(0.3, 0.85),
        legend.title = element_blank()) +
  scale_x_date(breaks = as.Date(paste0(seq(1960, 2100, 5), "-01-01")),
               labels = date_format("%Y")) +
  scale_y_log10(breaks = seq(0, 200, 10),
                     labels = scales::dollar_format(su = "", p = "", a = 1))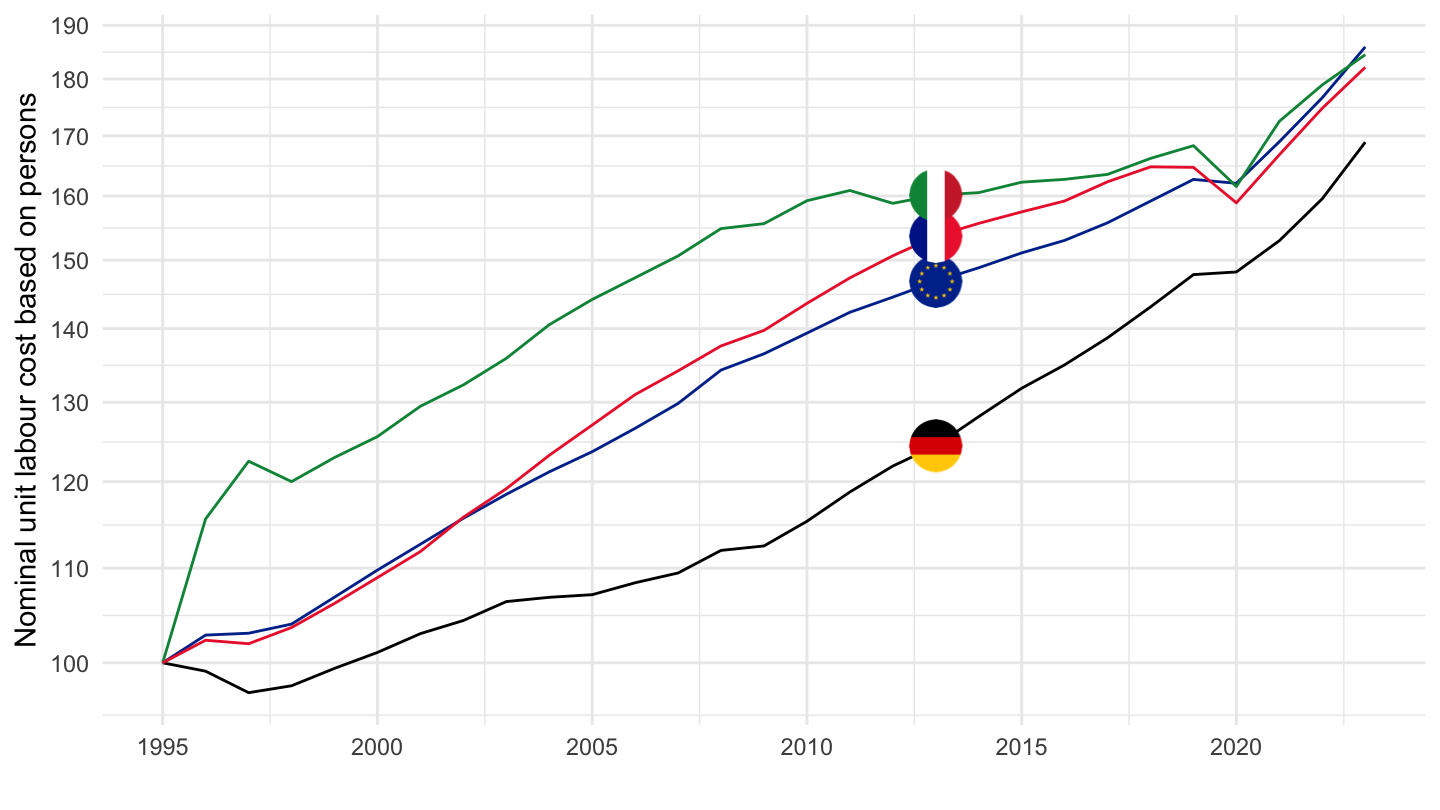
D1_SAL_PER - Individual Countries
Table, 2019
Code
nama_10_lp_ulc %>%
  filter(time == "2019",
         na_item == "D1_SAL_PER") %>%
  select(geo, unit, values) %>%
  spread(unit, values) %>%
  left_join(geo, by = "geo") %>%
  mutate(Geo = ifelse(geo == "DE", "Germany", Geo)) %>%
  mutate(Flag = gsub(" ", "-", str_to_lower(Geo)),
         Flag = paste0('<img src="../../bib/flags/vsmall/', Flag, '.png" alt="Flag">')) %>%
  select(-NAC) %>%
  select(Flag, geo, Geo, everything()) %>%
  {if (is_html_output()) datatable(., filter = 'top', rownames = F, escape = F) else .}
Germany
All
Code
nama_10_lp_ulc %>%
  filter(geo %in% c("DE"),
         na_item == "D1_SAL_PER") %>%
  year_to_date %>%
  left_join(unit, by = "unit") %>%
  group_by(Unit) %>%
  mutate(values = 100*values / values[date == as.Date("1995-01-01")]) %>%
  ggplot + theme_minimal() + xlab("") + ylab("Compensation of employees per hour worked") +
  geom_line(aes(x = date, y = values, color = Unit)) +
  scale_color_manual(values = viridis(6)[1:5]) +
  theme(legend.position = c(0.45, 0.85),
        legend.title = element_blank()) +
  scale_x_date(breaks = as.Date(paste0(seq(1960, 2100, 5), "-01-01")),
               labels = date_format("%Y")) +
  scale_y_log10(breaks = seq(0, 200, 10),
                     labels = scales::dollar_format(a= 1, su = "", p = ""))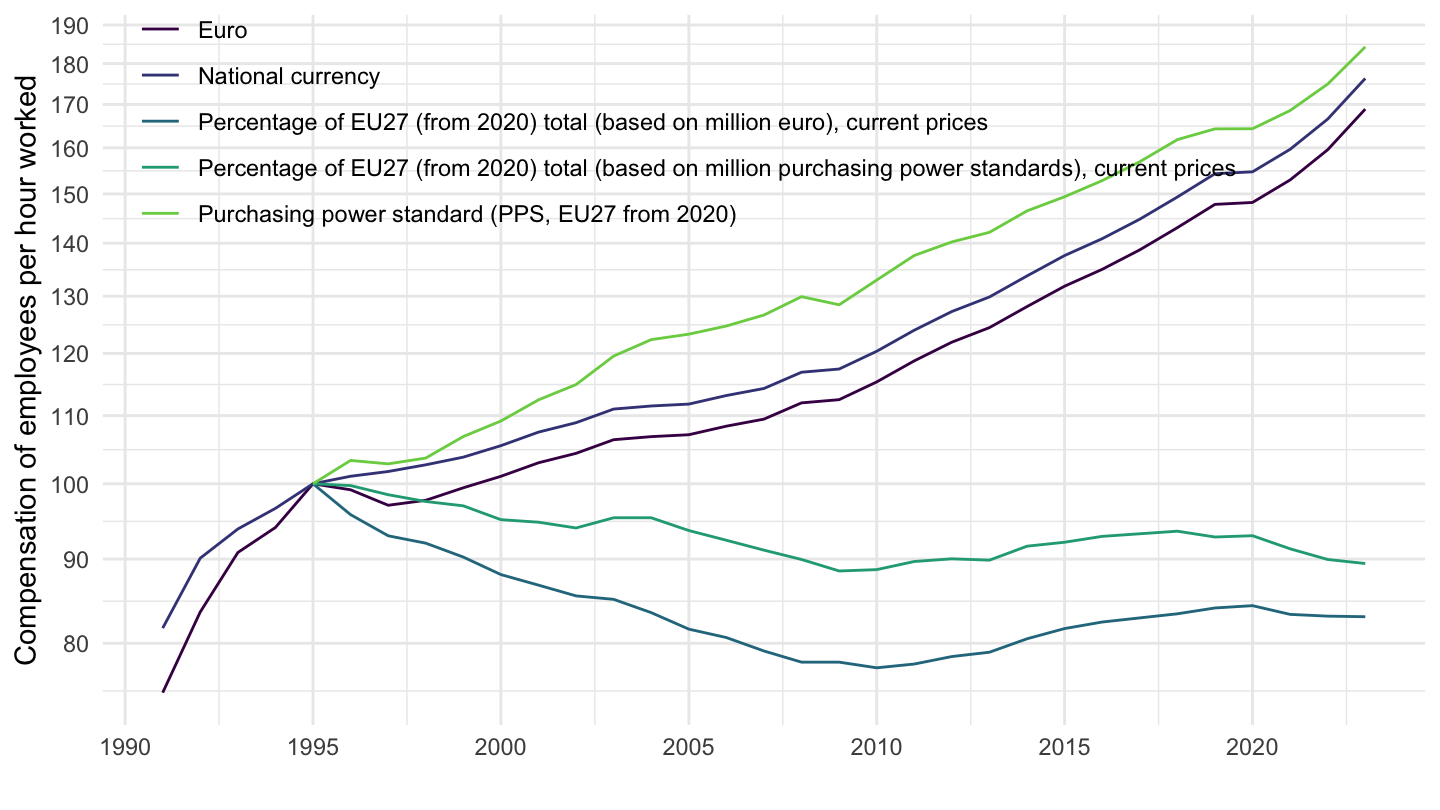
1995-
Code
nama_10_lp_ulc %>%
  filter(geo %in% c("DE"),
         na_item == "D1_SAL_PER") %>%
  year_to_date %>%
  filter(date >= as.Date("1995-01-01")) %>%
  left_join(unit, by = "unit") %>%
  group_by(Unit) %>%
  mutate(values = 100*values / values[date == as.Date("1995-01-01")]) %>%
  ggplot + theme_minimal() + xlab("") + ylab("Compensation of employees per hour worked") +
  geom_line(aes(x = date, y = values, color = Unit)) +
  scale_color_manual(values = viridis(6)[1:5]) +
  theme(legend.position = c(0.45, 0.85),
        legend.title = element_blank()) +
  scale_x_date(breaks = as.Date(paste0(seq(1960, 2100, 5), "-01-01")),
               labels = date_format("%Y")) +
  scale_y_log10(breaks = seq(0, 200, 5),
                     labels = scales::dollar_format(a= 1, su = "", p = ""))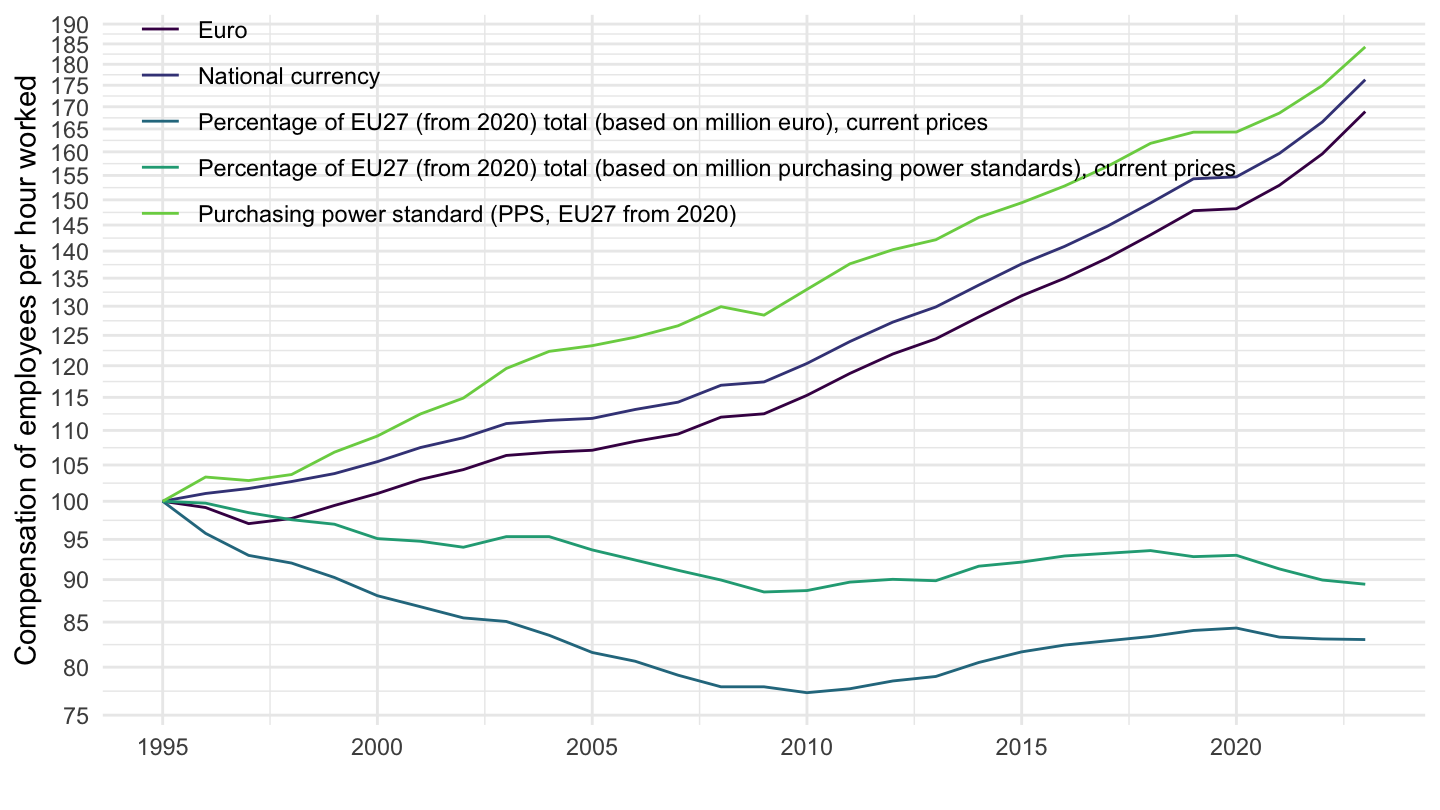
Italy
Code
nama_10_lp_ulc %>%
  filter(geo %in% c("IT"),
         na_item == "D1_SAL_PER") %>%
  year_to_date %>%
  left_join(unit, by = "unit") %>%
  ggplot + theme_minimal() + xlab("") + ylab("Compensation of employees per hour worked") +
  geom_line(aes(x = date, y = values / 1000, color = Unit, linetype = Unit)) +
  scale_color_manual(values = viridis(6)[1:5]) +
  theme(legend.position = c(0.3, 0.85),
        legend.title = element_blank()) +
  scale_x_date(breaks = as.Date(paste0(seq(1960, 2100, 5), "-01-01")),
               labels = date_format("%Y")) +
  scale_y_log10(breaks = seq(0, 200, 5),
                     labels = scales::dollar_format(a= 1, su = "k€", p = ""))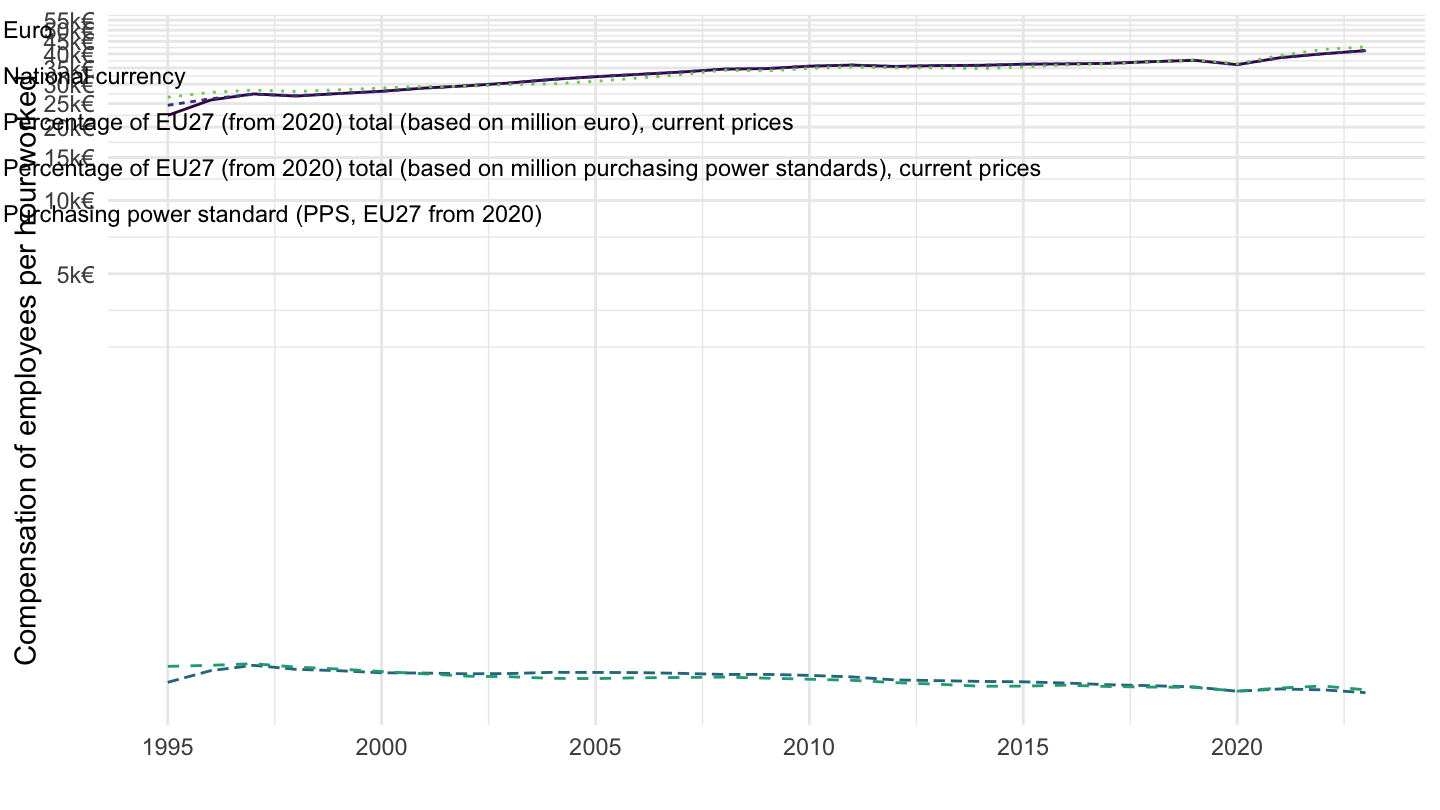
Iceland
Code
nama_10_lp_ulc %>%
  filter(geo %in% c("IS"),
         na_item == "D1_SAL_PER") %>%
  year_to_date %>%
  filter(date >= as.Date("1995-01-01")) %>%
  group_by(unit) %>%
  mutate(values = 100*values/values[date == as.Date("2008-01-01")]) %>%
  left_join(unit, by = "unit") %>%
  ggplot + theme_minimal() + xlab("") + ylab("Compensation of employees per hour (2008 = 100)") +
  geom_line(aes(x = date, y = values, color = Unit, linetype = Unit)) +
  scale_color_manual(values = viridis(6)[1:5]) +
  theme(legend.position = c(0.3, 0.85),
        legend.title = element_blank()) +
  scale_x_date(breaks = as.Date(paste0(seq(1960, 2020, 1), "-01-01")),
               labels = date_format("%Y")) +
  scale_y_log10(breaks = seq(0, 400, 20),
                     labels = scales::dollar_format(a= 1, su = "", p = ""))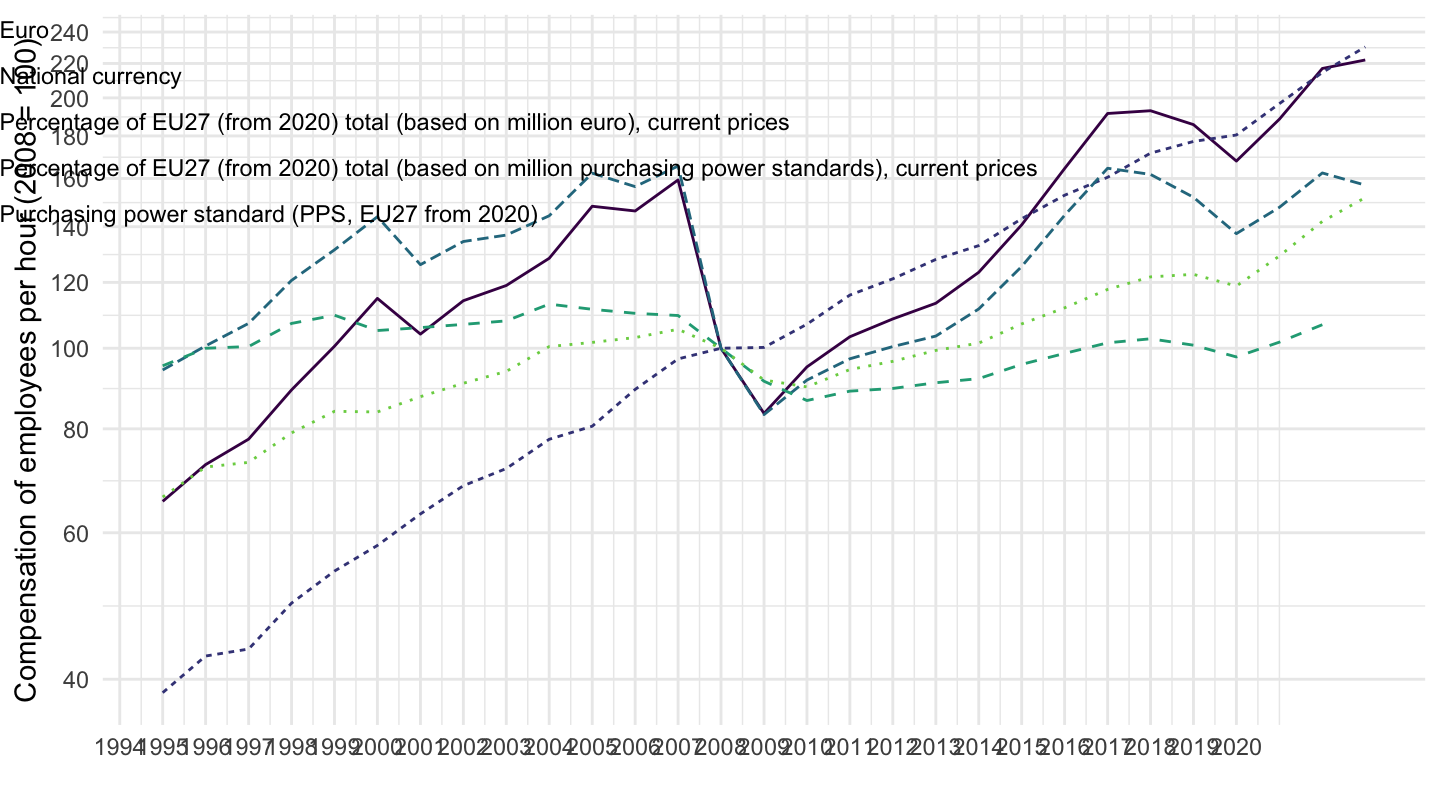
D1_SAL_HW - Individual Countries
Table, 2019
Code
nama_10_lp_ulc %>%
  filter(time == "2019",
         na_item == "D1_SAL_HW") %>%
  select(geo, unit, values) %>%
  spread(unit, values) %>%
  left_join(geo, by = "geo") %>%
  mutate(Geo = ifelse(geo == "DE", "Germany", Geo)) %>%
  mutate(Flag = gsub(" ", "-", str_to_lower(Geo)),
         Flag = paste0('<img src="../../bib/flags/vsmall/', Flag, '.png" alt="Flag">')) %>%
  select(-NAC) %>%
  select(Flag, geo, Geo, everything()) %>%
  {if (is_html_output()) datatable(., filter = 'top', rownames = F, escape = F) else .}
Eurozone, Greece, Portugal, Spain
Code
nama_10_lp_ulc %>%
  filter(geo %in% c("EA", "PT", "EL", "ES"),
         na_item == "D1_SAL_HW",
         unit == "EUR") %>%
  year_to_date %>%
  filter(date >= as.Date("1995-01-01")) %>%
  left_join(geo, by = "geo") %>%
  mutate(Geo = ifelse(geo == "EA", "Europe", Geo)) %>%
  left_join(colors, by = c("Geo" = "country")) %>%
  ggplot + theme_minimal() + xlab("") + ylab("Compensation of employees per hour worked") +
  geom_line(aes(x = date, y = values, color = color)) +
  scale_color_identity() + add_flags +
  theme(legend.position = c(0.3, 0.85),
        legend.title = element_blank()) +
  scale_x_date(breaks = as.Date(paste0(seq(1960, 2100, 5), "-01-01")),
               labels = date_format("%Y")) +
  scale_y_log10(breaks = seq(0, 200, 1),
                     labels = scales::dollar_format(a= 1, su = "€", p = ""))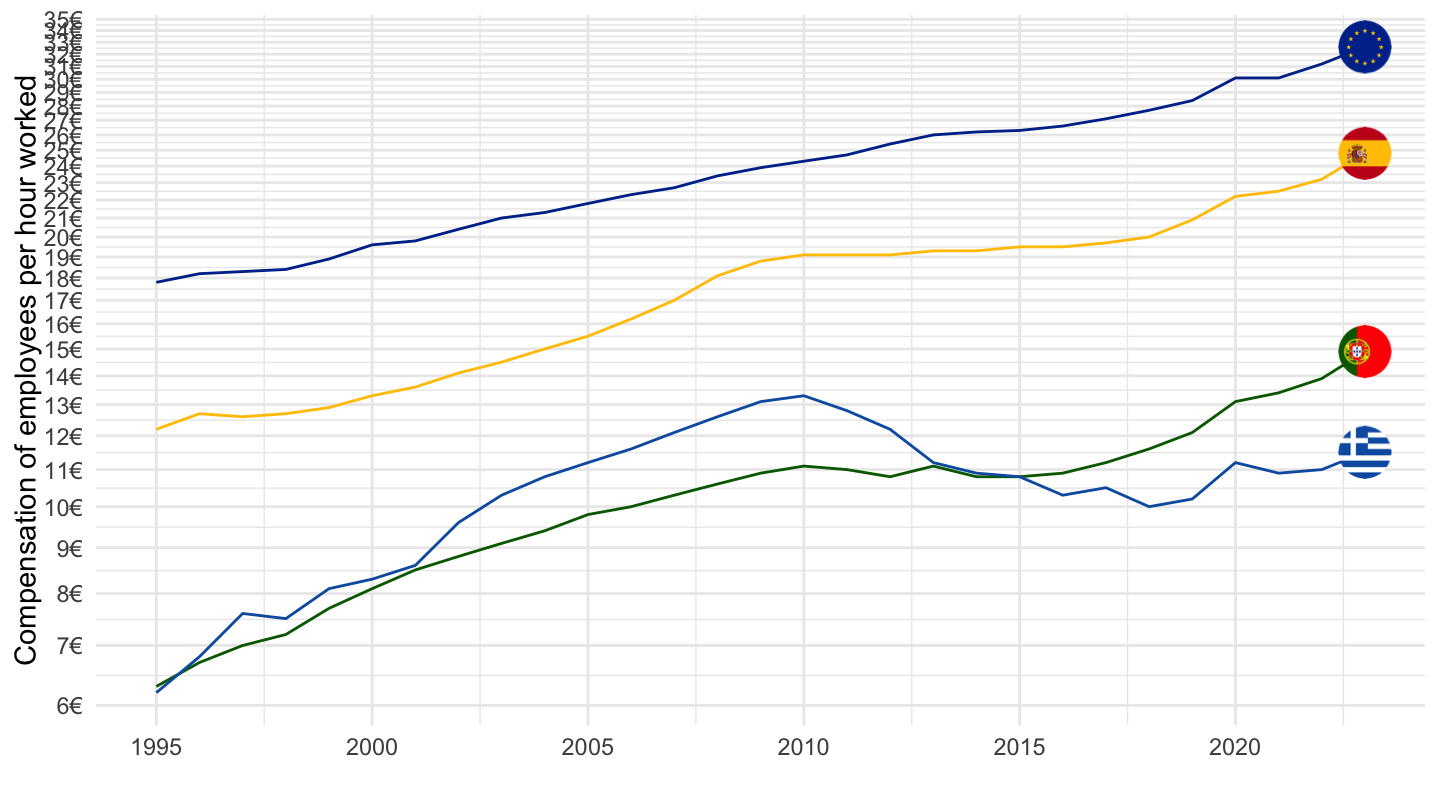
Germany
All
Code
nama_10_lp_ulc %>%
  filter(geo %in% c("DE"),
         na_item == "D1_SAL_HW") %>%
  year_to_date %>%
  left_join(unit, by = "unit") %>%
  ggplot + theme_minimal() + xlab("") + ylab("Compensation of employees per hour worked") +
  geom_line(aes(x = date, y = values, color = Unit, linetype = Unit)) +
  scale_color_manual(values = viridis(6)[1:5]) +
  theme(legend.position = c(0.3, 0.85),
        legend.title = element_blank()) +
  scale_x_date(breaks = as.Date(paste0(seq(1960, 2100, 5), "-01-01")),
               labels = date_format("%Y")) +
  scale_y_log10(breaks = seq(0, 200, 5),
                     labels = scales::dollar_format(a= 1, su = "€", p = ""))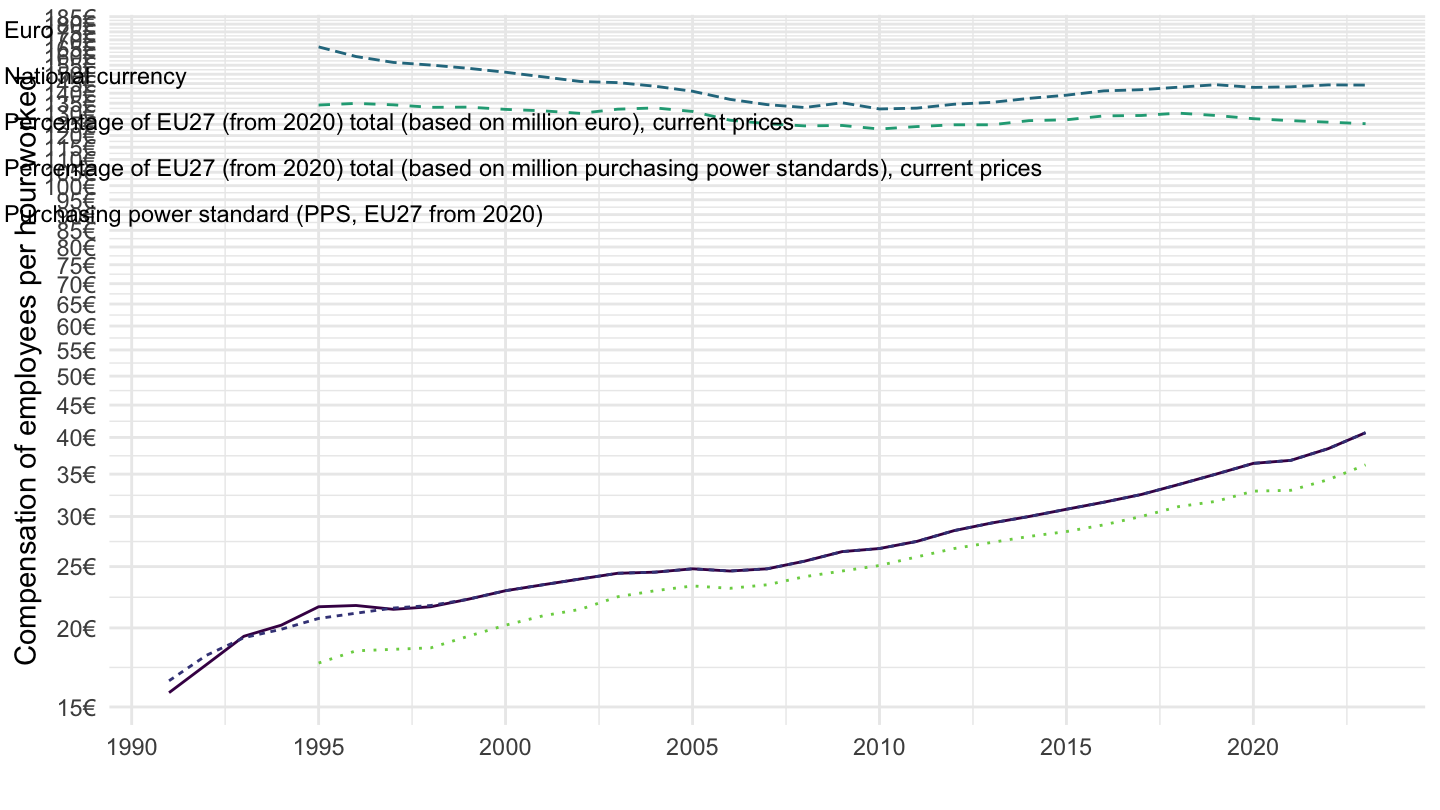
1995-
Code
nama_10_lp_ulc %>%
  filter(geo %in% c("DE"),
         na_item == "D1_SAL_HW") %>%
  year_to_date %>%
  filter(date >= as.Date("1995-01-01")) %>%
  left_join(unit, by = "unit") %>%
  ggplot + theme_minimal() + xlab("") + ylab("Compensation of employees per hour worked") +
  geom_line(aes(x = date, y = values, color = Unit, linetype = Unit)) +
  scale_color_manual(values = viridis(6)[1:5]) +
  theme(legend.position = c(0.3, 0.85),
        legend.title = element_blank()) +
  scale_x_date(breaks = as.Date(paste0(seq(1960, 2100, 5), "-01-01")),
               labels = date_format("%Y")) +
  scale_y_log10(breaks = seq(0, 200, 5),
                     labels = scales::dollar_format(a= 1, su = "€", p = ""))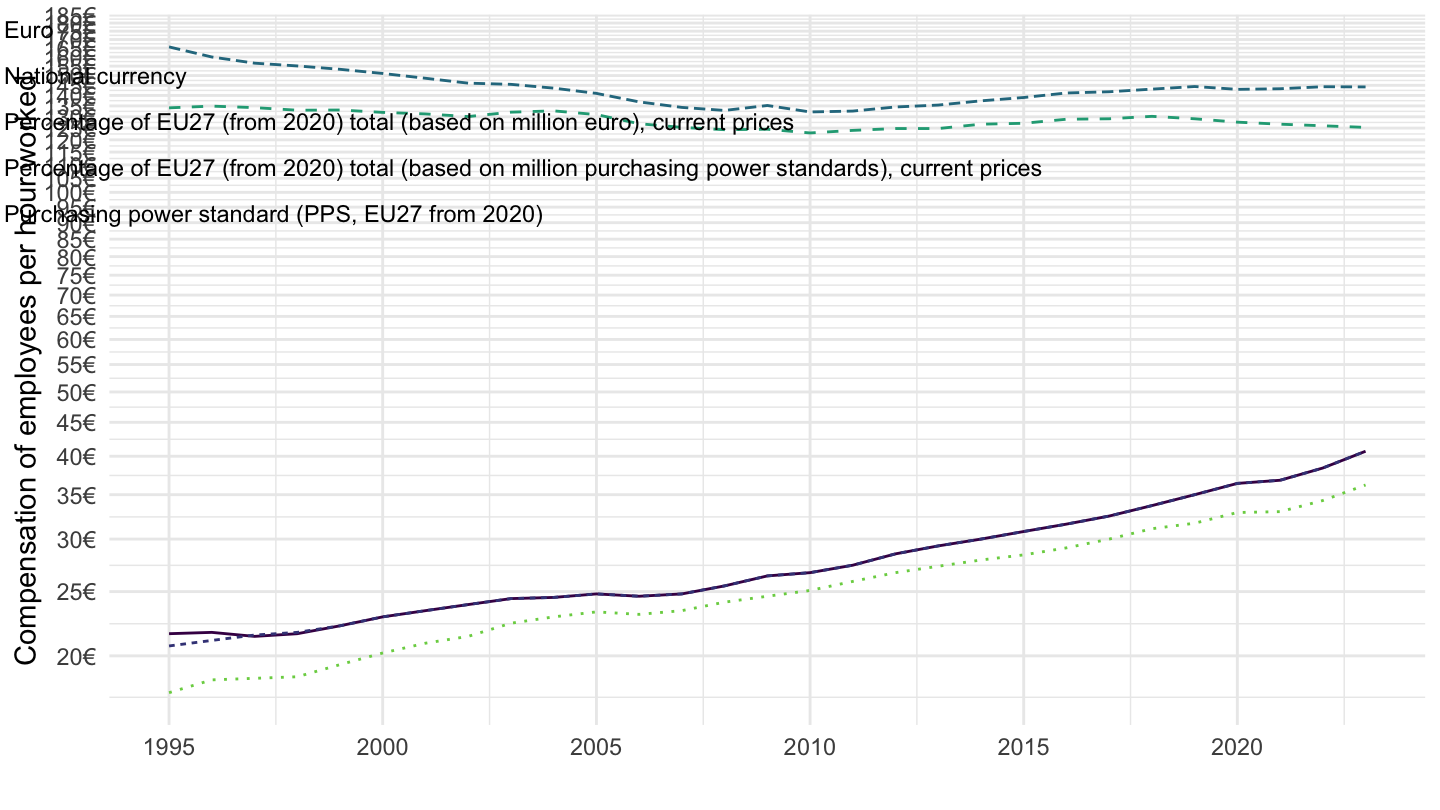
Italy
Code
nama_10_lp_ulc %>%
  filter(geo %in% c("IT"),
         na_item == "D1_SAL_HW") %>%
  year_to_date %>%
  filter(date >= as.Date("1995-01-01")) %>%
  left_join(unit, by = "unit") %>%
  ggplot + theme_minimal() + xlab("") + ylab("Compensation of employees per hour worked") +
  geom_line(aes(x = date, y = values, color = Unit, linetype = Unit)) +
  scale_color_manual(values = viridis(6)[1:5]) +
  theme(legend.position = c(0.3, 0.85),
        legend.title = element_blank()) +
  scale_x_date(breaks = as.Date(paste0(seq(1960, 2100, 5), "-01-01")),
               labels = date_format("%Y")) +
  scale_y_log10(breaks = seq(0, 200, 1),
                     labels = scales::dollar_format(a= 1, su = "€", p = ""))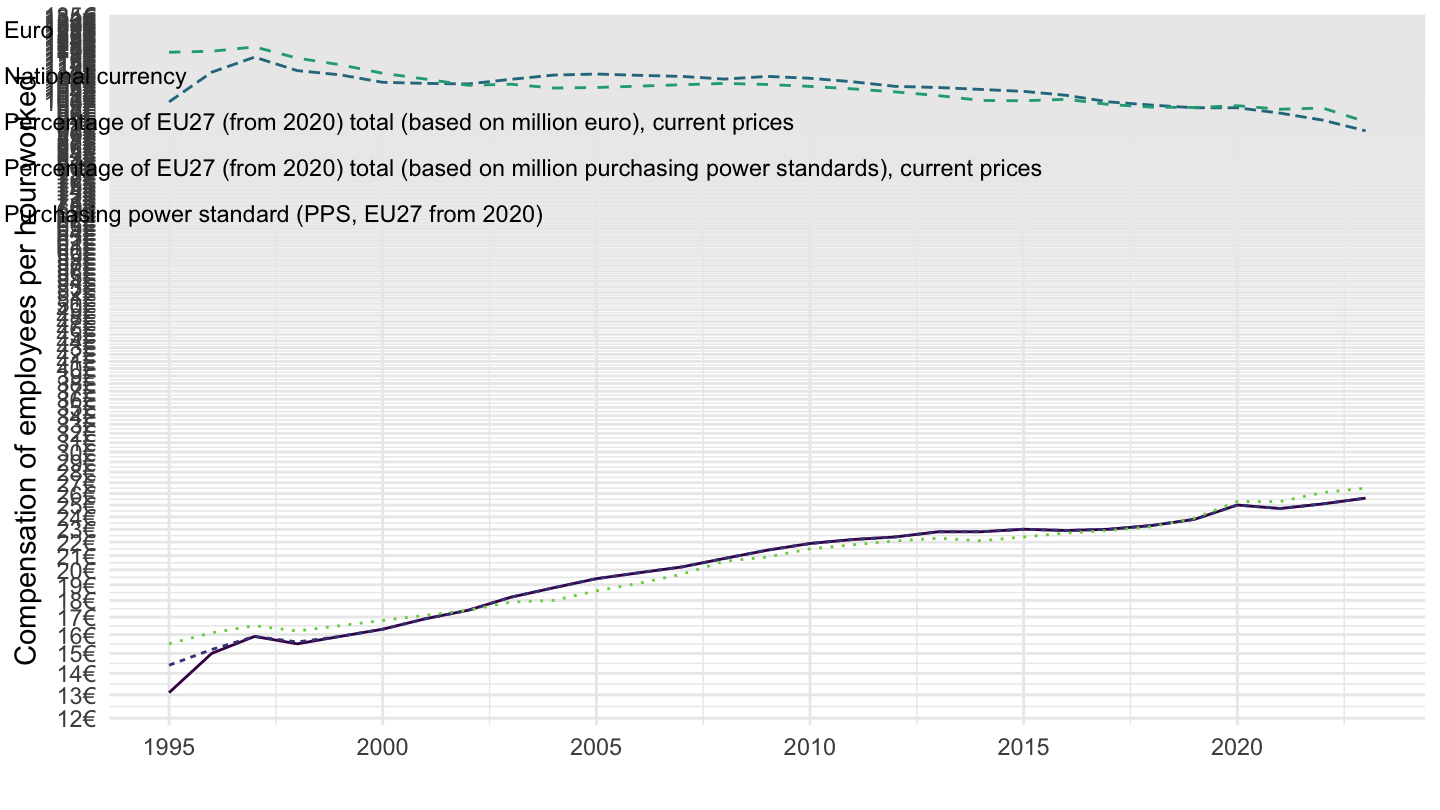
Spain
Code
nama_10_lp_ulc %>%
  filter(geo %in% c("ES"),
         na_item == "D1_SAL_HW") %>%
  year_to_date %>%
  filter(date >= as.Date("1995-01-01")) %>%
  left_join(unit, by = "unit") %>%
  ggplot + theme_minimal() + xlab("") + ylab("Compensation of employees per hour worked") +
  geom_line(aes(x = date, y = values, color = Unit, linetype = Unit)) +
  scale_color_manual(values = viridis(6)[1:5]) +
  theme(legend.position = c(0.3, 0.85),
        legend.title = element_blank()) +
  scale_x_date(breaks = as.Date(paste0(seq(1960, 2100, 5), "-01-01")),
               labels = date_format("%Y")) +
  scale_y_log10(breaks = seq(0, 200, 1),
                     labels = scales::dollar_format(a= 1, su = "€", p = ""))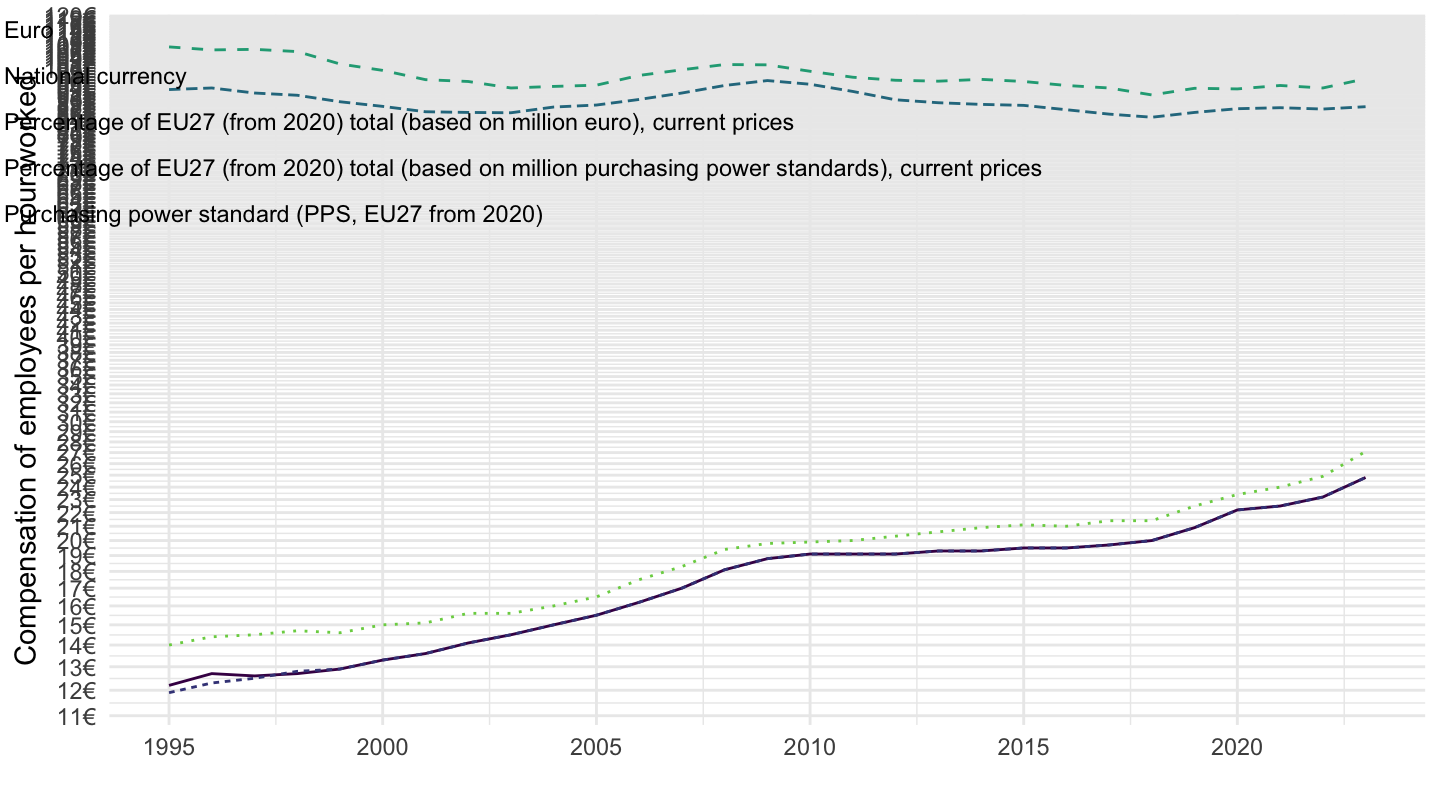
Greece
Code
nama_10_lp_ulc %>%
  filter(geo %in% c("EL"),
         na_item == "D1_SAL_HW") %>%
  year_to_date %>%
  filter(date >= as.Date("1995-01-01")) %>%
  left_join(unit, by = "unit") %>%
  ggplot + theme_minimal() + xlab("") + ylab("Compensation of employees per hour worked") +
  geom_line(aes(x = date, y = values, color = Unit, linetype = Unit)) +
  scale_color_manual(values = viridis(6)[1:5]) +
  theme(legend.position = c(0.3, 0.85),
        legend.title = element_blank()) +
  scale_x_date(breaks = as.Date(paste0(seq(1960, 2100, 5), "-01-01")),
               labels = date_format("%Y")) +
  scale_y_log10(breaks = seq(0, 200, 1),
                     labels = scales::dollar_format(a= 1, su = "€", p = ""))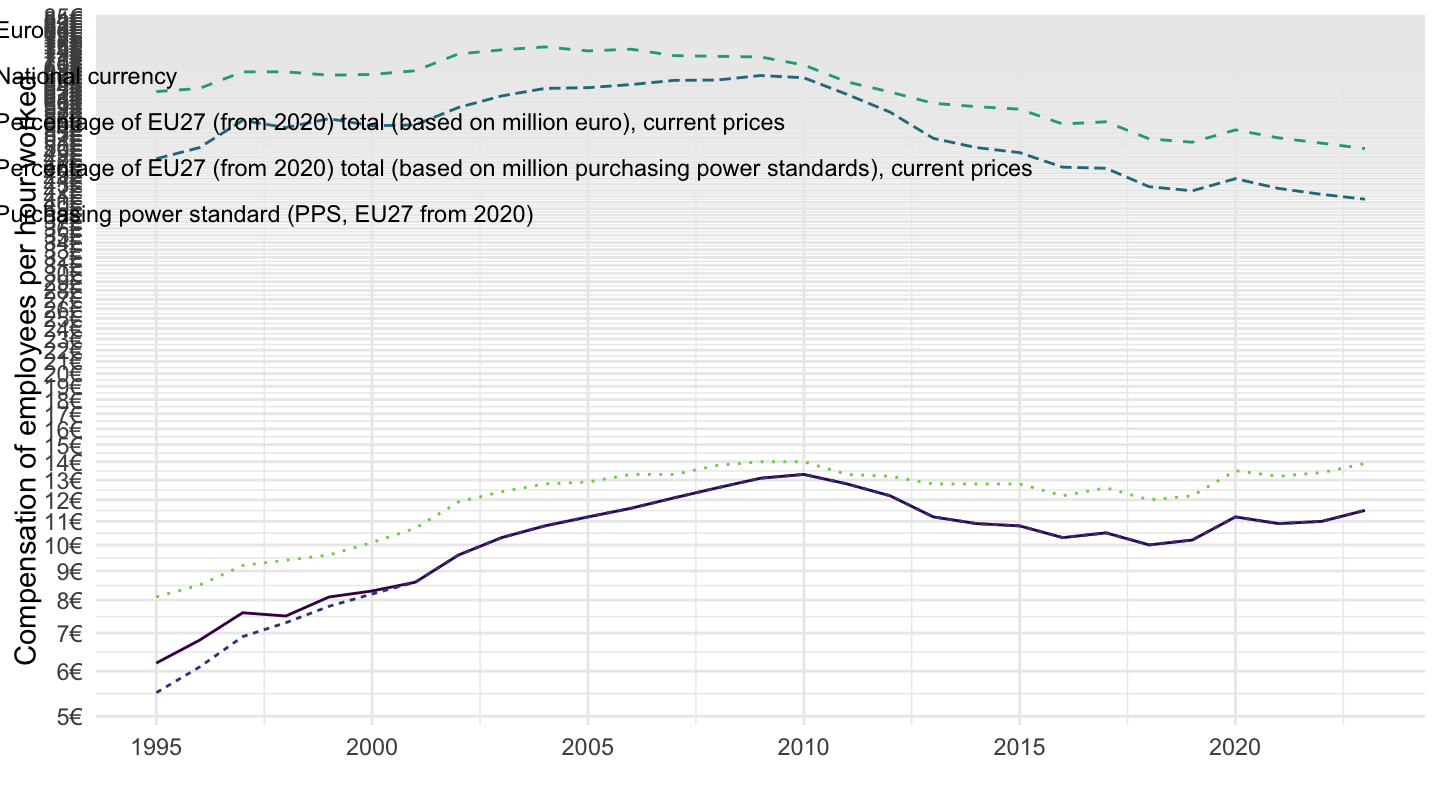
Portugal
Code
nama_10_lp_ulc %>%
  filter(geo %in% c("PT"),
         na_item == "D1_SAL_HW") %>%
  year_to_date %>%
  filter(date >= as.Date("1995-01-01")) %>%
  left_join(unit, by = "unit") %>%
  ggplot + theme_minimal() + xlab("") + ylab("Compensation of employees per hour worked") +
  geom_line(aes(x = date, y = values, color = Unit, linetype = Unit)) +
  scale_color_manual(values = viridis(6)[1:5]) +
  theme(legend.position = c(0.3, 0.85),
        legend.title = element_blank()) +
  scale_x_date(breaks = as.Date(paste0(seq(1960, 2100, 5), "-01-01")),
               labels = date_format("%Y")) +
  scale_y_log10(breaks = seq(0, 200, 1),
                     labels = scales::dollar_format(a= 1, su = "€", p = ""))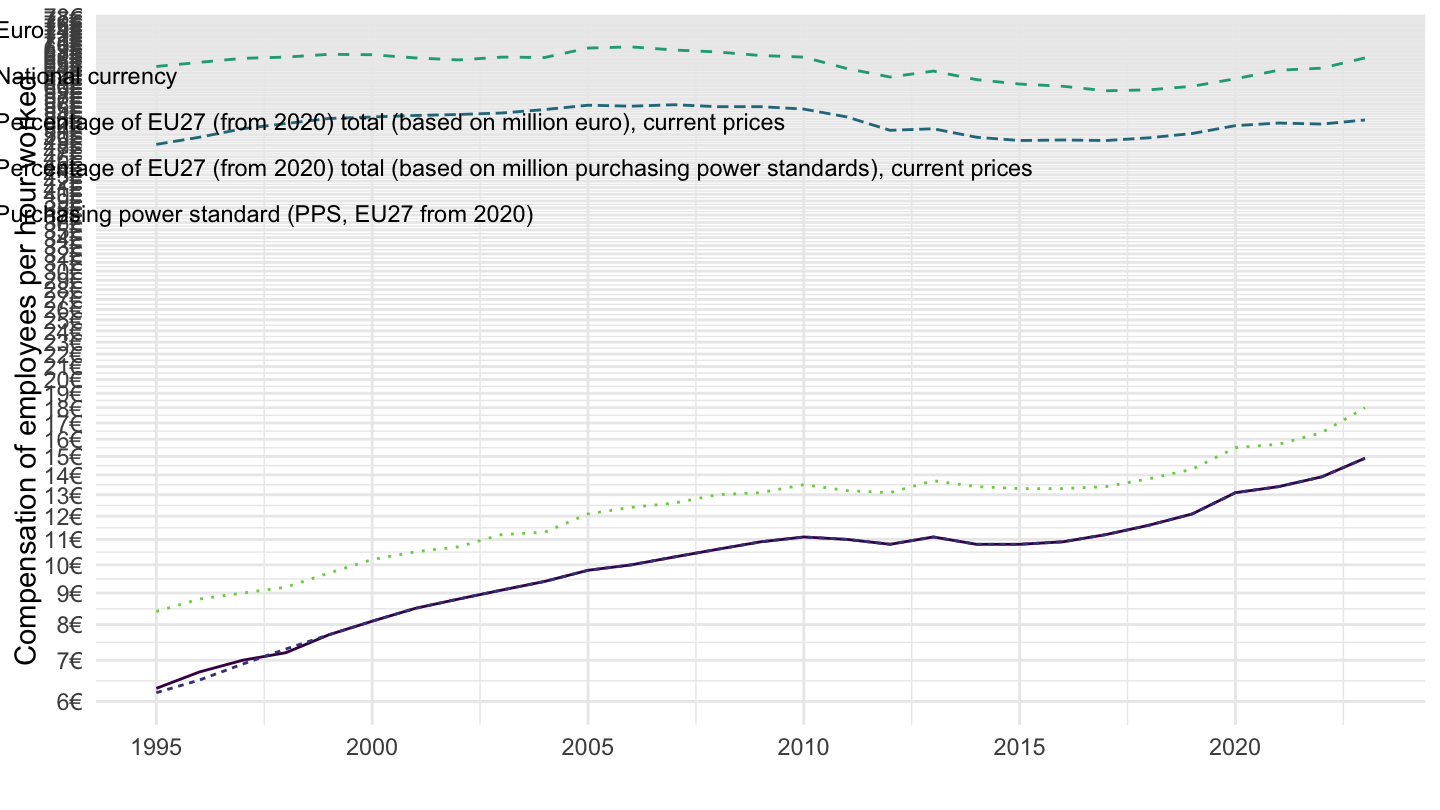
Iceland
All (2008-2019)
Code
nama_10_lp_ulc %>%
  filter(geo %in% c("IS"),
         na_item == "D1_SAL_HW") %>%
  year_to_date %>%
  filter(date >= as.Date("1995-01-01")) %>%
  group_by(unit) %>%
  mutate(values = 100*values/values[date == as.Date("2008-01-01")]) %>%
  left_join(unit, by = "unit") %>%
  ggplot + theme_minimal() + xlab("") + ylab("Compensation of employees per hour (2008 = 100)") +
  geom_line(aes(x = date, y = values, color = Unit, linetype = Unit)) +
  scale_color_manual(values = viridis(6)[1:5]) +
  theme(legend.position = c(0.3, 0.85),
        legend.title = element_blank()) +
  scale_x_date(breaks = as.Date(paste0(seq(1960, 2020, 1), "-01-01")),
               labels = date_format("%Y")) +
  scale_y_log10(breaks = seq(0, 400, 20),
                     labels = scales::dollar_format(a= 1, su = "", p = ""))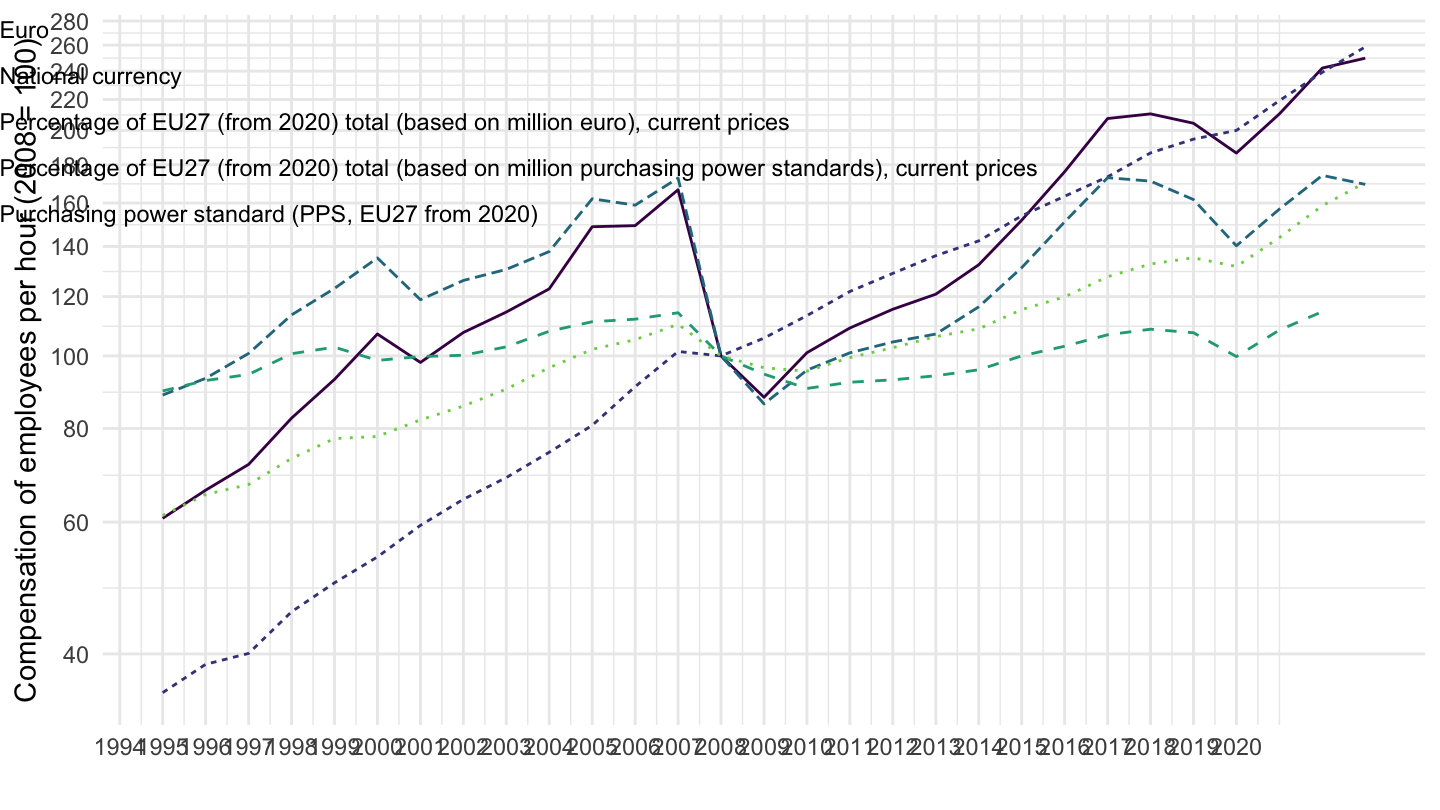
D1_SAL_HW, EUR - Compensation of employees per hour worked
France, Germany, Italy
Code
nama_10_lp_ulc %>%
  filter(geo %in% c("FR", "DE", "IT"),
         na_item == "D1_SAL_HW",
         unit == "EUR") %>%
  year_to_date %>%
  left_join(geo, by = "geo") %>%
  left_join(colors, by = c("Geo" = "country")) %>%
  ggplot + theme_minimal() + xlab("") + ylab("Compensation of employees per hour worked") +
  geom_line(aes(x = date, y = values, color = color)) +
  scale_color_identity() + add_flags +
  theme(legend.position = c(0.3, 0.85),
        legend.title = element_blank()) +
  scale_x_date(breaks = as.Date(paste0(seq(1960, 2100, 5), "-01-01")),
               labels = date_format("%Y")) +
  scale_y_log10(breaks = seq(0, 200, 5),
                     labels = scales::dollar_format(su = "€", p = "", a = 1))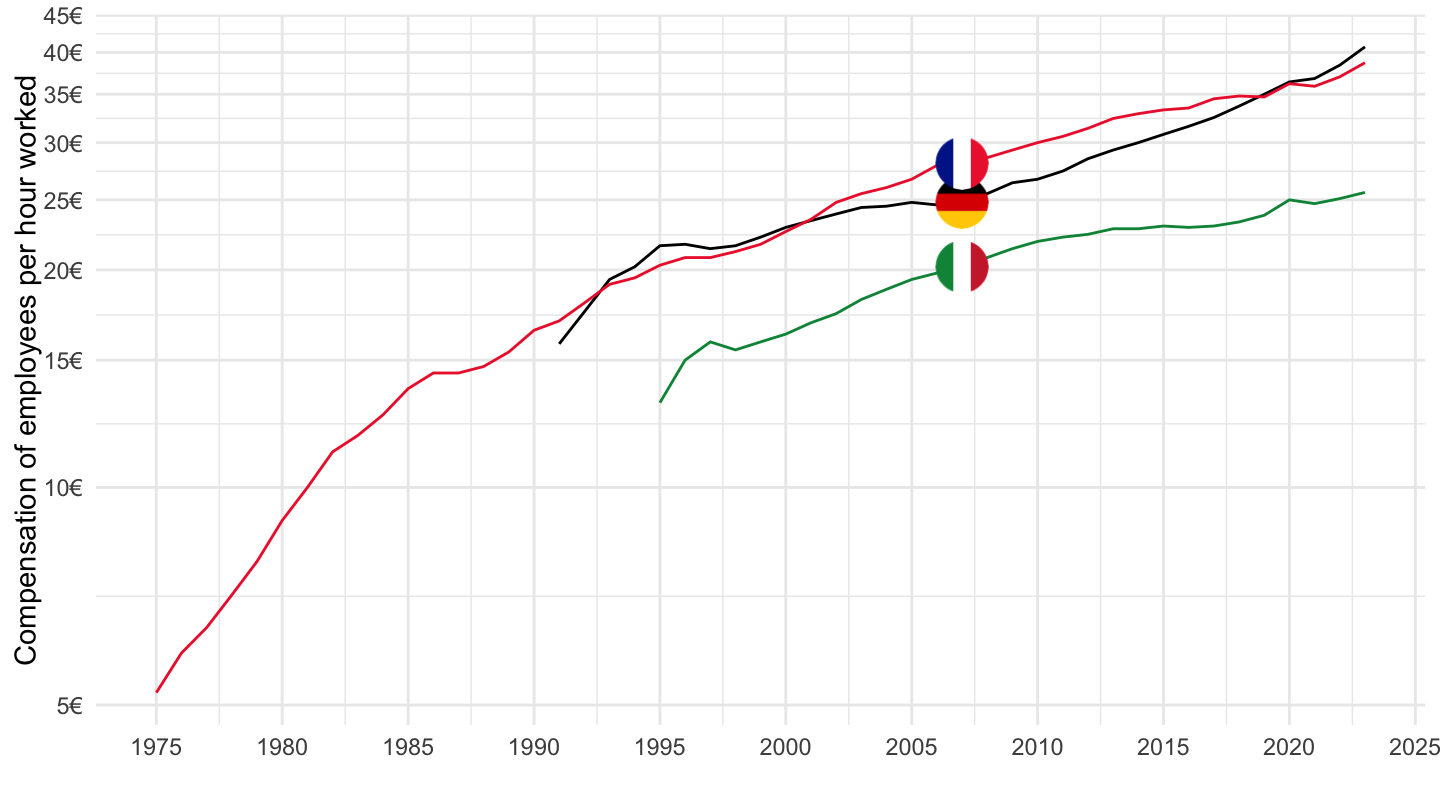
Iceland, Ireland, Denmark
Euro
Code
nama_10_lp_ulc %>%
  filter(geo %in% c("IS", "IE", "DK"),
         na_item == "D1_SAL_HW",
         unit == "EUR") %>%
  year_to_date %>%
  left_join(geo, by = "geo") %>%
  left_join(colors, by = c("Geo" = "country")) %>%
  ggplot + theme_minimal() + xlab("") + ylab("Compensation of employees per hour worked") +
  geom_line(aes(x = date, y = values, color = color)) +
  scale_color_identity() + add_flags +
  theme(legend.position = c(0.3, 0.85),
        legend.title = element_blank()) +
  scale_x_date(breaks = as.Date(paste0(seq(1960, 2100, 5), "-01-01")),
               labels = date_format("%Y")) +
  scale_y_log10(breaks = seq(0, 200, 5),
                     labels = scales::dollar_format(su = "€", p = "", a = 1))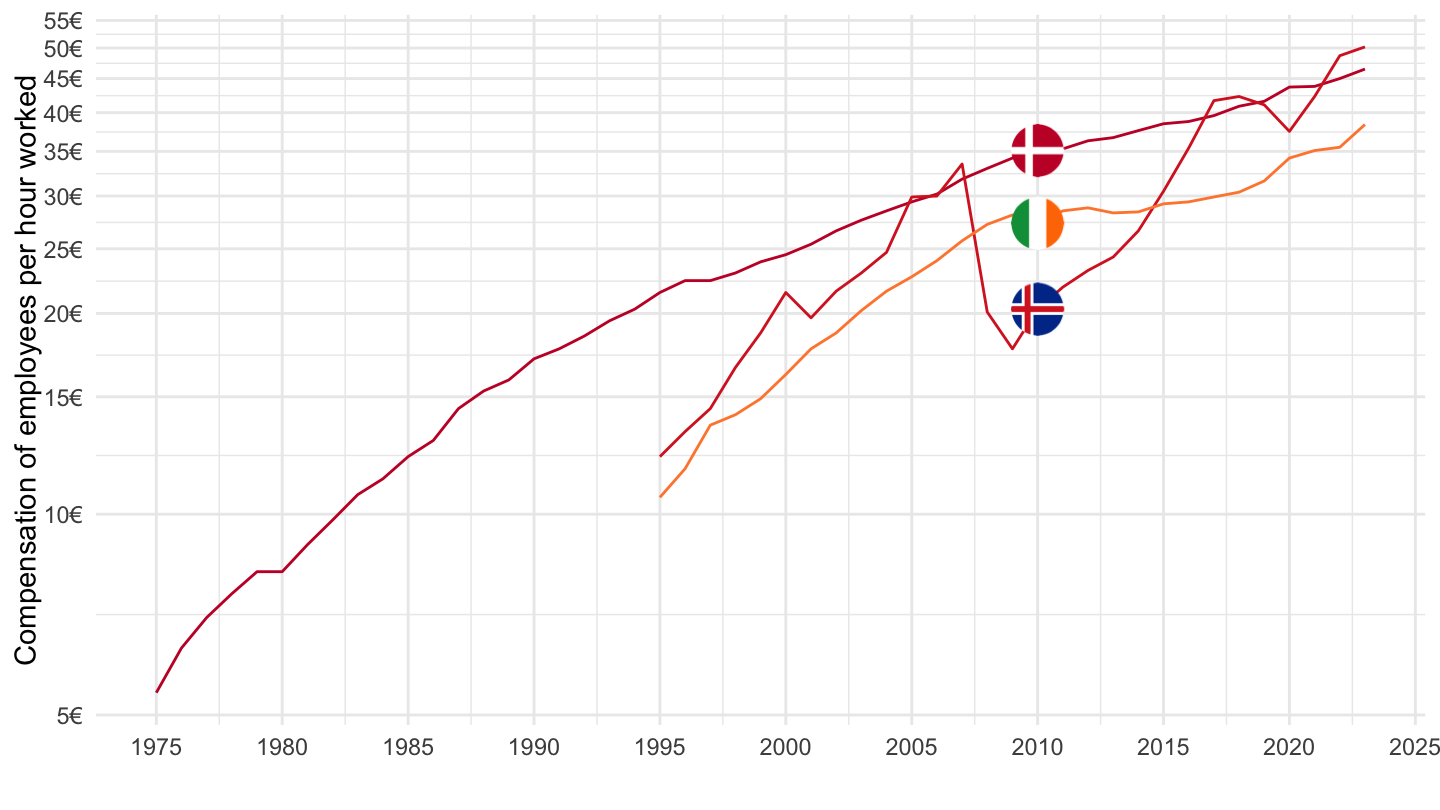
NAC
Code
nama_10_lp_ulc %>%
  filter(geo %in% c("IS", "IE", "DK"),
         na_item == "D1_SAL_HW",
         unit == "NAC") %>%
  year_to_date %>%
  left_join(geo, by = "geo") %>%
  left_join(colors, by = c("Geo" = "country")) %>%
  ggplot + theme_minimal() + xlab("") + ylab("Compensation of employees per hour worked") +
  geom_line(aes(x = date, y = values, color = color)) +
  scale_color_identity() + add_flags +
  theme(legend.position = c(0.3, 0.85),
        legend.title = element_blank()) +
  scale_x_date(breaks = as.Date(paste0(seq(1960, 2100, 5), "-01-01")),
               labels = date_format("%Y")) +
  scale_y_log10(breaks = seq(0, 200, 5),
                     labels = scales::dollar_format(su = "€", p = "", a = 1))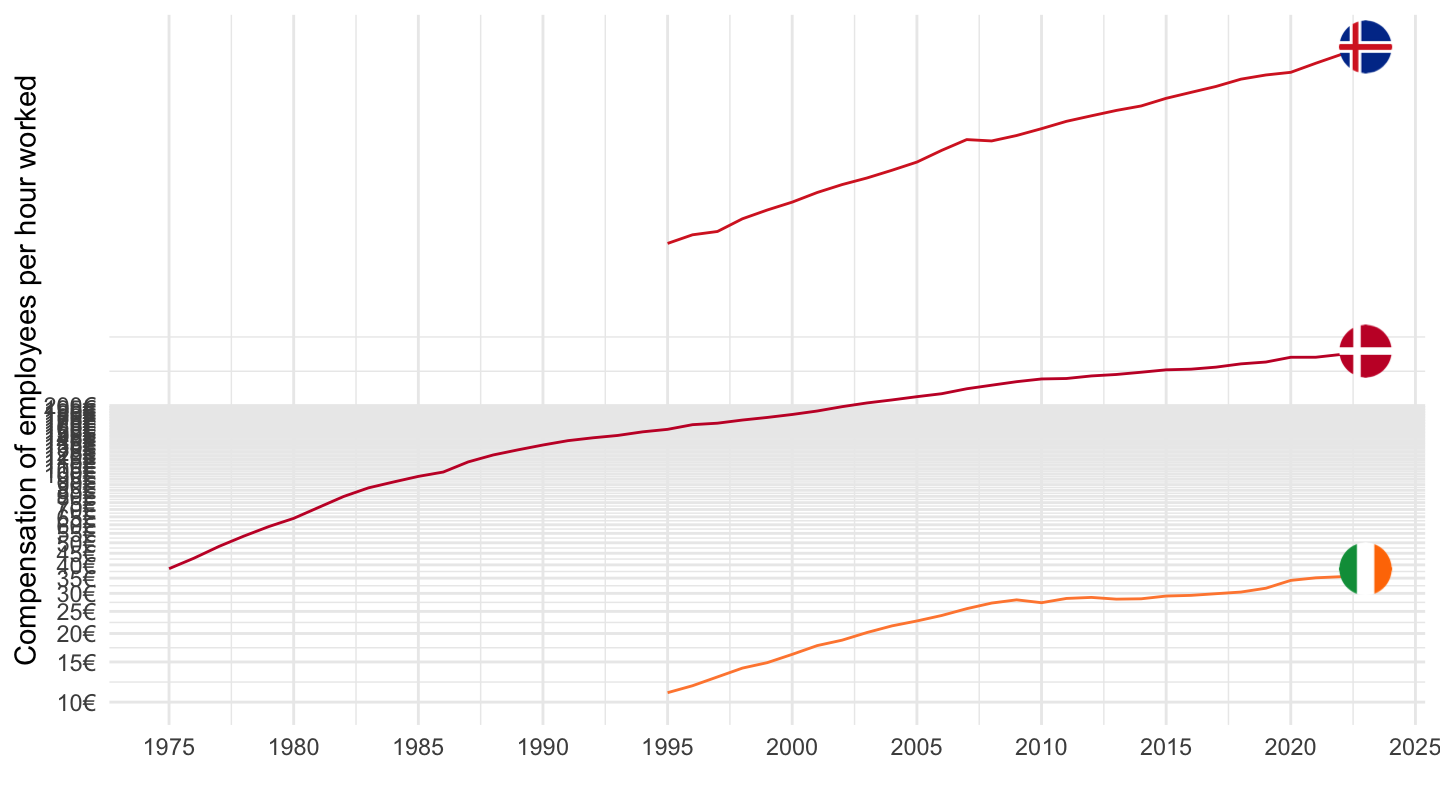
Luxembourg, Norway, Switzerland
All
Code
nama_10_lp_ulc %>%
  filter(geo %in% c("CH", "LU", "NO"),
         na_item == "D1_SAL_HW",
         unit == "EUR") %>%
  year_to_date %>%
  left_join(geo, by = "geo") %>%
  left_join(colors, by = c("Geo" = "country")) %>%
  ggplot + theme_minimal() + xlab("") + ylab("Compensation of employees per hour worked") +
  geom_line(aes(x = date, y = values, color = color)) +
  scale_color_identity() + add_flags +
  theme(legend.position = c(0.3, 0.85),
        legend.title = element_blank()) +
  scale_x_date(breaks = as.Date(paste0(seq(1960, 2100, 5), "-01-01")),
               labels = date_format("%Y")) +
  scale_y_log10(breaks = seq(0, 200, 5),
                     labels = scales::dollar_format(su = "€", p = "", a = 1))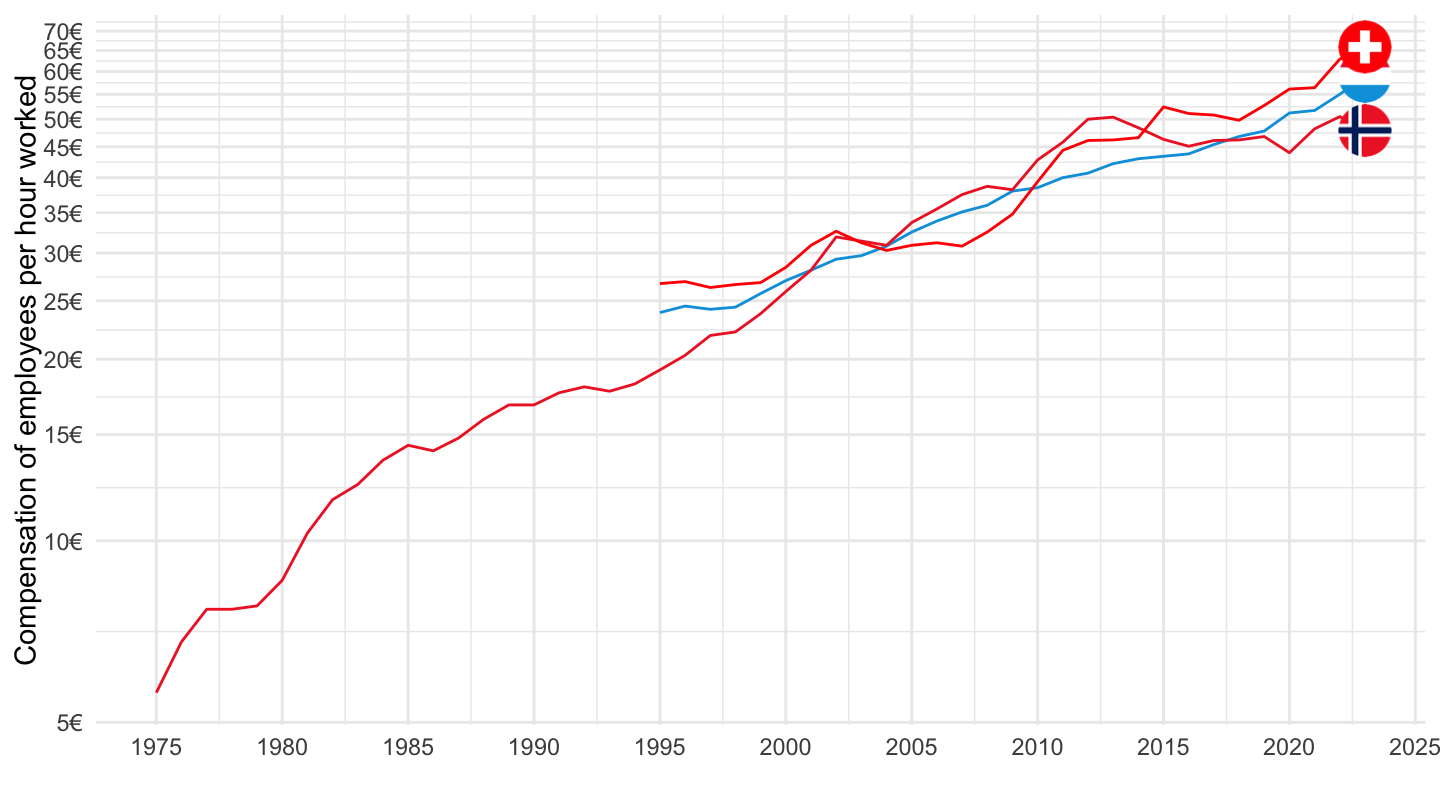
1995-
Code
nama_10_lp_ulc %>%
  filter(geo %in% c("CH", "LU", "NO"),
         na_item == "D1_SAL_HW",
         unit == "EUR") %>%
  year_to_date %>%
  filter(date >= as.Date("1995-01-01")) %>%
  left_join(geo, by = "geo") %>%
  left_join(colors, by = c("Geo" = "country")) %>%
  ggplot + theme_minimal() + xlab("") + ylab("Compensation of employees per hour worked") +
  geom_line(aes(x = date, y = values, color = color)) +
  scale_color_identity() + add_flags +
  theme(legend.position = c(0.3, 0.85),
        legend.title = element_blank()) +
  scale_x_date(breaks = as.Date(paste0(seq(1960, 2100, 5), "-01-01")),
               labels = date_format("%Y")) +
  scale_y_log10(breaks = seq(0, 200, 5),
                     labels = scales::dollar_format(su = "€", p = "", a = 1))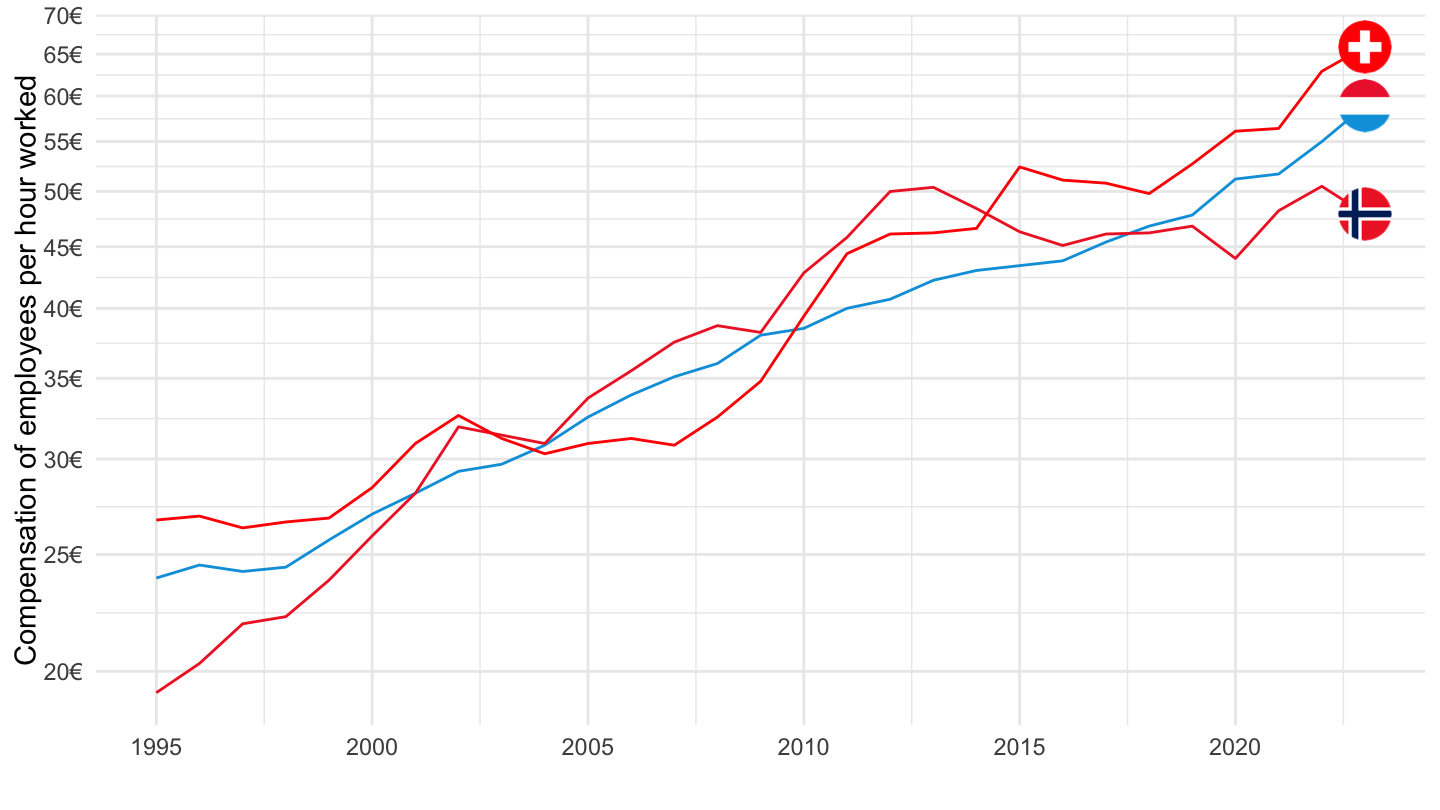
Belgium, Denmark, Iceland
All
Code
nama_10_lp_ulc %>%
  filter(geo %in% c("IS", "BE", "DK"),
         na_item == "D1_SAL_HW",
         unit == "EUR") %>%
  year_to_date %>%
  left_join(geo, by = "geo") %>%
  left_join(colors, by = c("Geo" = "country")) %>%
  ggplot + theme_minimal() + xlab("") + ylab("Compensation of employees per hour worked") +
  geom_line(aes(x = date, y = values, color = color)) +
  scale_color_identity() + add_flags +
  theme(legend.position = c(0.3, 0.85),
        legend.title = element_blank()) +
  scale_x_date(breaks = as.Date(paste0(seq(1960, 2100, 5), "-01-01")),
               labels = date_format("%Y")) +
  scale_y_log10(breaks = seq(0, 200, 5),
                     labels = scales::dollar_format(su = "€", p = "", a = 1))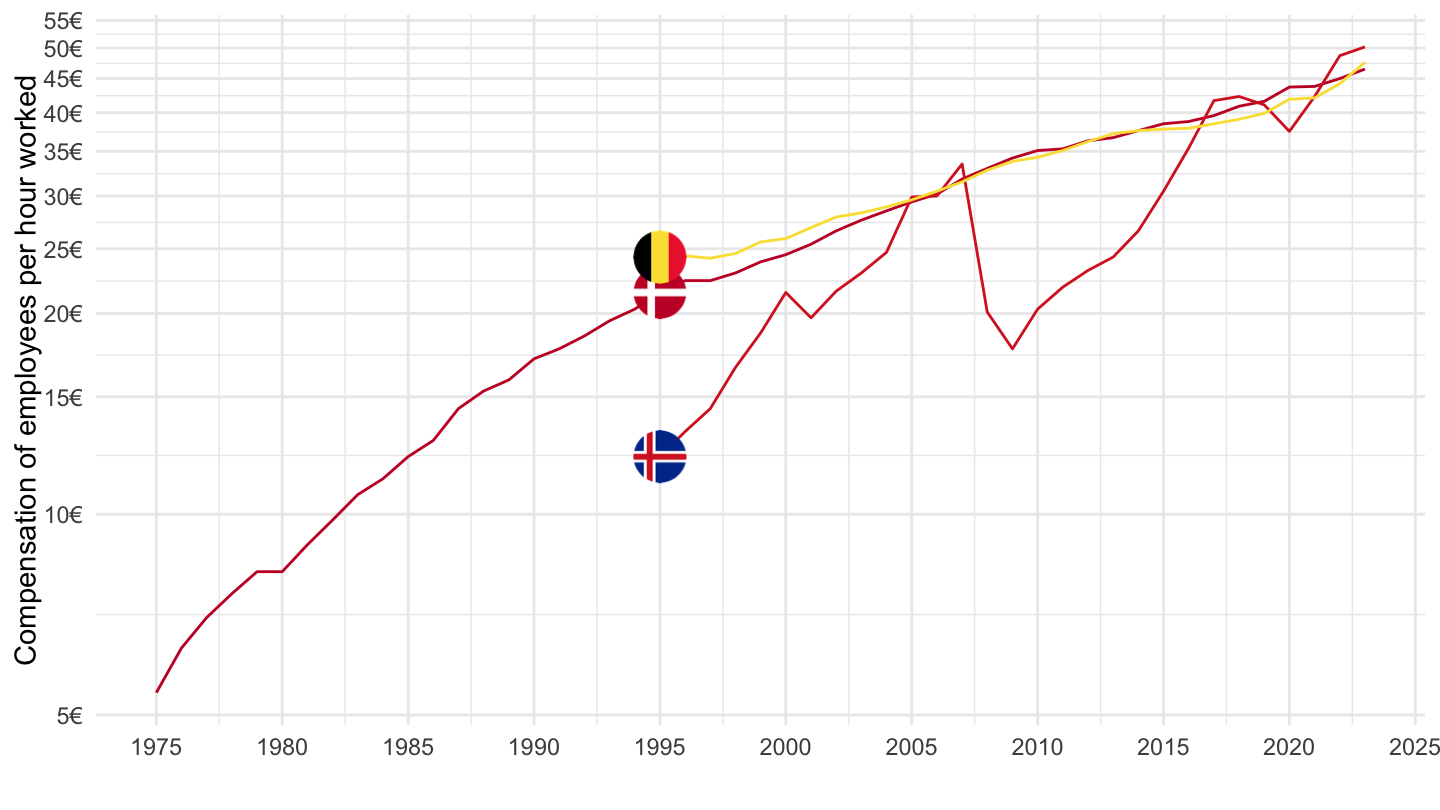
1995-
Code
nama_10_lp_ulc %>%
  filter(geo %in% c("IS", "BE", "DK"),
         na_item == "D1_SAL_HW",
         unit == "EUR") %>%
  year_to_date %>%
  filter(date >= as.Date("1995-01-01")) %>%
  left_join(geo, by = "geo") %>%
  left_join(colors, by = c("Geo" = "country")) %>%
  ggplot + theme_minimal() + xlab("") + ylab("Compensation of employees per hour worked") +
  geom_line(aes(x = date, y = values, color = color)) +
  scale_color_identity() + add_flags +
  theme(legend.position = c(0.3, 0.85),
        legend.title = element_blank()) +
  scale_x_date(breaks = as.Date(paste0(seq(1960, 2100, 5), "-01-01")),
               labels = date_format("%Y")) +
  scale_y_log10(breaks = seq(0, 200, 5),
                     labels = scales::dollar_format(su = "€", p = "", a = 1))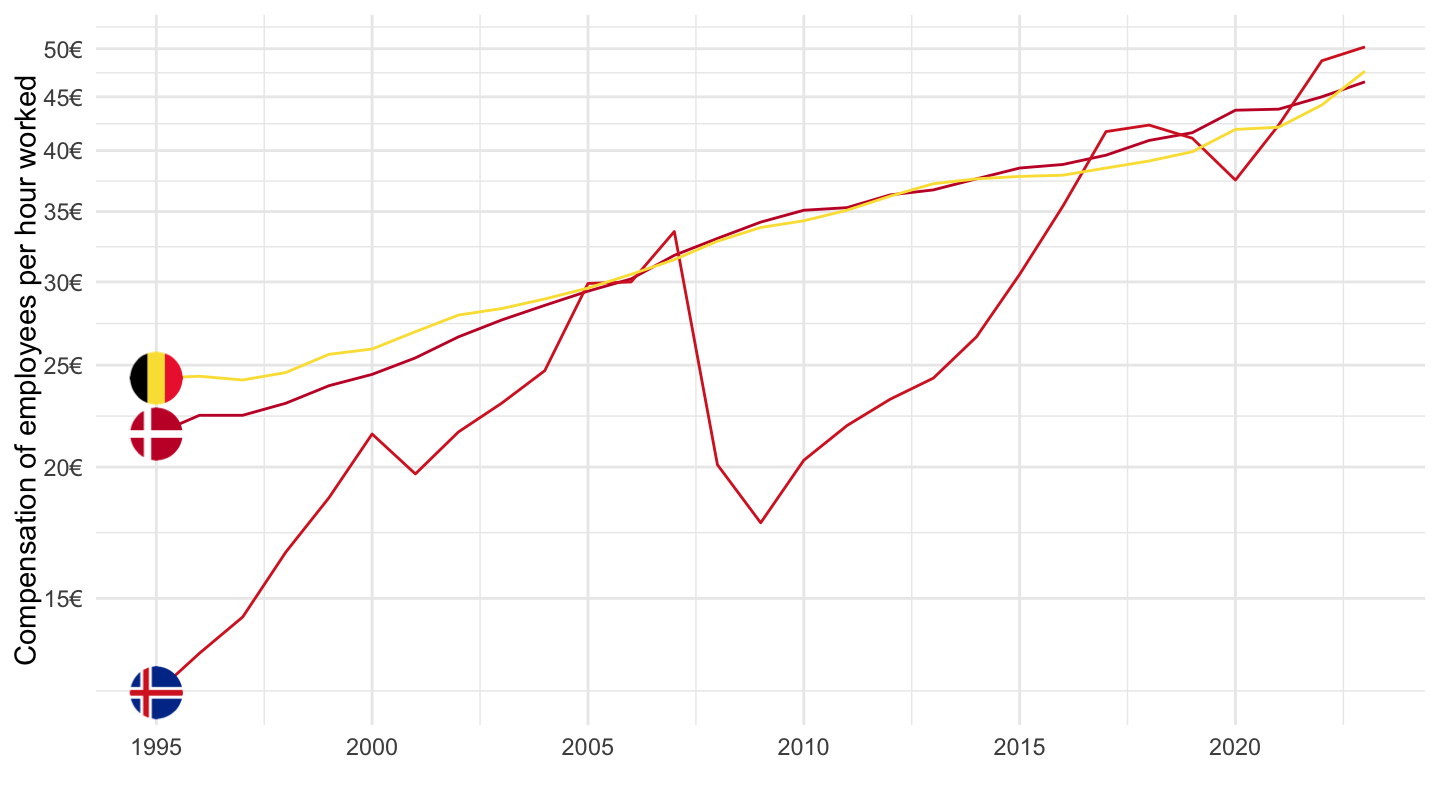
France, Ireland, Netherlands
Code
nama_10_lp_ulc %>%
  filter(geo %in% c("IE", "FR", "NL"),
         na_item == "D1_SAL_HW",
         unit == "EUR") %>%
  year_to_date %>%
  left_join(geo, by = "geo") %>%
  left_join(colors, by = c("Geo" = "country")) %>%
  ggplot + theme_minimal() + xlab("") + ylab("Compensation of employees per hour worked") +
  geom_line(aes(x = date, y = values, color = color)) +
  scale_color_identity() + add_flags +
  theme(legend.position = c(0.3, 0.85),
        legend.title = element_blank()) +
  scale_x_date(breaks = as.Date(paste0(seq(1960, 2100, 5), "-01-01")),
               labels = date_format("%Y")) +
  scale_y_log10(breaks = seq(0, 200, 5),
                     labels = scales::dollar_format(su = "€", p = "", a = 1))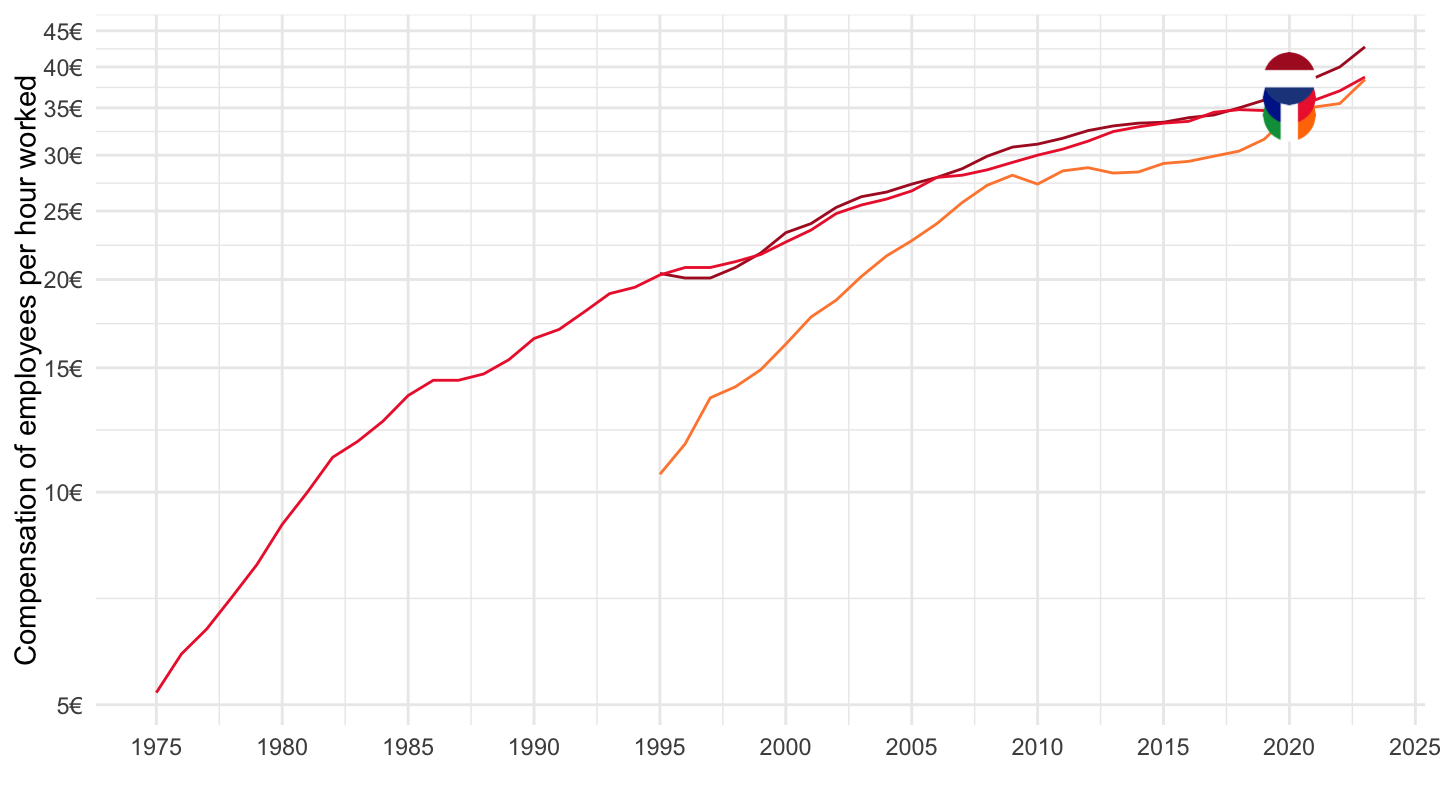
Austria, Finland, Sweden
Code
nama_10_lp_ulc %>%
  filter(geo %in% c("AT", "FI", "SE"),
         na_item == "D1_SAL_HW",
         unit == "EUR") %>%
  year_to_date %>%
  left_join(geo, by = "geo") %>%
  left_join(colors, by = c("Geo" = "country")) %>%
  ggplot + theme_minimal() + xlab("") + ylab("Compensation of employees per hour worked") +
  geom_line(aes(x = date, y = values, color = color)) +
  scale_color_identity() + add_flags +
  theme(legend.position = c(0.3, 0.85),
        legend.title = element_blank()) +
  scale_x_date(breaks = as.Date(paste0(seq(1960, 2100, 5), "-01-01")),
               labels = date_format("%Y")) +
  scale_y_log10(breaks = seq(0, 200, 5),
                     labels = scales::dollar_format(su = "€", p = "", a = 1))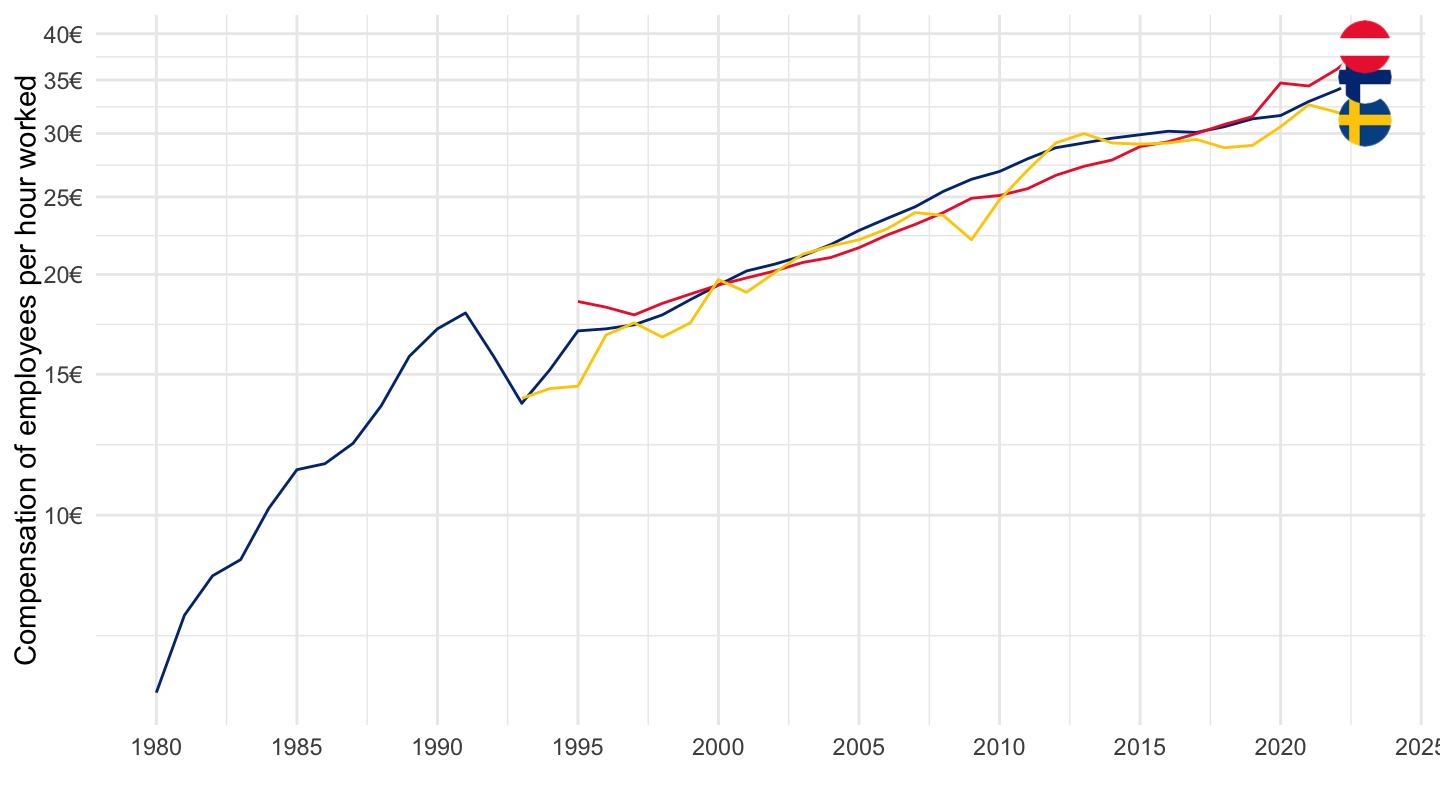
Germany, Italy, United Kingdom
Code
nama_10_lp_ulc %>%
  filter(geo %in% c("UK", "DE", "IT"),
         na_item == "D1_SAL_HW",
         unit == "EUR") %>%
  year_to_date %>%
  left_join(geo, by = "geo") %>%
  left_join(colors, by = c("Geo" = "country")) %>%
  ggplot + theme_minimal() + xlab("") + ylab("Compensation of employees per hour worked") +
  geom_line(aes(x = date, y = values, color = color)) +
  scale_color_identity() + add_flags +
  theme(legend.position = c(0.3, 0.85),
        legend.title = element_blank()) +
  scale_x_date(breaks = as.Date(paste0(seq(1960, 2100, 5), "-01-01")),
               labels = date_format("%Y")) +
  scale_y_log10(breaks = seq(0, 200, 5),
                     labels = scales::dollar_format(su = "€", p = "", a = 1))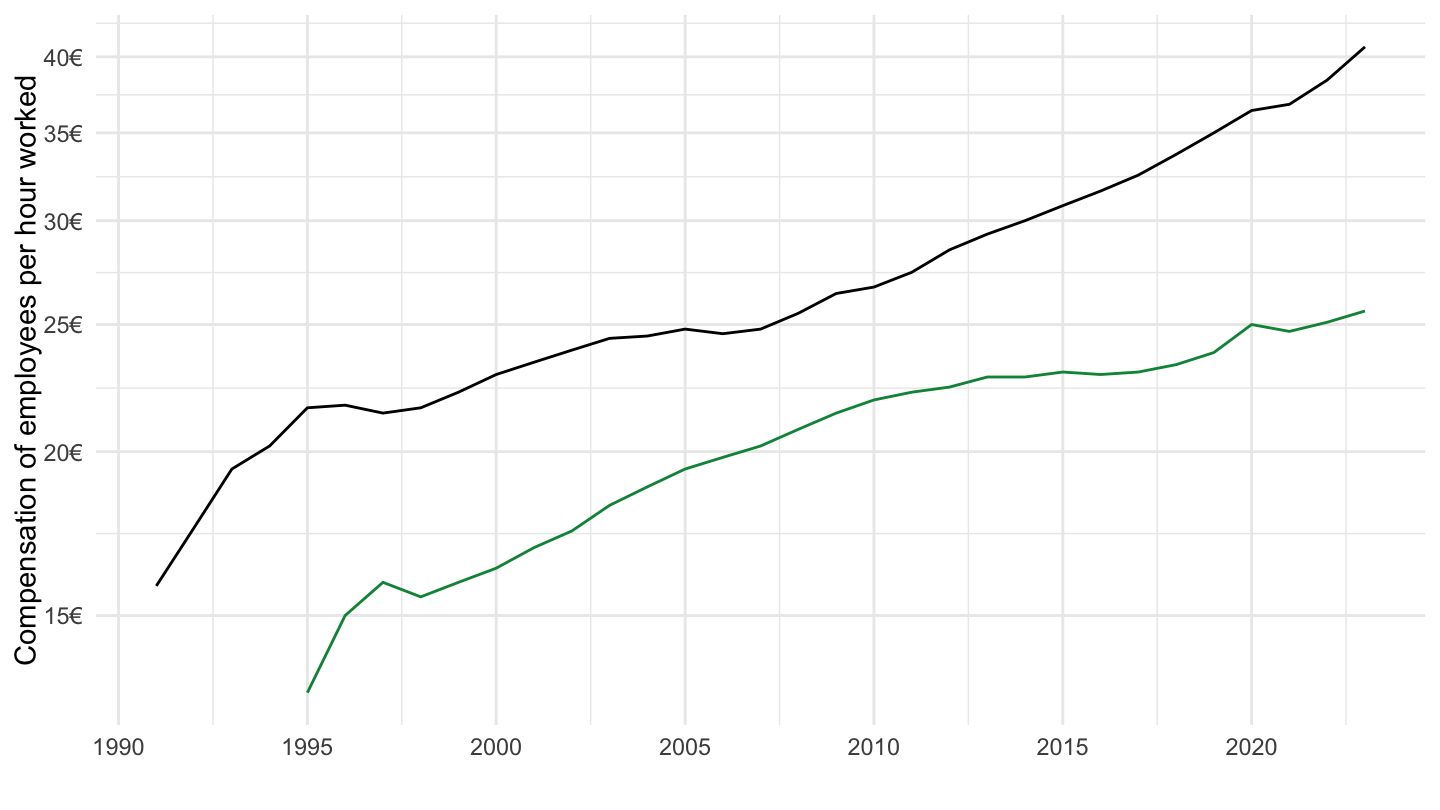
European Union, Euro Area
Code
nama_10_lp_ulc %>%
  filter(geo %in% c("EU15", "EU28", "EA19"),
         na_item == "D1_SAL_HW",
         unit == "EUR") %>%
  year_to_date %>%
  left_join(geo, by = "geo") %>%
  left_join(colors, by = c("Geo" = "country")) %>%
  ggplot + theme_minimal() + xlab("") + ylab("Compensation of employees per hour worked") +
  geom_line(aes(x = date, y = values, color = Geo)) +
  theme(legend.position = c(0.3, 0.85),
        legend.title = element_blank()) +
  scale_x_date(breaks = as.Date(paste0(seq(1960, 2100, 5), "-01-01")),
               labels = date_format("%Y")) +
  scale_y_log10(breaks = seq(0, 200, 5),
                     labels = scales::dollar_format(su = "€", p = "", a = 1))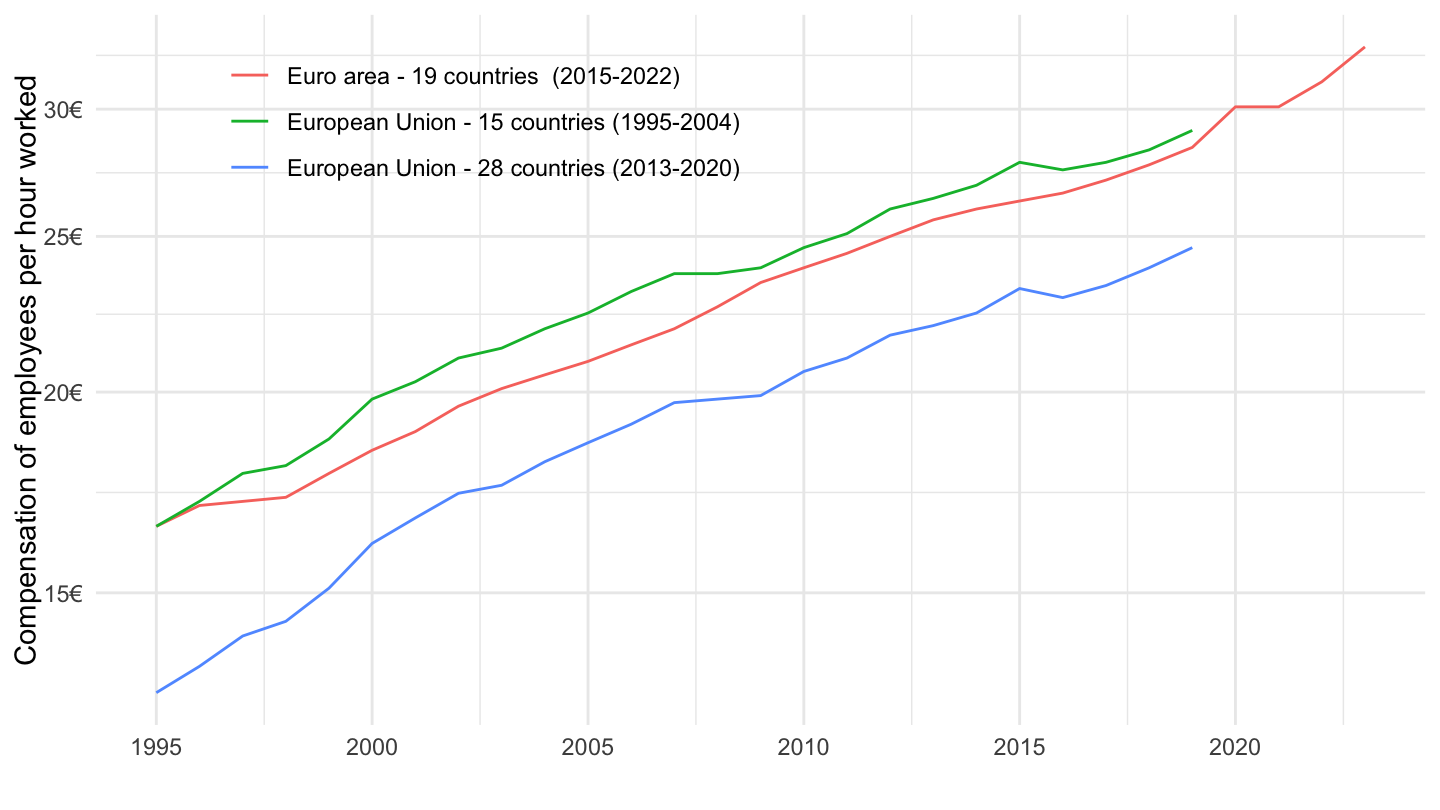
Italy, Spain, Slovenia
Code
nama_10_lp_ulc %>%
  filter(geo %in% c("IT", "ES", "SI"),
         na_item == "D1_SAL_HW",
         unit == "EUR") %>%
  year_to_date %>%
  left_join(geo, by = "geo") %>%
  left_join(colors, by = c("Geo" = "country")) %>%
  ggplot + theme_minimal() + xlab("") + ylab("Compensation of employees per hour worked") +
  geom_line(aes(x = date, y = values, color = color)) +
  scale_color_identity() + add_flags +
  theme(legend.position = c(0.3, 0.85),
        legend.title = element_blank()) +
  scale_x_date(breaks = as.Date(paste0(seq(1960, 2100, 5), "-01-01")),
               labels = date_format("%Y")) +
  scale_y_log10(breaks = seq(0, 200, 5),
                     labels = scales::dollar_format(su = "€", p = "", a = 1))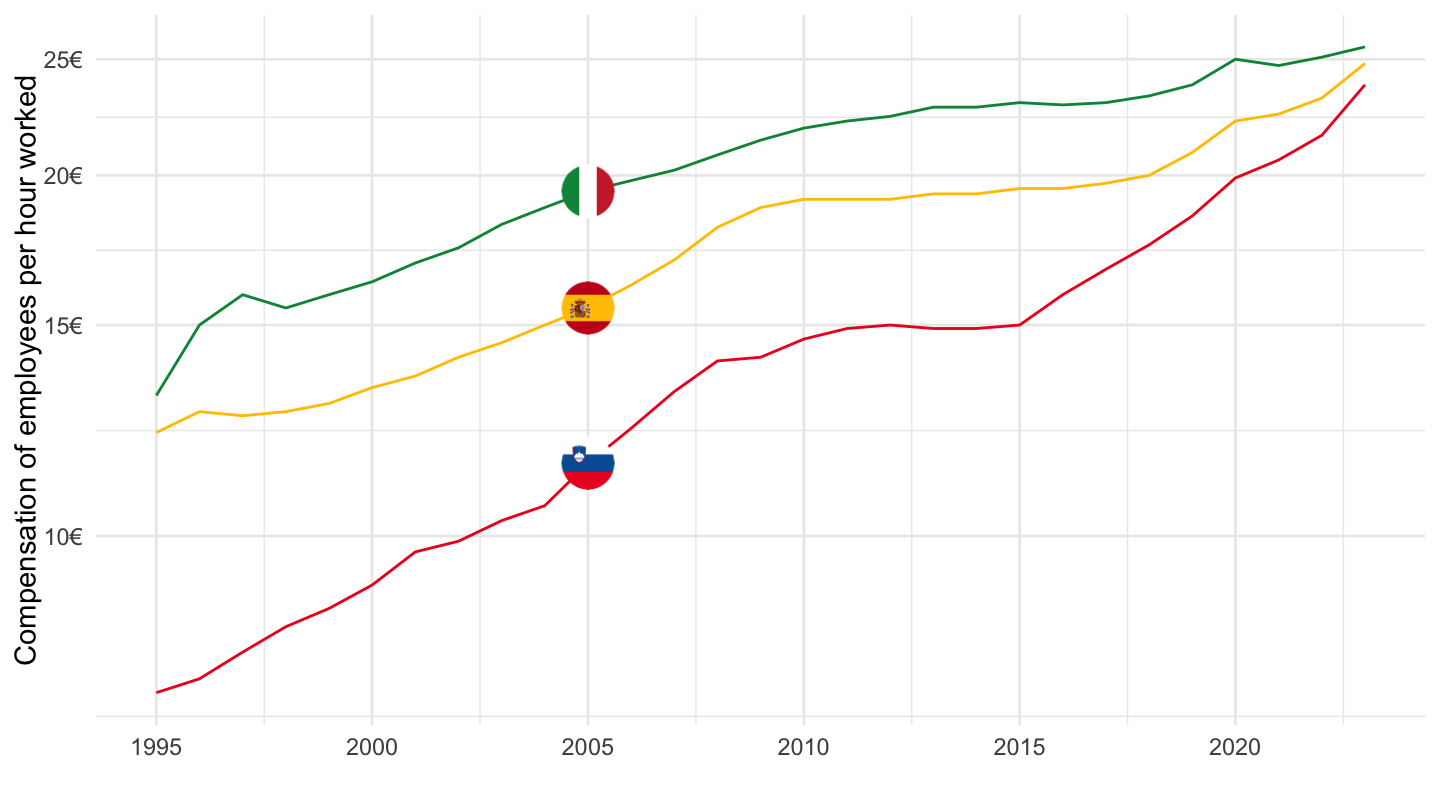
Cyprus, Estonia, Malta
Code
nama_10_lp_ulc %>%
  filter(geo %in% c("MT", "CY", "EE"),
         na_item == "D1_SAL_HW",
         unit == "EUR") %>%
  year_to_date %>%
  left_join(geo, by = "geo") %>%
  left_join(colors, by = c("Geo" = "country")) %>%
  ggplot + theme_minimal() + xlab("") + ylab("Compensation of employees per hour worked") +
  geom_line(aes(x = date, y = values, color = color)) +
  scale_color_identity() + add_flags +
  theme(legend.position = c(0.3, 0.85),
        legend.title = element_blank()) +
  scale_x_date(breaks = as.Date(paste0(seq(1960, 2100, 5), "-01-01")),
               labels = date_format("%Y")) +
  scale_y_log10(breaks = seq(0, 200, 1),
                     labels = scales::dollar_format(su = "€", p = "", a = 1))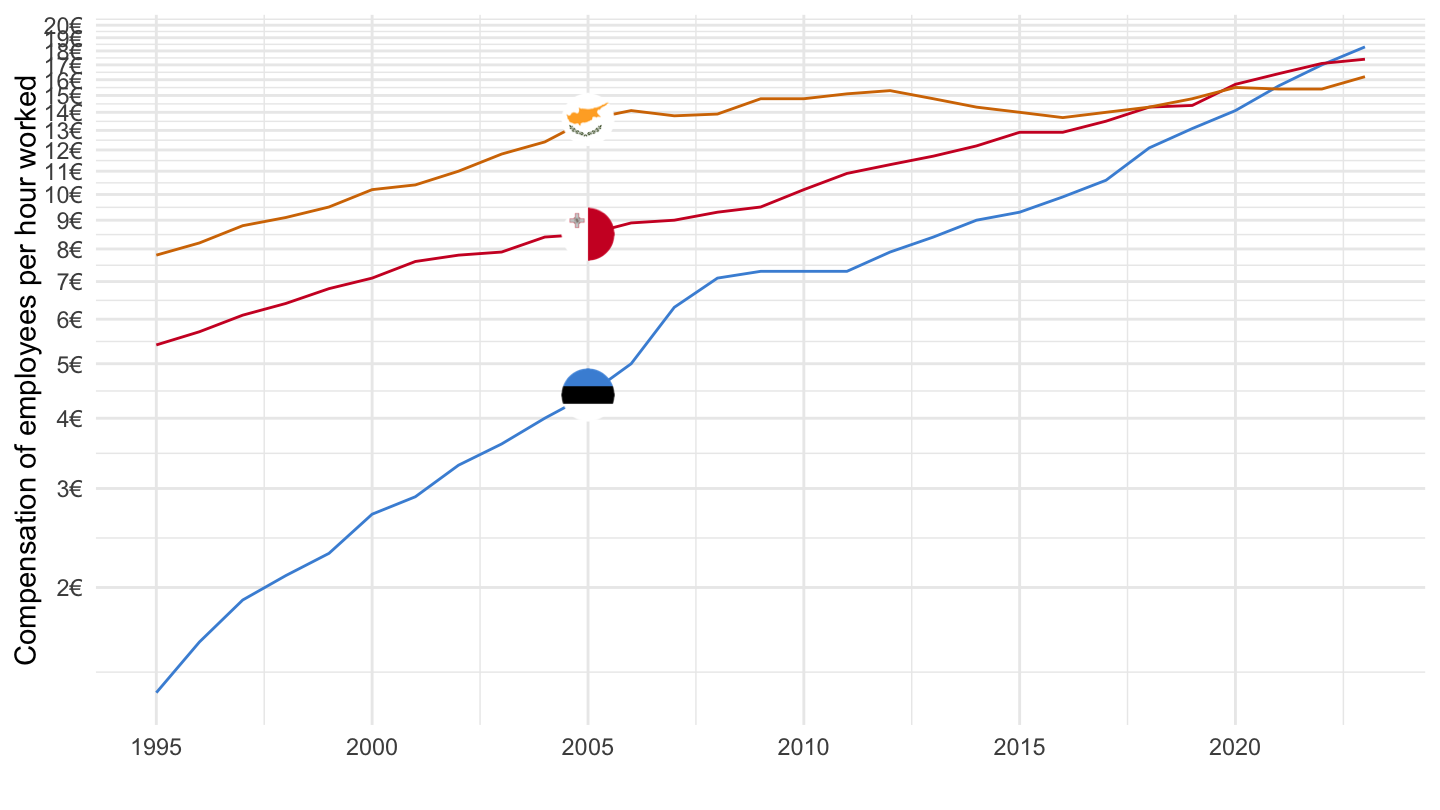
Greece, Czechia, Portugal
Code
nama_10_lp_ulc %>%
  filter(geo %in% c("PT", "CZ", "EL"),
         na_item == "D1_SAL_HW",
         unit == "EUR") %>%
  year_to_date %>%
  left_join(geo, by = "geo") %>%
  left_join(colors, by = c("Geo" = "country")) %>%
  ggplot + theme_minimal() + xlab("") + ylab("Compensation of employees per hour worked") +
  geom_line(aes(x = date, y = values, color = color)) +
  scale_color_identity() + add_flags +
  theme(legend.position = c(0.3, 0.85),
        legend.title = element_blank()) +
  scale_x_date(breaks = as.Date(paste0(seq(1960, 2100, 5), "-01-01")),
               labels = date_format("%Y")) +
  scale_y_log10(breaks = seq(0, 200, 1),
                     labels = scales::dollar_format(su = "€", p = "", a = 1))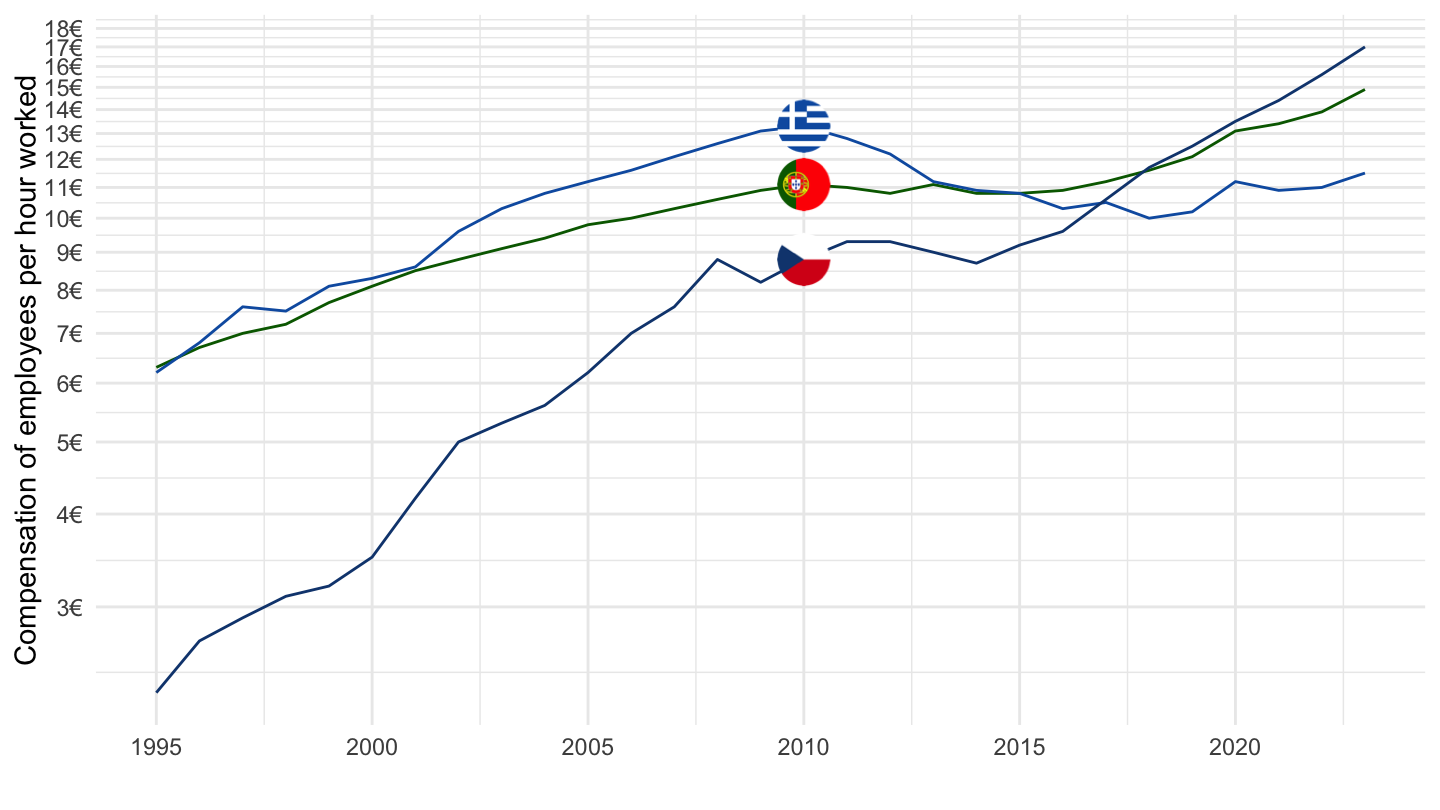
Latvia, Lithuania, Slovakia
Code
nama_10_lp_ulc %>%
  filter(geo %in% c("LV", "SK", "LT"),
         na_item == "D1_SAL_HW",
         unit == "EUR") %>%
  year_to_date %>%
  left_join(geo, by = "geo") %>%
  left_join(colors, by = c("Geo" = "country")) %>%
  ggplot + theme_minimal() + xlab("") + ylab("Compensation of employees per hour worked") +
  geom_line(aes(x = date, y = values, color = color)) +
  scale_color_identity() + add_flags +
  theme(legend.position = c(0.3, 0.85),
        legend.title = element_blank()) +
  scale_x_date(breaks = as.Date(paste0(seq(1960, 2100, 5), "-01-01")),
               labels = date_format("%Y")) +
  scale_y_log10(breaks = seq(0, 200, 5),
                     labels = scales::dollar_format(su = "€", p = "", a = 1))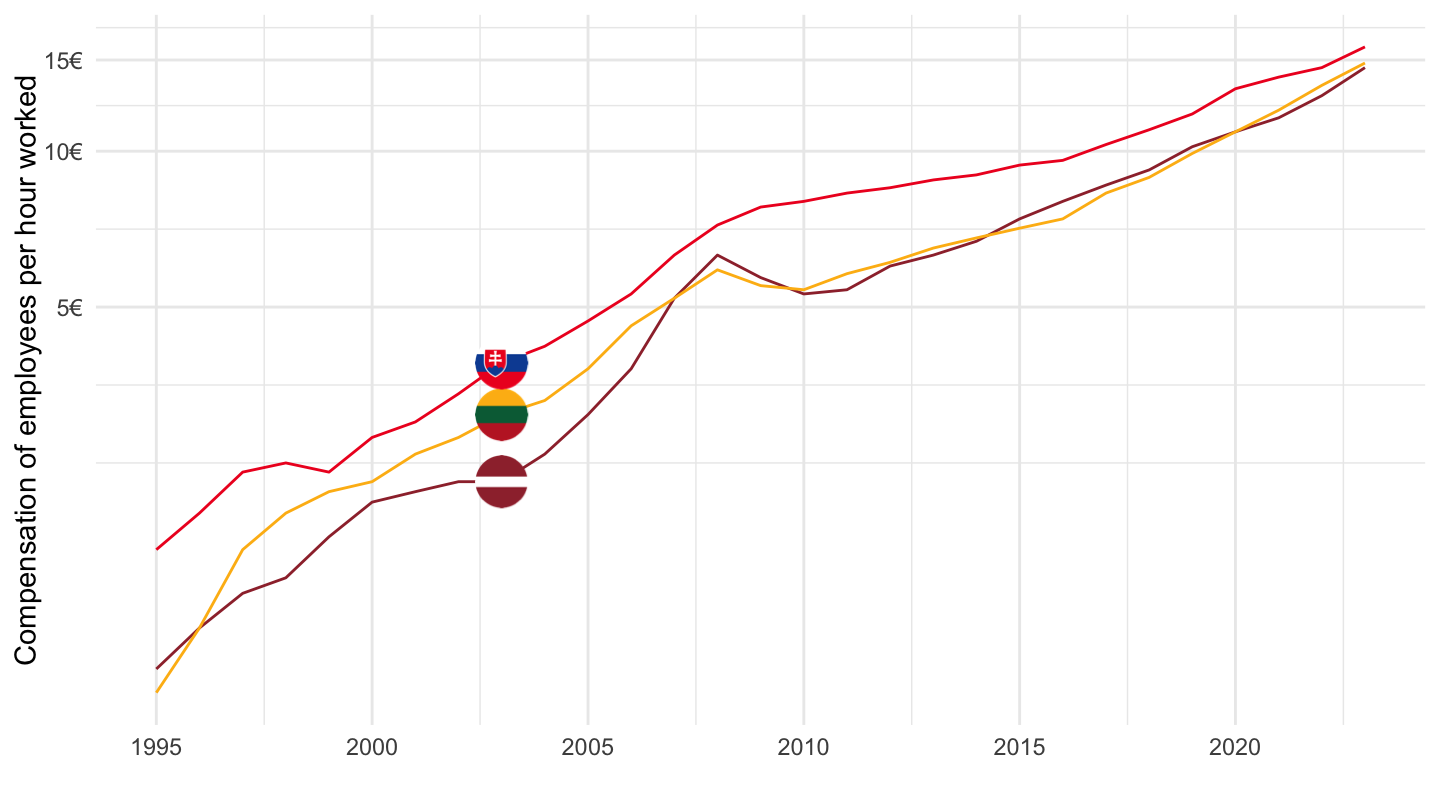
Croatia, Hungary, Poland
Euro
Code
nama_10_lp_ulc %>%
  filter(geo %in% c("HR", "PL", "HU"),
         na_item == "D1_SAL_HW",
         unit == "EUR") %>%
  year_to_date %>%
  left_join(geo, by = "geo") %>%
  left_join(colors, by = c("Geo" = "country")) %>%
  ggplot + theme_minimal() + xlab("") + ylab("Compensation of employees per hour worked") +
  geom_line(aes(x = date, y = values, color = color)) +
  scale_color_identity() + add_flags +
  theme(legend.position = c(0.3, 0.85),
        legend.title = element_blank()) +
  scale_x_date(breaks = as.Date(paste0(seq(1960, 2100, 5), "-01-01")),
               labels = date_format("%Y")) +
  scale_y_log10(breaks = seq(0, 200, 5),
                     labels = scales::dollar_format(su = "€", p = "", a = 1))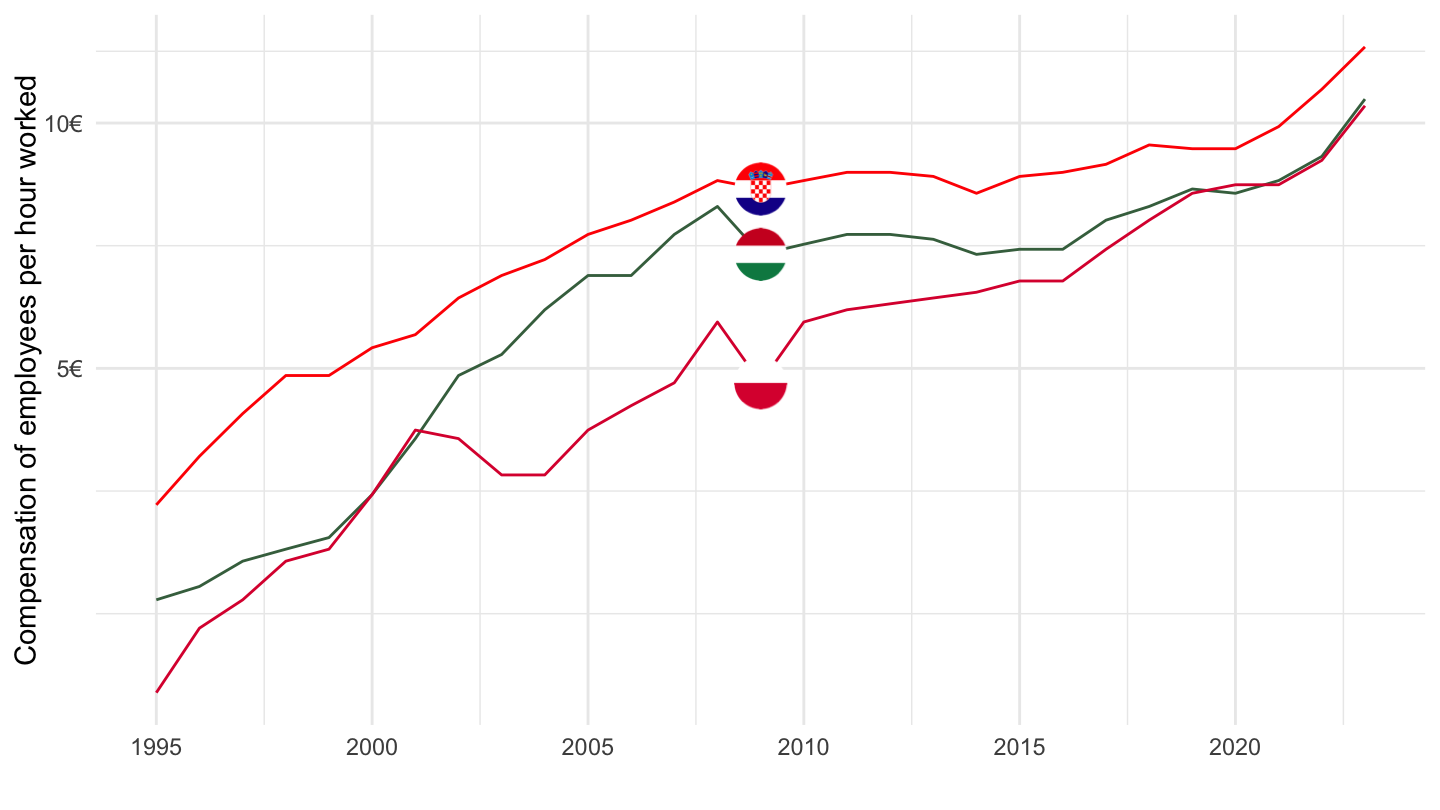
National Currency
All
Code
nama_10_lp_ulc %>%
  filter(geo %in% c("HR", "PL", "HU"),
         na_item == "D1_SAL_HW",
         unit == "NAC") %>%
  year_to_date %>%
  left_join(geo, by = "geo") %>%
  left_join(colors, by = c("Geo" = "country")) %>%
  ggplot + theme_minimal() + xlab("") + ylab("Compensation of employees per hour worked") +
  geom_line(aes(x = date, y = values, color = color)) +
  scale_color_identity() + add_flags +
  theme(legend.position = c(0.3, 0.85),
        legend.title = element_blank()) +
  scale_x_date(breaks = as.Date(paste0(seq(1960, 2100, 5), "-01-01")),
               labels = date_format("%Y")) +
  scale_y_log10(breaks = seq(0, 200, 5),
                     labels = scales::dollar_format(su = "€", p = "", a = 1))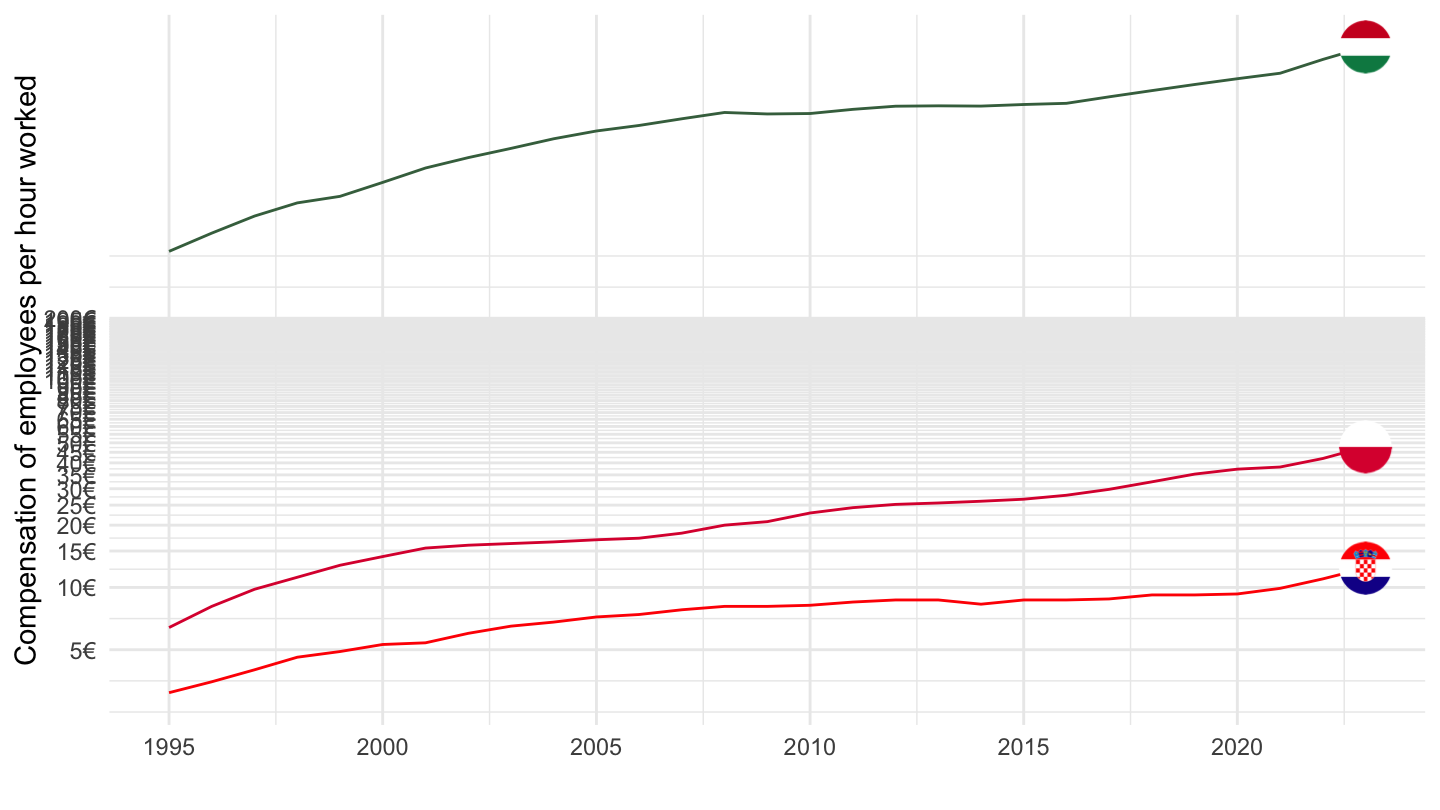
Index
Code
nama_10_lp_ulc %>%
  # HR: Croatia
  filter(geo %in% c("HR", "PL", "HU"),
         na_item == "D1_SAL_HW",
         unit %in% c("EUR", "NAC")) %>%
  year_to_date %>%
  left_join(geo, by = "geo") %>%
  left_join(unit, by = "unit") %>%
  left_join(colors, by = c("Geo" = "country")) %>%
  mutate(color = ifelse(geo == "HR", color2, color)) %>%
  group_by(Geo) %>%
  mutate(values = 100*values/values[date == as.Date("1995-01-01")]) %>%
  ggplot + theme_minimal() + xlab("") + ylab("Compensation of employees per hour worked") +
  geom_line(aes(x = date, y = values, color = color, linetype = Unit)) +
  scale_color_identity() + add_flags +
  theme(legend.position = c(0.3, 0.85),
        legend.title = element_blank()) +
  scale_x_date(breaks = as.Date(paste0(seq(1960, 2100, 5), "-01-01")),
               labels = date_format("%Y")) +
  scale_y_log10(breaks = seq(0, 1000, 50))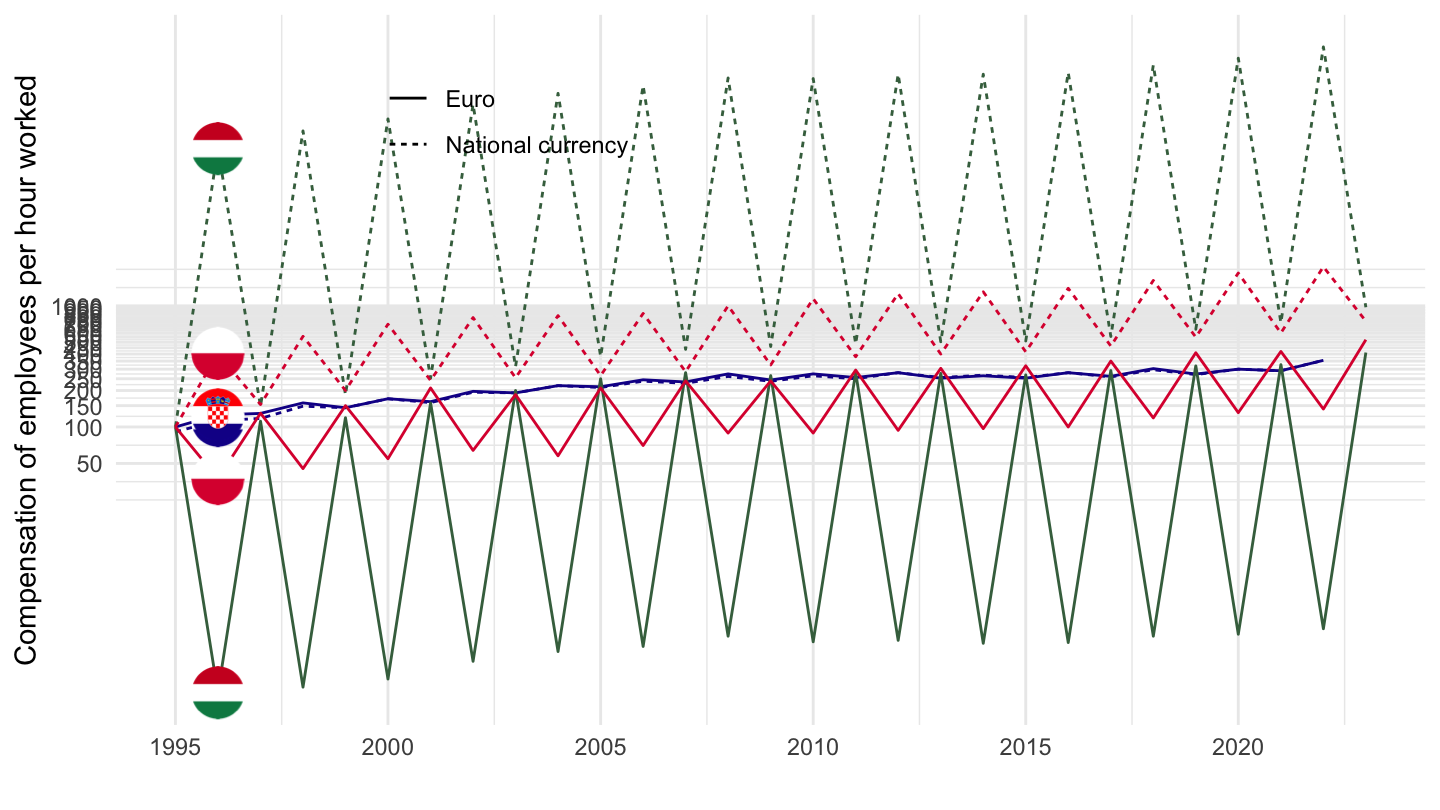
Romania, Bulgaria
Euro
Code
nama_10_lp_ulc %>%
  filter(geo %in% c("RO", "BG"),
         na_item == "D1_SAL_HW",
         unit == "EUR") %>%
  year_to_date %>%
  left_join(geo, by = "geo") %>%
  left_join(colors, by = c("Geo" = "country")) %>%
  ggplot + theme_minimal() + xlab("") + ylab("Compensation of employees per hour worked") +
  geom_line(aes(x = date, y = values, color = color)) +
  scale_color_identity() + add_flags +
  theme(legend.position = c(0.3, 0.85),
        legend.title = element_blank()) +
  scale_x_date(breaks = as.Date(paste0(seq(1960, 2100, 5), "-01-01")),
               labels = date_format("%Y")) +
  scale_y_log10(breaks = seq(0, 200, 1),
                     labels = scales::dollar_format(su = "€", p = "", a = 1))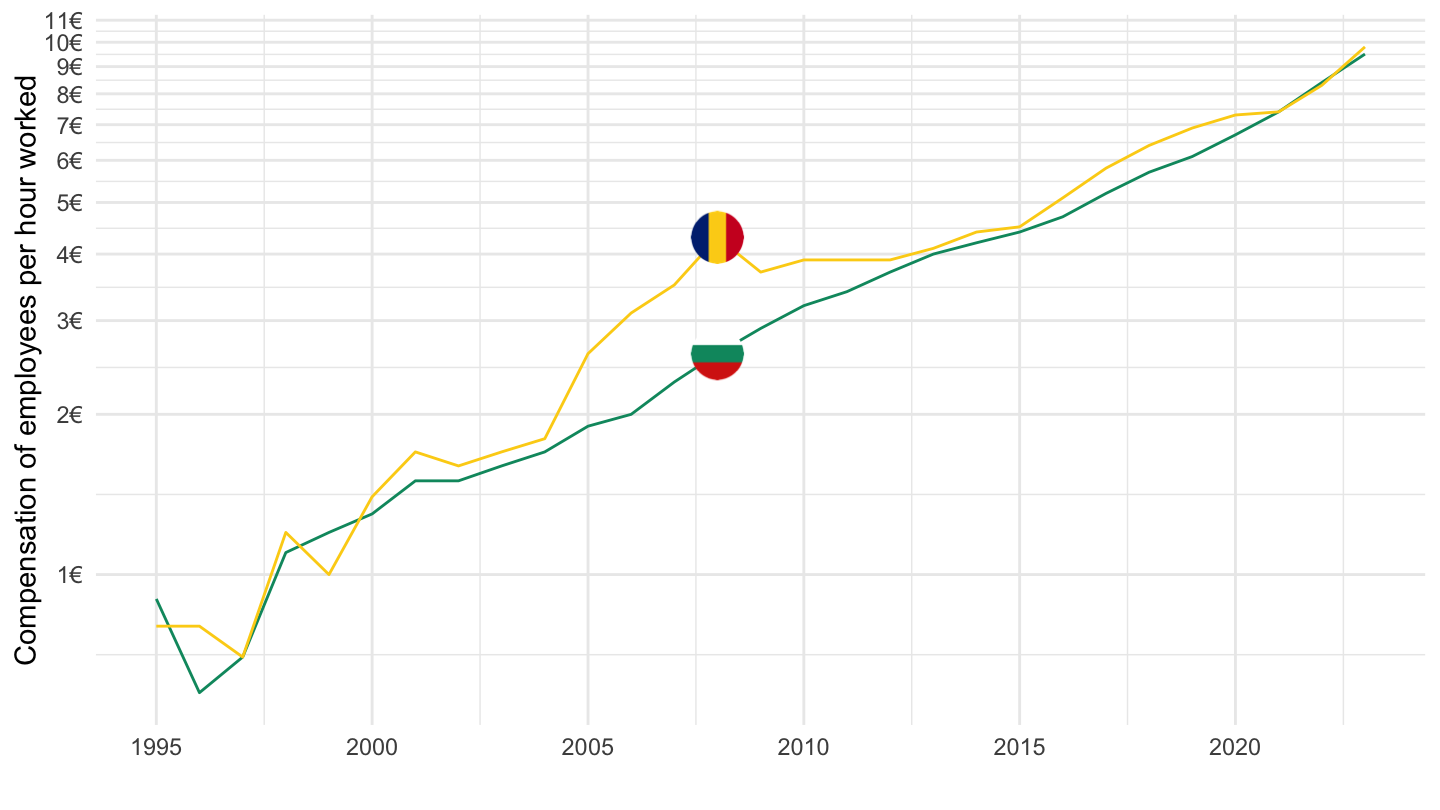
NAC
Code
nama_10_lp_ulc %>%
  filter(geo %in% c("RO", "BG"),
         na_item == "D1_SAL_HW",
         unit == "NAC") %>%
  year_to_date %>%
  left_join(geo, by = "geo") %>%
  left_join(colors, by = c("Geo" = "country")) %>%
  ggplot + theme_minimal() + xlab("") + ylab("Compensation of employees per hour worked") +
  geom_line(aes(x = date, y = values, color = color)) +
  scale_color_identity() + add_flags +
  theme(legend.position = c(0.3, 0.85),
        legend.title = element_blank()) +
  scale_x_date(breaks = as.Date(paste0(seq(1960, 2100, 5), "-01-01")),
               labels = date_format("%Y")) +
  scale_y_log10(breaks = seq(0, 200, 1),
                     labels = scales::dollar_format(su = "€", p = "", a = 1))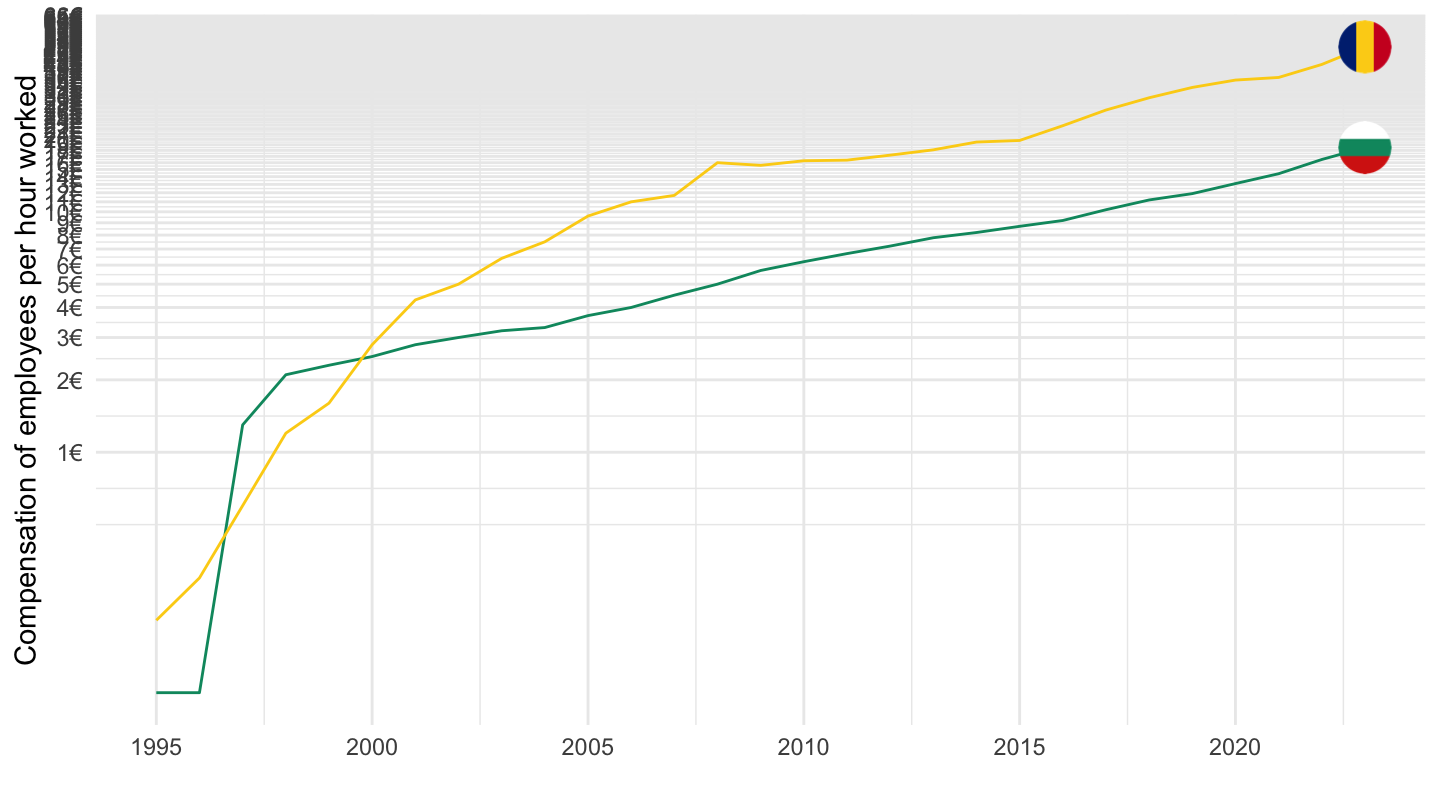
D1_SAL_PER - Compensation per employee
France, Germany, Italy
Code
nama_10_lp_ulc %>%
  filter(geo %in% c("FR", "DE", "IT"),
         na_item == "D1_SAL_PER",
         unit == "EUR") %>%
  year_to_date %>%
  left_join(geo, by = "geo") %>%
  left_join(colors, by = c("Geo" = "country")) %>%
  mutate(values = values/1000) %>%
  ggplot + theme_minimal() + xlab("") + ylab("Compensation per employee") +
  geom_line(aes(x = date, y = values, color = color)) +
  scale_color_identity() + add_flags +
  theme(legend.position = c(0.3, 0.85),
        legend.title = element_blank()) +
  scale_x_date(breaks = as.Date(paste0(seq(1960, 2100, 5), "-01-01")),
               labels = date_format("%Y")) +
  scale_y_log10(breaks = seq(0, 200, 10),
                     labels = scales::dollar_format(su = "k€", p = "", a = 1))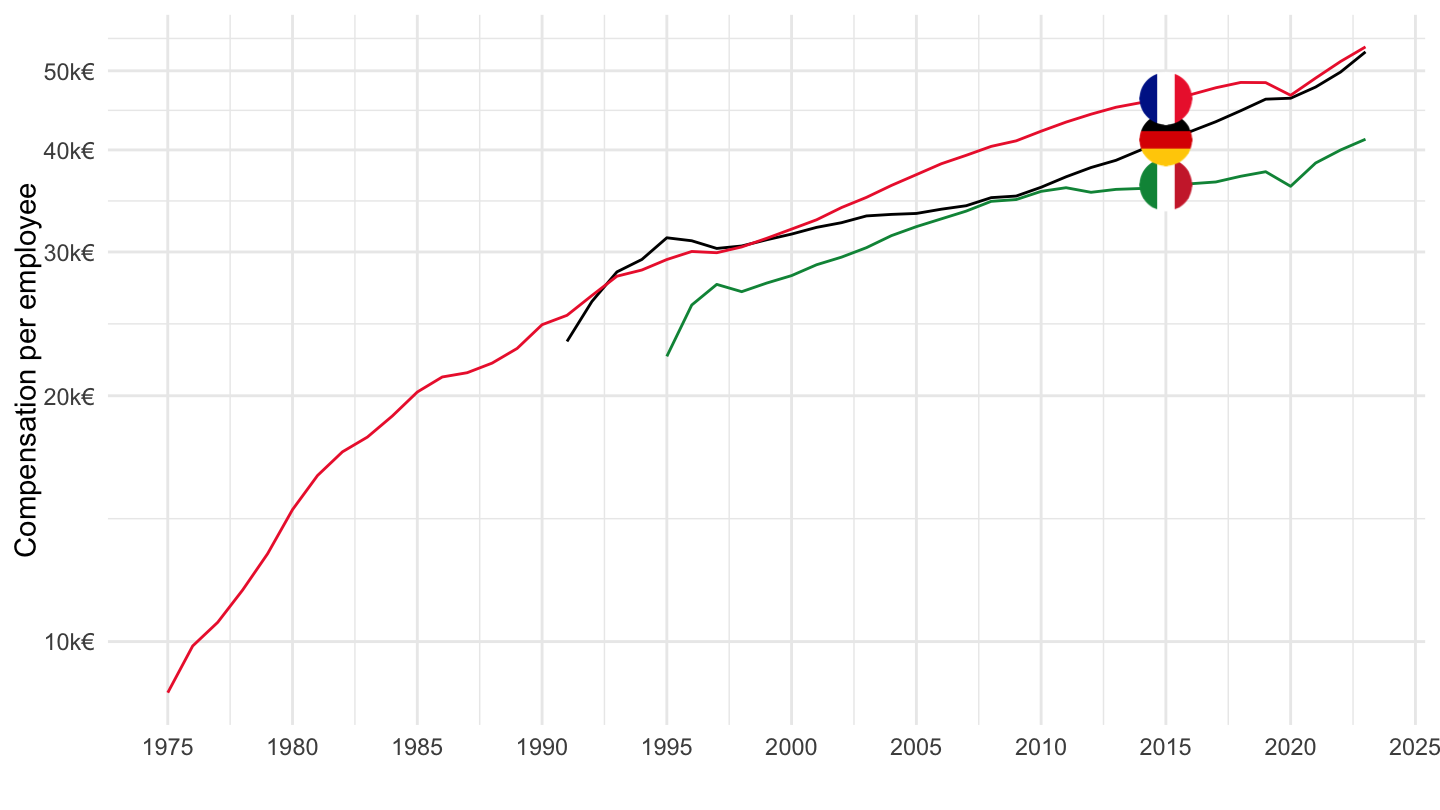
Iceland, Ireland, Denmark
Code
nama_10_lp_ulc %>%
  filter(geo %in% c("IS", "IE", "DK"),
         na_item == "D1_SAL_PER",
         unit == "EUR") %>%
  year_to_date %>%
  left_join(geo, by = "geo") %>%
  left_join(colors, by = c("Geo" = "country")) %>%
  mutate(values = values/1000) %>%
  ggplot + theme_minimal() + xlab("") + ylab("Compensation per employee") +
  geom_line(aes(x = date, y = values, color = color)) +
  scale_color_identity() + add_flags +
  theme(legend.position = c(0.3, 0.85),
        legend.title = element_blank()) +
  scale_x_date(breaks = as.Date(paste0(seq(1960, 2100, 5), "-01-01")),
               labels = date_format("%Y")) +
  scale_y_log10(breaks = seq(0, 200, 10),
                     labels = scales::dollar_format(su = "k€", p = "", a = 1))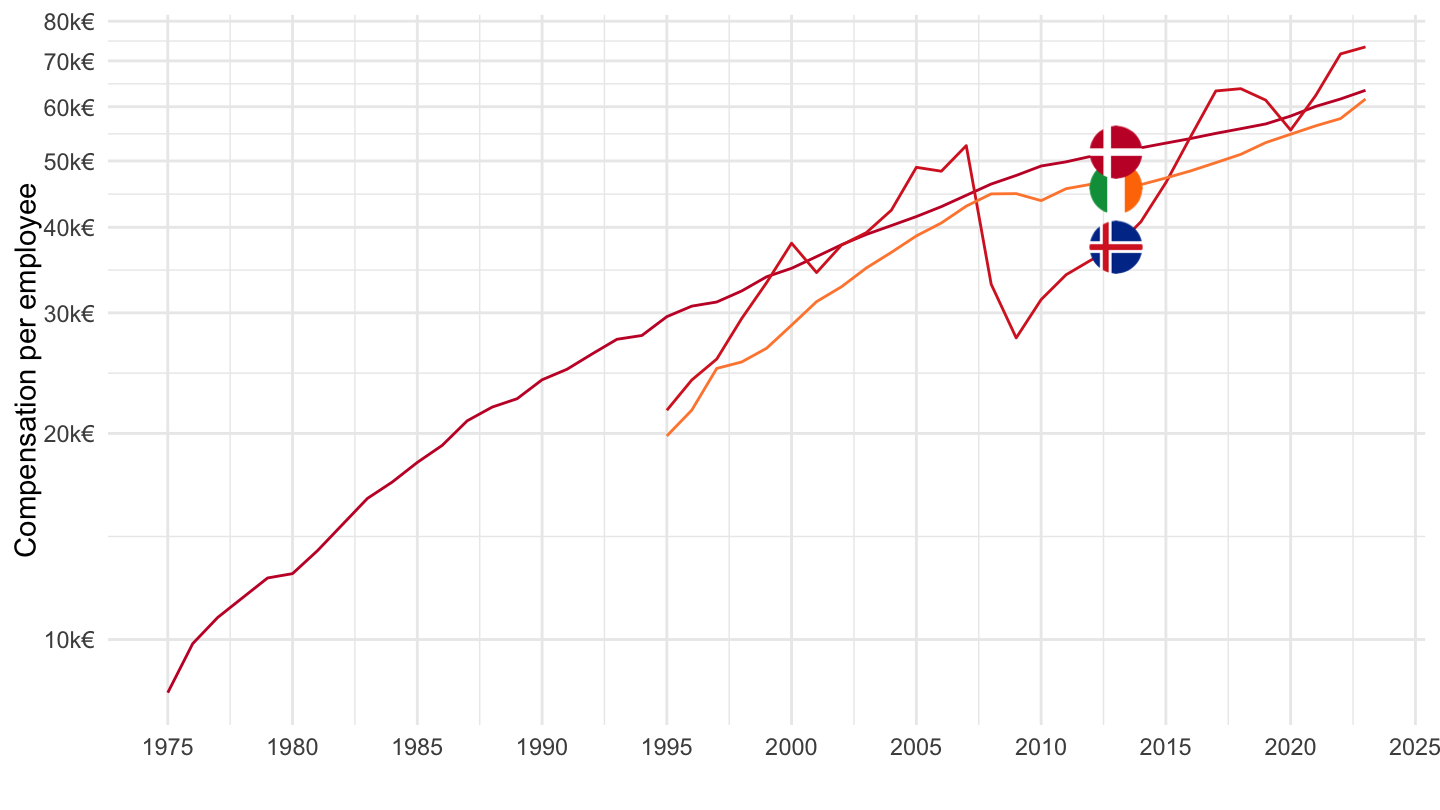
Luxembourg, Norway, Switzerland
All
Code
nama_10_lp_ulc %>%
  filter(geo %in% c("CH", "LU", "NO"),
         na_item == "D1_SAL_PER",
         unit == "EUR") %>%
  year_to_date %>%
  left_join(geo, by = "geo") %>%
  left_join(colors, by = c("Geo" = "country")) %>%
  mutate(values = values/1000) %>%
  ggplot + theme_minimal() + xlab("") + ylab("Compensation per employee") +
  geom_line(aes(x = date, y = values, color = color)) +
  scale_color_identity() + add_flags +
  theme(legend.position = c(0.3, 0.85),
        legend.title = element_blank()) +
  scale_x_date(breaks = as.Date(paste0(seq(1960, 2100, 5), "-01-01")),
               labels = date_format("%Y")) +
  scale_y_log10(breaks = seq(0, 200, 10),
                     labels = scales::dollar_format(su = "k€", p = "", a = 1))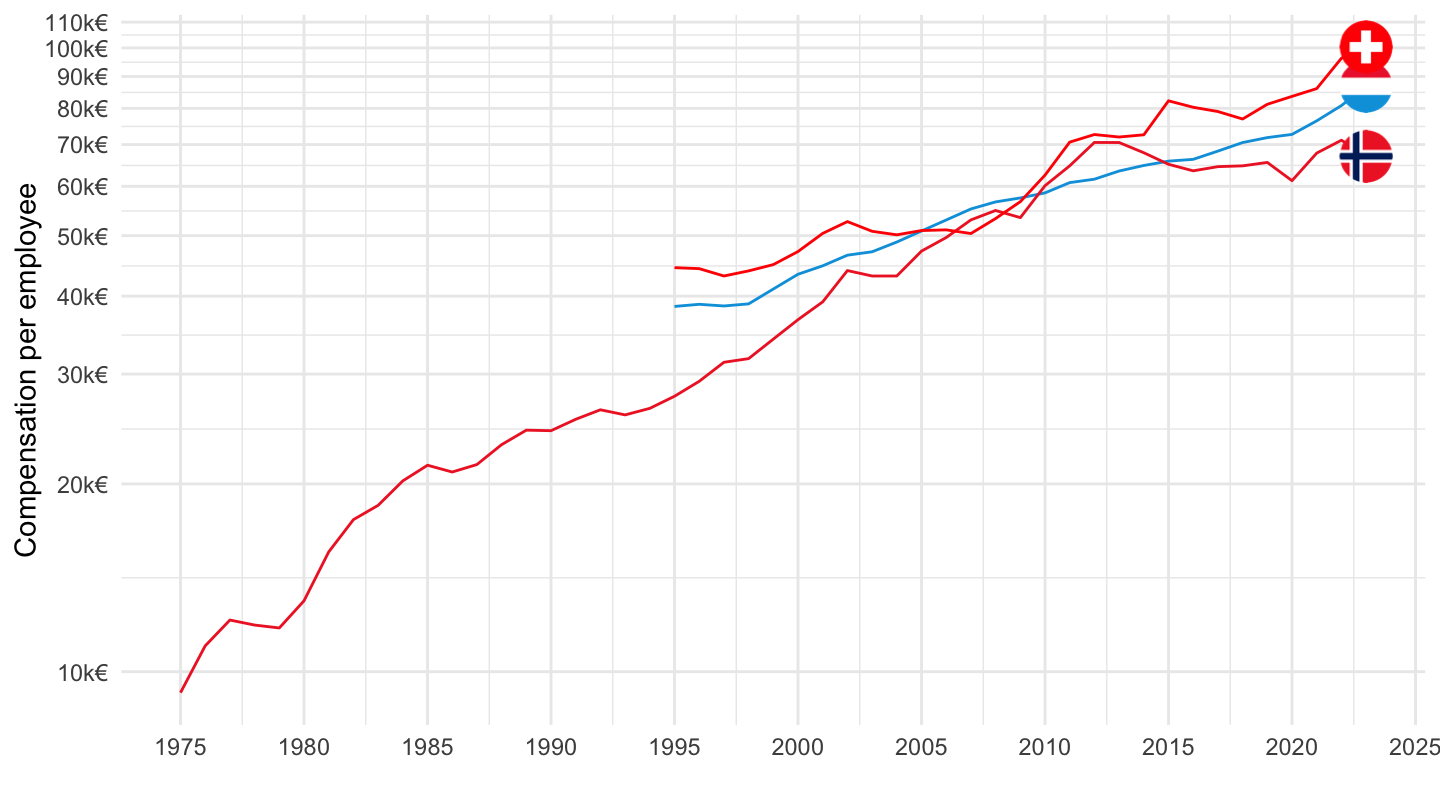
1995-
Code
nama_10_lp_ulc %>%
  filter(geo %in% c("CH", "LU", "NO"),
         na_item == "D1_SAL_PER",
         unit == "EUR") %>%
  year_to_date %>%
  filter(date >= as.Date("1995-01-01")) %>%
  left_join(geo, by = "geo") %>%
  left_join(colors, by = c("Geo" = "country")) %>%
  mutate(values = values/1000) %>%
  ggplot + theme_minimal() + xlab("") + ylab("Compensation per employee") +
  geom_line(aes(x = date, y = values, color = color)) +
  scale_color_identity() + add_flags +
  theme(legend.position = c(0.3, 0.85),
        legend.title = element_blank()) +
  scale_x_date(breaks = as.Date(paste0(seq(1960, 2100, 5), "-01-01")),
               labels = date_format("%Y")) +
  scale_y_log10(breaks = seq(0, 200, 10),
                     labels = scales::dollar_format(su = "k€", p = "", a = 1))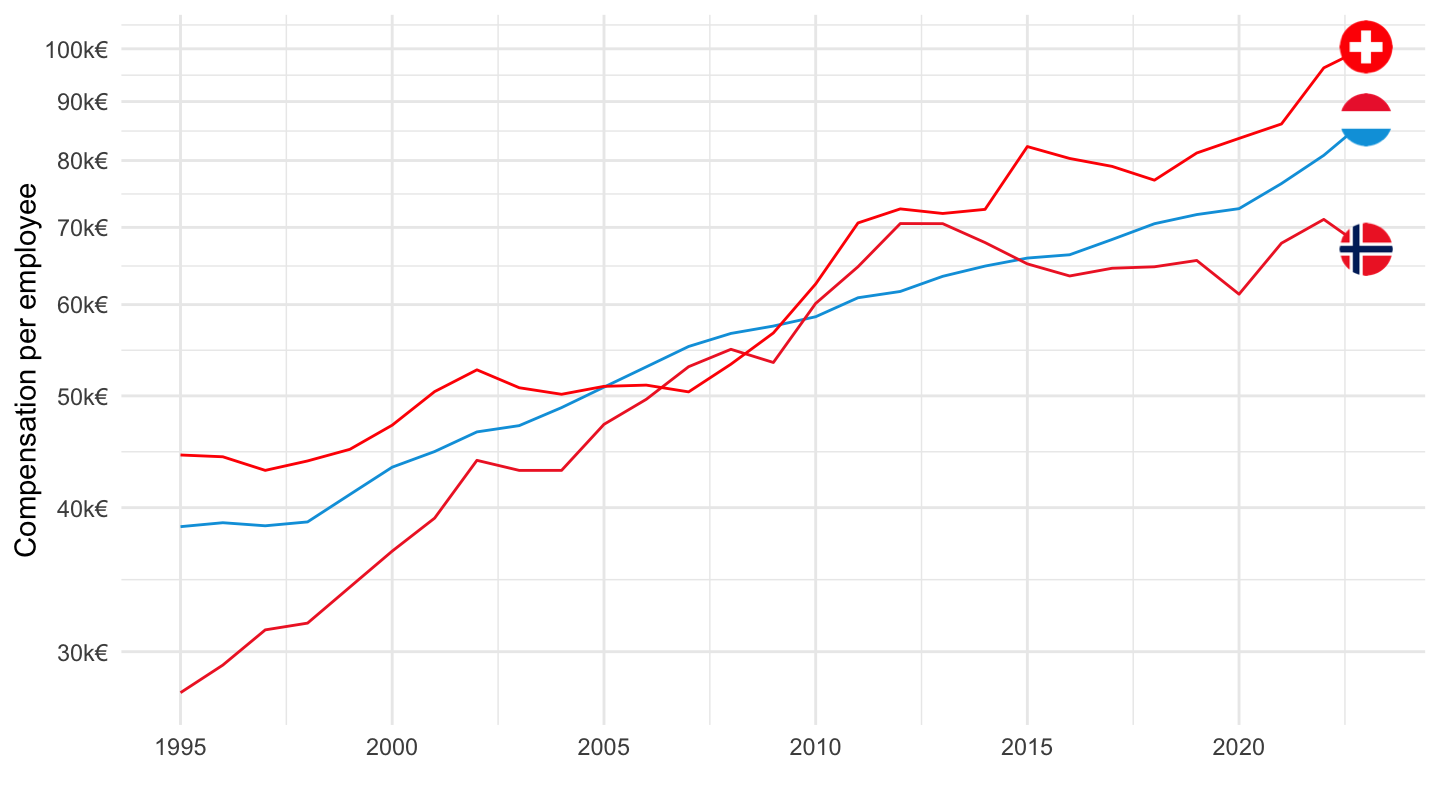
Belgium, Denmark, Iceland
All
Code
nama_10_lp_ulc %>%
  filter(geo %in% c("IS", "BE", "DK"),
         na_item == "D1_SAL_PER",
         unit == "EUR") %>%
  year_to_date %>%
  left_join(geo, by = "geo") %>%
  left_join(colors, by = c("Geo" = "country")) %>%
  mutate(values = values/1000) %>%
  ggplot + theme_minimal() + xlab("") + ylab("Compensation per employee") +
  geom_line(aes(x = date, y = values, color = color)) +
  scale_color_identity() + add_flags +
  theme(legend.position = c(0.3, 0.85),
        legend.title = element_blank()) +
  scale_x_date(breaks = as.Date(paste0(seq(1960, 2100, 5), "-01-01")),
               labels = date_format("%Y")) +
  scale_y_log10(breaks = seq(0, 200, 10),
                     labels = scales::dollar_format(su = "k€", p = "", a = 1))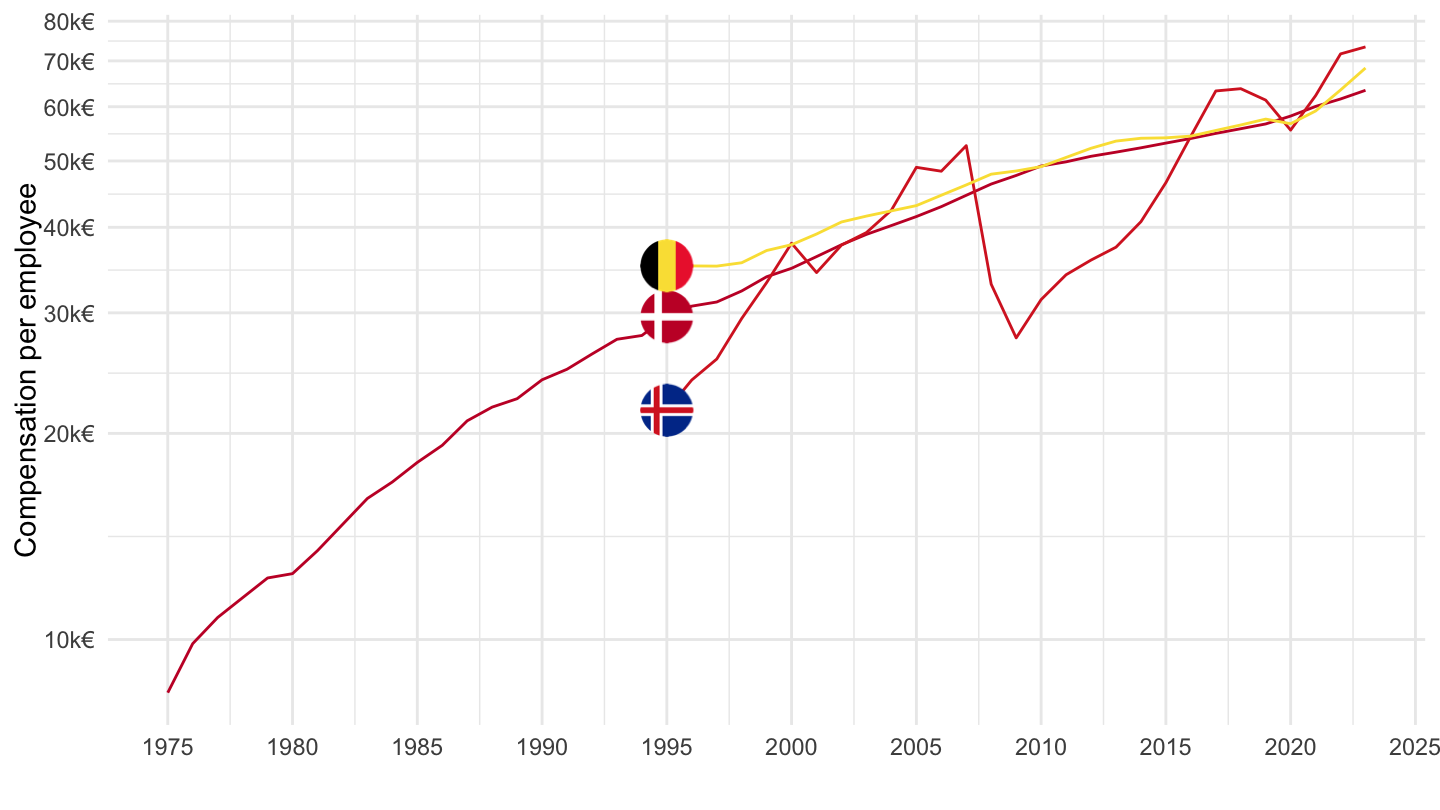
1995-
Code
nama_10_lp_ulc %>%
  filter(geo %in% c("IS", "BE", "DK"),
         na_item == "D1_SAL_PER",
         unit == "EUR") %>%
  year_to_date %>%
  filter(date >= as.Date("1995-01-01")) %>%
  left_join(geo, by = "geo") %>%
  left_join(colors, by = c("Geo" = "country")) %>%
  mutate(values = values/1000) %>%
  ggplot + theme_minimal() + xlab("") + ylab("Compensation per employee") +
  geom_line(aes(x = date, y = values, color = color)) +
  scale_color_identity() + add_flags +
  theme(legend.position = c(0.3, 0.85),
        legend.title = element_blank()) +
  scale_x_date(breaks = as.Date(paste0(seq(1960, 2100, 5), "-01-01")),
               labels = date_format("%Y")) +
  scale_y_log10(breaks = seq(0, 200, 10),
                     labels = scales::dollar_format(su = "k€", p = "", a = 1))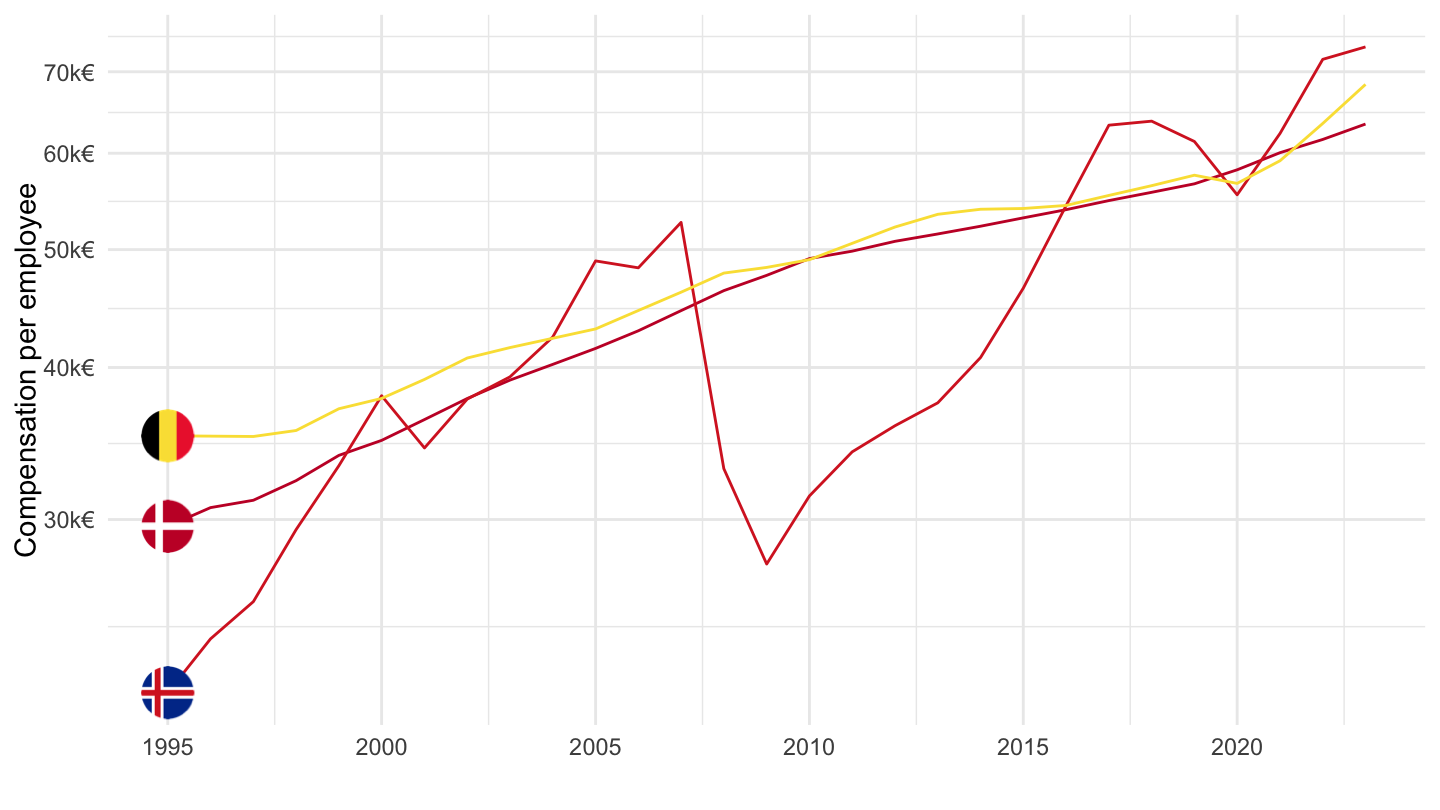
France, Ireland, Netherlands
All
Code
nama_10_lp_ulc %>%
  filter(geo %in% c("IE", "FR", "NL"),
         na_item == "D1_SAL_PER",
         unit == "EUR") %>%
  year_to_date %>%
  left_join(geo, by = "geo") %>%
  left_join(colors, by = c("Geo" = "country")) %>%
  mutate(values = values/1000) %>%
  ggplot + theme_minimal() + xlab("") + ylab("Compensation per employee") +
  geom_line(aes(x = date, y = values, color = color)) +
  scale_color_identity() + add_flags +
  theme(legend.position = c(0.3, 0.85),
        legend.title = element_blank()) +
  scale_x_date(breaks = as.Date(paste0(seq(1960, 2100, 5), "-01-01")),
               labels = date_format("%Y")) +
  scale_y_log10(breaks = seq(0, 200, 10),
                     labels = scales::dollar_format(su = "k€", p = "", a = 1))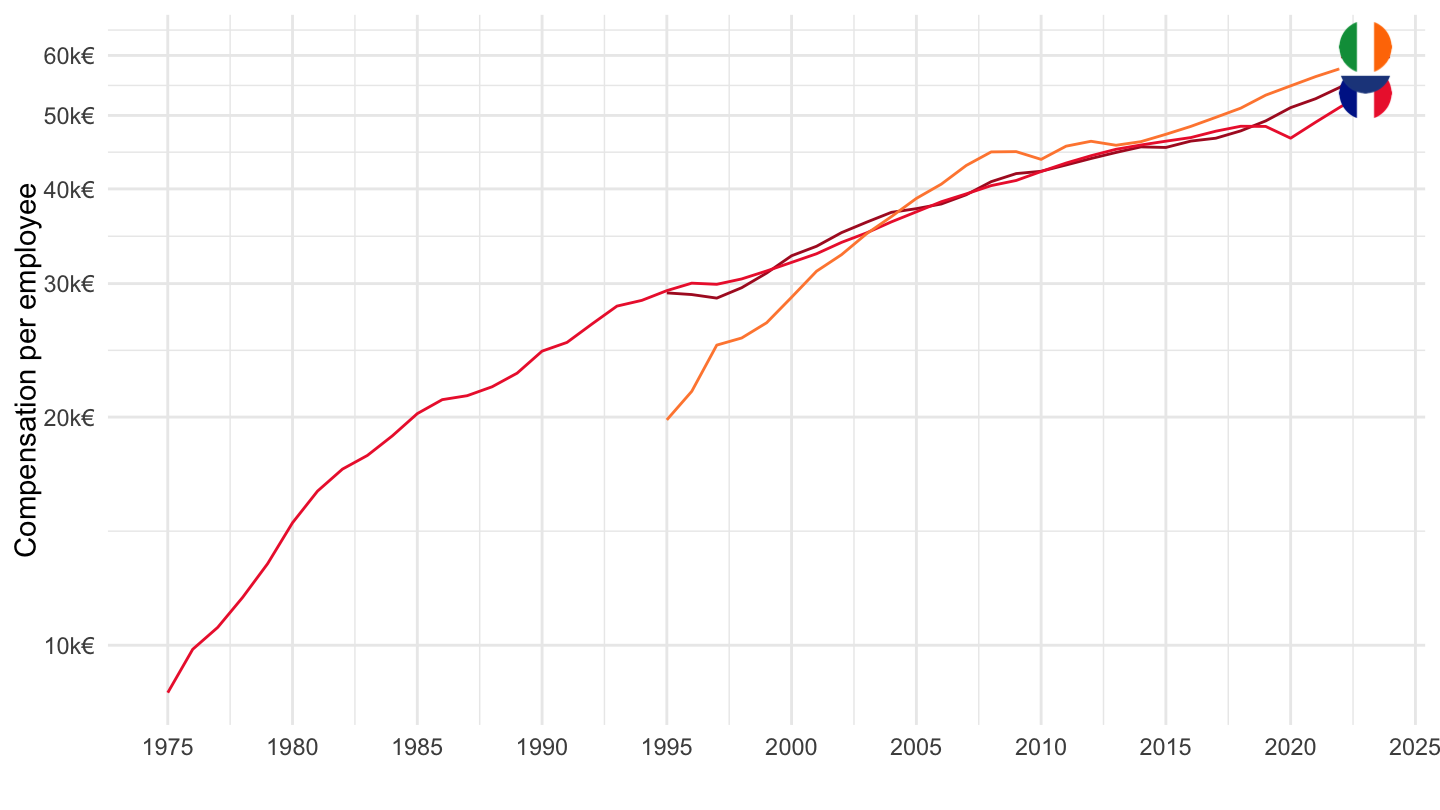
1995
Code
nama_10_lp_ulc %>%
  filter(geo %in% c("IE", "FR", "NL"),
         na_item == "D1_SAL_PER",
         unit == "EUR") %>%
  year_to_date %>%
  filter(date >= as.Date("1995-01-01")) %>%
  left_join(geo, by = "geo") %>%
  left_join(colors, by = c("Geo" = "country")) %>%
  mutate(values = values/1000) %>%
  ggplot + theme_minimal() + xlab("") + ylab("Compensation per employee") +
  geom_line(aes(x = date, y = values, color = color)) +
  scale_color_identity() + add_flags +
  theme(legend.position = c(0.3, 0.85),
        legend.title = element_blank()) +
  scale_x_date(breaks = as.Date(paste0(seq(1960, 2100, 5), "-01-01")),
               labels = date_format("%Y")) +
  scale_y_log10(breaks = seq(0, 200, 10),
                     labels = scales::dollar_format(su = "k€", p = "", a = 1))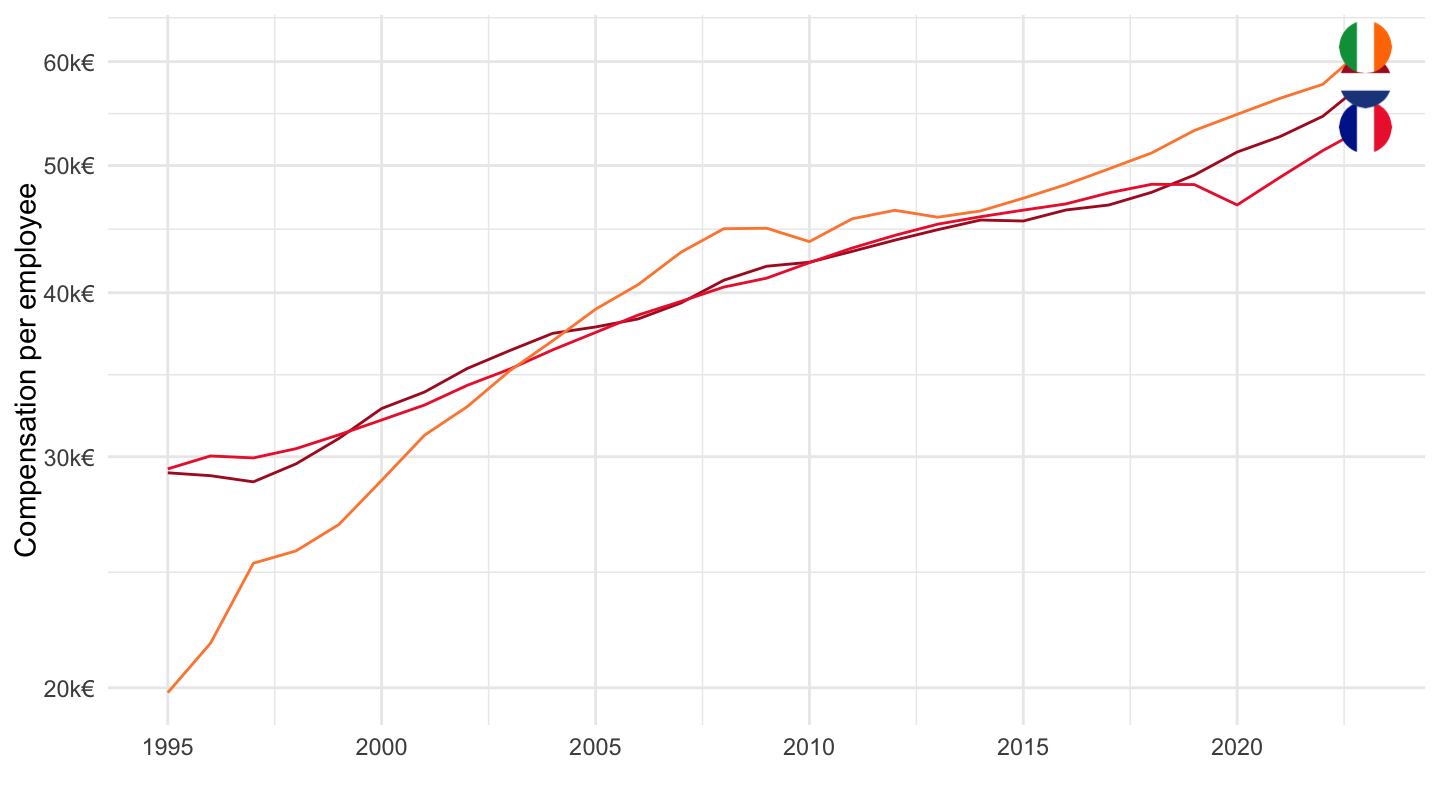
Austria, Finland, Sweden
Code
nama_10_lp_ulc %>%
  filter(geo %in% c("AT", "FI", "SE"),
         na_item == "D1_SAL_PER",
         unit == "EUR") %>%
  year_to_date %>%
  left_join(geo, by = "geo") %>%
  left_join(colors, by = c("Geo" = "country")) %>%
  mutate(values = values/1000) %>%
  ggplot + theme_minimal() + xlab("") + ylab("Compensation per employee") +
  geom_line(aes(x = date, y = values, color = color)) +
  scale_color_identity() + add_flags +
  theme(legend.position = c(0.3, 0.85),
        legend.title = element_blank()) +
  scale_x_date(breaks = as.Date(paste0(seq(1960, 2100, 5), "-01-01")),
               labels = date_format("%Y")) +
  scale_y_log10(breaks = seq(0, 200, 10),
                     labels = scales::dollar_format(su = "k€", p = "", a = 1))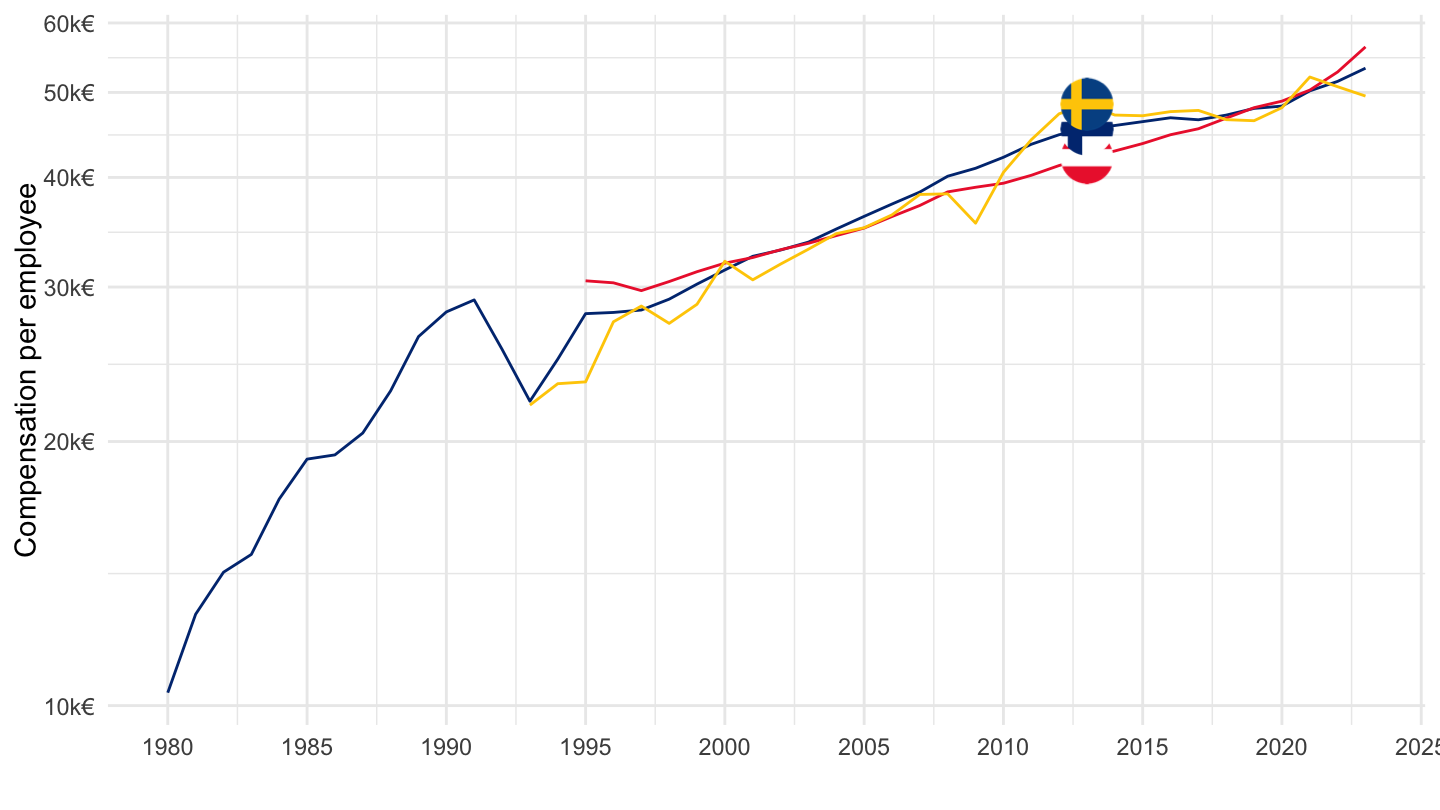
Germany, Italy, United Kingdom
Code
nama_10_lp_ulc %>%
  filter(geo %in% c("UK", "DE", "IT"),
         na_item == "D1_SAL_PER",
         unit == "EUR") %>%
  year_to_date %>%
  left_join(geo, by = "geo") %>%
  left_join(colors, by = c("Geo" = "country")) %>%
  mutate(values = values/1000) %>%
  ggplot + theme_minimal() + xlab("") + ylab("Compensation per employee") +
  geom_line(aes(x = date, y = values, color = color)) +
  scale_color_identity() + add_flags +
  theme(legend.position = c(0.3, 0.85),
        legend.title = element_blank()) +
  scale_x_date(breaks = as.Date(paste0(seq(1960, 2100, 5), "-01-01")),
               labels = date_format("%Y")) +
  scale_y_log10(breaks = seq(0, 200, 10),
                     labels = scales::dollar_format(su = "k€", p = "", a = 1))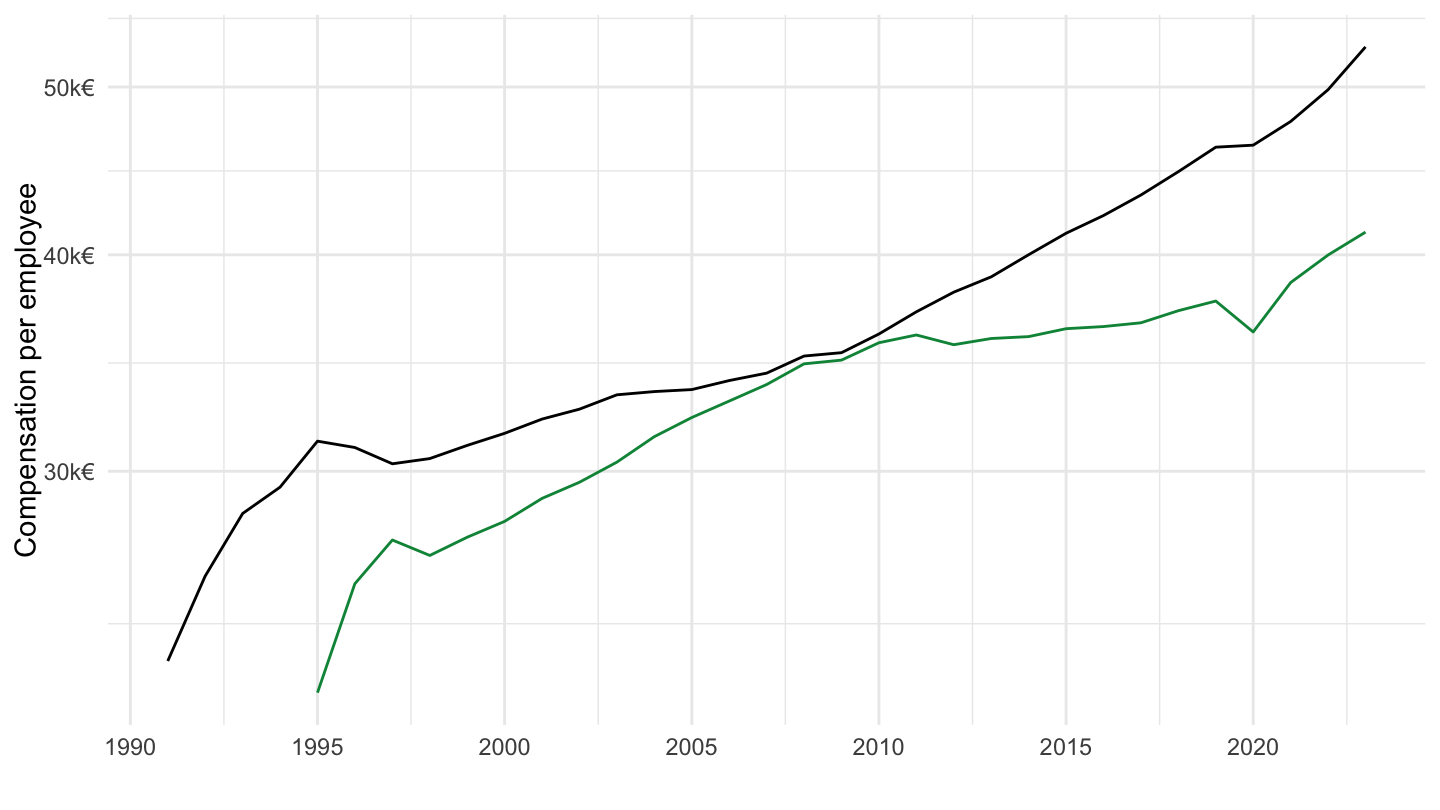
European Union, Euro Area
Code
nama_10_lp_ulc %>%
  filter(geo %in% c("EU15", "EU28", "EA19"),
         na_item == "D1_SAL_PER",
         unit == "EUR") %>%
  year_to_date %>%
  left_join(geo, by = "geo") %>%
  ggplot + theme_minimal() + xlab("") + ylab("Compensation per employee") +
  geom_line(aes(x = date, y = values/1000, color = Geo, linetype = Geo)) +
  scale_color_manual(values = viridis(4)[1:3]) +
  theme(legend.position = c(0.3, 0.85),
        legend.title = element_blank()) +
  scale_x_date(breaks = as.Date(paste0(seq(1960, 2100, 5), "-01-01")),
               labels = date_format("%Y")) +
  scale_y_continuous(breaks = seq(0, 200, 5),
                     labels = scales::dollar_format(su = "k€", p = ""))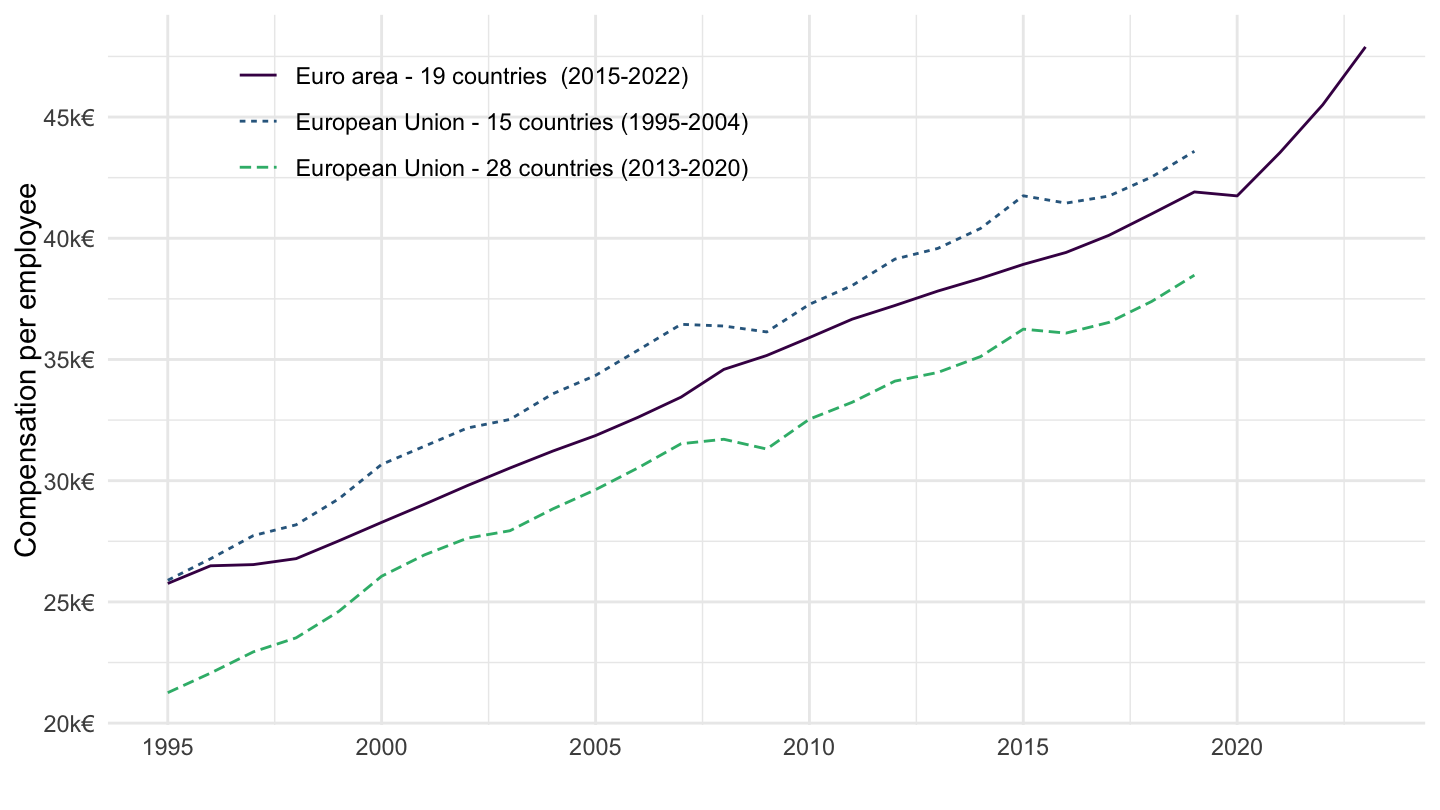
France, Germany, Italy, Spain, Poland
All
Code
nama_10_lp_ulc %>%
  filter(geo %in% c("FR", "DE", "IT", "ES", "NL"),
         na_item == "D1_SAL_PER",
         unit == "EUR") %>%
  year_to_date %>%
  left_join(geo, by = "geo") %>%
  left_join(colors, by = c("Geo" = "country")) %>%
  mutate(values = values/1000) %>%
  ggplot + theme_minimal() + xlab("") + ylab("Compensation per employee") +
  geom_line(aes(x = date, y = values, color = color)) +
  scale_color_identity() + add_flags +
  theme(legend.position = c(0.3, 0.85),
        legend.title = element_blank()) +
  scale_x_date(breaks = as.Date(paste0(seq(1960, 2100, 5), "-01-01")),
               labels = date_format("%Y")) +
  scale_y_log10(breaks = seq(0, 200, 10),
                     labels = scales::dollar_format(su = "k€", p = "", a = 1))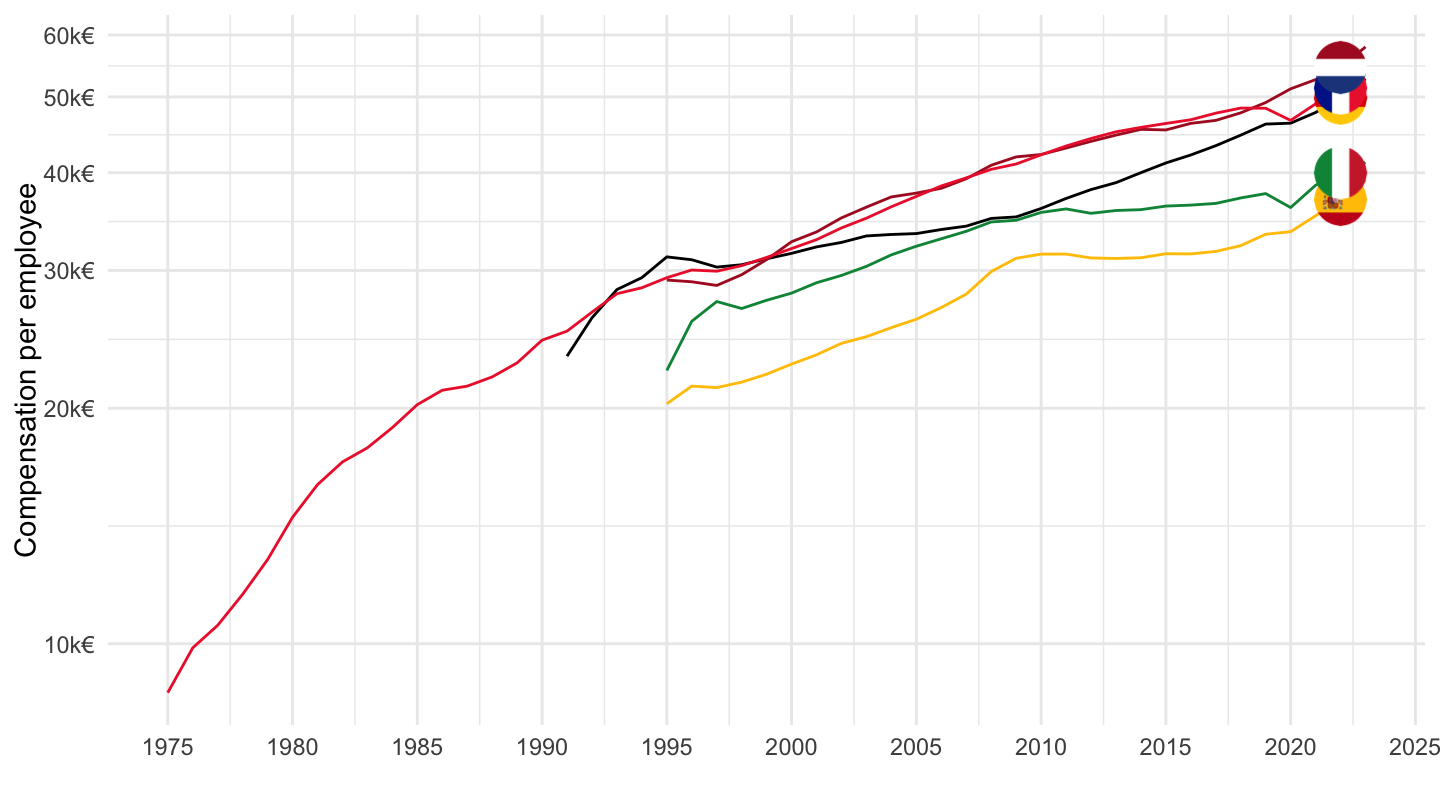
1995-
Euros
Code
nama_10_lp_ulc %>%
  filter(geo %in% c("FR", "DE", "IT", "ES", "NL"),
         na_item == "D1_SAL_PER",
         unit == "EUR") %>%
  year_to_date %>%
  filter(date >= as.Date("1995-01-01")) %>%
  left_join(geo, by = "geo") %>%
  left_join(colors, by = c("Geo" = "country")) %>%
  mutate(values = values/1000) %>%
  ggplot + theme_minimal() + xlab("") + ylab("Compensation per employee") +
  geom_line(aes(x = date, y = values, color = color)) +
  scale_color_identity() + add_flags +
  theme(legend.position = c(0.3, 0.85),
        legend.title = element_blank()) +
  scale_x_date(breaks = as.Date(paste0(seq(1960, 2100, 5), "-01-01")),
               labels = date_format("%Y")) +
  scale_y_log10(breaks = seq(0, 200, 5),
                     labels = scales::dollar_format(su = "k€", p = "", a = 1))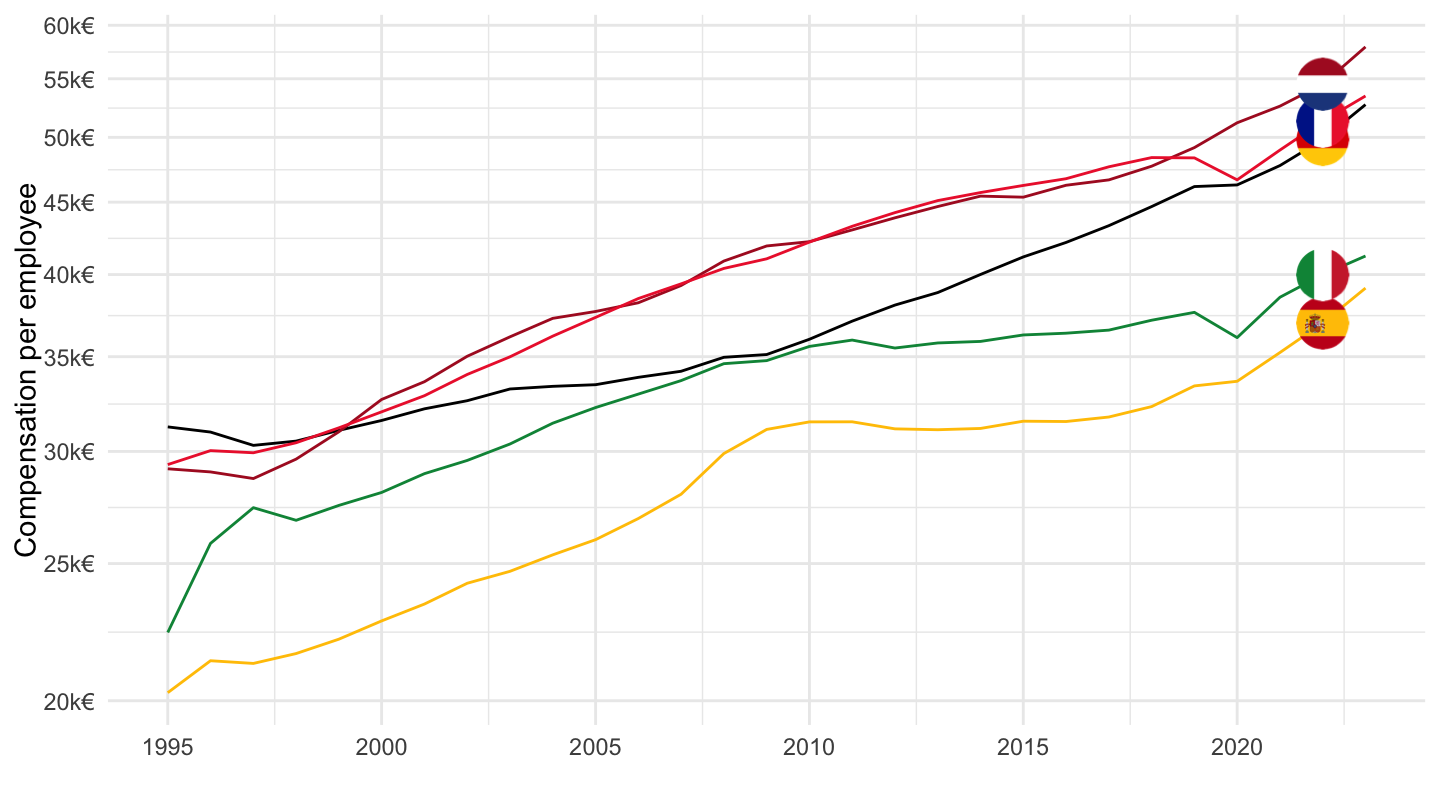
Index
Code
nama_10_lp_ulc %>%
  filter(geo %in% c("FR", "DE", "IT", "ES", "NL"),
         na_item == "D1_SAL_PER",
         unit == "EUR") %>%
  year_to_date %>%
  filter(date >= as.Date("1995-01-01")) %>%
  left_join(geo, by = "geo") %>%
  left_join(colors, by = c("Geo" = "country")) %>%
  group_by(Geo) %>%
  arrange(date) %>%
  mutate(values = 100*values/values[1]) %>%
  ggplot + theme_minimal() + xlab("") + ylab("Compensation per employee (1995-100)") +
  geom_line(aes(x = date, y = values, color = color)) +
  scale_color_identity() + add_flags +
  theme(legend.position = c(0.3, 0.85),
        legend.title = element_blank()) +
  scale_x_date(breaks = as.Date(paste0(seq(1960, 2100, 5), "-01-01")),
               labels = date_format("%Y")) +
  scale_y_log10(breaks = seq(0, 200, 10))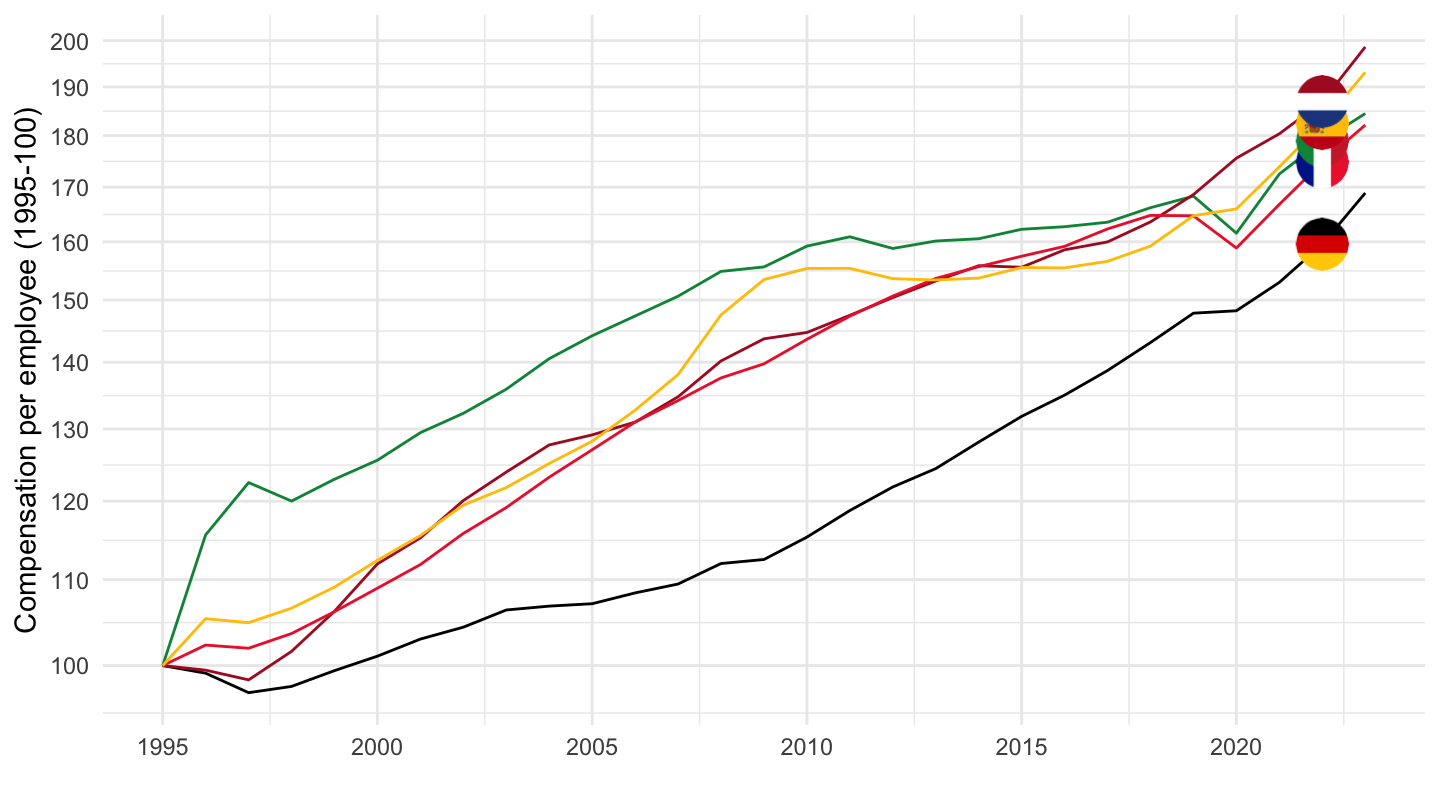
Italy, Spain, Slovenia
Code
nama_10_lp_ulc %>%
  filter(geo %in% c("IT", "ES", "SI"),
         na_item == "D1_SAL_PER",
         unit == "EUR") %>%
  year_to_date %>%
  left_join(geo, by = "geo") %>%
  left_join(colors, by = c("Geo" = "country")) %>%
  mutate(values = values/1000) %>%
  ggplot + theme_minimal() + xlab("") + ylab("Compensation per employee") +
  geom_line(aes(x = date, y = values, color = color)) +
  scale_color_identity() + add_flags +
  theme(legend.position = c(0.3, 0.85),
        legend.title = element_blank()) +
  scale_x_date(breaks = as.Date(paste0(seq(1960, 2100, 5), "-01-01")),
               labels = date_format("%Y")) +
  scale_y_log10(breaks = seq(0, 200, 10),
                     labels = scales::dollar_format(su = "k€", p = "", a = 1))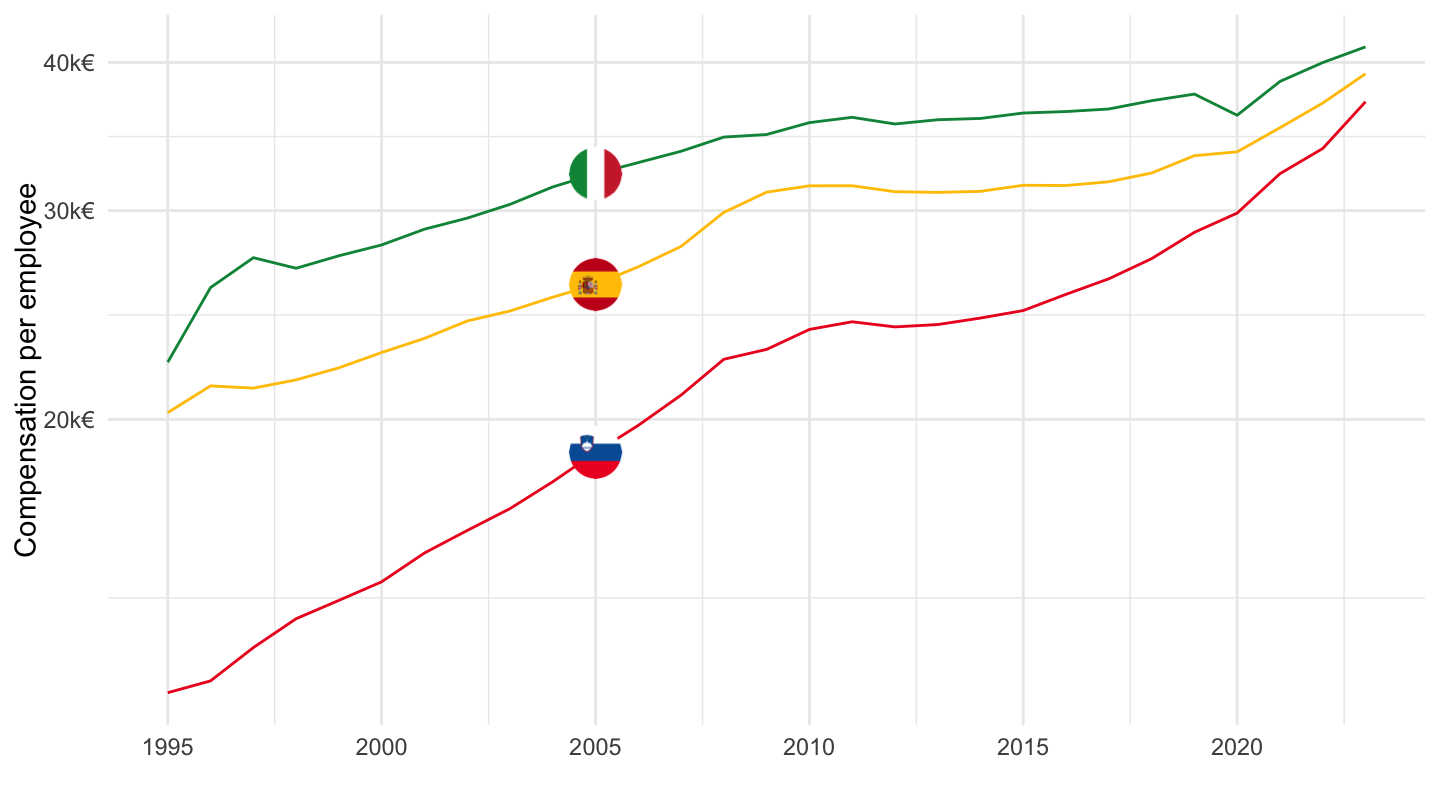
Cyprus, Estonia, Malta
Code
nama_10_lp_ulc %>%
  filter(geo %in% c("MT", "CY", "EE"),
         na_item == "D1_SAL_PER",
         unit == "EUR") %>%
  year_to_date %>%
  left_join(geo, by = "geo") %>%
  left_join(colors, by = c("Geo" = "country")) %>%
  mutate(values = values/1000) %>%
  ggplot + theme_minimal() + xlab("") + ylab("Compensation per employee") +
  geom_line(aes(x = date, y = values, color = color)) +
  scale_color_identity() + add_flags +
  theme(legend.position = c(0.3, 0.85),
        legend.title = element_blank()) +
  scale_x_date(breaks = as.Date(paste0(seq(1960, 2100, 5), "-01-01")),
               labels = date_format("%Y")) +
  scale_y_log10(breaks = seq(0, 200, 10),
                     labels = scales::dollar_format(su = "k€", p = "", a = 1))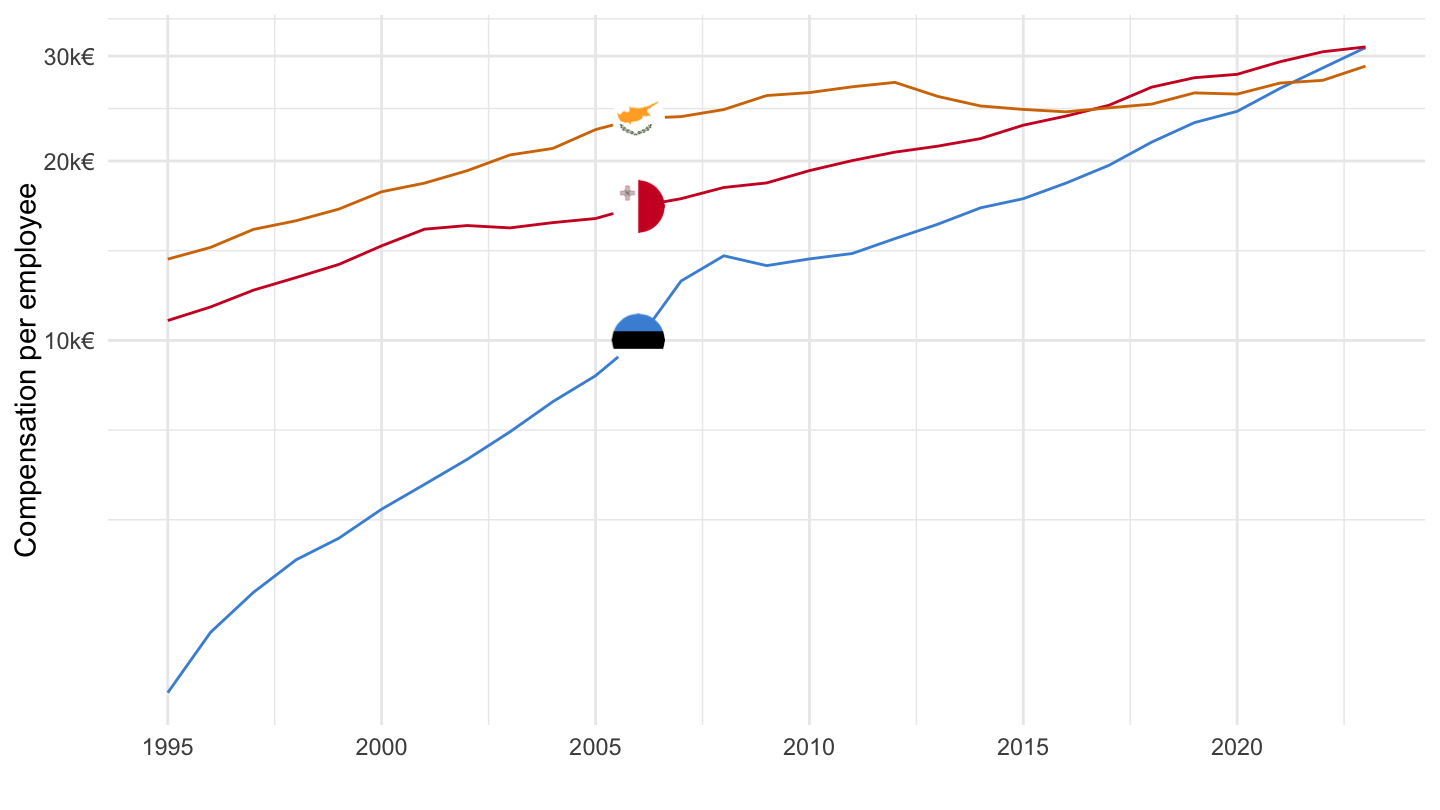
Greece, Czechia, Portugal
Code
nama_10_lp_ulc %>%
  filter(geo %in% c("PT", "CZ", "EL"),
         na_item == "D1_SAL_PER",
         unit == "EUR") %>%
  year_to_date %>%
  left_join(geo, by = "geo") %>%
  left_join(colors, by = c("Geo" = "country")) %>%
  mutate(values = values/1000) %>%
  ggplot + theme_minimal() + xlab("") + ylab("Compensation per employee") +
  geom_line(aes(x = date, y = values, color = color)) +
  scale_color_identity() + add_flags +
  theme(legend.position = c(0.3, 0.85),
        legend.title = element_blank()) +
  scale_x_date(breaks = as.Date(paste0(seq(1960, 2100, 5), "-01-01")),
               labels = date_format("%Y")) +
  scale_y_log10(breaks = seq(0, 200, 10),
                     labels = scales::dollar_format(su = "k€", p = "", a = 1))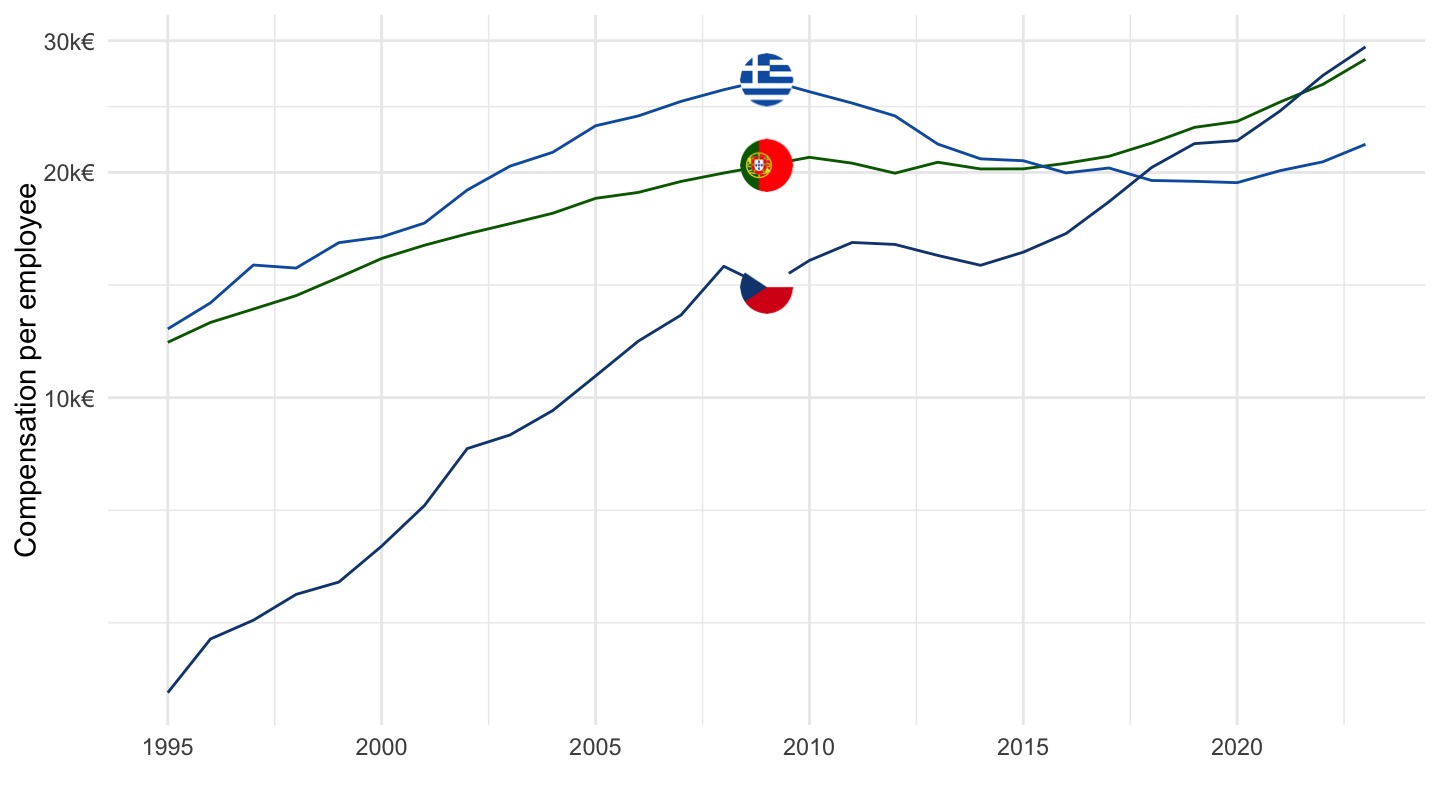
Latvia, Lithuania, Slovakia
Code
nama_10_lp_ulc %>%
  filter(geo %in% c("LV", "SK", "LT"),
         na_item == "D1_SAL_PER",
         unit == "EUR") %>%
  year_to_date %>%
  left_join(geo, by = "geo") %>%
  left_join(colors, by = c("Geo" = "country")) %>%
  mutate(values = values/1000) %>%
  ggplot + theme_minimal() + xlab("") + ylab("Compensation per employee") +
  geom_line(aes(x = date, y = values, color = color)) +
  scale_color_identity() + add_flags +
  theme(legend.position = c(0.3, 0.85),
        legend.title = element_blank()) +
  scale_x_date(breaks = as.Date(paste0(seq(1960, 2100, 5), "-01-01")),
               labels = date_format("%Y")) +
  scale_y_log10(breaks = seq(0, 200, 10),
                     labels = scales::dollar_format(su = "k€", p = "", a = 1))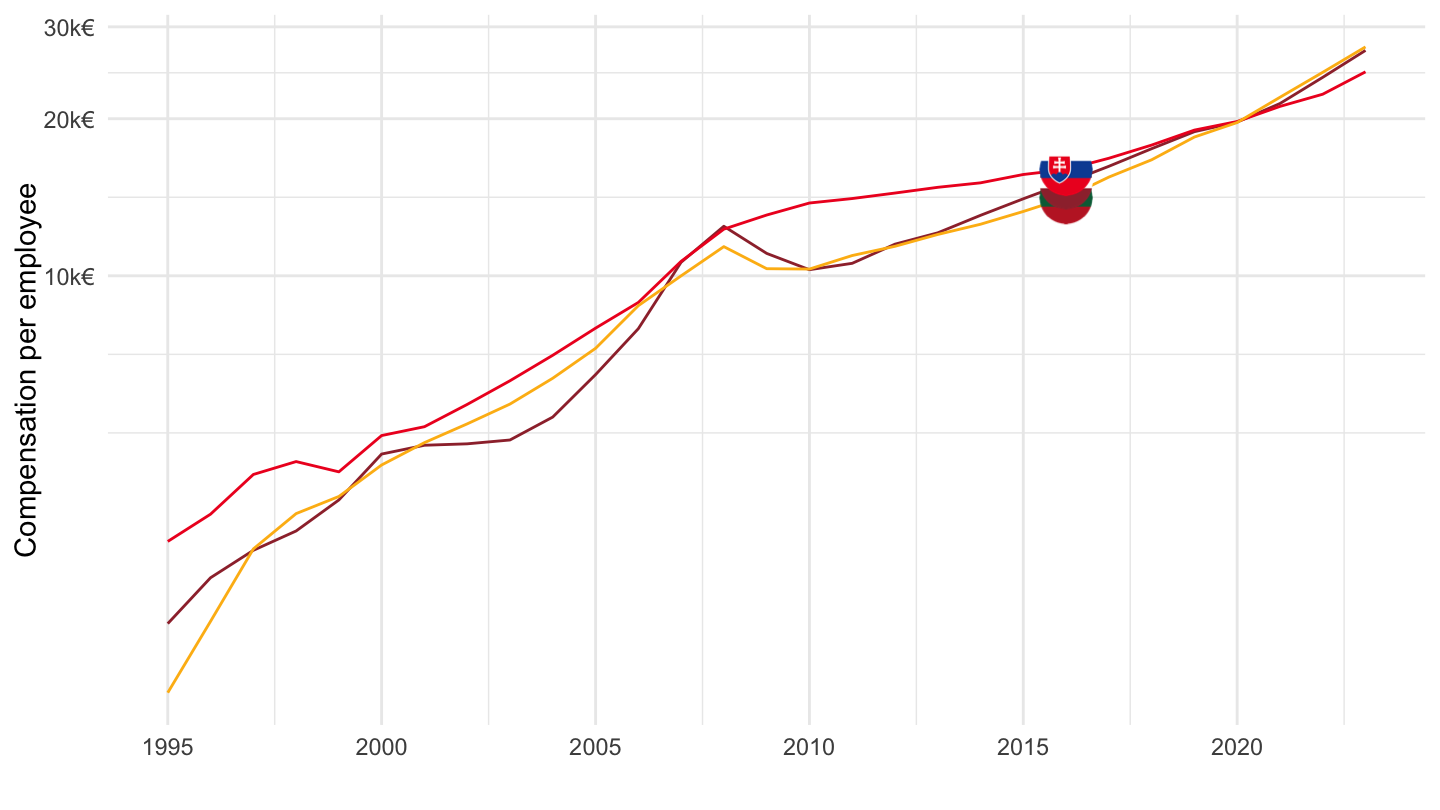
Croatia, Hungary, Poland
Code
nama_10_lp_ulc %>%
  filter(geo %in% c("HR", "PL", "HU"),
         na_item == "D1_SAL_PER",
         unit == "EUR") %>%
  year_to_date %>%
  left_join(geo, by = "geo") %>%
  left_join(colors, by = c("Geo" = "country")) %>%
  mutate(values = values/1000) %>%
  ggplot + theme_minimal() + xlab("") + ylab("Compensation per employee") +
  geom_line(aes(x = date, y = values, color = color)) +
  scale_color_identity() + add_flags +
  theme(legend.position = c(0.3, 0.85),
        legend.title = element_blank()) +
  scale_x_date(breaks = as.Date(paste0(seq(1960, 2100, 5), "-01-01")),
               labels = date_format("%Y")) +
  scale_y_log10(breaks = seq(0, 200, 10),
                     labels = scales::dollar_format(su = "k€", p = "", a = 1))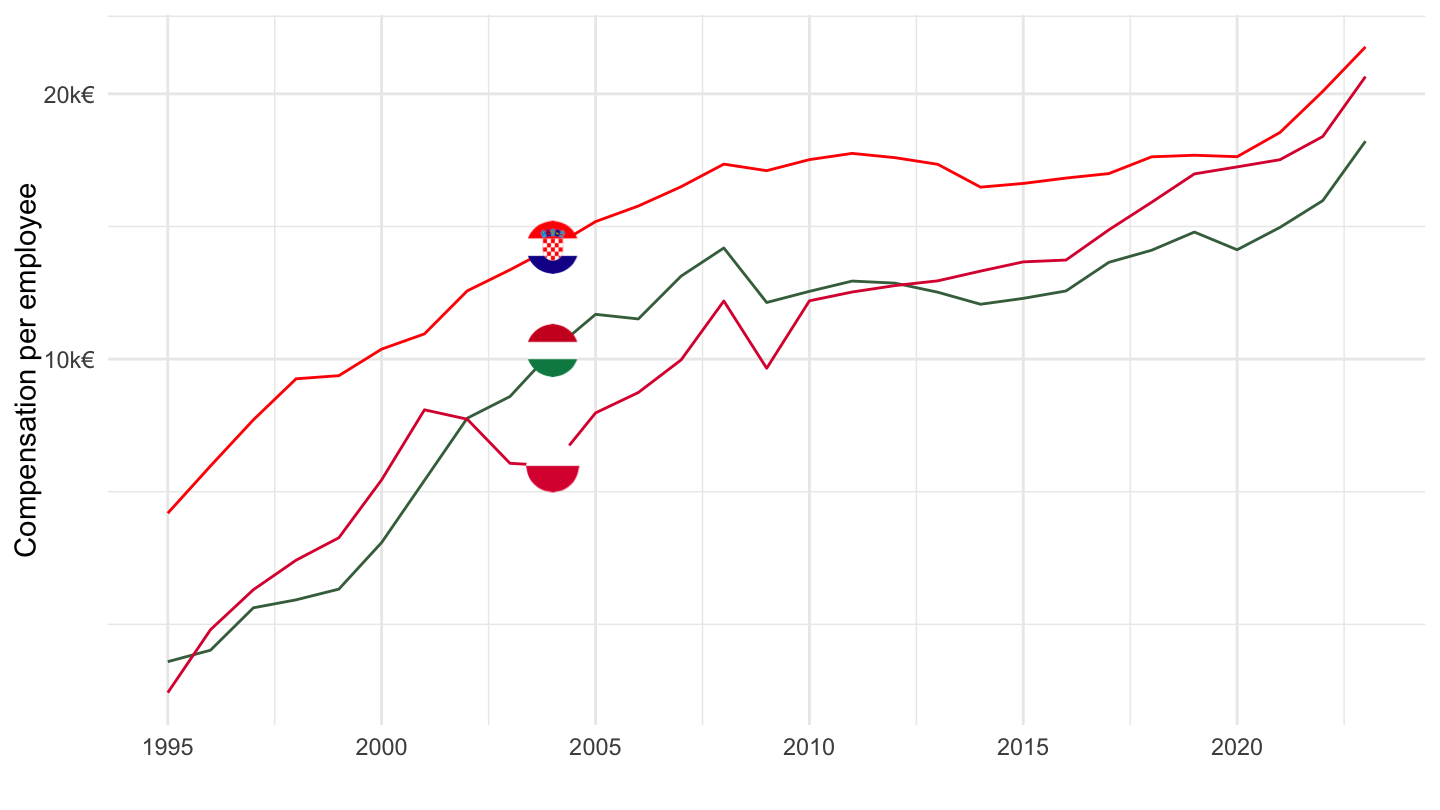
Romania, Bulgaria
Code
nama_10_lp_ulc %>%
  filter(geo %in% c("RO", "BG"),
         na_item == "D1_SAL_PER",
         unit == "EUR") %>%
  year_to_date %>%
  left_join(geo, by = "geo") %>%
  left_join(colors, by = c("Geo" = "country")) %>%
  mutate(values = values/1000) %>%
  ggplot + theme_minimal() + xlab("") + ylab("Compensation per employee") +
  geom_line(aes(x = date, y = values, color = color)) +
  scale_color_identity() + add_flags +
  theme(legend.position = c(0.3, 0.85),
        legend.title = element_blank()) +
  scale_x_date(breaks = as.Date(paste0(seq(1960, 2100, 5), "-01-01")),
               labels = date_format("%Y")) +
  scale_y_log10(breaks = seq(0, 200, 1),
                     labels = scales::dollar_format(su = "k€", p = "", a = 1))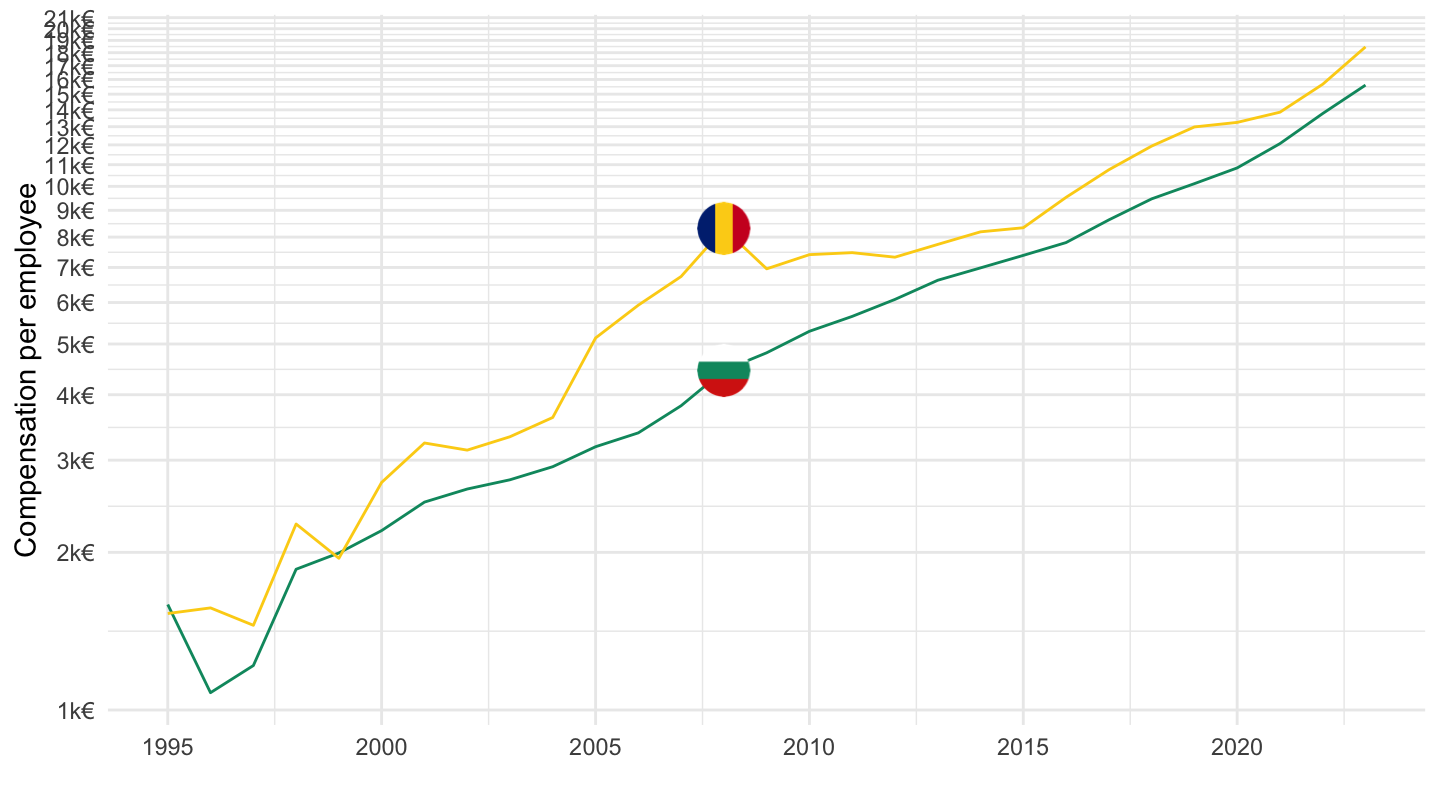
NULC_PER - Nominal unit labour cost based on persons
France, Germany, Italy
Code
nama_10_lp_ulc %>%
  filter(geo %in% c("FR", "DE", "IT"),
         na_item == "NULC_PER",
         unit == "I15") %>%
  year_to_date %>%
  left_join(geo, by = "geo") %>%
  left_join(colors, by = c("Geo" = "country")) %>%
  ggplot + theme_minimal() + xlab("") + ylab("Nominal unit labour cost based on persons") +
  geom_line(aes(x = date, y = values, color = color)) +
  scale_color_identity() + add_flags +
  scale_x_date(breaks = as.Date(paste0(seq(1960, 2100, 5), "-01-01")),
               labels = date_format("%Y")) +
  scale_y_continuous(breaks = seq(0, 200, 10),
                     labels = scales::dollar_format(su = "", p = ""))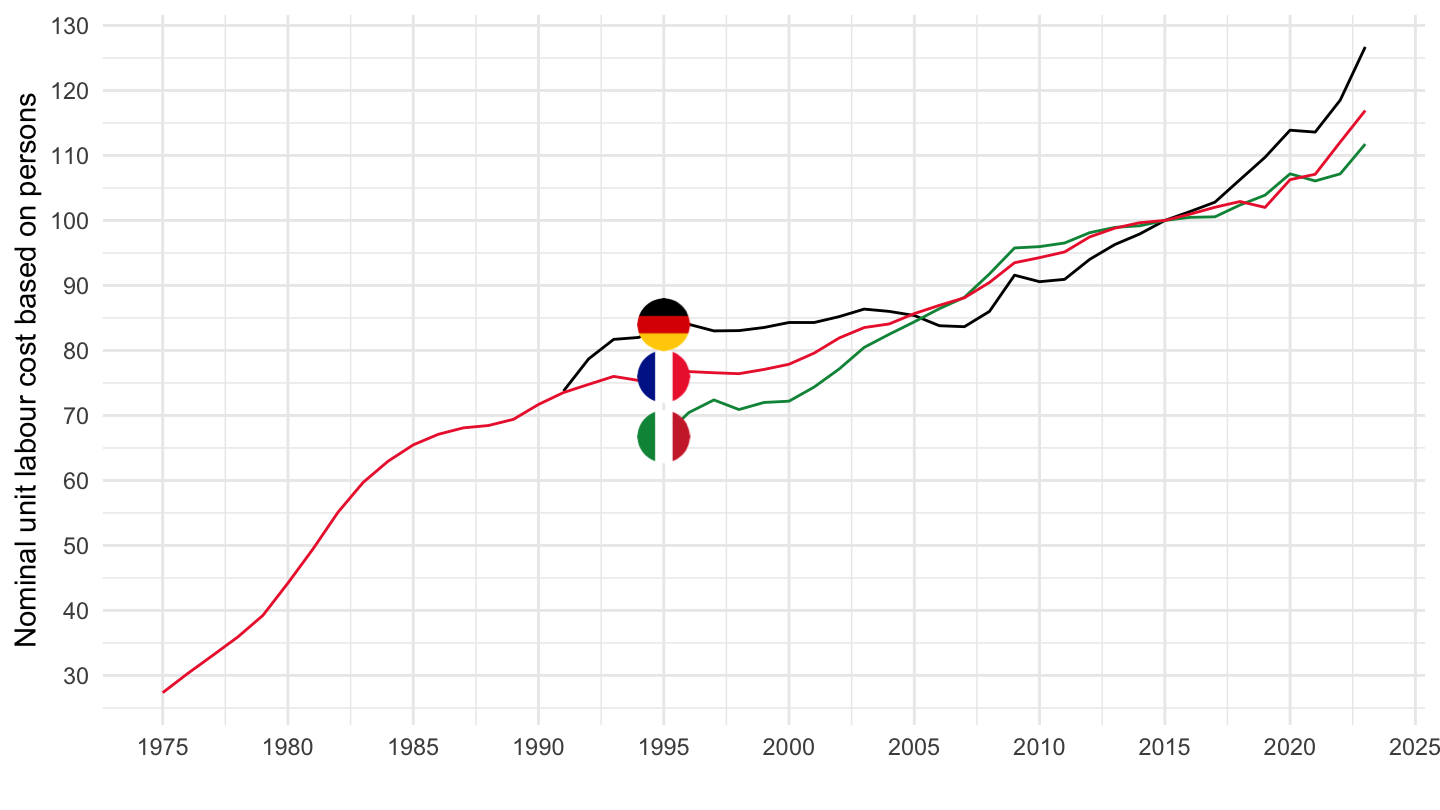
France, Germany
Code
nama_10_lp_ulc %>%
  filter(geo %in% c("FR", "DE"),
         na_item == "NULC_PER",
         unit == "I15") %>%
  year_to_date %>%
  filter(date >= as.Date("1990-01-01")) %>%
  left_join(geo, by = "geo") %>%
  left_join(colors, by = c("Geo" = "country")) %>%
  ggplot + theme_minimal() + xlab("") + ylab("Nominal unit labour cost based on persons") +
  geom_line(aes(x = date, y = values, color = color)) +
  scale_color_identity() + add_flags +
  scale_x_date(breaks = as.Date(paste0(seq(1960, 2100, 5), "-01-01")),
               labels = date_format("%Y")) +
  scale_y_continuous(breaks = seq(0, 200, 5),
                     labels = scales::dollar_format(su = "", p = ""))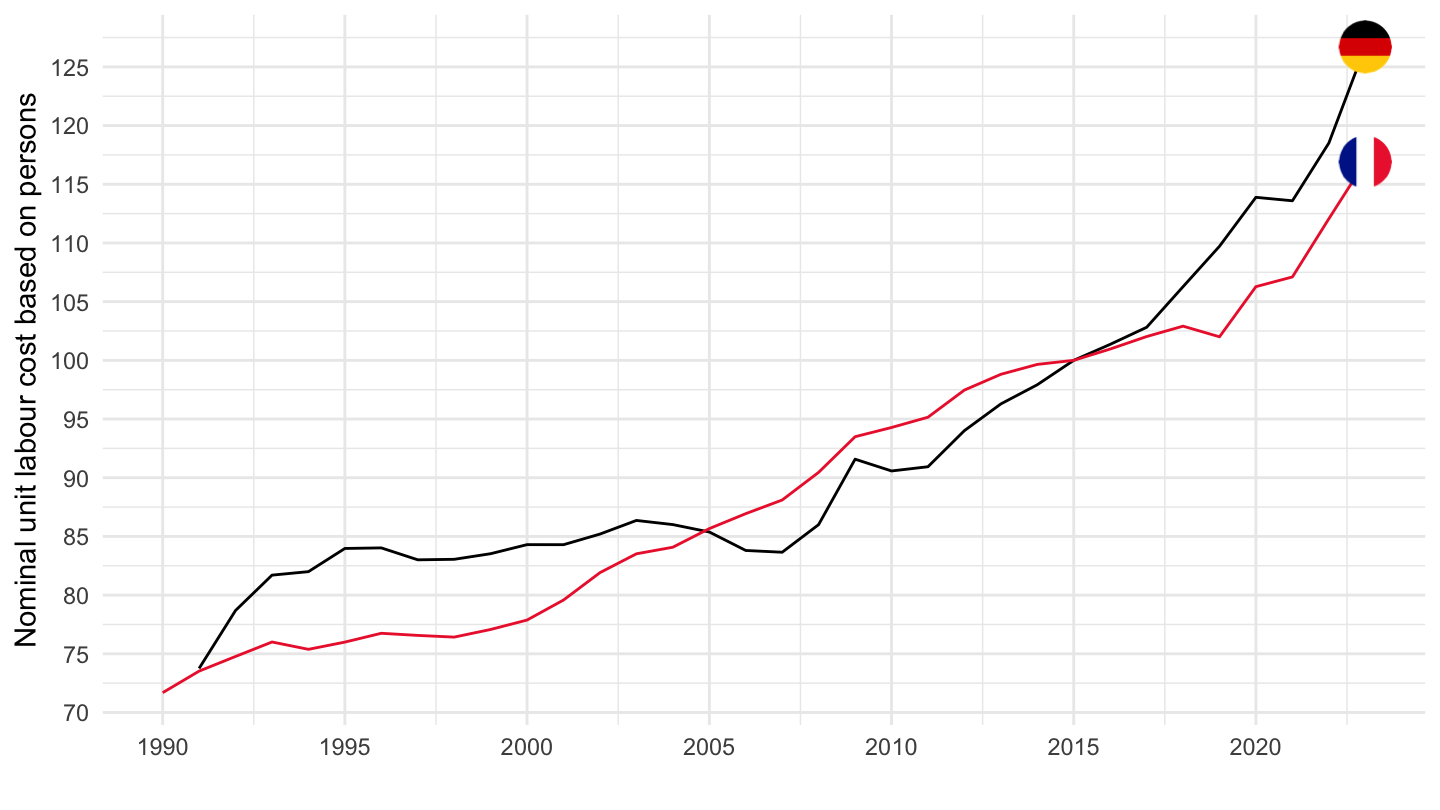
NULC_HW - Nominal unit labour cost based on hours worked
Code
nama_10_lp_ulc %>%
  filter(geo %in% c("FR", "DE", "IT"),
         na_item == "NULC_HW",
         unit == "I15") %>%
  year_to_date %>%
  left_join(geo, by = "geo") %>%
  left_join(colors, by = c("Geo" = "country")) %>%
  ggplot + theme_minimal() + xlab("") + ylab("Nominal unit labour cost based on hours worked") +
  geom_line(aes(x = date, y = values, color = color)) +
  scale_color_identity() + add_flags +
  scale_x_date(breaks = as.Date(paste0(seq(1960, 2100, 5), "-01-01")),
               labels = date_format("%Y")) +
  scale_y_continuous(breaks = seq(0, 200, 10),
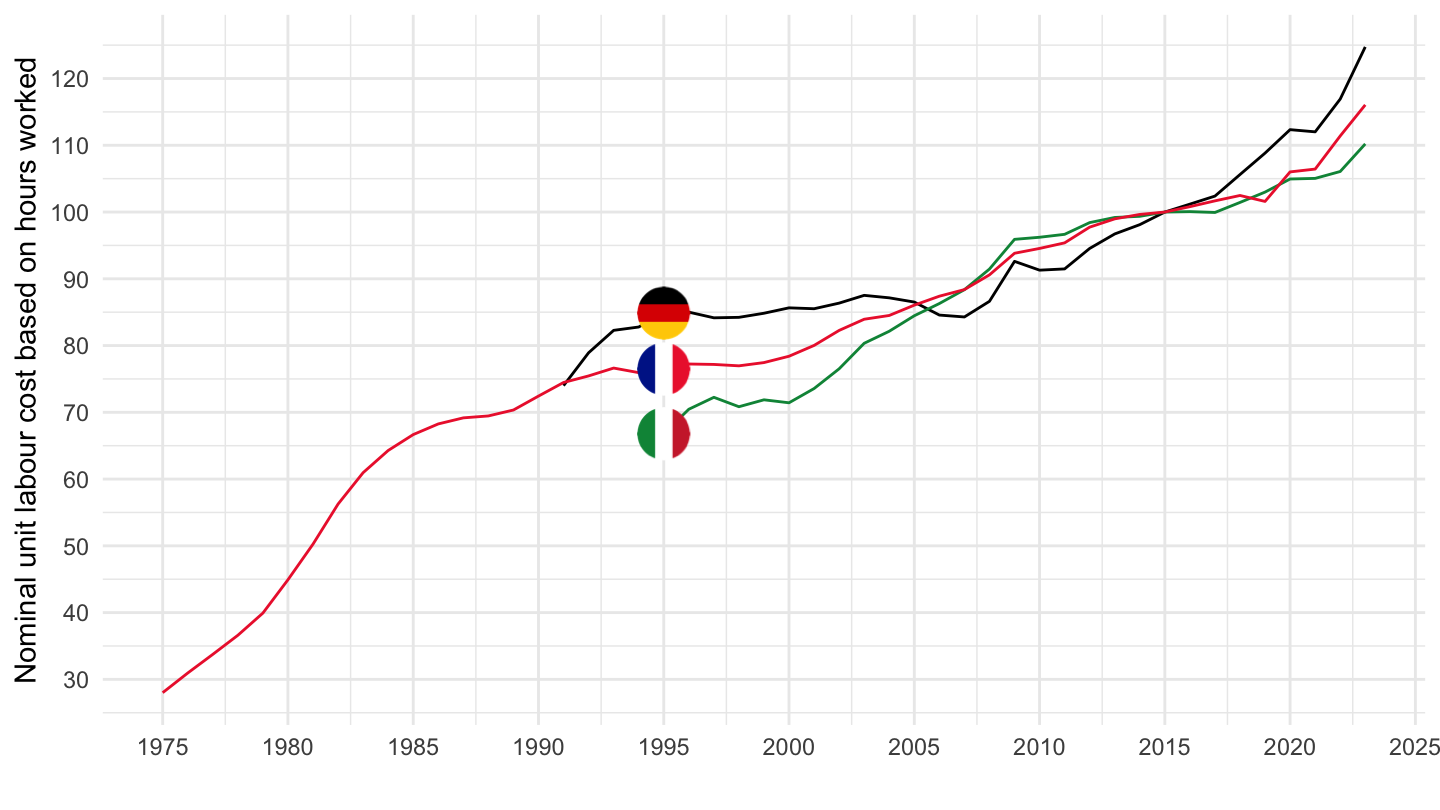
                     labels = scales::dollar_format(su = "", p = ""))