
Last observation: 2022 (N = 3160)
First observation: 1956 (N = 1)
Last data update: 02 août 2026, 08:56
Last compile: 09 oct. 2026, 22:57
ALFS_EMP |>
  filter(SEX == "TT",
         LOCATION == "USA",
         TIME_PERIOD %in% paste0(seq(1958, 2018, 20))) |>
  left_join(ALFS_EMP_var$SUBJECT, by = "SUBJECT") |>
  select(SUBJECT, Subject, TIME_PERIOD, obsValue) |>
  spread(TIME_PERIOD, obsValue) |>
print_table_conditional()ALFS_EMP |>
left_join(ALFS_EMP_var$SUBJECT, by = "SUBJECT") |>
filter(SEX == "TT",
LOCATION == "USA",
grepl("Agriculture", Subject)) |>
year_to_date() |>
ggplot() + theme_minimal() + xlab("") + ylab("Employment in Agriculture") +
geom_line(aes(x = date, y = obsValue, color = paste0(SUBJECT, " - ", Subject))) +
scale_x_date(breaks = seq(1950, 2100, 5) |> paste0("-01-01") |> as.Date(),
labels = date_format("%Y")) +
scale_y_continuous(breaks = seq(0, 80000, 500),
labels = dollar_format(accuracy = 1, prefix = "")) +
theme(legend.position = c(0.7, 0.80),
legend.title = element_blank())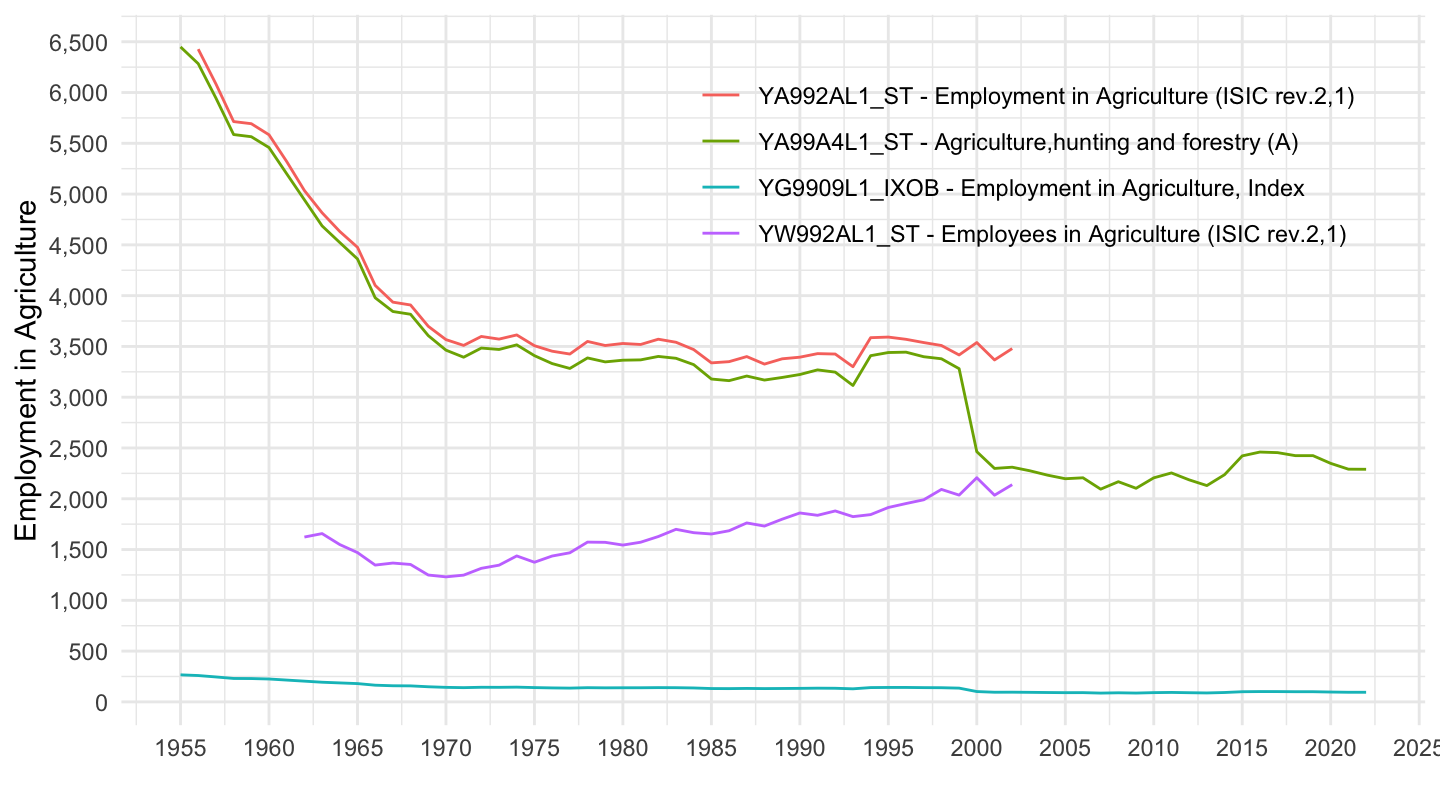
ALFS_EMP |>
  left_join(ALFS_EMP_var$SUBJECT, by = "SUBJECT") |>
  filter(SEX == "TT",
         LOCATION == "USA",
         grepl("Industry", Subject)) |>
  year_to_date() |>
  ggplot() + theme_minimal() + xlab("") + ylab("Employment in Manufacturing") +
  geom_line(aes(x = date, y = obsValue, color = paste0(SUBJECT, " - ", Subject))) +
  scale_x_date(breaks = seq(1950, 2100, 5) |> paste0("-01-01") |> as.Date(),
               labels = date_format("%Y")) +
  scale_y_continuous(breaks = seq(0, 80000, 500),
                     labels = dollar_format(accuracy = 1, prefix = "")) +

  theme(legend.position = c(0.7, 0.80),
        legend.title = element_blank())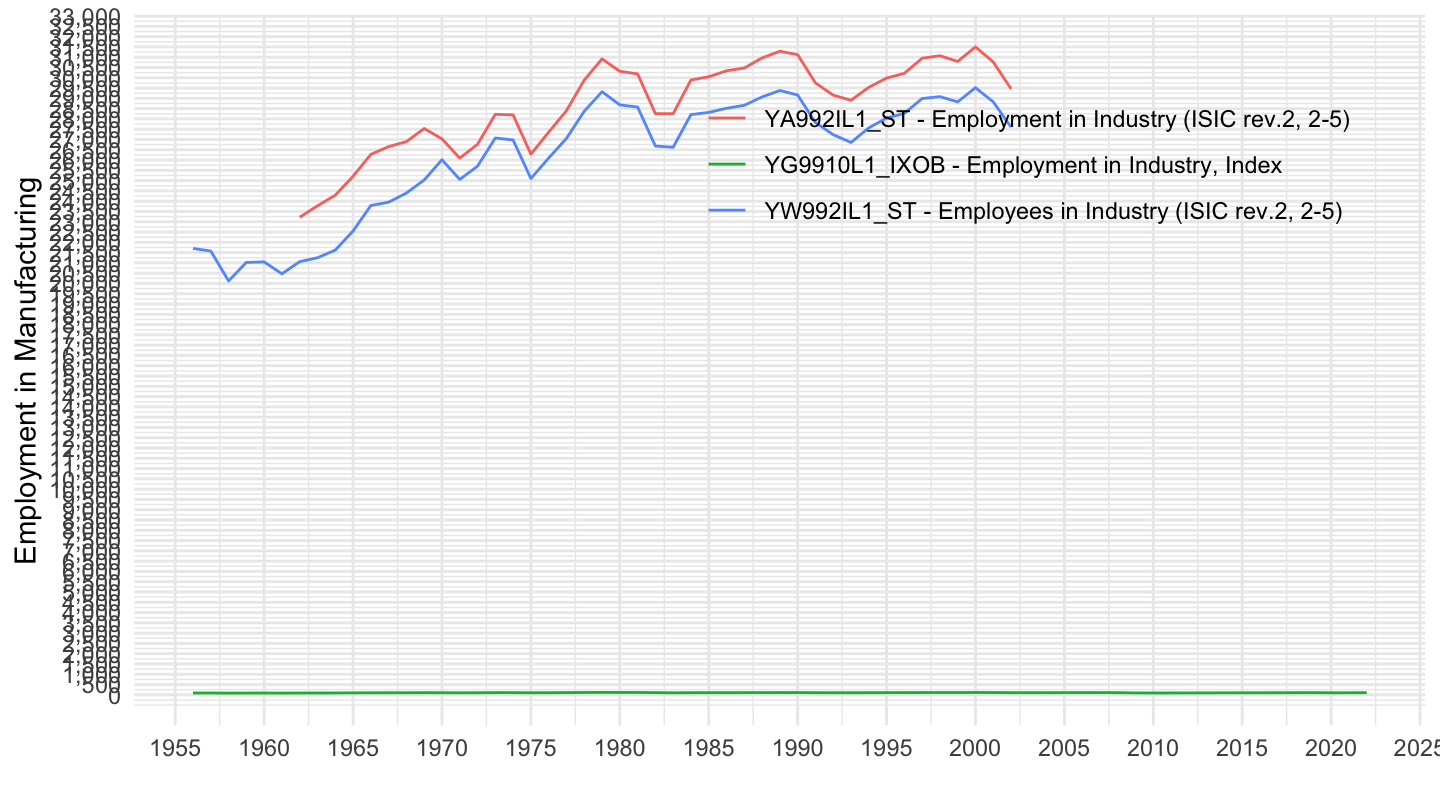
ALFS_EMP |>
  left_join(ALFS_EMP_var$SUBJECT, by = "SUBJECT") |>
  filter(SEX == "TT",
         LOCATION == "USA",
         grepl("Manufacturing", Subject)) |>
  year_to_date() |>
  ggplot() + theme_minimal() + xlab("") + ylab("Employment in Manufacturing") +
  geom_line(aes(x = date, y = obsValue, color = paste0(SUBJECT, " - ", Subject))) +
  scale_x_date(breaks = seq(1950, 2100, 5) |> paste0("-01-01") |> as.Date(),
               labels = date_format("%Y")) +
  scale_y_continuous(breaks = seq(0, 80000, 500),
                     labels = dollar_format(accuracy = 1, prefix = "")) +

  theme(legend.position = c(0.7, 0.80),
        legend.title = element_blank())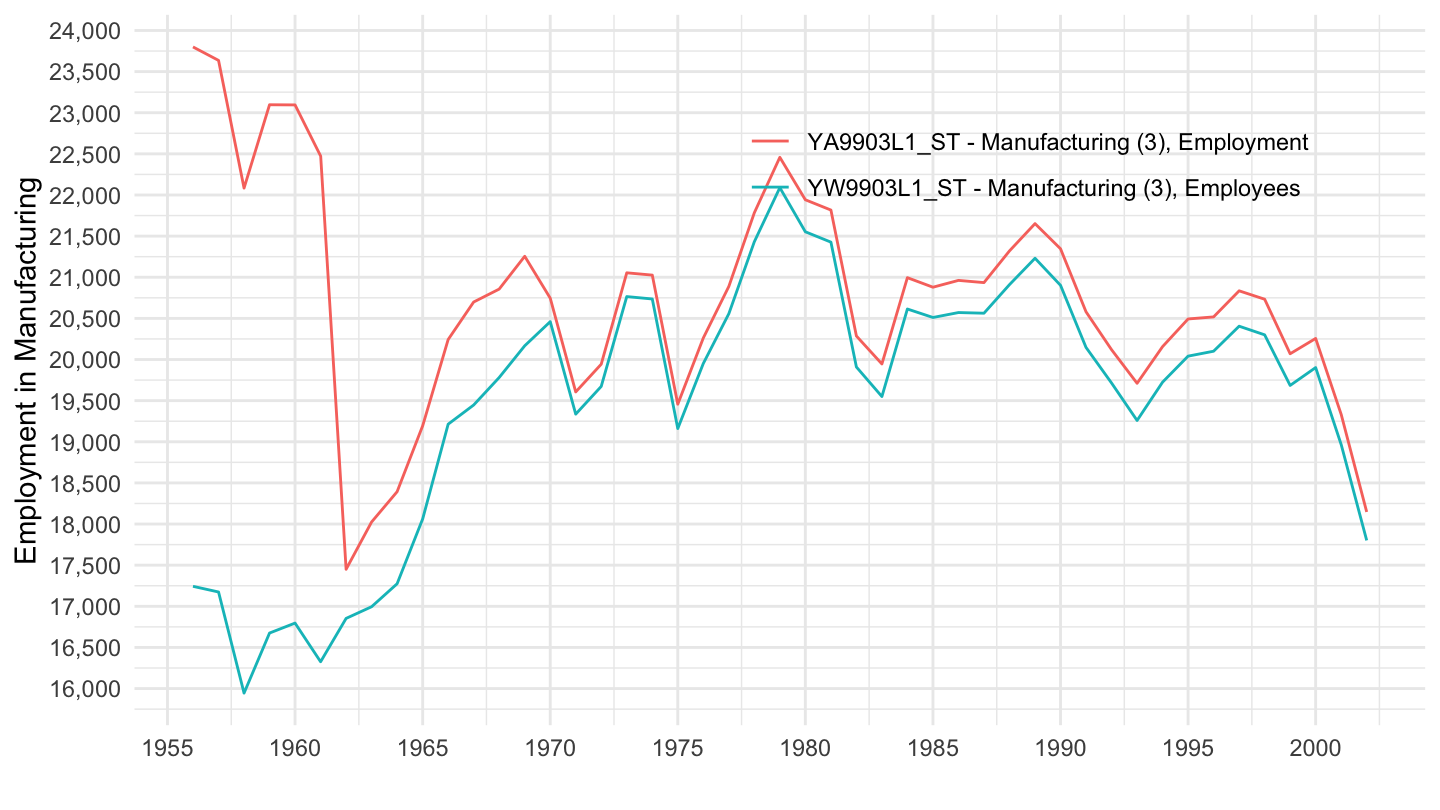
ALFS_EMP |>
  left_join(ALFS_EMP_var$SUBJECT, by = "SUBJECT") |>
  filter(SEX == "TT",
         LOCATION == "USA",
         grepl("Construction", Subject)) |>
  year_to_date() |>
  ggplot() + theme_minimal() + xlab("") + ylab("Employment in Construction") +
  geom_line(aes(x = date, y = obsValue, color = paste0(SUBJECT, " - ", Subject))) +
  scale_x_date(breaks = seq(1940, 2100, 5) |> paste0("-01-01") |> as.Date(),
               labels = date_format("%Y")) +
  scale_y_continuous(breaks = seq(0, 8000, 100),
                     labels = dollar_format(accuracy = 1, prefix = "")) +

  theme(legend.position = c(0.7, 0.80),
        legend.title = element_blank())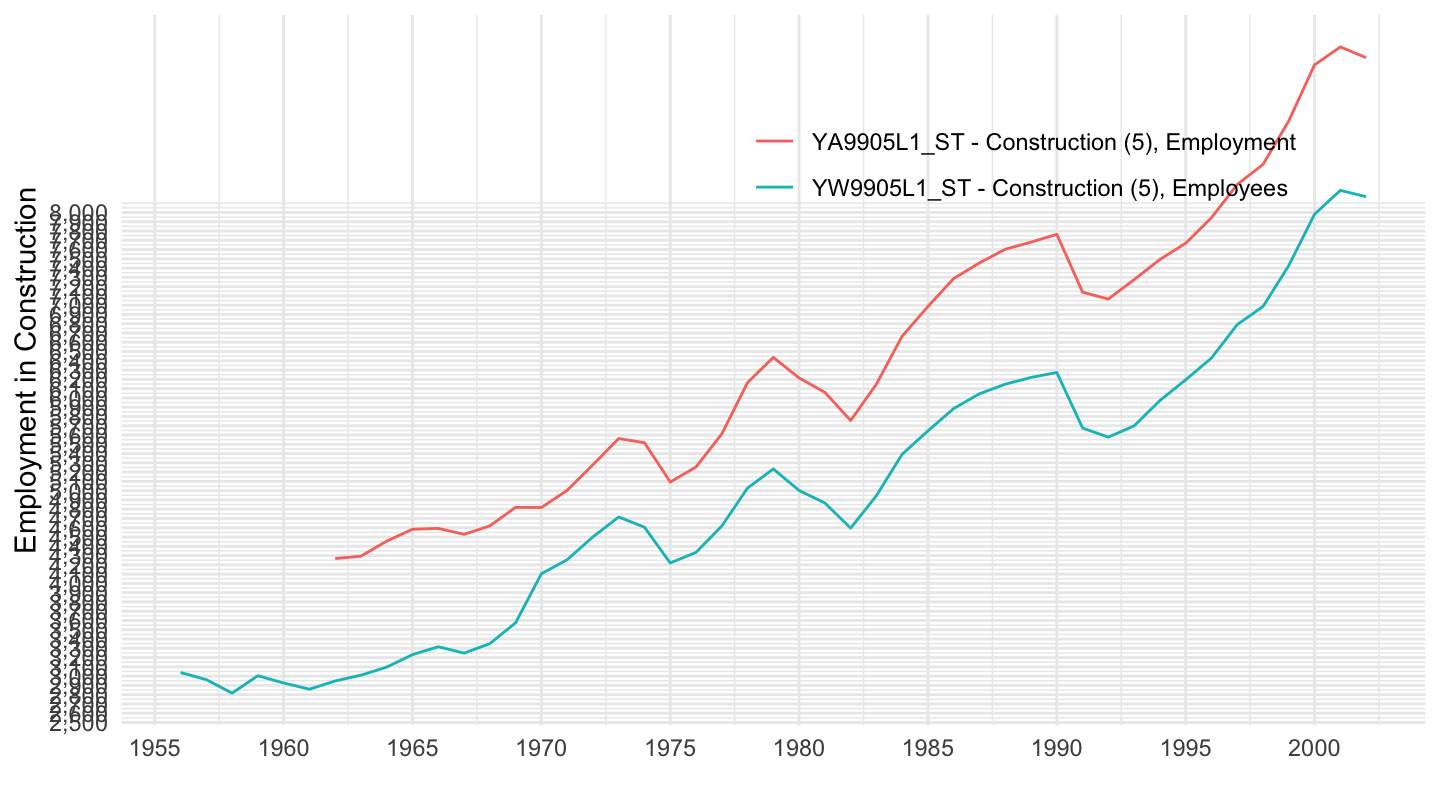
ALFS_EMP |>
  left_join(ALFS_EMP_var$SUBJECT, by = "SUBJECT") |>
  filter(SEX == "TT",
         LOCATION == "USA",
         grepl("all activities", Subject),
         !(SUBJECT %in% c("YS99TTL4_ST", "YS99TTL3_ST"))) |>
  year_to_date() |>
  ggplot() + theme_minimal() + xlab("") + ylab("Total Employment") +
  geom_line(aes(x = date, y = obsValue, color = paste0(SUBJECT, " - ", Subject))) +
  scale_x_date(breaks = seq(1940, 2100, 5) |> paste0("-01-01") |> as.Date(),
               labels = date_format("%Y")) +
  scale_y_continuous(breaks = seq(0, 100000, 2000),
                     labels = dollar_format(accuracy = 1, prefix = "")) +

  theme(legend.position = c(0.4, 0.80),
        legend.title = element_blank())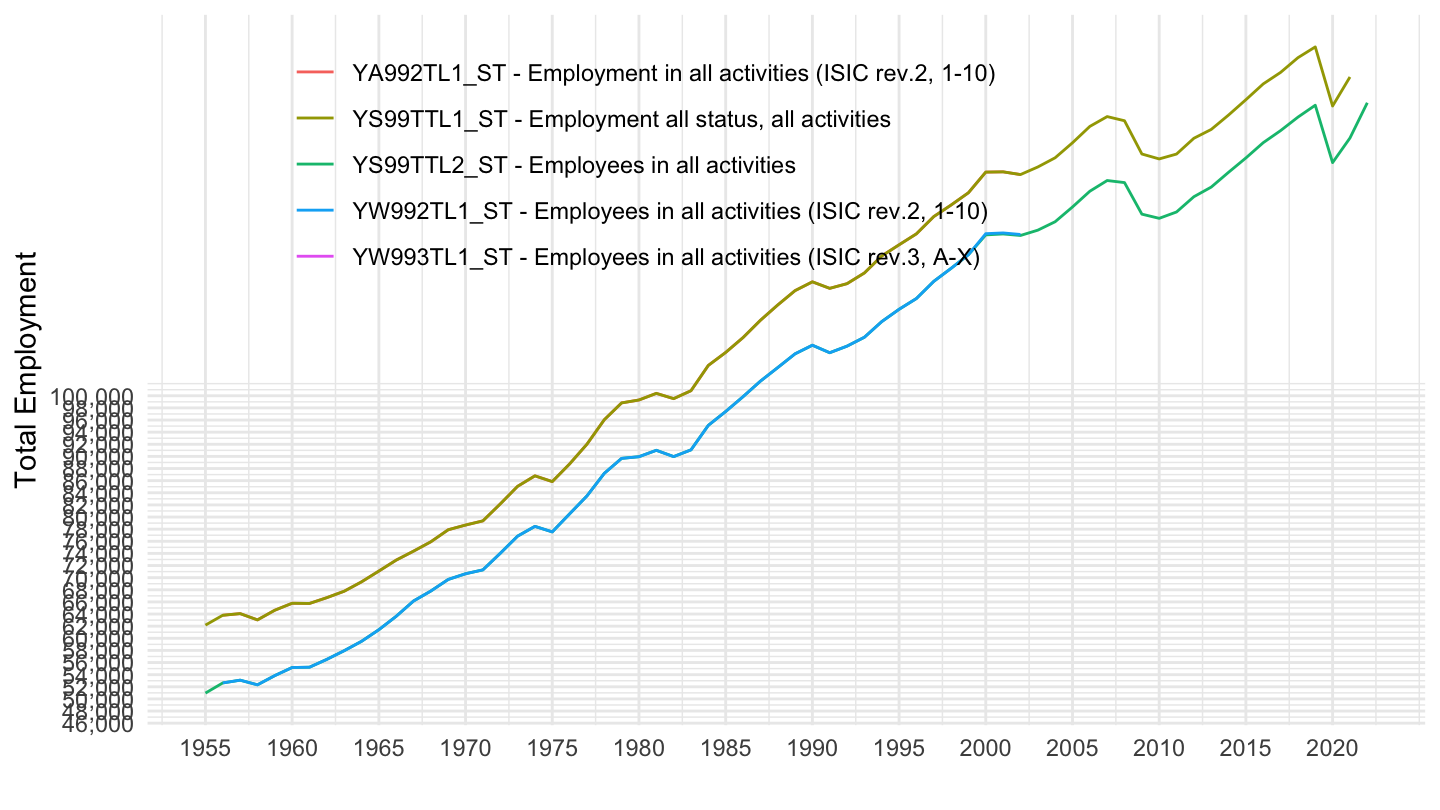
ALFS_EMP |>
  filter(SEX == "TT",
         LOCATION == "GBR",
         TIME_PERIOD %in% paste0(seq(1958, 2018, 20))) |>
  left_join(ALFS_EMP_var$SUBJECT, by = "SUBJECT") |>
  select(SUBJECT, Subject, TIME_PERIOD, obsValue) |>
  spread(TIME_PERIOD, obsValue) |>
print_table_conditional()ALFS_EMP |>
left_join(ALFS_EMP_var$SUBJECT, by = "SUBJECT") |>
filter(SEX == "TT",
LOCATION == "GBR",
grepl("Agriculture", Subject)) |>
year_to_date() |>
ggplot() + theme_minimal() + xlab("") + ylab("Employment in Agriculture") +
geom_line(aes(x = date, y = obsValue, color = paste0(SUBJECT, " - ", Subject))) +
scale_x_date(breaks = seq(1950, 2100, 5) |> paste0("-01-01") |> as.Date(),
labels = date_format("%Y")) +
scale_y_continuous(breaks = seq(0, 80000, 500),
labels = dollar_format(accuracy = 1, prefix = "")) +
#
theme(legend.position = c(0.7, 0.80),
legend.title = element_blank())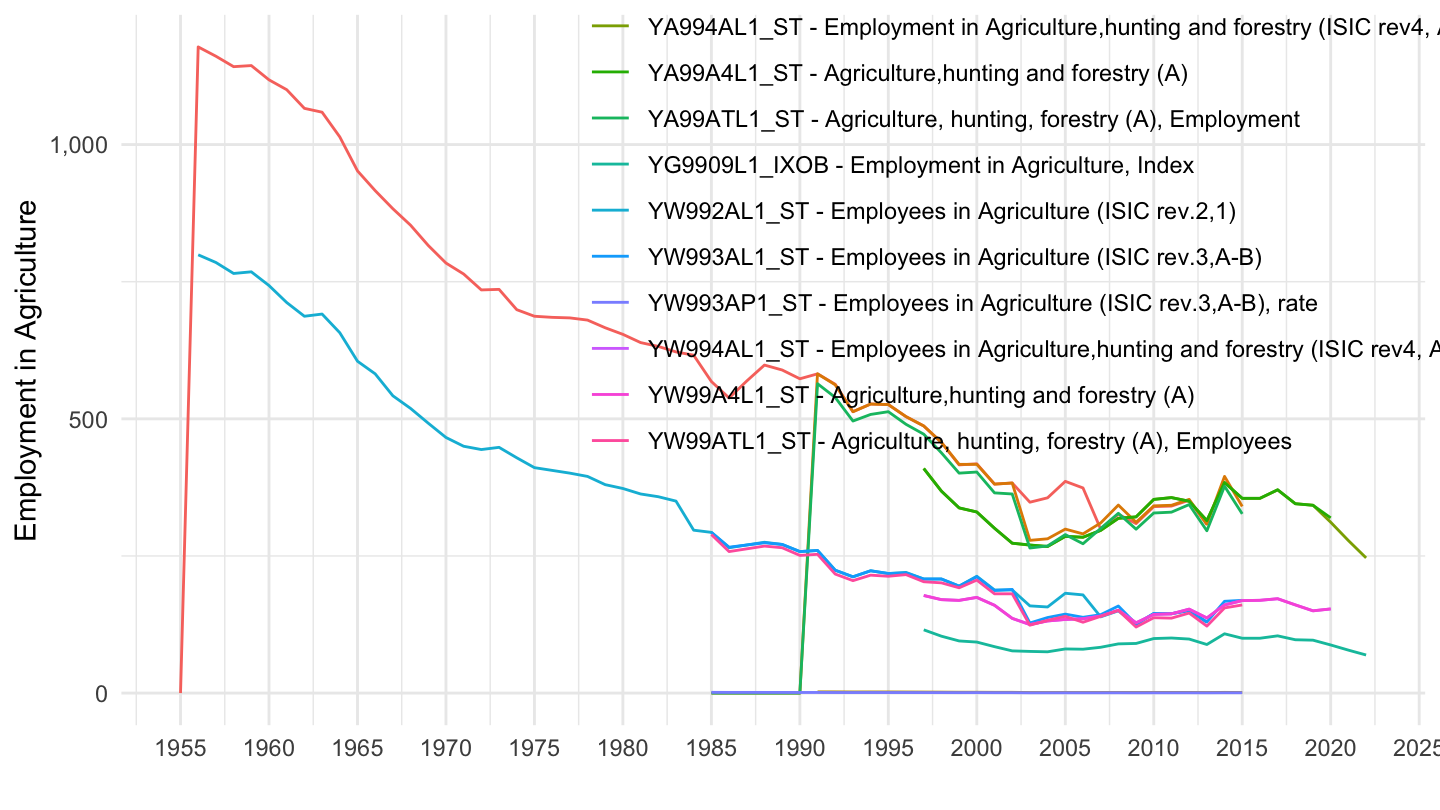
ALFS_EMP |>
  left_join(ALFS_EMP_var$SUBJECT, by = "SUBJECT") |>
  filter(SEX == "TT",
         LOCATION == "GBR",
         grepl("Industry", Subject)) |>
  year_to_date() |>
  ggplot() + theme_minimal() + xlab("") + ylab("Employment in Manufacturing") +
  geom_line(aes(x = date, y = obsValue, color = paste0(SUBJECT, " - ", Subject))) +
  scale_x_date(breaks = seq(1950, 2100, 5) |> paste0("-01-01") |> as.Date(),
               labels = date_format("%Y")) +
  scale_y_continuous(breaks = seq(0, 80000, 500),
                     labels = dollar_format(accuracy = 1, prefix = "")) +
  #
  theme(legend.position = c(0.7, 0.80),
        legend.title = element_blank())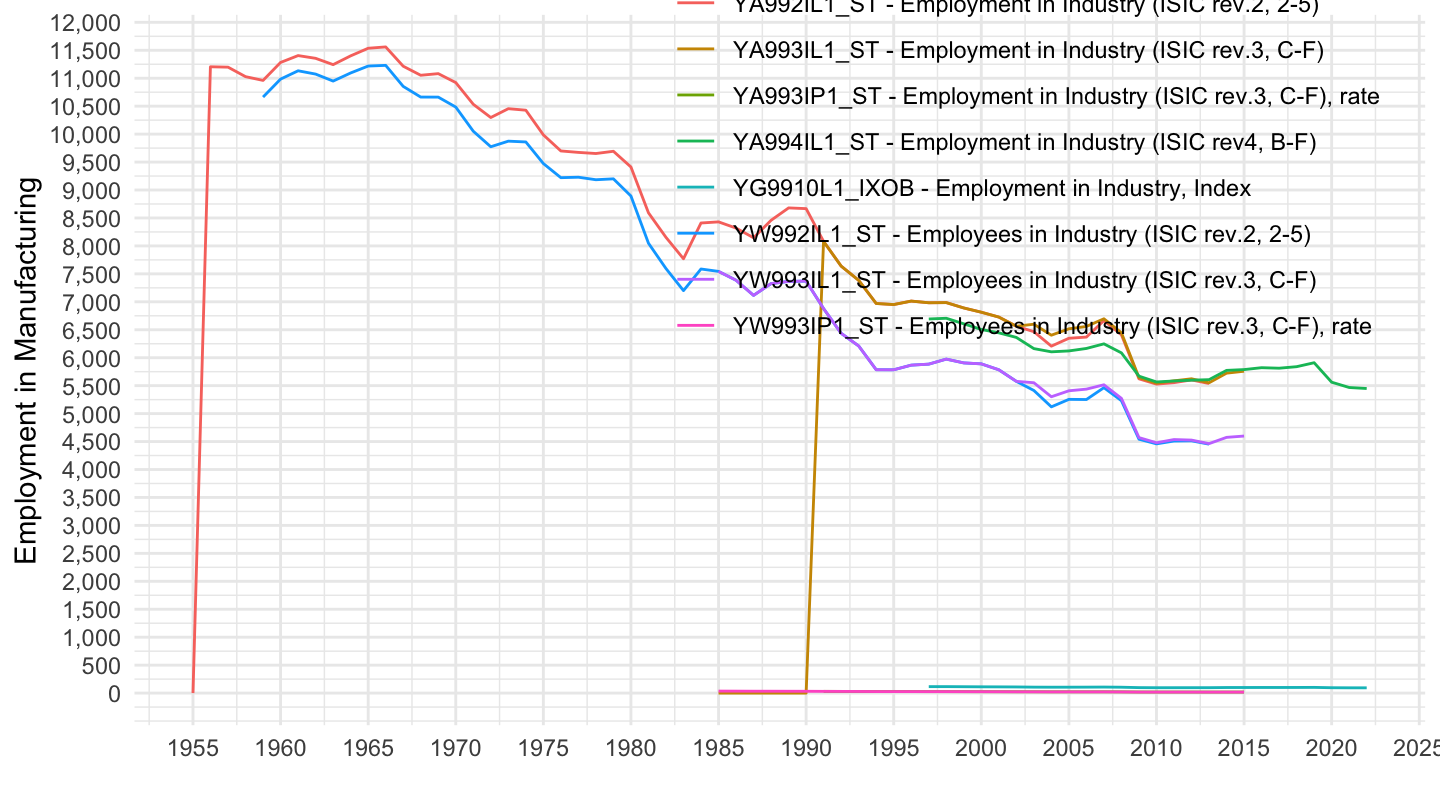
ALFS_EMP |>
  left_join(ALFS_EMP_var$SUBJECT, by = "SUBJECT") |>
  filter(SEX == "TT",
         LOCATION == "GBR",
         grepl("Manufacturing", Subject)) |>
  year_to_date() |>
  ggplot() + theme_minimal() + xlab("") + ylab("Employment in Manufacturing") +
  geom_line(aes(x = date, y = obsValue, color = paste0(SUBJECT, " - ", Subject))) +
  scale_x_date(breaks = seq(1950, 2100, 5) |> paste0("-01-01") |> as.Date(),
               labels = date_format("%Y")) +
  scale_y_continuous(breaks = seq(0, 80000, 500),
                     labels = dollar_format(accuracy = 1, prefix = "")) +

  theme(legend.position = c(0.7, 0.80),
        legend.title = element_blank())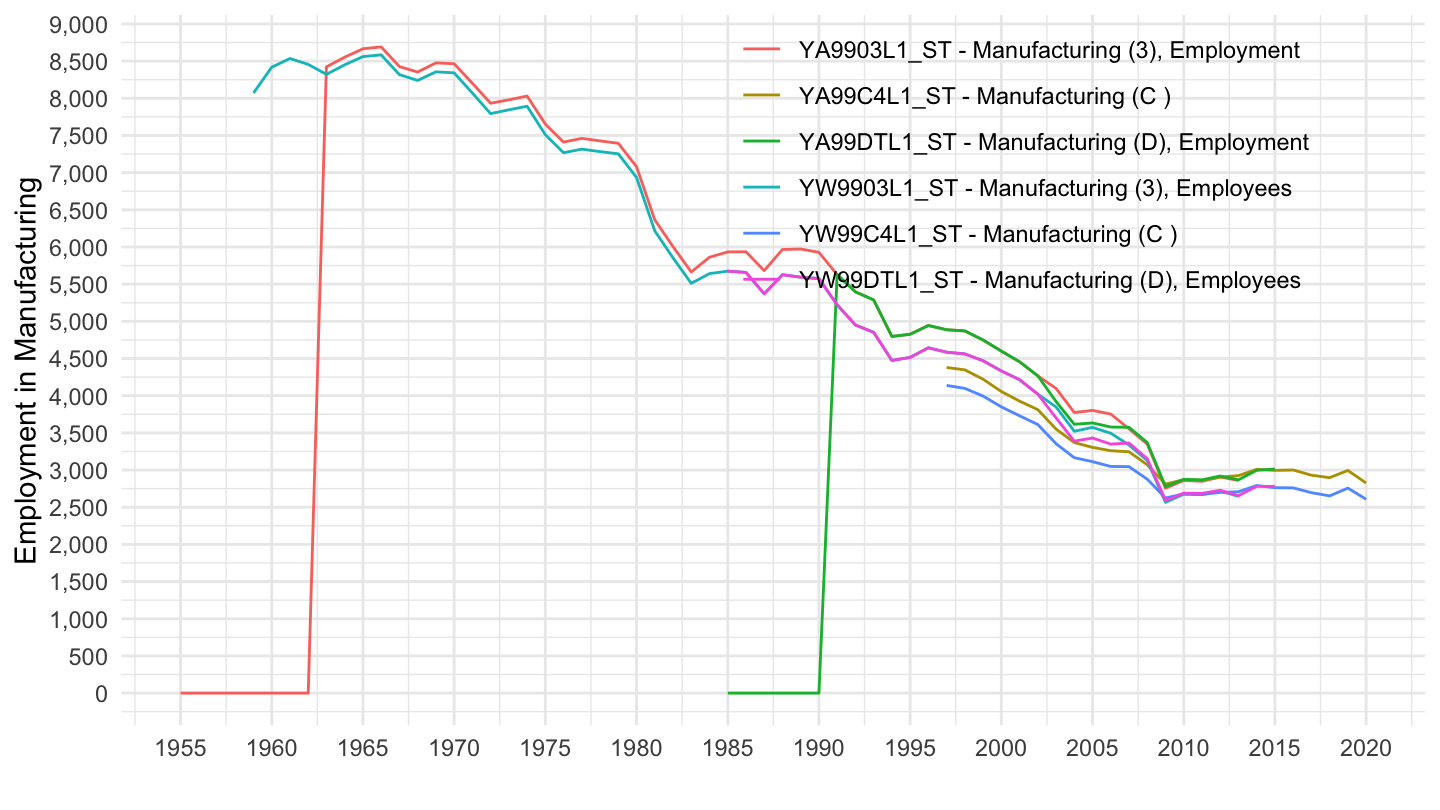
ALFS_EMP |>
  left_join(ALFS_EMP_var$SUBJECT, by = "SUBJECT") |>
  filter(SEX == "TT",
         LOCATION == "USA",
         grepl("Construction", Subject)) |>
  year_to_date() |>
  ggplot() + theme_minimal() + xlab("") + ylab("Employment in Construction") +
  geom_line(aes(x = date, y = obsValue, color = paste0(SUBJECT, " - ", Subject))) +
  scale_x_date(breaks = seq(1940, 2100, 5) |> paste0("-01-01") |> as.Date(),
               labels = date_format("%Y")) +
  scale_y_continuous(breaks = seq(0, 8000, 100),
                     labels = dollar_format(accuracy = 1, prefix = "")) +

  theme(legend.position = c(0.7, 0.80),
        legend.title = element_blank())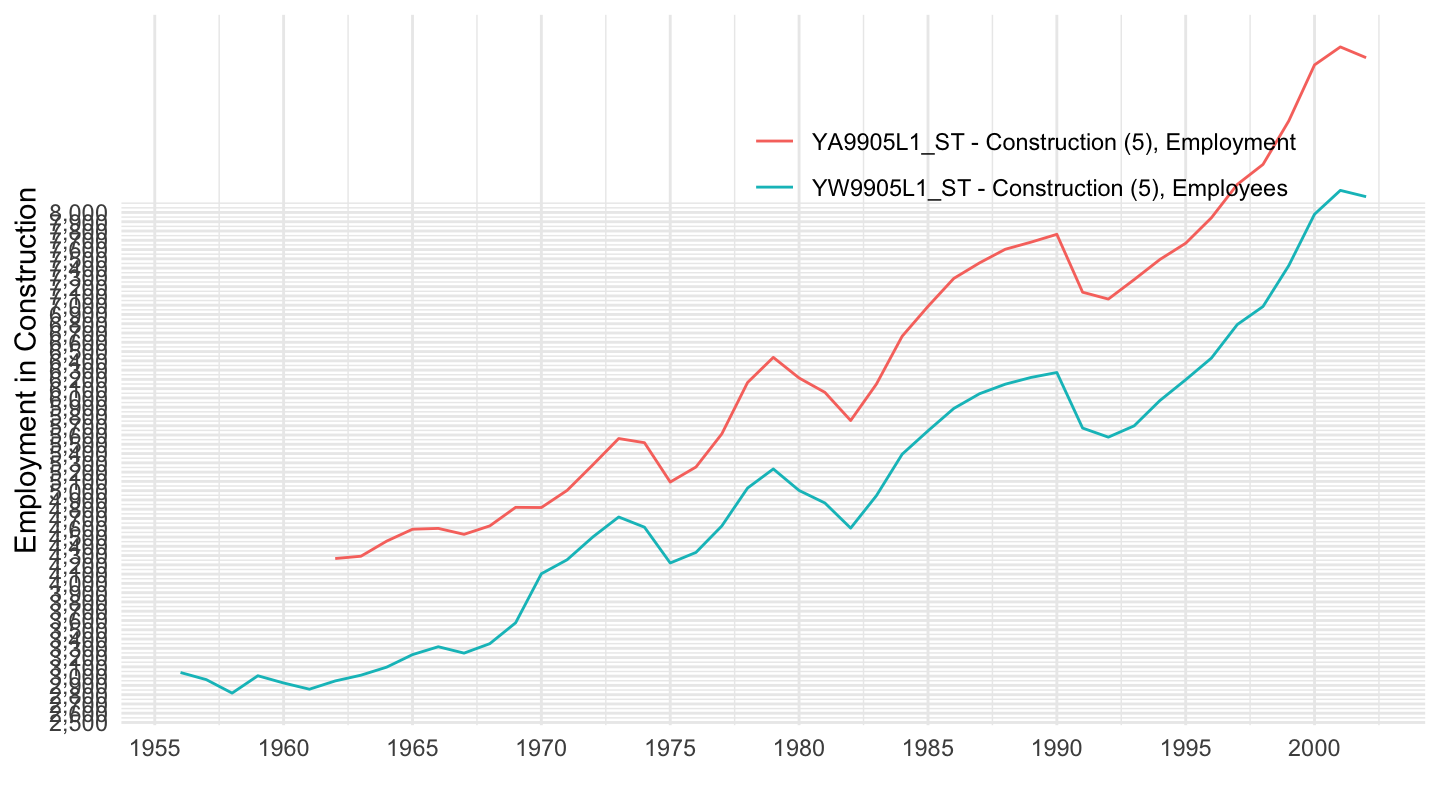
ALFS_EMP |>
  left_join(ALFS_EMP_var$SUBJECT, by = "SUBJECT") |>
  filter(SEX == "TT",
         LOCATION == "USA",
         grepl("all activities", Subject),
         !(SUBJECT %in% c("YS99TTL4_ST", "YS99TTL3_ST"))) |>
  year_to_date() |>
  ggplot() + theme_minimal() + xlab("") + ylab("Total Employment") +
  geom_line(aes(x = date, y = obsValue, color = paste0(SUBJECT, " - ", Subject))) +
  scale_x_date(breaks = seq(1940, 2100, 5) |> paste0("-01-01") |> as.Date(),
               labels = date_format("%Y")) +
  scale_y_continuous(breaks = seq(0, 500000, 2000),
                     labels = dollar_format(accuracy = 1, prefix = "")) +

  theme(legend.position = c(0.4, 0.80),
        legend.title = element_blank())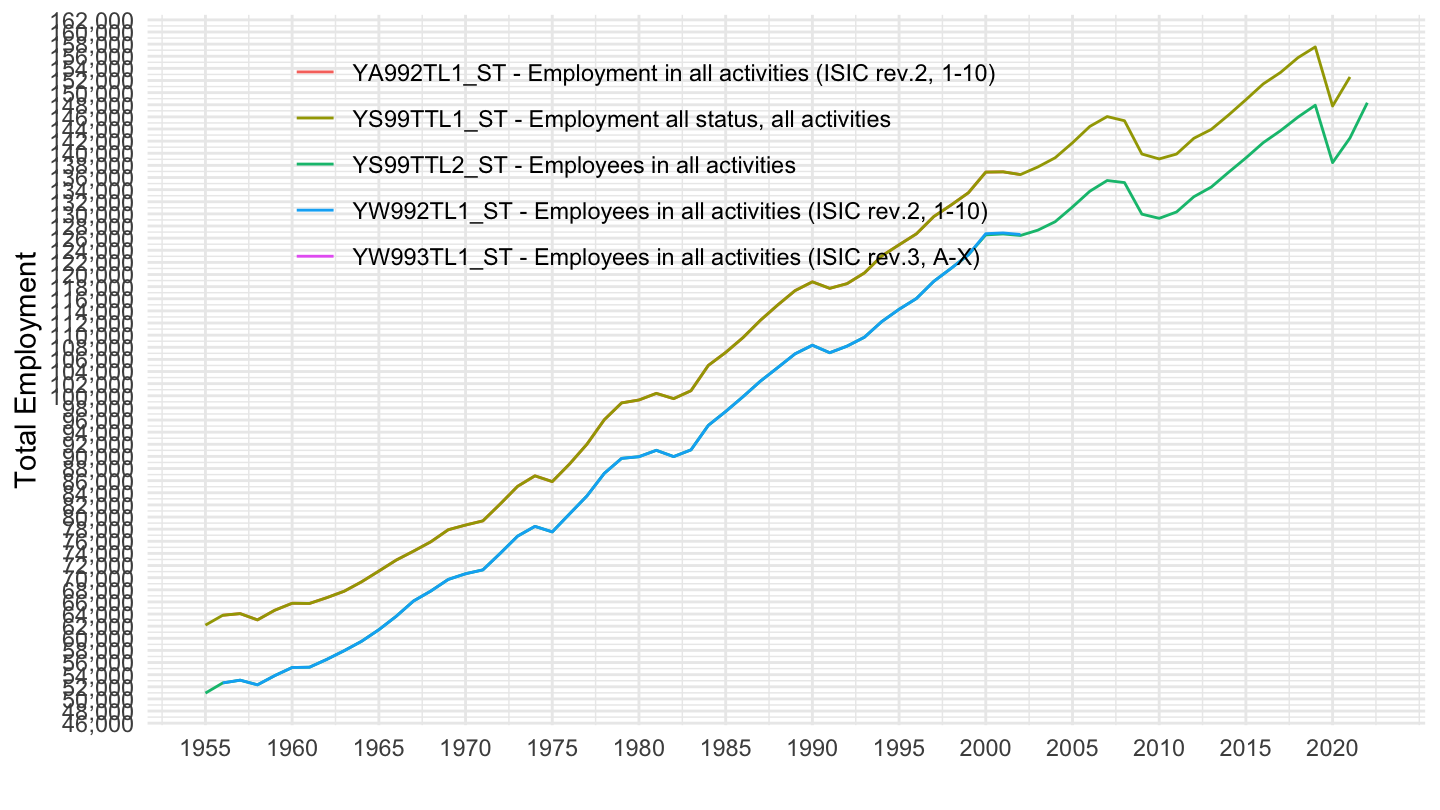
ALFS_EMP |>
  filter(SEX == "TT",
         LOCATION == "FRA",
         TIME_PERIOD %in% paste0(seq(1958, 2018, 20))) |>
  left_join(ALFS_EMP_var$SUBJECT, by = "SUBJECT") |>
  select(SUBJECT, Subject, TIME_PERIOD, obsValue) |>
  spread(TIME_PERIOD, obsValue) |>
print_table_conditional()ALFS_EMP |>
left_join(ALFS_EMP_var$SUBJECT, by = "SUBJECT") |>
filter(SEX == "TT",
LOCATION == "FRA",
grepl("Agriculture", Subject)) |>
year_to_date() |>
ggplot() + theme_minimal() + xlab("") + ylab("Employment in Agriculture") +
geom_line(aes(x = date, y = obsValue, color = paste0(SUBJECT, " - ", Subject))) +
scale_x_date(breaks = seq(1950, 2100, 5) |> paste0("-01-01") |> as.Date(),
labels = date_format("%Y")) +
scale_y_continuous(breaks = seq(0, 8000, 500),
labels = dollar_format(accuracy = 1, prefix = "")) +
theme(legend.position = c(0.7, 0.80),
legend.title = element_blank())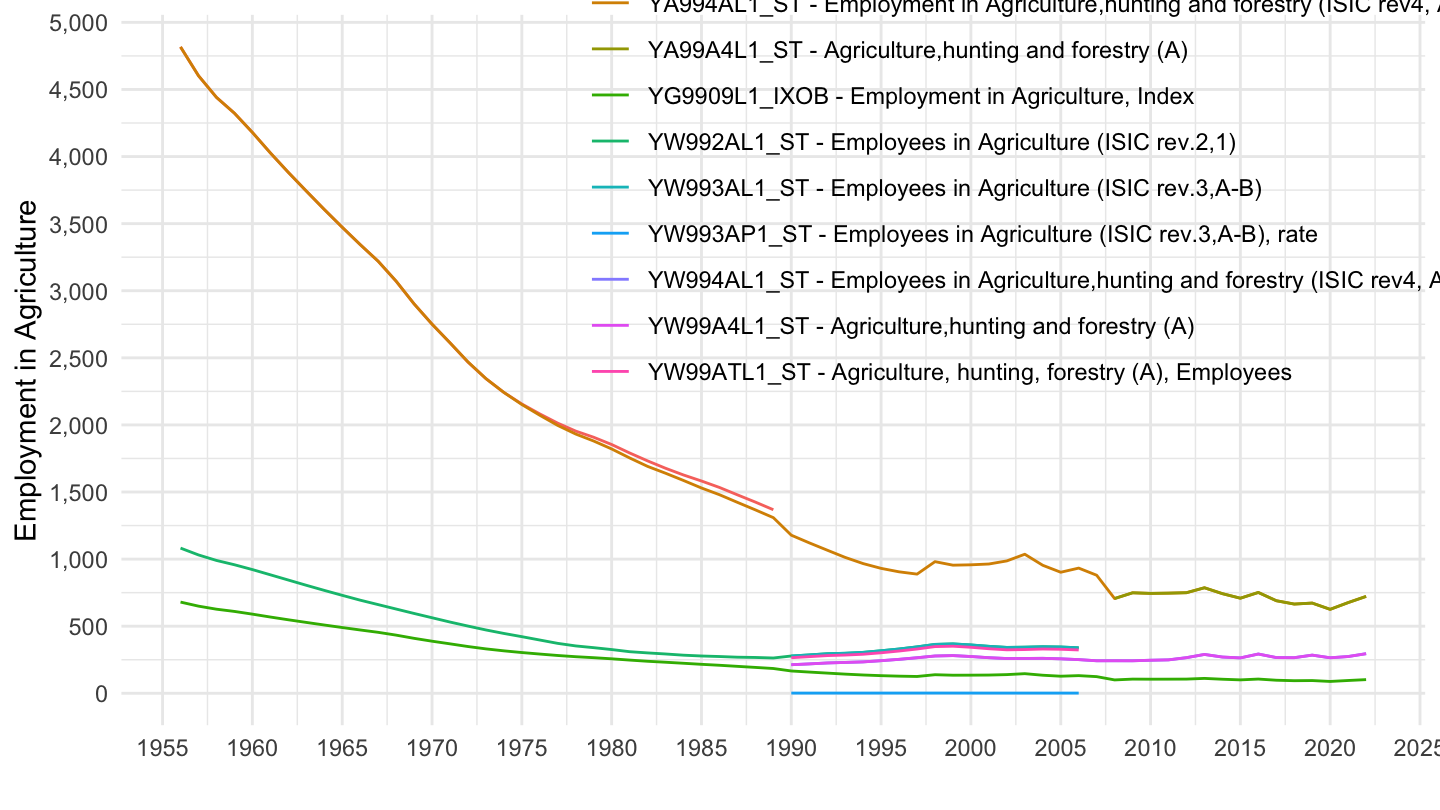
ALFS_EMP |>
  left_join(ALFS_EMP_var$SUBJECT, by = "SUBJECT") |>
  filter(SEX == "TT",
         LOCATION == "FRA",
         grepl("Manufacturing", Subject)) |>
  year_to_date() |>
  ggplot() + theme_minimal() + xlab("") + ylab("Employment in Manufacturing") +
  geom_line(aes(x = date, y = obsValue, color = paste0(SUBJECT, " - ", Subject))) +
  scale_x_date(breaks = seq(1950, 2100, 5) |> paste0("-01-01") |> as.Date(),
               labels = date_format("%Y")) +
  scale_y_continuous(breaks = seq(0, 8000, 500),
                     labels = dollar_format(accuracy = 1, prefix = "")) +

  theme(legend.position = c(0.7, 0.80),
        legend.title = element_blank())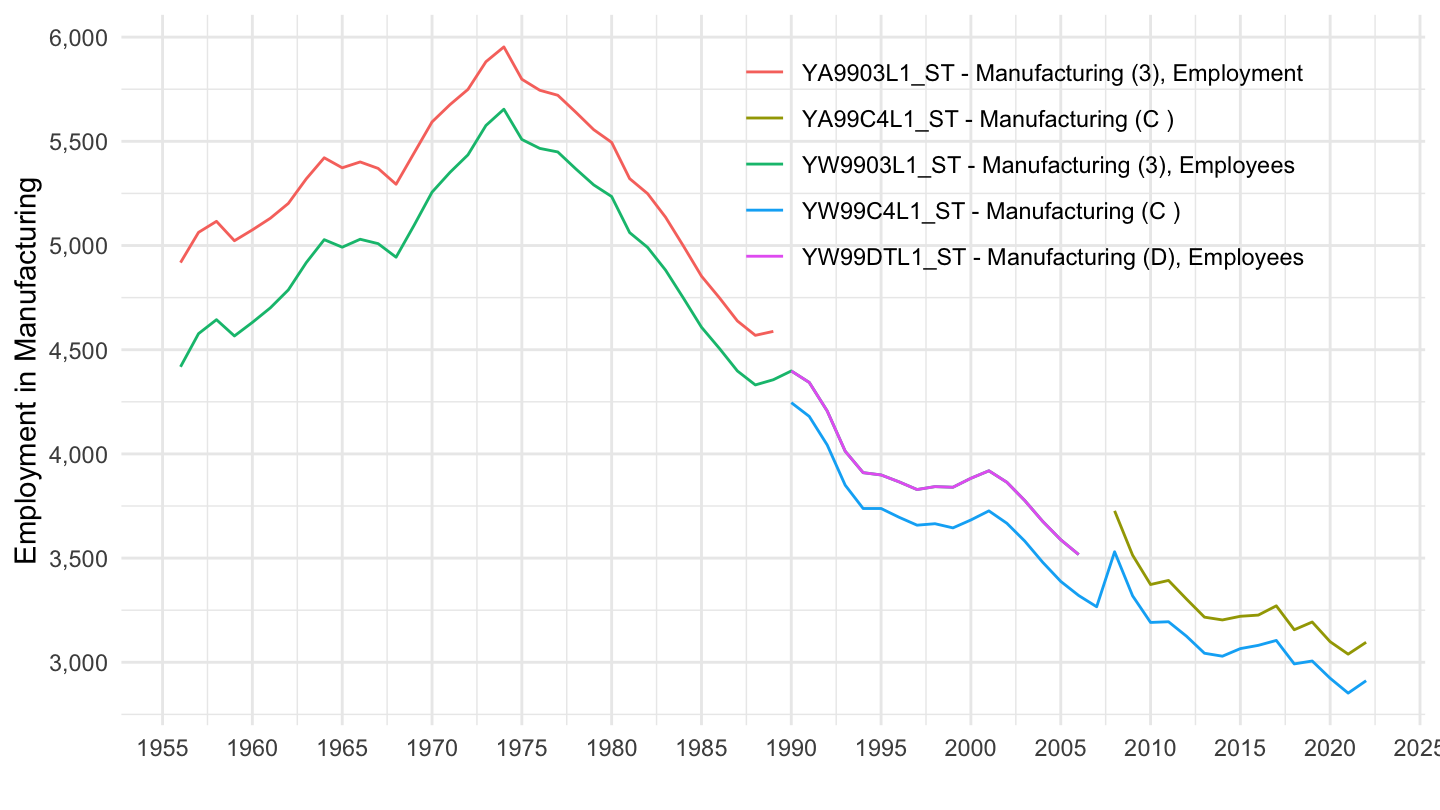
ALFS_EMP |>
  left_join(ALFS_EMP_var$SUBJECT, by = "SUBJECT") |>
  filter(SEX == "TT",
         LOCATION == "FRA",
         grepl("Construction", Subject)) |>
  year_to_date() |>
  ggplot() + theme_minimal() + xlab("") + ylab("Employment in Manufacturing") +
  geom_line(aes(x = date, y = obsValue, color = paste0(SUBJECT, " - ", Subject))) +
  scale_x_date(breaks = seq(1940, 2100, 5) |> paste0("-01-01") |> as.Date(),
               labels = date_format("%Y")) +
  scale_y_continuous(breaks = seq(0, 8000, 100),
                     labels = dollar_format(accuracy = 1, prefix = "")) +

  theme(legend.position = c(0.7, 0.80),
        legend.title = element_blank())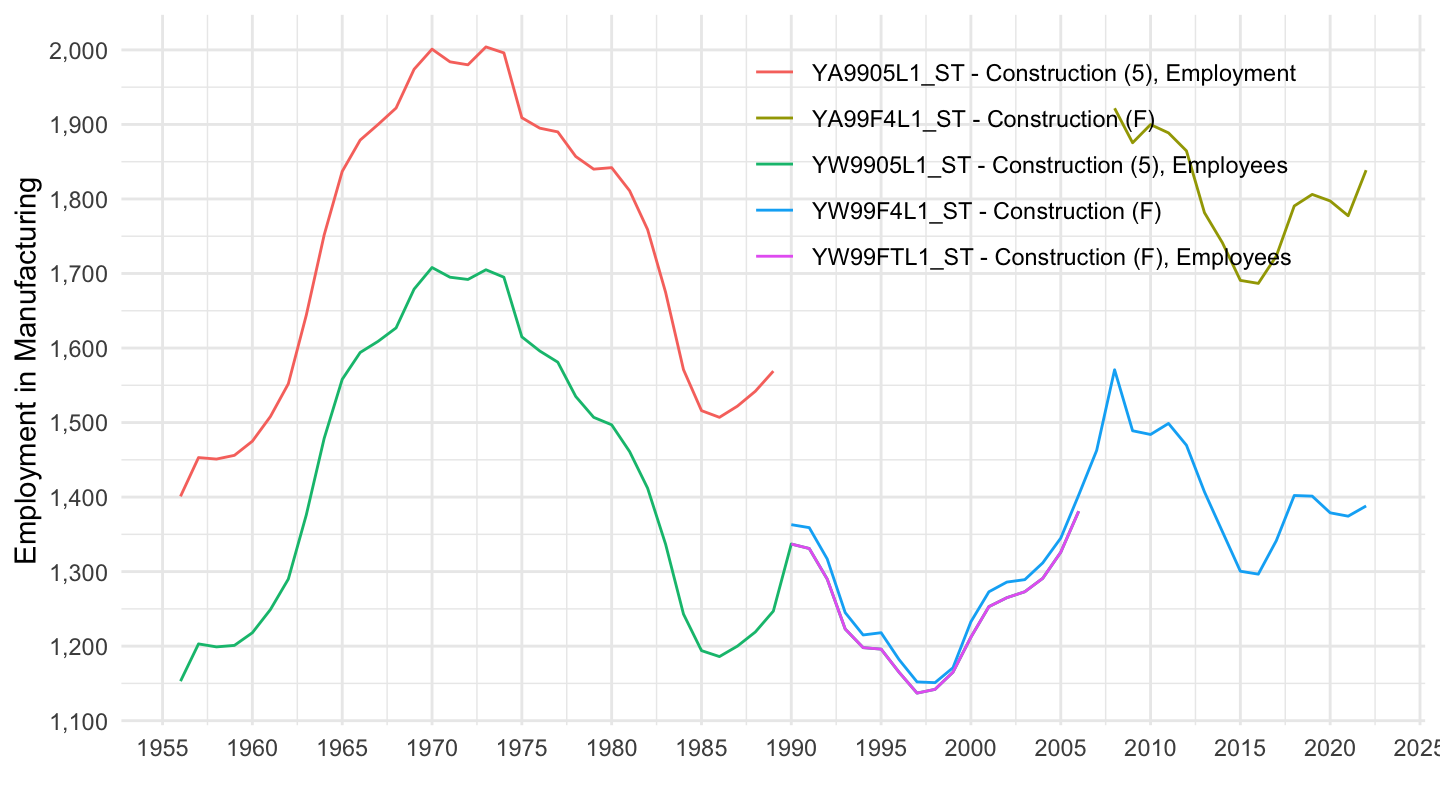
ALFS_EMP |>
  left_join(ALFS_EMP_var$SUBJECT, by = "SUBJECT") |>
  filter(SEX == "TT",
         LOCATION == "FRA",
         grepl("all activities", Subject),
         !(SUBJECT %in% c("YS99TTL4_ST", "YS99TTL3_ST"))) |>
  year_to_date() |>
  ggplot() + theme_minimal() + xlab("") + ylab("Total Employment") +
  geom_line(aes(x = date, y = obsValue, color = paste0(SUBJECT, " - ", Subject))) +
  scale_x_date(breaks = seq(1940, 2100, 5) |> paste0("-01-01") |> as.Date(),
               labels = date_format("%Y")) +
  scale_y_continuous(breaks = seq(0, 100000, 2000),
                     labels = dollar_format(accuracy = 1, prefix = "")) +

  theme(legend.position = c(0.4, 0.80),
        legend.title = element_blank())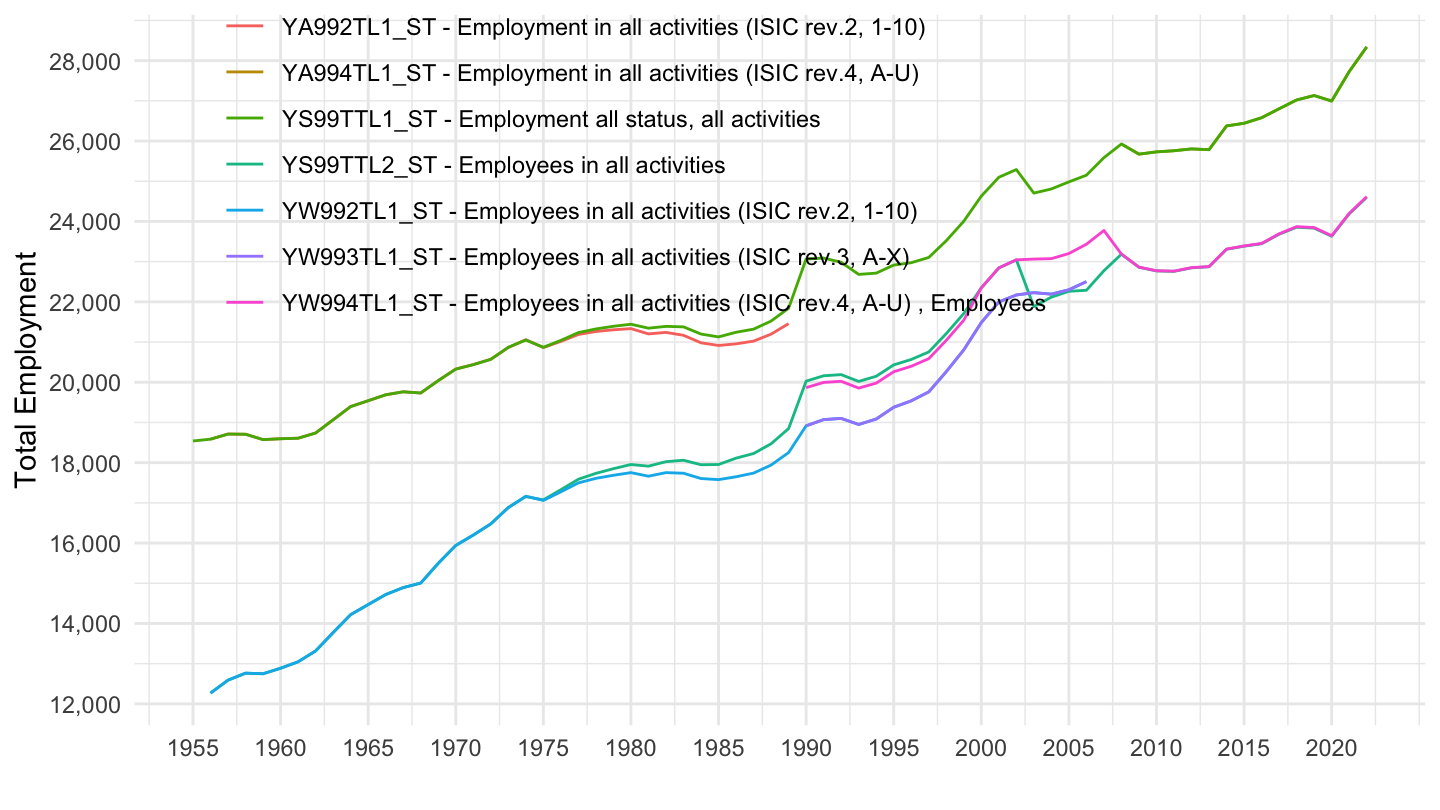
ALFS_EMP |>
  filter(SEX == "TT",
         LOCATION == "DEU",
         TIME_PERIOD %in% paste0(seq(1958, 2018, 20))) |>
  left_join(ALFS_EMP_var$SUBJECT, by = "SUBJECT") |>
  select(SUBJECT, Subject, TIME_PERIOD, obsValue) |>
  spread(TIME_PERIOD, obsValue) |>
print_table_conditional()ALFS_EMP |>
left_join(ALFS_EMP_var$SUBJECT, by = "SUBJECT") |>
year_to_date() |>
filter(SEX == "TT",
LOCATION == "DEU",
grepl("Manufacturing", Subject),
date >= as.Date("1958-01-01")) |>
ggplot() + theme_minimal() + xlab("") + ylab("Employment in Manufacturing") +
geom_line(aes(x = date, y = obsValue, color = paste0(SUBJECT, " - ", Subject))) +
scale_x_date(breaks = seq(1940, 2100, 5) |> paste0("-01-01") |> as.Date(),
labels = date_format("%Y")) +
scale_y_continuous(breaks = seq(0, 20000, 500),
labels = dollar_format(accuracy = 1, prefix = "")) +
theme(legend.position = c(0.7, 0.80),
legend.title = element_blank())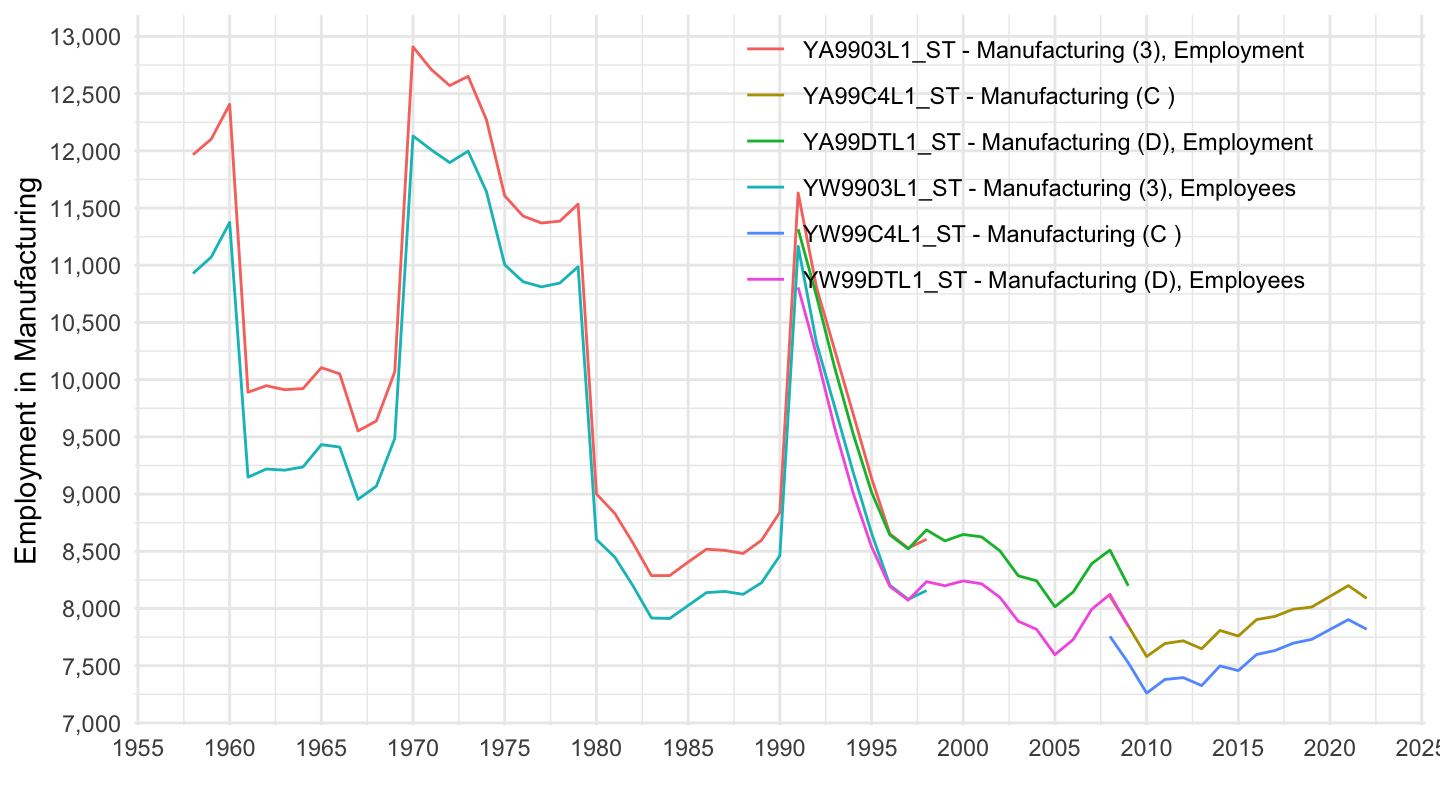
ALFS_EMP |>
  year_to_date() |>
  left_join(ALFS_EMP_var$SUBJECT, by = "SUBJECT") |>
  filter(SEX == "TT",
         LOCATION == "DEU",
         grepl("Construction", Subject),
         date >= as.Date("1961-01-01")) |>
  ggplot() + theme_minimal() + xlab("") + ylab("Employment in Construction") +
  geom_line(aes(x = date, y = obsValue, color = paste0(SUBJECT, " - ", Subject))) +
  scale_x_date(breaks = seq(1940, 2100, 5) |> paste0("-01-01") |> as.Date(),
               labels = date_format("%Y")) +
  scale_y_continuous(breaks = seq(0, 8000, 100),
                     labels = dollar_format(accuracy = 1, prefix = "")) +

  theme(legend.position = c(0.3, 0.80),
        legend.title = element_blank())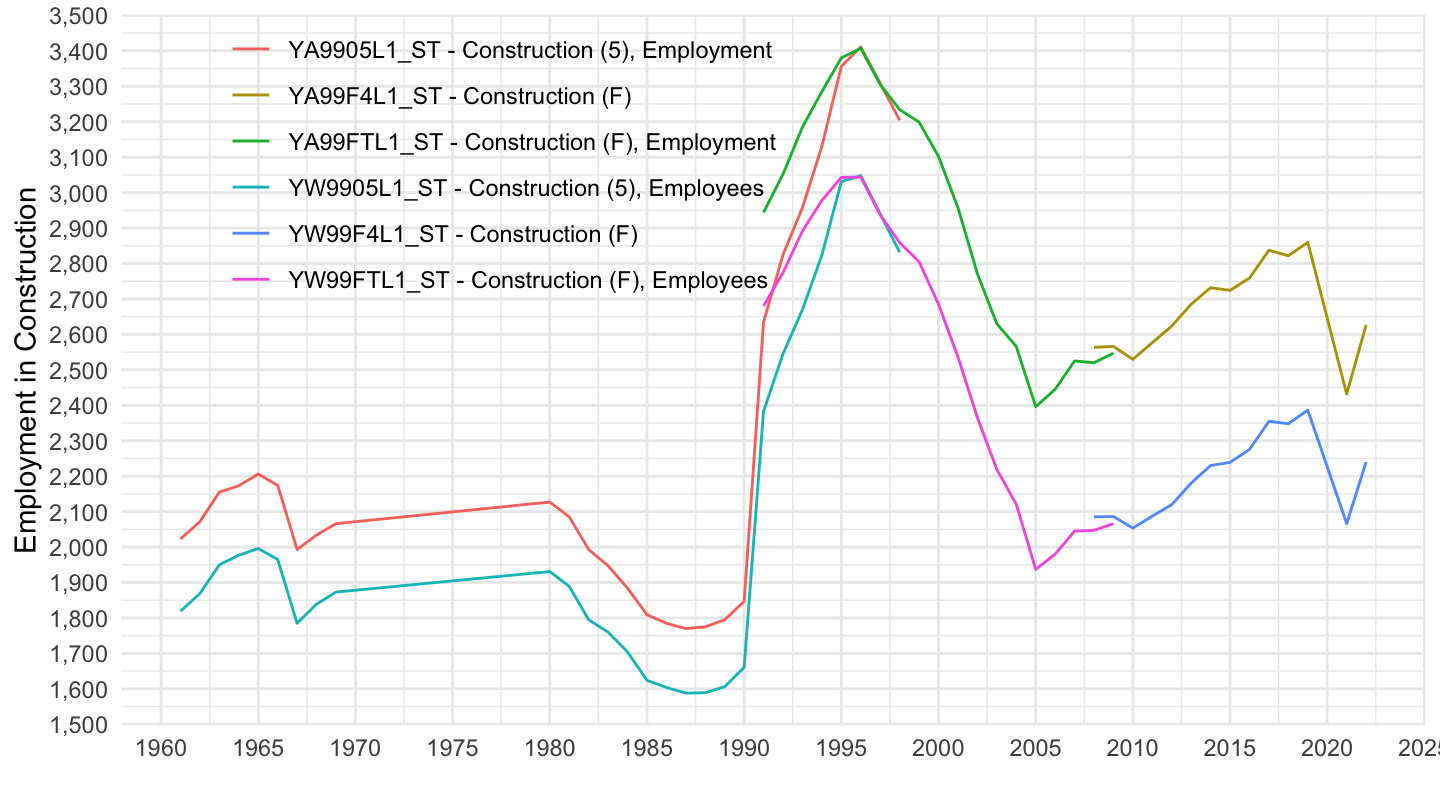
ALFS_EMP |>
  left_join(ALFS_EMP_var$SUBJECT, by = "SUBJECT") |>
  filter(SEX == "TT",
         LOCATION == "DEU",
         grepl("all activities", Subject),
         !(SUBJECT %in% c("YS99TTL4_ST", "YS99TTL3_ST"))) |>
  year_to_date() |>
  ggplot() + theme_minimal() + xlab("") + ylab("Total Employment") +
  geom_line(aes(x = date, y = obsValue, color = paste0(SUBJECT, " - ", Subject))) +
  scale_x_date(breaks = seq(1940, 2100, 5) |> paste0("-01-01") |> as.Date(),
               labels = date_format("%Y")) +
  scale_y_continuous(breaks = seq(0, 100000, 2000),
                     labels = dollar_format(accuracy = 1, prefix = "")) +

  theme(legend.position = c(0.4, 0.80),
        legend.title = element_blank())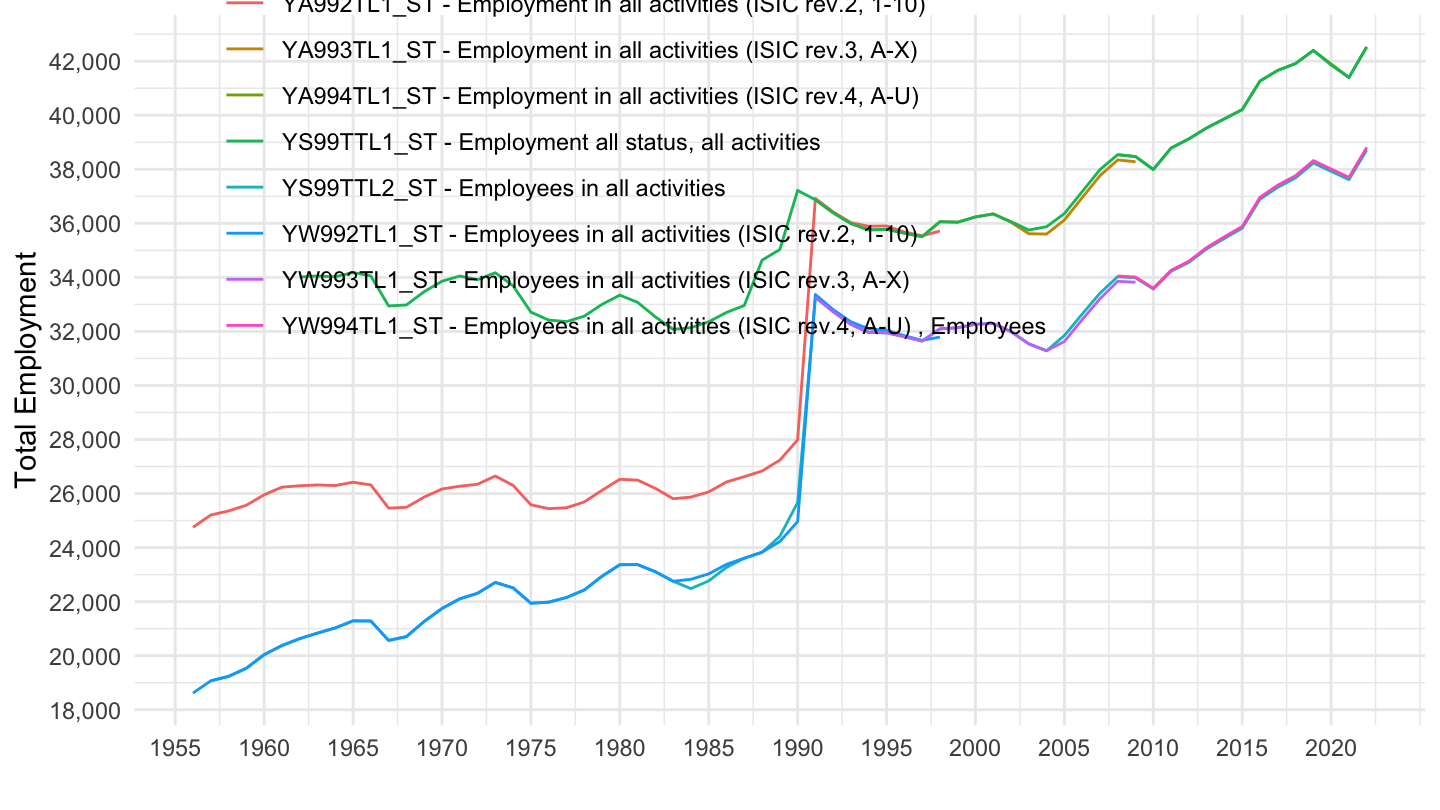
ALFS_EMP |>
  filter(SEX == "TT",
         LOCATION == "ITA",
         TIME_PERIOD %in% paste0(seq(1958, 2018, 20))) |>
  left_join(ALFS_EMP_var$SUBJECT, by = "SUBJECT") |>
  select(SUBJECT, Subject, TIME_PERIOD, obsValue) |>
  spread(TIME_PERIOD, obsValue) |>
print_table_conditional()ALFS_EMP |>
left_join(ALFS_EMP_var$SUBJECT, by = "SUBJECT") |>
filter(SEX == "TT",
LOCATION == "ITA",
grepl("Manufacturing", Subject)) |>
year_to_date() |>
ggplot() + theme_minimal() + xlab("") + ylab("Employment in Manufacturing") +
geom_line(aes(x = date, y = obsValue, color = paste0(SUBJECT, " - ", Subject))) +
scale_x_date(breaks = seq(1940, 2100, 5) |> paste0("-01-01") |> as.Date(),
labels = date_format("%Y")) +
scale_y_continuous(breaks = seq(0, 8000, 500),
labels = dollar_format(accuracy = 1, prefix = "")) +
theme(legend.position = c(0.7, 0.80),
legend.title = element_blank())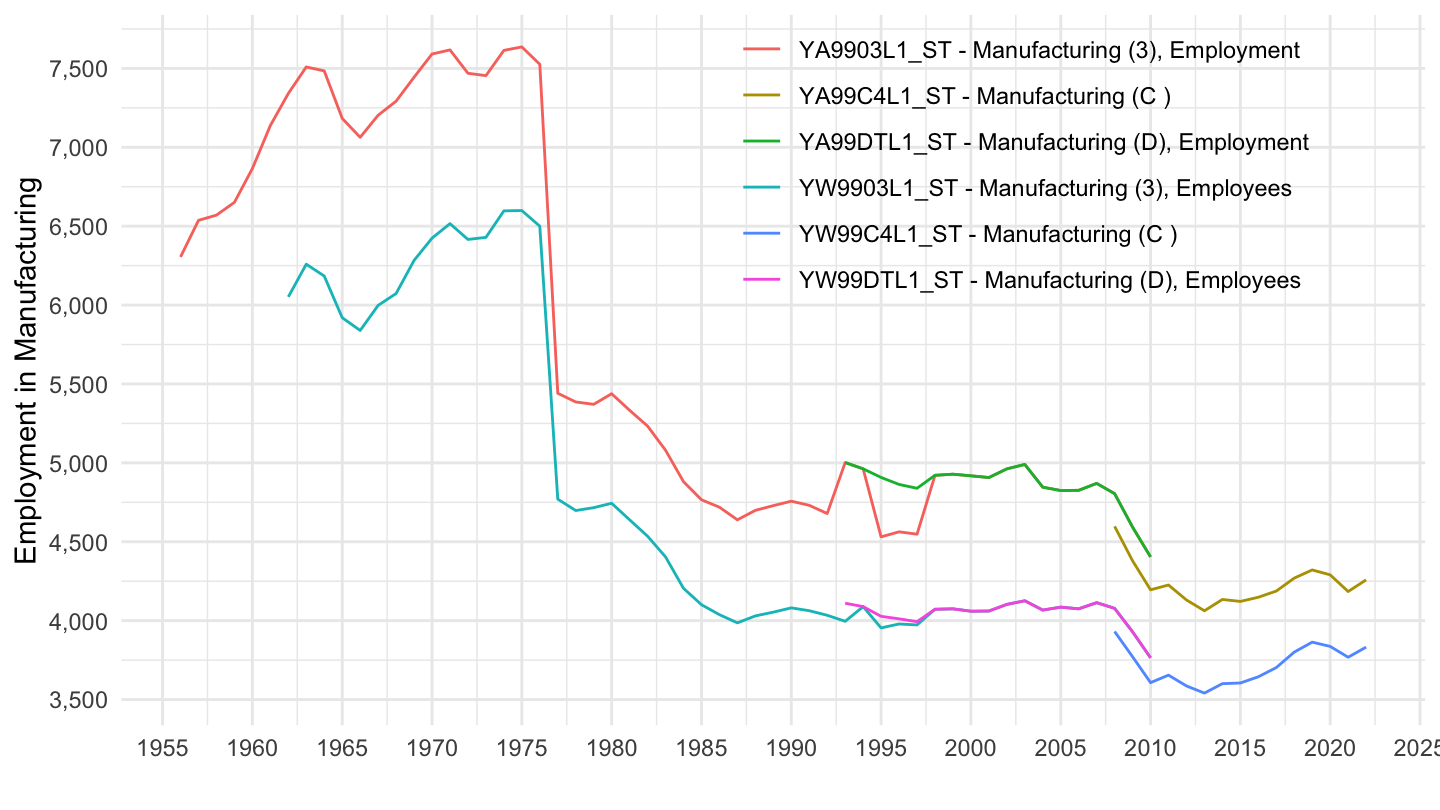
ALFS_EMP |>
  year_to_date() |>
  left_join(ALFS_EMP_var$SUBJECT, by = "SUBJECT") |>
  filter(SEX == "TT",
         LOCATION == "ITA",
         grepl("Construction", Subject),
         date >= as.Date("1961-01-01")) |>
  ggplot() + theme_minimal() + xlab("") + ylab("Employment in Construction") +
  geom_line(aes(x = date, y = obsValue, color = paste0(SUBJECT, " - ", Subject))) +
  scale_x_date(breaks = seq(1940, 2100, 5) |> paste0("-01-01") |> as.Date(),
               labels = date_format("%Y")) +
  scale_y_continuous(breaks = seq(0, 8000, 100),
                     labels = dollar_format(accuracy = 1, prefix = "")) +

  theme(legend.position = c(0.3, 0.80),
        legend.title = element_blank())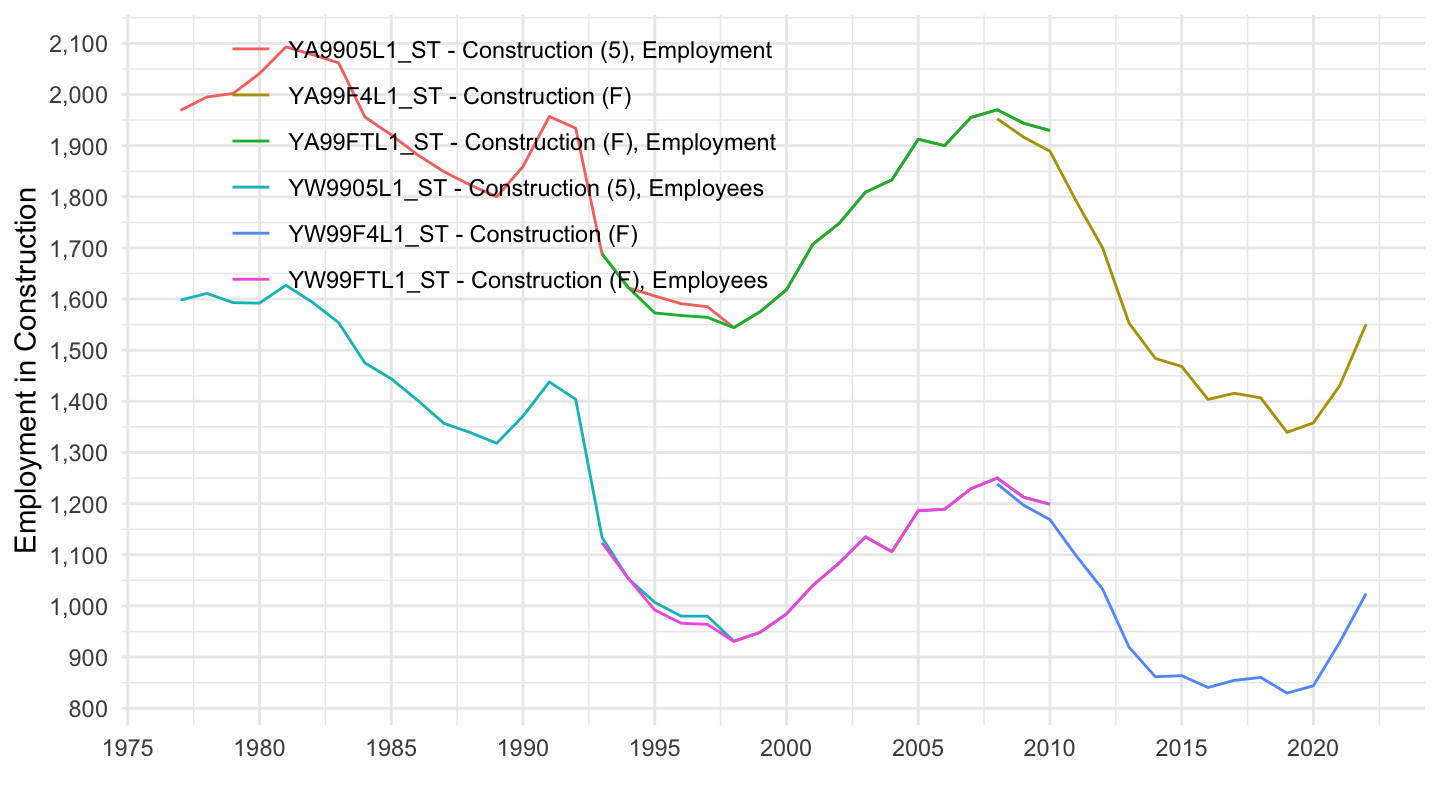
ALFS_EMP |>
  left_join(ALFS_EMP_var$SUBJECT, by = "SUBJECT") |>
  filter(SEX == "TT",
         LOCATION == "ITA",
         grepl("all activities", Subject),
         !(SUBJECT %in% c("YS99TTL4_ST", "YS99TTL3_ST"))) |>
  year_to_date() |>
  ggplot() + theme_minimal() + xlab("") + ylab("Total Employment") +
  geom_line(aes(x = date, y = obsValue, color = paste0(SUBJECT, " - ", Subject))) +
  scale_x_date(breaks = seq(1940, 2100, 5) |> paste0("-01-01") |> as.Date(),
               labels = date_format("%Y")) +
  scale_y_continuous(breaks = seq(0, 100000, 2000),
                     labels = dollar_format(accuracy = 1, prefix = "")) +

  theme(legend.position = c(0.4, 0.80),
        legend.title = element_blank())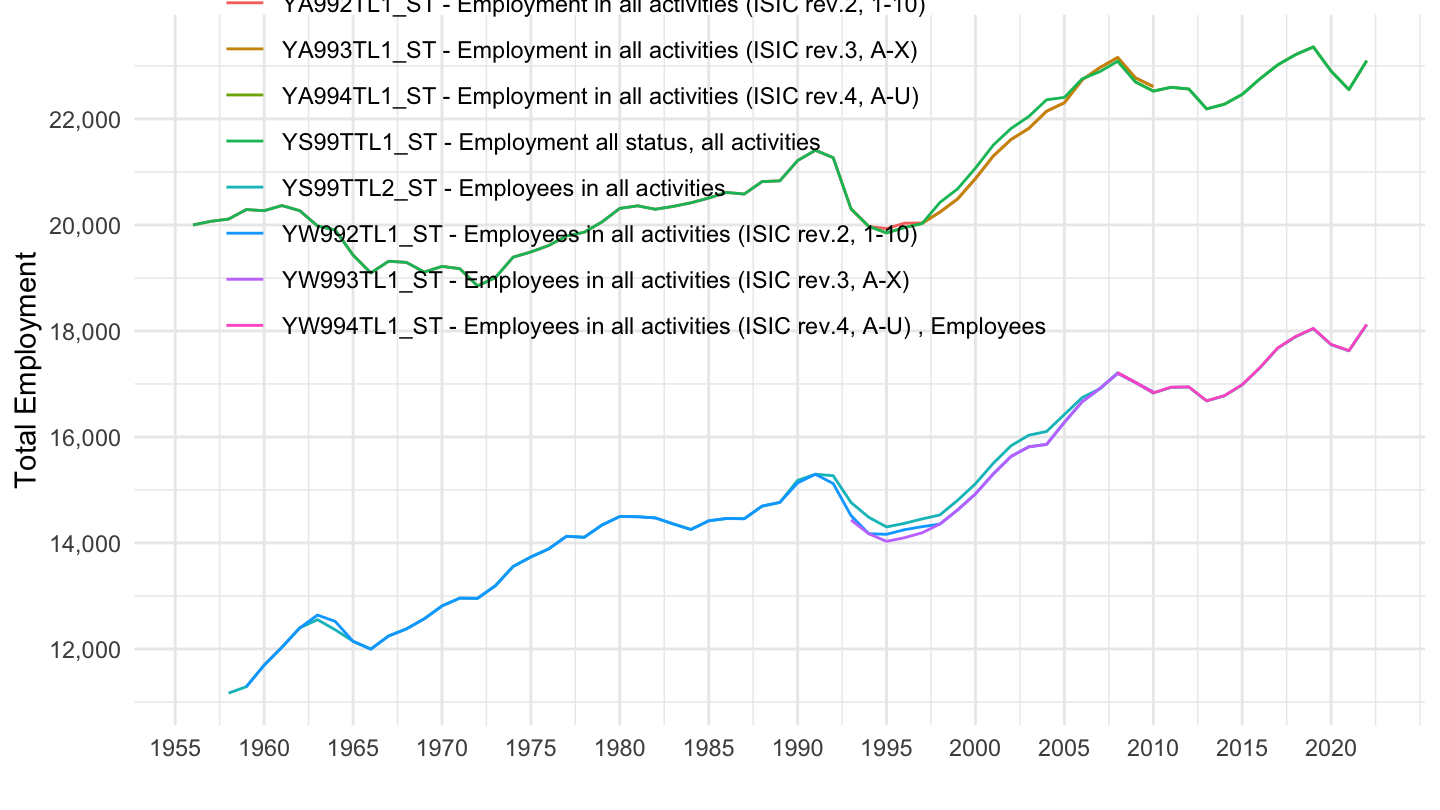
ALFS_EMP |>
  filter(SEX == "TT",
         LOCATION == "ESP",
         TIME_PERIOD %in% paste0(seq(1958, 2018, 20))) |>
  left_join(ALFS_EMP_var$SUBJECT, by = "SUBJECT") |>
  select(SUBJECT, Subject, TIME_PERIOD, obsValue) |>
  spread(TIME_PERIOD, obsValue) |>
print_table_conditional()ALFS_EMP |>
left_join(ALFS_EMP_var$SUBJECT, by = "SUBJECT") |>
filter(SEX == "TT",
LOCATION == "ESP",
grepl("Manufacturing", Subject)) |>
year_to_date() |>
ggplot() + theme_minimal() + xlab("") + ylab("Employment in Manufacturing") +
geom_line(aes(x = date, y = obsValue, color = paste0(SUBJECT, " - ", Subject))) +
scale_x_date(breaks = seq(1940, 2100, 5) |> paste0("-01-01") |> as.Date(),
labels = date_format("%Y")) +
scale_y_continuous(breaks = seq(0, 8000, 500),
labels = dollar_format(accuracy = 1, prefix = "")) +
theme(legend.position = c(0.7, 0.80),
legend.title = element_blank())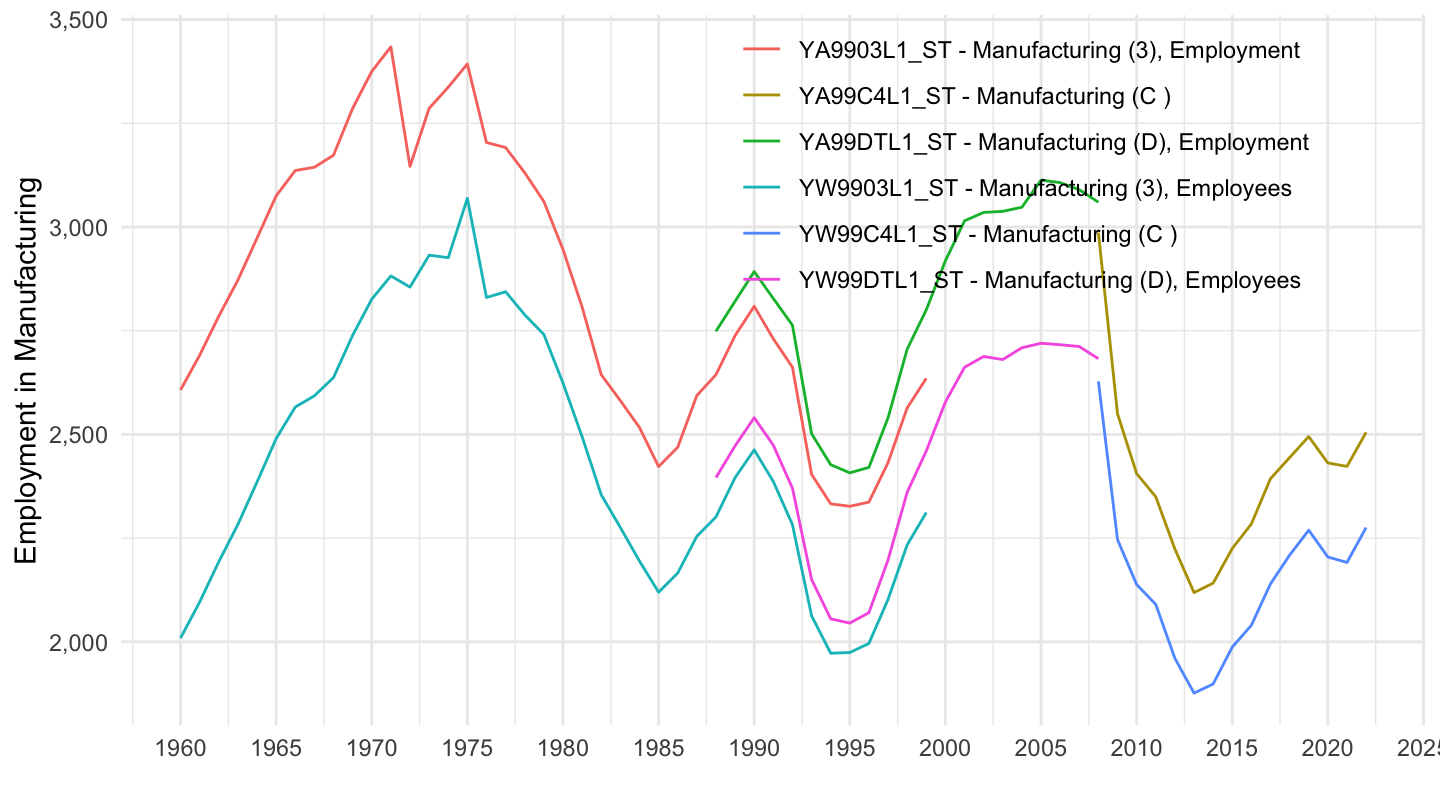
ALFS_EMP |>
  year_to_date() |>
  left_join(ALFS_EMP_var$SUBJECT, by = "SUBJECT") |>
  filter(SEX == "TT",
         LOCATION == "ESP",
         grepl("Construction", Subject),
         date >= as.Date("1961-01-01")) |>
  ggplot() + theme_minimal() + xlab("") + ylab("Employment in Construction") +
  geom_line(aes(x = date, y = obsValue, color = paste0(SUBJECT, " - ", Subject))) +
  scale_x_date(breaks = seq(1940, 2100, 5) |> paste0("-01-01") |> as.Date(),
               labels = date_format("%Y")) +
  scale_y_continuous(breaks = seq(0, 8000, 100),
                     labels = dollar_format(accuracy = 1, prefix = "")) +

  theme(legend.position = c(0.3, 0.80),
        legend.title = element_blank())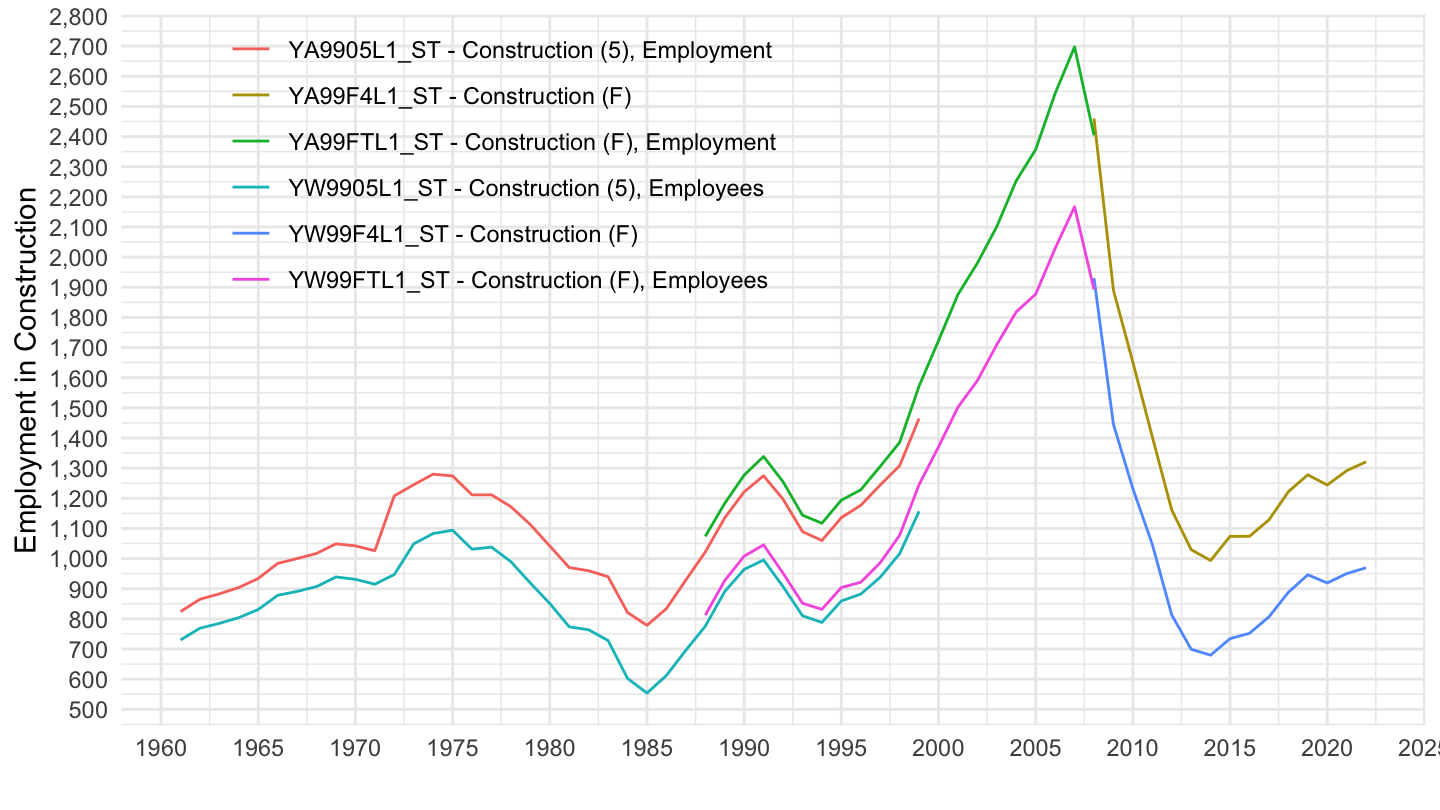
ALFS_EMP |>
  left_join(ALFS_EMP_var$SUBJECT, by = "SUBJECT") |>
  filter(SEX == "TT",
         LOCATION == "ESP",
         grepl("all activities", Subject),
         !(SUBJECT %in% c("YS99TTL4_ST", "YS99TTL3_ST"))) |>
  year_to_date() |>
  ggplot() + theme_minimal() + xlab("") + ylab("Total Employment") +
  geom_line(aes(x = date, y = obsValue, color = paste0(SUBJECT, " - ", Subject))) +
  scale_x_date(breaks = seq(1940, 2100, 5) |> paste0("-01-01") |> as.Date(),
               labels = date_format("%Y")) +
  scale_y_continuous(breaks = seq(0, 100000, 2000),
                     labels = dollar_format(accuracy = 1, prefix = "")) +

  theme(legend.position = c(0.4, 0.80),
        legend.title = element_blank())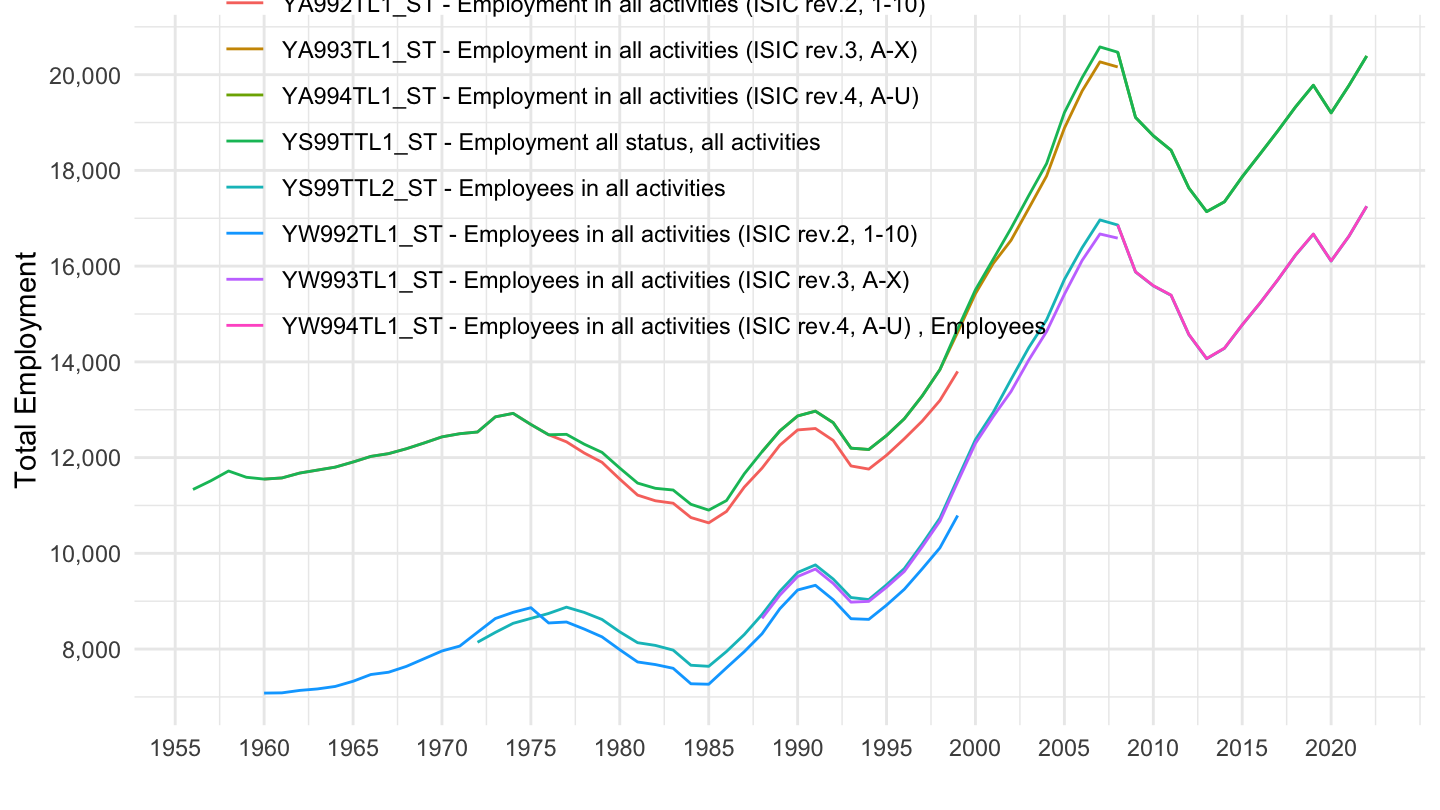
ALFS_EMP |>
  filter(SEX == "TT",
         LOCATION == "JPN",
         TIME_PERIOD %in% paste0(seq(1958, 2018, 20))) |>
  left_join(ALFS_EMP_var$SUBJECT, by = "SUBJECT") |>
  select(SUBJECT, Subject, TIME_PERIOD, obsValue) |>
  spread(TIME_PERIOD, obsValue) |>
print_table_conditional()ALFS_EMP |>
left_join(ALFS_EMP_var$SUBJECT, by = "SUBJECT") |>
filter(SEX == "TT",
LOCATION == "JPN",
grepl("Manufacturing", Subject)) |>
year_to_date() |>
ggplot() + theme_minimal() + xlab("") + ylab("Employment in Manufacturing") +
geom_line(aes(x = date, y = obsValue, color = paste0(SUBJECT, " - ", Subject))) +
scale_x_date(breaks = seq(1940, 2100, 5) |> paste0("-01-01") |> as.Date(),
labels = date_format("%Y")) +
scale_y_continuous(breaks = seq(0, 20000, 1000),
labels = dollar_format(accuracy = 1, prefix = "")) +
theme(legend.position = c(0.5, 0.25),
legend.title = element_blank())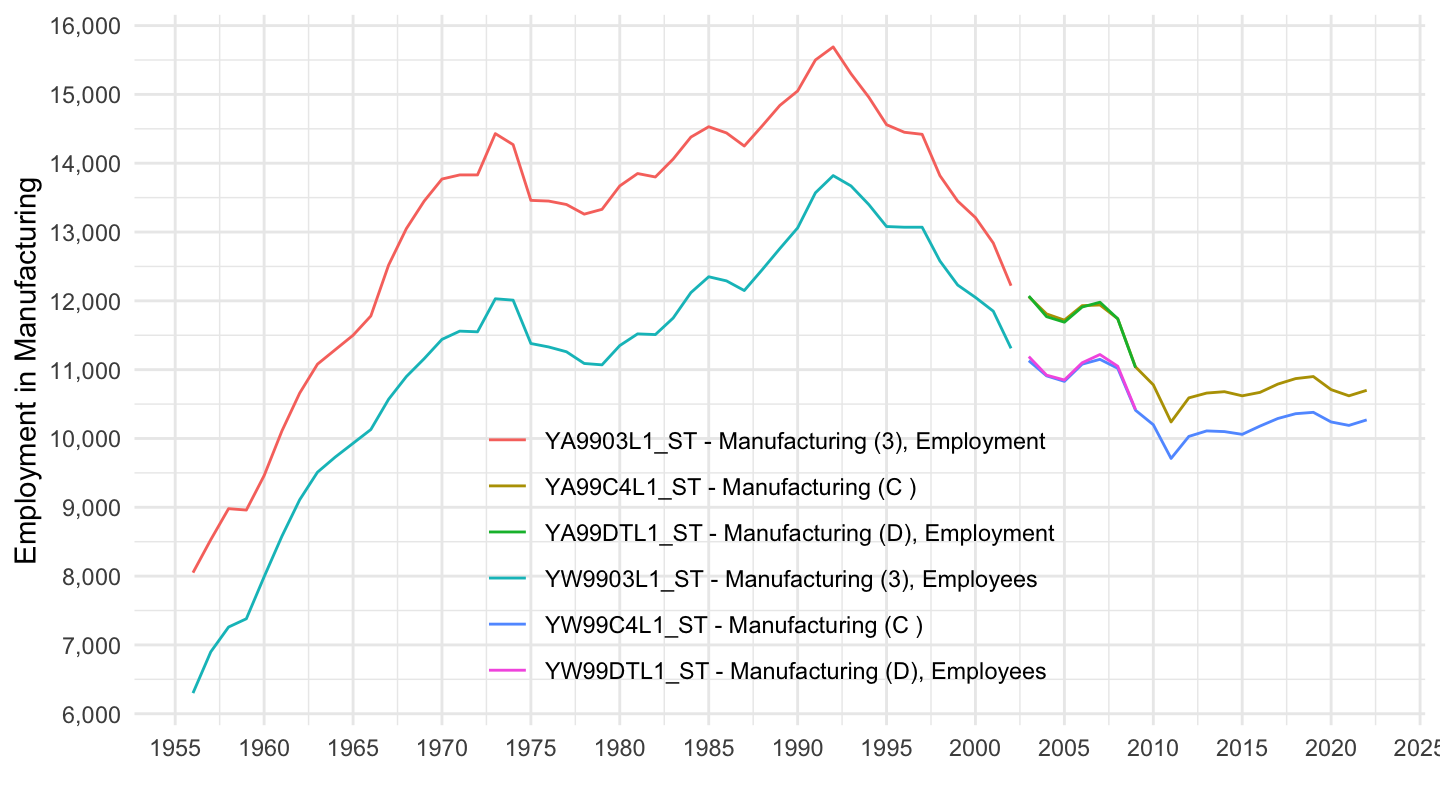
ALFS_EMP |>
  year_to_date() |>
  left_join(ALFS_EMP_var$SUBJECT, by = "SUBJECT") |>
  filter(SEX == "TT",
         LOCATION == "JPN",
         grepl("Construction", Subject),
         date >= as.Date("1961-01-01")) |>
  ggplot() + theme_minimal() + xlab("") + ylab("Employment in Construction") +
  geom_line(aes(x = date, y = obsValue, color = paste0(SUBJECT, " - ", Subject))) +
  scale_x_date(breaks = seq(1940, 2100, 5) |> paste0("-01-01") |> as.Date(),
               labels = date_format("%Y")) +
  scale_y_continuous(breaks = seq(0, 8000, 100),
                     labels = dollar_format(accuracy = 1, prefix = "")) +

  theme(legend.position = c(0.3, 0.80),
        legend.title = element_blank())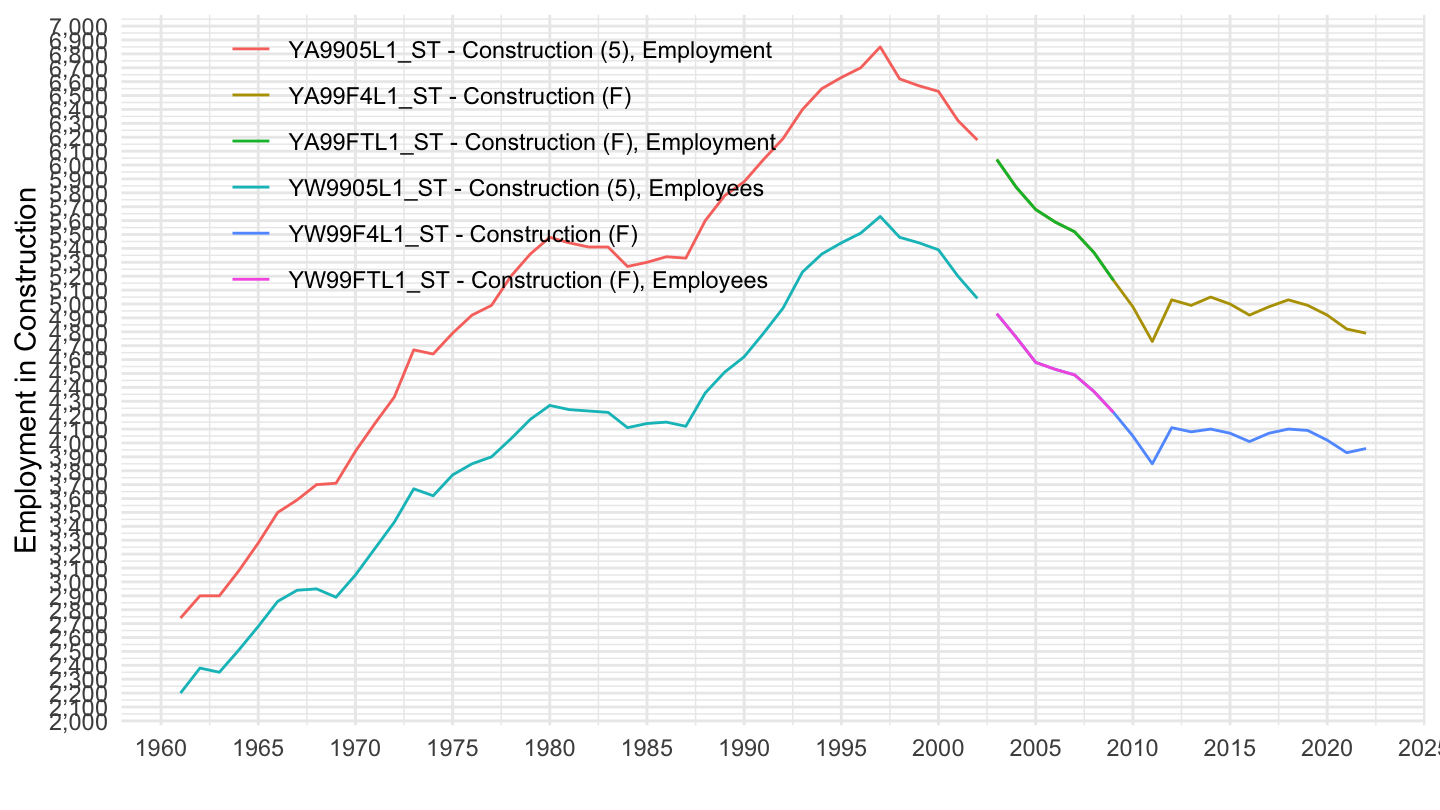
ALFS_EMP |>
  left_join(ALFS_EMP_var$SUBJECT, by = "SUBJECT") |>
  filter(SEX == "TT",
         LOCATION == "JPN",
         grepl("all activities", Subject),
         !(SUBJECT %in% c("YS99TTL4_ST", "YS99TTL3_ST"))) |>
  year_to_date() |>
  ggplot() + theme_minimal() + xlab("") + ylab("Total Employment") +
  geom_line(aes(x = date, y = obsValue, color = paste0(SUBJECT, " - ", Subject))) +
  scale_x_date(breaks = seq(1940, 2100, 5) |> paste0("-01-01") |> as.Date(),
               labels = date_format("%Y")) +
  scale_y_continuous(breaks = seq(0, 100000, 2000),
                     labels = dollar_format(accuracy = 1, prefix = "")) +

  theme(legend.position = c(0.4, 0.80),
        legend.title = element_blank())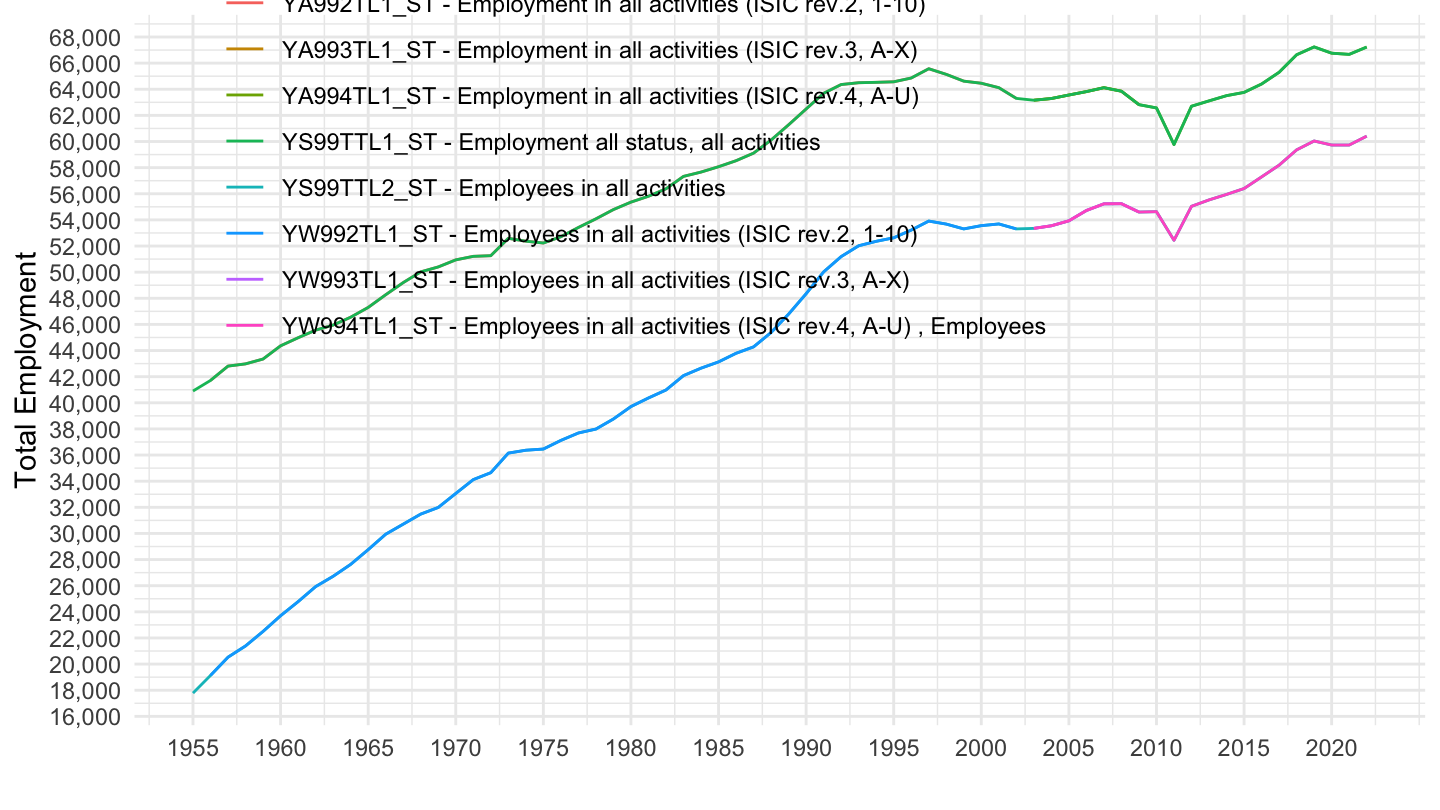
ALFS_EMP |>
  # YA9903L1_ST: Employees in Industry (ISIC rev.2, 2-5)
  # YS99TTL2_ST: Employees in all activities
  filter(SUBJECT %in% c("YA9903L1_ST", "YS99TTL2_ST"),
         SEX == "TT") |>
  select(LOCATION, SUBJECT, TIME_PERIOD, obsValue) |>
  spread(SUBJECT, obsValue) %>%
  mutate(share = (100*YA9903L1_ST/YS99TTL2_ST) |> round(digits = 1)) |>
  left_join(ALFS_EMP_var$LOCATION, by = "LOCATION") |>
  filter(!is.na(share)) |>
  mutate(share = paste0(share, " %")) |>
  group_by(Location) |>
  arrange(TIME_PERIOD) |>
  summarise(`Year 1` = first(TIME_PERIOD),
            `Year 2` = last(TIME_PERIOD),
            `Share 1` = first(share),
            `Share 2` = last(share)) |>
  mutate(Flag = gsub(" ", "-", str_to_lower(gsub(" ", "-", Location))),
         Flag = paste0('<img src="../../icon/flag/vsmall/', Flag, '.png" alt="Flag">')) |>
  select(Flag, everything()) %>%
{if (is_html_output()) datatable(., filter = 'top', rownames = F, escape = F) else .}ALFS_EMP |>
# YW992IL1_ST: Employees in Industry (ISIC rev.2, 2-5)
# YS99TTL2_ST: Employees in all activities
filter(SUBJECT %in% c("YW992IL1_ST", "YS99TTL2_ST"),
SEX == "TT") |>
select(LOCATION, SUBJECT, TIME_PERIOD, obsValue) |>
spread(SUBJECT, obsValue) %>%
mutate(share = (100*YW992IL1_ST/YS99TTL2_ST) |> round(digits = 1)) |>
left_join(ALFS_EMP_var$LOCATION, by = "LOCATION") |>
filter(!is.na(share)) |>
mutate(share = paste0(share, " %")) |>
group_by(Location) |>
summarise(`Year 1` = first(TIME_PERIOD),
`Year 2` = last(TIME_PERIOD),
`Share 1` = first(share),
`Share 2` = last(share)) |>
mutate(Flag = gsub(" ", "-", str_to_lower(gsub(" ", "-", Location))),
Flag = paste0('<img src="../../icon/flag/vsmall/', Flag, '.png" alt="Flag">')) |>
select(Flag, everything()) %>%
{if (is_html_output()) datatable(., filter = 'top', rownames = F, escape = F) else .}| source | dataset | Title | Updated |
|---|---|---|---|
| source | dataset | Title | Updated |
|---|---|---|---|




