Quarterly National Accounts
Data - OECD
Info
Last observation: Quarterly: 2026-Q4 (N = 1) · Annual: 2025 (N = 20,841)
First observation: Quarterly: NA (N = 10) · Annual: NA (N = 45)
Last update of .RData: 24 jul 2026, 00:13. Last compile: 24 jul 2026, 04:17
Structure
Data
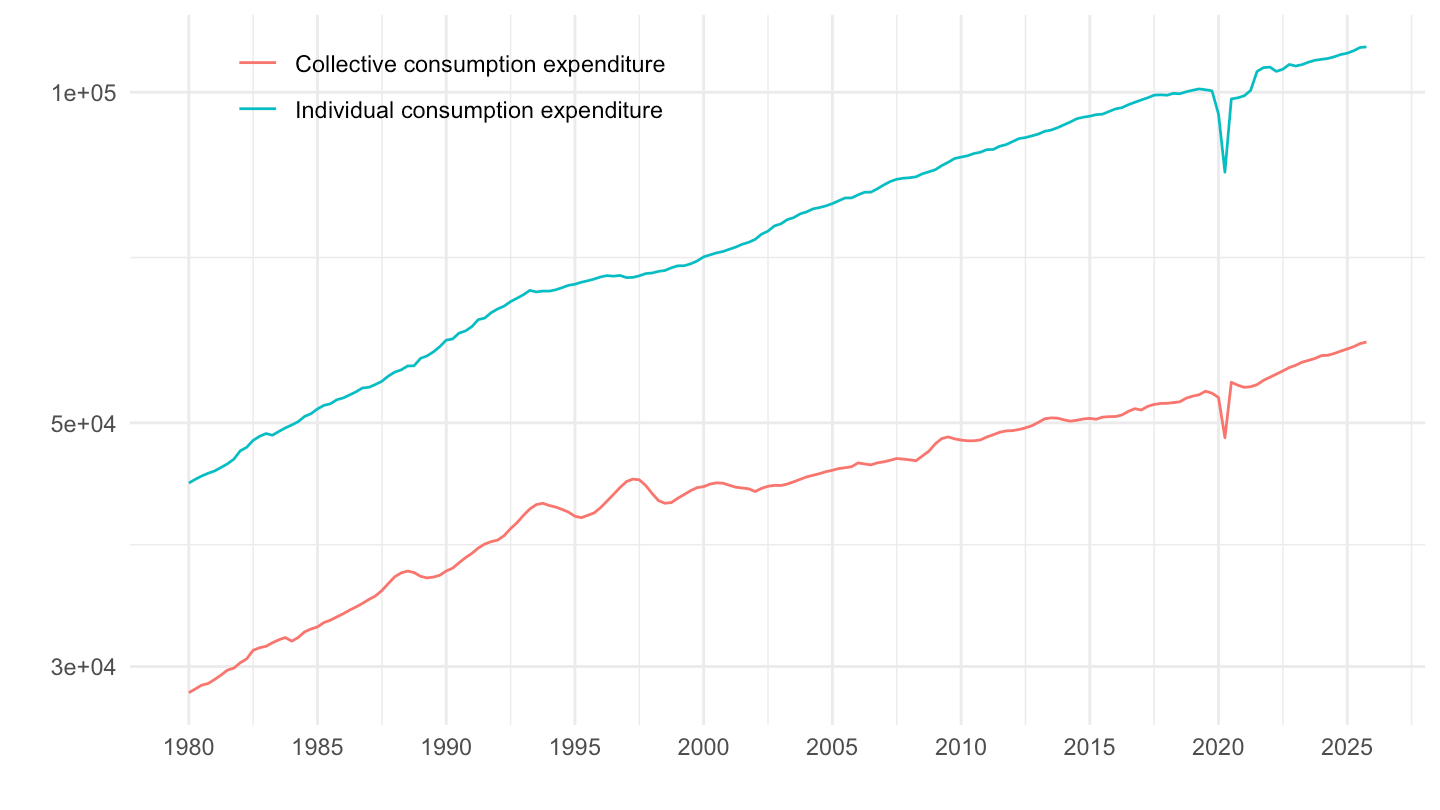
Consumption
Code
QNA |>
  filter(TRANSACTION %in% c("P31", "P32"),
         # Chain linked volume
         PRICE_BASE == "L",
         ADJUSTMENT == "Y",
         FREQ == "Q",
         REF_AREA == "FRA") |>
  select_if(~ n_distinct(.) > 1) |>
  arrange(obsTime) |>
  quarter_to_date() |>
  ggplot() + geom_line(aes(x = date, y = obsValue, color = Transaction)) +
  xlab("") + ylab("") + theme_minimal() +
  scale_x_date(breaks = seq(1920, 2100, 5) %>% paste0("-01-01") %>% as.Date,
               labels = date_format("%Y")) +
  theme(legend.position = c(0.25, 0.9),
        legend.title = element_blank()) +
  scale_y_log10()