High-tech trade by high-tech group of products in million euro (from 2007, SITC Rev. 4)

Data - Eurostat

Info

LAST_DOWNLOAD

Code
tibble(source = c("eurostat", "oecd", "oecd"),
       dataset = c("htec_trd_group4", "GBARD_NABS2007", "BERD_MA_SOF")) %>%
  mutate(Title = read_lines(paste0("~/iCloud/website/data/", source, "/",dataset, ".qmd"), skip = 1, n_max = 1) %>% gsub("title: ", "", .) %>% gsub("\"", "", .)) %>%
  mutate(Download = as.Date(file.info(paste0("~/iCloud/website/data/", source, "/", dataset, ".RData"))$mtime),
         Compile = as.Date(file.info(paste0("~/iCloud/website/data/", source, "/", dataset, ".html"))$mtime)) %>%
  mutate(Compile = paste0("[", Compile, "](https://fgeerolf.com/data/", source, "/", dataset, '.html)')) %>%
  print_table_conditional()
source dataset Title Download Compile
eurostat htec_trd_group4 High-tech trade by high-tech group of products in million euro (from 2007, SITC Rev. 4) 2024-10-08 [2025-01-05]
oecd GBARD_NABS2007 Government budget allocations for R and D 2023-11-22 [2024-04-16]
oecd BERD_MA_SOF Business enterprise R&D expenditure by main activity (focussed) and source of funds 2023-09-09 [2024-04-16]

LAST_COMPILE

LAST_COMPILE
2025-01-07

Last

Code
htec_trd_group4 %>%
  group_by(time) %>%
  summarise(Nobs = n()) %>%
  arrange(desc(time)) %>%
  head(1) %>%
  print_table_conditional()
time Nobs
2022 1846

stk_flow

Code
htec_trd_group4 %>%
  left_join(stk_flow, by = "stk_flow") %>%
  group_by(stk_flow, Stk_flow) %>%
  summarise(Nobs = n()) %>%
  arrange(-Nobs) %>%
  print_table_conditional
stk_flow Stk_flow Nobs
IMP Imports 14796
EXP Exports 14749

sitc06

Code
htec_trd_group4 %>%
  left_join(sitc06, by = "sitc06") %>%
  group_by(sitc06, Sitc06) %>%
  summarise(Nobs = n()) %>%
  arrange(-Nobs) %>%
  mutate(Sector = gsub(" ", "-", str_to_lower(Sitc06)),
         Sector = paste0('<img src="../../icon/sector/vsmall/', Sector, '.png" alt="Sector">')) %>%
  select(Sector, everything()) %>%
  {if (is_html_output()) datatable(., filter = 'top', rownames = F, escape = F) else .}

partner

Code
htec_trd_group4 %>%
  left_join(partner, by = "partner") %>%
  group_by(partner, Partner) %>%
  summarise(Nobs = n()) %>%
  arrange(-Nobs) %>%
  print_table_conditional
partner Partner Nobs
WORLD All countries of the world 9858
EXT_EU27_2020 Extra-EU27 (from 2020) 9853
INT_EU27_2020 Intra-EU27 (from 2020) 9834

geo

Code
htec_trd_group4 %>%
  left_join(geo, by = "geo") %>%
  group_by(geo, Geo) %>%
  summarise(Nobs = n()) %>%
  arrange(-Nobs) %>%
  mutate(Geo = ifelse(geo == "DE", "Germany", Geo)) %>%
  mutate(Flag = gsub(" ", "-", str_to_lower(Geo)),
         Flag = paste0('<img src="../../icon/flags/vsmall/', Flag, '.png" alt="Flag">')) %>%
  select(Flag, everything()) %>%
  {if (is_html_output()) datatable(., filter = 'top', rownames = F, escape = F) else .}

time

Code
htec_trd_group4 %>%
  group_by(time) %>%
  summarise(Nobs = n()) %>%
  arrange(desc(time)) %>%
  print_table_conditional()
time Nobs
2022 1846
2021 1853
2020 1858
2019 1859
2018 1859
2017 1856
2016 1858
2015 1854
2014 1839
2013 1839
2012 1841
2011 1836
2010 1839
2009 1839
2008 1833
2007 1836

France, Germany, Italy

Exports - EXP

Code
htec_trd_group4 %>%
  filter(partner == "WORLD",
         time == "2018",
         stk_flow == "EXP",
         geo %in% c("DE", "FR", "IT", "UK")) %>%
  left_join(geo, by = "geo") %>%
  left_join(sitc06, by = "sitc06") %>%
  select(sitc06, Sitc06, Geo, values) %>%
  spread(Geo, values) %>%
  mutate(Sector = gsub(" ", "-", str_to_lower(Sitc06)),
         Sector = paste0('<img src="../../icon/sector/vsmall/', Sector, '.png" alt="Sector">')) %>%
  select(Sector, everything()) %>%
  {if (is_html_output()) datatable(., filter = 'top', rownames = F, escape = F) else .}

Imports - IMP

Code
htec_trd_group4 %>%
  filter(partner == "WORLD",
         time == "2018",
         stk_flow == "IMP",
         geo %in% c("DE", "FR", "IT", "UK")) %>%
  left_join(geo, by = "geo") %>%
  left_join(sitc06, by = "sitc06") %>%
  select(sitc06, Sitc06, Geo, values) %>%
  spread(Geo, values) %>%
  mutate(Sector = gsub(" ", "-", str_to_lower(Sitc06)),
         Sector = paste0('<img src="../../icon/sector/vsmall/', Sector, '.png" alt="Sector">')) %>%
  select(Sector, everything()) %>%
  {if (is_html_output()) datatable(., filter = 'top', rownames = F, escape = F) else .}

Balance - EXP-IMP

Code
htec_trd_group4 %>%
  filter(partner == "WORLD",
         time == "2018",
         geo %in% c("DE", "FR", "IT", "UK", "EU27_2020")) %>%
  left_join(geo, by = "geo") %>%
  left_join(sitc06, by = "sitc06") %>%
  select(sitc06, Sitc06, stk_flow, Geo, values) %>%
  spread(stk_flow, values) %>%
  mutate(values = EXP-IMP) %>%
  select(-EXP, -IMP) %>%
  spread(Geo, values) %>%
  mutate(Sector = gsub(" ", "-", str_to_lower(Sitc06)),
         Sector = paste0('<img src="../../icon/sector/vsmall/', Sector, '.png" alt="Sector">')) %>%
  select(Sector, everything()) %>%
  {if (is_html_output()) datatable(., filter = 'top', rownames = F, escape = F) else .}

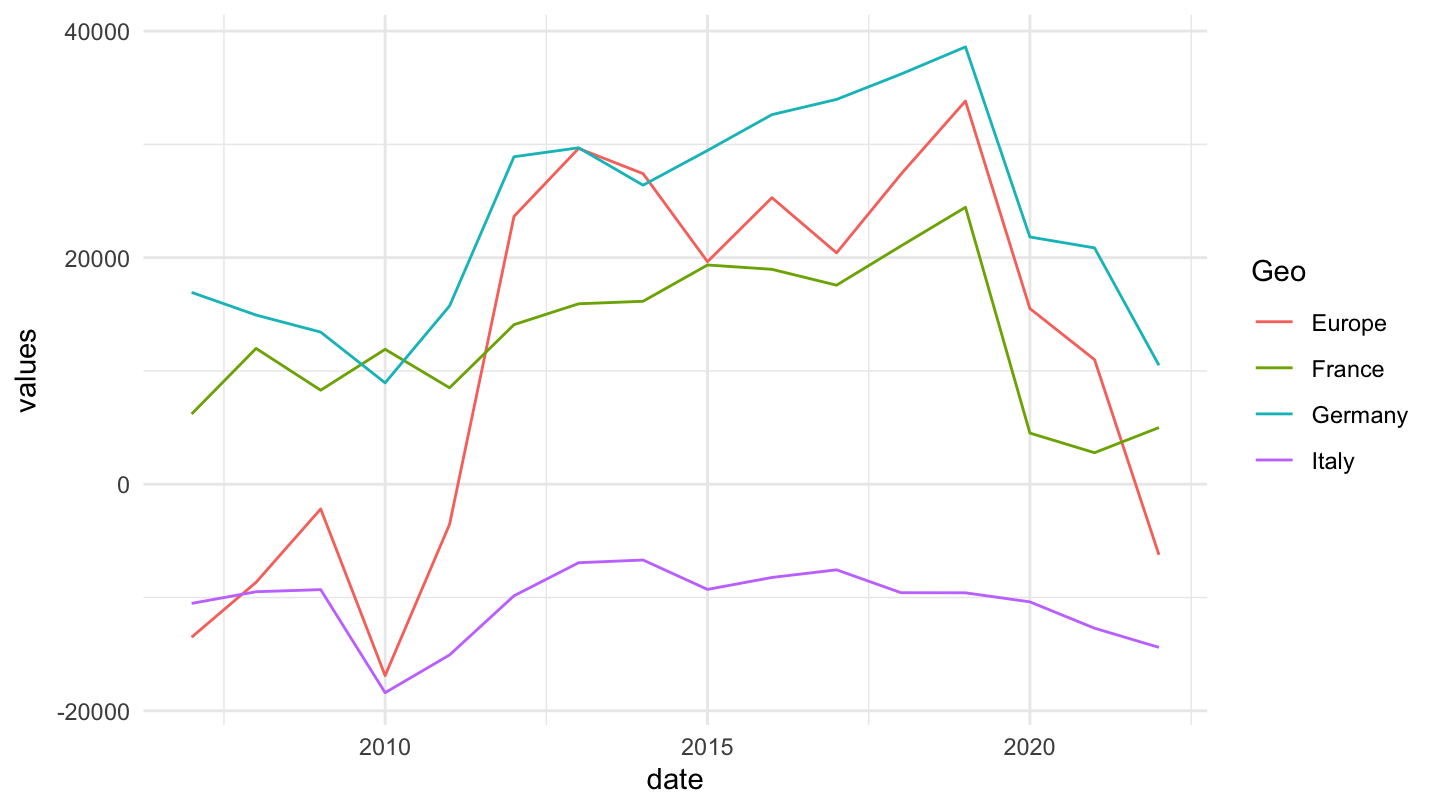
Exports high tech products

Values

Code
htec_trd_group4 %>%
  filter(partner == "WORLD",
         geo %in% c("DE", "IT", "FR", "EU27_2020"),
         sitc06 == "TOT_HT") %>%
  year_to_date %>%
  left_join(geo, by = "geo") %>%
  select_if(~ n_distinct(.) > 1) %>%
  mutate(Geo = ifelse(geo == "EU27_2020", "Europe", Geo)) %>%
  select(date, stk_flow, Geo, values) %>%
  spread(stk_flow, values) %>%
  mutate(values = EXP-IMP) %>%
  ggplot + geom_line(aes(x = date, y = values, color = Geo)) + 
  theme_minimal()

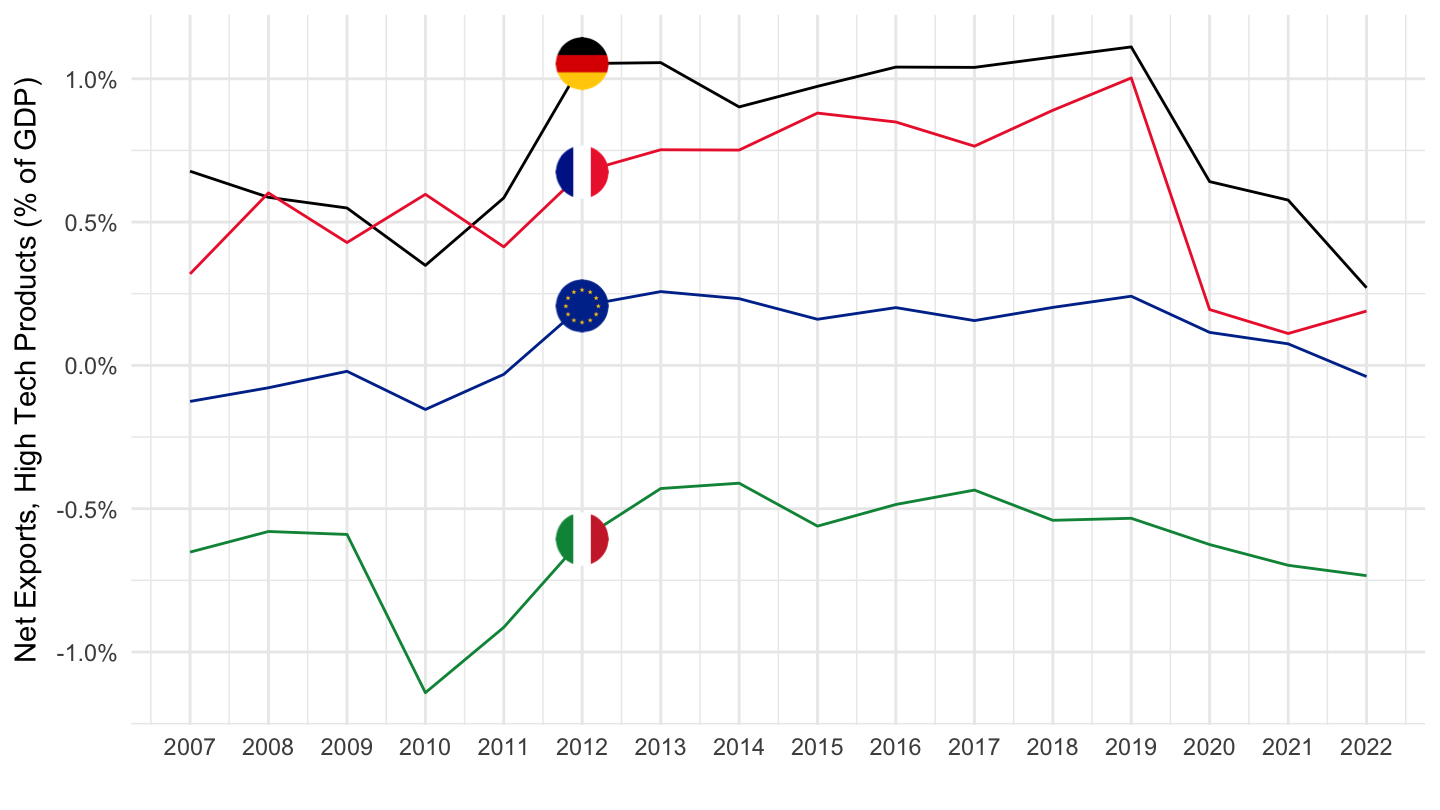
% of GDP

Code
htec_trd_group4 %>%
  filter(partner == "WORLD",
         geo %in% c("DE", "IT", "FR", "EU27_2020"),
         sitc06 == "TOT_HT") %>%
  left_join(gdp, by = c("geo", "time")) %>%
  mutate(values = values/gdp) %>%
  year_to_date %>%
  left_join(geo, by = "geo") %>%
  select_if(~ n_distinct(.) > 1) %>%
  mutate(Geo = ifelse(geo == "EU27_2020", "Europe", Geo)) %>%
  select(date, stk_flow, Geo, values) %>%
  spread(stk_flow, values) %>%
  mutate(values = EXP-IMP) %>%
  left_join(colors, by = c("Geo" = "country")) %>%
  ggplot(.) + geom_line(aes(x = date, y = values, color = color)) + 
  theme_minimal() + xlab("") + ylab("Net Exports, High Tech Products (% of GDP)") +
  scale_color_identity() +
  scale_x_date(breaks = seq(1960, 2100, 1) %>% paste0("-01-01") %>% as.Date,
               labels = date_format("%Y")) + add_4flags +
  theme(legend.position = "none") +
  scale_y_continuous(breaks = 0.01*seq(-500, 200, 0.5),
                     labels = percent_format(accuracy = .1))