Industry (sector data)
Data - ec
Info
Data on industry
| source | dataset | Title | .html | .rData |
|---|---|---|---|---|
| ec | INDUSTRY | Industry (sector data) | 2026-07-23 | 2026-07-22 |
| eurostat | ei_isin_m | Industry - monthly data - index (2015 = 100) (NACE Rev. 2) - ei_isin_m | 2026-07-22 | 2026-07-23 |
| eurostat | htec_trd_group4 | High-tech trade by high-tech group of products in million euro (from 2007, SITC Rev. 4) | 2026-07-22 | 2026-07-23 |
| eurostat | nama_10_a64 | National accounts aggregates by industry (up to NACE A*64) | 2026-07-17 | 2026-07-23 |
| eurostat | nama_10_a64_e | National accounts employment data by industry (up to NACE A*64) | 2026-07-23 | 2026-07-23 |
| eurostat | namq_10_a10_e | Employment A*10 industry breakdowns | 2026-07-23 | 2026-07-23 |
| eurostat | road_eqr_carmot | New registrations of passenger cars by type of motor energy and engine size - road_eqr_carmot | 2026-07-23 | 2026-07-23 |
| eurostat | sts_inpp_m | Producer prices in industry, total - monthly data | 2026-07-21 | 2026-07-23 |
| eurostat | sts_inppd_m | Producer prices in industry, domestic market - monthly data | 2026-07-21 | 2026-07-23 |
| eurostat | sts_inpr_m | Production in industry - monthly data | 2026-07-21 | 2026-07-23 |
| eurostat | sts_intvnd_m | Turnover in industry, non domestic market - monthly data - sts_intvnd_m | 2026-07-23 | 2026-07-23 |
| fred | industry | Manufacturing, Industry | 2026-07-22 | 2026-07-22 |
| oecd | ALFS_EMP | Employment by activities and status (ALFS) | 2024-04-16 | 2025-05-24 |
| oecd | BERD_MA_SOF | Business enterprise R&D expenditure by main activity (focussed) and source of funds | 2024-04-16 | 2023-09-09 |
| oecd | GBARD_NABS2007 | Government budget allocations for R and D | 2024-04-16 | 2023-11-22 |
| oecd | MEI_REAL | Production and Sales (MEI) | 2024-05-12 | 2025-05-24 |
| oecd | MSTI_PUB | Main Science and Technology Indicators | 2024-09-15 | 2025-05-24 |
| oecd | SNA_TABLE4 | PPPs and exchange rates | 2024-09-15 | 2025-05-24 |
| wdi | NV.IND.EMPL.KD | Industry, value added per worker (constant 2010 USD) | 2024-01-06 | 2026-07-22 |
| wdi | NV.IND.MANF.CD | Manufacturing, value added (current USD) | 2026-07-22 | 2026-07-22 |
| wdi | NV.IND.MANF.ZS | Manufacturing, value added (% of GDP) | 2025-05-24 | 2026-07-22 |
| wdi | NV.IND.TOTL.KD | Industry (including construction), value added (constant 2015 USD) - NV.IND.TOTL.KD | 2024-01-06 | 2026-07-22 |
| wdi | NV.IND.TOTL.ZS | Industry, value added (including construction) (% of GDP) | 2025-05-24 | 2026-07-22 |
| wdi | SL.IND.EMPL.ZS | Employment in industry (% of total employment) | 2026-07-22 | 2026-07-22 |
| wdi | TX.VAL.MRCH.CD.WT | Merchandise exports (current USD) | 2024-01-06 | 2026-07-22 |
Données sur l’industrie
| source | dataset | Title | .html | .rData |
|---|---|---|---|---|
| eurostat | mar_mg_am_cvh | Country level - volume (in TEUs) of containers handled in main ports, by loading status - mar_mg_am_cvh | 2026-07-23 | 2026-07-23 |
| eurostat | namq_10_a10 | Gross value added and income A*10 industry breakdowns | 2026-07-23 | 2026-07-23 |
| insee | CNA-2014-EMPLOI | Emploi intérieur, durée effective travaillée et productivité horaire | 2026-07-23 | 2026-07-22 |
| insee | CNT-2014-CB | Comptes des branches | 2026-07-23 | 2026-07-23 |
| insee | CNT-2014-OPERATIONS | Opérations sur biens et services | 2026-07-23 | 2026-07-23 |
| insee | ENQ-CONJ-ACT-IND | Conjoncture dans l’industrie | 2026-07-23 | 2026-07-23 |
| insee | ICA-2015-IND-CONS | Indices de chiffre d'affaires dans l'industrie et la construction | 2026-07-23 | 2026-07-23 |
| insee | IPI-2021 | Indice de la production industrielle | 2026-07-23 | 2026-07-23 |
| insee | IPPI-2015 | Indices de prix de production et d'importation dans l'industrie | 2026-07-23 | 2026-07-23 |
| insee | TCRED-EMPLOI-SALARIE-TRIM | Estimations d'emploi salarié par secteur d'activité et par département | 2026-07-23 | 2026-07-23 |
| insee | t_5407 | 5.407 – Solde extérieur de biens et de services par produit à prix courants (En milliards d'euros) - t_5407 | 2026-07-23 | 2021-08-01 |
| oecd | ALFS_EMP | Employment by activities and status (ALFS) | 2024-04-16 | 2025-05-24 |
| oecd | SNA_TABLE3 | Population and employment by main activity | 2024-09-15 | 2025-05-24 |
LAST_COMPILE
| LAST_COMPILE |
|---|
| 2026-07-24 |
Last
Code
INDUSTRY %>%
  group_by(period) %>%
  summarise(Nobs = n()) %>%
  arrange(desc(period)) %>%
  head(2) %>%
print_table_conditional()| period | Nobs |
|---|---|
| 2023-05-31 | 528 |
| 2023-04-30 | 528 |
sector
Code
INDUSTRY %>%
  group_by(sector, Sector) %>%
  summarise(Nobs = n()) %>%
print_table_conditional| sector | Sector | Nobs |
|---|---|---|
| TOT | TOTAL Manufacturing | 300243 |
question
Code
INDUSTRY %>%
  group_by(question, Question) %>%
  summarise(Nobs = n()) %>%
print_table_conditional| question | Question | Nobs |
|---|---|---|
| 1 | Production trend observed in recent months | 25246 |
| 10 | Duration of production assured by current order-book levels | 7403 |
| 11 | New orders in recent months | 7417 |
| 12 | Export expectations for the months ahead | 7672 |
| 13 | Current level of capacity utilization | 8100 |
| 14 | Competitive position domestic market | 6292 |
| 15 | Competitive position inside EU | 6132 |
| 16 | Competitive position outside EU | 6098 |
| 2 | Assessment of order-book levels | 25234 |
| 3 | Assessment of export order-book levels | 24828 |
| 4 | Assessment of stocks of finished products | 25078 |
| 5 | Production expectations for the months ahead | 25414 |
| 6 | Selling price expectations for the months ahead | 24765 |
| 7 | Employment expectations for the months ahead | 24650 |
| 8 | Factors limiting the production | 43077 |
| 9 | Assessment of current production capacity | 7939 |
| COF | Confidence Indicator (Q2 - Q4 + Q5) / 3 | 24898 |
answers
Code
INDUSTRY %>%
  group_by(answers, Answers) %>%
  summarise(Nobs = n()) %>%
print_table_conditional| answers | Answers | Nobs |
|---|---|---|
| B | Balance not seasonally adjusted (n.s.a) | 120837 |
| BS | Balance seasonally adjusted (s.a) | 120826 |
| F1 | None (% n.s.a - quarterly question 8) | 3714 |
| F1S | None (% s.a - quarterly question 8) | 3739 |
| F2 | Demand (% n.s.a - quarterly question 8) | 3738 |
| F2S | Demand (% s.a - quarterly question 8) | 3739 |
| F3 | Labour (% n.s.a - quarterly question 8) | 3736 |
| F3S | Labour (% s.a - quarterly question 8) | 3739 |
| F4 | Equipment (% n.s.a - quarterly question 8) | 3737 |
| F4S | Equipment (% s.a - quarterly question 8) | 3739 |
| F5 | Other (% n.s.a - quarterly question 8) | 3603 |
| F5S | Other (% s.a - quarterly question 8) | 3562 |
| F6 | Financial (% n.s.a - quarterly question 8) | 2938 |
| F6S | Financial (% s.a - quarterly question 8) | 3093 |
| QM | months (n.s.a - quarterly question 10) | 3701 |
| QMS | months (s.a - quarterly question 10) | 3702 |
| QP | % (n.s.a - quarterly question 13) | 4049 |
| QPS | % (s.a - quarterly question 13) | 4051 |
country
Code
INDUSTRY %>%
  group_by(country, Country) %>%
  summarise(Nobs = n()) %>%
  mutate(Flag = gsub(" ", "-", str_to_lower(gsub(" ", "-", Country))),
         Flag = paste0('<img src="../../icon/flag/vsmall/', Flag, '.png" alt="Flag">')) %>%
  select(Flag, everything()) %>%
  {if (is_html_output()) datatable(., filter = 'top', rownames = F, escape = F) else .}
freq
Code
INDUSTRY %>%
  group_by(freq, Frequency) %>%
  summarise(Nobs = n()) %>%
print_table_conditional| freq | Frequency | Nobs |
|---|---|---|
| M | Monthly | 200113 |
| Q | Quarterly | 100130 |
Germany
Competitive positions
NSA
Code
INDUSTRY %>%
  filter(country == "DE",
         question %in% c("14", "15", "16"),
         answers == "B") %>%
  ggplot + theme_minimal() + xlab("") + ylab("Balance not seasonally adjusted (s.a)") +
  geom_line(aes(x = period, y = value, color = Question)) +

  scale_x_date(breaks = as.Date(paste0(seq(1960, 2100, 5), "-01-01")),
               labels = date_format("%Y")) +
  theme(legend.position = c(0.8, 0.1),
        legend.title = element_blank()) +
  scale_y_continuous(breaks = seq(-60, 60, 2))
SA
Code
INDUSTRY %>%
  filter(country == "DE",
         question %in% c("14", "15", "16"),
         answers == "BS") %>%
  ggplot + theme_minimal() + xlab("") + ylab("Balance not seasonally adjusted (s.a)") +
  geom_line(aes(x = period, y = value, color = Question)) +

  scale_x_date(breaks = as.Date(paste0(seq(1960, 2100, 5), "-01-01")),
               labels = date_format("%Y")) +
  theme(legend.position = c(0.8, 0.1),
        legend.title = element_blank()) +
  scale_y_continuous(breaks = seq(-60, 60, 2))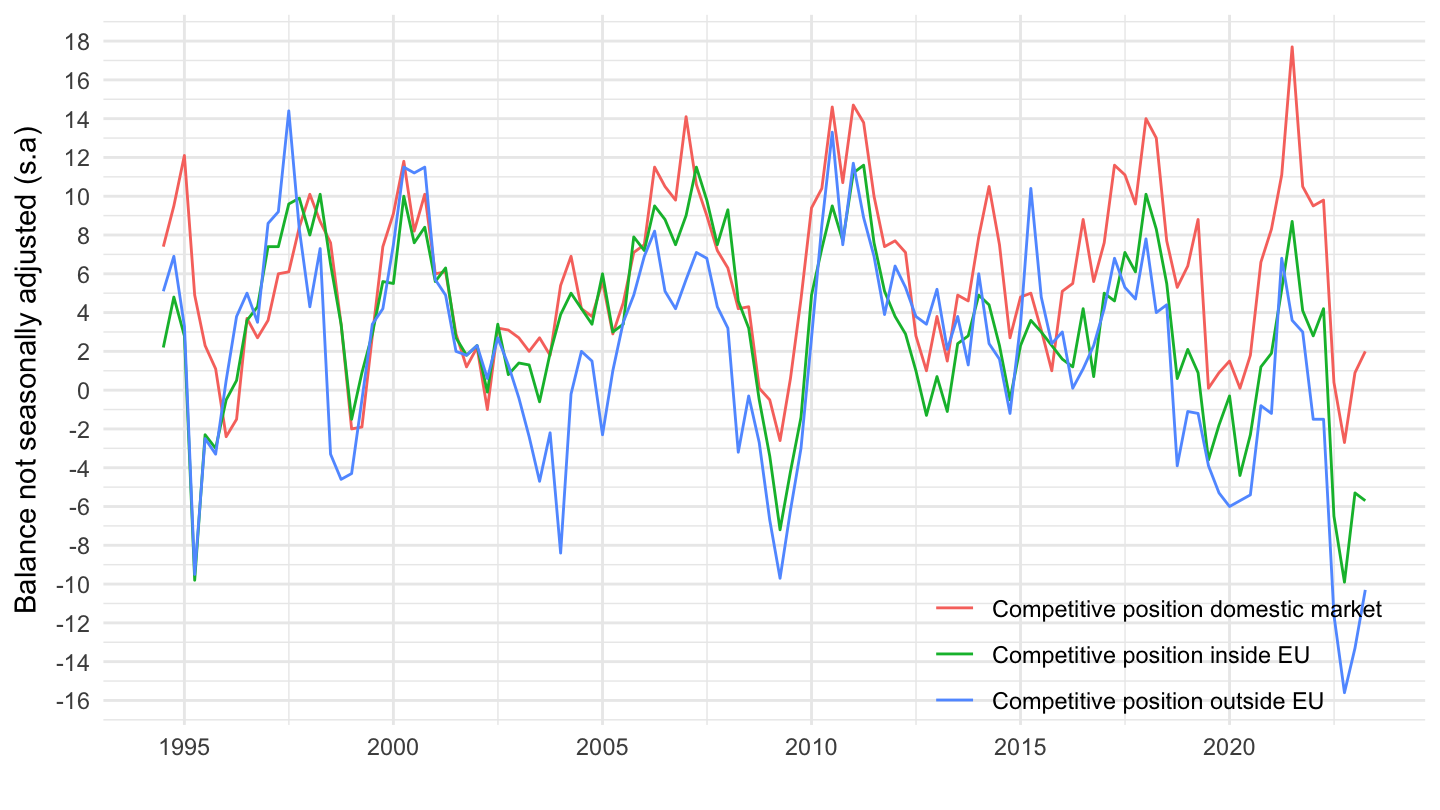
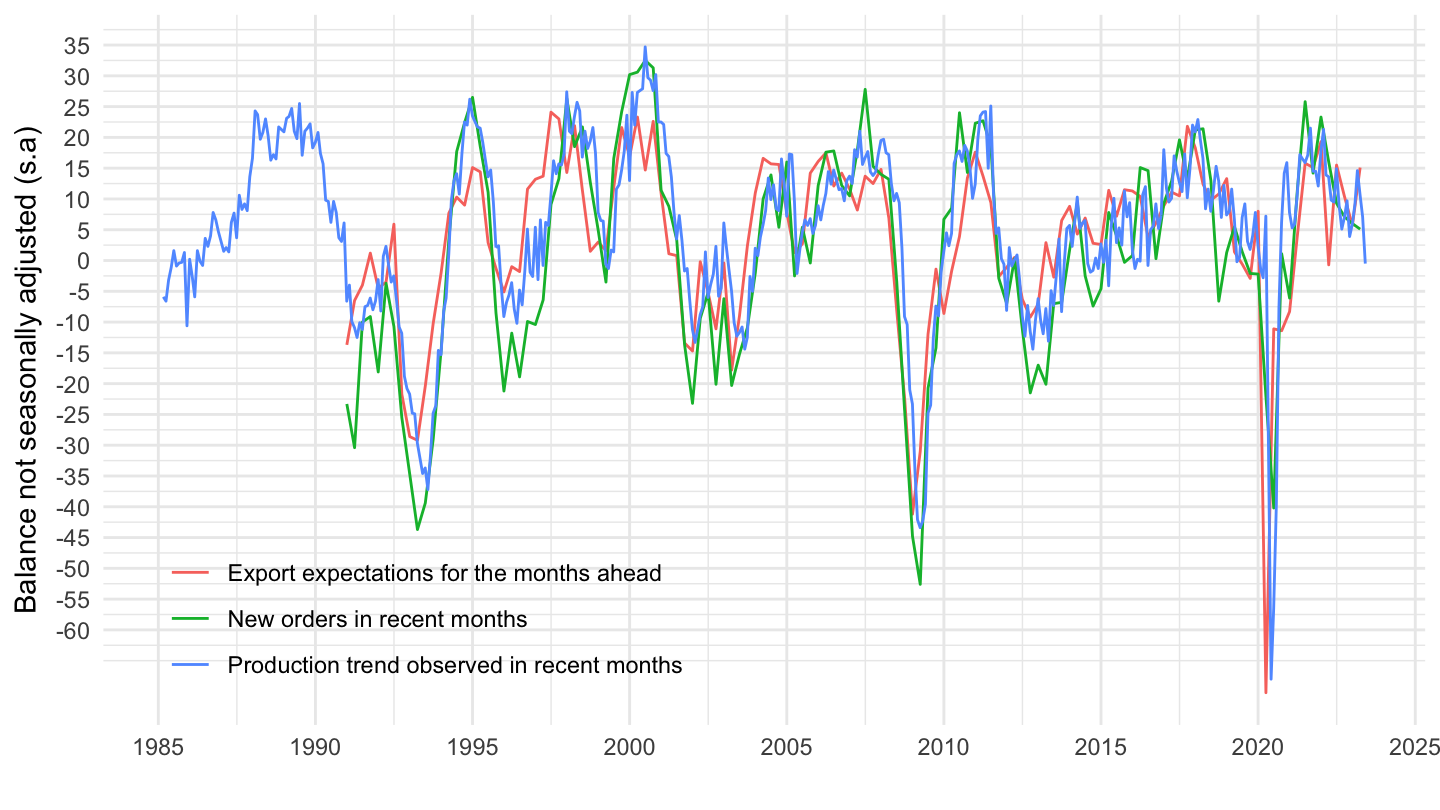
Export Expectations, New Orders, Producion Trend
Code
INDUSTRY %>%
  filter(country == "DE",
         question %in% c("12", "11", "1"),
         answers == "BS") %>%
  ggplot + theme_minimal() + xlab("") + ylab("Balance not seasonally adjusted (s.a)") +
  geom_line(aes(x = period, y = value, color = Question)) +

  scale_x_date(breaks = as.Date(paste0(seq(1960, 2100, 5), "-01-01")),
               labels = date_format("%Y")) +
  theme(legend.position = c(0.25, 0.15),
        legend.title = element_blank()) +
  scale_y_continuous(breaks = seq(-60, 60, 5))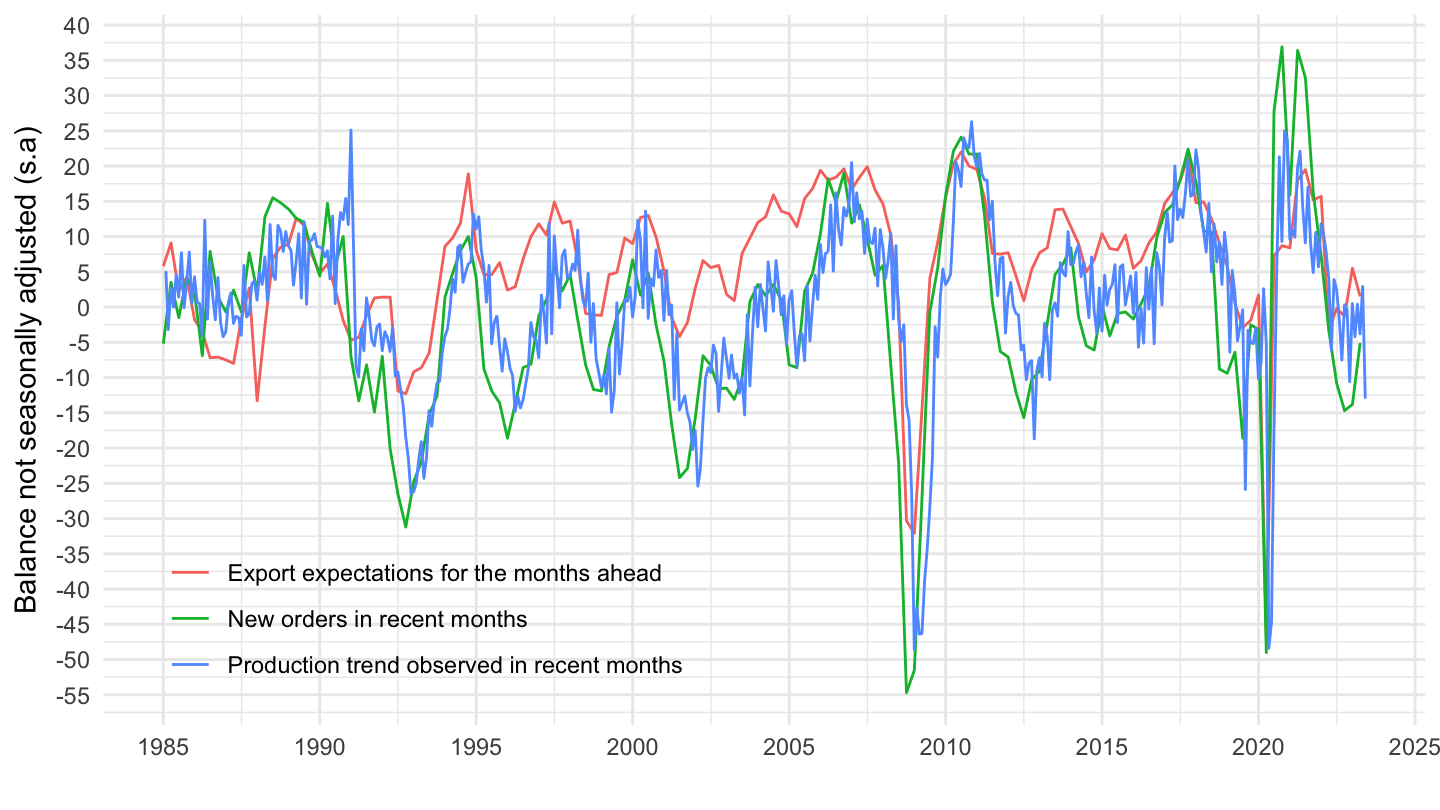
France
Competitive positions
NSA
Code
INDUSTRY %>%
  filter(country == "FR",
         question %in% c("14", "15", "16"),
         answers == "B") %>%
  ggplot + theme_minimal() + xlab("") + ylab("Balance not seasonally adjusted (s.a)") +
  geom_line(aes(x = period, y = value, color = Question)) +

  scale_x_date(breaks = as.Date(paste0(seq(1960, 2100, 5), "-01-01")),
               labels = date_format("%Y")) +
  theme(legend.position = c(0.8, 0.1),
        legend.title = element_blank()) +
  scale_y_continuous(breaks = seq(-60, 60, 2))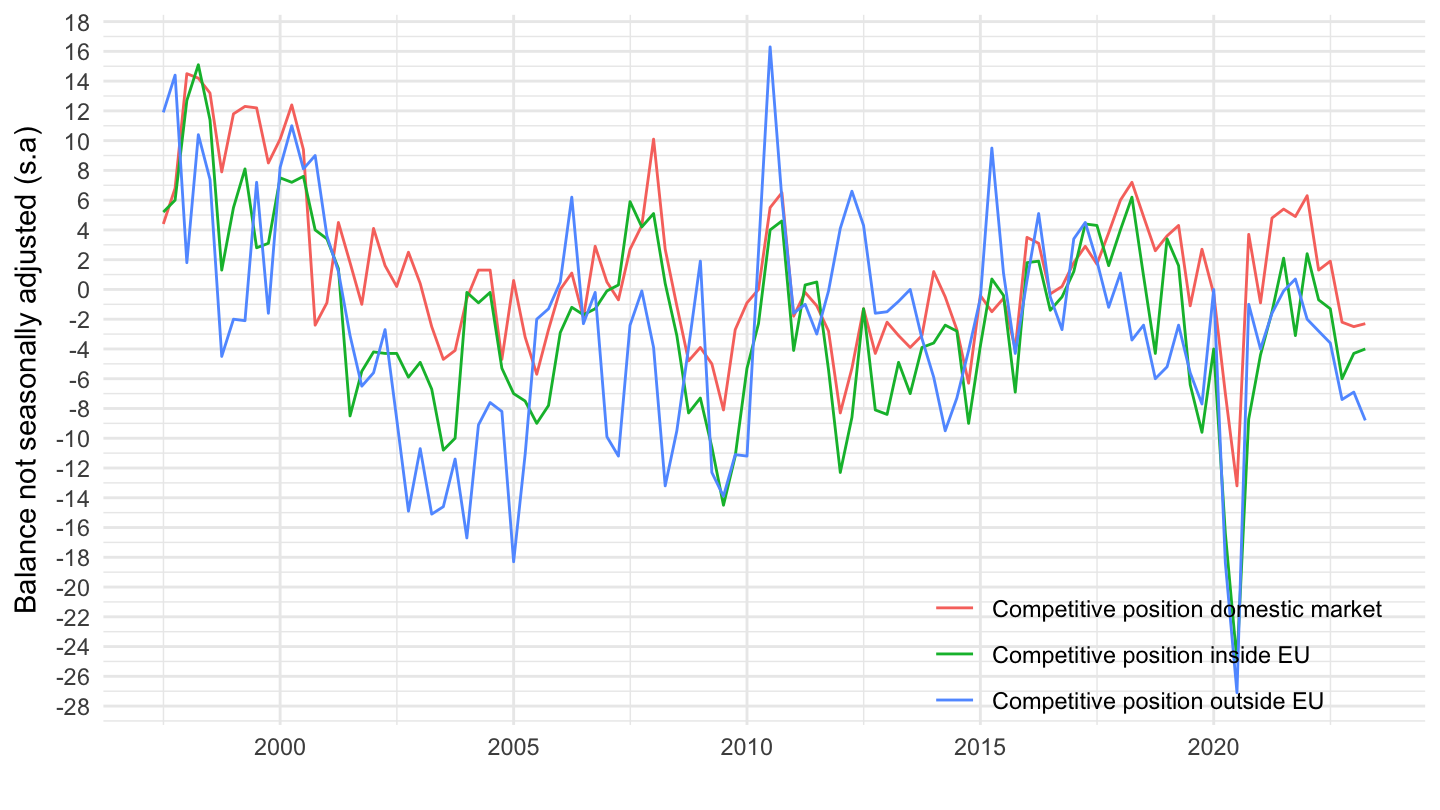
SA
Code
INDUSTRY %>%
  filter(country == "FR",
         question %in% c("14", "15", "16"),
         answers == "BS") %>%
  ggplot + theme_minimal() + xlab("") + ylab("Balance not seasonally adjusted (s.a)") +
  geom_line(aes(x = period, y = value, color = Question)) +

  scale_x_date(breaks = as.Date(paste0(seq(1960, 2100, 5), "-01-01")),
               labels = date_format("%Y")) +
  theme(legend.position = c(0.8, 0.1),
        legend.title = element_blank()) +
  scale_y_continuous(breaks = seq(-60, 60, 2))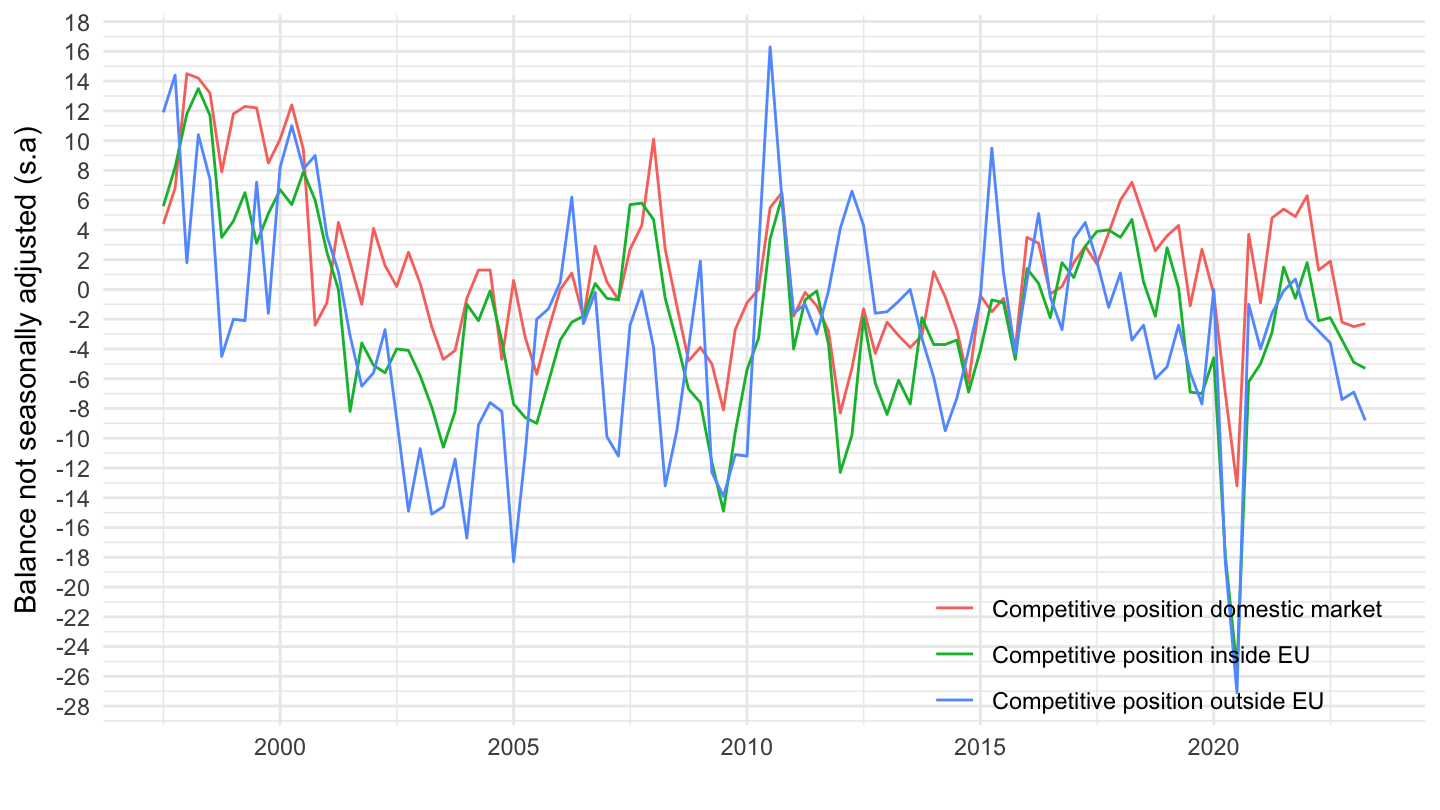
Export Expectations, New Orders, Producion Trend
Code
INDUSTRY %>%
  filter(country == "FR",
         question %in% c("12", "11", "1"),
         answers == "BS") %>%
  ggplot + theme_minimal() + xlab("") + ylab("Balance not seasonally adjusted (s.a)") +
  geom_line(aes(x = period, y = value, color = Question)) +

  scale_x_date(breaks = as.Date(paste0(seq(1960, 2100, 5), "-01-01")),
               labels = date_format("%Y")) +
  theme(legend.position = c(0.25, 0.15),
        legend.title = element_blank()) +
  scale_y_continuous(breaks = seq(-60, 60, 5))