Last observation: 2023 (N = 135)
First observation: 1981 (N = 624)
Last data update: 02 août 2026, 08:59
Last compile: 19 oct. 2026, 01:38
Data are provided in million national currency (for the euro zone, pre-EMU euro or EUR), million current PPP USD and million constant USD (2015 prices and PPPs).
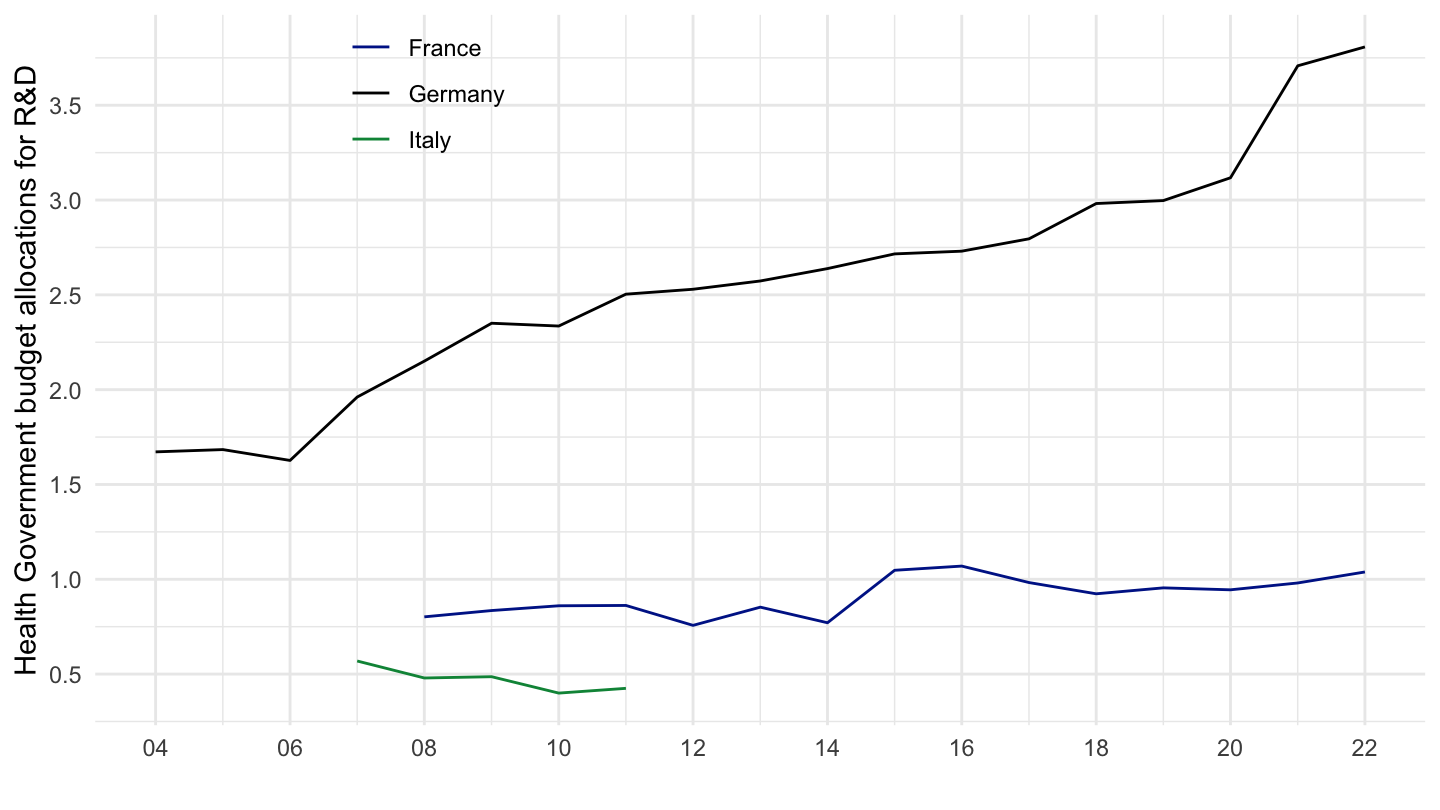
This table presents data on Government budget allocations for RD (GBARD) by socio-economic objective (SEO), using the NABS 2007 classification i.e.: Exploration and exploitation of the Earth, Environment, Exploration and exploitation of space, Transport, telecommunication and other infrastructures, Energy, Industrial production and technology, Health, Agriculture, Education, Culture, recreation, religion and mass media, Political and social systems, structures and processes, General advancement of knowledge: RD financed from General University Funds (GUF), General advancement of knowledge: RD financed from sources other than GUF, Defence. Please note that in this new NABS 2007 classification, the three socio-economic objectives – Education, Culture, recreation, religion and mass media, and Political and social systems, structures and processes – were previously grouped under a single objective: Social structures and relationships. At the time of this publication there is no breakdown of historical data into the three new SEOs. Another issue relating to the transition from NABS 1993 to NABS 2007 is that what was formerly Other civil research is now to be distributed among the other chapters. This distribution has not yet been done in this database. Therefore, until the countries are in a position to provide breakdown according to the NABS 2007 classification, in some cases GBAORD by SEO is greater than the sum of its chapters.
GBARD_NABS2007_var |>
  pluck("VAR_DESC") %>%
{if (is_html_output()) print_table(.) else .}| id | description |
|---|---|
| COUNTRY | Country |
| SEO | Socio economic objective |
| MEASURE | Measure |
| YEAR | Year |
| OBS_VALUE | Observation Value |
| TIME_FORMAT | Time Format |
| OBS_STATUS | Observation Status |
| UNIT | Unit |
| POWERCODE | Unit multiplier |
| REFERENCEPERIOD | Reference period |
GBARD_NABS2007 |>
  group_by(obsTime) |>
  summarise(Nobs = n()) |>
  arrange(desc(obsTime)) %>%
{if (is_html_output()) datatable(., filter = 'top', rownames = F) else .}GBARD_NABS2007 |>
filter(obsTime == 2018,
MEASURE == "DF6",
COUNTRY %in% c("DEU", "FRA", "GBR", "ITA")) |>
left_join(GBARD_NABS2007_var$SEO, by = "SEO") |>
left_join(GBARD_NABS2007_var$COUNTRY, by = "COUNTRY") |>
select(Country, SEO, Seo, obsValue) |>
mutate(obsValue = round(obsValue/1000, 1)) |>
spread(Country, obsValue) %>%
{if (is_html_output()) datatable(., filter = 'top', rownames = F) else .}GBARD_NABS2007 |>
filter(obsTime == 2011,
MEASURE == "DF6",
COUNTRY %in% c("DEU", "FRA", "GBR", "ITA")) |>
left_join(GBARD_NABS2007_var$SEO, by = "SEO") |>
left_join(GBARD_NABS2007_var$COUNTRY, by = "COUNTRY") |>
select(Country, SEO, Seo, obsValue) |>
mutate(obsValue = round(obsValue/1000, 1)) |>
spread(Country, obsValue) %>%
{if (is_html_output()) datatable(., filter = 'top', rownames = F) else .}GBARD_NABS2007 |>
filter(obsTime == 2015,
MEASURE == "DF6",
COUNTRY %in% c("DEU", "FRA", "GBR", "ITA")) |>
left_join(GBARD_NABS2007_var$SEO, by = "SEO") |>
left_join(GBARD_NABS2007_var$COUNTRY, by = "COUNTRY") |>
select(Country, SEO, Seo, obsValue) |>
mutate(obsValue = round(obsValue/1000, 1)) |>
spread(Country, obsValue) %>%
{if (is_html_output()) datatable(., filter = 'top', rownames = F) else .}GBARD_NABS2007 |>
filter(SEO == "_T") |>
left_join(GBARD_NABS2007_var$COUNTRY, by = "COUNTRY") |>
group_by(COUNTRY, Country, MEASURE) |>
summarise(Nobs = n()) |>
spread(MEASURE, Nobs) %>%
{if (is_html_output()) datatable(., filter = 'top', rownames = F) else .}GBARD_NABS2007 |>
filter(SEO == "_T",
MEASURE == "DF6",
COUNTRY %in% c("DEU", "FRA", "GBR", "ITA")) |>
left_join(GBARD_NABS2007_var$COUNTRY, by = "COUNTRY") |>
year_to_date() |>
mutate(obsValue = obsValue/1000,
Location = Country) |>
ggplot() + theme_minimal() + xlab("") + ylab("All Government budget allocations for R&D") +
geom_line(aes(x = date, y = obsValue, color = Country)) + add_4flags +
scale_color_manual(values = c("#002395", "#000000", "#009246", "#CF142B")) +
theme(legend.position = c(0.85, 0.9),
legend.title = element_blank()) +
scale_x_date(breaks = seq(1920, 2100, 5) |> paste0("-01-01") |> as.Date(),
labels = date_format("%Y")) +
scale_y_continuous(breaks = seq(0, 100, 2)) +
theme(legend.position = c(0.25, 0.9),
legend.title = element_blank())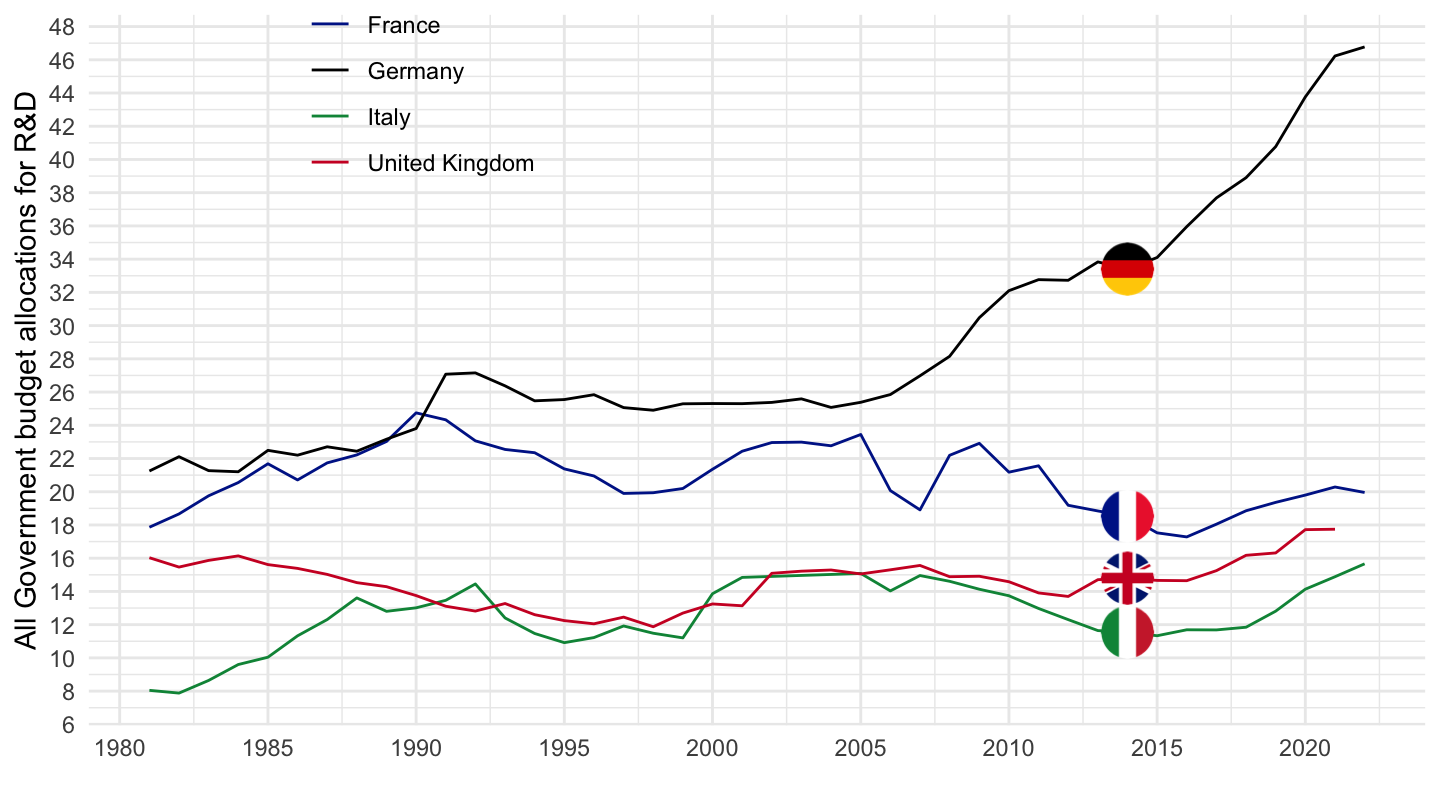
GBARD_NABS2007 |>
  filter(SEO == "_T",
         MEASURE == "DC6",
         COUNTRY %in% c("DEU", "FRA", "ITA", "GBR")) |>
  left_join(GBARD_NABS2007_var$COUNTRY, by = "COUNTRY") |>
  year_to_date() |>
  ggplot() + theme_minimal() + xlab("") + ylab("All Government budget allocations for R&D") +
  geom_line(aes(x = date, y = obsValue/1000, color = Country)) +
  scale_color_manual(values = c("#002395", "#000000", "#009246", "#CF142B")) +
  theme(legend.position = c(0.85, 0.9),
        legend.title = element_blank()) +
  scale_x_date(breaks = seq(1920, 2100, 2) |> paste0("-01-01") |> as.Date(),
               labels = date_format("%Y")) +
  scale_y_continuous(breaks = seq(0, 100, 2)) +
  theme(legend.position = c(0.25, 0.9),
        legend.title = element_blank())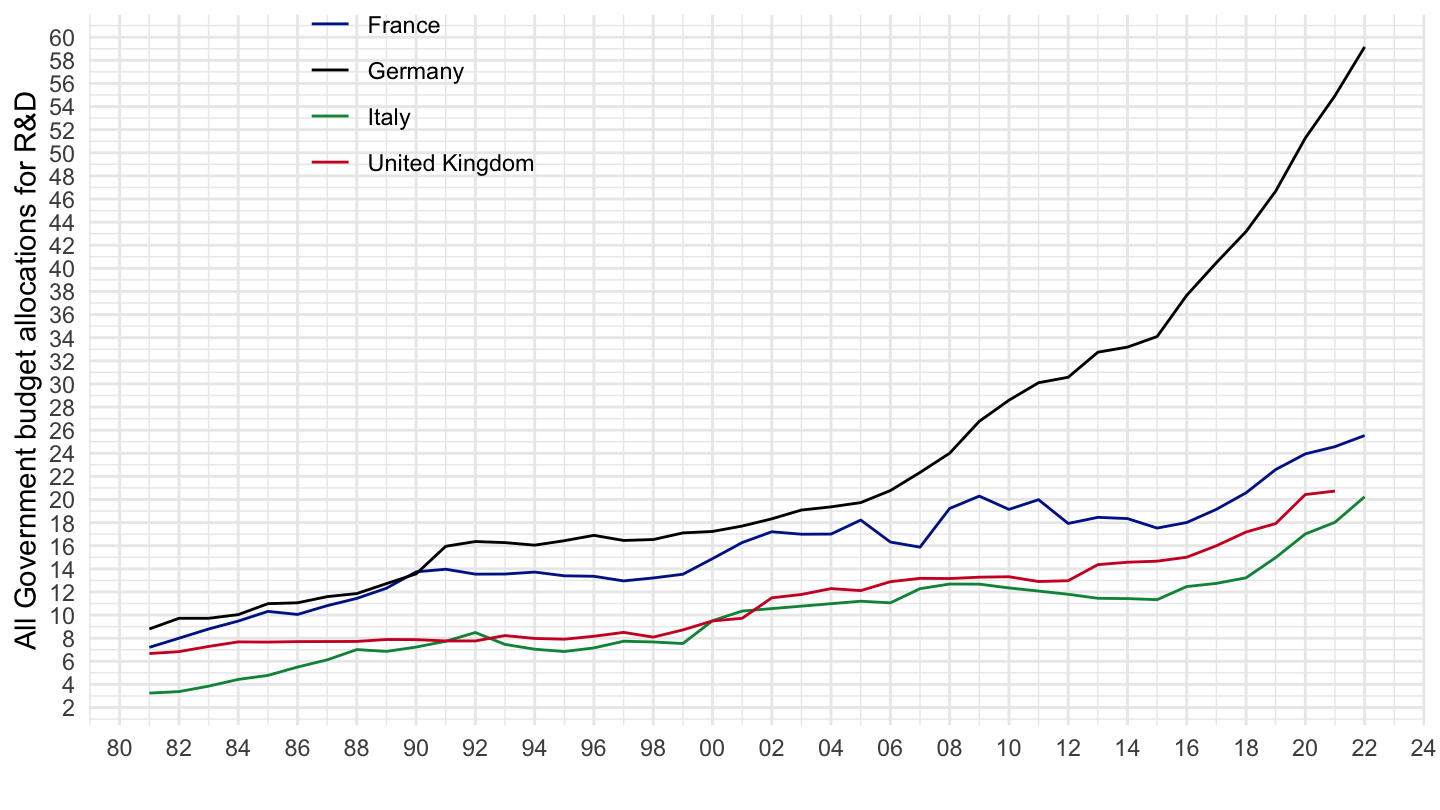
GBARD_NABS2007 |>
  filter(SEO == "_T",
         MEASURE == "MIO_NAC",
         COUNTRY %in% c("DEU", "FRA", "ITA", "GBR")) |>
  left_join(GBARD_NABS2007_var$COUNTRY, by = "COUNTRY") |>
  year_to_date() |>
  ggplot() + theme_minimal() + xlab("") + ylab("Health Government budget allocations for R&D") +
  geom_line(aes(x = date, y = obsValue/1000, color = Country)) +
  scale_color_manual(values = c("#002395", "#000000", "#009246", "#CF142B")) +
  theme(legend.position = c(0.85, 0.9),
        legend.title = element_blank()) +
  scale_x_date(breaks = seq(1920, 2100, 2) |> paste0("-01-01") |> as.Date(),
               labels = date_format("%Y")) +
  scale_y_continuous(breaks = seq(0, 100, 2)) +
  theme(legend.position = c(0.25, 0.9),
        legend.title = element_blank())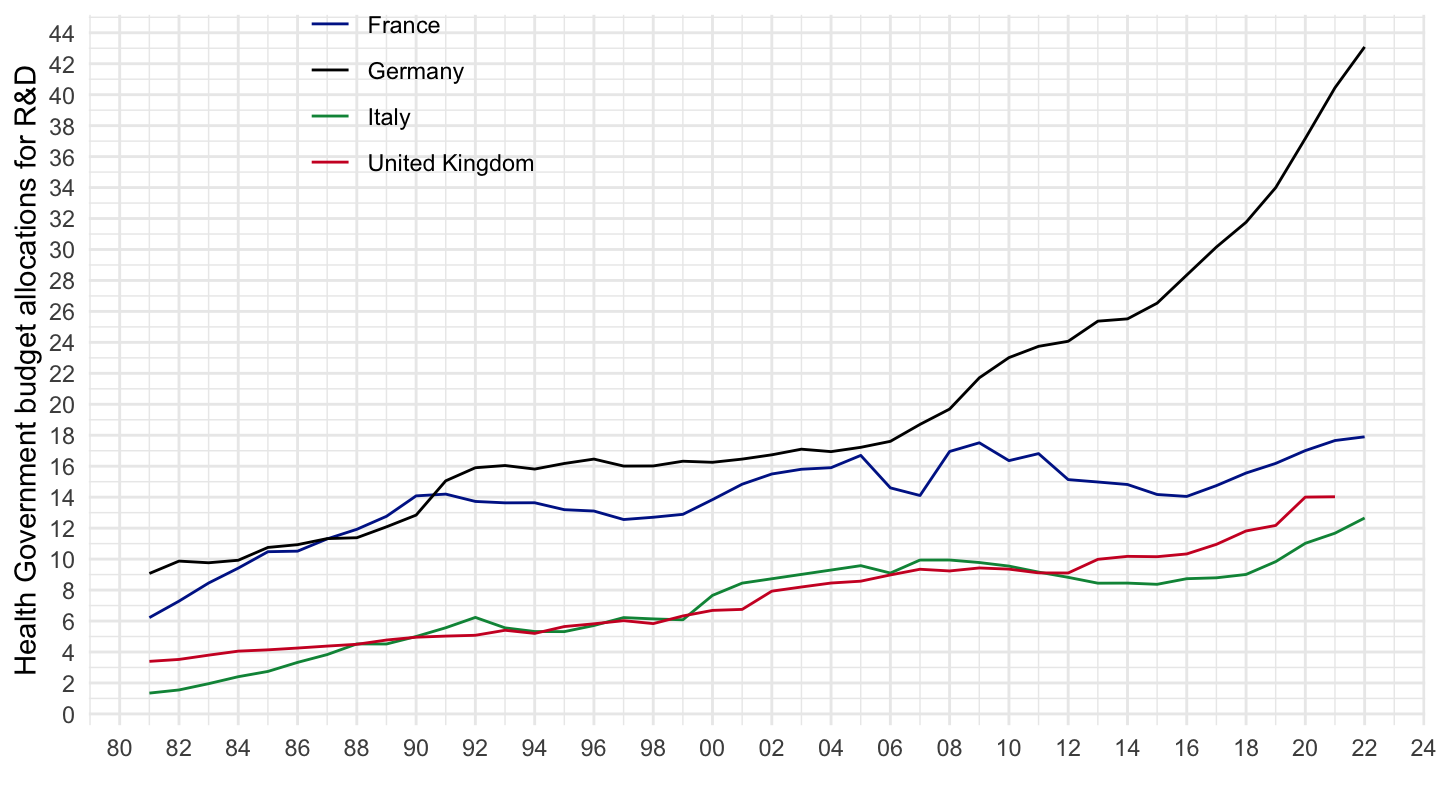
GBARD_NABS2007 |>
  filter(SEO == "NABS07") |>
  left_join(GBARD_NABS2007_var$COUNTRY, by = "COUNTRY") |>
  group_by(COUNTRY, Country, MEASURE) |>
  summarise(Nobs = n()) |>
  spread(MEASURE, Nobs) |>
  arrange(-DC6) %>%
{if (is_html_output()) datatable(., filter = 'top', rownames = F) else .}GBARD_NABS2007 |>
filter(SEO == "NABS07",
MEASURE == "DC6") |>
left_join(GBARD_NABS2007_var$COUNTRY, by = "COUNTRY") |>
group_by(COUNTRY, Country, MEASURE) |>
summarise(Nobs = n(),
first = first(obsTime),
last = last(obsTime)) |>
arrange(-Nobs) %>%
{if (is_html_output()) datatable(., filter = 'top', rownames = F) else .}GBARD_NABS2007 |>
filter(SEO == "NABS07",
MEASURE == "DF6",
obsTime %in% c("1983", "2018")) |>
left_join(SNA_TABLE3 |>
filter(TRANSACT == "POPNC",
MEASURE == "PER") |>
select(COUNTRY = LOCATION, obsTime, POPNC = obsValue),
by = c("COUNTRY", "obsTime")) |>
left_join(GBARD_NABS2007_var$COUNTRY, by = "COUNTRY") |>
mutate(obsValue = 1000*obsValue/POPNC) |>
select(COUNTRY, Country, obsTime, obsValue) |>
spread(obsTime, obsValue) |>
na.omit() |>
mutate(`Growth` = 100*(`2018` / `1983`-1)) |>
arrange(Growth) |>
mutate(Growth = paste0(round(`Growth`), "%")) %>%
mutate_at(vars(3, 4), funs(round(., 1))) |>
mutate(Flag = gsub(" ", "-", str_to_lower(Country)),
Flag = paste0('<img src="../../icon/flag/vsmall/', Flag, '.png" alt="Flag">')) |>
select(COU = Flag, everything()) %>%
{if (is_html_output()) datatable(., filter = 'top', rownames = F, escape = F, options = list(pageLength = 40)) else .}GBARD_NABS2007 |>
filter(SEO == "NABS07",
MEASURE == "DF6",
COUNTRY %in% c("DEU", "FRA", "GBR", "ITA")) |>
left_join(GBARD_NABS2007_var$COUNTRY, by = "COUNTRY") |>
year_to_date() |>
ggplot() + theme_minimal() + xlab("") + ylab("Health Government Budget Allocations for R&D (2015$ Bn)") +
geom_line(aes(x = date, y = obsValue/1000, color = Country)) +
scale_color_manual(values = c("#002395", "#000000", "#009246", "#CF142B")) +
geom_image(data = . %>%
group_by(Country) %>%
summarise(date = last(date),
obsValue = last(obsValue)) %>%
mutate(date = as.Date("2020-01-01"),
image = paste0("../../icon/flag/", str_to_lower(gsub(" ", "-", Country)), ".png")),
aes(x = date, y = obsValue/1000, image = image), asp = 1.5) +
theme(legend.position = "none") +
scale_x_date(breaks = seq(1920, 2100, 2) |> paste0("-01-01") |> as.Date(),
labels = date_format("%Y")) +
scale_y_continuous(breaks = seq(0, 5, 0.5))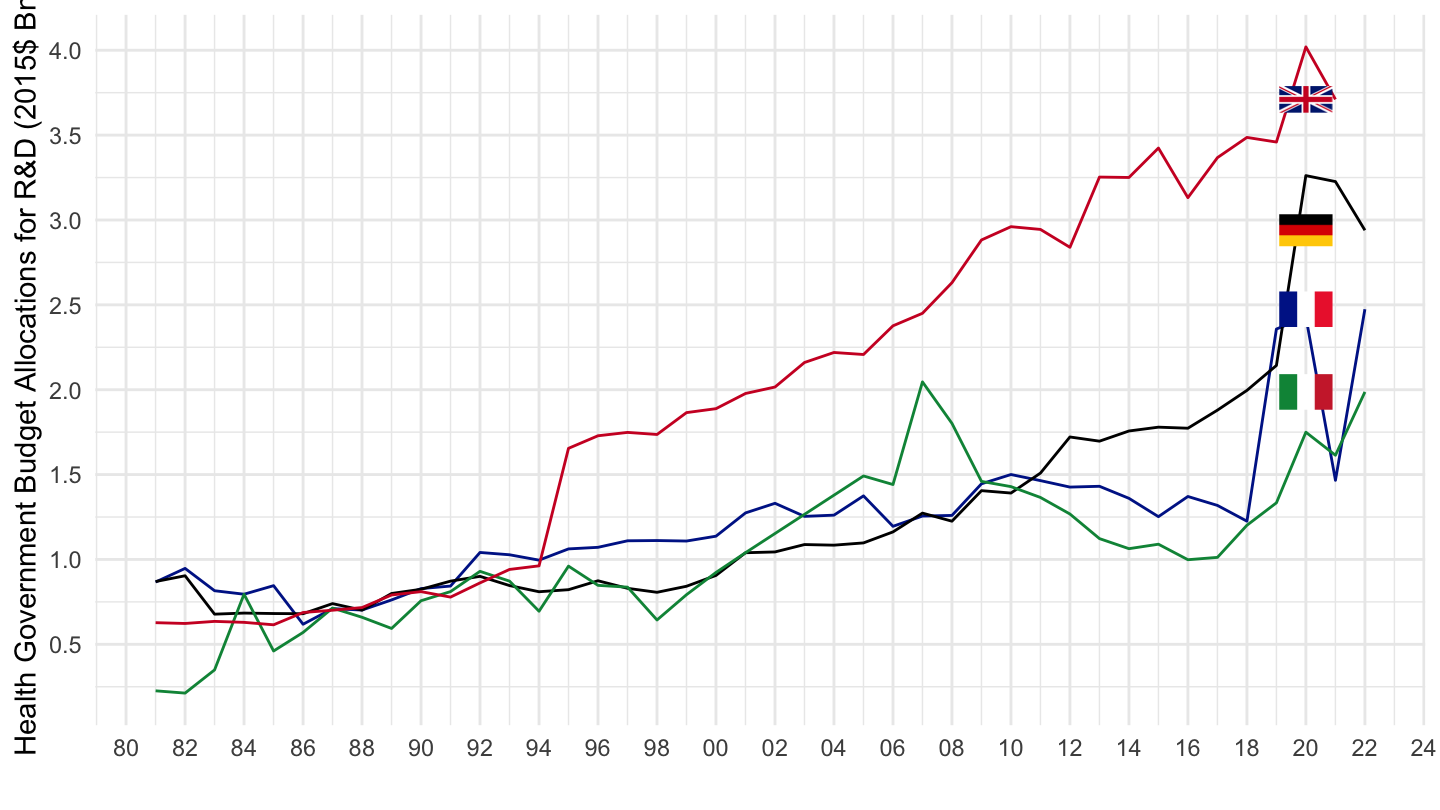
GBARD_NABS2007 |>
  filter(SEO == "NABS07",
         MEASURE == "DF6",
         COUNTRY %in% c("DEU", "FRA", "GBR", "ITA")) |>
  left_join(GBARD_NABS2007_var$COUNTRY, by = "COUNTRY") |>
  year_to_date() |>
  ggplot() + theme_minimal() + xlab("") + ylab("Santé - Crédits Budgétaires Publics de R&D ($2015, PPA)") +
  geom_line(aes(x = date, y = obsValue/1000, color = Country)) +
  scale_color_manual(values = c("#002395", "#000000", "#009246", "#CF142B")) +
  geom_image(data = . %>%
               group_by(Country) %>%
               summarise(date = last(date),
                         obsValue = last(obsValue)) %>%
               mutate(date = as.Date("2020-01-01"),
                      image = paste0("../../icon/flag/", str_to_lower(gsub(" ", "-", Country)), ".png")),
             aes(x = date, y = obsValue/1000, image = image), asp = 1.5) +
  theme(legend.position = "none") +
  scale_x_date(breaks = seq(1920, 2100, 2) |> paste0("-01-01") |> as.Date(),
               labels = date_format("%Y")) +
  scale_y_continuous(breaks = seq(0, 5, 0.5))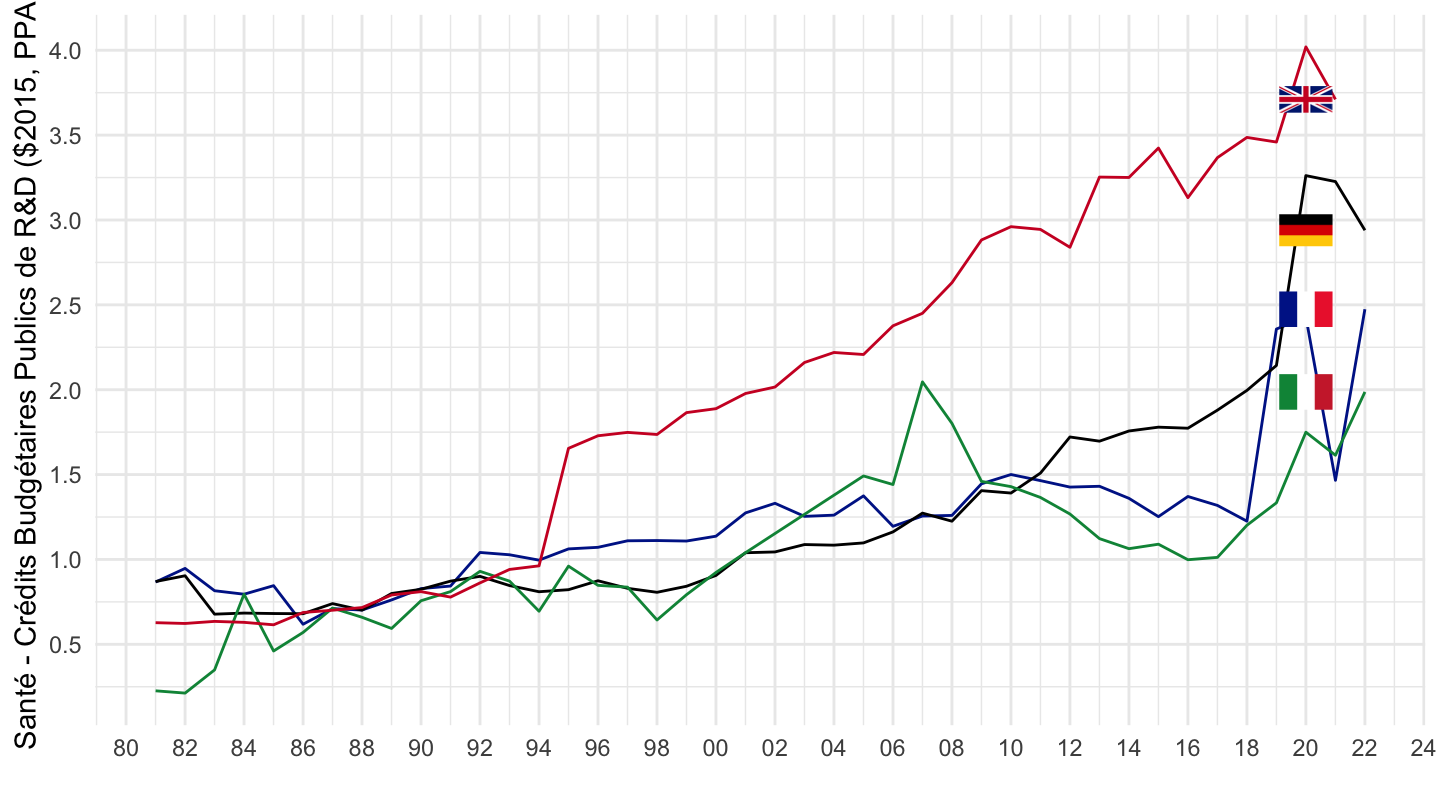
GBARD_NABS2007 |>
  filter(SEO == "NABS07",
         MEASURE == "DF6",
         COUNTRY %in% c("DEU", "FRA", "GBR", "ITA"),
         obsTime %in% c("2011", 2018)) |>
  left_join(GBARD_NABS2007_var$COUNTRY, by = "COUNTRY") |>
  select(COUNTRY, Country, obsTime, obsValue) |>
  spread(obsTime, obsValue) |>
  mutate(`Growth (%)` = (`2018`/`2011`-1)*100) %>%
  mutate_at(vars(-COUNTRY, -Country), funs(round(., 1))) %>%
{if (is_html_output()) print_table(.) else .}| COUNTRY | Country | 2011 | 2018 | Growth (%) |
|---|---|---|---|---|
| DEU | Germany | 1508.8 | 1996.1 | 32.3 |
| FRA | France | 1464.5 | 1225.5 | -16.3 |
| GBR | United Kingdom | 2944.4 | 3486.5 | 18.4 |
| ITA | Italy | 1365.3 | 1201.4 | -12.0 |
GBARD_NABS2007 |>
  filter(SEO == "NABS07",
         MEASURE == "DF6",
         COUNTRY %in% c("KOR", "CHE", "ESP")) |>
  left_join(GBARD_NABS2007_var$COUNTRY, by = "COUNTRY") |>
  year_to_date() |>
  ggplot() + theme_minimal() + xlab("") + ylab("Health Government budget allocations for R&D") +
  geom_line(aes(x = date, y = obsValue/1000, color = Country)) +
  scale_color_manual(values = c("#002395", "#000000", "#009246", "#CF142B")) +
  geom_image(data = . %>%
               group_by(Country) %>%
               summarise(date = last(date),
                         obsValue = last(obsValue)) %>%
               mutate(date = as.Date("2020-01-01"),
                      image = paste0("../../icon/flag/", str_to_lower(gsub(" ", "-", Country)), ".png")),
             aes(x = date, y = obsValue/1000, image = image), asp = 1.5) +
  theme(legend.position = c(0.85, 0.9),
        legend.title = element_blank()) +
  scale_x_date(breaks = seq(1920, 2100, 2) |> paste0("-01-01") |> as.Date(),
               labels = date_format("%Y")) +
  scale_y_continuous(breaks = seq(0, 5, 0.5)) +
  theme(legend.position = c(0.25, 0.9),
        legend.title = element_blank())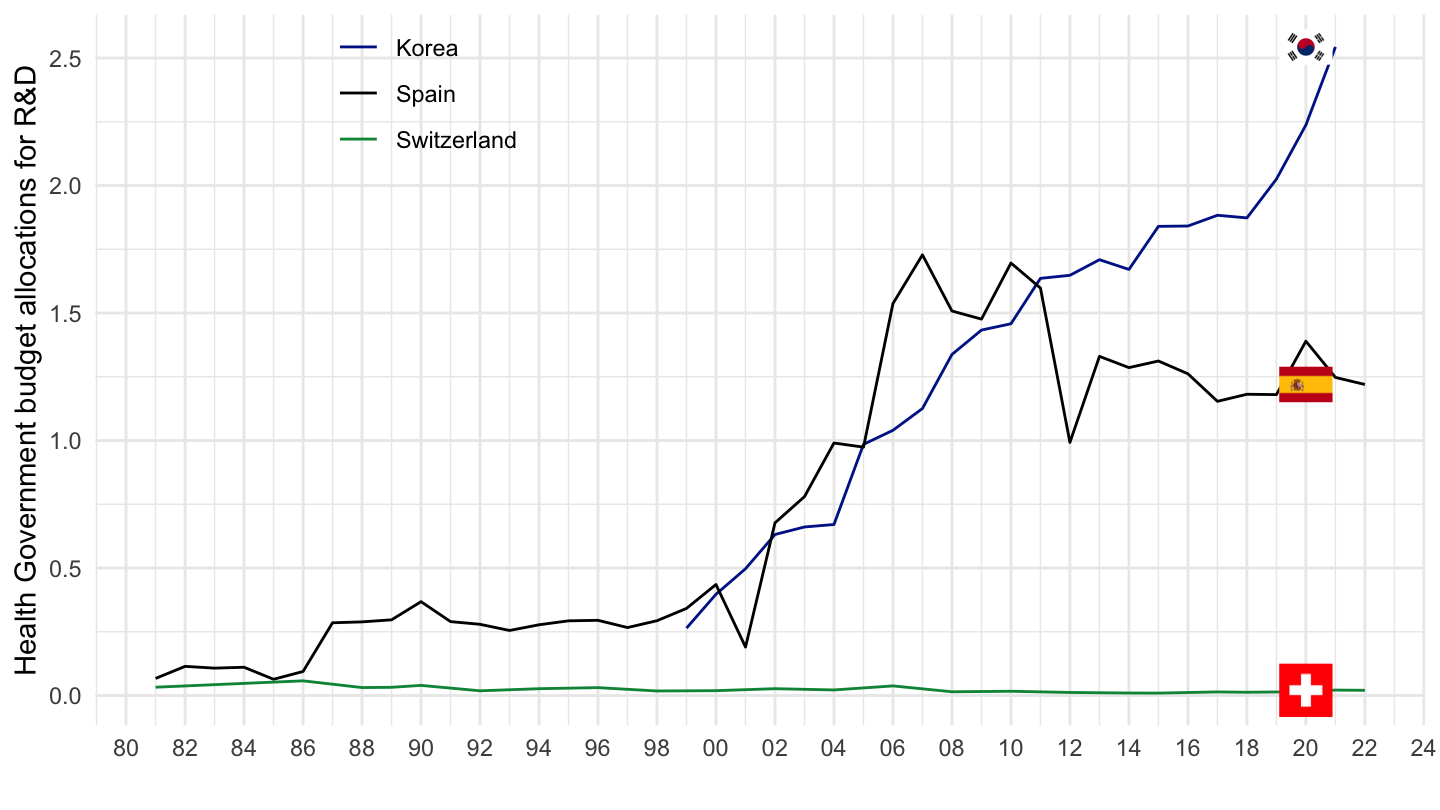
GBARD_NABS2007 |>
  filter(SEO == "NABS07",
         MEASURE == "DC6",
         COUNTRY %in% c("DEU", "FRA", "ITA", "GBR")) |>
  left_join(GBARD_NABS2007_var$COUNTRY, by = "COUNTRY") |>
  year_to_date() |>
  ggplot() + theme_minimal() + xlab("") + ylab("Health Government budget allocations for R&D") +
  geom_line(aes(x = date, y = obsValue/1000, color = Country)) +
  scale_color_manual(values = c("#002395", "#000000", "#009246", "#CF142B")) +
  geom_image(data = . %>%
               group_by(Country) %>%
               summarise(date = last(date),
                         obsValue = last(obsValue)) %>%
               mutate(date = as.Date("2020-01-01"),
                      image = paste0("../../icon/flag/", str_to_lower(gsub(" ", "-", Country)), ".png")),
             aes(x = date, y = obsValue/1000, image = image), asp = 1.5) +
  theme(legend.position = c(0.85, 0.9),
        legend.title = element_blank()) +
  scale_x_date(breaks = seq(1920, 2100, 2) |> paste0("-01-01") |> as.Date(),
               labels = date_format("%Y")) +
  scale_y_continuous(breaks = seq(0, 5, 0.5)) +
  theme(legend.position = c(0.25, 0.9),
        legend.title = element_blank())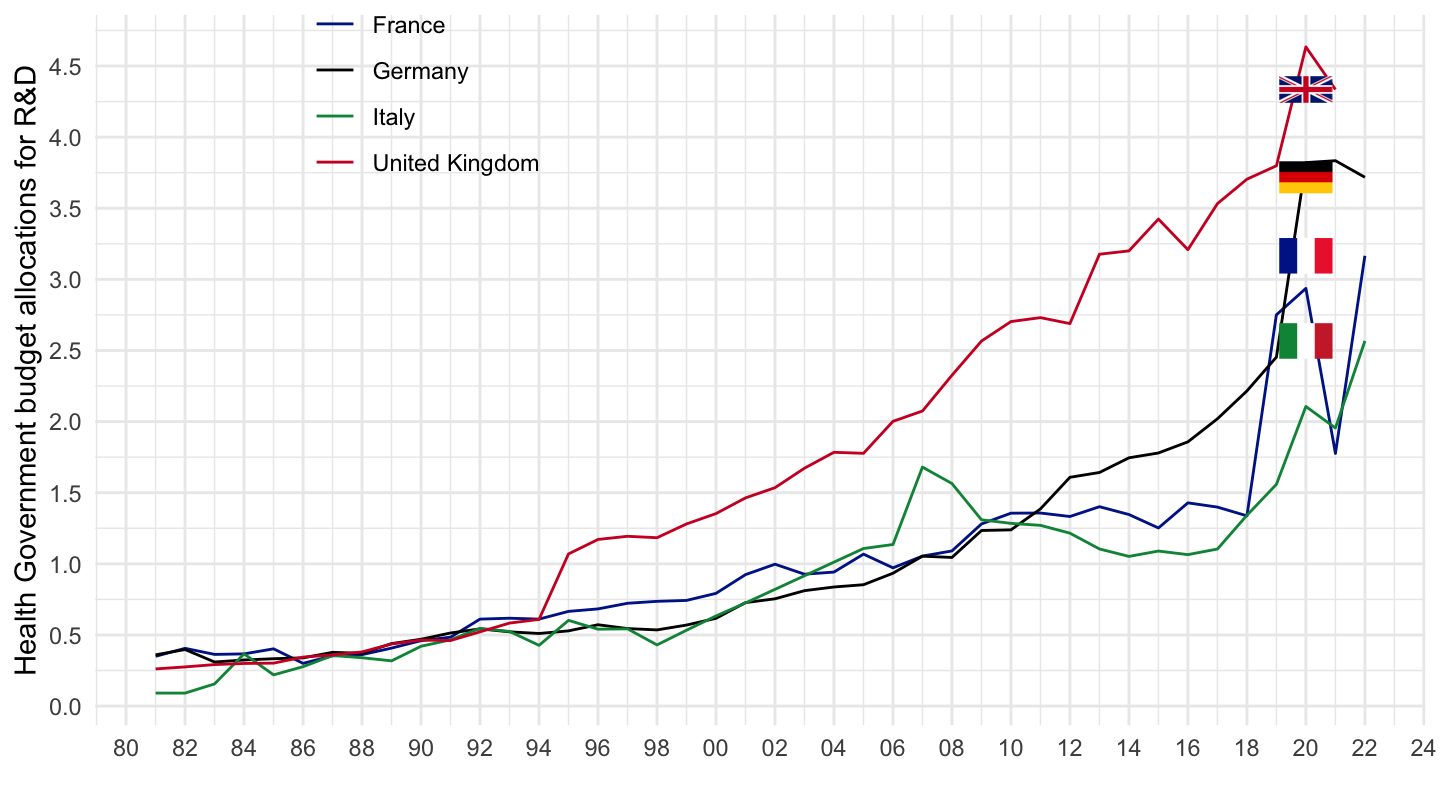
GBARD_NABS2007 |>
  filter(SEO == "NABS07",
         MEASURE == "MIO_NAC",
         COUNTRY %in% c("DEU", "FRA", "ITA", "GBR")) |>
  left_join(GBARD_NABS2007_var$COUNTRY, by = "COUNTRY") |>
  year_to_date() |>
  ggplot() + theme_minimal() + xlab("") + ylab("Health Government budget allocations for R&D") +
  geom_line(aes(x = date, y = obsValue/1000, color = Country)) +
  scale_color_manual(values = c("#002395", "#000000", "#009246", "#CF142B")) +
  geom_image(data = . %>%
               group_by(Country) %>%
               summarise(date = last(date),
                         obsValue = last(obsValue)) %>%
               mutate(date = as.Date("2020-01-01"),
                      image = paste0("../../icon/flag/", str_to_lower(gsub(" ", "-", Country)), ".png")),
             aes(x = date, y = obsValue/1000, image = image), asp = 1.5) +
  theme(legend.position = c(0.85, 0.9),
        legend.title = element_blank()) +
  scale_x_date(breaks = seq(1920, 2100, 2) |> paste0("-01-01") |> as.Date(),
               labels = date_format("%Y")) +
  scale_y_continuous(breaks = seq(0, 5, 0.5)) +
  theme(legend.position = c(0.25, 0.9),
        legend.title = element_blank())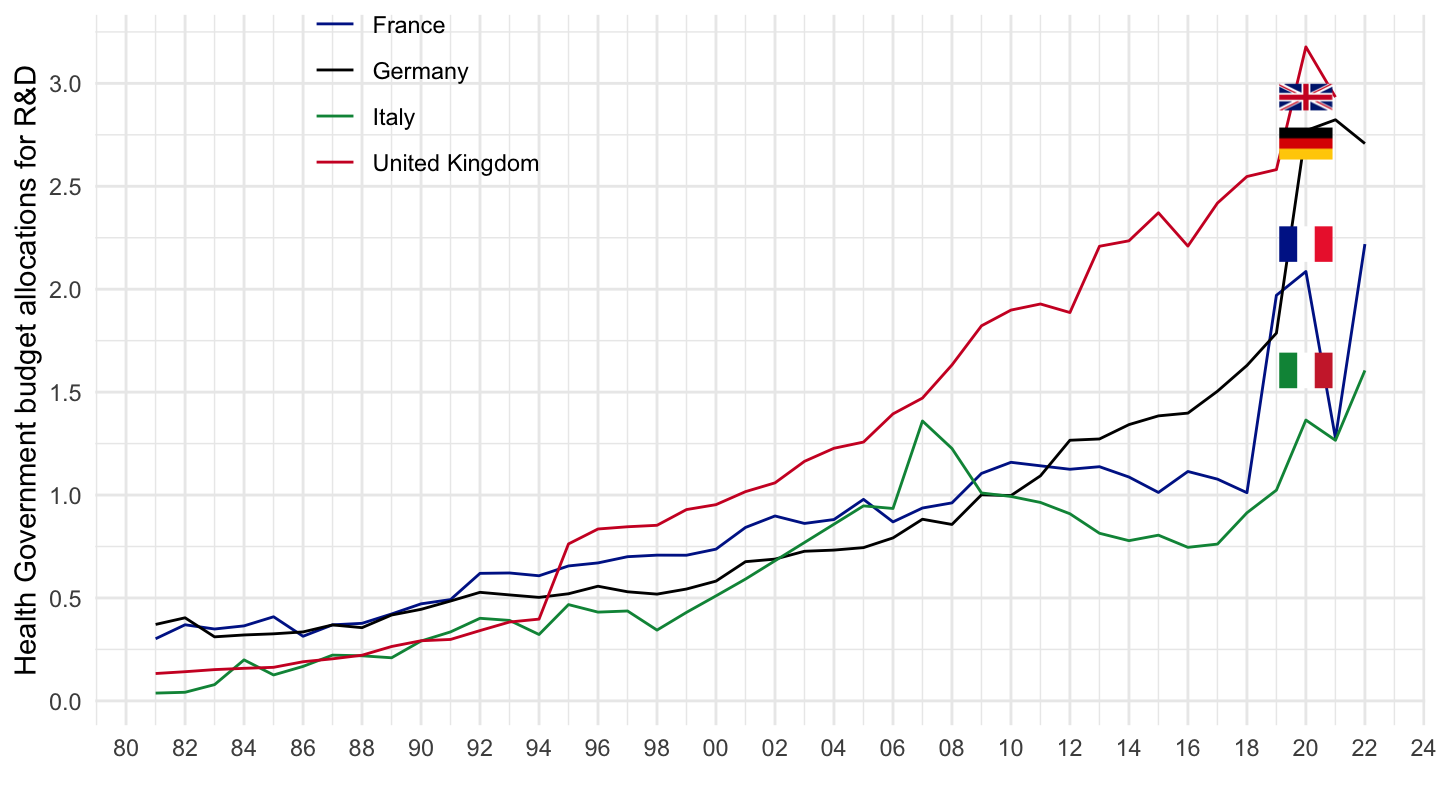
GBARD_NABS2007 |>
  filter(SEO == "NABS133") |>
  left_join(GBARD_NABS2007_var$COUNTRY, by = "COUNTRY") |>
  group_by(COUNTRY, Country, MEASURE) |>
  summarise(Nobs = n()) |>
  spread(MEASURE, Nobs) %>%
{if (is_html_output()) datatable(., filter = 'top', rownames = F) else .}GBARD_NABS2007 |>
filter(SEO == "NABS133",
MEASURE == "DF6",
COUNTRY %in% c("DEU", "FRA", "GBR", "ITA")) |>
left_join(GBARD_NABS2007_var$COUNTRY, by = "COUNTRY") |>
year_to_date() |>
ggplot() + theme_minimal() + xlab("") + ylab("R&D related to Medical and health sciences") +
geom_line(aes(x = date, y = obsValue/1000, color = Country)) +
scale_color_manual(values = c("#002395", "#000000", "#009246", "#CF142B")) +
theme(legend.position = c(0.85, 0.9),
legend.title = element_blank()) +
scale_x_date(breaks = seq(1920, 2100, 2) |> paste0("-01-01") |> as.Date(),
labels = date_format("%Y")) +
scale_y_continuous(breaks = seq(0, 5, 0.5)) +
theme(legend.position = c(0.25, 0.9),
legend.title = element_blank())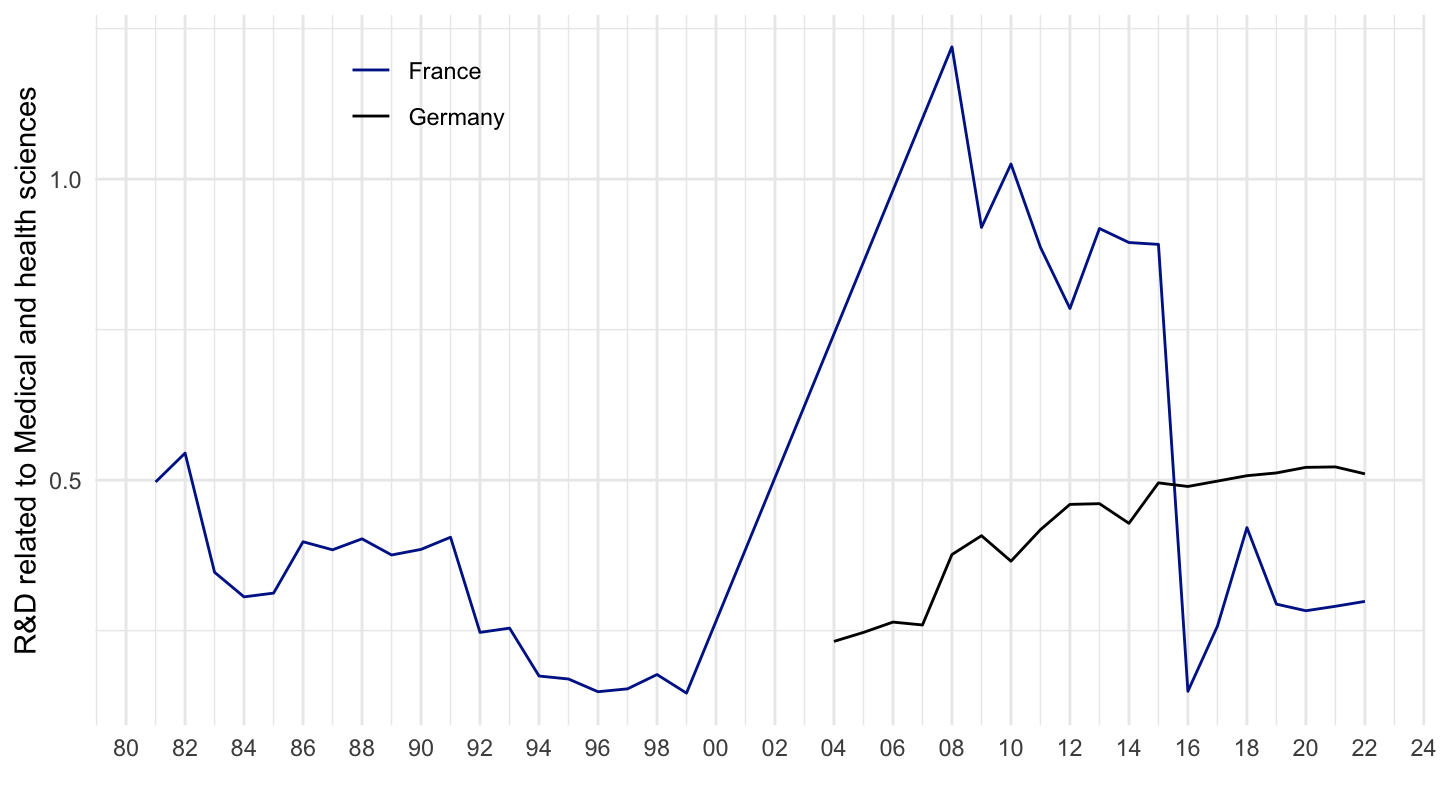
GBARD_NABS2007 |>
  filter(SEO == "NABS133",
         MEASURE == "DC6",
         COUNTRY %in% c("DEU", "FRA", "ITA", "GBR")) |>
  left_join(GBARD_NABS2007_var$COUNTRY, by = "COUNTRY") |>
  year_to_date() |>
  ggplot() + theme_minimal() + xlab("") + ylab("R&D related to Medical and health sciences") +
  geom_line(aes(x = date, y = obsValue/1000, color = Country)) +
  scale_color_manual(values = c("#002395", "#000000", "#009246", "#CF142B")) +
  theme(legend.position = c(0.85, 0.9),
        legend.title = element_blank()) +
  scale_x_date(breaks = seq(1920, 2100, 2) |> paste0("-01-01") |> as.Date(),
               labels = date_format("%Y")) +
  scale_y_continuous(breaks = seq(0, 5, 0.5)) +
  theme(legend.position = c(0.25, 0.9),
        legend.title = element_blank())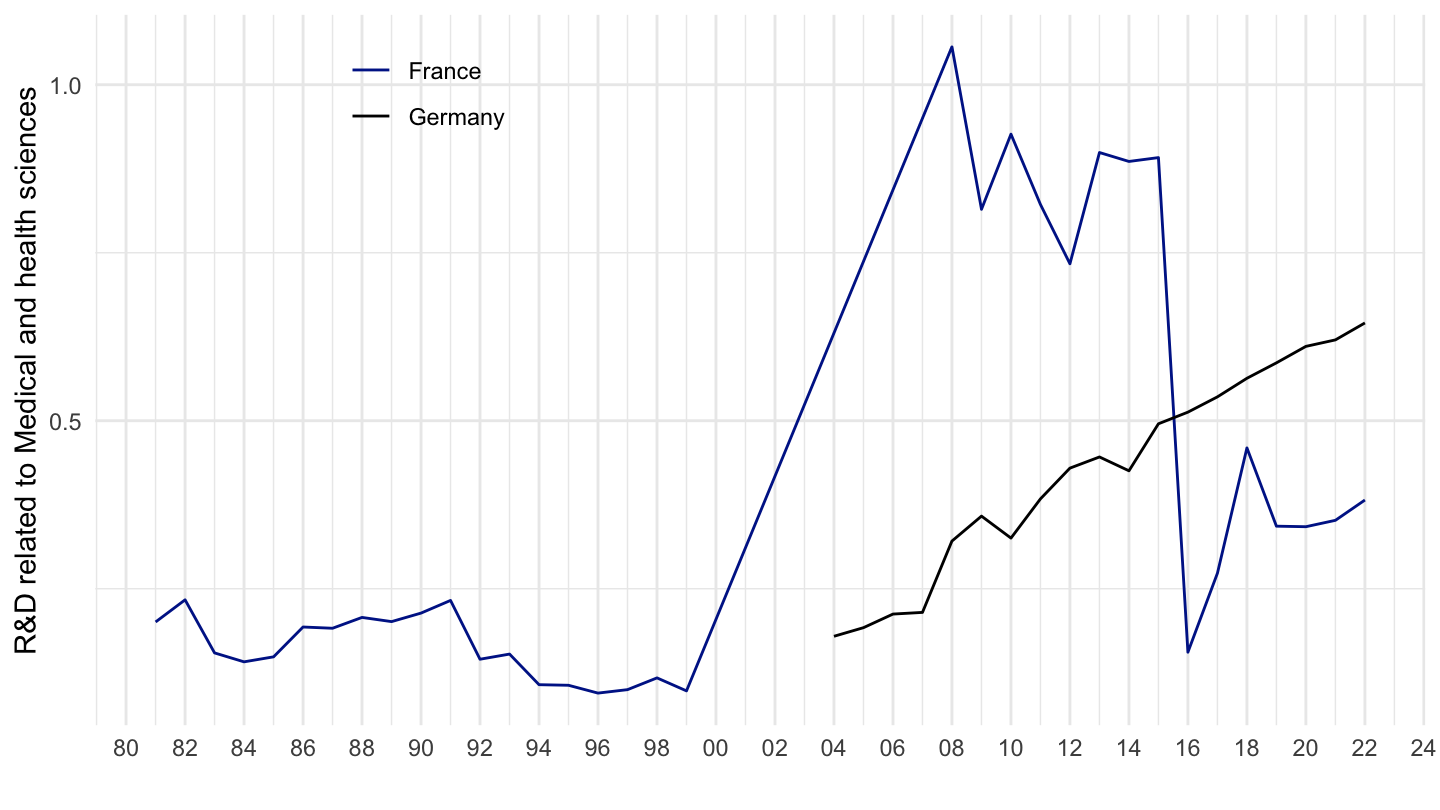
GBARD_NABS2007 |>
  filter(SEO == "NABS133",
         MEASURE == "MIO_NAC",
         COUNTRY %in% c("DEU", "FRA", "ITA", "GBR")) |>
  left_join(GBARD_NABS2007_var$COUNTRY, by = "COUNTRY") |>
  year_to_date() |>
  ggplot() + theme_minimal() + xlab("") + ylab("Health Government budget allocations for R&D") +
  geom_line(aes(x = date, y = obsValue/1000, color = Country)) +
  scale_color_manual(values = c("#002395", "#000000", "#009246", "#CF142B")) +
  theme(legend.position = c(0.85, 0.9),
        legend.title = element_blank()) +
  scale_x_date(breaks = seq(1920, 2100, 2) |> paste0("-01-01") |> as.Date(),
               labels = date_format("%Y")) +
  scale_y_continuous(breaks = seq(0, 5, 0.5)) +
  theme(legend.position = c(0.25, 0.9),
        legend.title = element_blank())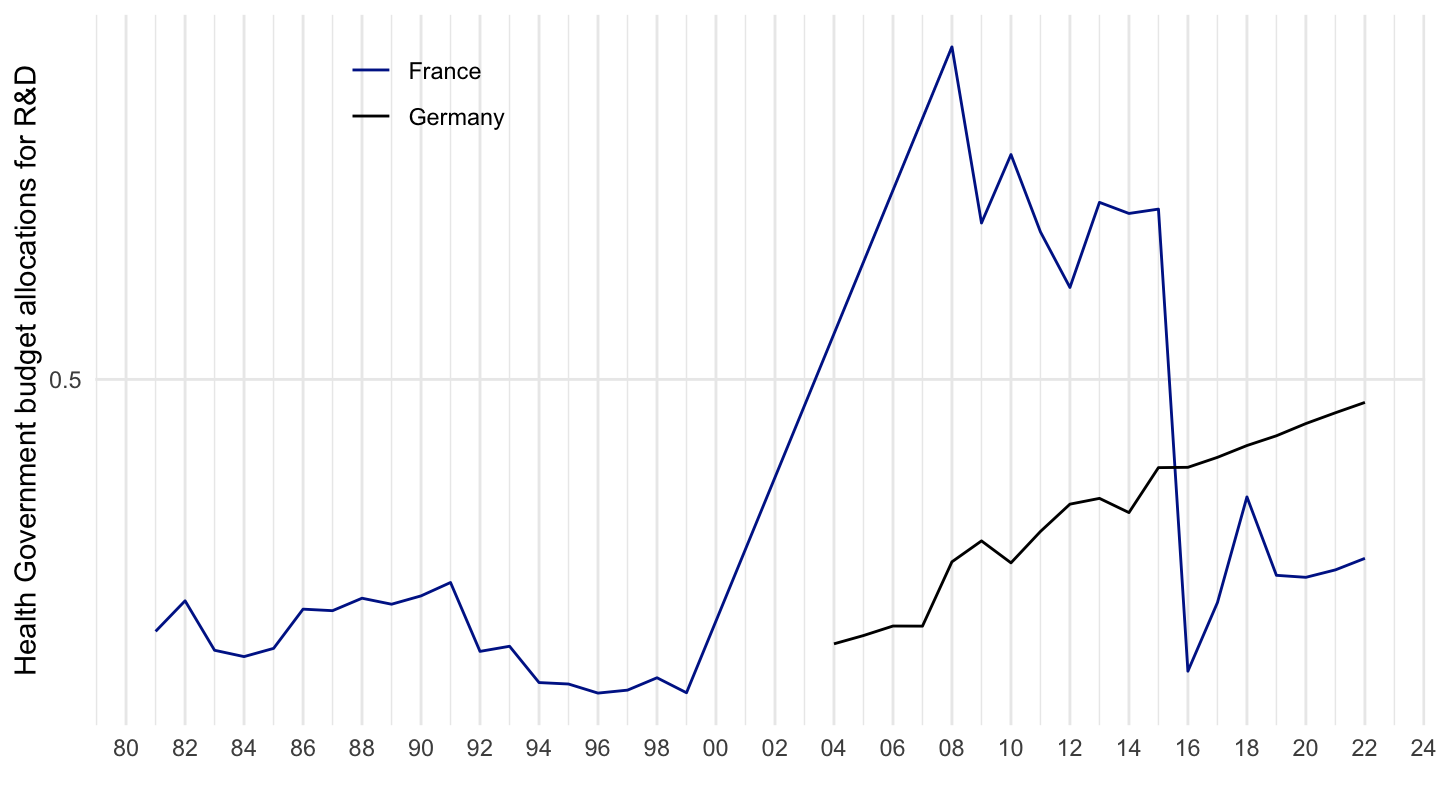
GBARD_NABS2007 |>
  filter(SEO == "NABS123") |>
  left_join(GBARD_NABS2007_var$COUNTRY, by = "COUNTRY") |>
  group_by(COUNTRY, Country, MEASURE) |>
  summarise(Nobs = n()) |>
  spread(MEASURE, Nobs) %>%
{if (is_html_output()) datatable(., filter = 'top', rownames = F) else .}GBARD_NABS2007 |>
filter(SEO == "NABS123",
MEASURE == "DF6",
COUNTRY %in% c("DEU", "FRA", "GBR", "ITA")) |>
left_join(GBARD_NABS2007_var$COUNTRY, by = "COUNTRY") |>
year_to_date() |>
ggplot() + theme_minimal() + xlab("") + ylab("R&D related to Medical and health sciences - financed from GUF") +
geom_line(aes(x = date, y = obsValue/1000, color = Country)) +
scale_color_manual(values = c("#002395", "#000000", "#009246", "#CF142B")) +
theme(legend.position = c(0.85, 0.9),
legend.title = element_blank()) +
scale_x_date(breaks = seq(1920, 2100, 2) |> paste0("-01-01") |> as.Date(),
labels = date_format("%Y")) +
scale_y_continuous(breaks = seq(0, 5, 0.5)) +
theme(legend.position = c(0.25, 0.9),
legend.title = element_blank())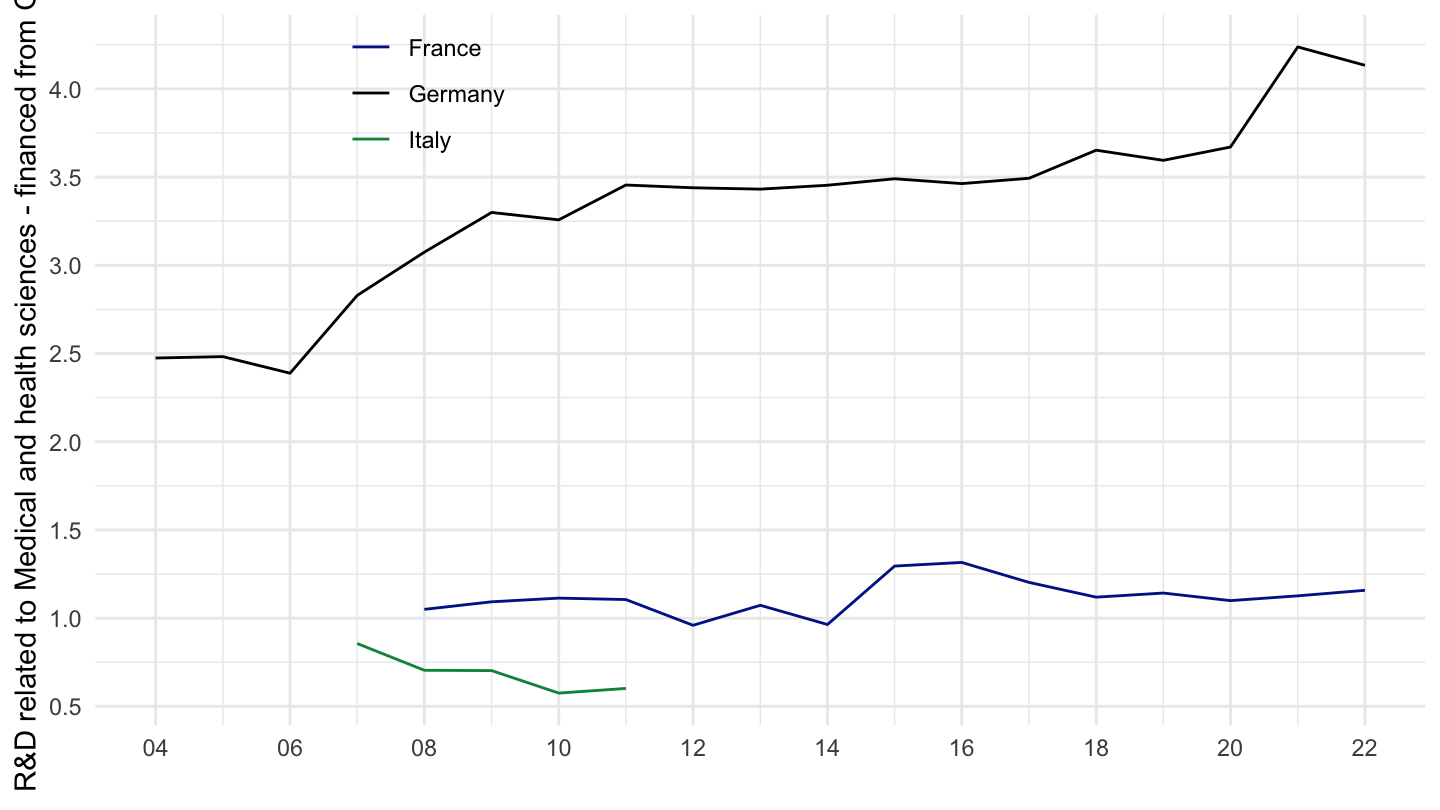
GBARD_NABS2007 |>
  filter(SEO == "NABS123",
         MEASURE == "DC6",
         COUNTRY %in% c("DEU", "FRA", "ITA", "GBR")) |>
  left_join(GBARD_NABS2007_var$COUNTRY, by = "COUNTRY") |>
  year_to_date() |>
  ggplot() + theme_minimal() + xlab("") + ylab("Health Government budget allocations for R&D") +
  geom_line(aes(x = date, y = obsValue/1000, color = Country)) +
  scale_color_manual(values = c("#002395", "#000000", "#009246", "#CF142B")) +
  theme(legend.position = c(0.85, 0.9),
        legend.title = element_blank()) +
  scale_x_date(breaks = seq(1920, 2100, 2) |> paste0("-01-01") |> as.Date(),
               labels = date_format("%Y")) +
  scale_y_continuous(breaks = seq(0, 5, 0.5)) +
  theme(legend.position = c(0.25, 0.9),
        legend.title = element_blank())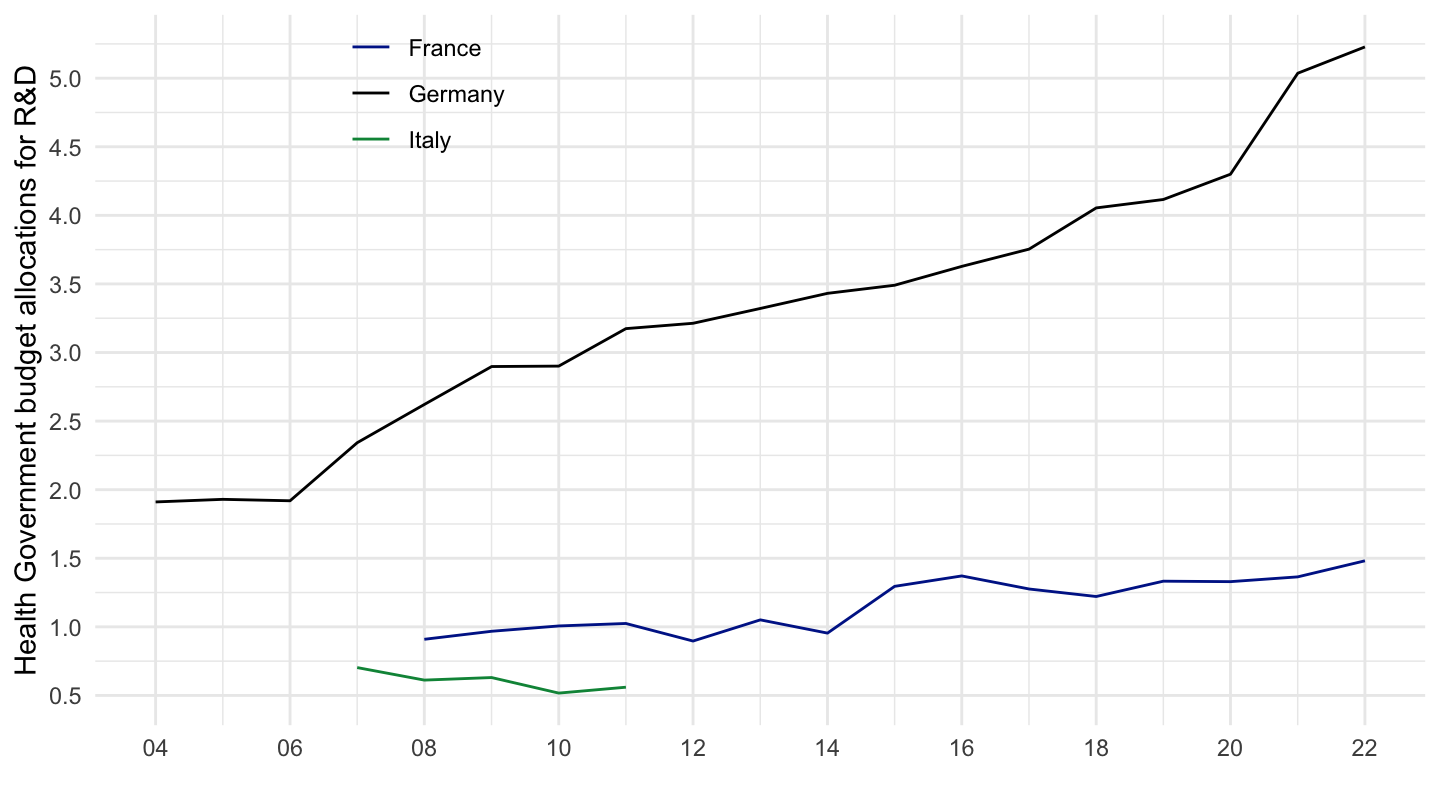
GBARD_NABS2007 |>
  filter(SEO == "NABS123",
         MEASURE == "MIO_NAC",
         COUNTRY %in% c("DEU", "FRA", "ITA", "GBR")) |>
  left_join(GBARD_NABS2007_var$COUNTRY, by = "COUNTRY") |>
  year_to_date() |>
  ggplot() + theme_minimal() + xlab("") + ylab("Health Government budget allocations for R&D") +
  geom_line(aes(x = date, y = obsValue/1000, color = Country)) +
  scale_color_manual(values = c("#002395", "#000000", "#009246", "#CF142B")) +
  theme(legend.position = c(0.85, 0.9),
        legend.title = element_blank()) +
  scale_x_date(breaks = seq(1920, 2100, 2) |> paste0("-01-01") |> as.Date(),
               labels = date_format("%Y")) +
  scale_y_continuous(breaks = seq(0, 5, 0.5)) +
  theme(legend.position = c(0.25, 0.9),
        legend.title = element_blank())