| source | dataset | Title | .html | .rData |
|---|---|---|---|---|
| eurostat | prc_hicp_manr | HICP (2015 = 100) - monthly data (annual rate of change) | 2026-07-23 | 2026-07-23 |
| eurostat | prc_hicp_midx | HICP (2015 = 100) - monthly data (index) | 2026-07-23 | 2026-07-23 |
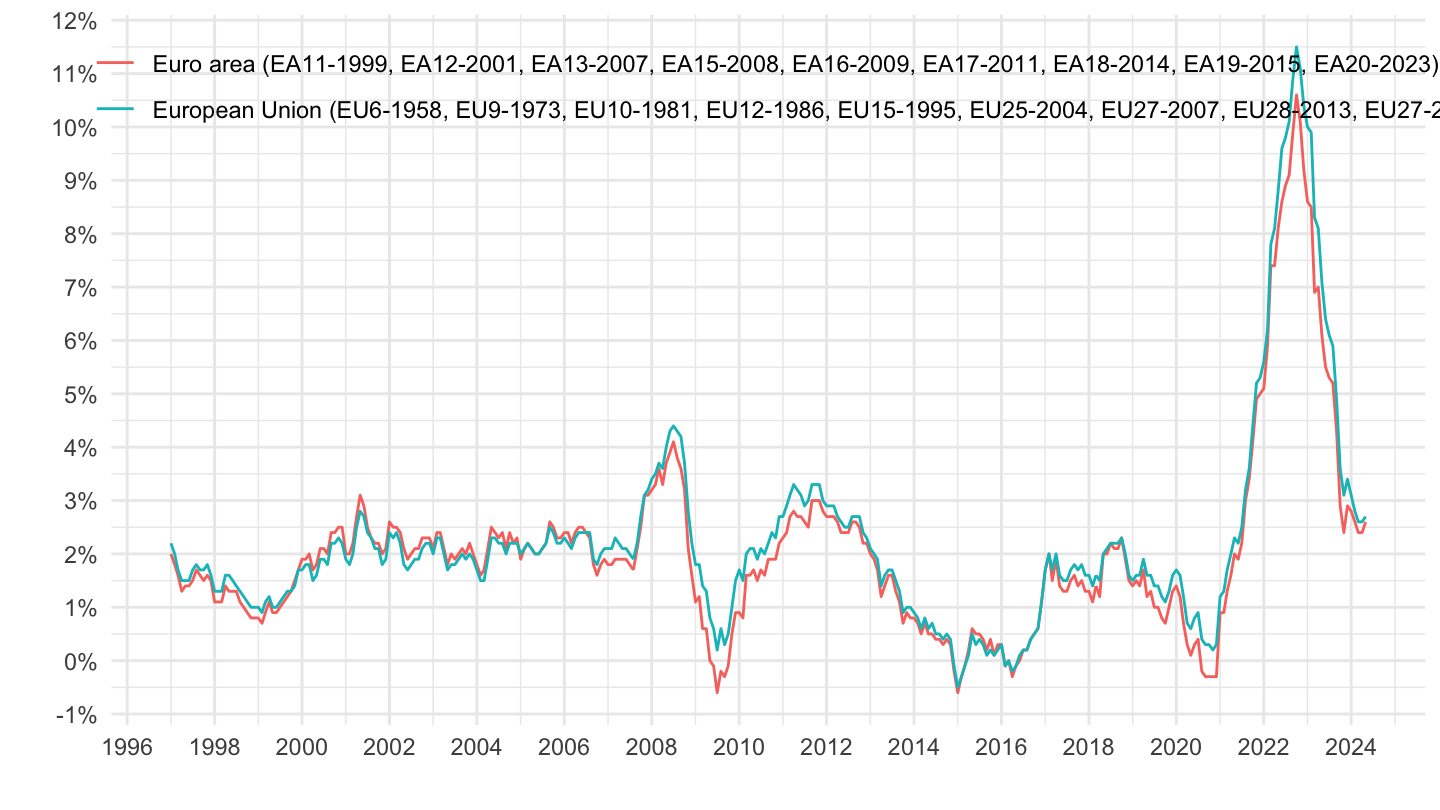
HICP (2015 = 100) - monthly data (annual rate of change)
Data - Eurostat
Info
Data on inflation
| source | dataset | Title | .html | .rData |
|---|---|---|---|---|
| eurostat | prc_hicp_manr | HICP (2015 = 100) - monthly data (annual rate of change) | 2026-07-23 | 2026-07-23 |
| bis | CPI | Consumer Price Index | 2026-07-22 | 2026-07-22 |
| ecb | CES | Consumer Expectations Survey | 2026-07-23 | 2026-07-19 |
| eurostat | nama_10_co3_p3 | Final consumption expenditure of households by consumption purpose (COICOP 3 digit) | 2026-07-18 | 2026-07-23 |
| eurostat | prc_hicp_cow | HICP - country weights | 2026-07-23 | 2026-07-23 |
| eurostat | prc_hicp_ctrb | Contributions to euro area annual inflation (in percentage points) | 2026-07-23 | 2026-07-23 |
| eurostat | prc_hicp_inw | HICP - item weights | 2026-07-23 | 2026-07-23 |
| eurostat | prc_hicp_midx | HICP (2015 = 100) - monthly data (index) | 2026-07-23 | 2026-07-23 |
| eurostat | prc_hicp_mmor | HICP (2015 = 100) - monthly data (monthly rate of change) | 2026-07-23 | 2026-07-23 |
| eurostat | prc_ppp_ind | Purchasing power parities (PPPs), price level indices and real expenditures for ESA 2010 aggregates | 2026-07-22 | 2026-07-23 |
| eurostat | sts_inpp_m | Producer prices in industry, total - monthly data | 2026-07-21 | 2026-07-23 |
| eurostat | sts_inppd_m | Producer prices in industry, domestic market - monthly data | 2026-07-21 | 2026-07-23 |
| eurostat | sts_inppnd_m | Producer prices in industry, non domestic market - monthly data | 2026-07-21 | 2026-07-23 |
| fred | cpi | Consumer Price Index | 2026-07-22 | 2026-07-22 |
| fred | inflation | Inflation | 2026-07-22 | 2026-07-22 |
| imf | CPI | Consumer Price Index (CPI) 2026 February - CPI_2026_FEB_VINTAGE | 2026-07-22 | 2026-04-13 |
| oecd | MEI_PRICES_PPI | Producer Prices - MEI_PRICES_PPI | 2026-07-23 | 2024-04-15 |
| oecd | PPP2017 | 2017 PPP Benchmark results | 2024-04-16 | 2023-07-25 |
| oecd | PRICES_CPI | Consumer price indices (CPIs) | 2024-04-16 | 2024-04-15 |
| wdi | FP.CPI.TOTL.ZG | Inflation, consumer prices (annual %) | 2026-07-22 | 2026-07-22 |
| wdi | NY.GDP.DEFL.KD.ZG | Inflation, GDP deflator (annual %) | 2026-07-22 | 2026-07-22 |
Données sur l’inflation en France
| source | dataset | Title | .html | .rData |
|---|---|---|---|---|
| insee | ILC-ILAT-ICC | Indices pour la révision d’un bail commercial ou professionnel | 2026-07-23 | 2026-07-23 |
| insee | INDICES_LOYERS | Indices des loyers d'habitation (ILH) | 2026-07-23 | 2026-07-23 |
| insee | IPC-1970-1980 | Indice des prix à la consommation - Base 1970, 1980 | 2026-07-23 | 2026-07-23 |
| insee | IPC-1990 | Indices des prix à la consommation - Base 1990 | 2026-07-23 | 2026-07-23 |
| insee | IPC-2015 | Indice des prix à la consommation - Base 2015 | 2026-07-23 | 2026-07-23 |
| insee | IPC-PM-2015 | Prix moyens de vente de détail | 2026-07-23 | 2026-07-23 |
| insee | IPCH-2015 | Indices des prix à la consommation harmonisés | 2026-07-23 | 2026-07-23 |
| insee | IPCH-IPC-2015-ensemble | Indices des prix à la consommation harmonisés | 2026-07-23 | 2026-07-23 |
| insee | IPGD-2015 | Indice des prix dans la grande distribution | 2026-07-23 | 2026-07-23 |
| insee | IPLA-IPLNA-2015 | Indices des prix des logements neufs et Indices Notaires-Insee des prix des logements anciens | 2026-07-23 | 2026-07-23 |
| insee | IPPI-2015 | Indices de prix de production et d'importation dans l'industrie | 2026-07-23 | 2026-07-23 |
| insee | IRL | Indice pour la révision d’un loyer d’habitation | 2026-07-23 | 2026-07-23 |
| insee | SERIES_LOYERS | Variation des loyers | 2026-07-23 | 2026-07-23 |
| insee | T_CONSO_EFF_FONCTION | Consommation effective des ménages par fonction | 2026-07-23 | 2025-12-22 |
| insee | bdf2017 | Budget de famille 2017 | 2026-07-23 | 2023-11-21 |
| insee | echantillon-agglomerations-IPC-2024 | Échantillon d’agglomérations enquêtées de l’IPC en 2024 | 2026-07-23 | 2026-01-27 |
| insee | echantillon-agglomerations-IPC-2025 | Échantillon d’agglomérations enquêtées de l’IPC en 2025 | 2026-07-23 | 2026-01-27 |
| insee | liste-varietes-IPC-2024 | Liste des variétés pour la mesure de l'IPC en 2024 | 2026-07-23 | 2025-04-02 |
| insee | liste-varietes-IPC-2025 | Liste des variétés pour la mesure de l'IPC en 2025 | 2026-07-23 | 2026-01-27 |
| insee | ponderations-elementaires-IPC-2024 | Pondérations élémentaires 2024 intervenant dans le calcul de l’IPC | 2026-07-23 | 2025-04-02 |
| insee | ponderations-elementaires-IPC-2025 | Pondérations élémentaires 2025 intervenant dans le calcul de l’IPC | 2026-07-23 | 2026-01-27 |
| insee | table_conso_moyenne_par_categorie_menages | Montants de consommation selon différentes catégories de ménages | 2026-07-23 | 2026-01-27 |
| insee | table_poste_au_sein_sous_classe_ecoicopv2_france_entiere_ | Ventilation de chaque sous-classe (niveau 4 de la COICOP v2) en postes et leurs pondérations | 2026-07-23 | 2026-01-27 |
| insee | tranches_unitesurbaines | Poids de chaque tranche d’unités urbaines dans la consommation | 2026-07-23 | 2026-01-27 |
LAST_COMPILE
| LAST_COMPILE |
|---|
| 2026-07-24 |
Last
Code
prc_hicp_manr %>%
  group_by(time) %>%
  summarise(Nobs = n()) %>%
  arrange(desc(time)) %>%
  head(1) %>%
print_table_conditional()| time | Nobs |
|---|---|
| 2025M12 | 16264 |
HICP Releases
Code
tibble(release = "2021-11", key = "11563387", date = "30112021") %>%
  add_row(release = "2021-12", key = "14442438", date = "07012022") %>%
  add_row(release = "2022-02", key = "14358044", date = "02032022") %>%
  add_row(release = "2022-03", key = "14442438", date = "01042022") %>%
  add_row(release = "2022-09", key = "15131964", date = "30092022") %>%
  add_row(release = "2022-10", key = "15131964", date = "31102022") %>%
  mutate(en = paste0('<a  target=_blank href=https://ec.europa.eu/eurostat/documents/2995521/', key, '/2-', date, '-AP-EN.pdf > en </a>')) %>%
  mutate(fr = paste0('<a  target=_blank href=https://ec.europa.eu/eurostat/documents/2995521/', key, '/2-', date, '-AP-FR.pdf > fr </a>')) %>%
  mutate(de = paste0('<a  target=_blank href=https://ec.europa.eu/eurostat/documents/2995521/', key, '/2-', date, '-AP-DE.pdf > de </a>')) %>%
  select(-key, -date) %>%
  arrange(desc(release)) %>%
{if (is_html_output()) datatable(., filter = 'top', rownames = F, escape = F) else .}- Full series of indices (approx. 2 weeks later).
Code
tibble(release = "2021-11", key = "2995521", date = "17122021") %>%
  add_row(release = "2022-08", key = "16092022", date = "30112021") %>%
  add_row(release = "2022-09", key = "15131946", date = "19102022") %>%
  # https://ec.europa.eu/eurostat/documents/2995521/15265521/2-17112022-AP-EN.pdf
  add_row(release = "2022-10", key = "15265521", date = "17112022") %>%
  mutate(en = paste0('<a  target=_blank href=https://ec.europa.eu/eurostat/documents/2995521/', key, '/2-', date, '-AP-EN.pdf > en </a>')) %>%
  mutate(fr = paste0('<a  target=_blank href=https://ec.europa.eu/eurostat/documents/2995521/', key, '/2-', date, '-AP-FR.pdf > fr </a>')) %>%
  mutate(de = paste0('<a  target=_blank href=https://ec.europa.eu/eurostat/documents/2995521/', key, '/2-', date, '-AP-DE.pdf > de </a>')) %>%
  select(-key, -date) %>%
  arrange(desc(release)) %>%
  {if (is_html_output()) datatable(., filter = 'top', rownames = F, escape = F) else .}
Code
i_g("bib/eurostat/2-30112021-AP-EN/euro-area-annual-inflation-components.png")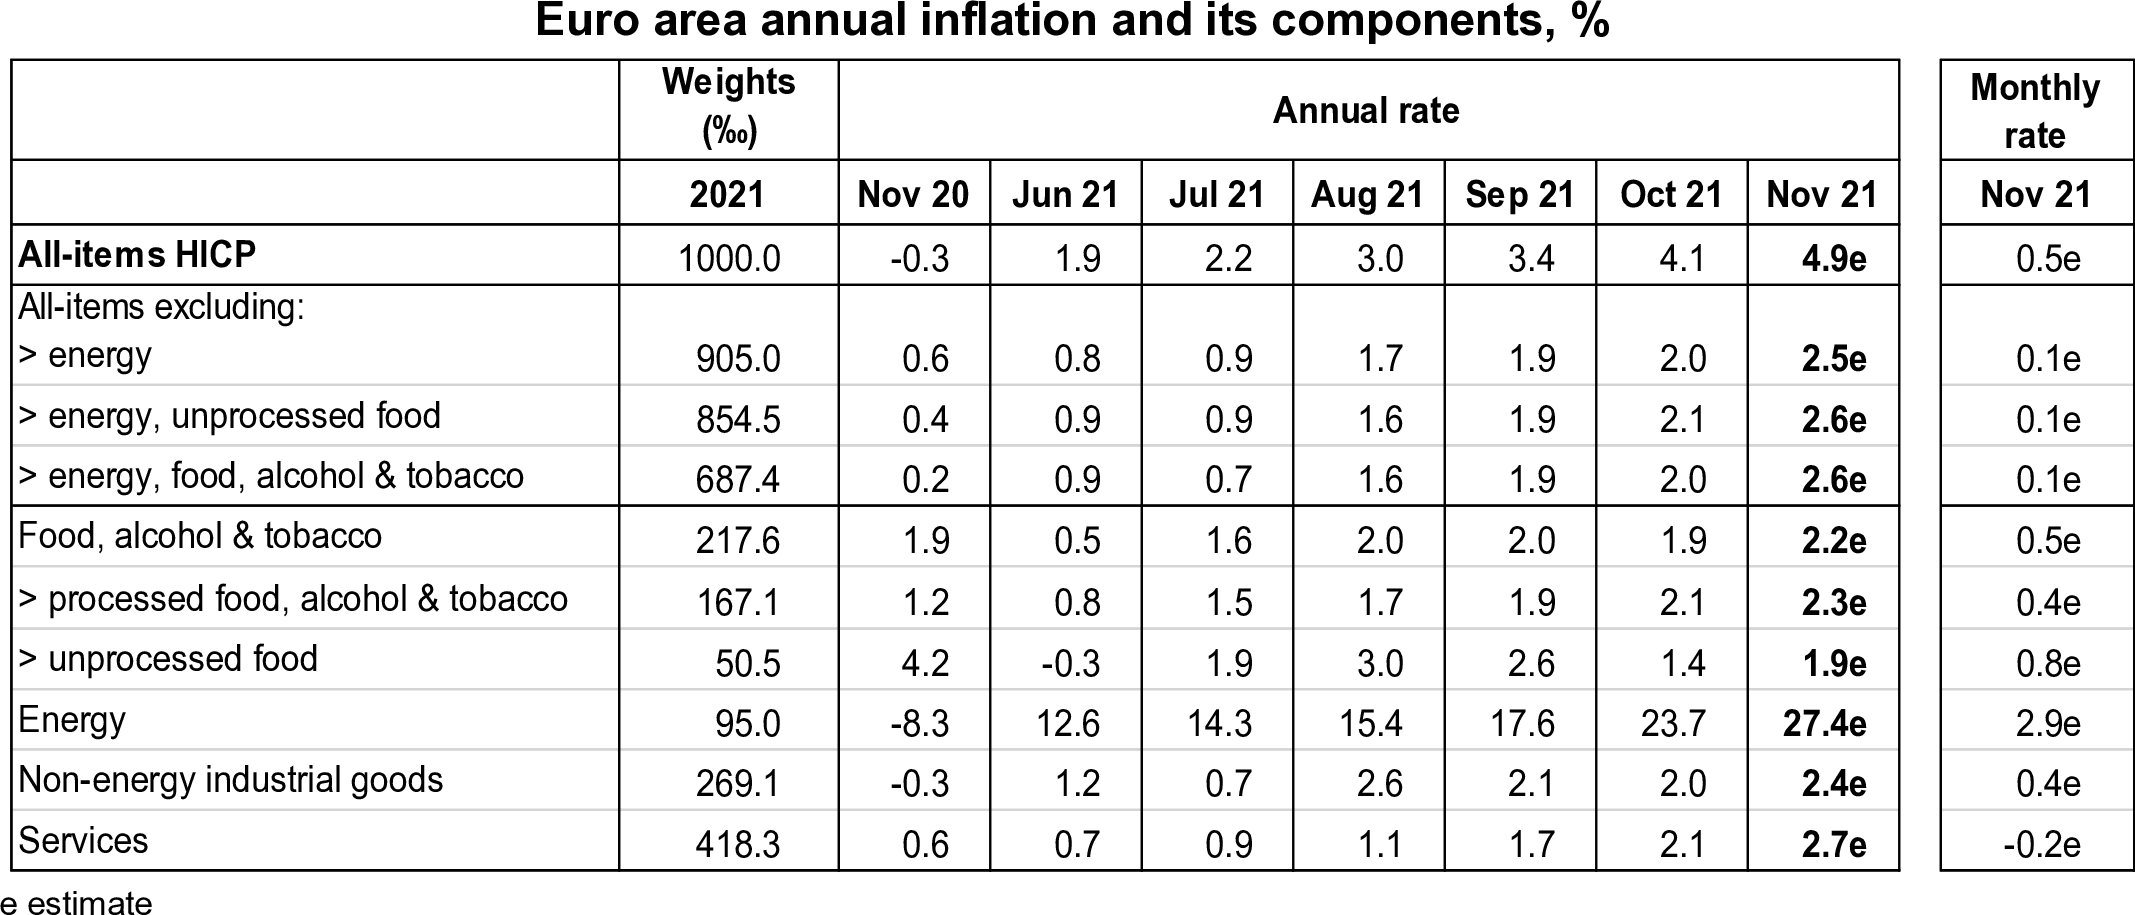
Code
i_g("bib/eurostat/2-30112021-AP-EN/HICP-202111.png")
coicop
All
Code
prc_hicp_manr %>%
  left_join(coicop, by = "coicop") %>%
  group_by(coicop, Coicop) %>%
  summarise(Nobs = n()) %>%
  print_table_conditional()
2-digit
Code
prc_hicp_manr %>%
  filter(nchar(coicop) == 4,
         unit == "RCH_A") %>%
  left_join(coicop, by = "coicop") %>%
  filter(!is.na(values)) %>%
  group_by(coicop, Coicop) %>%
  summarise(Nobs = n()) %>%
print_table_conditional()| coicop | Coicop | Nobs |
|---|---|---|
| CP00 | All-items HICP | 14231 |
| CP01 | Food and non-alcoholic beverages | 14231 |
| CP02 | Alcoholic beverages, tobacco and narcotics | 14231 |
| CP03 | Clothing and footwear | 14231 |
| CP04 | Housing, water, electricity, gas and other fuels | 14231 |
| CP05 | Furnishings, household equipment and routine household maintenance | 14231 |
| CP06 | Health | 14231 |
| CP07 | Transport | 14231 |
| CP08 | Communications | 14231 |
| CP09 | Recreation and culture | 14231 |
| CP10 | Education | 14184 |
| CP11 | Restaurants and hotels | 14231 |
| CP12 | Miscellaneous goods and services | 14231 |
| FOOD | Food including alcohol and tobacco | 13683 |
| FUEL | Liquid fuels and fuels and lubricants for personal transport equipment | 13660 |
| SERV | Services (overall index excluding goods) | 12777 |
3-digit
Code
prc_hicp_manr %>%
  filter(nchar(coicop) == 5) %>%
  left_join(coicop, by = "coicop") %>%
  group_by(coicop, Coicop) %>%
  summarise(Nobs = n()) %>%
  print_table_conditional()
4-digit
Code
prc_hicp_manr %>%
  filter(nchar(coicop) == 6) %>%
  left_join(coicop, by = "coicop") %>%
  group_by(coicop, Coicop) %>%
  summarise(Nobs = n()) %>%
  print_table_conditional()
5-digit
Code
prc_hicp_manr %>%
  filter(nchar(coicop) == 7) %>%
  left_join(coicop, by = "coicop") %>%
  group_by(coicop, Coicop) %>%
  summarise(Nobs = n()) %>%
  print_table_conditional()
Other
Code
prc_hicp_manr %>%
  filter(nchar(coicop) > 7) %>%
  left_join(coicop, by = "coicop") %>%
  group_by(coicop, Coicop) %>%
  summarise(Nobs = n()) %>%
  print_table_conditional()
geo
Code
prc_hicp_manr %>%
  left_join(geo, by = "geo") %>%
  group_by(geo, Geo) %>%
  summarise(Nobs = n()) %>%
  mutate(Flag = gsub(" ", "-", str_to_lower(gsub(" ", "-", Geo))),
         Flag = paste0('<img src="../../icon/flag/vsmall/', Flag, '.png" alt="Flag">')) %>%
  select(Flag, everything()) %>%
  {if (is_html_output()) datatable(., filter = 'top', rownames = F, escape = F) else .}
time
Code
prc_hicp_manr %>%
  group_by(time) %>%
  summarise(Nobs = n()) %>%
  arrange(desc(time)) %>%
  print_table_conditional()
Last
Code
prc_hicp_manr %>%
  filter(time == last_time) %>%
  select_if(function(col) length(unique(col)) > 1) %>%
  left_join(geo, by = "geo") %>%
  left_join(coicop, by = "coicop") %>%
  select(geo, Geo, coicop, Coicop, values) %>%
  print_table_conditional()
Europe, United States (Proxy-HICP)
How much data ?
Code
prc_hicp_manr %>%
  filter(geo %in% c("US", "EA20"),
         time == "2023M09") %>%
  group_by(time, coicop) %>%
  filter(n() == 2) %>%
  ungroup %>%
  left_join(coicop, by = "coicop") %>%
  mutate(Geo = ifelse(geo == "EA20", "Euro area HICP", "US Proxy-HICP")) %>%
  select(-unit, -geo, - time) %>%
  spread(Geo, values)
# # A tibble: 13 × 5
# freq coicop Coicop `Euro area HICP` `US Proxy-HICP`
# <chr> <chr> <chr> <dbl> <dbl>
# 1 M CP00 All-items HICP 4.3 2.6
# 2 M CP01 Food and non-alcoholic beverag… 9.1 2.3
# 3 M CP02 Alcoholic beverages, tobacco a… 7.4 4.2
# 4 M CP03 Clothing and footwear 3 2.6
# 5 M CP04 Housing, water, electricity, g… -2.3 3.9
# 6 M CP05 Furnishings, household equipme… 4.8 1.3
# 7 M CP06 Health 2.9 2.8
# 8 M CP07 Transport 3.6 -0.1
# 9 M CP08 Communications -0.3 -0.9
# 10 M CP09 Recreation and culture 5.6 4.8
# 11 M CP10 Education 3.2 3.1
# 12 M CP11 Restaurants and hotels 6.7 5.2
# 13 M CP12 Miscellaneous goods and servic… 5.2 3.82020-
All
Code
coicop_short <- tribble(
  ~ coicop, ~ Coicop,
  "CP01", "Food",
  "CP02", "Alcohol, Tobacco",
  "CP03", "Clothing",
  "CP04", "Housing, heating",
  "CP05", "Furnishings",
  "CP06", "Health",
  "CP07", "Transport",
  "CP08", "Communications",
  "CP09", "Recreation",
  "CP10", "Education",
  "CP11", "Restaurants, Hotels",
  "CP12", "Misc G&S")
prc_hicp_manr %>%
  filter(coicop != "CP00",
         geo %in% c("EA20", "US")) %>%
  group_by(time, coicop) %>%
  filter(n() == 2) %>%
  ungroup %>%
  month_to_date %>%
  filter(date >= as.Date("2021-03-01")) %>%
  mutate(Geo = ifelse(geo == "EA20", "Euro area HICP", "US Proxy-HICP")) %>%
  mutate(values = values/100) %>%
  left_join(coicop_short, by = "coicop") %>%
  ggplot(.) + geom_line(aes(x = date, y = values, color = Geo)) +
  theme_minimal() + xlab("") + ylab("Inflation (%)") +
  scale_x_date(breaks = seq.Date(as.Date("2019-09-01"), as.Date("2100-09-01"), "6 months"),
               labels = date_format("%b %Y")) +
  scale_y_continuous(breaks = 0.01*seq(-100, 100, 5),
                     labels = percent_format(a = 1)) +
  scale_color_manual(values = c("#003399", "#B22234")) +
  theme(legend.position = "top",
        legend.title = element_blank(),
        axis.text.x = element_text(angle = 45, vjust = 1, hjust = 1)) +
  geom_vline(xintercept = as.Date("2023-09-01"), linetype = "dotted") +
  geom_vline(xintercept = as.Date("2022-09-01"), linetype = "dotted") +
  facet_wrap(~paste(coicop, Coicop, sep = " - ")) +
  geom_text_repel(data = . %>% filter(date %in% c(as.Date("2023-09-01"),
                                                  as.Date("2022-09-01"))),
                  aes(x = date, y = values, label = percent(values, acc = 0.1), color = Geo),
                  fontface ="plain", size = 3)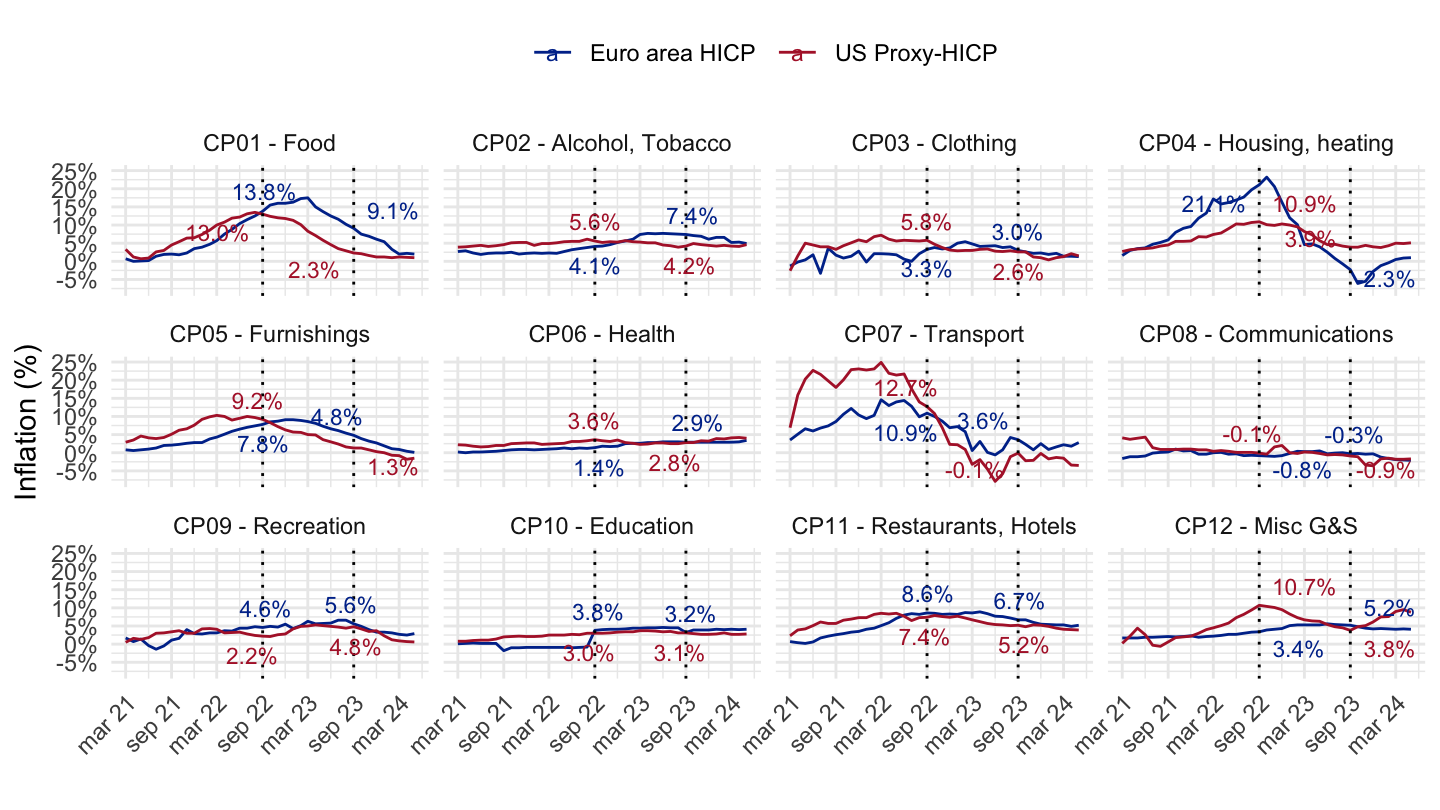
All
Code
coicop_short <- tribble(
  ~ coicop, ~ Coicop,
  "CP01", "Food",
  "CP02", "Alcohol, Tobacco",
  "CP03", "Clothing",
  "CP04", "Housing, heating",
  "CP05", "Furnishings",
  "CP06", "Health",
  "CP07", "Transport",
  "CP08", "Communications",
  "CP09", "Recreation",
  "CP10", "Education",
  "CP11", "Restaurants, Hotels",
  "CP12", "Misc G&S")
prc_hicp_manr %>%
  filter(coicop != "CP00",
         geo %in% c("EA20", "US")) %>%
  group_by(time, coicop) %>%
  filter(n() == 2) %>%
  ungroup %>%
  month_to_date %>%
  filter(date >= as.Date("2021-03-01")) %>%
  mutate(Geo = ifelse(geo == "EA20", "Euro area HICP", "US Proxy-HICP")) %>%
  mutate(values = values/100) %>%
  left_join(coicop_short, by = "coicop") %>%
  ggplot(.) + geom_line(aes(x = date, y = values, color = Geo)) +
  theme_minimal() + xlab("") + ylab("Inflation (%)") +
  scale_x_date(breaks = seq.Date(as.Date("2019-09-01"), as.Date("2100-09-01"), "6 months"),
               labels = date_format("%b %Y")) +
  scale_y_continuous(breaks = 0.01*seq(-100, 100, 5),
                     labels = percent_format(a = 1)) +
  scale_color_manual(values = c("#003399", "#B22234")) +
  theme(legend.position = "top",
        legend.title = element_blank(),
        axis.text.x = element_text(angle = 45, vjust = 1, hjust = 1)) +
  geom_vline(xintercept = as.Date("2023-10-01"), linetype = "dotted") +
  geom_vline(xintercept = as.Date("2022-10-01"), linetype = "dotted") +
  facet_wrap(~paste(coicop, Coicop, sep = " - ")) +
  geom_text_repel(data = . %>% filter(date %in% c(as.Date("2023-10-01"),
                                                  as.Date("2022-10-01"))),
                  aes(x = date, y = values, label = percent(values, acc = 0.1), color = Geo),
                  fontface ="plain", size = 3)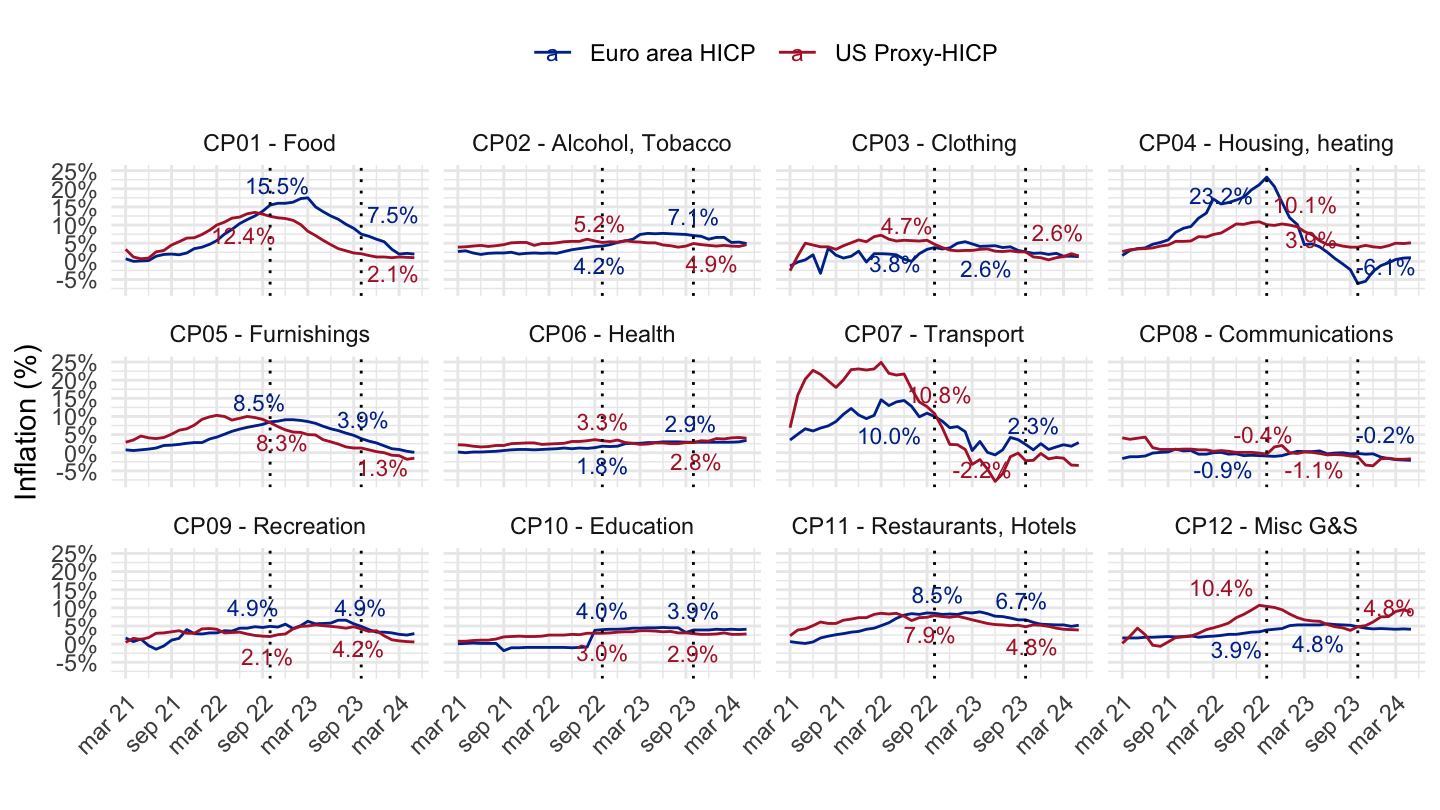
CP00 - All-items HICP
Code
prc_hicp_manr %>%
  filter(coicop == "CP00",
         geo %in% c("EA", "US")) %>%
  month_to_date %>%
  filter(date >= as.Date("2020-01-01")) %>%
  mutate(Geo = ifelse(geo == "EA", "Euro area HICP", "US Proxy-HICP")) %>%
  mutate(values = values/100) %>%
  ggplot(.) + geom_line(aes(x = date, y = values, color = Geo)) +
  theme_minimal() + xlab("") + ylab("Inflation (%)") +
  scale_x_date(breaks = seq.Date(as.Date("2019-12-01"), Sys.Date(), "3 months"),
               labels = date_format("%b %Y")) +
  scale_y_continuous(breaks = 0.01*seq(-20, 20, 1),
                     labels = percent_format(a = 1)) +
  scale_color_manual(values = c("#003399", "#B22234")) +
  theme(legend.position = c(0.25, 0.90),
        legend.title = element_blank(),
        axis.text.x = element_text(angle = 45, vjust = 1, hjust = 1)) +
  geom_text_repel(data = . %>% filter(date %in% c(max(date), as.Date("2022-06-01"),
                                                  as.Date("2022-10-01"))),
                  aes(x = date, y = values, label = percent(values, acc = 0.1)),
                  fontface ="plain", color = "black", size = 3) +
  geom_vline(xintercept = as.Date("2022-06-01"), linetype = "dotted") +
  geom_vline(xintercept = as.Date("2022-10-01"), linetype = "dotted")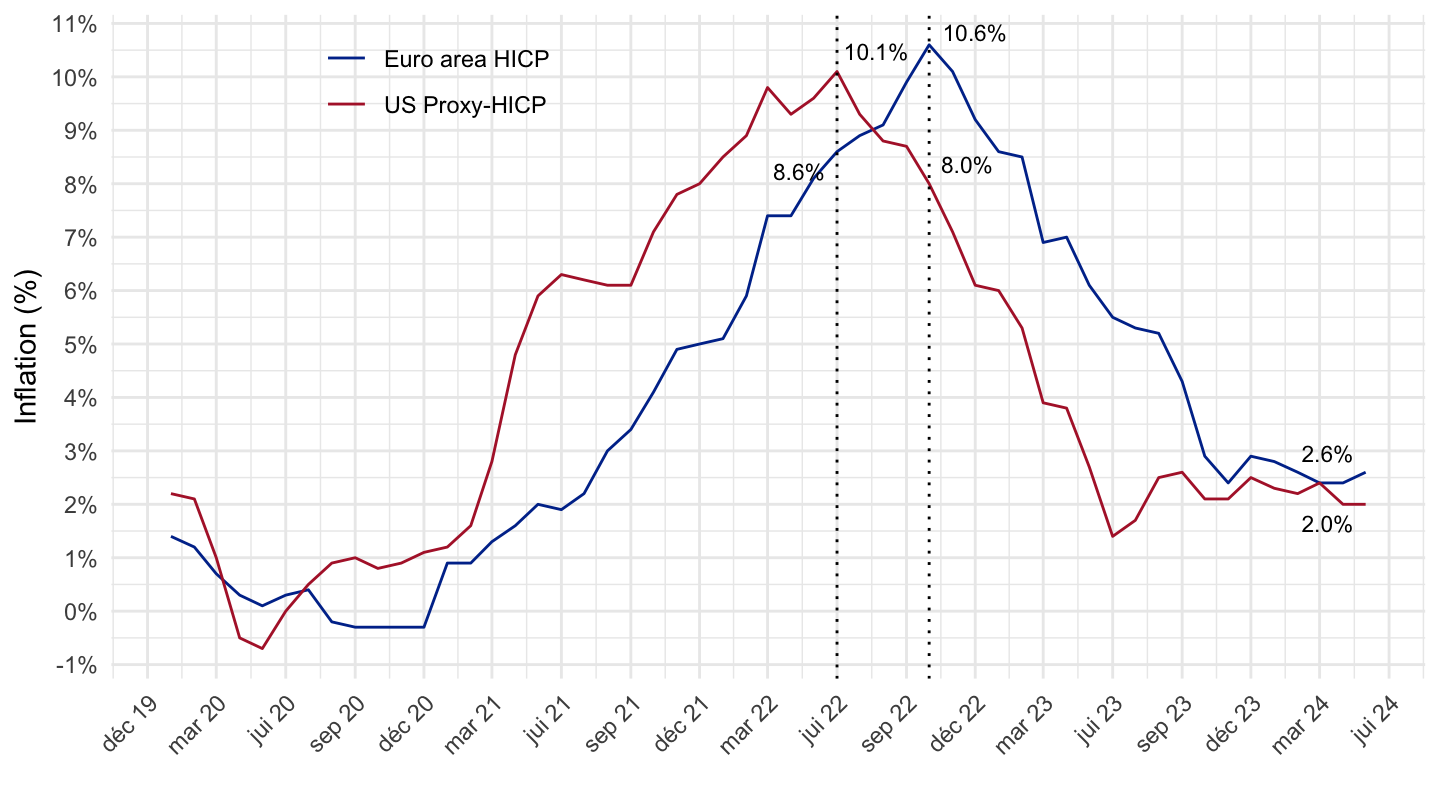
CP01 - Food and non-alcoholic beverages
Code
prc_hicp_manr %>%
  filter(coicop == "CP01",
         geo %in% c("EA", "US")) %>%
  month_to_date %>%
  filter(date >= as.Date("2020-01-01")) %>%
  mutate(Geo = ifelse(geo == "EA", "Euro area HICP", "US Proxy-HICP")) %>%
  mutate(values = values/100) %>%
  ggplot(.) + geom_line(aes(x = date, y = values, color = Geo)) +
  theme_minimal() + xlab("") + ylab("Food Inflation (%)") +
  scale_x_date(breaks = seq.Date(as.Date("2019-12-01"), Sys.Date(), "3 months"),
               labels = date_format("%b %Y")) +
  scale_y_continuous(breaks = 0.01*seq(-20, 20, 1),
                     labels = percent_format(a = 1)) +
  scale_color_manual(values = c("#003399", "#B22234")) +
  theme(legend.position = c(0.25, 0.90),
        legend.title = element_blank(),
        axis.text.x = element_text(angle = 45, vjust = 1, hjust = 1)) +
  geom_text_repel(data = . %>% filter(date %in% c(max(date), as.Date("2022-06-01"),
                                                  as.Date("2022-10-01"))),
                  aes(x = date, y = values, label = percent(values, acc = 0.1)),
                  fontface ="plain", color = "black", size = 3) +
  geom_vline(xintercept = as.Date("2022-06-01"), linetype = "dotted") +
  geom_vline(xintercept = as.Date("2022-10-01"), linetype = "dotted")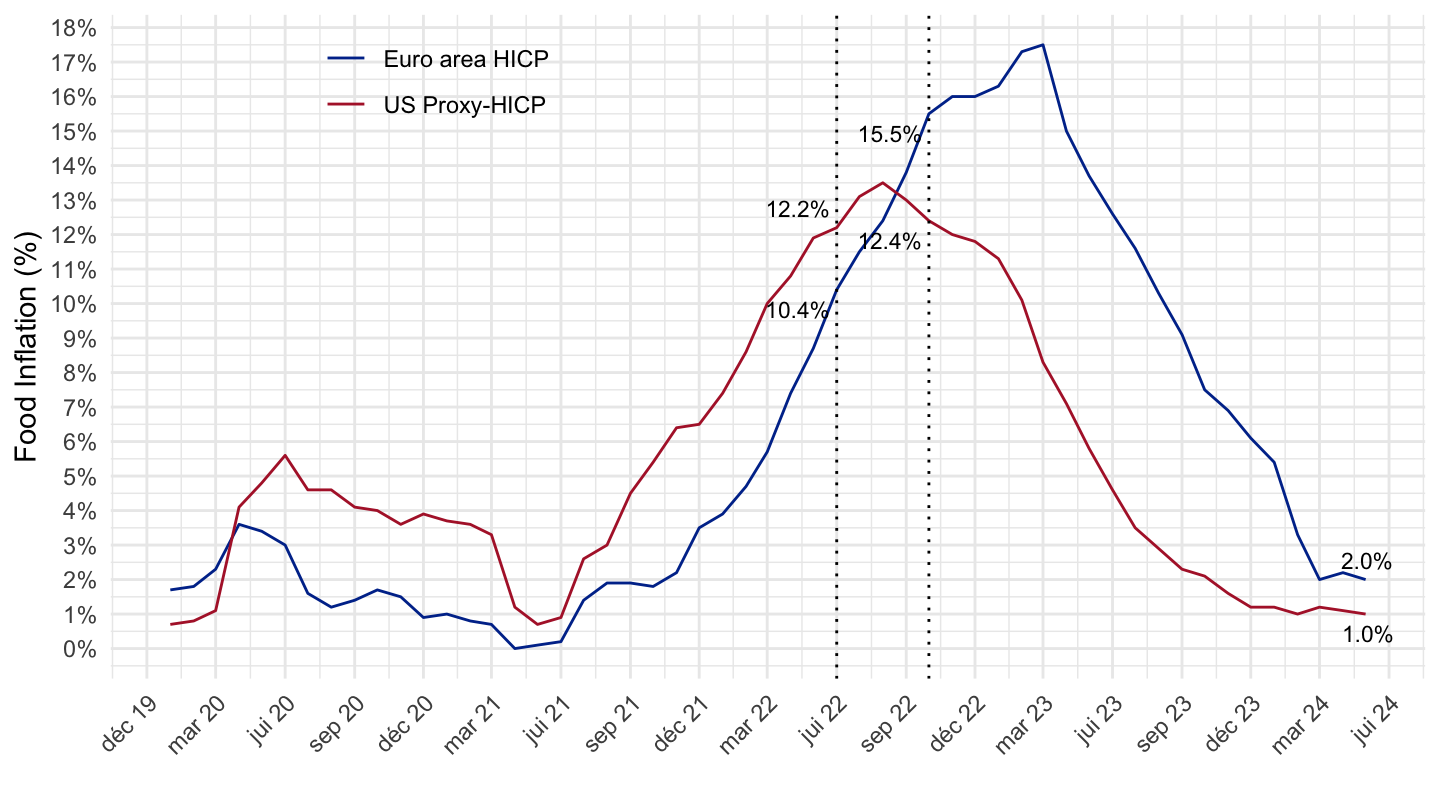
CP02 - Alcoholic beverages, tobacco and narcotics
Code
prc_hicp_manr %>%
  filter(coicop == "CP02",
         geo %in% c("EA20", "US")) %>%
  month_to_date %>%
  filter(date >= as.Date("2020-01-01")) %>%
  mutate(Geo = ifelse(geo == "EA20", "Euro area HICP", "US Proxy-HICP")) %>%
  mutate(values = values/100) %>%
  ggplot(.) + geom_line(aes(x = date, y = values, color = Geo)) +
  theme_minimal() + xlab("") + ylab("Food Inflation (%)") +
  scale_x_date(breaks = seq.Date(as.Date("2019-12-01"), as.Date("2100-01-01"), "3 months"),
               labels = date_format("%b %Y")) +
  scale_y_continuous(breaks = 0.01*seq(-20, 20, 1),
                     labels = percent_format(a = 1)) +
  scale_color_manual(values = c("#003399", "#B22234")) +
  theme(legend.position = c(0.25, 0.90),
        legend.title = element_blank(),
        axis.text.x = element_text(angle = 45, vjust = 1, hjust = 1)) +
  geom_text_repel(data = . %>% filter(date %in% c(max(date), as.Date("2022-06-01"),
                                                  as.Date("2022-10-01"))),
                  aes(x = date, y = values, label = percent(values, acc = 0.1)),
                  fontface ="plain", color = "black", size = 3) +
  geom_vline(xintercept = as.Date("2022-06-01"), linetype = "dotted") +
  geom_vline(xintercept = as.Date("2022-10-01"), linetype = "dotted")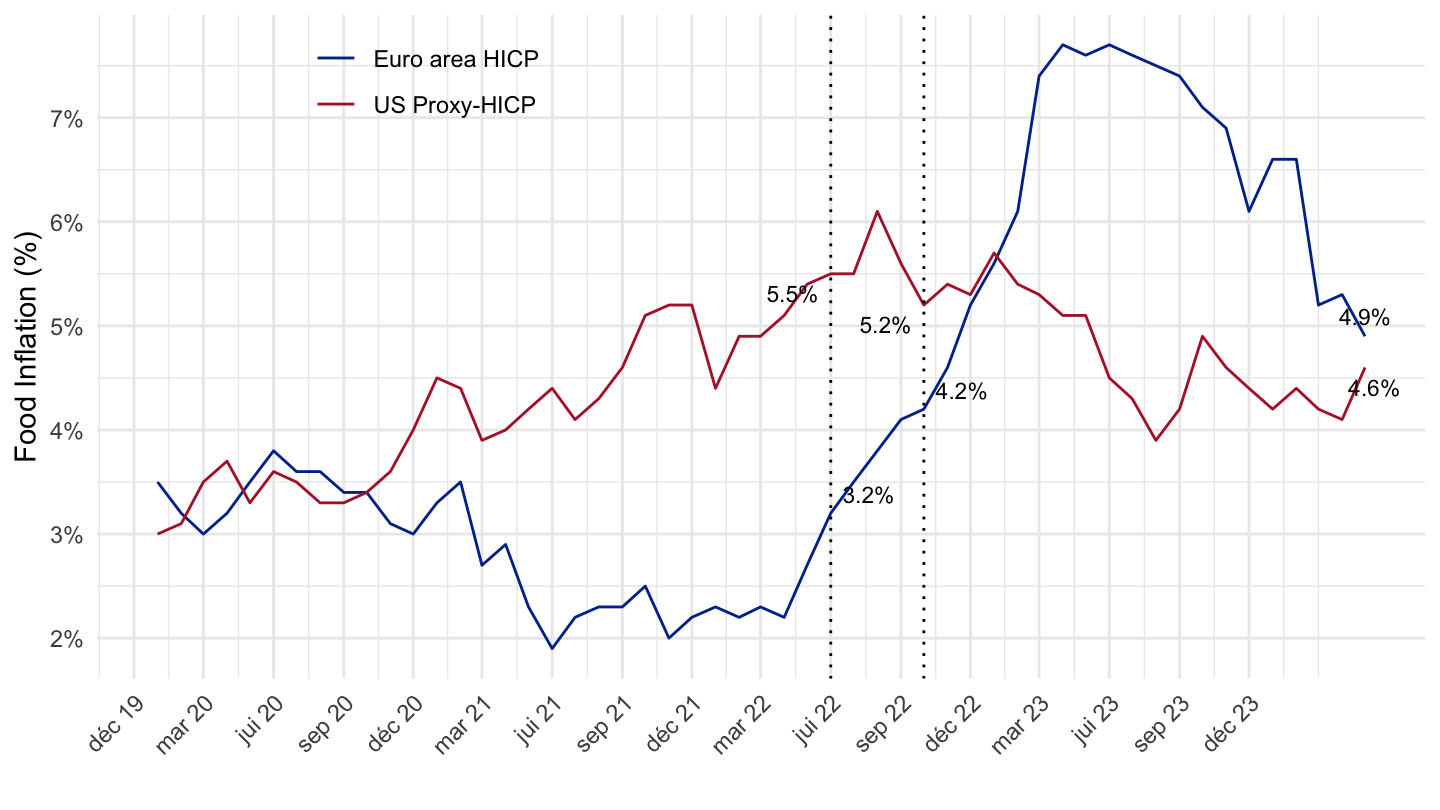
CP03 - Clothing and footwear
Code
prc_hicp_manr %>%
  filter(coicop == "CP03",
         geo %in% c("EA20", "US")) %>%
  month_to_date %>%
  filter(date >= as.Date("2020-01-01")) %>%
  mutate(Geo = ifelse(geo == "EA20", "Euro area HICP", "US Proxy-HICP")) %>%
  mutate(values = values/100) %>%
  ggplot(.) + geom_line(aes(x = date, y = values, color = Geo)) +
  theme_minimal() + xlab("") + ylab("Clothing and footwear Inflation (%)") +
  scale_x_date(breaks = seq.Date(as.Date("2019-12-01"), as.Date("2100-01-01"), "3 months"),
               labels = date_format("%b %Y")) +
  scale_y_continuous(breaks = 0.01*seq(-20, 20, 1),
                     labels = percent_format(a = 1)) +
  scale_color_manual(values = c("#003399", "#B22234")) +
  theme(legend.position = c(0.25, 0.90),
        legend.title = element_blank(),
        axis.text.x = element_text(angle = 45, vjust = 1, hjust = 1)) +
  geom_text_repel(data = . %>% filter(date %in% c(max(date), as.Date("2022-06-01"),
                                                  as.Date("2022-10-01"))),
                  aes(x = date, y = values, label = percent(values, acc = 0.1)),
                  fontface ="plain", color = "black", size = 3) +
  geom_vline(xintercept = as.Date("2022-06-01"), linetype = "dotted") +
  geom_vline(xintercept = as.Date("2022-10-01"), linetype = "dotted")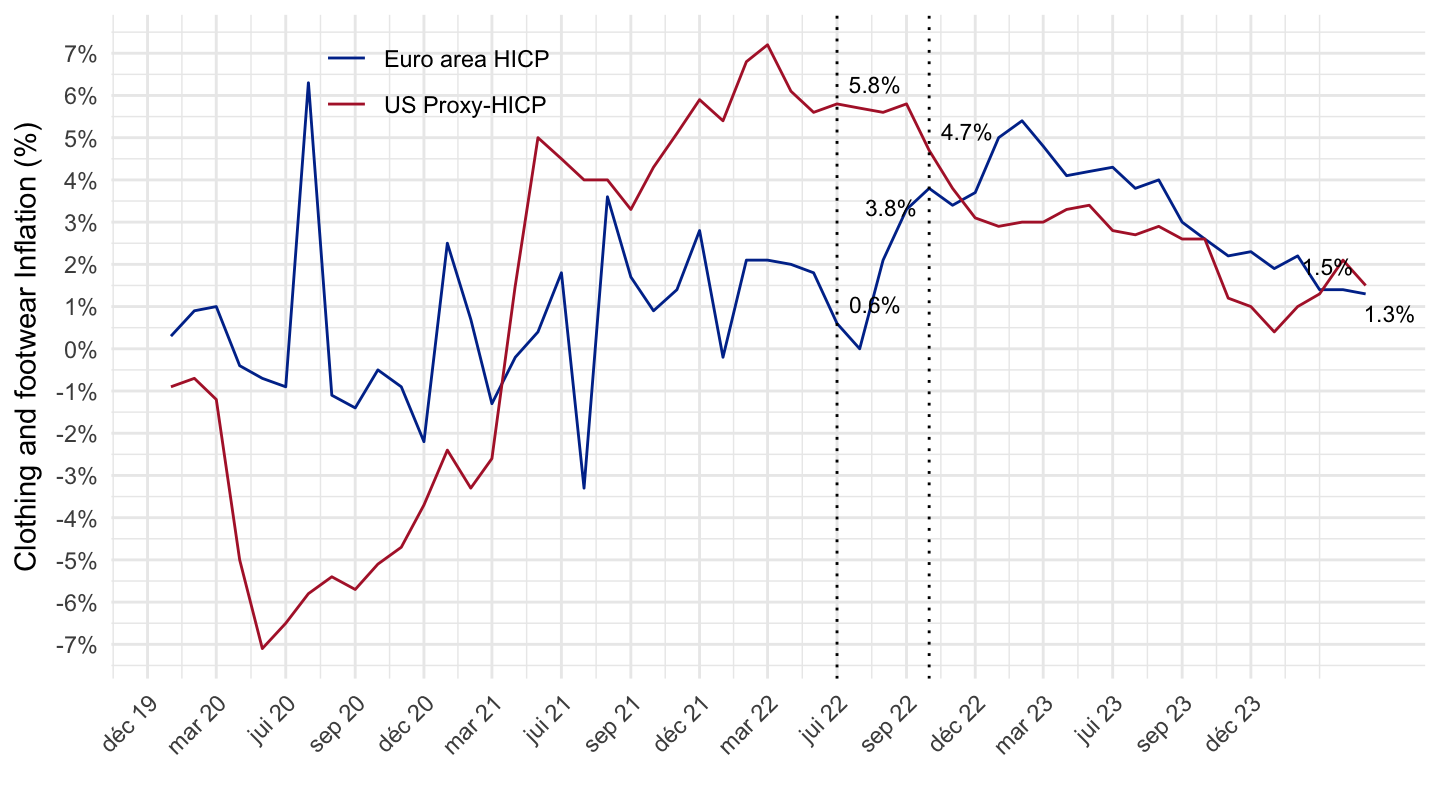
CP04 - Housing, water, electricity, gas and other fuels
Code
prc_hicp_manr %>%
  filter(coicop == "CP04",
         geo %in% c("EA20", "US")) %>%
  month_to_date %>%
  filter(date >= as.Date("2020-01-01")) %>%
  mutate(Geo = ifelse(geo == "EA20", "Euro area HICP", "US Proxy-HICP")) %>%
  mutate(values = values/100) %>%
  ggplot(.) + geom_line(aes(x = date, y = values, color = Geo)) +
  theme_minimal() + xlab("") + ylab("Housing, water, electricity, gas and other fuels (%)") +
  scale_x_date(breaks = seq.Date(as.Date("2019-12-01"), as.Date("2100-01-01"), "3 months"),
               labels = date_format("%b %Y")) +
  scale_y_continuous(breaks = 0.01*seq(-20, 50, 1),
                     labels = percent_format(a = 1)) +
  scale_color_manual(values = c("#003399", "#B22234")) +
  theme(legend.position = c(0.25, 0.90),
        legend.title = element_blank(),
        axis.text.x = element_text(angle = 45, vjust = 1, hjust = 1)) +
  geom_text_repel(data = . %>% filter(date %in% c(max(date), as.Date("2022-06-01"),
                                                  as.Date("2022-10-01"))),
                  aes(x = date, y = values, label = percent(values, acc = 0.1)),
                  fontface ="plain", color = "black", size = 3) +
  geom_vline(xintercept = as.Date("2022-06-01"), linetype = "dotted") +
  geom_vline(xintercept = as.Date("2022-10-01"), linetype = "dotted")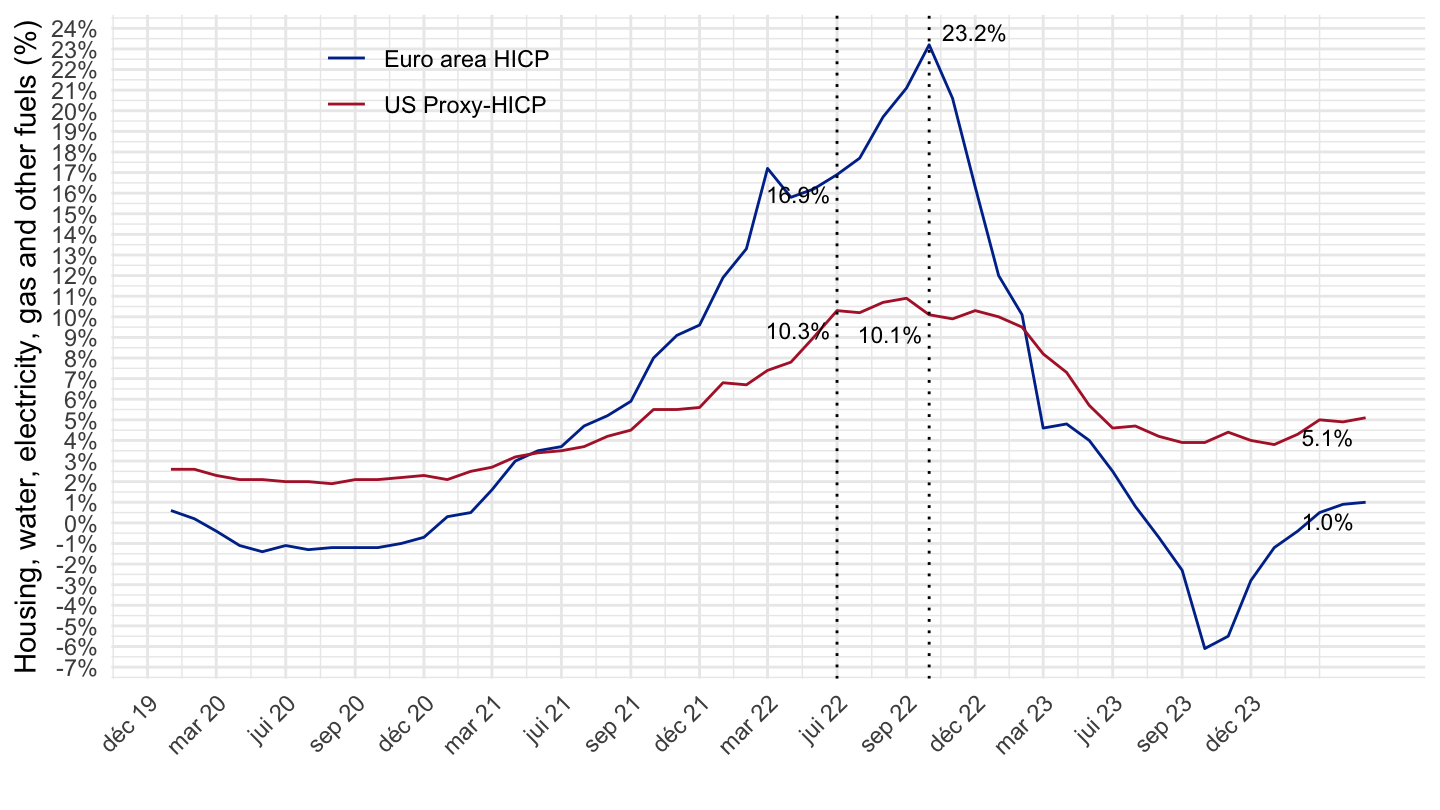
CP05 - Furnishings, household equipment and routine household maintenance
Code
prc_hicp_manr %>%
  filter(coicop == "CP05",
         geo %in% c("EA20", "US")) %>%
  month_to_date %>%
  filter(date >= as.Date("2020-01-01")) %>%
  mutate(Geo = ifelse(geo == "EA20", "Euro area HICP", "US Proxy-HICP")) %>%
  mutate(values = values/100) %>%
  ggplot(.) + geom_line(aes(x = date, y = values, color = Geo)) +
  theme_minimal() + xlab("") + ylab("Furnishings, household equipment Inflation (%)") +
  scale_x_date(breaks = seq.Date(as.Date("2019-12-01"), as.Date("2100-01-01"), "3 months"),
               labels = date_format("%b %Y")) +
  scale_y_continuous(breaks = 0.01*seq(-20, 50, 1),
                     labels = percent_format(a = 1)) +
  scale_color_manual(values = c("#003399", "#B22234")) +
  theme(legend.position = c(0.25, 0.90),
        legend.title = element_blank(),
        axis.text.x = element_text(angle = 45, vjust = 1, hjust = 1)) +
  geom_text_repel(data = . %>% filter(date %in% c(max(date), as.Date("2022-06-01"),
                                                  as.Date("2022-10-01"))),
                  aes(x = date, y = values, label = percent(values, acc = 0.1)),
                  fontface ="plain", color = "black", size = 3) +
  geom_vline(xintercept = as.Date("2022-06-01"), linetype = "dotted") +
  geom_vline(xintercept = as.Date("2022-10-01"), linetype = "dotted")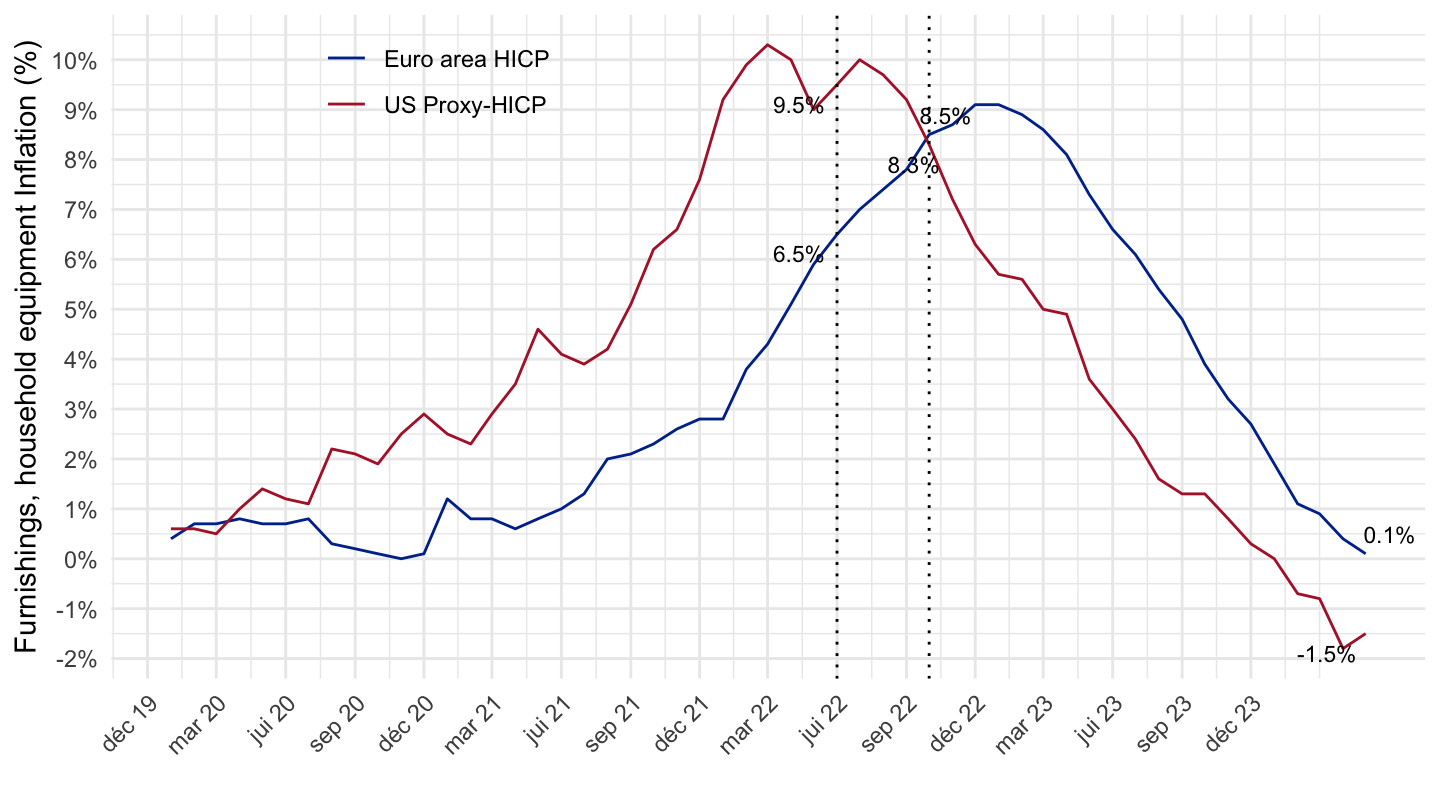
CP06 - Health
Code
prc_hicp_manr %>%
  filter(coicop == "CP06",
         geo %in% c("EA20", "US")) %>%
  month_to_date %>%
  filter(date >= as.Date("2020-01-01")) %>%
  mutate(Geo = ifelse(geo == "EA20", "Euro area HICP", "US Proxy-HICP")) %>%
  mutate(values = values/100) %>%
  ggplot(.) + geom_line(aes(x = date, y = values, color = Geo)) +
  theme_minimal() + xlab("") + ylab("Health Inflation (%)") +
  scale_x_date(breaks = seq.Date(as.Date("2019-12-01"), as.Date("2100-01-01"), "3 months"),
               labels = date_format("%b %Y")) +
  scale_y_continuous(breaks = 0.01*seq(-20, 50, 1),
                     labels = percent_format(a = 1)) +
  scale_color_manual(values = c("#003399", "#B22234")) +
  theme(legend.position = c(0.25, 0.90),
        legend.title = element_blank(),
        axis.text.x = element_text(angle = 45, vjust = 1, hjust = 1)) +
  geom_text_repel(data = . %>% filter(date %in% c(max(date), as.Date("2022-06-01"),
                                                  as.Date("2022-10-01"))),
                  aes(x = date, y = values, label = percent(values, acc = 0.1)),
                  fontface ="plain", color = "black", size = 3) +
  geom_vline(xintercept = as.Date("2022-06-01"), linetype = "dotted") +
  geom_vline(xintercept = as.Date("2022-10-01"), linetype = "dotted")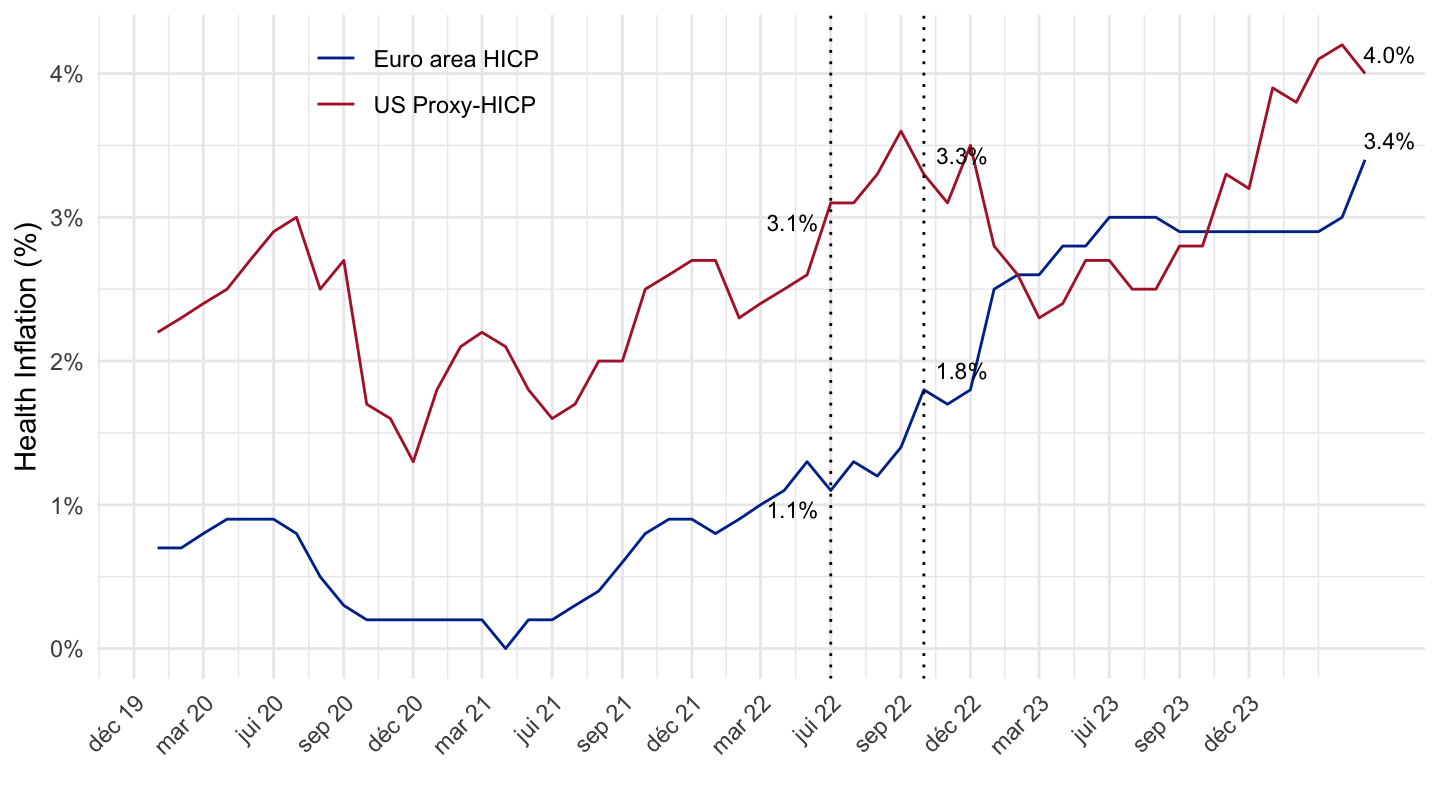
CP07 - Transport
Code
prc_hicp_manr %>%
  filter(coicop == "CP07",
         geo %in% c("EA20", "US")) %>%
  month_to_date %>%
  filter(date >= as.Date("2020-01-01")) %>%
  mutate(Geo = ifelse(geo == "EA20", "Euro area HICP", "US Proxy-HICP")) %>%
  mutate(values = values/100) %>%
  ggplot(.) + geom_line(aes(x = date, y = values, color = Geo)) +
  theme_minimal() + xlab("") + ylab("Transport Inflation (%)") +
  scale_x_date(breaks = seq.Date(as.Date("2019-12-01"), as.Date("2100-01-01"), "3 months"),
               labels = date_format("%b %Y")) +
  scale_y_continuous(breaks = 0.01*seq(-20, 50, 1),
                     labels = percent_format(a = 1)) +
  scale_color_manual(values = c("#003399", "#B22234")) +
  theme(legend.position = c(0.25, 0.90),
        legend.title = element_blank(),
        axis.text.x = element_text(angle = 45, vjust = 1, hjust = 1)) +
  geom_text_repel(data = . %>% filter(date %in% c(max(date), as.Date("2022-06-01"),
                                                  as.Date("2022-10-01"))),
                  aes(x = date, y = values, label = percent(values, acc = 0.1)),
                  fontface ="plain", color = "black", size = 3) +
  geom_vline(xintercept = as.Date("2022-06-01"), linetype = "dotted") +
  geom_vline(xintercept = as.Date("2022-10-01"), linetype = "dotted")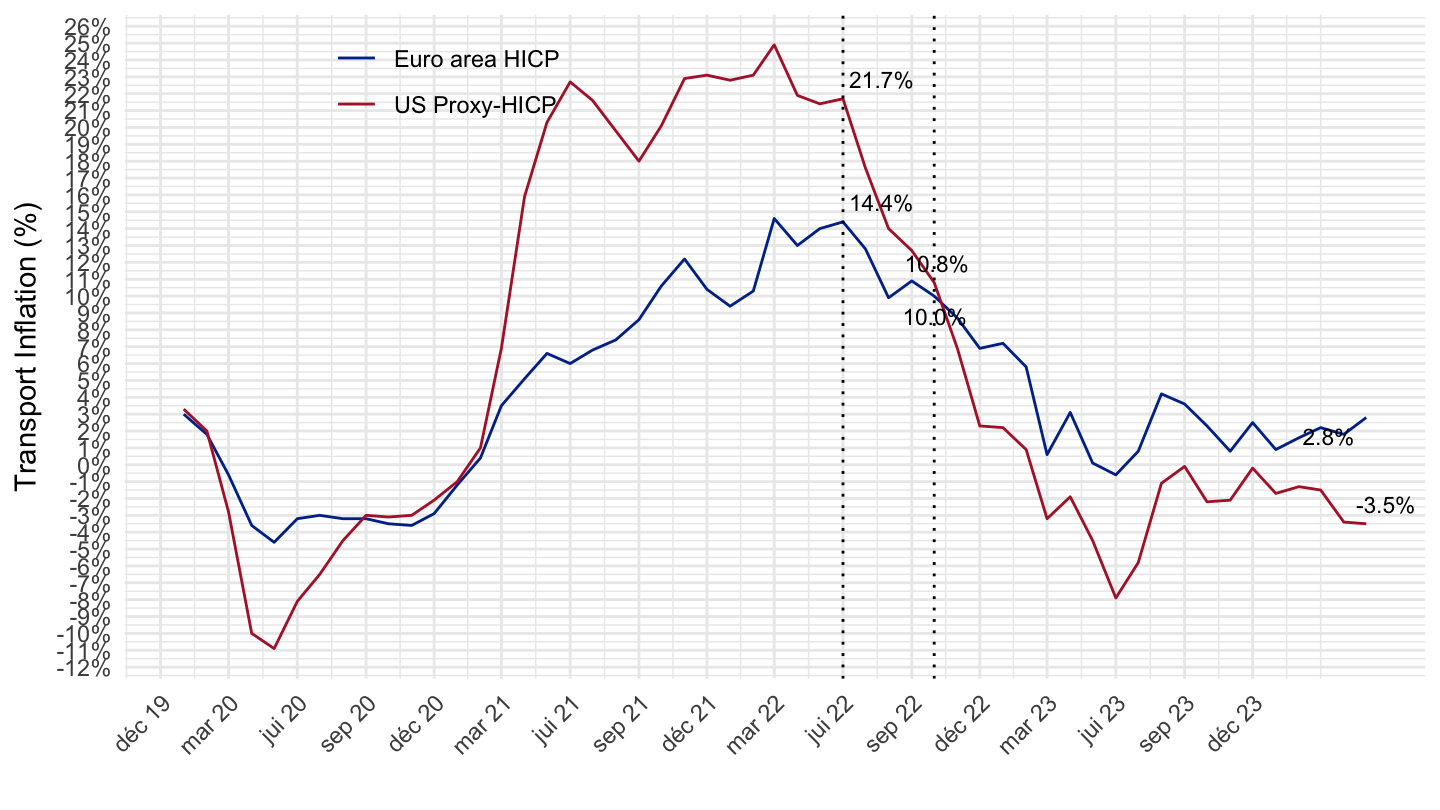
CP08 - Communications
Code
prc_hicp_manr %>%
  filter(coicop == "CP08",
         geo %in% c("EA20", "US")) %>%
  month_to_date %>%
  filter(date >= as.Date("2020-01-01")) %>%
  mutate(Geo = ifelse(geo == "EA20", "Euro area HICP", "US Proxy-HICP")) %>%
  mutate(values = values/100) %>%
  ggplot(.) + geom_line(aes(x = date, y = values, color = Geo)) +
  theme_minimal() + xlab("") + ylab("Inflation, Communications (%)") +
  scale_x_date(breaks = seq.Date(as.Date("2019-12-01"), as.Date("2100-01-01"), "3 months"),
               labels = date_format("%b %Y")) +
  scale_y_continuous(breaks = 0.01*seq(-20, 50, 1),
                     labels = percent_format(a = 1)) +
  scale_color_manual(values = c("#003399", "#B22234")) +
  theme(legend.position = c(0.25, 0.90),
        legend.title = element_blank(),
        axis.text.x = element_text(angle = 45, vjust = 1, hjust = 1)) +
  geom_text_repel(data = . %>% filter(date %in% c(max(date), as.Date("2022-06-01"),
                                                  as.Date("2022-10-01"))),
                  aes(x = date, y = values, label = percent(values, acc = 0.1)),
                  fontface ="plain", color = "black", size = 3)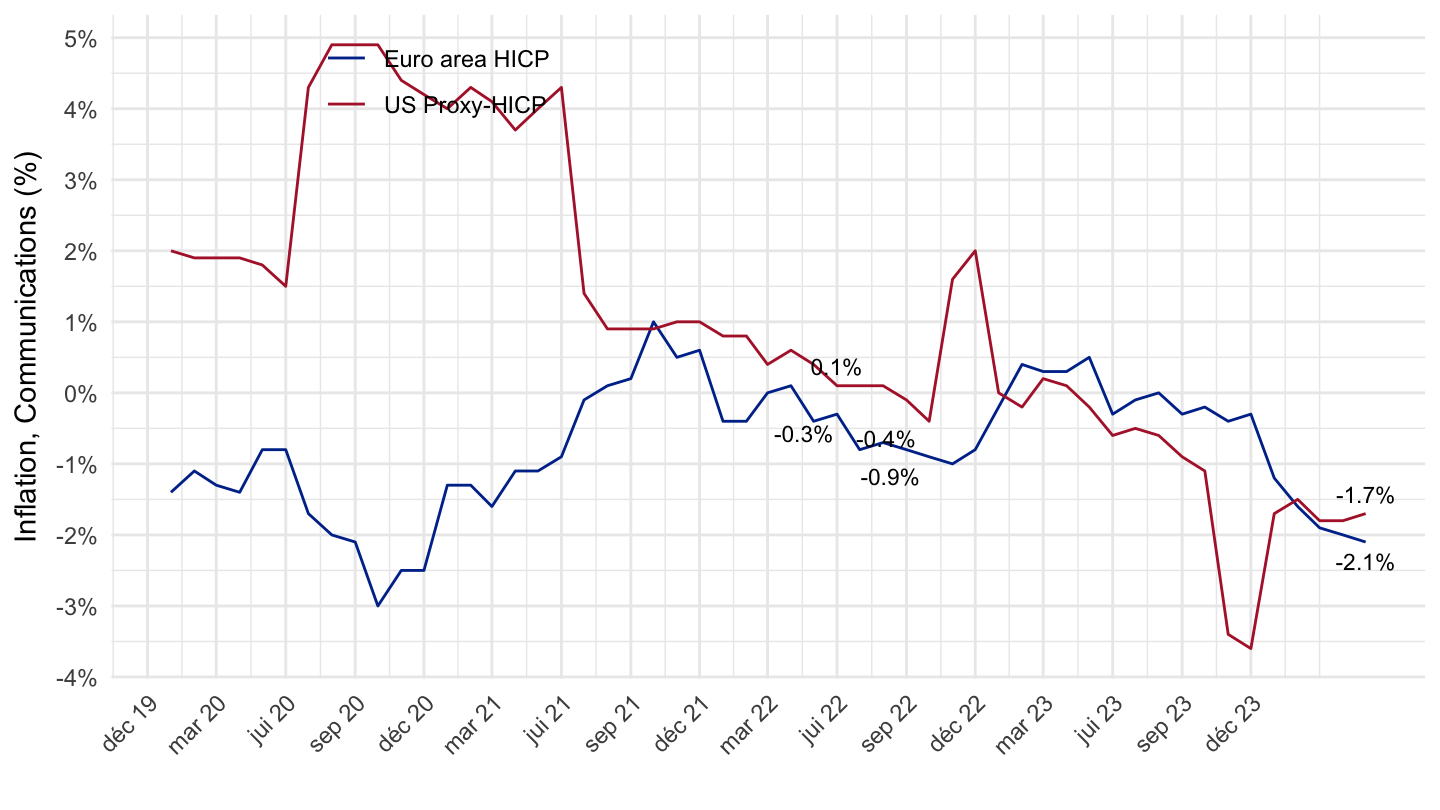
CP09 - Recreation and culture
Code
prc_hicp_manr %>%
  filter(coicop == "CP09",
         geo %in% c("EA20", "US")) %>%
  month_to_date %>%
  filter(date >= as.Date("2020-01-01")) %>%
  mutate(Geo = ifelse(geo == "EA20", "Euro area HICP", "US Proxy-HICP")) %>%
  mutate(values = values/100) %>%
  ggplot(.) + geom_line(aes(x = date, y = values, color = Geo)) +
  theme_minimal() + xlab("") + ylab("Inflation, Recreation and culture (%)") +
  scale_x_date(breaks = seq.Date(as.Date("2019-12-01"), as.Date("2100-01-01"), "3 months"),
               labels = date_format("%b %Y")) +
  scale_y_continuous(breaks = 0.01*seq(-20, 50, 1),
                     labels = percent_format(a = 1)) +
  scale_color_manual(values = c("#003399", "#B22234")) +
  theme(legend.position = c(0.25, 0.90),
        legend.title = element_blank(),
        axis.text.x = element_text(angle = 45, vjust = 1, hjust = 1)) +
  geom_text_repel(data = . %>% filter(date %in% c(max(date), as.Date("2022-06-01"),
                                                  as.Date("2022-10-01"))),
                  aes(x = date, y = values, label = percent(values, acc = 0.1)),
                  fontface ="plain", color = "black", size = 3) +
  geom_vline(xintercept = as.Date("2022-06-01"), linetype = "dotted") +
  geom_vline(xintercept = as.Date("2022-10-01"), linetype = "dotted")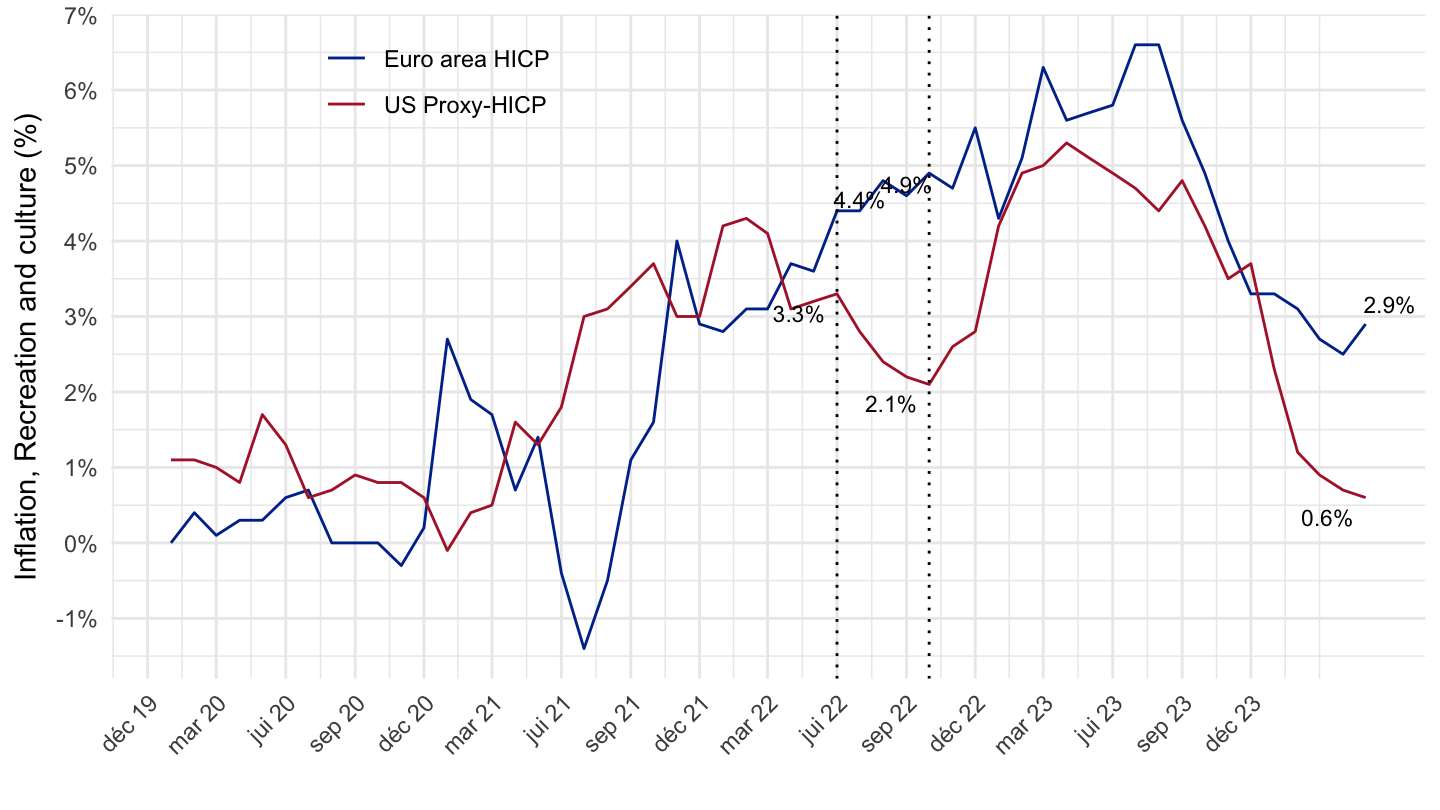
CP10 - Education
Code
prc_hicp_manr %>%
  filter(coicop == "CP10",
         geo %in% c("EA20", "US")) %>%
  month_to_date %>%
  filter(date >= as.Date("2020-01-01")) %>%
  mutate(Geo = ifelse(geo == "EA20", "Euro area HICP", "US Proxy-HICP")) %>%
  mutate(values = values/100) %>%
  ggplot(.) + geom_line(aes(x = date, y = values, color = Geo)) +
  theme_minimal() + xlab("") + ylab("Inflation, Education (%)") +
  scale_x_date(breaks = seq.Date(as.Date("2019-12-01"), as.Date("2100-01-01"), "3 months"),
               labels = date_format("%b %Y")) +
  scale_y_continuous(breaks = 0.01*seq(-20, 50, 1),
                     labels = percent_format(a = 1)) +
  scale_color_manual(values = c("#003399", "#B22234")) +
  theme(legend.position = c(0.25, 0.90),
        legend.title = element_blank(),
        axis.text.x = element_text(angle = 45, vjust = 1, hjust = 1)) +
  geom_text_repel(data = . %>% filter(date %in% c(max(date), as.Date("2022-06-01"),
                                                  as.Date("2022-10-01"))),
                  aes(x = date, y = values, label = percent(values, acc = 0.1)),
                  fontface ="plain", color = "black", size = 3) +
  geom_vline(xintercept = as.Date("2022-06-01"), linetype = "dotted") +
  geom_vline(xintercept = as.Date("2022-10-01"), linetype = "dotted")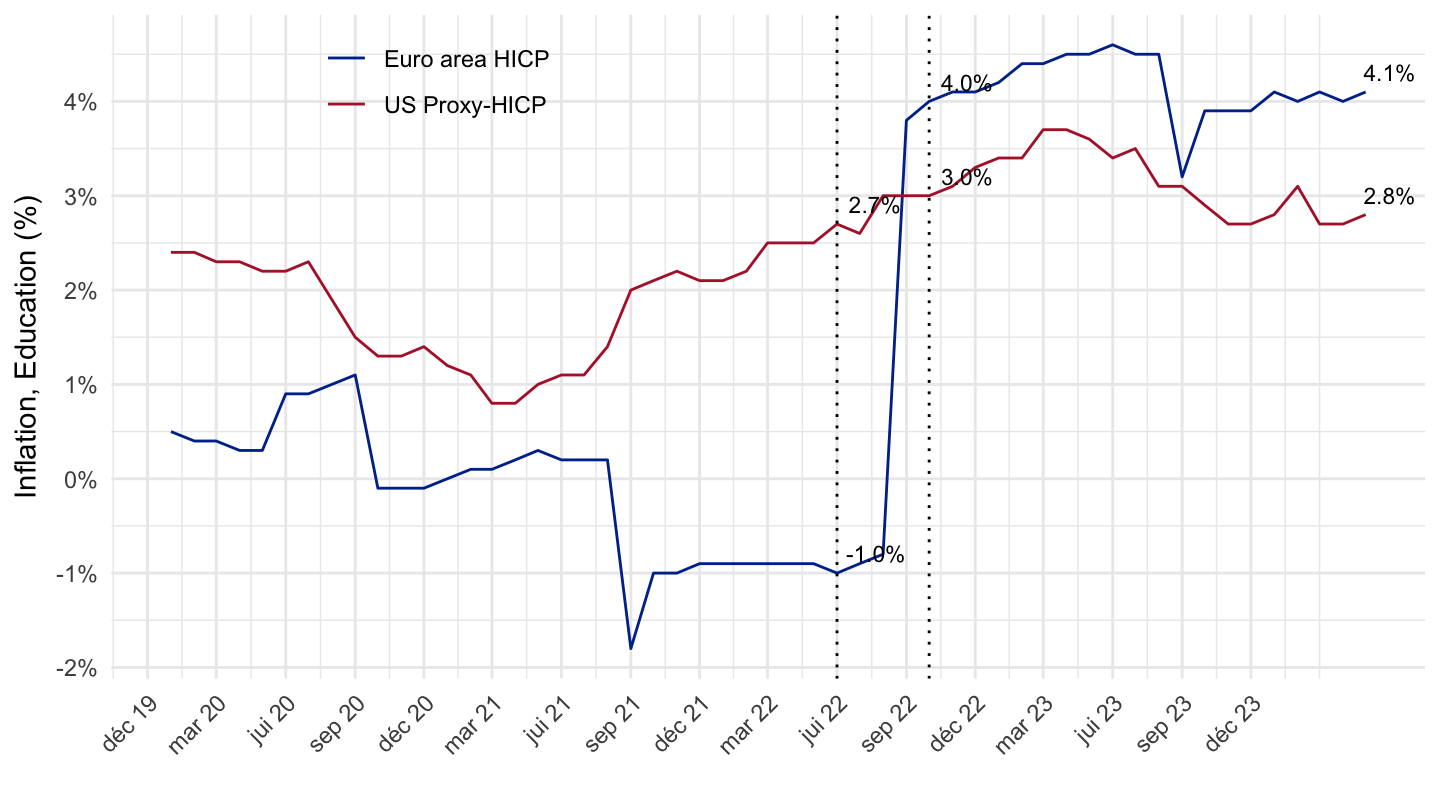
CP11 - Restaurants and hotels
Code
prc_hicp_manr %>%
  filter(coicop == "CP11",
         geo %in% c("EA20", "US")) %>%
  month_to_date %>%
  filter(date >= as.Date("2020-01-01")) %>%
  mutate(Geo = ifelse(geo == "EA20", "Euro area HICP", "US Proxy-HICP")) %>%
  mutate(values = values/100) %>%
  ggplot(.) + geom_line(aes(x = date, y = values, color = Geo)) +
  theme_minimal() + xlab("") + ylab("Inflation, Restaurants and hotels (%)") +
  scale_x_date(breaks = seq.Date(as.Date("2019-12-01"), as.Date("2100-01-01"), "3 months"),
               labels = date_format("%b %Y")) +
  scale_y_continuous(breaks = 0.01*seq(-20, 50, 1),
                     labels = percent_format(a = 1)) +
  scale_color_manual(values = c("#003399", "#B22234")) +
  theme(legend.position = c(0.25, 0.90),
        legend.title = element_blank(),
        axis.text.x = element_text(angle = 45, vjust = 1, hjust = 1)) +
  geom_text_repel(data = . %>% filter(date %in% c(max(date), as.Date("2022-06-01"),
                                                  as.Date("2022-10-01"))),
                  aes(x = date, y = values, label = percent(values, acc = 0.1)),
                  fontface ="plain", color = "black", size = 3) +
  geom_vline(xintercept = as.Date("2022-06-01"), linetype = "dotted") +
  geom_vline(xintercept = as.Date("2022-10-01"), linetype = "dotted")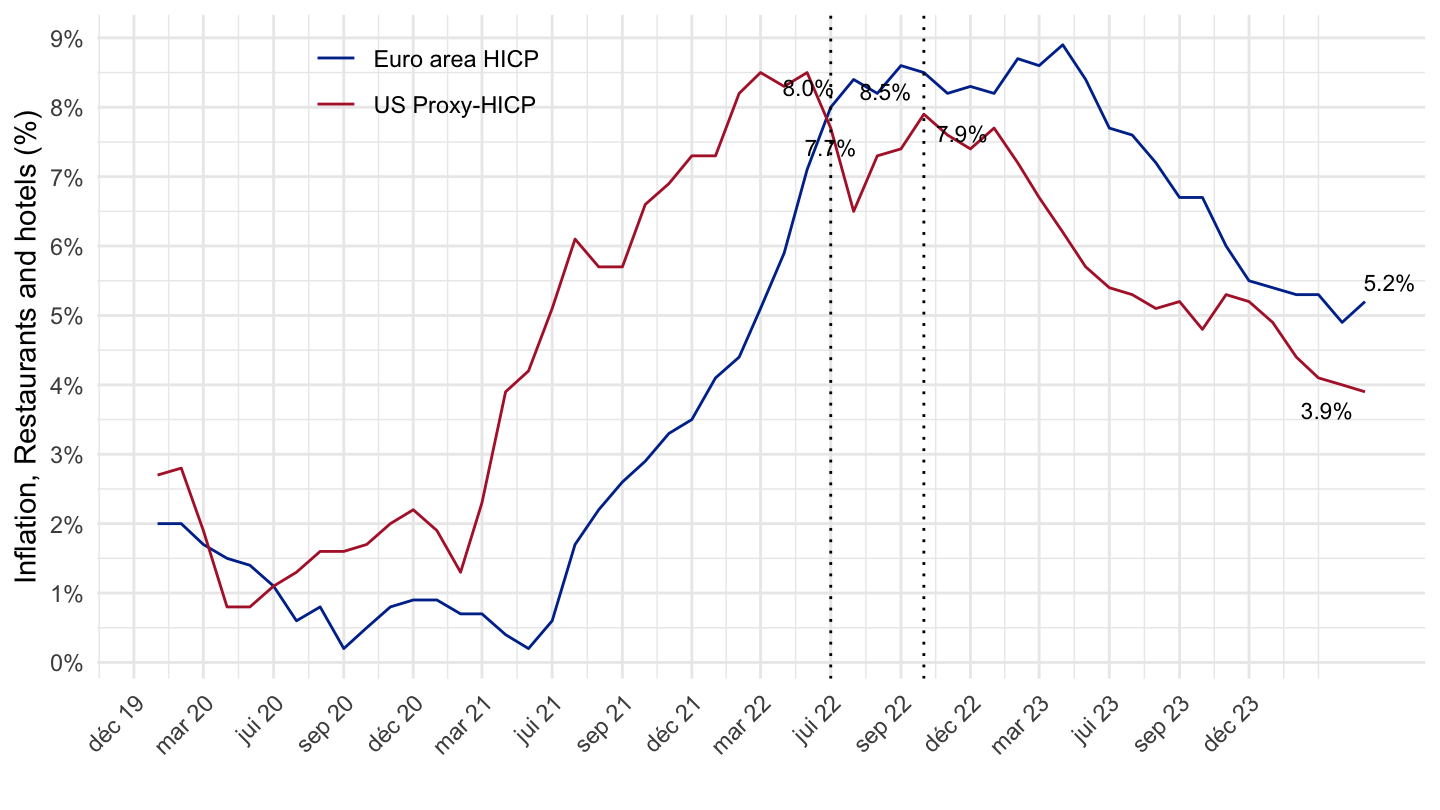
CP12 - Miscellaneous goods and services
Code
prc_hicp_manr %>%
  filter(coicop == "CP12",
         geo %in% c("EA20", "US")) %>%
  month_to_date %>%
  filter(date >= as.Date("2020-01-01")) %>%
  mutate(Geo = ifelse(geo == "EA20", "Euro area HICP", "US Proxy-HICP")) %>%
  mutate(values = values/100) %>%
  ggplot(.) + geom_line(aes(x = date, y = values, color = Geo)) +
  theme_minimal() + xlab("") + ylab("Inflation, Miscellaneous goods and services (%)") +
  scale_x_date(breaks = seq.Date(as.Date("2019-12-01"), as.Date("2100-01-01"), "3 months"),
               labels = date_format("%b %Y")) +
  scale_y_continuous(breaks = 0.01*seq(-20, 50, 1),
                     labels = percent_format(a = 1)) +
  scale_color_manual(values = c("#003399", "#B22234")) +
  theme(legend.position = c(0.25, 0.90),
        legend.title = element_blank(),
        axis.text.x = element_text(angle = 45, vjust = 1, hjust = 1)) +
  geom_text_repel(data = . %>% filter(date %in% c(max(date), as.Date("2022-06-01"),
                                                  as.Date("2022-10-01"))),
                  aes(x = date, y = values, label = percent(values, acc = 0.1)),
                  fontface ="plain", color = "black", size = 3) +
  geom_vline(xintercept = as.Date("2022-06-01"), linetype = "dotted") +
  geom_vline(xintercept = as.Date("2022-10-01"), linetype = "dotted")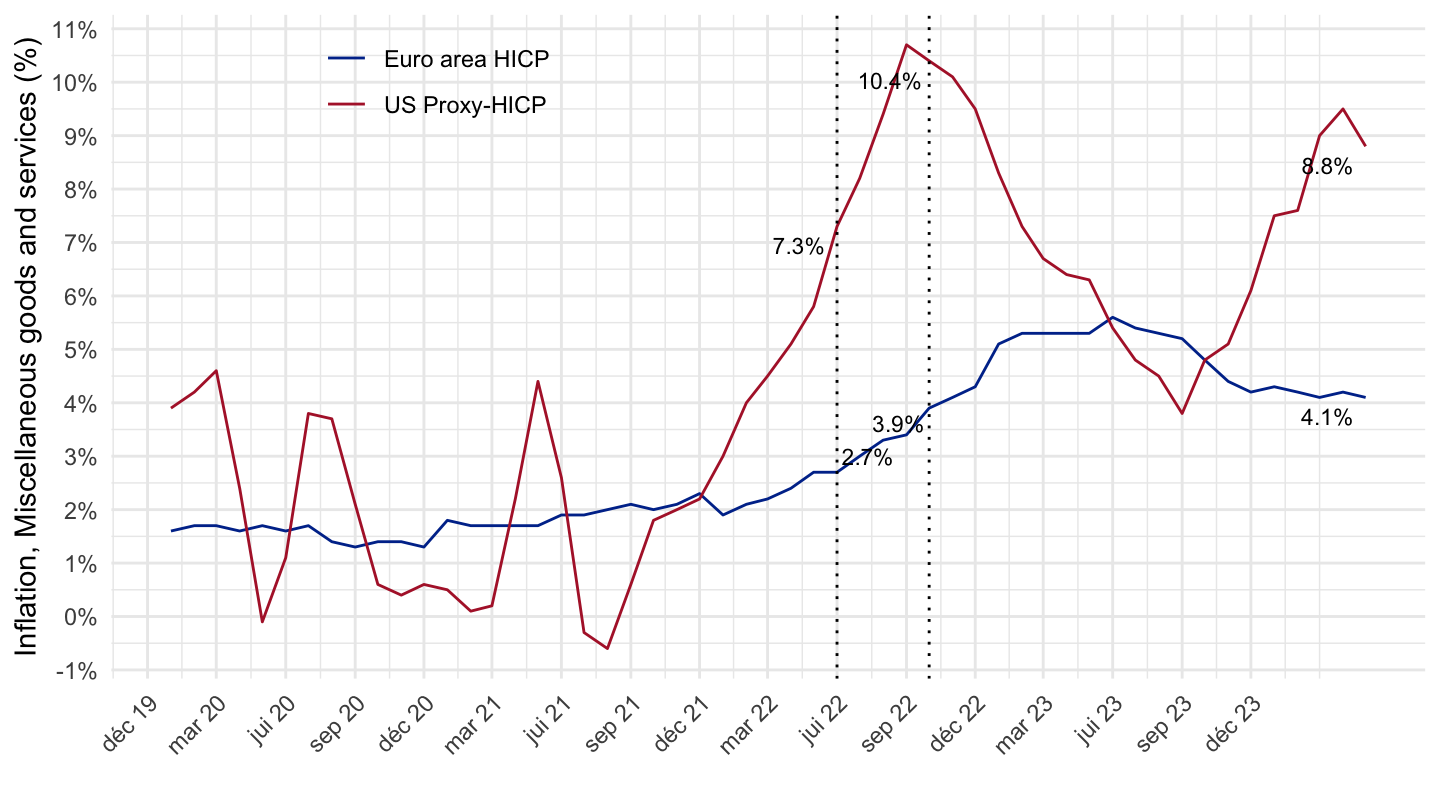
CP00
2 years
Code
prc_hicp_manr %>%
  filter(coicop == "CP00",
         geo %in% c("EA20", "US")) %>%
  month_to_date %>%
  filter(date >= max(date) - years(2)) %>%
  left_join(geo, by = "geo") %>%
  mutate(Geo = ifelse(geo == "EA20", "Europe", Geo)) %>%
  left_join(colors, by = c("Geo" = "country")) %>%
  mutate(color = ifelse(geo == "US", color2, color)) %>%
  mutate(values = values/100) %>%
  ggplot(.) + geom_line(aes(x = date, y = values, color = color)) +
  theme_minimal() + xlab("") + ylab("") +
  scale_x_date(breaks = seq.Date(as.Date("2019-12-01"), as.Date("2100-01-01"), "1 month"),
               labels = date_format("%b %Y")) +
  scale_y_continuous(breaks = 0.01*seq(-20, 20, 1),
                     labels = percent_format(a = 1)) +
  scale_color_identity() + add_2flags +
  theme(legend.position = c(0.75, 0.90),
        legend.title = element_blank(),
        axis.text.x = element_text(angle = 45, vjust = 1, hjust = 1))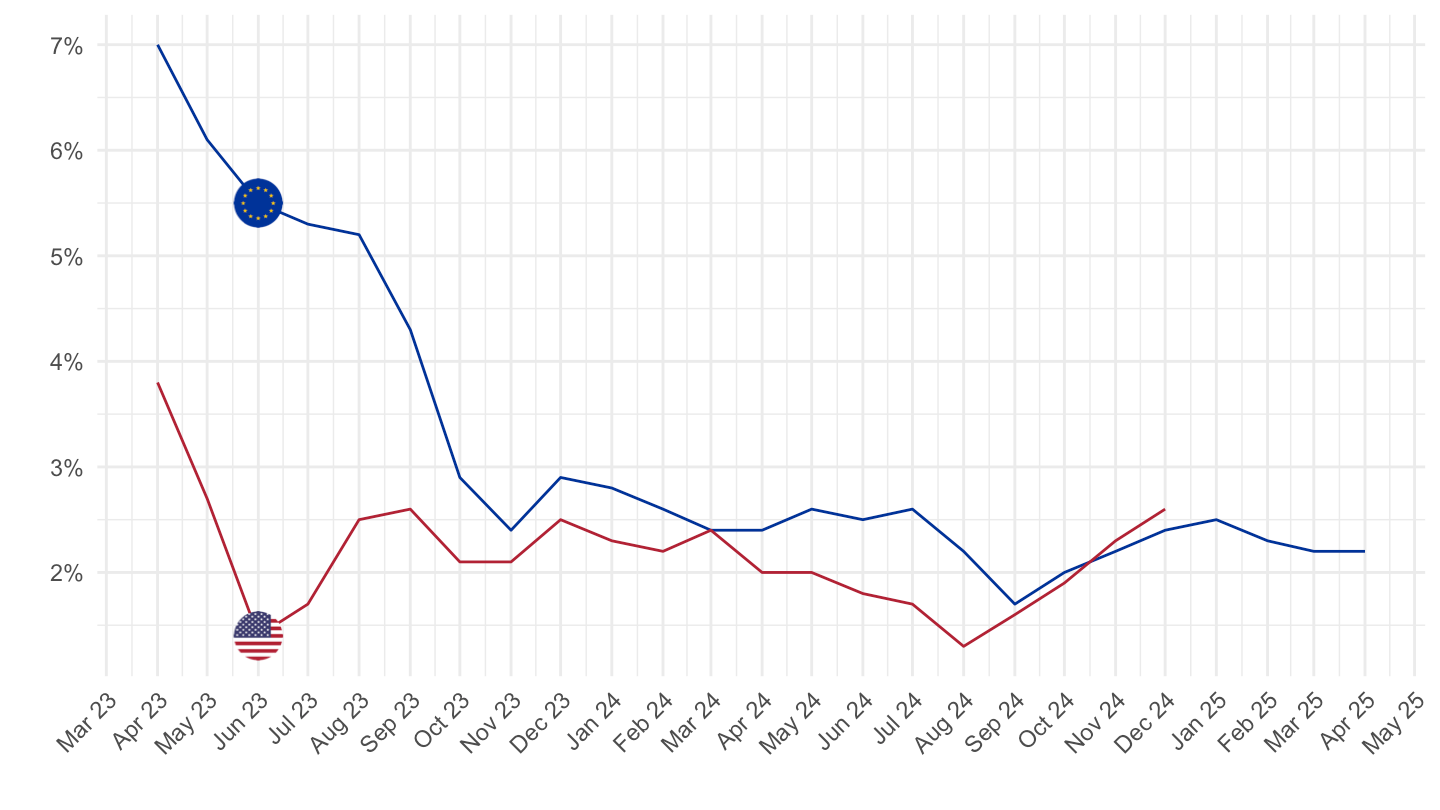
Mean of Inflation
All - Unweighted
Code
eurozone_countries <- c("Austria", "Belgium", "Cyprus", "Estonia", "Finland",
                        "France", "Germany", "Greece", "Ireland", "Italy",
                        "Latvia", "Lithuania", "Luxembourg", "Malta", "Netherlands",
                        "Portugal", "Slovakia", "Slovenia", "Spain", "Euro area - 19 countries  (from 2015)")

CEEC_countries <- c("Bulgaria", "Czech Republic", "Estonia", "Hungary", "Lithuania",
                    "Latvia", "Poland", "Romania", "Slovenia", "Slovakia")

prc_hicp_manr_2022M09 <- prc_hicp_manr %>%
  filter(time == "2022M09",
         coicop == "CP00") %>%
  left_join(geo, by = "geo") %>%
  select(Geo, inflation_2022M09 = values)

prc_hicp_manr_2022M10 <- prc_hicp_manr %>%
  filter(time == "2022M10",
         coicop == "CP00") %>%
  left_join(geo, by = "geo") %>%
  select(Geo, inflation_2022M10 = values)

prc_hicp_manr_2022M09_Energy <- prc_hicp_manr %>%
  filter(time == "2022M09",
         coicop == "NRG") %>%
  left_join(geo, by = "geo") %>%
  select(Geo, inflation_2022M09_NRG = values)

prc_hicp_manr_2022M10_Energy <- prc_hicp_manr %>%
  filter(time == "2022M10",
         coicop == "NRG") %>%
  left_join(geo, by = "geo") %>%
  select(Geo, inflation_2022M10_NRG = values)


coicop <- tibble(coicop = "CP00", Coicop = "Headline inflation") %>%
  add_row(coicop = "TOT_X_NRG_FOOD", Coicop = "Core inflation")
prc_hicp_manr %>%
  filter(coicop %in% c("TOT_X_NRG_FOOD", "CP00"),
         geo %in% geos_EA_20) %>%
  month_to_date %>%
  group_by(coicop, date) %>%
  summarise(Nobs = n(),
            values = mean(values)) %>%
  mutate(values = values/100) %>%
  left_join(coicop, by = "coicop") %>%
  ggplot(.) + geom_line(aes(x = date, y = values, color = Coicop, linetype = Coicop)) +
  theme_minimal() + xlab("") + ylab("Standard Deviation, Unweighted, EA-20 (%)") +
  scale_x_date(breaks = seq(1960, 2100, 2) %>% paste0("-01-01") %>% as.Date,
               labels = date_format("%Y")) +
  scale_color_manual(values = c("#1E1C1C", "#A81630")) +
  scale_y_continuous(breaks = 0.01*seq(-20, 20, 1),
                     labels = percent_format(a = 1)) +
  theme(legend.position = c(0.55, 0.90),
        legend.title = element_blank())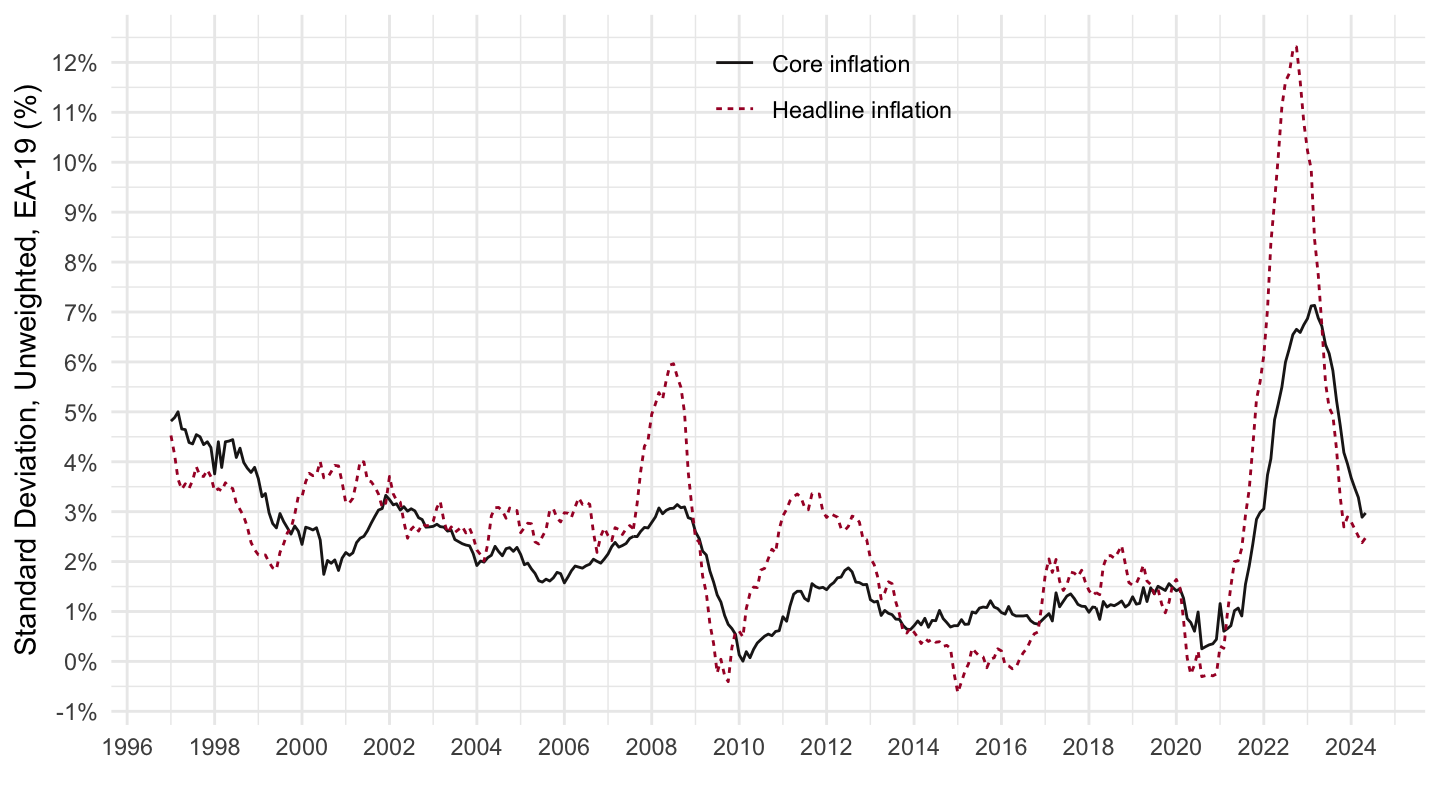
All - Weighted
Core, Headline
Code
prc_hicp_manr %>%
  filter(coicop %in% c("TOT_X_NRG_FOOD", "CP00"),
         geo %in% geos_EA_20) %>%
  mutate(year = substr(time, 1, 4)) %>%
  left_join(prc_hicp_cow %>%
              filter(statinfo == "COWEA20", geo != "EA20") %>%
              transmute(geo, year = time, country_weights = values/1000),
            by = c("geo", "year")) %>%
  month_to_date %>%
  group_by(coicop, date) %>%
  summarise(values = sum(values*country_weights/100)) %>%
  left_join(coicop, by = "coicop") %>%
  ggplot(.) + geom_line(aes(x = date, y = values, color = Coicop, linetype = Coicop)) +
  theme_minimal() + xlab("") + ylab("Standard Deviation of Inflation, Weighted, EA-20 (%)") +
  scale_x_date(breaks = seq(1960, 2100, 2) %>% paste0("-01-01") %>% as.Date,
               labels = date_format("%Y")) +
  scale_color_manual(values = c("#1E1C1C", "#A81630")) +
  scale_y_continuous(breaks = 0.01*seq(-20, 20, 1),
                     labels = percent_format(a = 1)) +
  theme(legend.position = c(0.55, 0.90),
        legend.title = element_blank())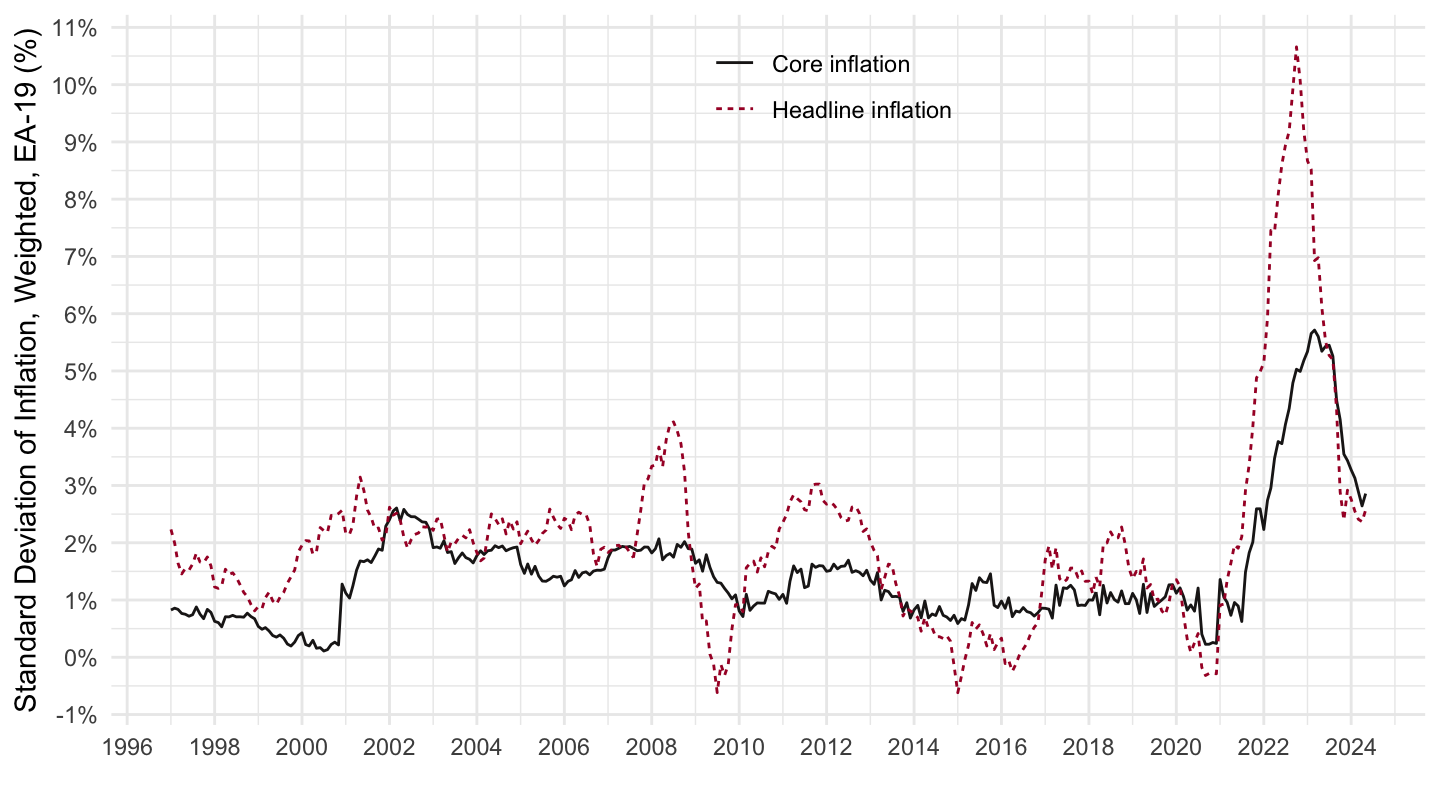
CP01, CP02, CP03, CP04
Code
load_data("eurostat/coicop.RData")
prc_hicp_manr %>%
  filter(coicop %in% c("CP01", "CP02", "CP03", "CP04"),
         geo %in% geos_EA_20) %>%
  mutate(year = substr(time, 1, 4)) %>%
  left_join(prc_hicp_cow %>%
              filter(statinfo == "COWEA20", geo != "EA20") %>%
              transmute(geo, year = time, country_weights = values/1000),
            by = c("geo", "year")) %>%
  month_to_date %>%
  group_by(coicop, date) %>%
  summarise(values = sum(values*country_weights/100)) %>%
  left_join(coicop, by = "coicop") %>%
  ggplot(.) + geom_line(aes(x = date, y = values, color = Coicop)) +
  theme_minimal() + xlab("") + ylab("Standard Deviation of Inflation, Weighted, EA-20 (%)") +
  scale_x_date(breaks = seq(1960, 2100, 2) %>% paste0("-01-01") %>% as.Date,
               labels = date_format("%Y")) +
  scale_y_continuous(breaks = 0.01*seq(-20, 20, 1),
                     labels = percent_format(a = 1)) +
  theme(legend.position = c(0.55, 0.90),
        legend.title = element_blank())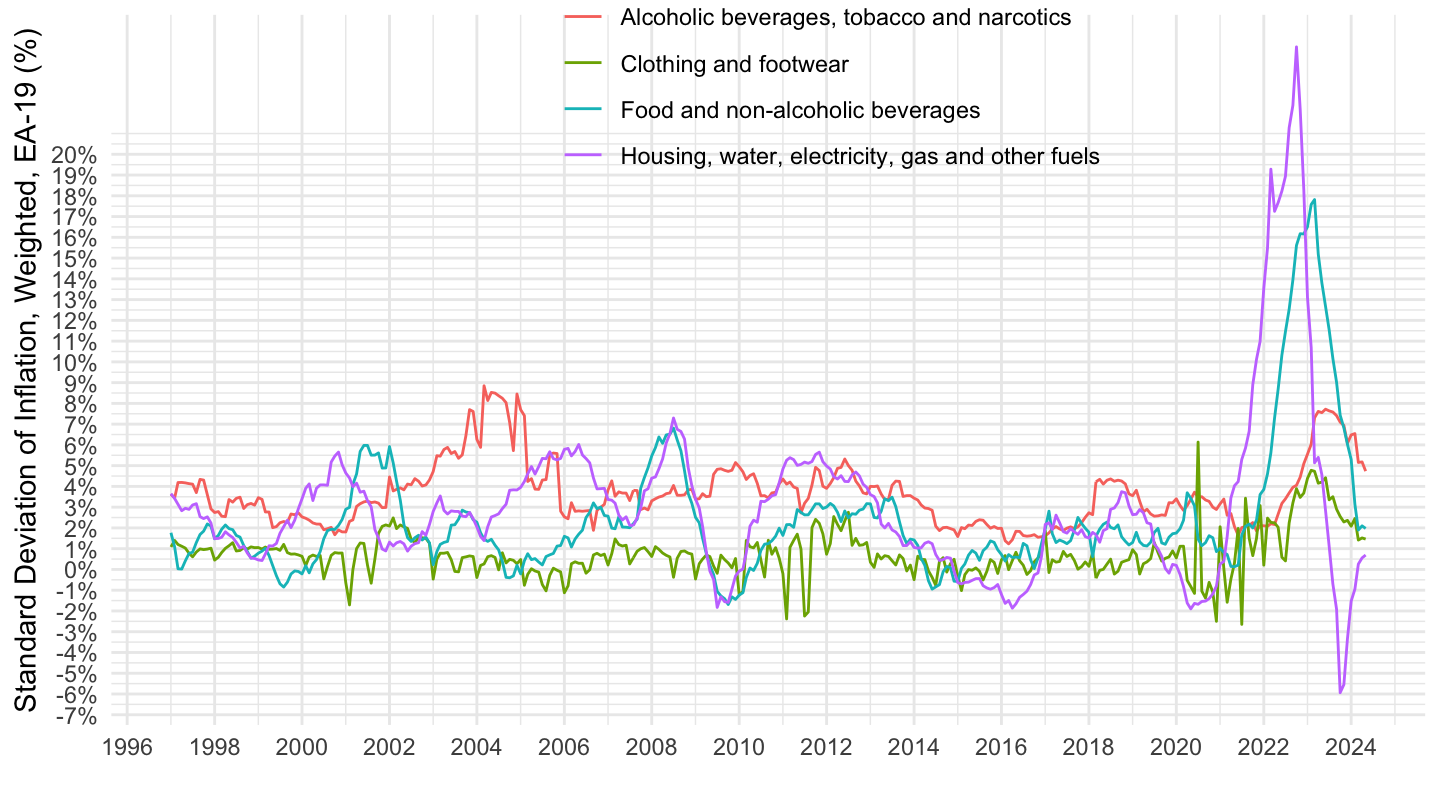
All - Weighted, Unweighted
Code
prc_hicp_manr %>%
  filter(coicop %in% c("TOT_X_NRG_FOOD", "CP00"),
         geo %in% geos_EA_20) %>%
  mutate(year = substr(time, 1, 4)) %>%
  left_join(prc_hicp_cow %>%
              filter(statinfo == "COWEA20", geo != "EA20") %>%
              transmute(geo, year = time, country_weights = values),
            by = c("geo", "year")) %>%
  month_to_date %>%
  group_by(coicop, date) %>%
  summarise(`Unweighted` = mean(values/100),
            `Weighted` = Hmisc::wtd.mean(values/100, country_weights)) %>%
  gather(weighted_yes_no, values, -date, -coicop) %>%
  arrange(desc(date)) %>%
  left_join(coicop, by = "coicop") %>%
  ggplot(.) + geom_line(aes(x = date, y = values, color = Coicop, linetype = weighted_yes_no)) +
  theme_minimal() + xlab("") + ylab("Mean Inflation, EA-20 (%)") +
  scale_x_date(breaks = seq(1960, 2100, 2) %>% paste0("-01-01") %>% as.Date,
               labels = date_format("%Y")) +
  scale_color_manual(values = c("#1E1C1C", "#A81630")) +
  scale_linetype_manual(values = c("dashed", "solid")) +
  scale_y_continuous(breaks = 0.01*seq(-20, 20, 1),
                     labels = percent_format(a = 1)) +
  theme(legend.position = c(0.4, 0.80),
        legend.title = element_blank())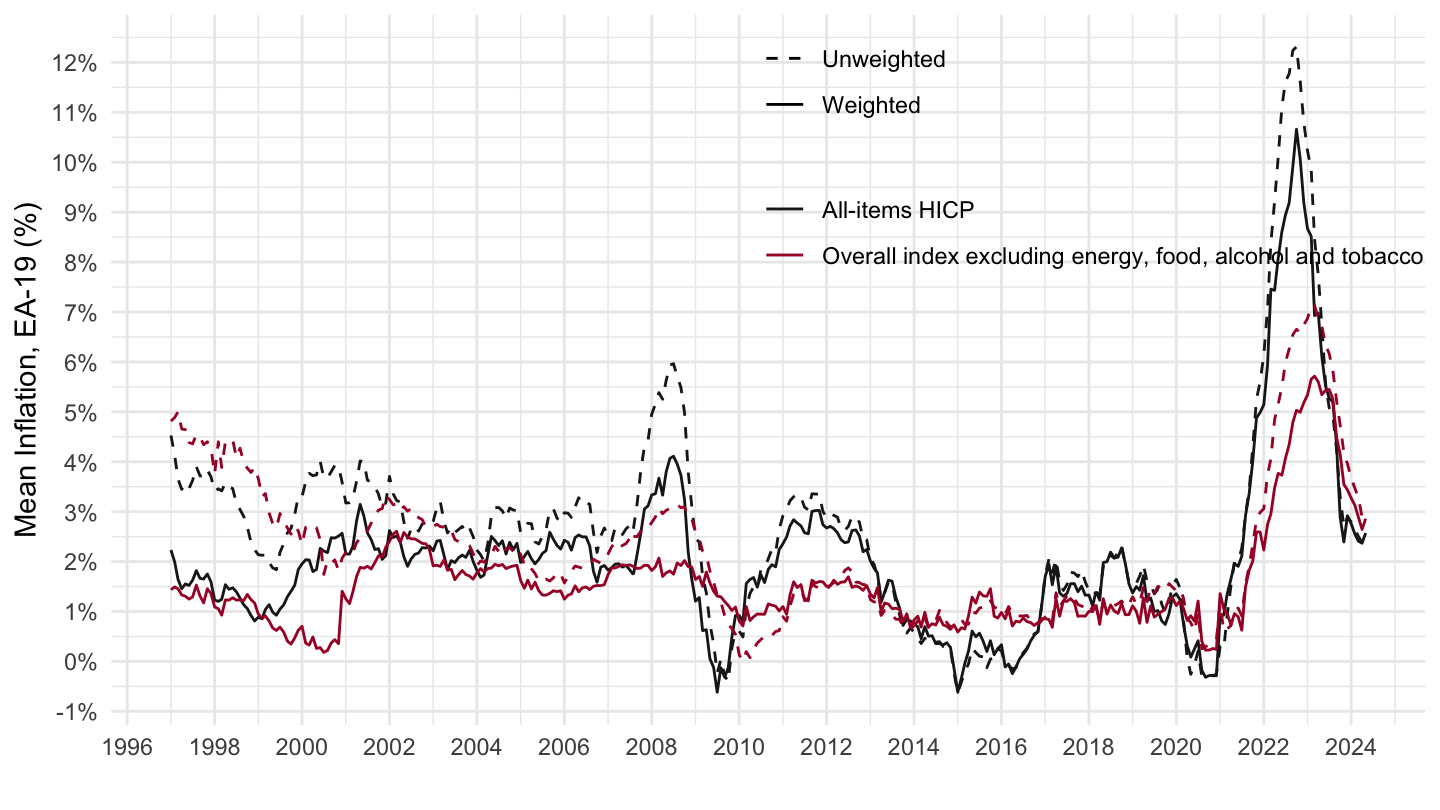
Compare: Standard Deviation, IQR max minus min
All - Unweighted
HICP Inflation
Code
prc_hicp_manr %>%
  filter(coicop %in% c("CP00"),
         geo %in% geos_EA_20) %>%
  month_to_date %>%
  group_by(date) %>%
  filter(n() == 19) %>%
  summarise(`Standard Deviation` = sd(values/100),
            `Interquartile Range (IQR)` = quantile(values/100, 0.75)-quantile(values/100, 0.25)) %>%
  gather(Variable, values, -date) %>%
  ggplot(.) + geom_line(aes(x = date, y = values, color = Variable, linetype = Variable)) +
  theme_minimal() + xlab("") + ylab("HICP Inflation, Std, IQR, Unweighted, EA-20 (%)") +
  scale_x_date(breaks = seq(1960, 2100, 2) %>% paste0("-01-01") %>% as.Date,
               labels = date_format("%Y")) +
  scale_color_manual(values = c("#1E1C1C", "#A81630", "#003399")) +
  scale_y_continuous(breaks = 0.01*seq(-20, 20, 1),
                     labels = percent_format(a = 1)) +
  theme(legend.position = c(0.7, 0.90),
        legend.title = element_blank())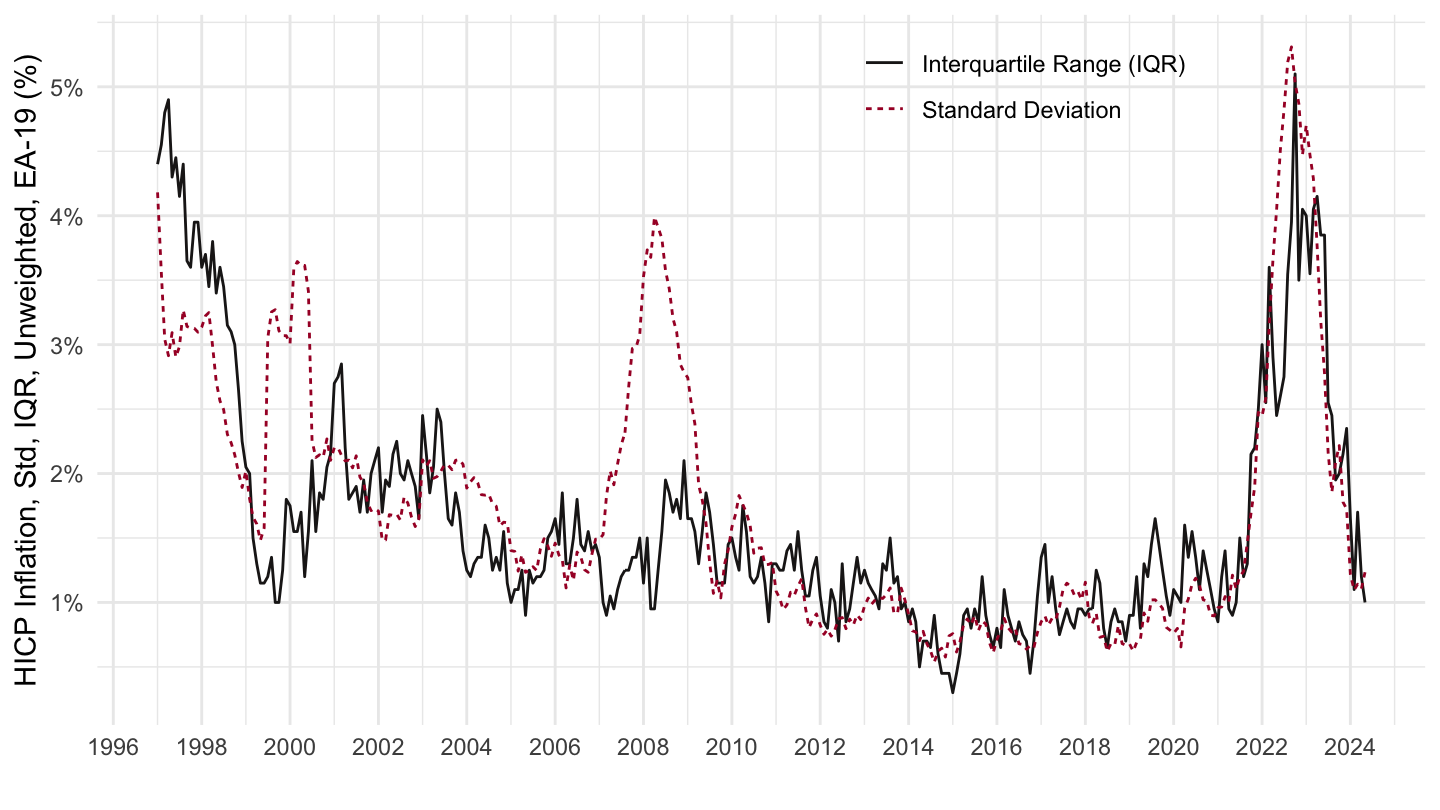
Core Inflation
Code
prc_hicp_manr %>%
  filter(coicop %in% c("TOT_X_NRG_FOOD"),
         geo %in% geos_EA_20) %>%
  month_to_date %>%
  group_by(date) %>%
  filter(n() == 19) %>%
  summarise(`Standard Deviation` = sd(values/100),
            `Interquartile Range (IQR)` = quantile(values/100, 0.75)-quantile(values/100, 0.25),
            `Maximum - Minimum` = max(values/100) - min(values/100)) %>%
  gather(Variable, values, -date) %>%
  ggplot(.) + geom_line(aes(x = date, y = values, color = Variable)) +
  theme_minimal() + xlab("") + ylab("Core Inflation, Std, IQR, Max-Min, Unweighted, EA-20 (%)") +
  scale_x_date(breaks = seq(1960, 2100, 2) %>% paste0("-01-01") %>% as.Date,
               labels = date_format("%Y")) +
  scale_color_manual(values = c("#1E1C1C", "#A81630", "#003399")) +
  scale_y_continuous(breaks = 0.01*seq(-20, 20, 1),
                     labels = percent_format(a = 1)) +
  theme(legend.position = c(0.7, 0.90),
        legend.title = element_blank())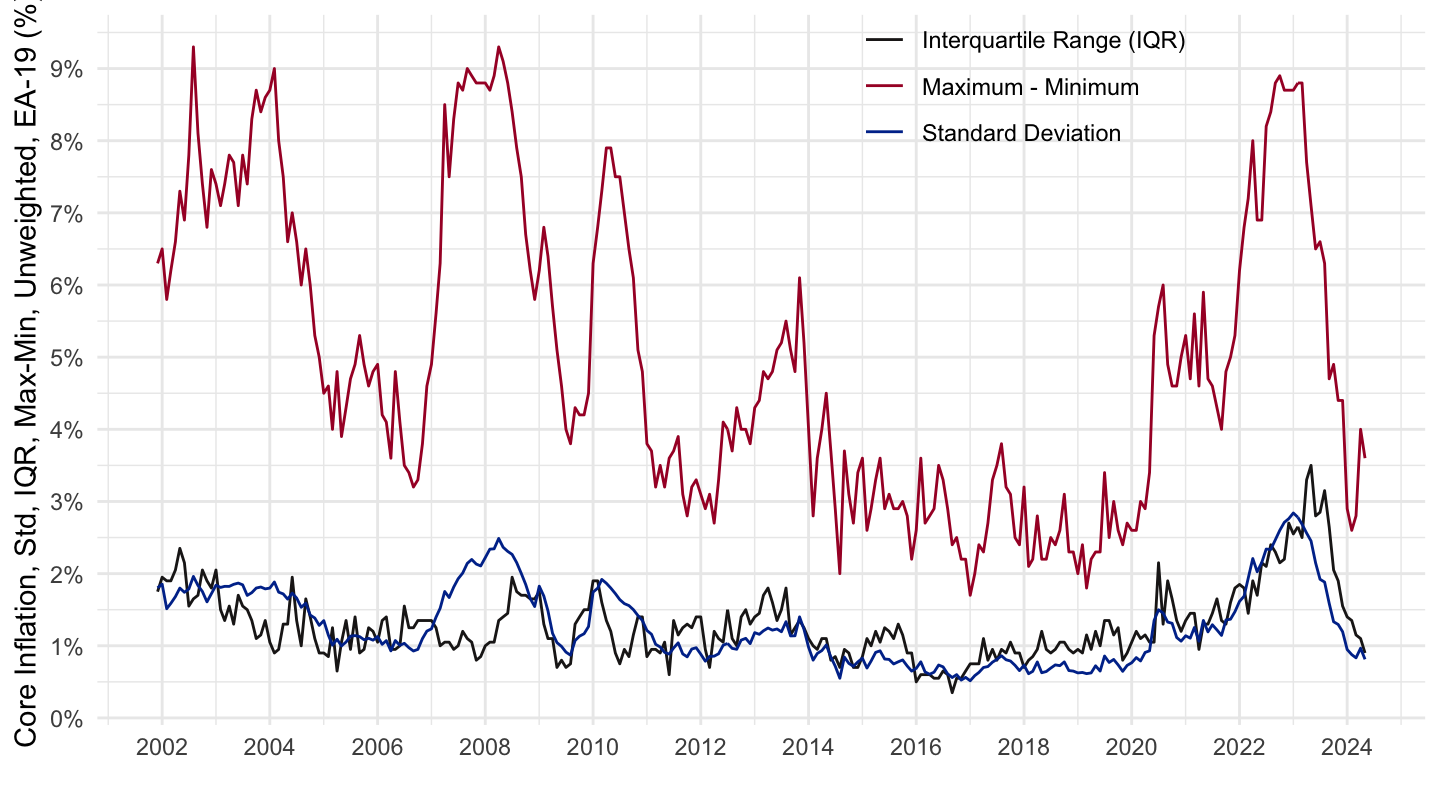
All - Weighted
HICP Inflation
Code
prc_hicp_manr %>%
  filter(coicop %in% c("CP00"),
         geo %in% geos_EA_20) %>%
  mutate(year = substr(time, 1, 4)) %>%
  left_join(prc_hicp_cow %>%
              filter(statinfo == "COWEA20", geo != "EA20") %>%
              transmute(geo, year = time, country_weights = values),
            by = c("geo", "year")) %>%
  month_to_date %>%
  filter(!is.na(values), !is.na(country_weights)) %>%
  group_by(date) %>%
  arrange(date) %>%
  filter(n() == 19) %>%
  summarise(`Standard Deviation` = sqrt(Hmisc::wtd.var(values/100, country_weights)),
            `Interquartile Range (IQR)` = Hmisc::wtd.quantile(values/100, country_weights, probs = 0.75) -
              Hmisc::wtd.quantile(values/100, country_weights, probs = 0.25)) %>%
  gather(Variable, values, -date) %>%
  ggplot(.) + geom_line(aes(x = date, y = values, color = Variable, linetype = Variable)) +
  theme_minimal() + xlab("") + ylab("HICP Inflation, Std, IQR, Weighted, EA-20 (%)") +
  scale_x_date(breaks = seq(1960, 2100, 2) %>% paste0("-01-01") %>% as.Date,
               labels = date_format("%Y")) +
  scale_color_manual(values = c("#1E1C1C", "#A81630", "#003399")) +
  scale_y_continuous(breaks = 0.01*seq(-20, 20, 1),
                     labels = percent_format(a = 1)) +
  theme(legend.position = c(0.7, 0.90),
        legend.title = element_blank())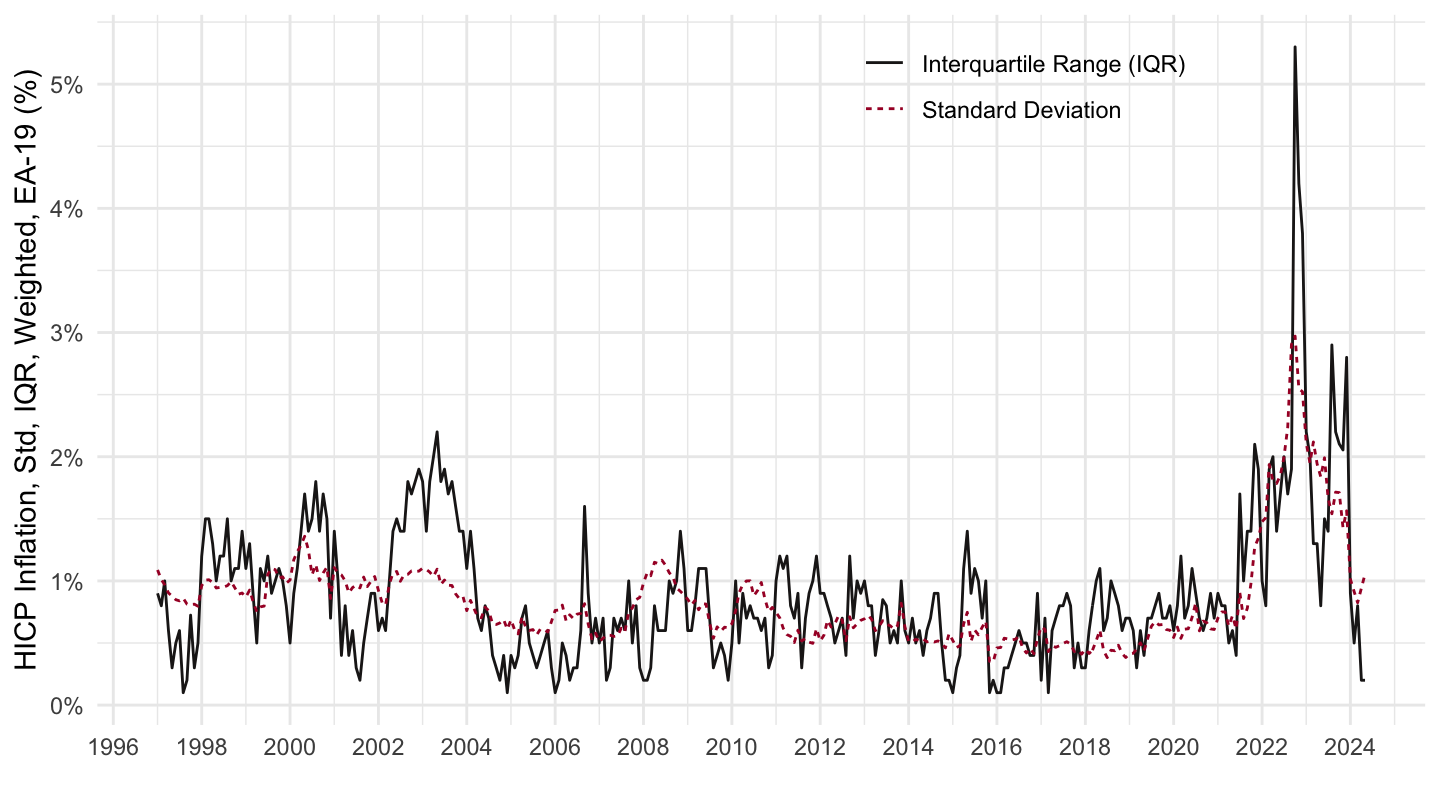
Core Inflation
Code
prc_hicp_manr %>%
  filter(coicop %in% c("TOT_X_NRG_FOOD"),
         geo %in% geos_EA_20) %>%
  mutate(year = substr(time, 1, 4)) %>%
  left_join(prc_hicp_cow %>%
              filter(statinfo == "COWEA20", geo != "EA20") %>%
              transmute(geo, year = time, country_weights = values),
            by = c("geo", "year")) %>%
  month_to_date %>%
  filter(!is.na(values), !is.na(country_weights)) %>%
  group_by(date) %>%
  filter(n() == 19) %>%
  summarise(`Standard Deviation` = sqrt(Hmisc::wtd.var(values/100, country_weights)),
            `Interquartile Range (IQR)` = Hmisc::wtd.quantile(values/100, country_weights, probs = 0.75) -
              Hmisc::wtd.quantile(values/100, country_weights, probs = 0.25)) %>%
  gather(Variable, values, -date) %>%
  ggplot(.) + geom_line(aes(x = date, y = values, color = Variable, linetype = Variable)) +
  theme_minimal() + xlab("") + ylab("Core Inflation, Std, IQR, Weighted, EA-20 (%)") +
  scale_x_date(breaks = seq(1960, 2100, 2) %>% paste0("-01-01") %>% as.Date,
               labels = date_format("%Y")) +
  scale_color_manual(values = c("#1E1C1C", "#A81630", "#003399")) +
  scale_y_continuous(breaks = 0.01*seq(-20, 20, 1),
                     labels = percent_format(a = 1)) +
  theme(legend.position = c(0.7, 0.90),
        legend.title = element_blank())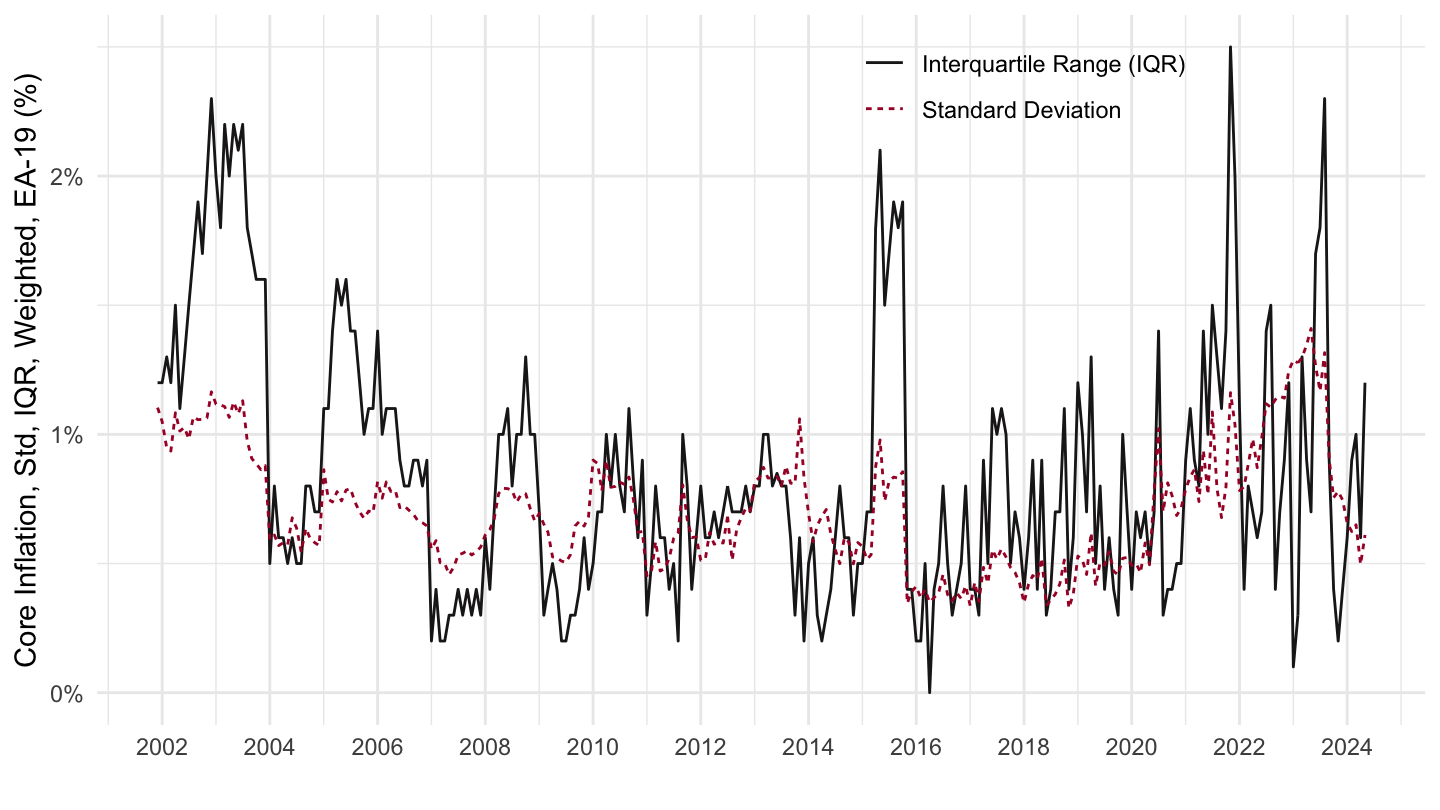
Weighted, Unweighted
HICP Inflation
Core Inflation
Standard Deviation of Inflation
All - Unweighted
Code
prc_hicp_manr %>%
  filter(coicop %in% c("TOT_X_NRG_FOOD", "CP00"),
         geo %in% geos_EA_20) %>%
  month_to_date %>%
  group_by(coicop, date) %>%
  summarise(values = sd(values/100)) %>%
  left_join(coicop, by = "coicop") %>%
  ggplot(.) + geom_line(aes(x = date, y = values, color = Coicop, linetype = Coicop)) +
  theme_minimal() + xlab("") + ylab("Standard Deviation of Inflation, Unweighted, EA-20 (%)") +
  scale_x_date(breaks = seq(1960, 2100, 2) %>% paste0("-01-01") %>% as.Date,
               labels = date_format("%Y")) +
  scale_color_manual(values = c("#1E1C1C", "#A81630")) +
  scale_y_continuous(breaks = 0.01*seq(-20, 20, 1),
                     labels = percent_format(a = 1)) +
  theme(legend.position = c(0.55, 0.90),
        legend.title = element_blank())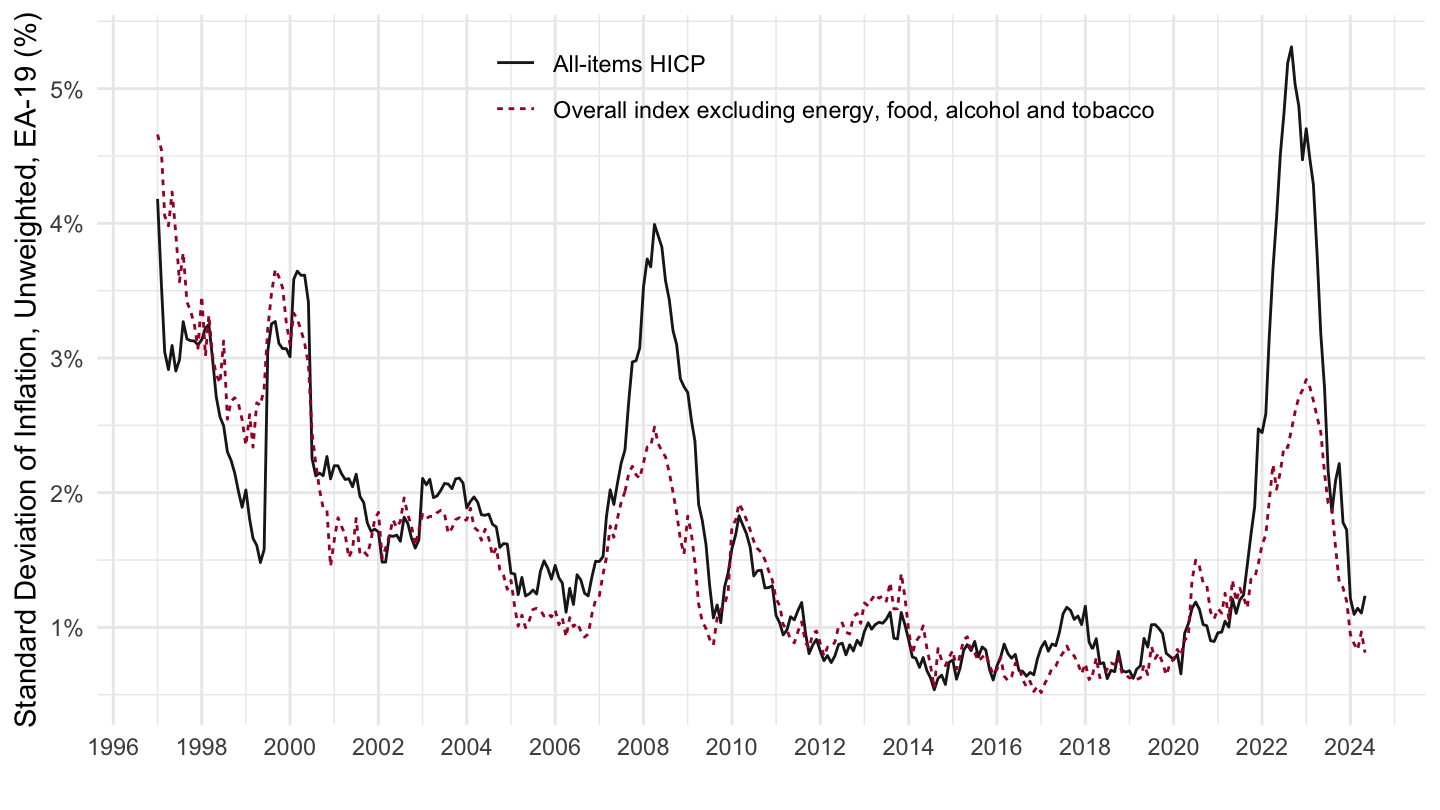
All - Weighted
Headline, Core
All
Code
prc_hicp_manr %>%
  filter(coicop %in% c("TOT_X_NRG_FOOD", "CP00"),
         geo %in% geos_EA_20) %>%
  mutate(year = substr(time, 1, 4)) %>%
  left_join(geo, by = "geo") %>%
  #filter(!(Geo %in% intersect(eurozone_countries, CEEC_countries))) %>%
  left_join(prc_hicp_cow %>%
              filter(statinfo == "COWEA20", geo != "EA20") %>%
              transmute(geo, year = time, country_weights = values, uniform_weights = 1),
            by = c("geo", "year")) %>%
  month_to_date %>%
  group_by(coicop, date) %>%
  summarise(values = sqrt(Hmisc::wtd.var(values/100, country_weights))) %>%
  left_join(coicop, by = "coicop") %>%

  ggplot(.) + geom_line(aes(x = date, y = values, color = Coicop, linetype = Coicop)) +
  theme_minimal() + xlab("") + ylab("Standard Deviation of Inflation, Weighted, EA-20 (%)") +
  scale_x_date(breaks = seq(1960, 2100, 2) %>% paste0("-01-01") %>% as.Date,
               labels = date_format("%Y")) +
  scale_color_manual(values = c("#1E1C1C", "#A81630")) +
  scale_y_continuous(breaks = 0.01*seq(-20, 20, .5),
                     labels = percent_format(a = .1)) +
  theme(legend.position = c(0.55, 0.90),
        legend.title = element_blank())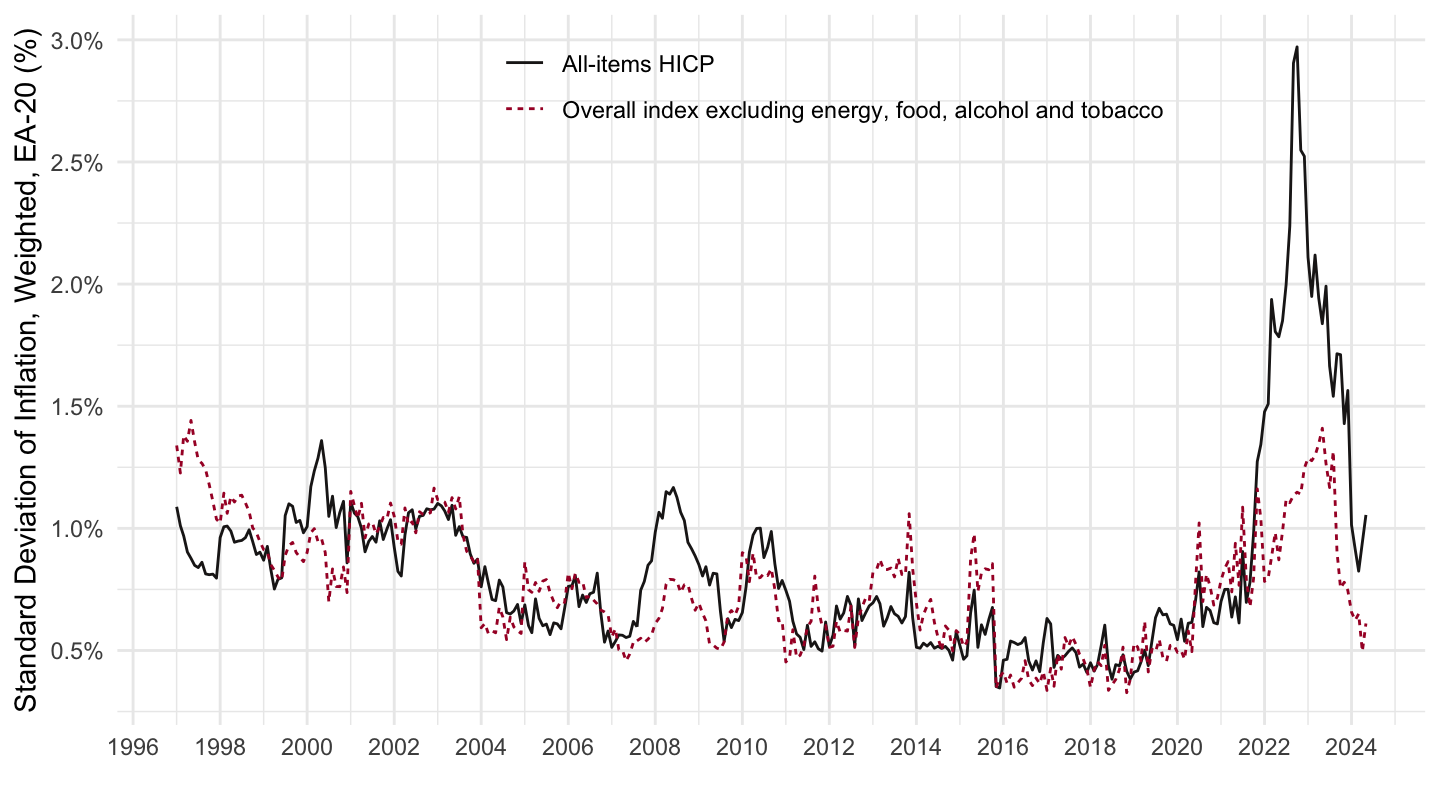
2017-
Code
prc_hicp_manr %>%
  filter(coicop %in% c("TOT_X_NRG_FOOD", "CP00"),
         geo %in% geos_EA_20) %>%
  mutate(year = substr(time, 1, 4)) %>%
  left_join(prc_hicp_cow %>%
              filter(statinfo == "COWEA20", geo != "EA20") %>%
              transmute(geo, year = time, country_weights = values, uniform_weights = 1),
            by = c("geo", "year")) %>%
  month_to_date %>%
  group_by(coicop, date) %>%
  summarise(values = sqrt(Hmisc::wtd.var(values/100, country_weights))) %>%
  left_join(coicop, by = "coicop") %>%
  filter(date >= as.Date("2017-01-01")) %>%
  ggplot(.) + geom_line(aes(x = date, y = values, color = Coicop, linetype = Coicop)) +
  theme_minimal() + xlab("") + ylab("Standard Deviation of Inflation, Weighted, EA-20 (%)") +
  scale_x_date(breaks = seq(1960, 2100, 1) %>% paste0("-01-01") %>% as.Date,
               labels = date_format("%Y")) +
  scale_color_manual(values = c("#1E1C1C", "#A81630")) +
  scale_y_continuous(breaks = 0.01*seq(-20, 20, .5),
                     labels = percent_format(a = .1)) +
  theme(legend.position = c(0.55, 0.90),
        legend.title = element_blank())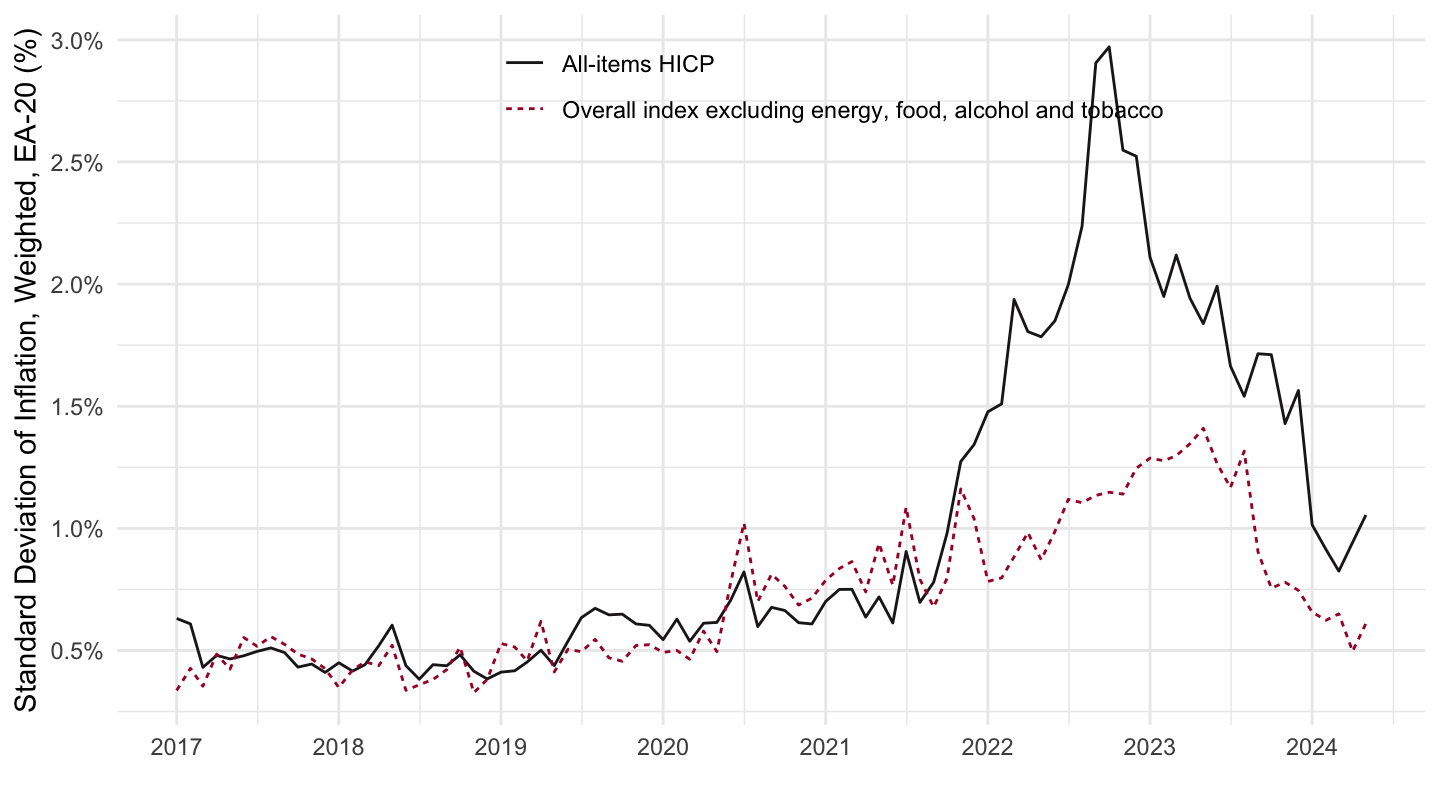
Table
Code
instant_time <- "2022M10"
load_data("eurostat/coicop.RData")
prc_hicp_manr %>%
  filter(geo %in% geos_EA_20,
         time == instant_time) %>%
  mutate(year = substr(time, 1, 4)) %>%
  left_join(prc_hicp_cow %>%
              filter(statinfo == "COWEA20", geo != "EA20") %>%
              transmute(geo, year = time, country_weights = values, uniform_weights = 1),
            by = c("geo", "year")) %>%
  group_by(coicop) %>%
  summarise(values = sqrt(Hmisc::wtd.var(values, country_weights))) %>%
  left_join(coicop, by = "coicop") %>%
  arrange(-values) %>%
  transmute(coicop, Coicop, `Weighted Std.` = paste0(round(values, 1), " %")) %>%
  head(9) %>%
print_table_conditional()| coicop | Coicop | Weighted Std. |
|---|---|---|
| CP0451 | Electricity | 73.6 % |
| AP_NRG | Administered prices, energy | 51.7 % |
| ELC_GAS | Electricity, gas, solid fuels and heat energy | 51.6 % |
| CP045 | Electricity, gas and other fuels | 48.9 % |
| CP04521 | Natural gas and town gas | 46.4 % |
| CP0452 | Gas | 44.1 % |
| CP04549 | Other solid fuels | 38.1 % |
| CP0454 | Solid fuels | 35.2 % |
| CP07332 | International flights | 34.8 % |
CP0451, CP07332, CP0452, CP0454
All
Code
prc_hicp_manr %>%
  filter(coicop %in% c("CP0451", "CP07332", "CP0452", "CP0454"),
         geo %in% geos_EA_20) %>%
  mutate(year = substr(time, 1, 4)) %>%
  left_join(geo, by = "geo") %>%
  left_join(prc_hicp_cow %>%
              filter(statinfo == "COWEA20", geo != "EA20") %>%
              transmute(geo, year = time, country_weights = values, uniform_weights = 1),
            by = c("geo", "year")) %>%
  month_to_date %>%
  group_by(coicop, date) %>%
  summarise(values = sqrt(Hmisc::wtd.var(values/100, country_weights))) %>%
  left_join(coicop, by = "coicop") %>%
  ggplot(.) + geom_line(aes(x = date, y = values, color = Coicop)) +
  theme_minimal() + xlab("") + ylab("Standard Deviation of Inflation, Weighted, EA-20 (%)") +
  scale_x_date(breaks = seq(1960, 2100, 2) %>% paste0("-01-01") %>% as.Date,
               labels = date_format("%Y")) +
  #scale_color_manual(values = c("#1E1C1C", "#A81630")) +
  scale_y_continuous(breaks = 0.01*seq(-20, 100, 5),
                     labels = percent_format(a = 1)) +
  theme(legend.position = c(0.55, 0.90),
        legend.title = element_blank())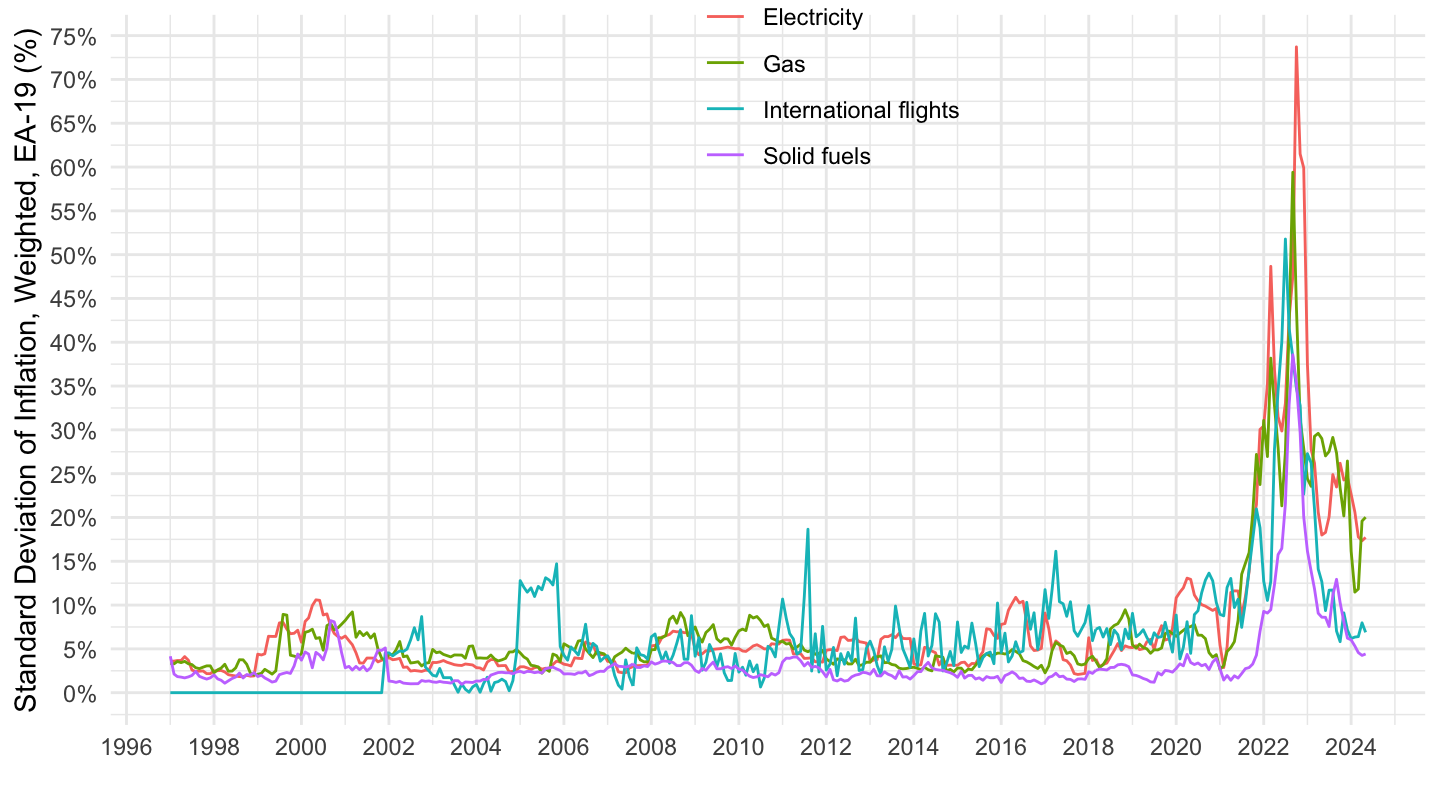
2017-
Code
prc_hicp_manr %>%
  filter(coicop %in% c("CP0451", "CP07332", "CP0452", "CP0454"),
         geo %in% geos_EA_20) %>%
  mutate(year = substr(time, 1, 4)) %>%
  left_join(geo, by = "geo") %>%
  left_join(prc_hicp_cow %>%
              filter(statinfo == "COWEA20", geo != "EA20") %>%
              transmute(geo, year = time, country_weights = values, uniform_weights = 1),
            by = c("geo", "year")) %>%
  month_to_date %>%
  filter(date >= as.Date("2017-01-01")) %>%
  group_by(coicop, date) %>%
  summarise(values = sqrt(Hmisc::wtd.var(values/100, country_weights))) %>%
  left_join(coicop, by = "coicop") %>%
  ggplot(.) + geom_line(aes(x = date, y = values, color = Coicop)) +
  theme_minimal() + xlab("") + ylab("Standard Deviation of Inflation, Weighted, EA-20 (%)") +
  scale_x_date(breaks = seq(1960, 2100, 1) %>% paste0("-01-01") %>% as.Date,
               labels = date_format("%Y")) +
  #scale_color_manual(values = c("#1E1C1C", "#A81630")) +
  scale_y_continuous(breaks = 0.01*seq(-20, 100, 5),
                     labels = percent_format(a = 1)) +
  theme(legend.position = c(0.55, 0.90),
        legend.title = element_blank())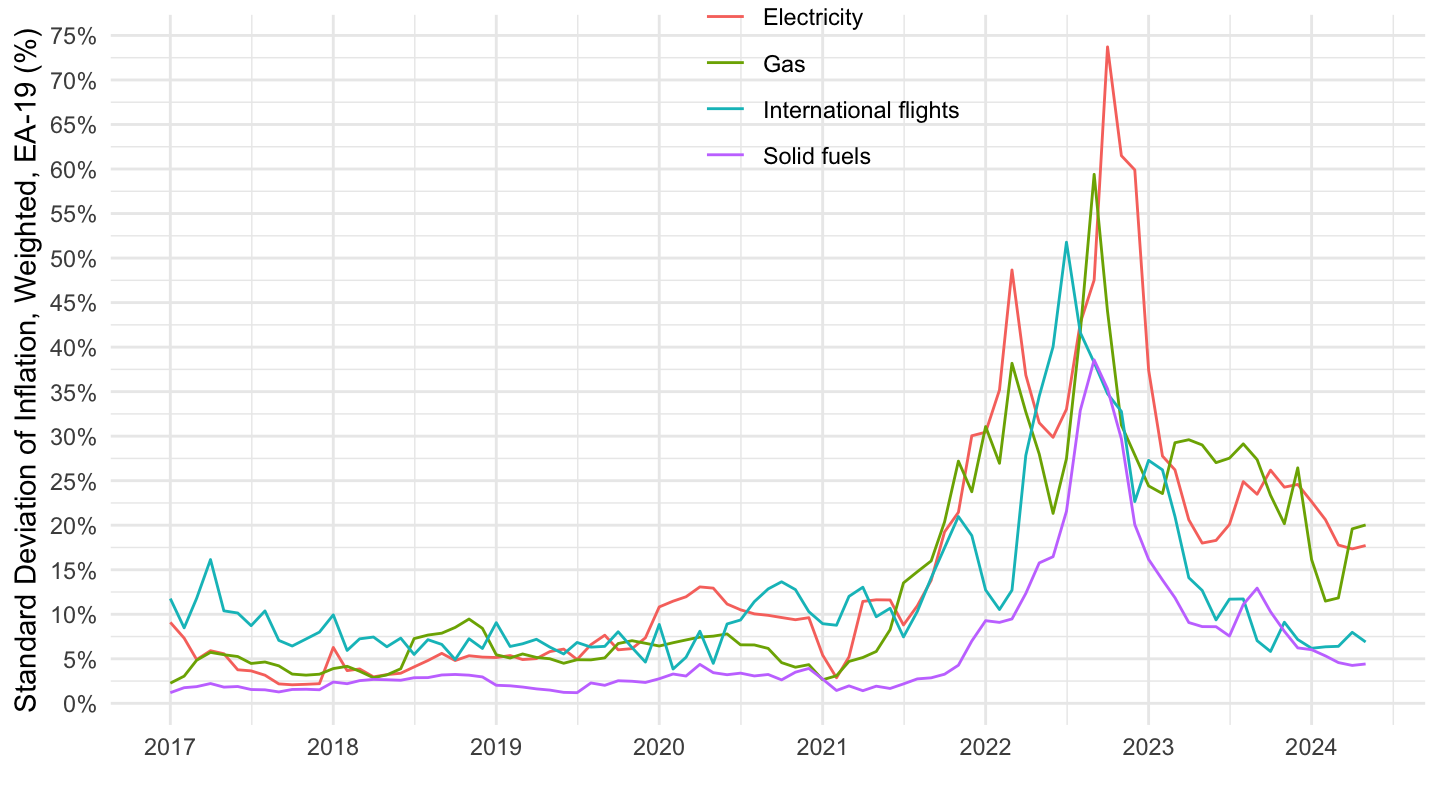
CP01, CP02, CP03, CP05
Code
prc_hicp_manr %>%
  filter(coicop %in% c("CP01", "CP02", "CP03", "CP05"),
         geo %in% c("AT", "BE", "CY", "DE", "EE", "EL", "ES", "FI", "FR", "IE",
                    "IT", "LT", "LU", "LV", "MT", "NL", "PT", "SI", "SK")) %>%
  mutate(year = substr(time, 1, 4)) %>%
  left_join(geo, by = "geo") %>%
  filter(!(Geo %in% intersect(eurozone_countries, CEEC_countries))) %>%
  left_join(prc_hicp_cow %>%
              filter(statinfo == "COWEA20", geo != "EA20") %>%
              transmute(geo, year = time, country_weights = values, uniform_weights = 1),
            by = c("geo", "year")) %>%
  month_to_date %>%
  group_by(coicop, date) %>%
  summarise(values = sqrt(Hmisc::wtd.var(values/100, country_weights))) %>%
  left_join(coicop, by = "coicop") %>%
  ggplot(.) + geom_line(aes(x = date, y = values, color = Coicop)) +
  theme_minimal() + xlab("") + ylab("Standard Deviation of Inflation, Weighted, EA-20 (%)") +
  scale_x_date(breaks = seq(1960, 2100, 2) %>% paste0("-01-01") %>% as.Date,
               labels = date_format("%Y")) +
  #scale_color_manual(values = c("#1E1C1C", "#A81630")) +
  scale_y_continuous(breaks = 0.01*seq(-20, 20, .5),
                     labels = percent_format(a = .1)) +
  theme(legend.position = c(0.55, 0.90),
        legend.title = element_blank())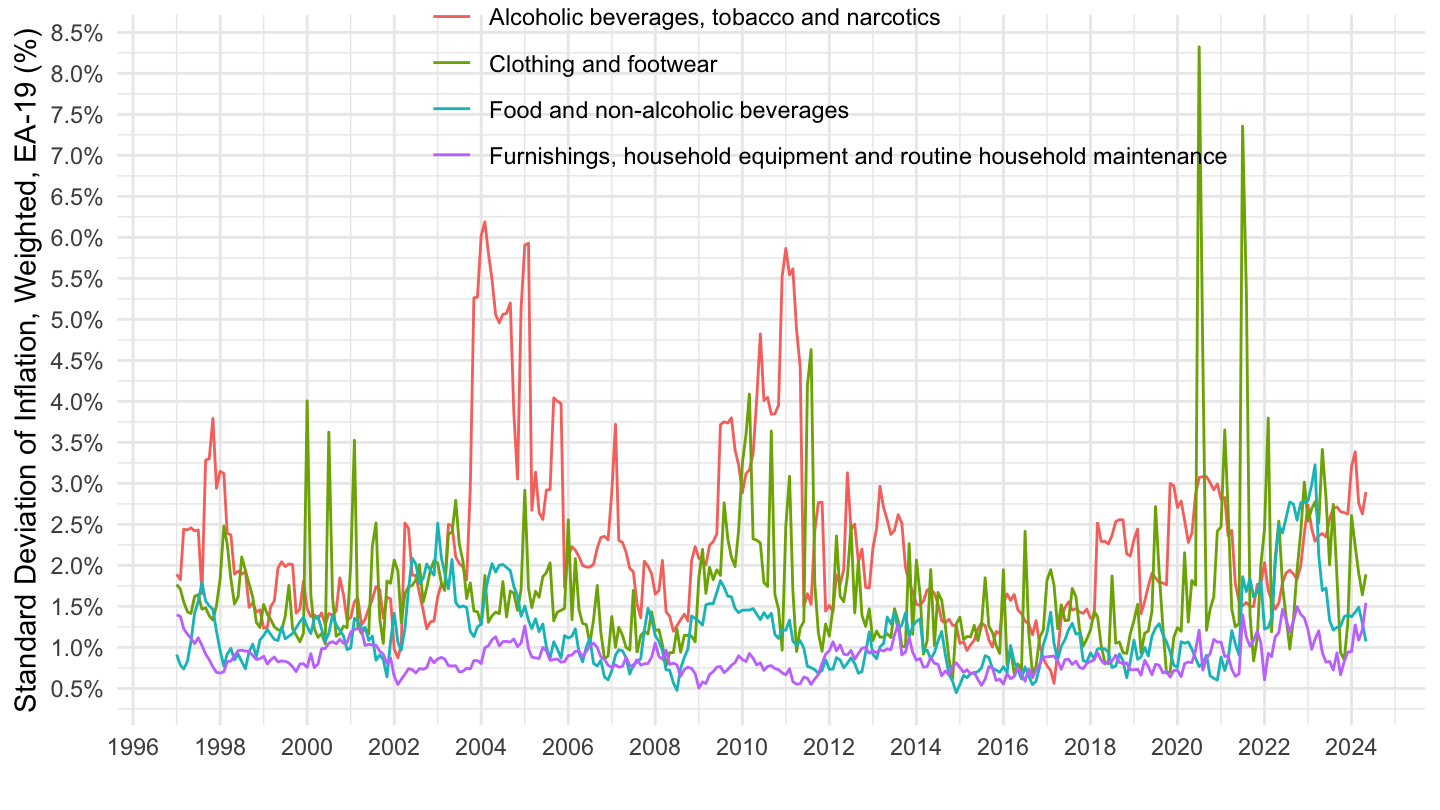
CP06, CP07, CP08, CP09
Code
prc_hicp_manr %>%
  filter(coicop %in% c("CP06", "CP07", "CP08", "CP09"),
         geo %in% c("AT", "BE", "CY", "DE", "EE", "EL", "ES", "FI", "FR", "IE",
                    "IT", "LT", "LU", "LV", "MT", "NL", "PT", "SI", "SK")) %>%
  mutate(year = substr(time, 1, 4)) %>%
  left_join(geo, by = "geo") %>%
  filter(!(Geo %in% intersect(eurozone_countries, CEEC_countries))) %>%
  left_join(prc_hicp_cow %>%
              filter(statinfo == "COWEA20", geo != "EA20") %>%
              transmute(geo, year = time, country_weights = values, uniform_weights = 1),
            by = c("geo", "year")) %>%
  month_to_date %>%
  group_by(coicop, date) %>%
  summarise(values = sqrt(Hmisc::wtd.var(values/100, country_weights))) %>%
  left_join(coicop, by = "coicop") %>%
  ggplot(.) + geom_line(aes(x = date, y = values, color = Coicop)) +
  theme_minimal() + xlab("") + ylab("Standard Deviation of Inflation, Weighted, EA-20 (%)") +
  scale_x_date(breaks = seq(1960, 2100, 2) %>% paste0("-01-01") %>% as.Date,
               labels = date_format("%Y")) +
  #scale_color_manual(values = c("#1E1C1C", "#A81630")) +
  scale_y_continuous(breaks = 0.01*seq(-20, 20, .5),
                     labels = percent_format(a = .1)) +
  theme(legend.position = c(0.55, 0.90),
        legend.title = element_blank())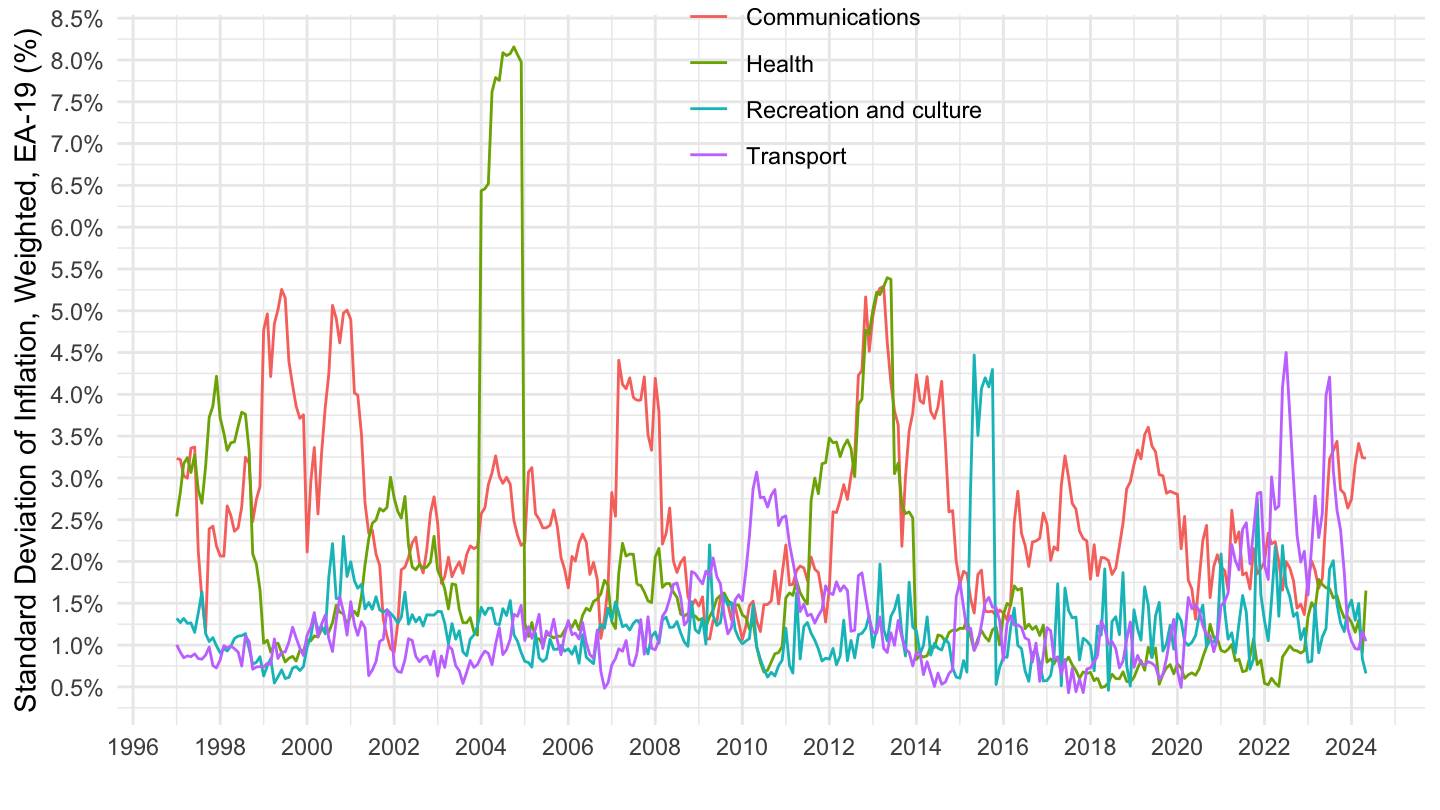
CP10, CP11, CP12
Code
prc_hicp_manr %>%
  filter(coicop %in% c("CP10", "CP11", "CP12"),
         geo %in% c("AT", "BE", "CY", "DE", "EE", "EL", "ES", "FI", "FR", "IE",
                    "IT", "LT", "LU", "LV", "MT", "NL", "PT", "SI", "SK")) %>%
  mutate(year = substr(time, 1, 4)) %>%
  left_join(geo, by = "geo") %>%
  filter(!(Geo %in% intersect(eurozone_countries, CEEC_countries))) %>%
  left_join(prc_hicp_cow %>%
              filter(statinfo == "COWEA20", geo != "EA20") %>%
              transmute(geo, year = time, country_weights = values, uniform_weights = 1),
            by = c("geo", "year")) %>%
  month_to_date %>%
  group_by(coicop, date) %>%
  summarise(values = sqrt(Hmisc::wtd.var(values/100, country_weights))) %>%
  left_join(coicop, by = "coicop") %>%
  ggplot(.) + geom_line(aes(x = date, y = values, color = Coicop)) +
  theme_minimal() + xlab("") + ylab("Standard Deviation of Inflation, Weighted, EA-20 (%)") +
  scale_x_date(breaks = seq(1960, 2100, 2) %>% paste0("-01-01") %>% as.Date,
               labels = date_format("%Y")) +
  #scale_color_manual(values = c("#1E1C1C", "#A81630")) +
  scale_y_continuous(breaks = 0.01*seq(-20, 20, .5),
                     labels = percent_format(a = .1)) +
  theme(legend.position = c(0.55, 0.90),
        legend.title = element_blank())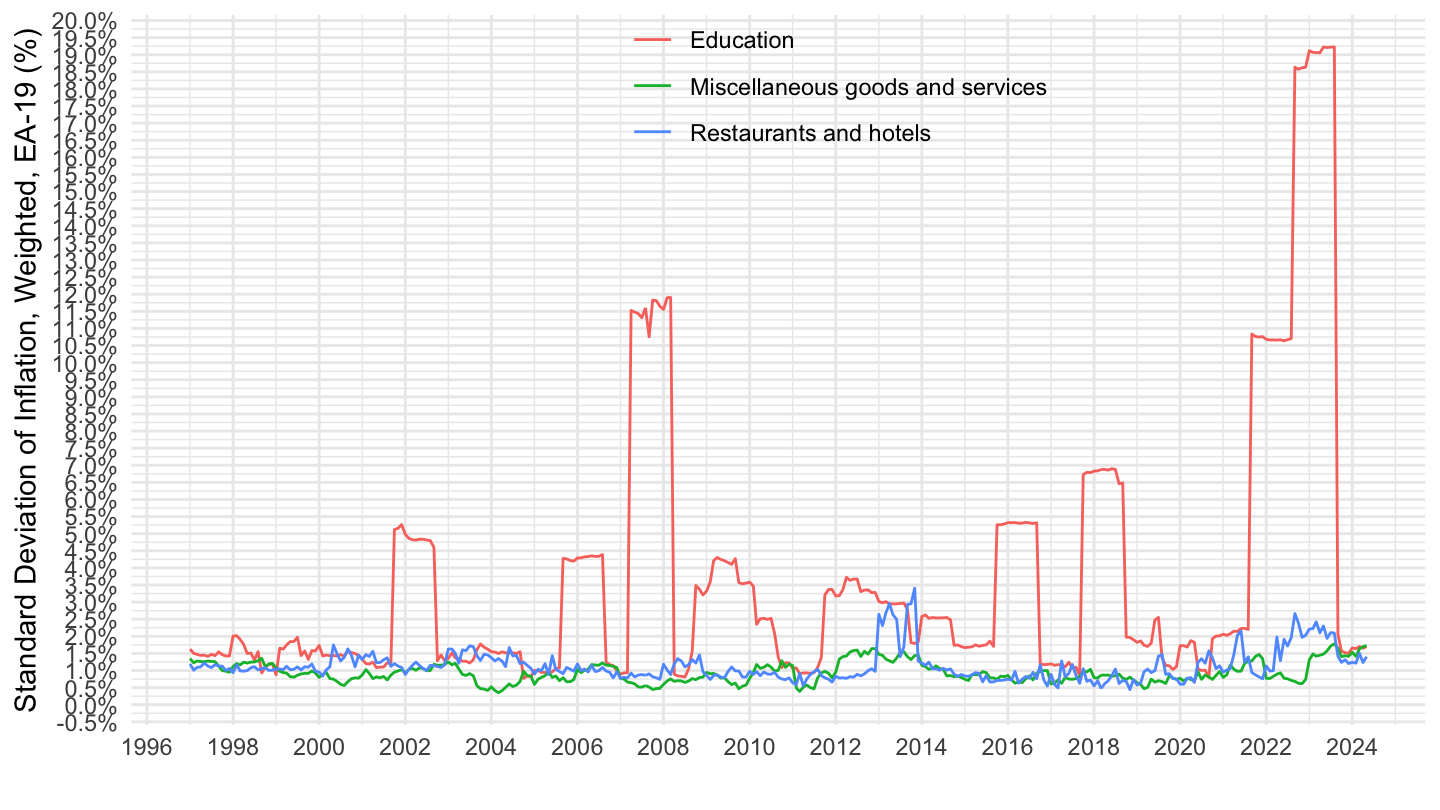
All - Weighted, Unweighted
All
Code
coicop <- tibble(coicop = "CP00", Coicop = "Headline inflation") %>%
  add_row(coicop = "TOT_X_NRG_FOOD", Coicop = "Core inflation")
prc_hicp_manr %>%
  filter(coicop %in% c("TOT_X_NRG_FOOD", "CP00"),
         geo %in% geos_EA_20) %>%
  mutate(year = substr(time, 1, 4)) %>%
  left_join(prc_hicp_cow %>%
              filter(statinfo == "COWEA20", geo != "EA20") %>%
              transmute(geo, year = time, country_weights = values, uniform_weights = 1),
            by = c("geo", "year")) %>%
  month_to_date %>%
  group_by(coicop, date) %>%
  summarise(`Unweighted` = sqrt(Hmisc::wtd.var(values/100, uniform_weights)),
            `Weighted` = sqrt(Hmisc::wtd.var(values/100, country_weights))) %>%
  gather(weighted_yes_no, values, -date, -coicop) %>%
  left_join(coicop, by = "coicop") %>%
  arrange(desc(date)) %>%
  ggplot(.) + geom_line(aes(x = date, y = values, color = Coicop, linetype = weighted_yes_no)) +
  theme_minimal() + xlab("") + ylab("Standard Deviation of Inflation, EA-20 (%)") +
  scale_x_date(breaks = seq(1960, 2100, 2) %>% paste0("-01-01") %>% as.Date,
               labels = date_format("%Y")) +
  scale_color_manual(values = c("#1E1C1C", "#A81630")) +
  scale_linetype_manual(values = c("dashed", "solid")) +
  scale_y_continuous(breaks = 0.01*seq(-20, 20, 1),
                     labels = percent_format(a = 1)) +
  theme(legend.position = c(0.75, 0.80),
        legend.title = element_blank())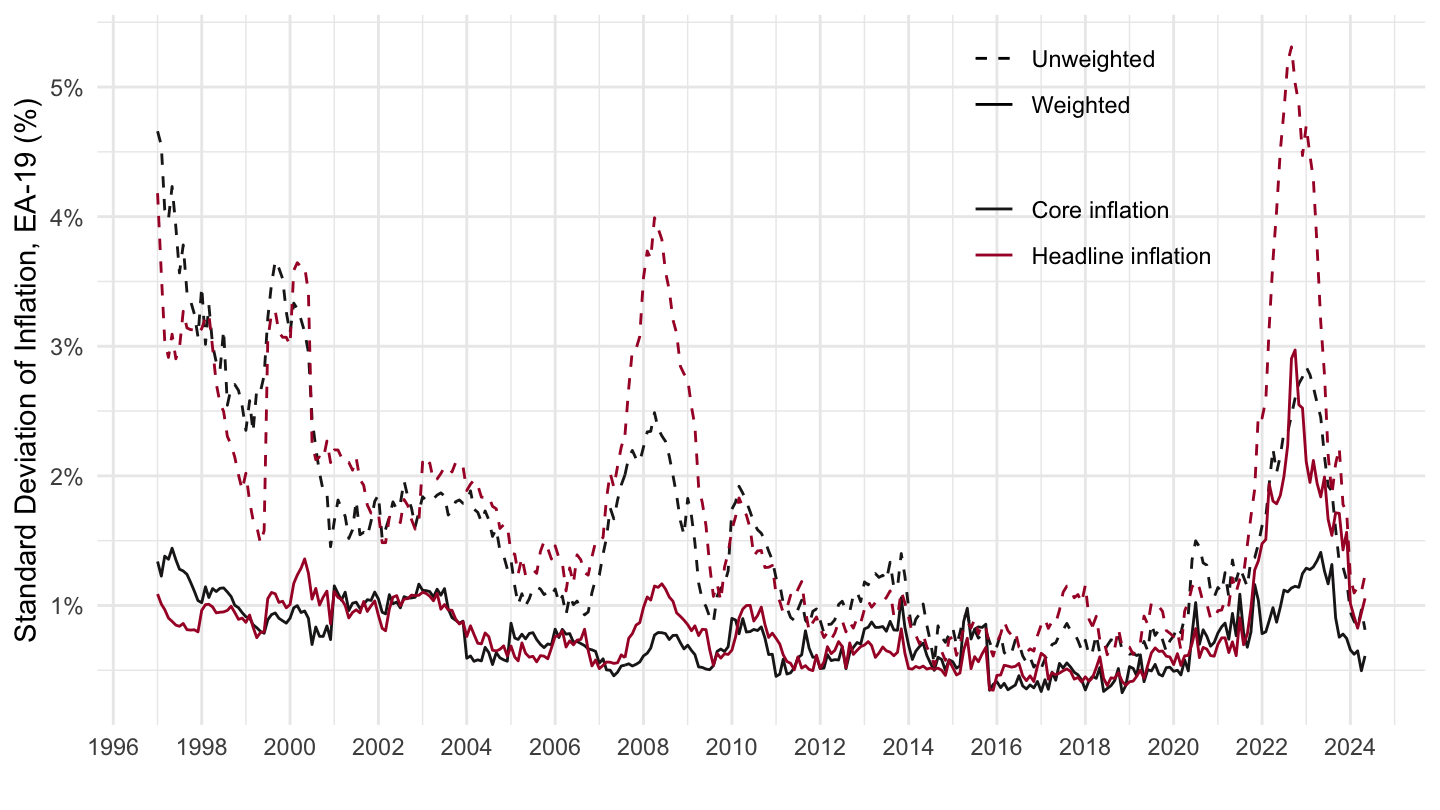
2000-
Code
coicop <- tibble(coicop = "CP00", Coicop = "Headline inflation") %>%
  add_row(coicop = "TOT_X_NRG_FOOD", Coicop = "Core inflation")
prc_hicp_manr %>%
  filter(coicop %in% c("TOT_X_NRG_FOOD", "CP00"),
         geo %in% geos_EA_20) %>%
  mutate(year = substr(time, 1, 4)) %>%
  left_join(prc_hicp_cow %>%
              filter(statinfo == "COWEA20", geo != "EA20") %>%
              transmute(geo, year = time, country_weights = values, uniform_weights = 1),
            by = c("geo", "year")) %>%
  month_to_date %>%
  group_by(coicop, date) %>%
  summarise(`Unweighted` = sqrt(Hmisc::wtd.var(values/100, uniform_weights)),
            `Weighted` = sqrt(Hmisc::wtd.var(values/100, country_weights))) %>%
  gather(weighted_yes_no, values, -date, -coicop) %>%
  left_join(coicop, by = "coicop") %>%
  arrange(desc(date)) %>%
  filter(date >= as.Date("2000-01-01")) %>%
  ggplot(.) + geom_line(aes(x = date, y = values, color = Coicop, linetype = weighted_yes_no)) +
  theme_minimal() + xlab("") + ylab("Standard Deviation of Inflation, EA-20 (%)") +
  scale_x_date(breaks = seq(1960, 2100, 2) %>% paste0("-01-01") %>% as.Date,
               labels = date_format("%Y")) +
  scale_color_manual(values = c("#1E1C1C", "#A81630")) +
  scale_linetype_manual(values = c("dashed", "solid")) +
  scale_y_continuous(breaks = 0.01*seq(-20, 20, 1),
                     labels = percent_format(a = 1)) +
  theme(legend.position = c(0.6, 0.80),
        legend.title = element_blank())+
  guides(color = guide_legend(order = 1),
         linetype = guide_legend(order = 2))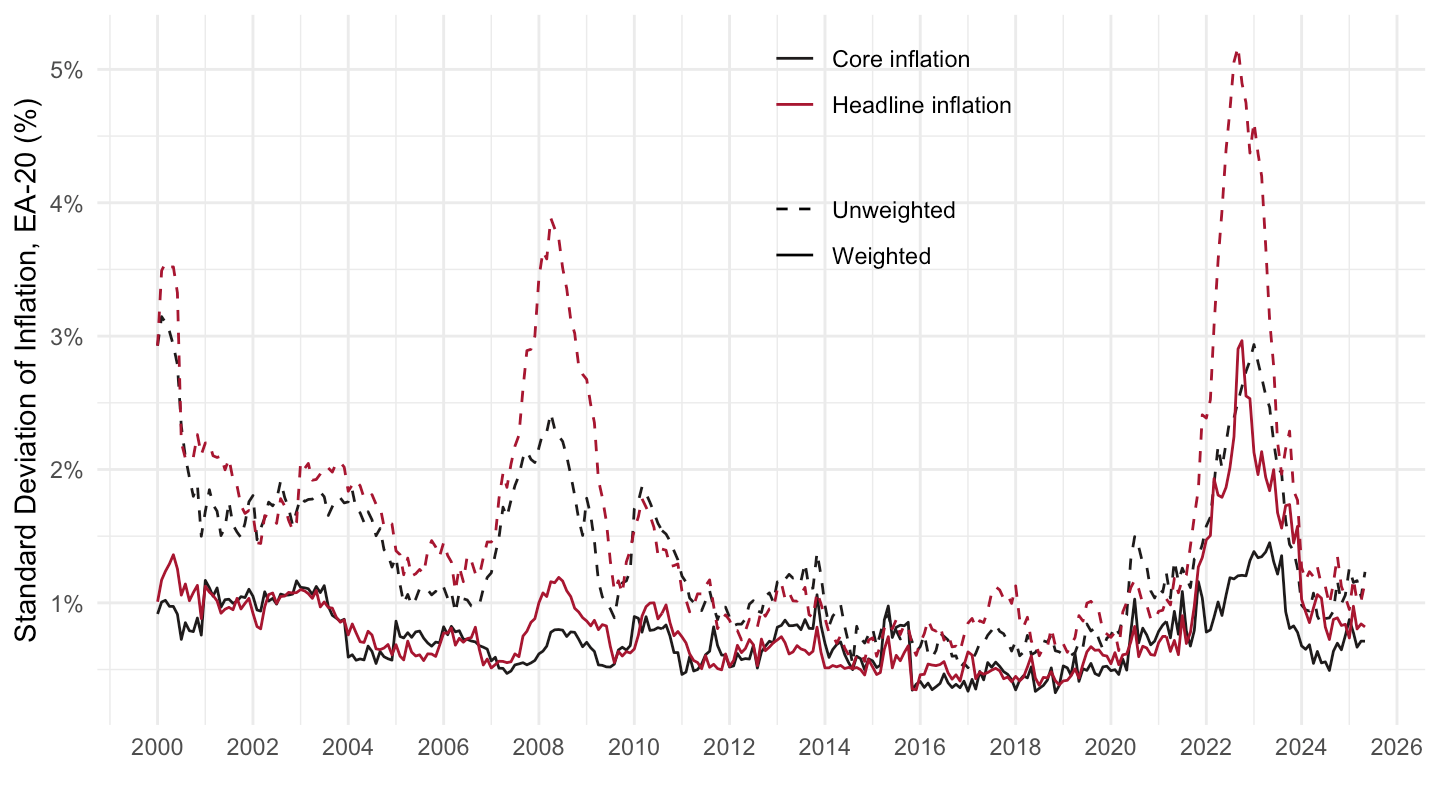
Interquartile range (IQR) of Inflation
All - Unweighted
Code
prc_hicp_manr %>%
  filter(coicop %in% c("TOT_X_NRG_FOOD", "CP00"),
         geo %in% c("AT", "BE", "CY", "DE", "EE", "EL", "ES", "FI", "FR", "IE",
                    "IT", "LT", "LU", "LV", "MT", "NL", "PT", "SI", "SK")) %>%
  month_to_date %>%
  group_by(coicop, date) %>%
  filter(n() == 19) %>%
  summarise(values = quantile(values/100, probs = 0.75) - quantile(values/100, probs = 0.25)) %>%
  left_join(coicop, by = "coicop") %>%
  ggplot(.) + geom_line(aes(x = date, y = values, color = Coicop)) +
  theme_minimal() + xlab("") + ylab("Interquartile range of Inflation, Unweighted, EA-20 (%)") +
  scale_x_date(breaks = seq(1960, 2100, 2) %>% paste0("-01-01") %>% as.Date,
               labels = date_format("%Y")) +
  scale_color_manual(values = c("#1E1C1C", "#A81630")) +
  scale_y_continuous(breaks = 0.01*seq(-20, 20, 1),
                     labels = percent_format(a = 1)) +
  theme(legend.position = c(0.55, 0.90),
        legend.title = element_blank())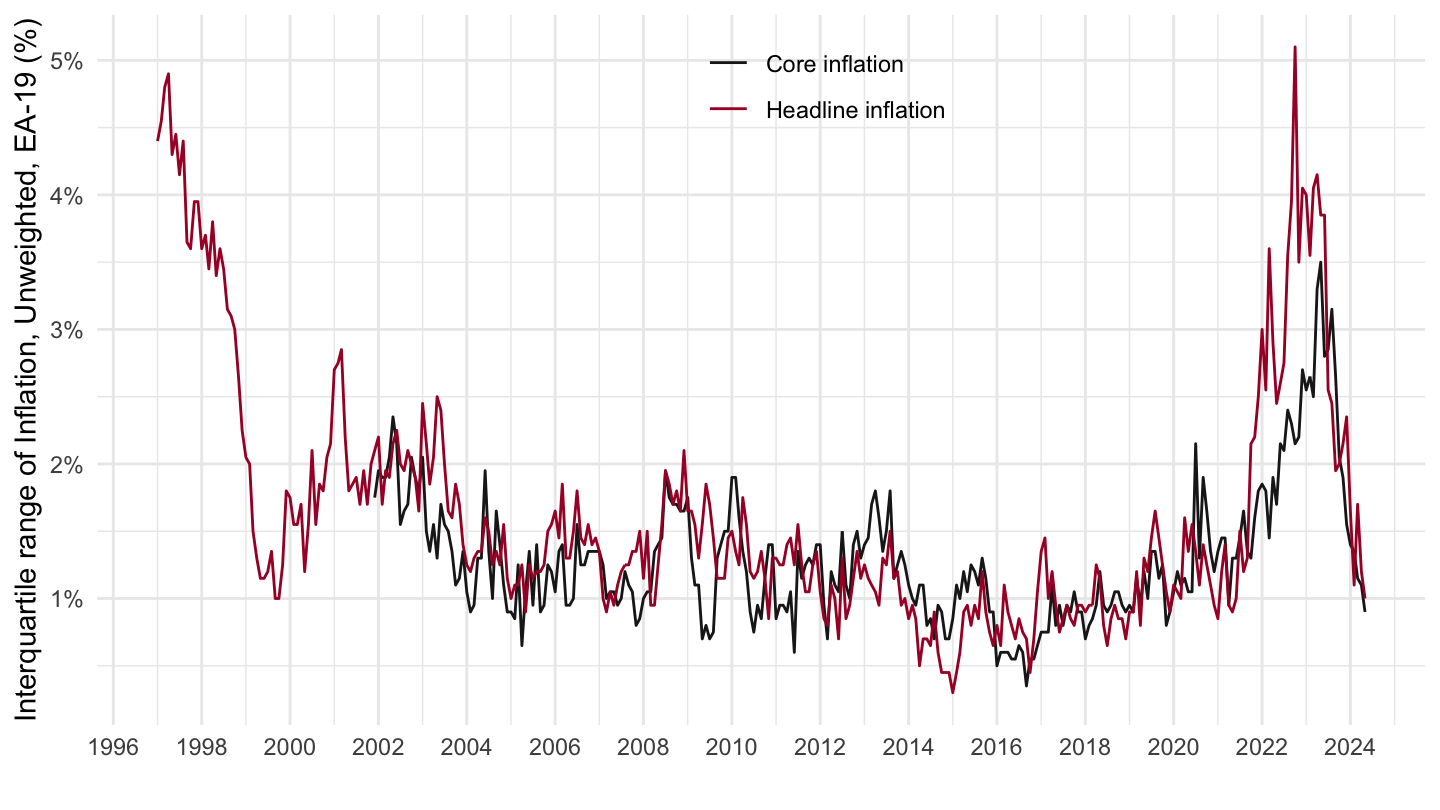
Contributions to inflation
Eurozone
Code
prc_hicp_inw_2022 <- prc_hicp_inw %>%
  filter(time == "2022",
         geo == "EA") %>%
  mutate(values = values/1000) %>%
  select(-time) %>%
  rename(weights = values) %>%
  select_if(~ n_distinct(.) > 1)

prc_hicp_manr_last <- prc_hicp_manr %>%
  filter(time == "2022M03",
         geo == "EA") %>%
  select_if(~ n_distinct(.) > 1)

prc_hicp_inw_2022 %>%
  inner_join(prc_hicp_manr_last, by = c("coicop")) %>%
  left_join(coicop, by = "coicop") %>%
  mutate(contributions = weights*values) %>%
  arrange(-contributions) %>%
  select(coicop, Coicop, everything()) %>%
  print_table_conditional()
France, Italy, Germany
Code
prc_hicp_inw_2022 <- prc_hicp_inw %>%
  filter(time == "2022",
         geo %in% c("DE", "FR", "IT")) %>%
  mutate(values = values/1000) %>%
  select(-time) %>%
  rename(weights = values) %>%
  select_if(~ n_distinct(.) > 1)

prc_hicp_manr_last <- prc_hicp_manr %>%
  filter(time == "2022M03",
         geo %in% c("DE", "FR", "IT")) %>%
  select_if(~ n_distinct(.) > 1)

prc_hicp_inw_2022 %>%
  inner_join(prc_hicp_manr_last, by = c("coicop", "geo")) %>%
  left_join(coicop, by = "coicop") %>%
  left_join(geo, by = "geo") %>%
  mutate(contributions = weights*values) %>%
  select(coicop, Coicop, Geo, contributions) %>%
  spread(Geo, contributions) %>%
  print_table_conditional()
CP0612
Table
Code
prc_hicp_manr %>%
  filter(coicop == "CP0612",
         time %in% c("2021M01", "2021M01", "2021M11")) %>%
  left_join(geo, by = "geo") %>%
  select_if(~ n_distinct(.) > 1) %>%
  spread(time, values) %>%
  arrange(`2021M11`) %>%
  mutate(Flag = gsub(" ", "-", str_to_lower(gsub(" ", "-", Geo))),
         Flag = paste0('<img src="../../icon/flag/vsmall/', Flag, '.png" alt="Flag">')) %>%
  select(Flag, everything()) %>%
  {if (is_html_output()) datatable(., filter = 'top', rownames = F, escape = F) else .}
France, Germany, Spain, Italy
Code
prc_hicp_manr %>%
  filter(coicop == "CP0612",
         geo %in% c("FR", "DE", "ES", "IT")) %>%
  month_to_date %>%
  filter(date >= as.Date("2020-01-01")) %>%
  left_join(geo, by = "geo") %>%
  left_join(colors, by = c("Geo" = "country")) %>%
  mutate(values = values/100) %>%
  ggplot(.) + geom_line(aes(x = date, y = values, color = color)) +
  theme_minimal() + xlab("") + ylab("CP0612 - Other medical products") +
  scale_x_date(breaks = "3 months",
               labels = date_format("%b %Y")) +
  scale_y_continuous(breaks = 0.01*seq(-40, 20, 2),
                     labels = percent_format(a = 1)) +
  scale_color_identity() + add_4flags +
  theme(legend.position = c(0.75, 0.90),
        legend.title = element_blank())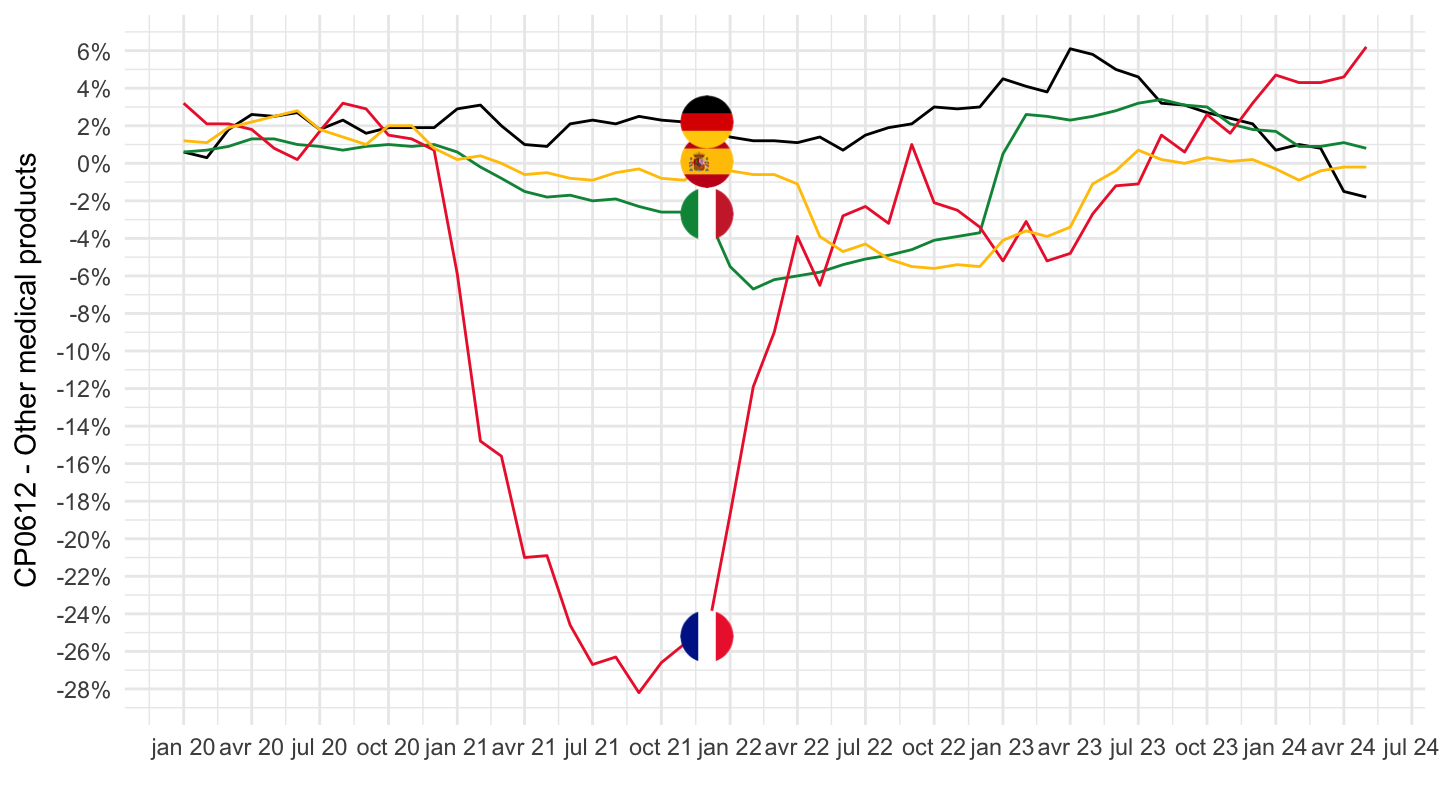
Share of Energy VS Rise in inflation
Share of Energy, Total Inflation
Code
nrg_weights <- prc_hicp_inw %>%
  filter(time %in% c("2022"),
         coicop %in% c("AP_NRG", "NRG")) %>%
  left_join(geo, by = "geo") %>%
  mutate(values = round(values/10, 1)) %>%
  select(Geo, coicop, values) %>%
  spread(coicop, values) %>%
  transmute(Geo, `Energy, Non Administered Prices` = NRG - AP_NRG,
            `Energy, Administered Prices` = AP_NRG,
            Energy = NRG) %>%
  arrange(-`Energy, Non Administered Prices`)

prc_hicp_manr_2022M09 %>%
  inner_join(prc_hicp_manr_2022M09_Energy, by = "Geo") %>%
  inner_join(nrg_weights, by = "Geo") %>%
  filter(Geo %in% eurozone_countries) %>%
  mutate(contribution_Energy = inflation_2022M09_NRG*Energy/100) %>%
  ggplot(.) + theme_minimal() + xlab("Inflation, contribution of Energy (%)") + ylab("Total Inflation (%)") +
  geom_point(aes(x = `contribution_Energy`/100, y = `inflation_2022M09`/100)) +
  scale_x_continuous(breaks = 0.01*seq(-100, 100, 1),
                     labels = percent_format(accuracy = 1)) +
  scale_y_continuous(breaks = 0.01*seq(-100, 100, 1),
                     labels = percent_format(accuracy = 1)) +
  stat_smooth(aes(x = `contribution_Energy`/100, y = `inflation_2022M09`/100),
              linetype = 2, method = "lm", color = "#F2A900") +
  geom_text_repel(aes(x = `contribution_Energy`/100, y = `inflation_2022M09`/100, label = Geo))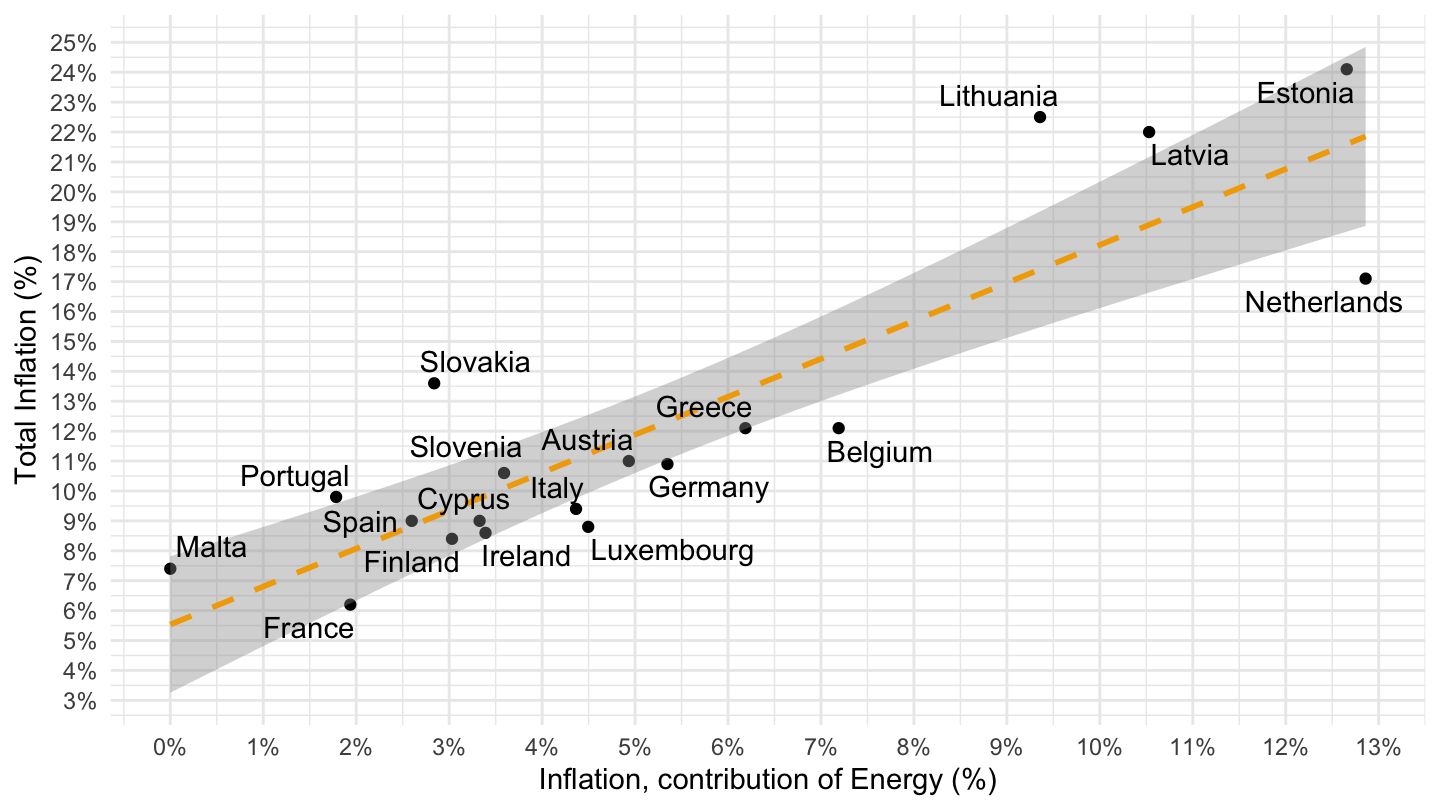
2021M11
Code
prc_hicp_manr_2021M11 <- prc_hicp_manr %>%
  filter(time == "2021M11",
         coicop == "CP00") %>%
  left_join(geo, by = "geo") %>%
  select(Geo, inflation_2021M11 = values)
prc_hicp_manr_2021M11 %>%
  inner_join(nrg_weights, by = "Geo") %>%
  arrange(-inflation_2021M11) %>%
  ggplot(.) + theme_minimal() + xlab("Share of energy (%)") + ylab("Inflation (%)") +
  geom_point(aes(x = `Energy, Non Administered Prices`/100, y = `inflation_2021M11`/100)) +
  scale_x_continuous(breaks = 0.01*seq(-100, 100, 1),
                     labels = percent_format(accuracy = 1)) +
  scale_y_continuous(breaks = 0.01*seq(-100, 100, 1),
                     labels = percent_format(accuracy = 1)) +
  stat_smooth(aes(x = `Energy, Non Administered Prices`/100, y = `inflation_2021M11`/100),
              linetype = 2, method = "lm", color = "#F2A900") +
  geom_text_repel(aes(x = `Energy, Non Administered Prices`/100, y = `inflation_2021M11`/100, label = Geo))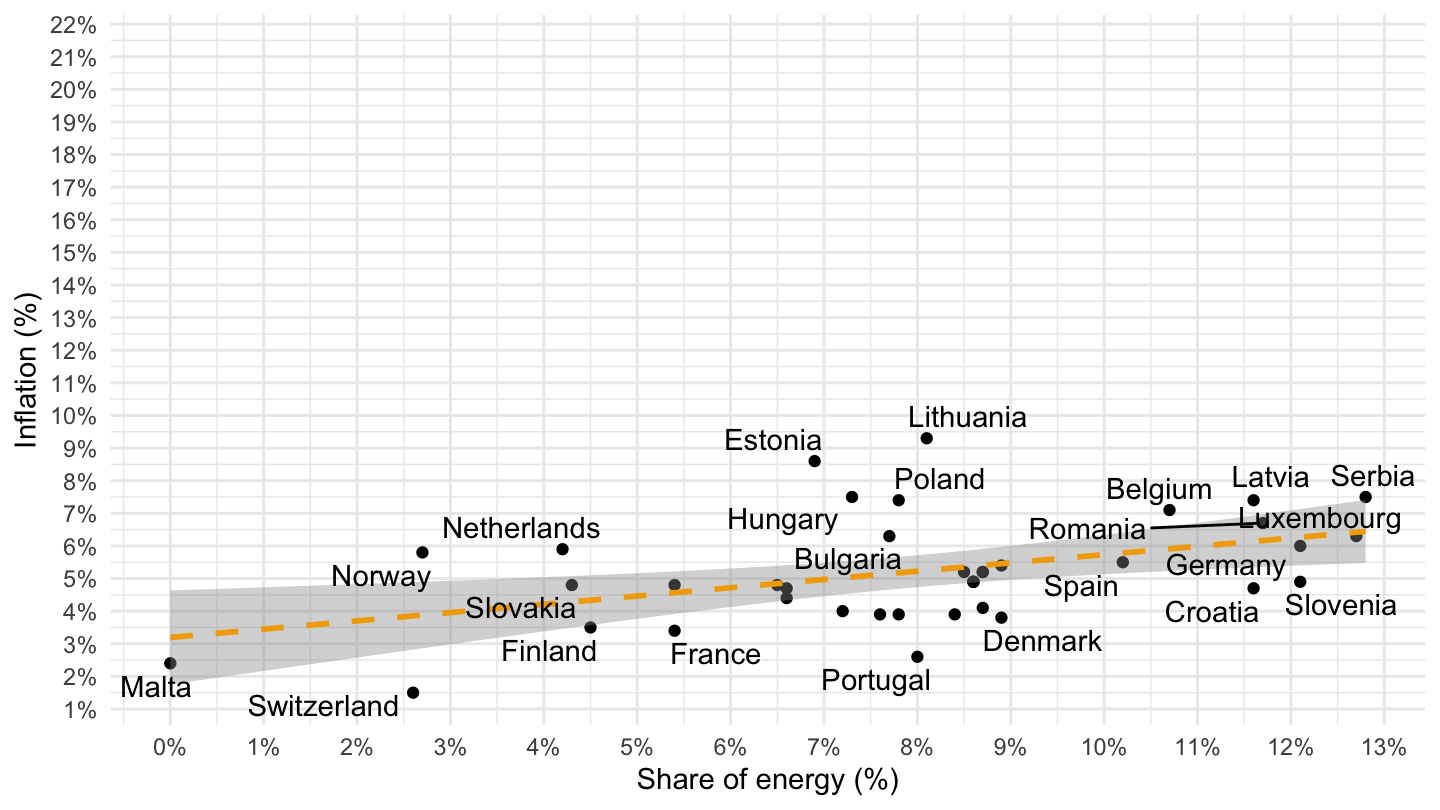
2022M10 - Inflation
Code
prc_hicp_manr_2022M10 %>%
  inner_join(nrg_weights, by = "Geo") %>%
  arrange(-inflation_2022M10) %>%
  ggplot(.) + theme_minimal() + xlab("Share of energy (%)") + ylab("Inflation (%)") +
  geom_point(aes(x = `Energy, Non Administered Prices`/100, y = `inflation_2022M10`/100)) +
  scale_x_continuous(breaks = 0.01*seq(-100, 100, 1),
                     labels = percent_format(accuracy = 1)) +
  scale_y_continuous(breaks = 0.01*seq(-100, 100, 1),
                     labels = percent_format(accuracy = 1)) +
  stat_smooth(aes(x = `Energy, Non Administered Prices`/100, y = `inflation_2022M10`/100),
              linetype = 2, method = "lm", color = "#F2A900") +
  geom_text_repel(aes(x = `Energy, Non Administered Prices`/100, y = `inflation_2022M10`/100, label = Geo))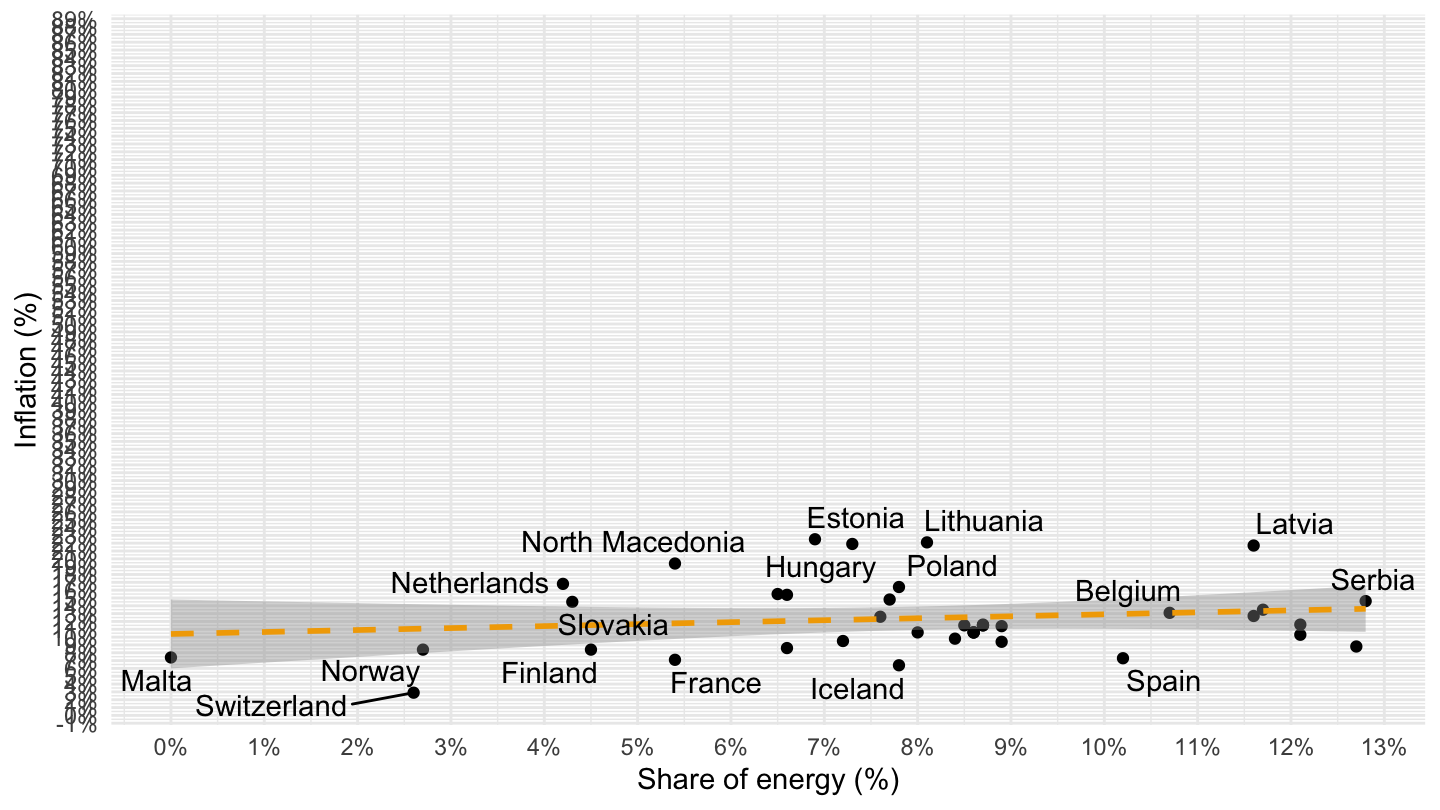
Energy
List - Online
- List. html
Code
i_g("bib/eurostat/NRG_aggregate.png")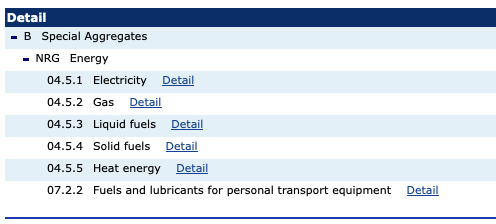
List - COICOP
Code
coicop_NRG <- c("CP0451", "CP04521", "CP04522", "CP0453", "CP04541", "CP04549", "CP0455",
                "CP07221", "CP07222", "CP07223")
All
Code
load_data("eurostat/coicop_fr.RData")
prc_hicp_manr %>%
  filter(coicop %in% c("CP00", "TOT_X_NRG", "TOT_X_NRG_FOOD_NP"),
         geo %in% c("EA")) %>%
  month_to_date %>%
  left_join(coicop, by = "coicop") %>%
  mutate(values = values/100) %>%
  ggplot(.) + geom_line(aes(x = date, y = values, color = Coicop)) +
  theme_minimal() + xlab("") + ylab("") +
  scale_x_date(breaks = seq(1960, 2100, 2) %>% paste0("-01-01") %>% as.Date,
               labels = date_format("%Y")) +
  #scale_color_manual(values = viridis(4)[1:3]) +
  scale_y_continuous(breaks = 0.01*seq(-20, 20, 1),
                     labels = percent_format(a = 1)) +
  theme(legend.position = c(0.4, 0.90),
        legend.title = element_blank())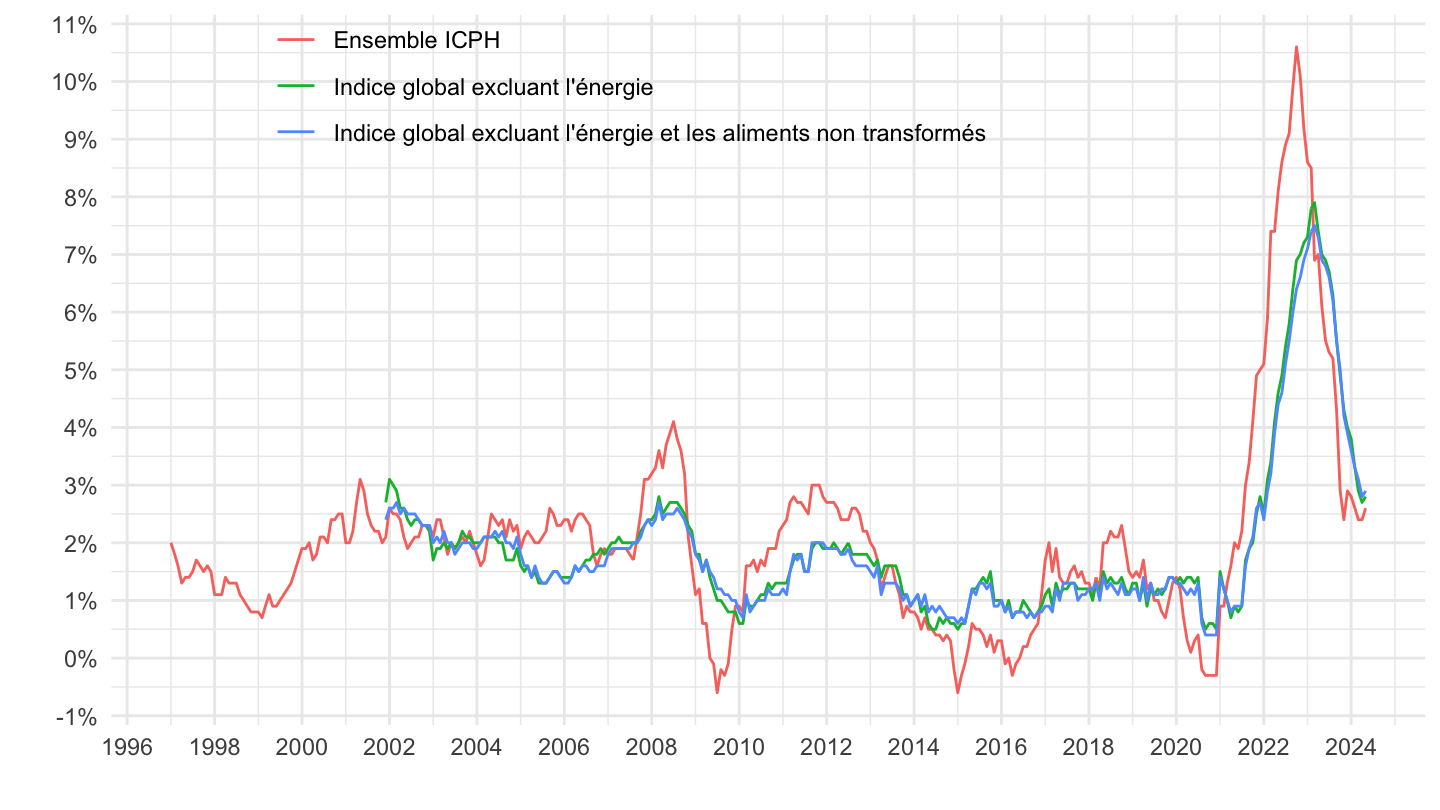
Code
load_data("eurostat/coicop.RData")2010-
Code
load_data("eurostat/coicop_fr.RData")
prc_hicp_manr %>%
  filter(coicop %in% c("CP00", "TOT_X_NRG", "TOT_X_NRG_FOOD_NP"),
         geo %in% c("EA")) %>%
  month_to_date %>%
  filter(date >= as.Date("2010-01-01")) %>%
  left_join(coicop, by = "coicop") %>%
  mutate(values = values/100) %>%
  ggplot(.) + geom_line(aes(x = date, y = values, color = Coicop)) +
  theme_minimal() + xlab("") + ylab("") +
  scale_x_date(breaks = seq(1960, 2100, 2) %>% paste0("-01-01") %>% as.Date,
               labels = date_format("%Y")) +
  #scale_color_manual(values = viridis(4)[1:3]) +
  scale_y_continuous(breaks = 0.01*seq(-20, 20, 1),
                     labels = percent_format(a = 1)) +
  theme(legend.position = c(0.4, 0.90),
        legend.title = element_blank())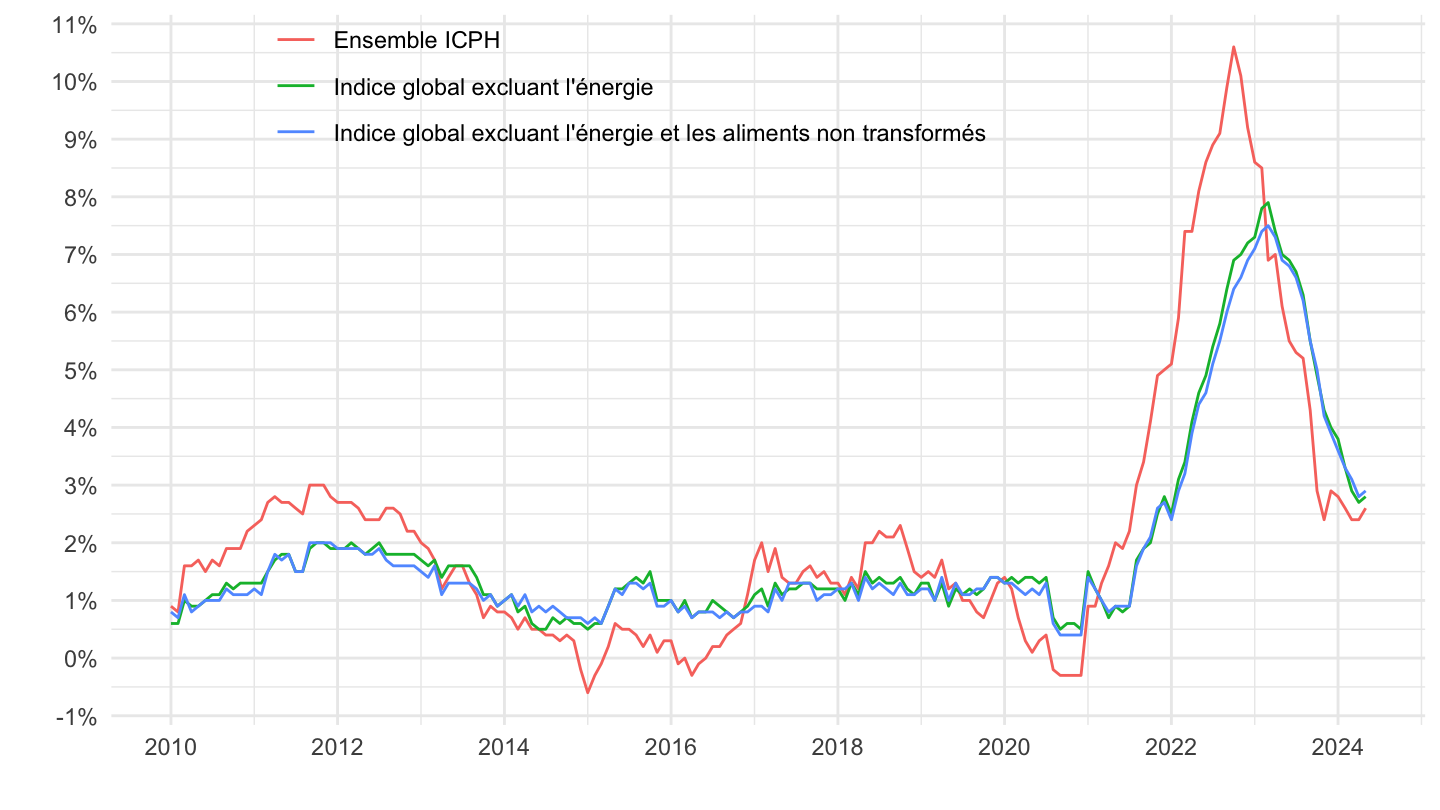
Code
load_data("eurostat/coicop.RData")2016-
Code
load_data("eurostat/coicop_fr.RData")
prc_hicp_manr %>%
  filter(coicop %in% c("CP00", "TOT_X_NRG", "TOT_X_NRG_FOOD_NP"),
         geo %in% c("EA")) %>%
  month_to_date %>%
  filter(date >= as.Date("2016-01-01")) %>%
  left_join(coicop, by = "coicop") %>%
  mutate(values = values/100) %>%
  ggplot(.) + geom_line(aes(x = date, y = values, color = Coicop)) +
  theme_minimal() + xlab("") + ylab("") +
  scale_x_date(breaks = seq(1960, 2100, 1) %>% paste0("-01-01") %>% as.Date,
               labels = date_format("%Y")) +
  #scale_color_manual(values = viridis(4)[1:3]) +
  scale_y_continuous(breaks = 0.01*seq(-20, 20, 1),
                     labels = percent_format(a = 1)) +
  theme(legend.position = c(0.4, 0.90),
        legend.title = element_blank())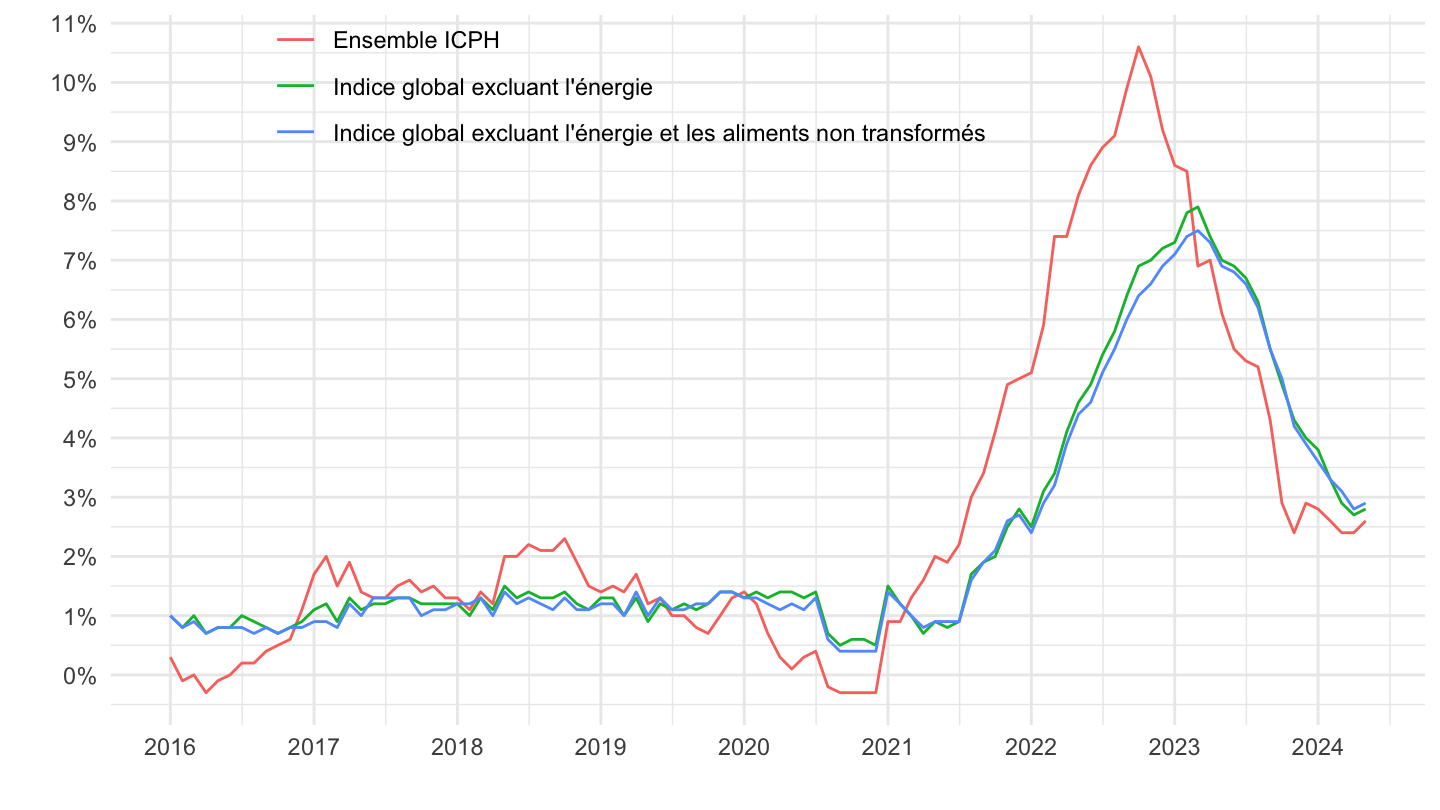
Code
load_data("eurostat/coicop.RData")France, Germany, Italy, Netherlands, Europe
CP04521 - Town gas
2020-
Code
prc_hicp_manr %>%
  filter(coicop == "CP04521",
         geo %in% c("FR", "BE", "IT", "EA20", "NL")) %>%
  month_to_date %>%
  filter(date >= as.Date("2020-01-01")) %>%
  left_join(geo, by = "geo") %>%
  mutate(Geo = ifelse(geo == "EA20", "Europe", Geo)) %>%
  left_join(colors, by = c("Geo" = "country")) %>%
  mutate(values = values/100) %>%
  ggplot(.) + geom_line(aes(x = date, y = values, color = color)) +
  theme_minimal() + xlab("") + ylab("Inflation, CP04521 - Natural gas and town gas (%)") +
  scale_x_date(breaks = seq.Date(as.Date("2019-12-01"), as.Date("2100-01-01"), "3 months"),
               labels = date_format("%b %Y")) +
  scale_y_continuous(breaks = 0.01*seq(-20, 400, 20),
                     labels = percent_format(a = 1)) +
  scale_color_identity() + add_5flags +
  geom_hline(yintercept = 0, linetype = "dashed")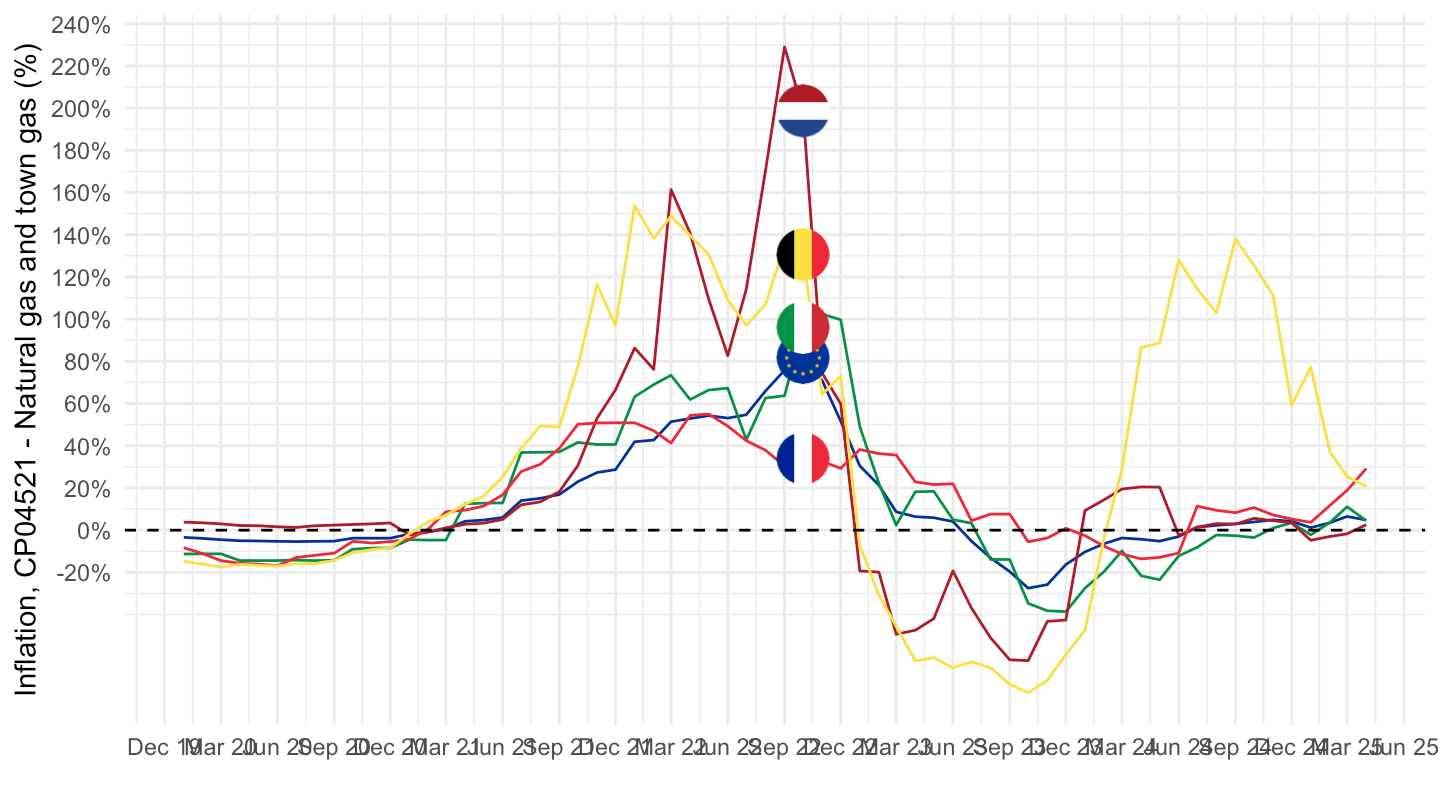
CP0451 - Electricity
2020-
Code
prc_hicp_manr %>%
  filter(coicop == "CP0451",
         geo %in% c("FR", "DE", "IT", "EA20", "NL", "BE")) %>%
  month_to_date %>%
  filter(date >= as.Date("2021-01-01")) %>%
  left_join(geo, by = "geo") %>%
  mutate(Geo = ifelse(geo == "EA20", "Europe", Geo)) %>%
  left_join(colors, by = c("Geo" = "country")) %>%
  mutate(values = values/100) %>%
  ggplot(.) + geom_line(aes(x = date, y = values, color = color)) +
  theme_minimal() + xlab("") + ylab("Inflation, CP0451 - Electricité (%)") +
  scale_x_date(breaks = seq.Date(as.Date("2019-12-01"), as.Date("2100-01-01"), "6 months"),
               labels = date_format("%b %Y")) +
  scale_y_continuous(breaks = 0.01*seq(-20, 400, 20),
                     labels = percent_format(a = 1)) +
  scale_color_identity() + add_6flags +
  geom_hline(yintercept = 0, linetype = "dashed")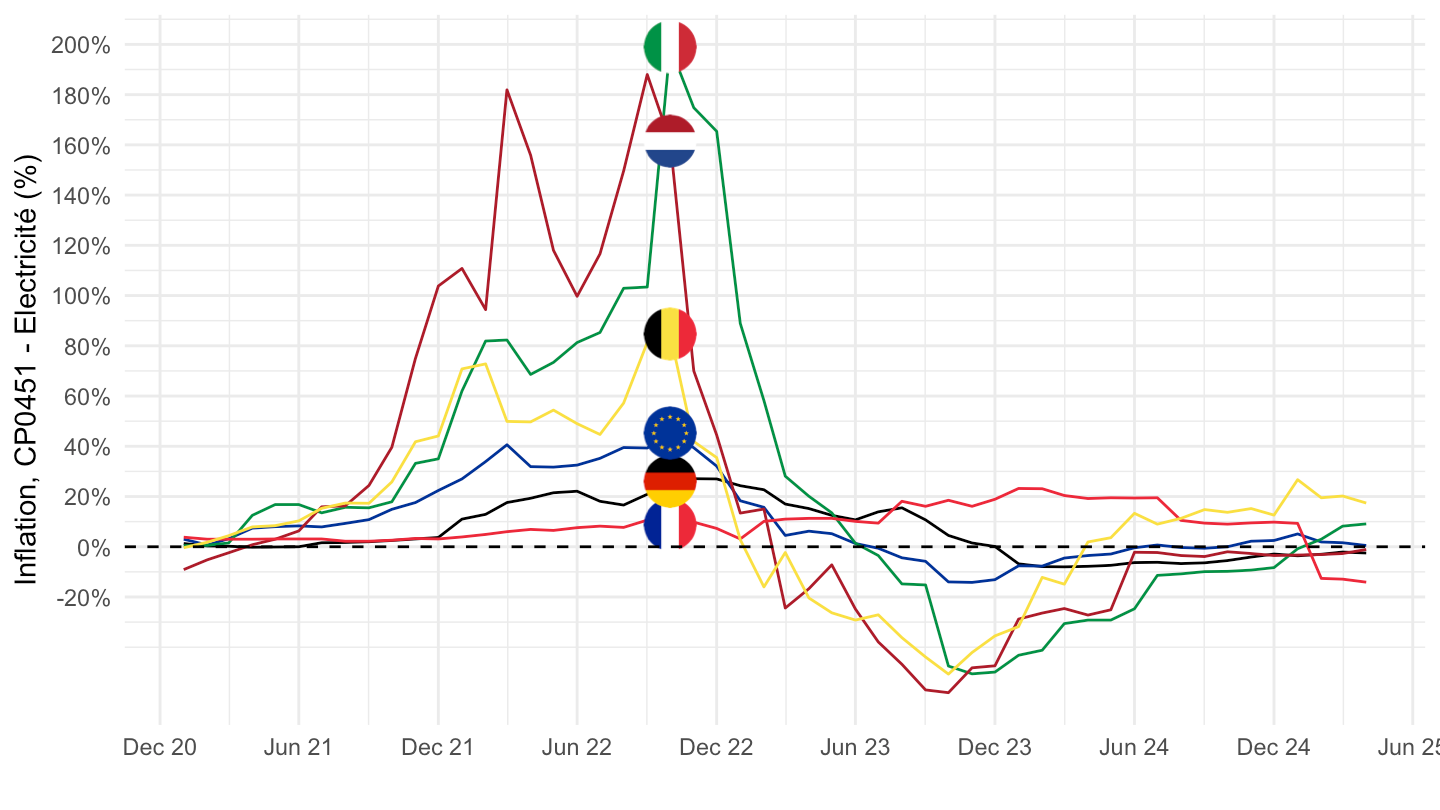
France, Germany, Italy, Spain, Europe
CP00
All
Code
prc_hicp_manr %>%
  filter(coicop == "CP00",
         geo %in% c("FR", "DE", "ES", "IT", "EA20", "US")) %>%
  month_to_date %>%
  left_join(geo, by = "geo") %>%
  mutate(Geo = ifelse(geo == "EA20", "Europe", Geo)) %>%
  left_join(colors, by = c("Geo" = "country")) %>%
  mutate(values = values/100) %>%
  ggplot(.) + geom_line(aes(x = date, y = values, color = color)) +
  theme_minimal() + xlab("") + ylab("") +
  scale_x_date(breaks = seq(1960, 2100, 2) %>% paste0("-01-01") %>% as.Date,
               labels = date_format("%Y")) +
  scale_y_continuous(breaks = 0.01*seq(-20, 20, 1),
                     labels = percent_format(a = 1)) +
  scale_color_identity() + add_5flags +
  theme(legend.position = c(0.75, 0.90),
        legend.title = element_blank())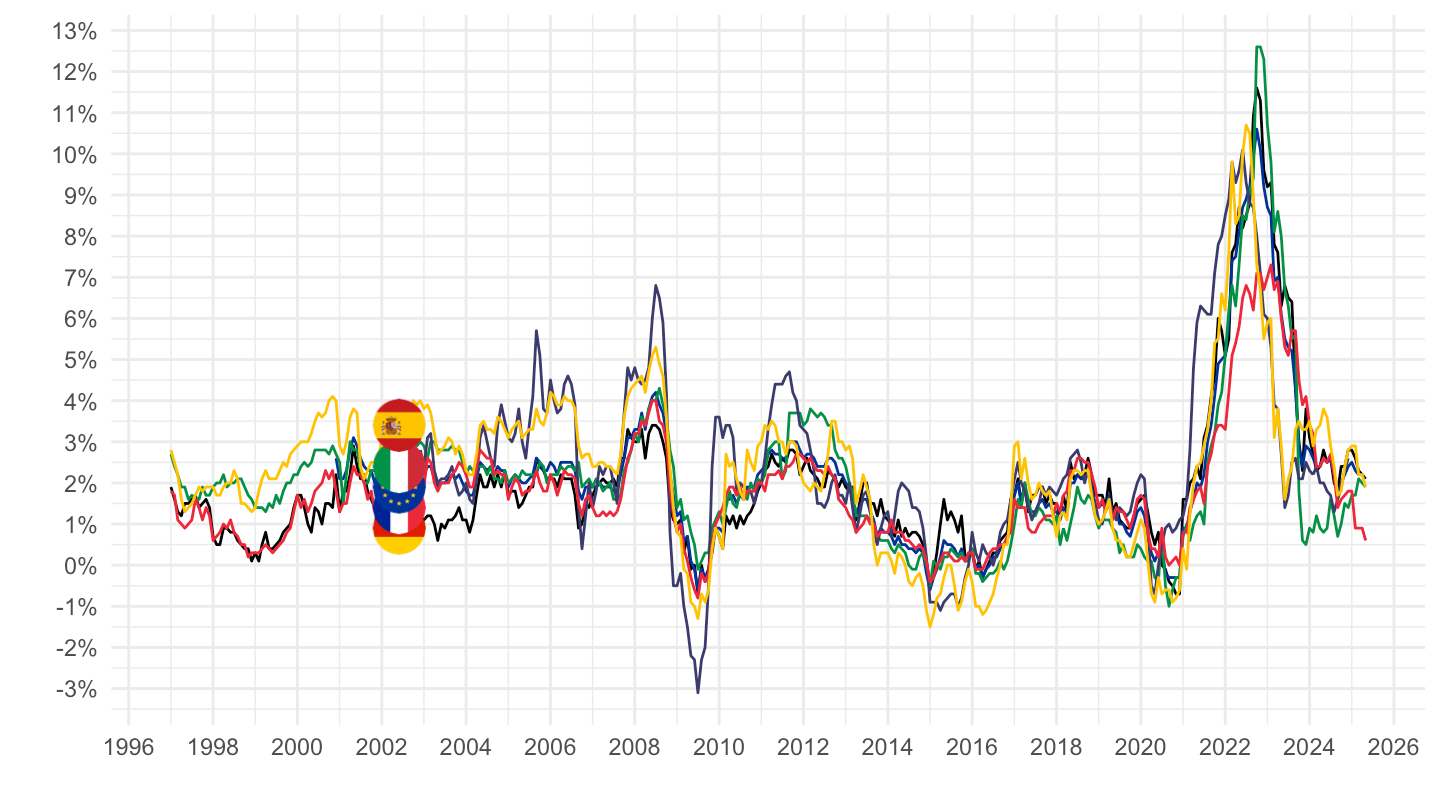
2 years
Code
prc_hicp_manr %>%
  filter(coicop == "CP00",
         geo %in% c("FR", "DE", "ES", "IT", "EA20", "US")) %>%
  month_to_date %>%
  filter(date >= max(date) - years(2)) %>%
  left_join(geo, by = "geo") %>%
  mutate(Geo = ifelse(geo == "EA20", "Europe", Geo)) %>%
  left_join(colors, by = c("Geo" = "country")) %>%
  mutate(values = values/100) %>%
  ggplot(.) + geom_line(aes(x = date, y = values, color = color)) +
  theme_minimal() + xlab("") + ylab("") +
  scale_x_date(breaks = seq.Date(as.Date("2019-12-01"), as.Date("2100-01-01"), "2 months"),
               labels = date_format("%b %Y")) +
  scale_y_continuous(breaks = 0.01*seq(-20, 20, 1),
                     labels = percent_format(a = 1)) +
  scale_color_identity() + add_6flags +
  theme(legend.position = c(0.75, 0.90),
        legend.title = element_blank(),
        axis.text.x = element_text(angle = 45, vjust = 1, hjust = 1))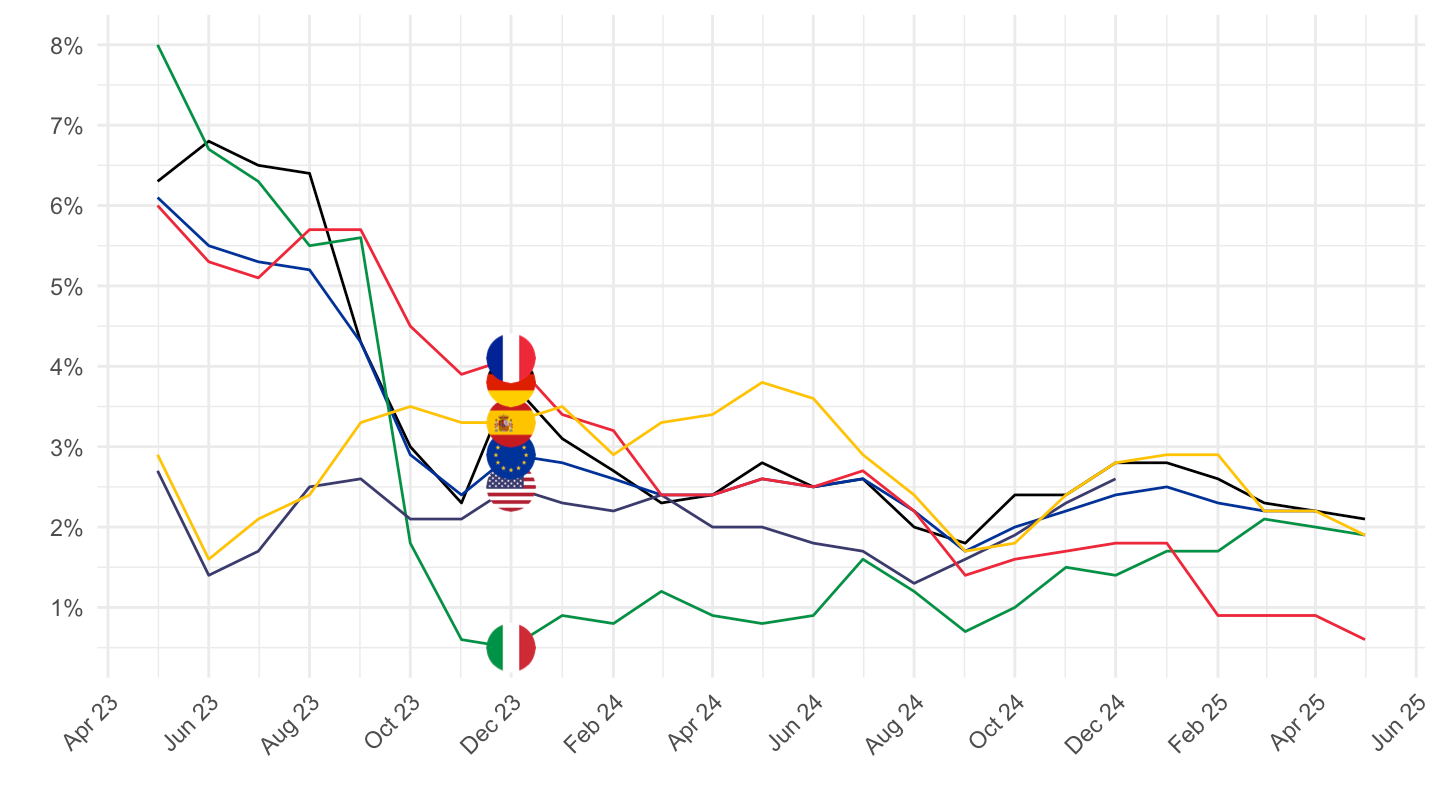
France, Germany, Belgium, Netherlands
Total
Code
prc_hicp_manr %>%
  filter(coicop == "CP00",
         geo %in% c("FR", "DE", "BE", "NL")) %>%
  month_to_date %>%
  filter(date >= max(date) - years(2)) %>%
  left_join(geo, by = "geo") %>%
  mutate(Geo = ifelse(geo == "EA20", "Europe", Geo)) %>%
  left_join(colors, by = c("Geo" = "country")) %>%
  mutate(values = values/100) %>%
  ggplot(.) + geom_line(aes(x = date, y = values, color = color)) +
  theme_minimal() + xlab("") + ylab("") +
  scale_x_date(breaks = seq.Date(as.Date("2019-12-01"), as.Date("2100-01-01"), "1 month"),
               labels = date_format("%b %Y")) +
  scale_y_continuous(breaks = 0.01*seq(-20, 20, 1),
                     labels = percent_format(a = 1)) +
  scale_color_identity() + add_4flags +
  theme(legend.position = c(0.75, 0.90),
        legend.title = element_blank(),
        axis.text.x = element_text(angle = 45, vjust = 1, hjust = 1))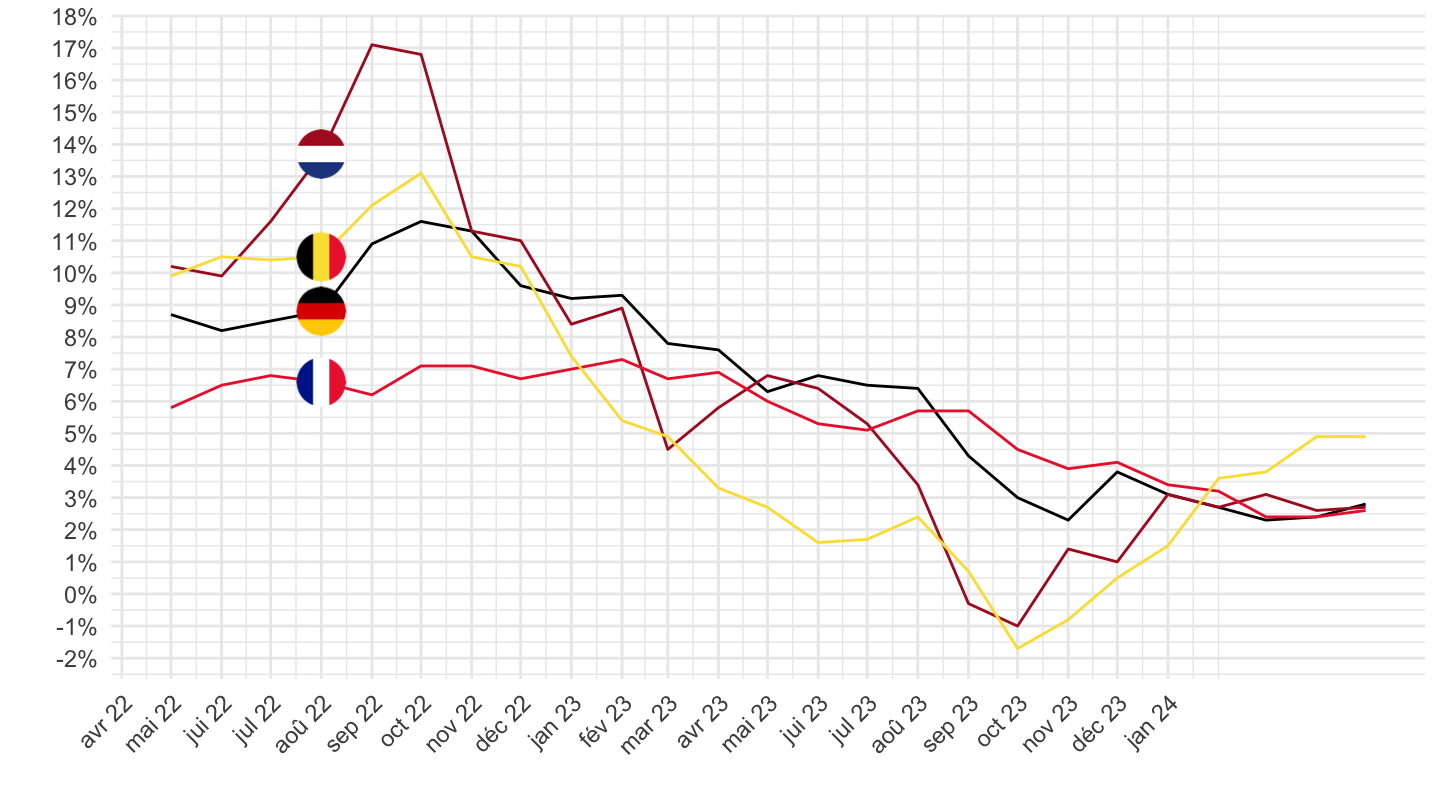
Core
Code
prc_hicp_manr %>%
  filter(coicop == "TOT_X_NRG_FOOD",
         geo %in% c("FR", "DE", "BE", "NL")) %>%
  month_to_date %>%
  filter(date >= max(date) - years(2)) %>%
  left_join(geo, by = "geo") %>%
  mutate(Geo = ifelse(geo == "EA20", "Europe", Geo)) %>%
  left_join(colors, by = c("Geo" = "country")) %>%
  mutate(values = values/100) %>%
  ggplot(.) + geom_line(aes(x = date, y = values, color = color)) +
  theme_minimal() + xlab("") + ylab("") +
  scale_x_date(breaks = seq.Date(as.Date("2019-12-01"), as.Date("2100-01-01"), "1 month"),
               labels = date_format("%b %Y")) +
  scale_y_continuous(breaks = 0.01*seq(-20, 20, 1),
                     labels = percent_format(a = 1)) +
  scale_color_identity() + add_4flags +
  theme(legend.position = c(0.75, 0.90),
        legend.title = element_blank(),
        axis.text.x = element_text(angle = 45, vjust = 1, hjust = 1))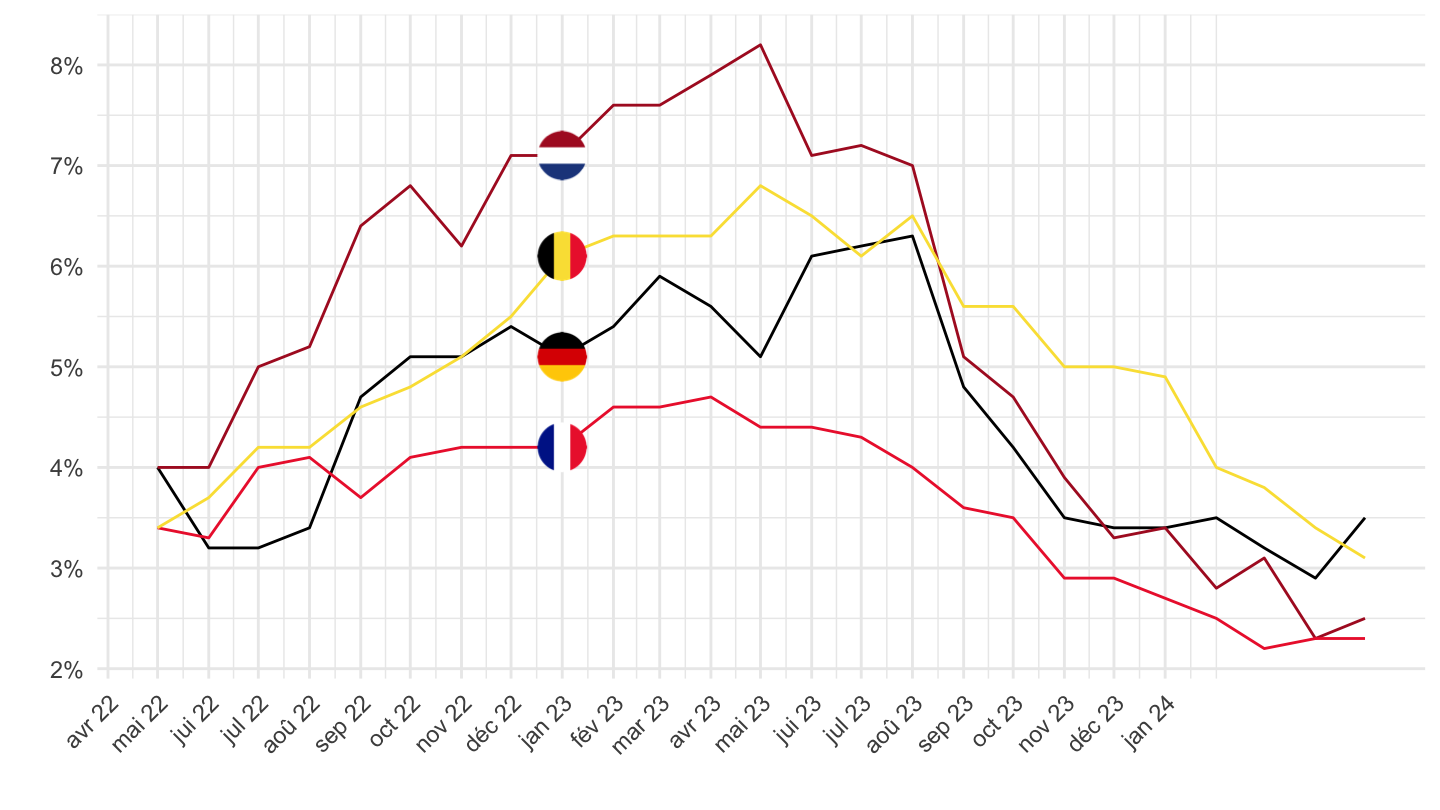
CP04521 - Natural gas and town gas
Code
prc_hicp_manr %>%
  filter(coicop == "CP04521",
         geo %in% c("FR", "DE", "BE", "NL")) %>%
  month_to_date %>%
  filter(date >= max(date) - years(2)) %>%
  left_join(geo, by = "geo") %>%
  mutate(Geo = ifelse(geo == "EA20", "Europe", Geo)) %>%
  left_join(colors, by = c("Geo" = "country")) %>%
  mutate(values = values/100) %>%
  ggplot(.) + geom_line(aes(x = date, y = values, color = color)) +
  theme_minimal() + xlab("") + ylab("Natural gas and twon gas") +
  scale_x_date(breaks = seq.Date(as.Date("2019-12-01"), as.Date("2100-01-01"), "1 month"),
               labels = date_format("%b %Y")) +
  scale_y_continuous(breaks = 0.01*seq(-300, 300, 10),
                     labels = percent_format(a = 1)) +
  scale_color_identity() + add_4flags +
  theme(legend.position = c(0.75, 0.90),
        legend.title = element_blank(),
        axis.text.x = element_text(angle = 45, vjust = 1, hjust = 1))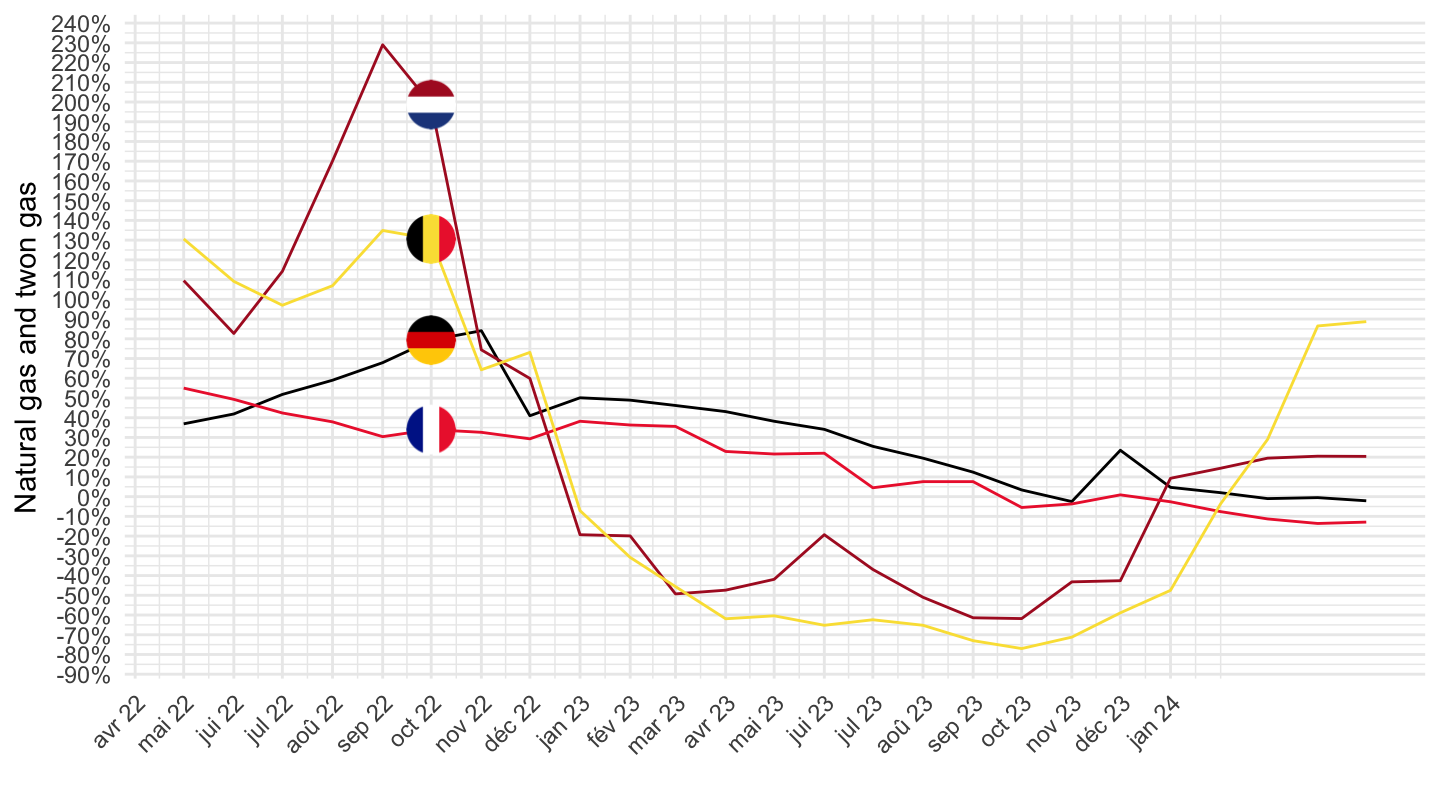
France, Germany, Italy, Spain, Europe
CP00
All
Code
prc_hicp_manr %>%
  filter(coicop == "CP00",
         geo %in% c("FR", "DE", "ES", "IT", "EA20")) %>%
  month_to_date %>%
  left_join(geo, by = "geo") %>%
  mutate(Geo = ifelse(geo == "EA20", "Europe", Geo)) %>%
  left_join(colors, by = c("Geo" = "country")) %>%
  mutate(values = values/100) %>%
  ggplot(.) + geom_line(aes(x = date, y = values, color = color)) +
  theme_minimal() + xlab("") + ylab("") +
  scale_x_date(breaks = seq(1960, 2100, 2) %>% paste0("-01-01") %>% as.Date,
               labels = date_format("%Y")) +
  scale_y_continuous(breaks = 0.01*seq(-20, 20, 1),
                     labels = percent_format(a = 1)) +
  scale_color_identity() + add_5flags +
  theme(legend.position = c(0.75, 0.90),
        legend.title = element_blank())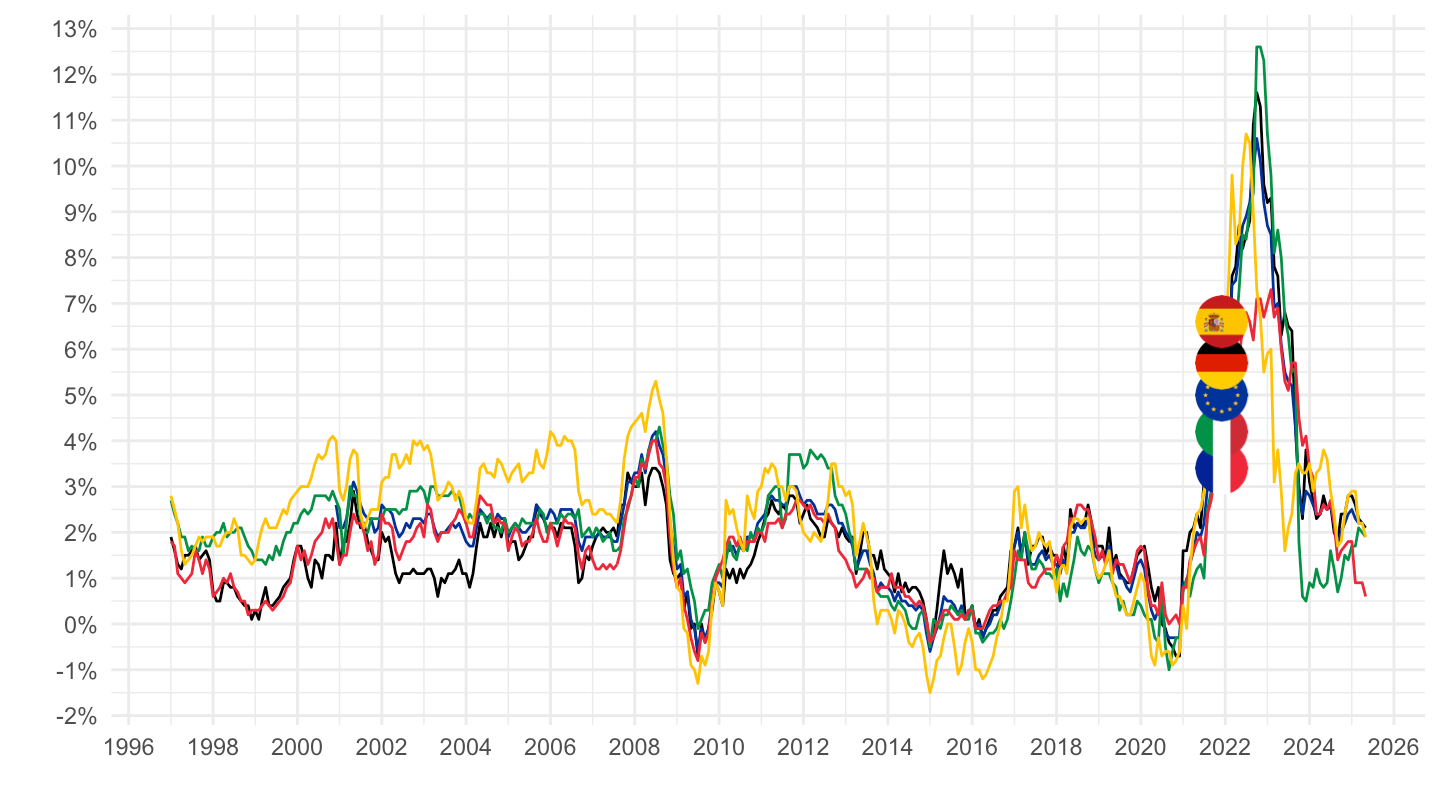
2016-
Code
prc_hicp_manr %>%
  filter(coicop == "CP00",
         geo %in% c("FR", "DE", "ES", "IT", "EA20")) %>%
  month_to_date %>%
  filter(date >= as.Date("2016-01-01")) %>%
  left_join(geo, by = "geo") %>%
  mutate(Geo = ifelse(geo == "EA20", "Europe", Geo)) %>%
  left_join(colors, by = c("Geo" = "country")) %>%
  mutate(values = values/100) %>%
  ggplot(.) + geom_line(aes(x = date, y = values, color = color)) +
  theme_minimal() + xlab("") + ylab("") +
  scale_x_date(breaks = seq(1960, 2100, 1) %>% paste0("-01-01") %>% as.Date,
               labels = date_format("%Y")) +
  scale_y_continuous(breaks = 0.01*seq(-20, 20, 1),
                     labels = percent_format(a = 1)) +
  scale_color_identity() + add_5flags +
  theme(legend.position = c(0.75, 0.90),
        legend.title = element_blank())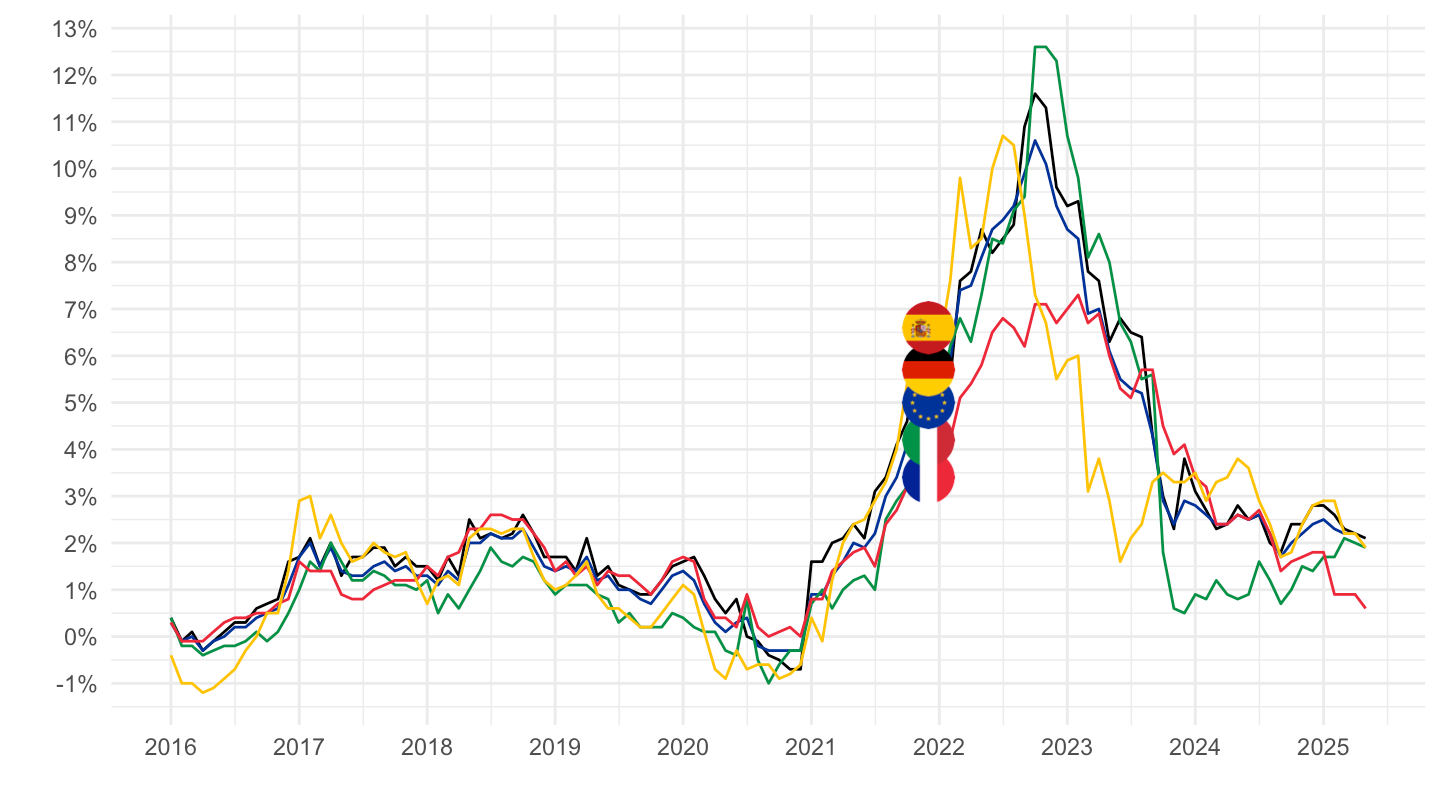
2020-
Code
prc_hicp_manr %>%
  filter(coicop == "CP00",
         geo %in% c("FR", "DE", "ES", "IT", "NL", "EA20")) %>%
  month_to_date %>%
  filter(date >= as.Date("2020-01-01")) %>%
  left_join(geo, by = "geo") %>%
  mutate(Geo = ifelse(geo == "EA20", "Europe", Geo)) %>%
  left_join(colors, by = c("Geo" = "country")) %>%
  mutate(values = values/100) %>%
  ggplot(.) + geom_line(aes(x = date, y = values, color = color)) +
  theme_minimal() + xlab("") + ylab("") +
  scale_x_date(breaks = seq.Date(as.Date("2019-12-01"), as.Date("2100-01-01"), "3 months"),
               labels = date_format("%b %Y")) +
  scale_y_continuous(breaks = 0.01*seq(-20, 20, 1),
                     labels = percent_format(a = 1)) +
  scale_color_identity() + add_6flags +
  theme(legend.position = c(0.75, 0.90),
        legend.title = element_blank(),
        axis.text.x = element_text(angle = 45, vjust = 1, hjust = 1))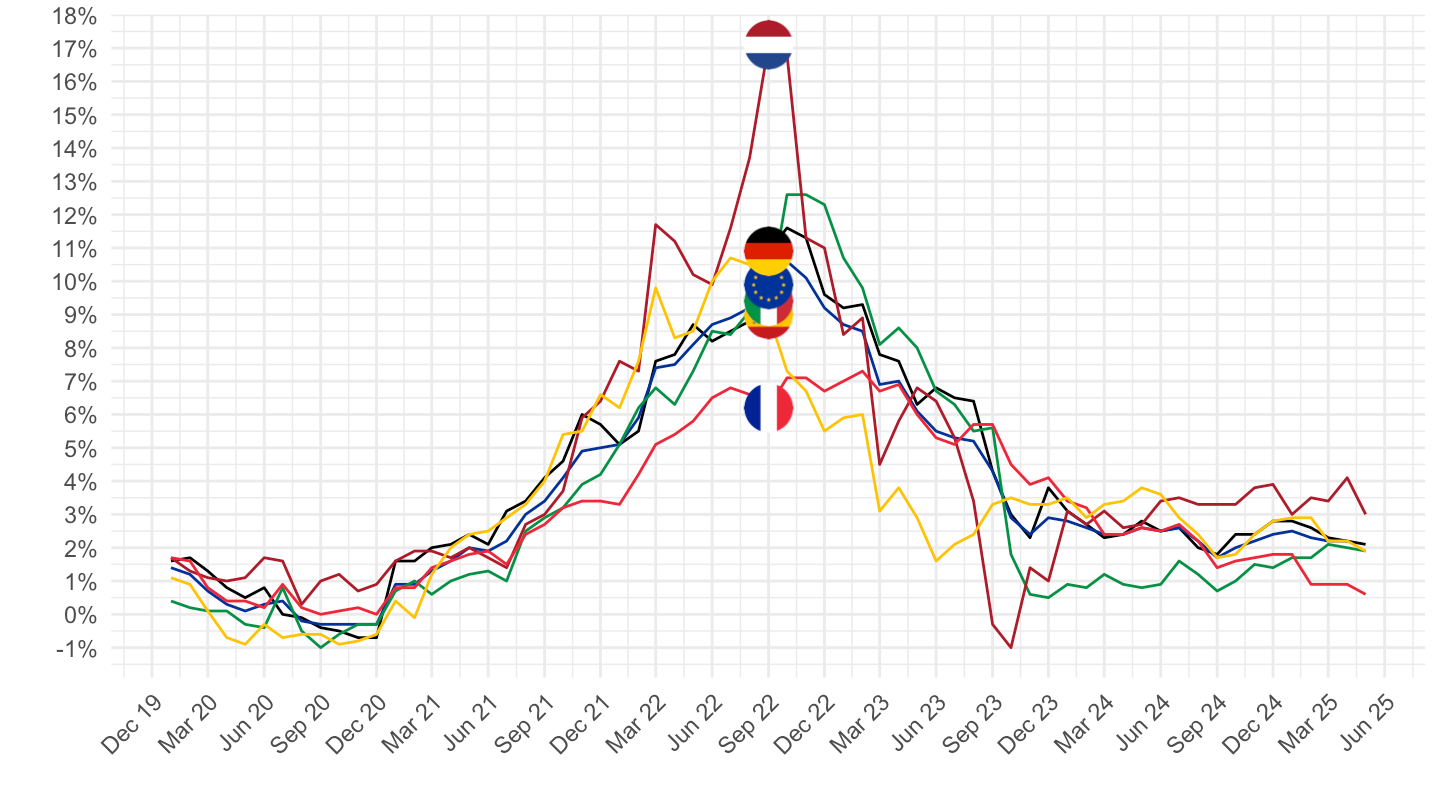
CP041
All
Code
prc_hicp_manr %>%
  filter(coicop == "CP041",
         geo %in% c("FR", "DE", "ES", "IT", "EA20")) %>%
  month_to_date %>%
  left_join(geo, by = "geo") %>%
  mutate(Geo = ifelse(geo == "EA20", "Europe", Geo)) %>%
  left_join(colors, by = c("Geo" = "country")) %>%
  mutate(values = values/100) %>%
  ggplot(.) + geom_line(aes(x = date, y = values, color = color)) +
  theme_minimal() + xlab("") + ylab("") +
  scale_x_date(breaks = seq(1960, 2100, 2) %>% paste0("-01-01") %>% as.Date,
               labels = date_format("%Y")) +
  scale_y_continuous(breaks = 0.01*seq(-20, 20, 1),
                     labels = percent_format(a = 1)) +
  scale_color_identity() + add_5flags +
  theme(legend.position = c(0.75, 0.90),
        legend.title = element_blank())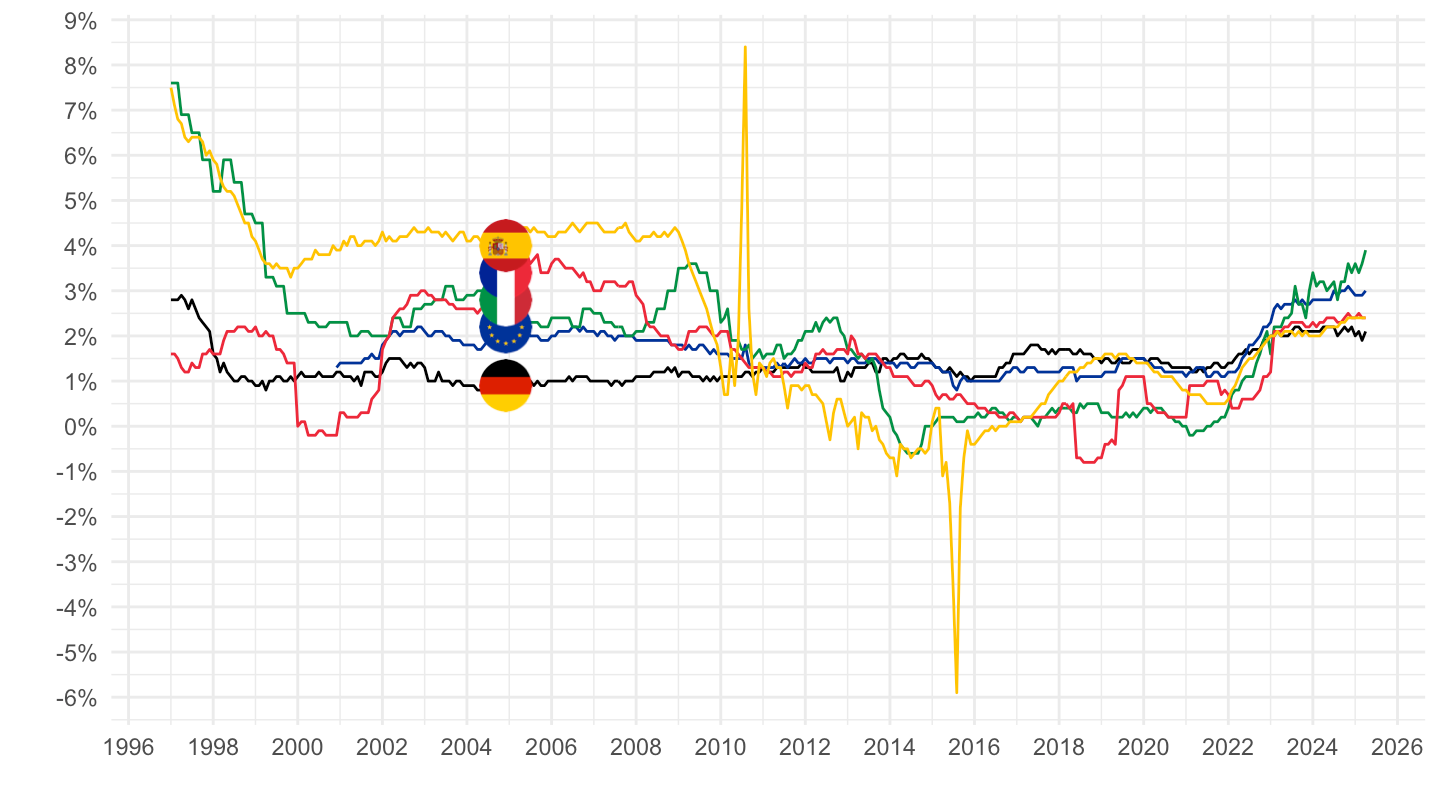
2016-
Code
prc_hicp_manr %>%
  filter(coicop == "CP041",
         geo %in% c("FR", "DE", "ES", "IT", "EA20")) %>%
  month_to_date %>%
  filter(date >= as.Date("2016-01-01")) %>%
  left_join(geo, by = "geo") %>%
  mutate(Geo = ifelse(geo == "EA20", "Europe", Geo)) %>%
  left_join(colors, by = c("Geo" = "country")) %>%
  mutate(values = values/100) %>%
  ggplot(.) + geom_line(aes(x = date, y = values, color = color)) +
  theme_minimal() + xlab("") + ylab("") +
  scale_x_date(breaks = seq(1960, 2100, 1) %>% paste0("-01-01") %>% as.Date,
               labels = date_format("%Y")) +
  scale_y_continuous(breaks = 0.01*seq(-20, 20, 1),
                     labels = percent_format(a = 1)) +
  scale_color_identity() + add_5flags +
  theme(legend.position = c(0.75, 0.90),
        legend.title = element_blank())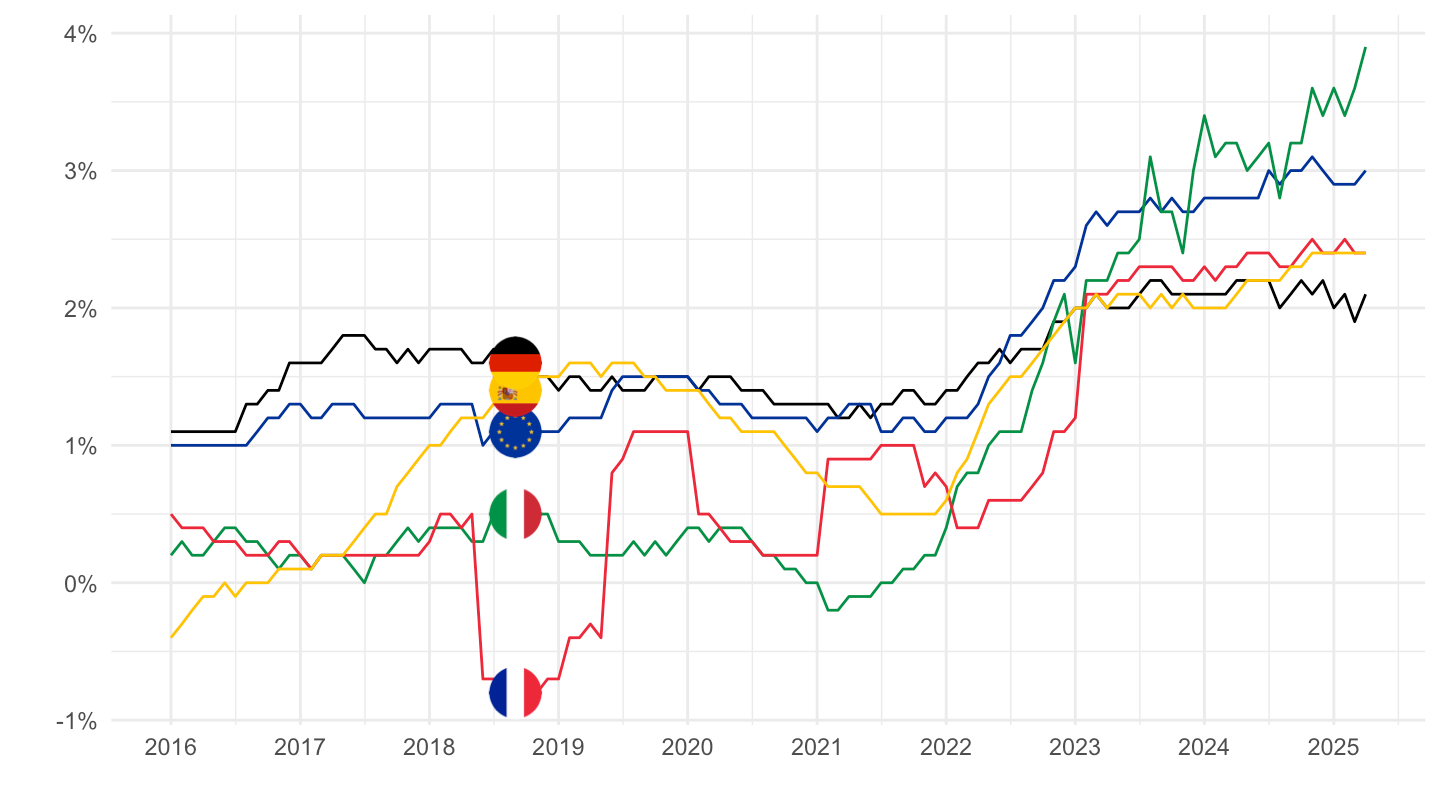
2020-
Code
prc_hicp_manr %>%
  filter(coicop == "CP041",
         geo %in% c("FR", "DE", "ES", "IT", "EA20")) %>%
  month_to_date %>%
  filter(date >= as.Date("2020-01-01")) %>%
  left_join(geo, by = "geo") %>%
  mutate(Geo = ifelse(geo == "EA20", "Europe", Geo)) %>%
  left_join(colors, by = c("Geo" = "country")) %>%
  mutate(values = values/100) %>%
  ggplot(.) + geom_line(aes(x = date, y = values, color = color)) +
  theme_minimal() + xlab("") + ylab("") +
  scale_x_date(breaks = seq.Date(as.Date("2019-12-01"), as.Date("2100-01-01"), "3 months"),
               labels = date_format("%b %Y")) +
  scale_y_continuous(breaks = 0.01*seq(-20, 20, .5),
                     labels = percent_format(a = .1)) +
  scale_color_identity() + add_5flags +
  theme(legend.position = c(0.75, 0.90),
        legend.title = element_blank(),
        axis.text.x = element_text(angle = 45, vjust = 1, hjust = 1))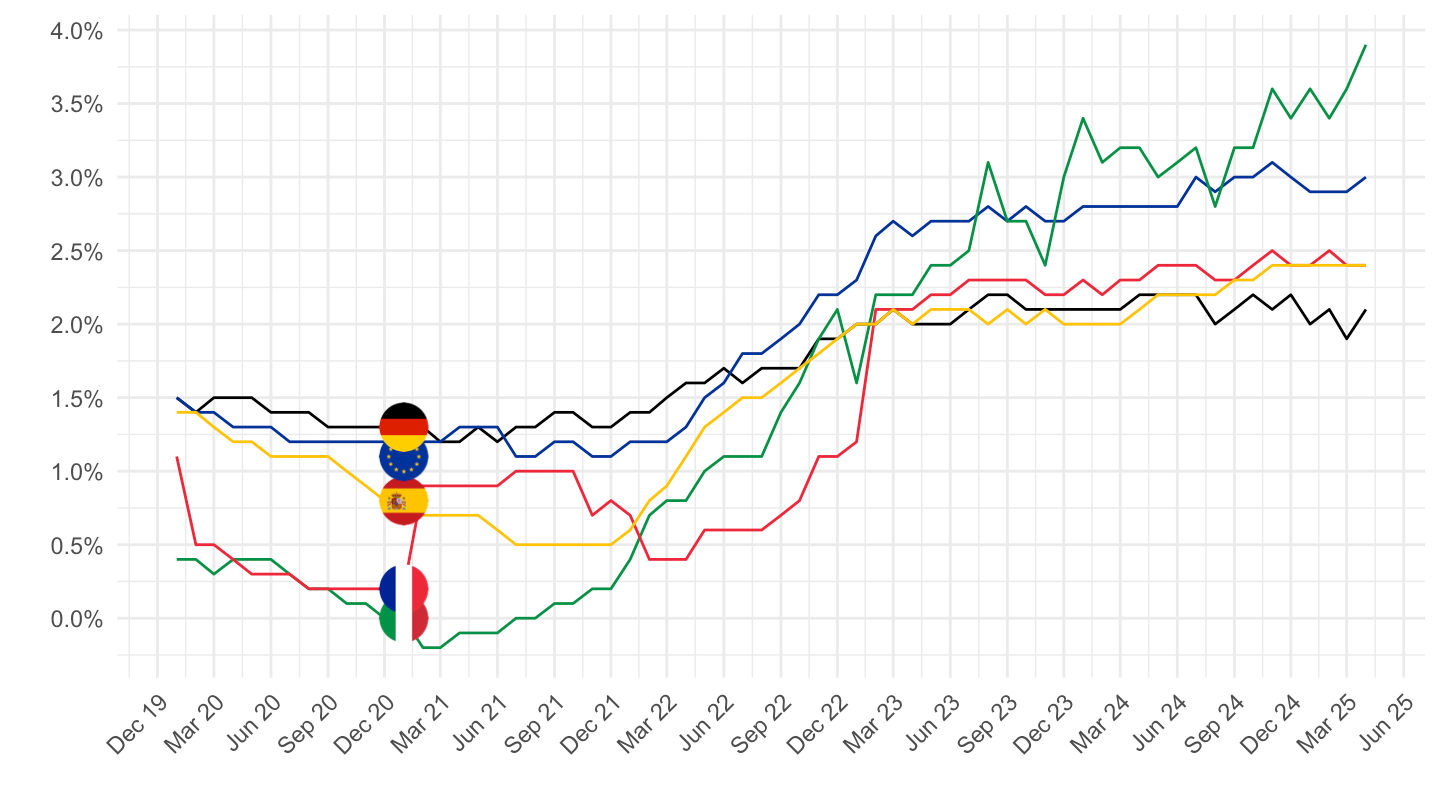
2 years
Code
prc_hicp_manr %>%
  filter(coicop == "CP041",
         geo %in% c("FR", "DE", "ES", "IT", "EA20")) %>%
  month_to_date %>%
  filter(date >= max(date) - years(2)) %>%
  left_join(geo, by = "geo") %>%
  mutate(Geo = ifelse(geo == "EA20", "Europe", Geo)) %>%
  left_join(colors, by = c("Geo" = "country")) %>%
  mutate(values = values/100) %>%
  ggplot(.) + geom_line(aes(x = date, y = values, color = color)) +
  theme_minimal() + xlab("") + ylab("") +
  scale_x_date(breaks = seq.Date(as.Date("2019-12-01"), as.Date("2100-01-01"), "1 months"),
               labels = date_format("%b %Y")) +
  scale_y_continuous(breaks = 0.01*seq(-20, 20, .5),
                     labels = percent_format(a = .1)) +
  scale_color_identity() + add_5flags +
  theme(legend.position = c(0.75, 0.90),
        legend.title = element_blank(),
        axis.text.x = element_text(angle = 45, vjust = 1, hjust = 1))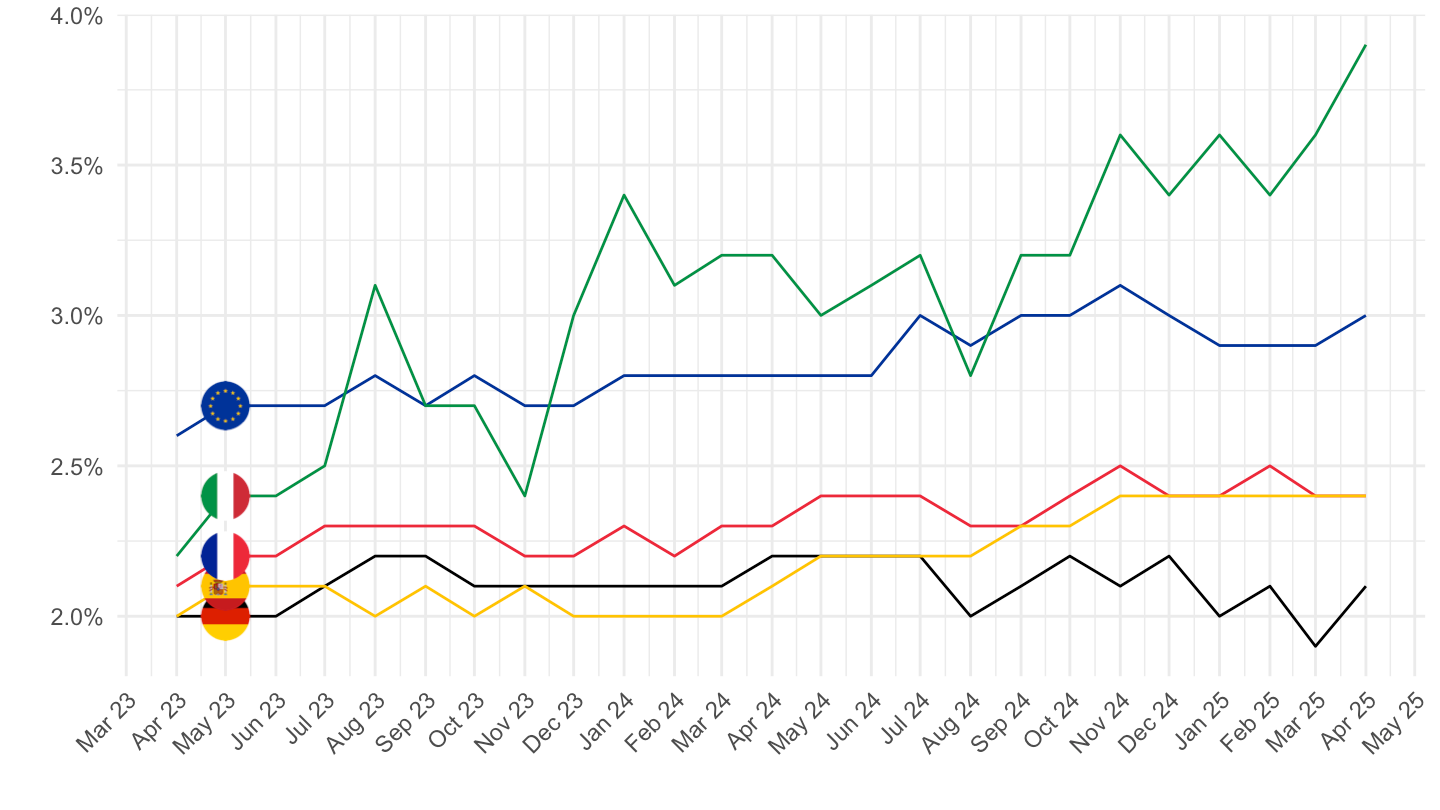
1 year
Code
prc_hicp_manr %>%
  filter(coicop == "CP041",
         geo %in% c("FR", "DE", "ES", "IT", "EA20")) %>%
  month_to_date %>%
  filter(date >= max(date) - years(1)) %>%
  left_join(geo, by = "geo") %>%
  mutate(Geo = ifelse(geo == "EA20", "Europe", Geo)) %>%
  left_join(colors, by = c("Geo" = "country")) %>%
  mutate(values = values/100) %>%
  ggplot(.) + geom_line(aes(x = date, y = values, color = color)) +
  theme_minimal() + xlab("") + ylab("") +
  scale_x_date(breaks = seq.Date(as.Date("2019-12-01"), as.Date("2100-01-01"), "1 months"),
               labels = date_format("%b %Y")) +
  scale_y_continuous(breaks = 0.01*seq(-20, 20, .2),
                     labels = percent_format(a = .1)) +
  scale_color_identity() + add_5flags +
  theme(legend.position = c(0.75, 0.90),
        legend.title = element_blank(),
        axis.text.x = element_text(angle = 45, vjust = 1, hjust = 1))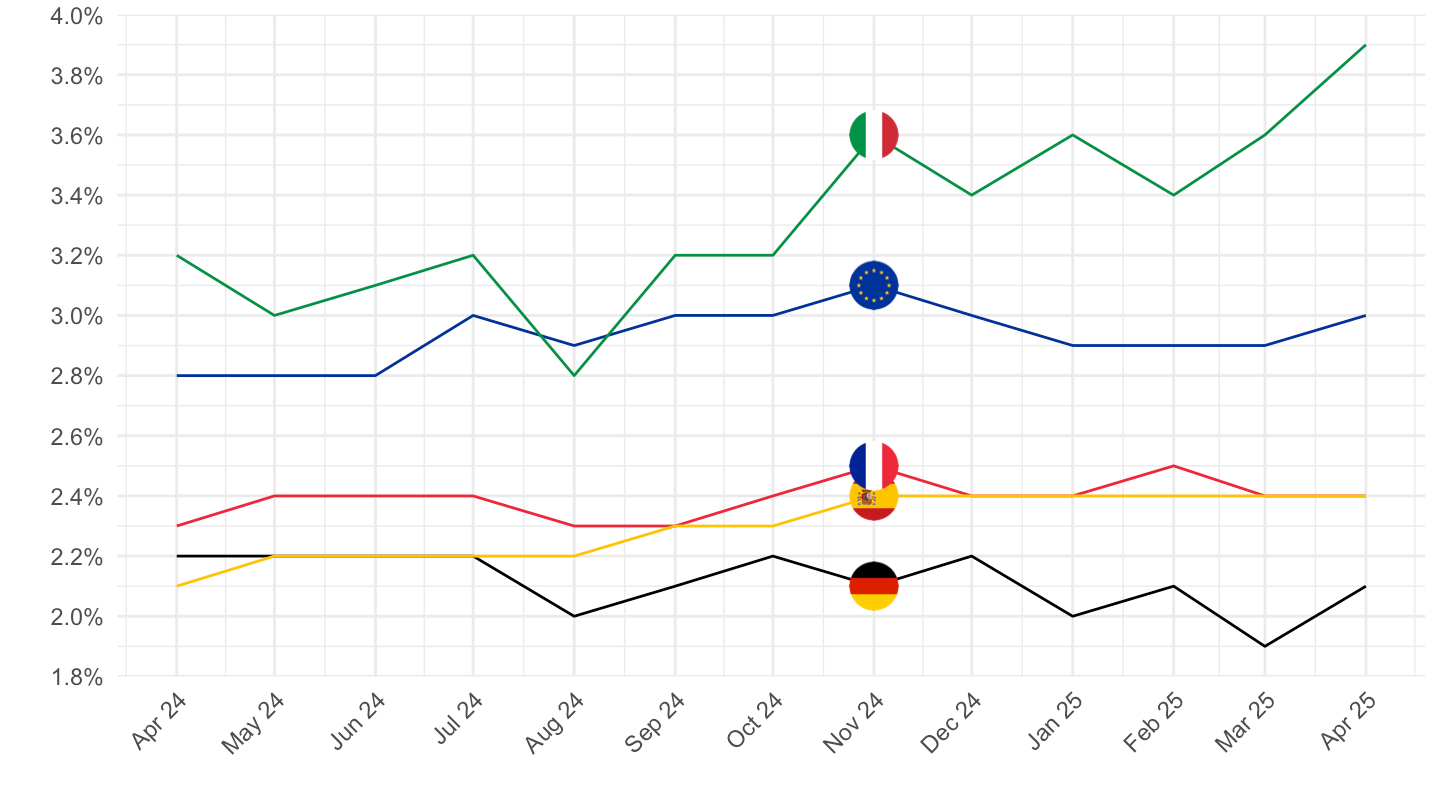
AP_NRG
All
Code
prc_hicp_manr %>%
  filter(coicop == "AP_NRG",
         geo %in% c("FR", "DE", "ES", "IT", "EA20")) %>%
  month_to_date %>%
  left_join(geo, by = "geo") %>%
  mutate(Geo = ifelse(geo == "EA20", "Europe", Geo)) %>%
  left_join(colors, by = c("Geo" = "country")) %>%
  mutate(values = values/100) %>%
  ggplot(.) + geom_line(aes(x = date, y = values, color = color)) +
  theme_minimal() + xlab("") + ylab("") +
  scale_x_date(breaks = seq(1960, 2100, 2) %>% paste0("-01-01") %>% as.Date,
               labels = date_format("%Y")) +
  scale_y_continuous(breaks = 0.01*seq(-100, 100, 5),
                     labels = percent_format(a = 1)) +
  scale_color_identity() + add_5flags +
  theme(legend.position = c(0.75, 0.90),
        legend.title = element_blank())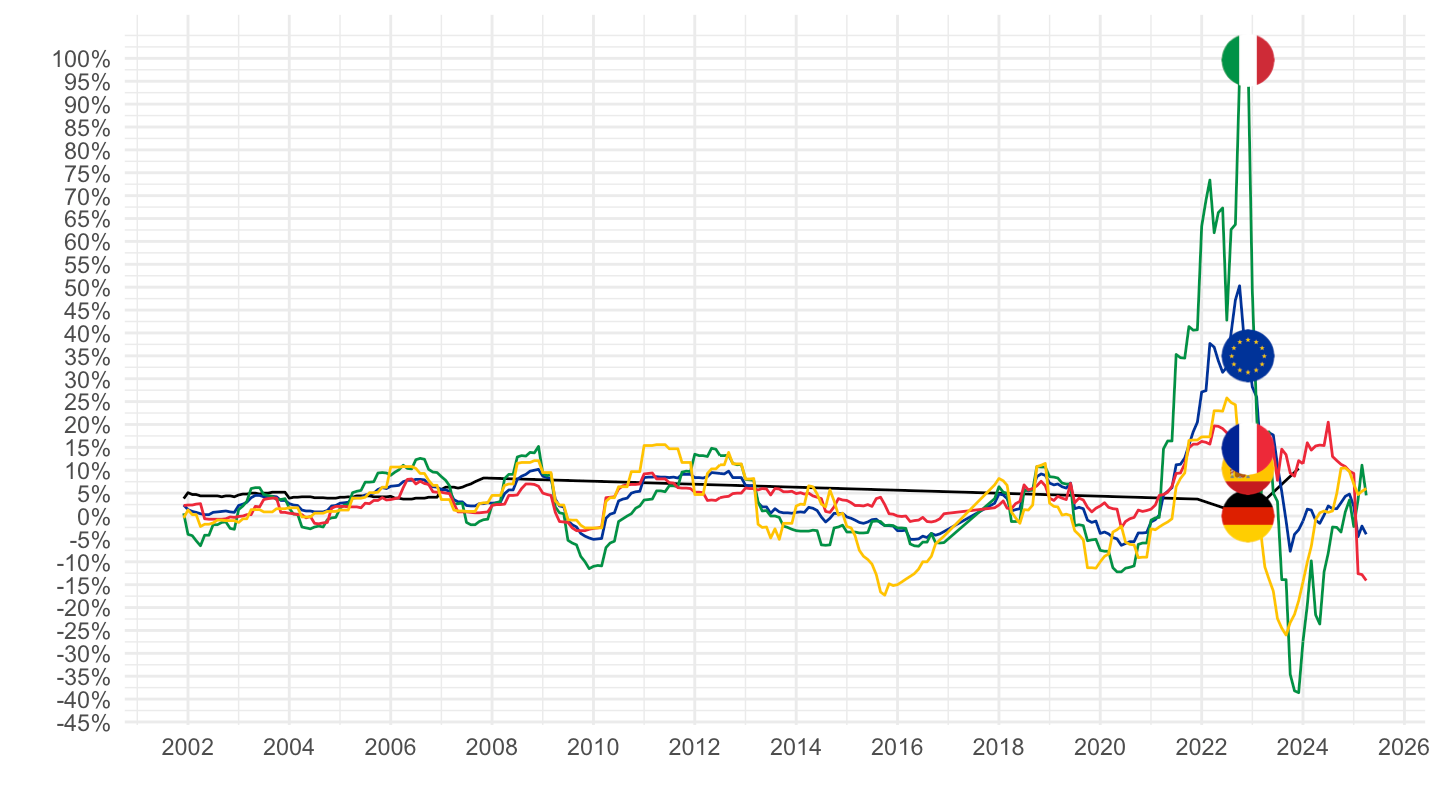
2016-
Code
prc_hicp_manr %>%
  filter(coicop == "AP_NRG",
         geo %in% c("FR", "ES", "IT", "EA20")) %>%
  # group_by(geo) %>%
  # summarise(Nobs = n()) %>%
  month_to_date %>%
  filter(date >= as.Date("2016-01-01")) %>%
  left_join(geo, by = "geo") %>%
  mutate(Geo = ifelse(geo == "EA20", "Europe", Geo)) %>%
  left_join(colors, by = c("Geo" = "country")) %>%
  mutate(values = values/100) %>%
  ggplot(.) + geom_line(aes(x = date, y = values, color = color)) +
  theme_minimal() + xlab("") + ylab("") +
  scale_x_date(breaks = seq(1960, 2100, 1) %>% paste0("-01-01") %>% as.Date,
               labels = date_format("%Y")) +
  scale_y_continuous(breaks = 0.01*seq(-20, 100, 5),
                     labels = percent_format(a = 1)) +
  scale_color_identity() + add_4flags +
  theme(legend.position = c(0.75, 0.90),
        legend.title = element_blank())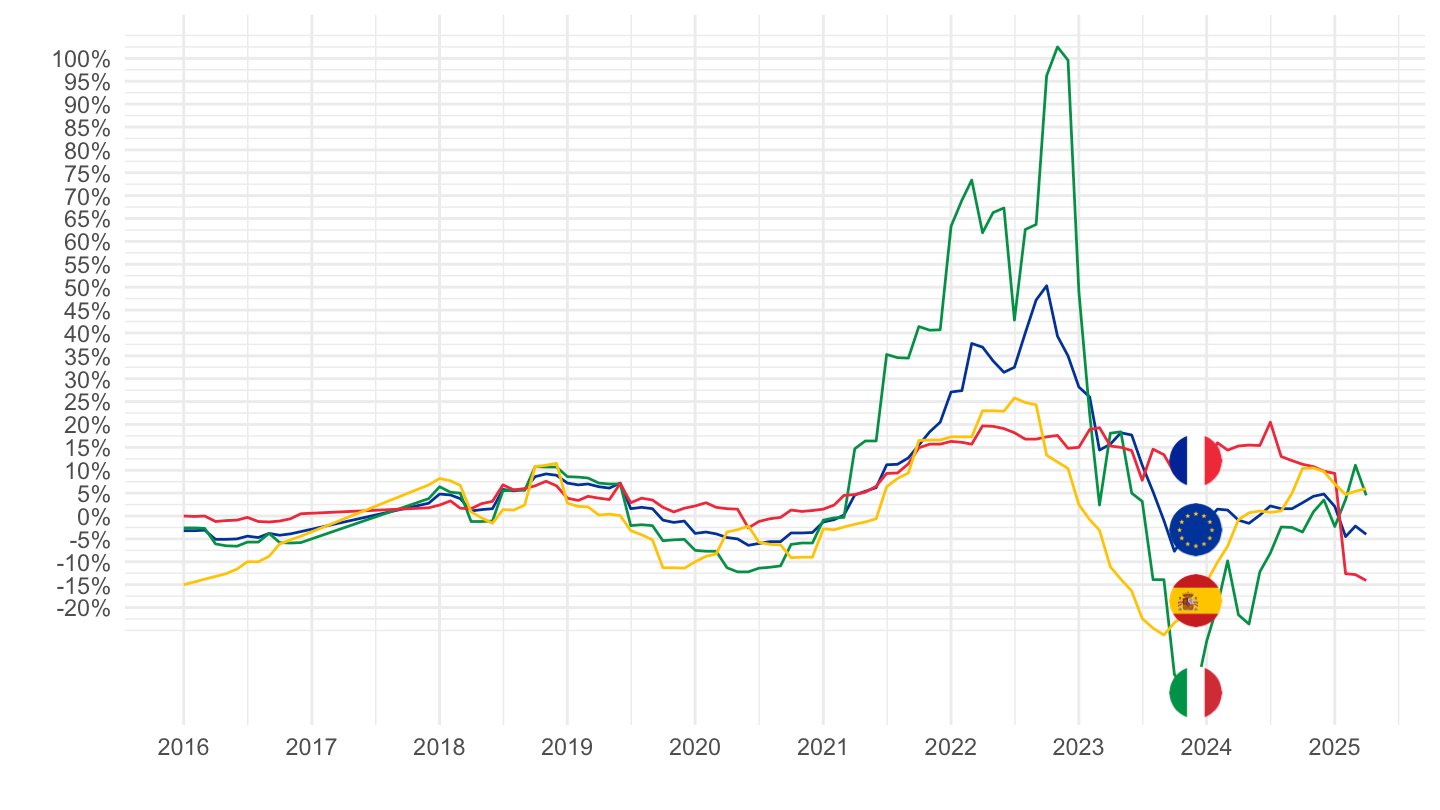
2020-
Code
prc_hicp_manr %>%
  filter(coicop == "AP_NRG",
         geo %in% c("FR", "ES", "IT", "EA20")) %>%
  month_to_date %>%
  filter(date >= as.Date("2020-01-01")) %>%
  left_join(geo, by = "geo") %>%
  mutate(Geo = ifelse(geo == "EA20", "Europe", Geo)) %>%
  left_join(colors, by = c("Geo" = "country")) %>%
  mutate(values = values/100) %>%
  ggplot(.) + geom_line(aes(x = date, y = values, color = color)) +
  theme_minimal() + xlab("") + ylab("") +
  scale_x_date(breaks = seq.Date(as.Date("2019-12-01"), as.Date("2100-01-01"), "3 months"),
               labels = date_format("%b %Y")) +
  scale_y_continuous(breaks = 0.01*seq(-20, 100, 10),
                     labels = percent_format(a = 1)) +
  scale_color_identity() + add_4flags +
  theme(legend.position = c(0.75, 0.90),
        legend.title = element_blank(),
        axis.text.x = element_text(angle = 45, vjust = 1, hjust = 1))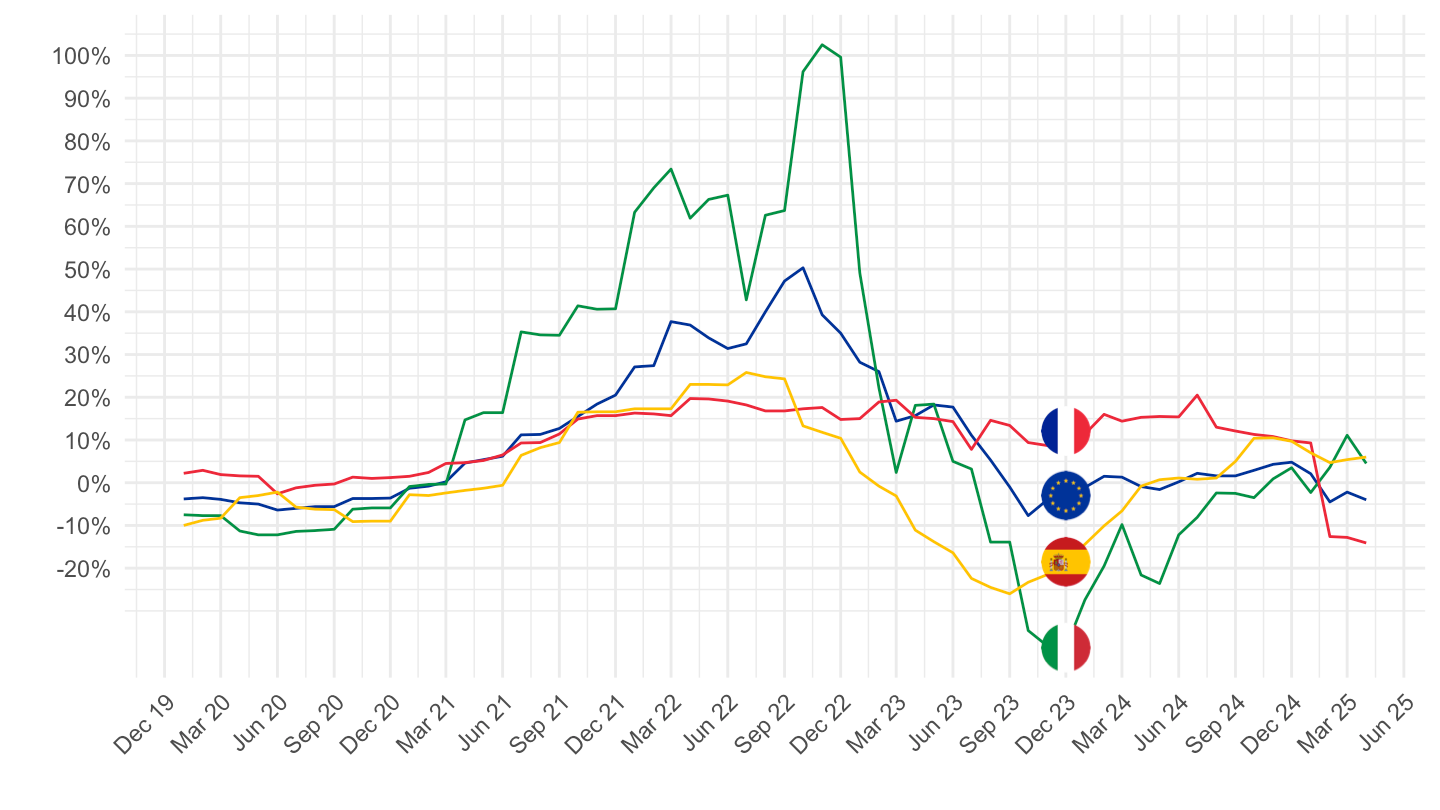
CP04521 - Natural gas and town gas
All
Code
prc_hicp_manr %>%
  filter(coicop == "CP04521",
         geo %in% c("FR", "DE", "ES", "IT", "EA20")) %>%
  month_to_date %>%
  left_join(geo, by = "geo") %>%
  mutate(Geo = ifelse(geo == "EA20", "Europe", Geo)) %>%
  left_join(colors, by = c("Geo" = "country")) %>%
  mutate(values = values/100) %>%
  ggplot(.) + geom_line(aes(x = date, y = values, color = color)) +
  theme_minimal() + xlab("") + ylab("") +
  scale_x_date(breaks = seq(1960, 2100, 2) %>% paste0("-01-01") %>% as.Date,
               labels = date_format("%Y")) +
  scale_y_continuous(breaks = 0.01*seq(-100, 100, 1),
                     labels = percent_format(a = 1)) +
  scale_color_identity() + add_5flags +
  theme(legend.position = c(0.75, 0.90),
        legend.title = element_blank())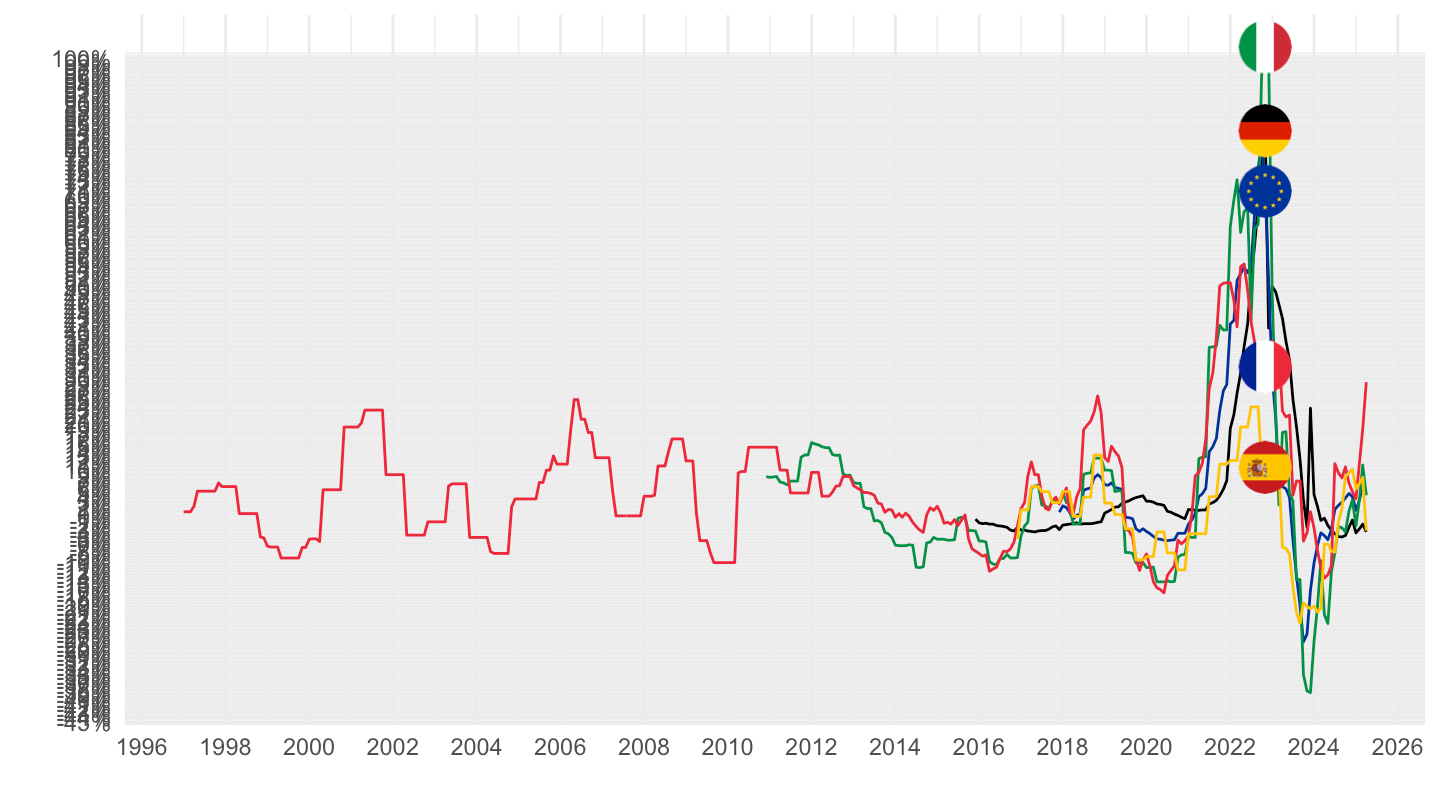
2016-
Code
prc_hicp_manr %>%
  filter(coicop == "CP04521",
         geo %in% c("FR", "DE", "ES", "IT", "EA20")) %>%
  month_to_date %>%
  filter(date >= as.Date("2016-01-01")) %>%
  left_join(geo, by = "geo") %>%
  mutate(Geo = ifelse(geo == "EA20", "Europe", Geo)) %>%
  left_join(colors, by = c("Geo" = "country")) %>%
  mutate(values = values/100) %>%
  ggplot(.) + geom_line(aes(x = date, y = values, color = color)) +
  theme_minimal() + xlab("") + ylab("") +
  scale_x_date(breaks = seq(1960, 2100, 1) %>% paste0("-01-01") %>% as.Date,
               labels = date_format("%Y")) +
  scale_y_continuous(breaks = 0.01*seq(-20, 100, 5),
                     labels = percent_format(a = 1)) +
  scale_color_identity() + add_5flags +
  theme(legend.position = c(0.75, 0.90),
        legend.title = element_blank())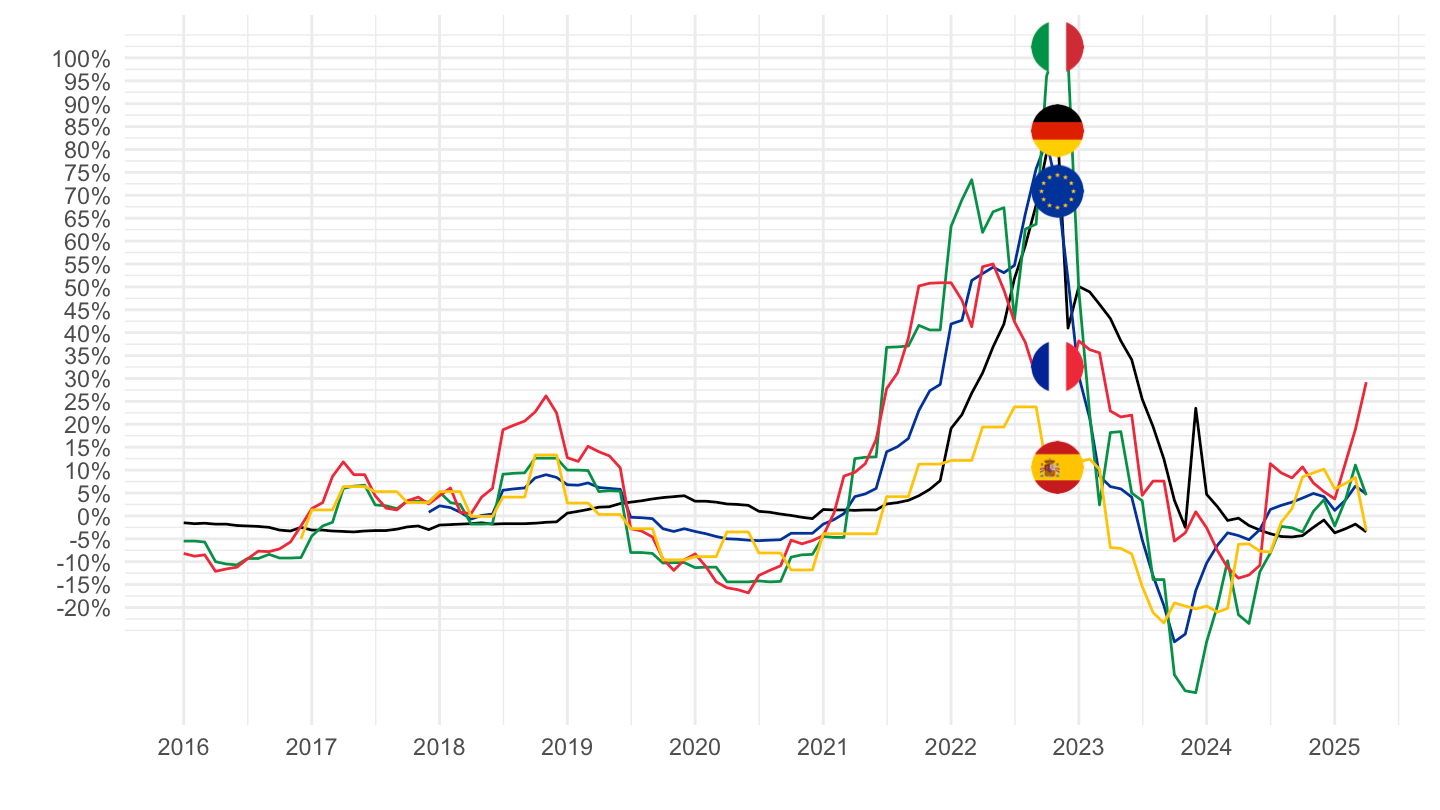
2020-
Code
prc_hicp_manr %>%
  filter(coicop == "CP04521",
         geo %in% c("FR", "DE", "ES", "IT", "EA20")) %>%
  month_to_date %>%
  filter(date >= as.Date("2020-01-01")) %>%
  left_join(geo, by = "geo") %>%
  mutate(Geo = ifelse(geo == "EA20", "Europe", Geo)) %>%
  left_join(colors, by = c("Geo" = "country")) %>%
  mutate(values = values/100) %>%
  ggplot(.) + geom_line(aes(x = date, y = values, color = color)) +
  theme_minimal() + xlab("") + ylab("Inflation, CP04521 - Natural gas and town gas (%)") +
  scale_x_date(breaks = seq.Date(as.Date("2019-12-01"), as.Date("2100-01-01"), "3 months"),
               labels = date_format("%b %Y")) +
  scale_y_continuous(breaks = 0.01*seq(-100, 200, 10),
                     labels = percent_format(a = 1)) +
  scale_color_identity() + add_5flags +
  theme(legend.position = c(0.75, 0.90),
        legend.title = element_blank(),
        axis.text.x = element_text(angle = 45, vjust = 1, hjust = 1)) +
  geom_hline(yintercept = 0, linetype = "dashed")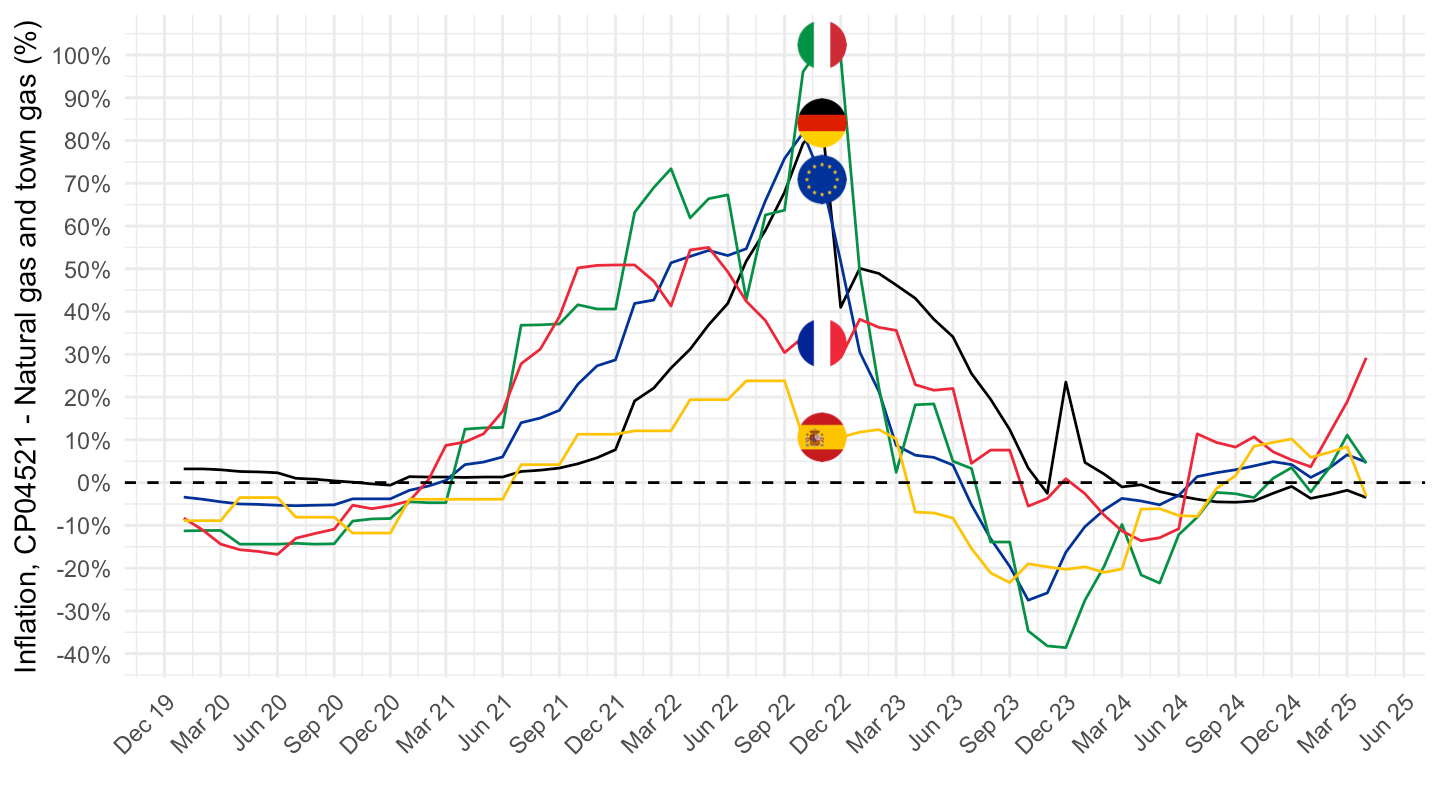
CP011 - Food
All
Code
prc_hicp_manr %>%
  filter(coicop == "CP011",
         geo %in% c("FR", "DE", "ES", "IT", "EA20")) %>%
  month_to_date %>%
  left_join(geo, by = "geo") %>%
  mutate(Geo = ifelse(geo == "EA20", "Europe", Geo)) %>%
  left_join(colors, by = c("Geo" = "country")) %>%
  mutate(values = values/100) %>%
  ggplot(.) + geom_line(aes(x = date, y = values, color = color)) +
  theme_minimal() + xlab("") + ylab("") +
  scale_x_date(breaks = seq(1960, 2100, 2) %>% paste0("-01-01") %>% as.Date,
               labels = date_format("%Y")) +
  scale_y_continuous(breaks = 0.01*seq(-100, 100, 1),
                     labels = percent_format(a = 1)) +
  scale_color_identity() + add_5flags +
  theme(legend.position = c(0.75, 0.90),
        legend.title = element_blank())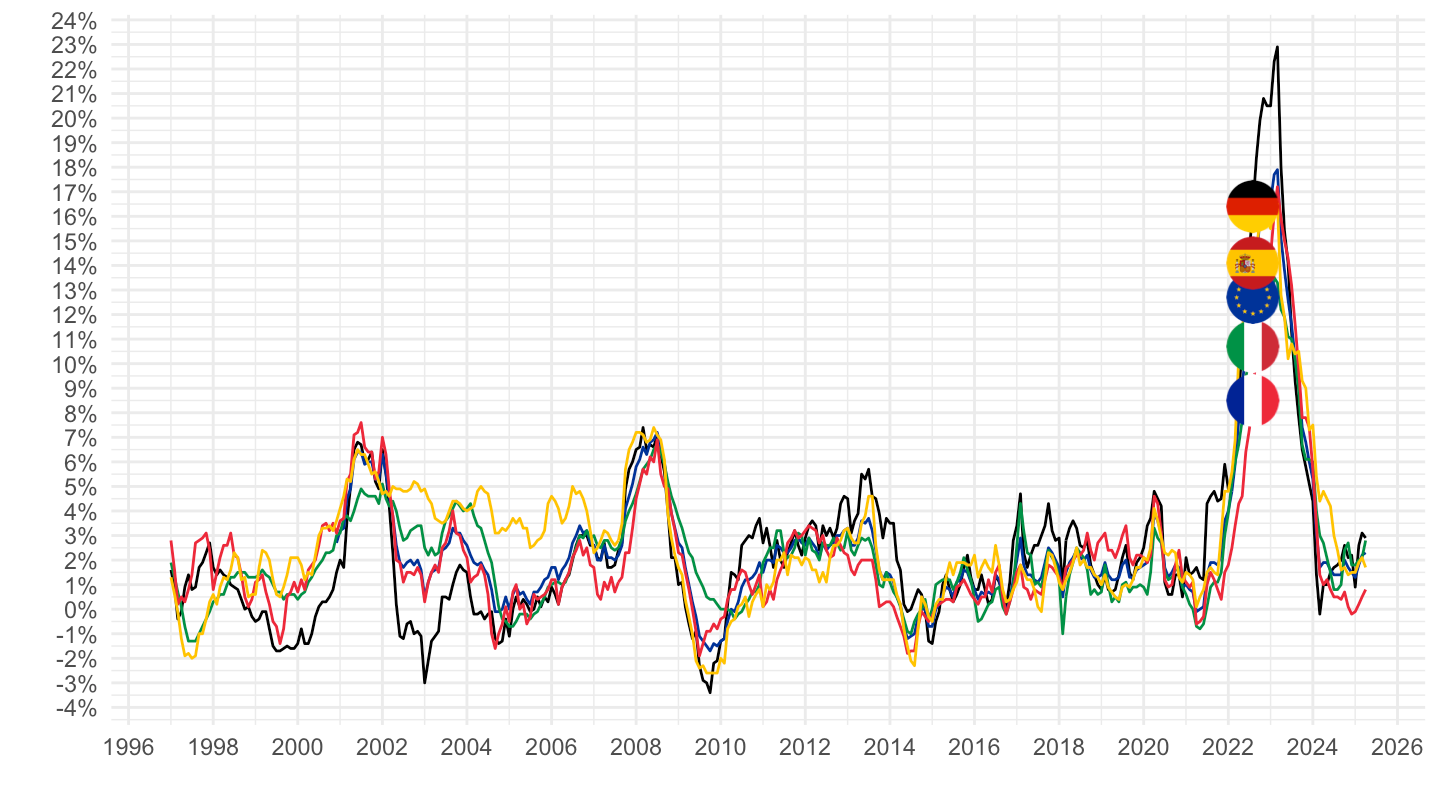
2016-
Code
prc_hicp_manr %>%
  filter(coicop == "CP011",
         geo %in% c("FR", "DE", "ES", "IT", "EA20")) %>%
  month_to_date %>%
  filter(date >= as.Date("2016-01-01")) %>%
  left_join(geo, by = "geo") %>%
  mutate(Geo = ifelse(geo == "EA20", "Europe", Geo)) %>%
  left_join(colors, by = c("Geo" = "country")) %>%
  mutate(values = values/100) %>%
  ggplot(.) + geom_line(aes(x = date, y = values, color = color)) +
  theme_minimal() + xlab("") + ylab("") +
  scale_x_date(breaks = seq(1960, 2100, 1) %>% paste0("-01-01") %>% as.Date,
               labels = date_format("%Y")) +
  scale_y_continuous(breaks = 0.01*seq(-20, 100, 1),
                     labels = percent_format(a = 1)) +
  scale_color_identity() + add_5flags +
  theme(legend.position = c(0.75, 0.90),
        legend.title = element_blank())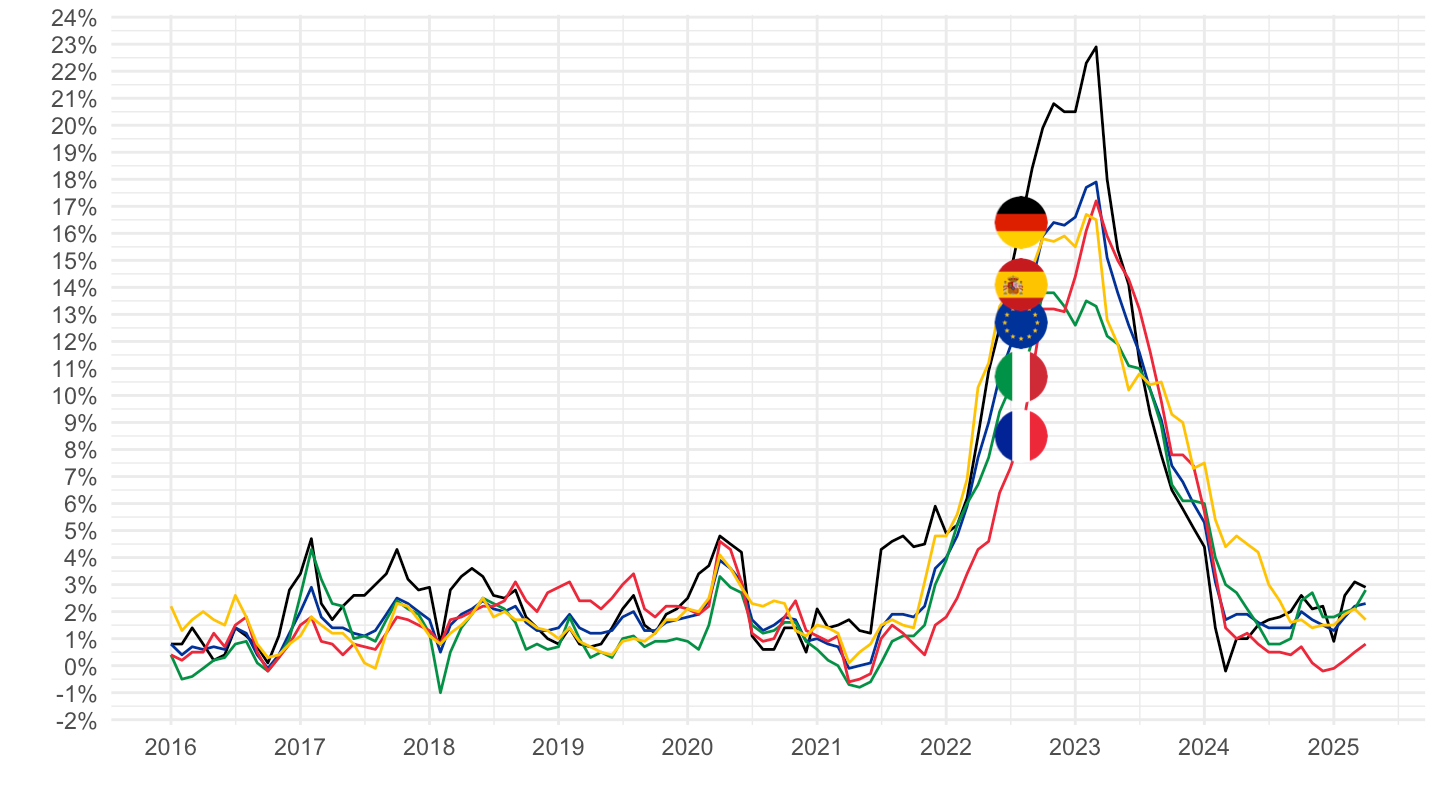
2020-
Code
prc_hicp_manr %>%
  filter(coicop == "CP011",
         geo %in% c("FR", "DE", "ES", "IT", "EA20")) %>%
  month_to_date %>%
  filter(date >= as.Date("2020-01-01")) %>%
  left_join(geo, by = "geo") %>%
  mutate(Geo = ifelse(geo == "EA20", "Europe", Geo)) %>%
  left_join(colors, by = c("Geo" = "country")) %>%
  mutate(values = values/100) %>%
  ggplot(.) + geom_line(aes(x = date, y = values, color = color)) +
  theme_minimal() + xlab("") + ylab("Inflation, CP011 - Alimentation (%)") +
  scale_x_date(breaks = seq.Date(as.Date("2019-12-01"), as.Date("2100-01-01"), "3 months"),
               labels = date_format("%b %Y")) +
  scale_y_continuous(breaks = 0.01*seq(-20, 100, 1),
                     labels = percent_format(a = 1)) +
  scale_color_identity() + add_5flags +
  theme(legend.position = c(0.75, 0.90),
        legend.title = element_blank(),
        axis.text.x = element_text(angle = 45, vjust = 1, hjust = 1)) +
  geom_hline(yintercept = 0, linetype = "dashed")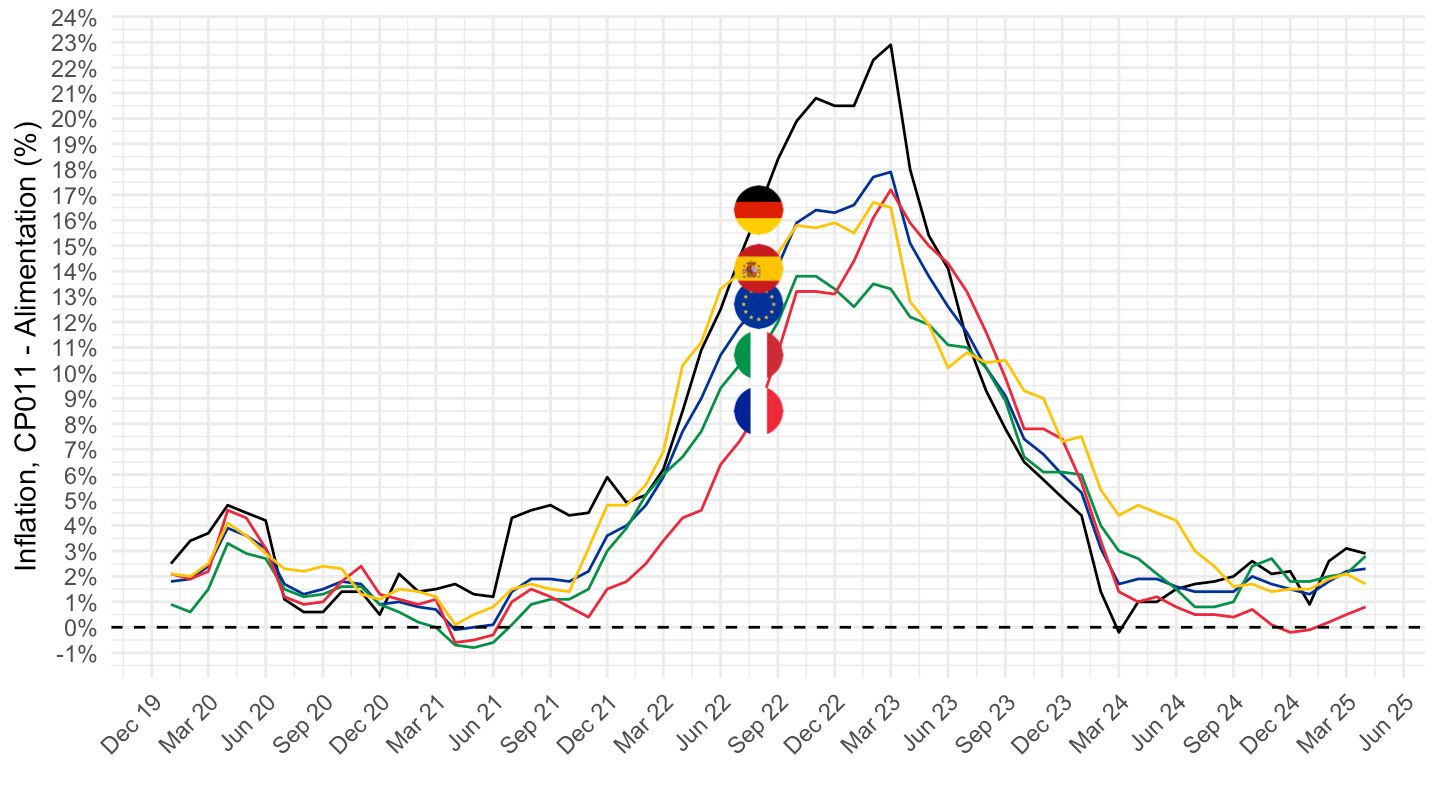
CP0111 - Bread and cereals
All
Code
prc_hicp_manr %>%
  filter(coicop == "CP0111",
         geo %in% c("FR", "DE", "ES", "IT", "EA20")) %>%
  month_to_date %>%
  left_join(geo, by = "geo") %>%
  mutate(Geo = ifelse(geo == "EA20", "Europe", Geo)) %>%
  left_join(colors, by = c("Geo" = "country")) %>%
  mutate(values = values/100) %>%
  ggplot(.) + geom_line(aes(x = date, y = values, color = color)) +
  theme_minimal() + xlab("") + ylab("") +
  scale_x_date(breaks = seq(1960, 2100, 2) %>% paste0("-01-01") %>% as.Date,
               labels = date_format("%Y")) +
  scale_y_continuous(breaks = 0.01*seq(-100, 100, 1),
                     labels = percent_format(a = 1)) +
  scale_color_identity() + add_5flags +
  theme(legend.position = c(0.75, 0.90),
        legend.title = element_blank())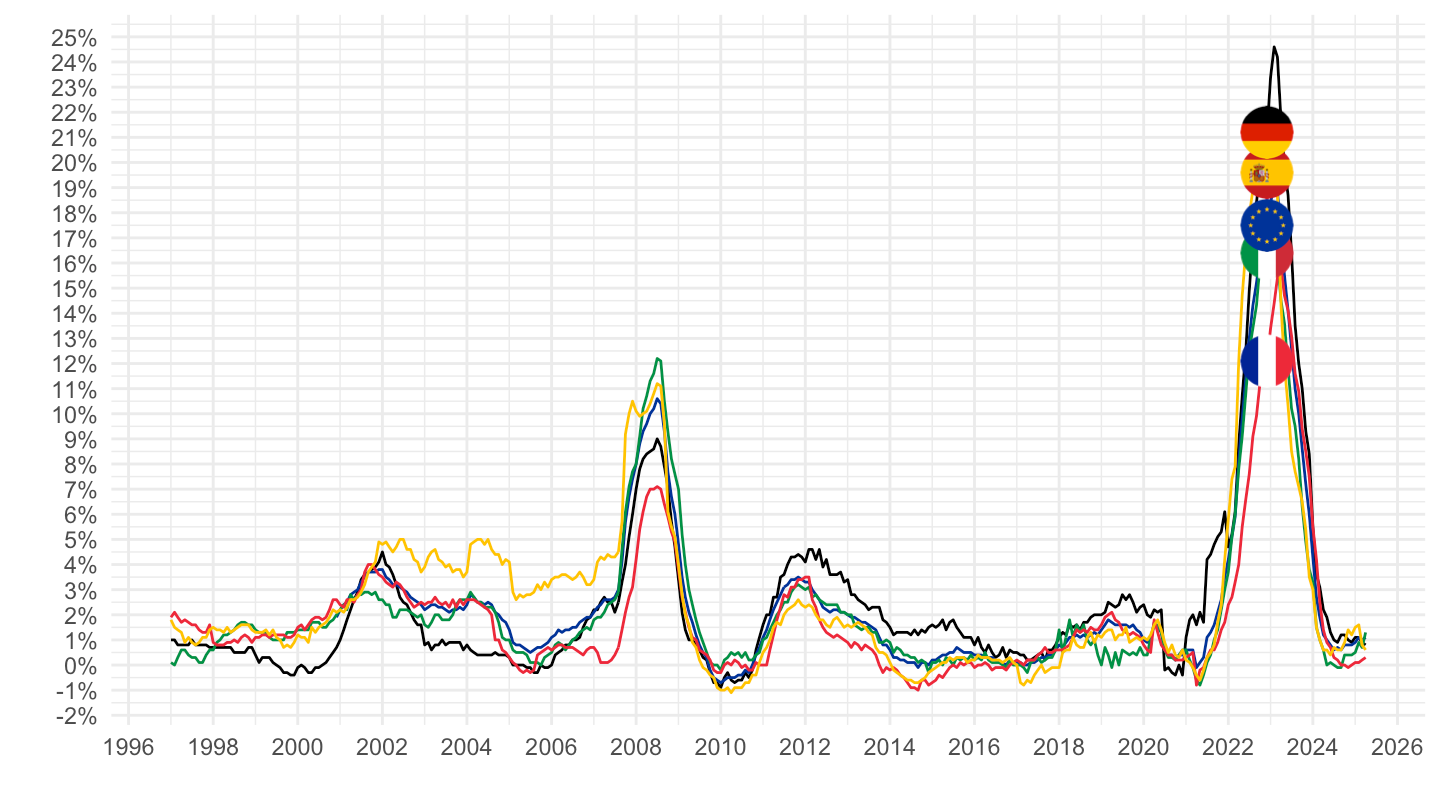
2016-
Code
prc_hicp_manr %>%
  filter(coicop == "CP0111",
         geo %in% c("FR", "DE", "ES", "IT", "EA20")) %>%
  month_to_date %>%
  filter(date >= as.Date("2016-01-01")) %>%
  left_join(geo, by = "geo") %>%
  mutate(Geo = ifelse(geo == "EA20", "Europe", Geo)) %>%
  left_join(colors, by = c("Geo" = "country")) %>%
  mutate(values = values/100) %>%
  ggplot(.) + geom_line(aes(x = date, y = values, color = color)) +
  theme_minimal() + xlab("") + ylab("") +
  scale_x_date(breaks = seq(1960, 2100, 1) %>% paste0("-01-01") %>% as.Date,
               labels = date_format("%Y")) +
  scale_y_continuous(breaks = 0.01*seq(-20, 100, 1),
                     labels = percent_format(a = 1)) +
  scale_color_identity() + add_5flags +
  theme(legend.position = c(0.75, 0.90),
        legend.title = element_blank())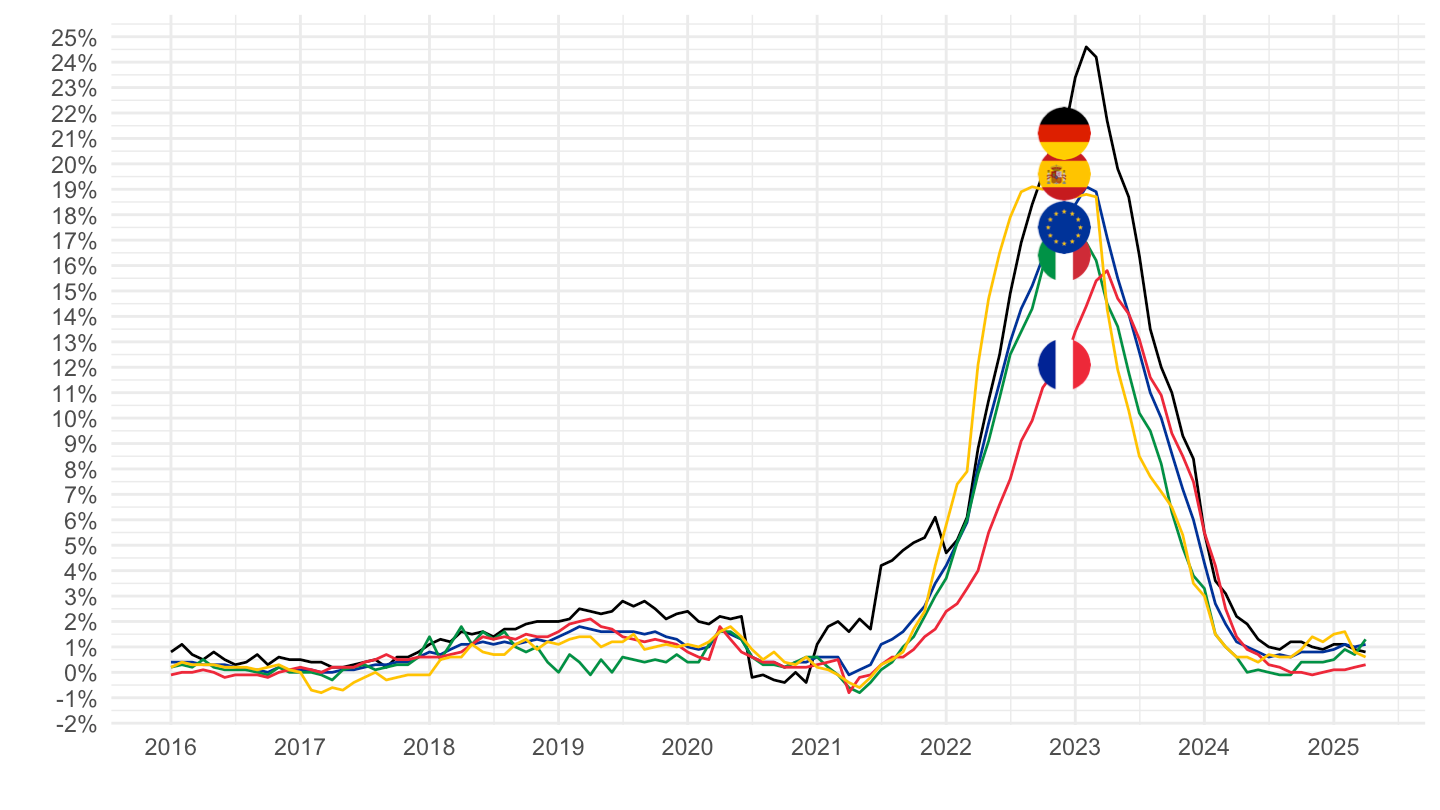
2020-
Code
prc_hicp_manr %>%
  filter(coicop == "CP0111",
         geo %in% c("FR", "DE", "ES", "IT", "EA20")) %>%
  month_to_date %>%
  filter(date >= as.Date("2020-01-01")) %>%
  left_join(geo, by = "geo") %>%
  mutate(Geo = ifelse(geo == "EA20", "Europe", Geo)) %>%
  left_join(colors, by = c("Geo" = "country")) %>%
  mutate(values = values/100) %>%
  ggplot(.) + geom_line(aes(x = date, y = values, color = color)) +
  theme_minimal() + xlab("") + ylab("") +
  scale_x_date(breaks = seq.Date(as.Date("2019-12-01"), as.Date("2100-01-01"), "3 months"),
               labels = date_format("%b %Y")) +
  scale_y_continuous(breaks = 0.01*seq(-20, 100, 1),
                     labels = percent_format(a = 1)) +
  scale_color_identity() + add_5flags +
  theme(legend.position = c(0.75, 0.90),
        legend.title = element_blank(),
        axis.text.x = element_text(angle = 45, vjust = 1, hjust = 1))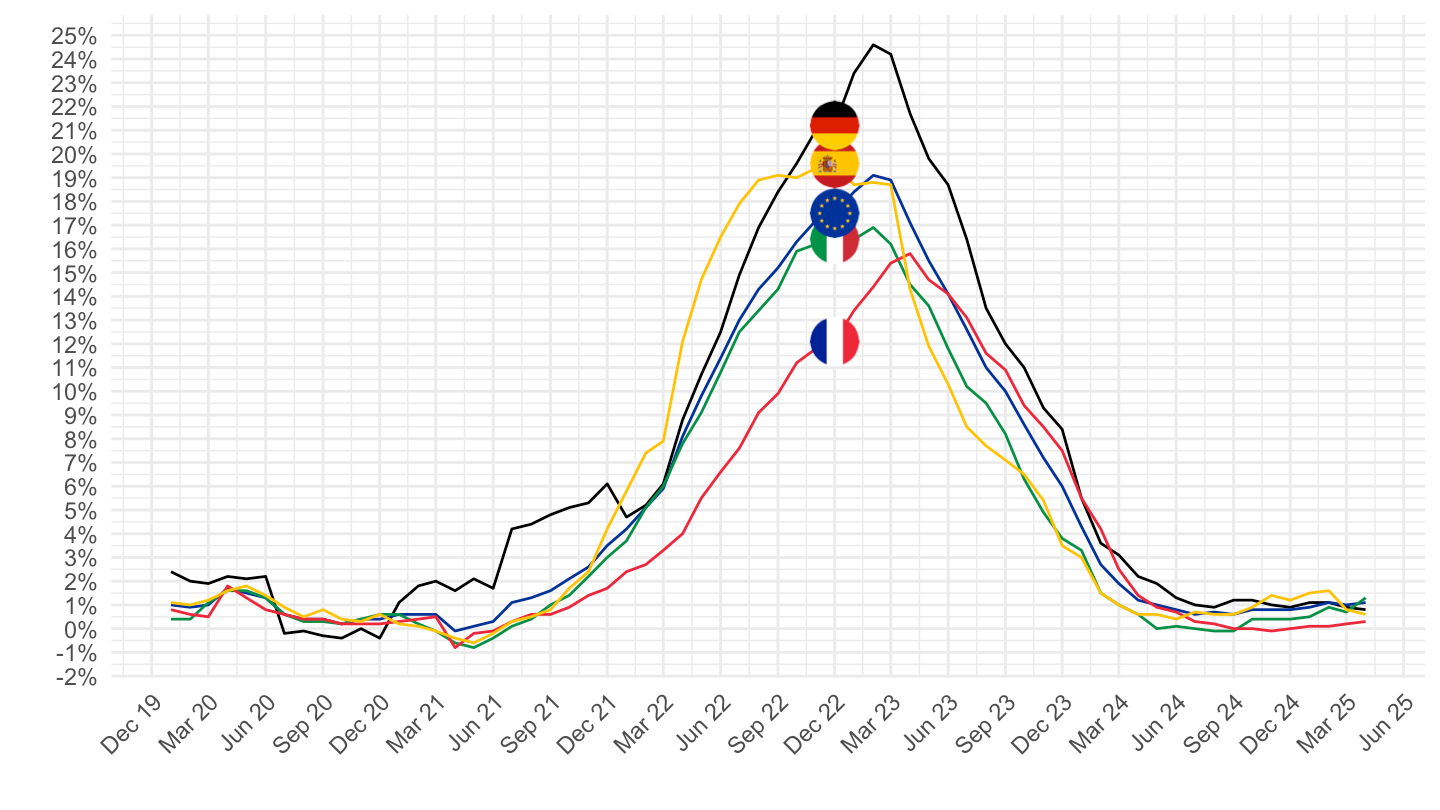
CP0112 - Meat
All
Code
prc_hicp_manr %>%
  filter(coicop == "CP0112",
         geo %in% c("FR", "DE", "ES", "IT", "EA20")) %>%
  month_to_date %>%
  left_join(geo, by = "geo") %>%
  mutate(Geo = ifelse(geo == "EA20", "Europe", Geo)) %>%
  left_join(colors, by = c("Geo" = "country")) %>%
  mutate(values = values/100) %>%
  ggplot(.) + geom_line(aes(x = date, y = values, color = color)) +
  theme_minimal() + xlab("") + ylab("") +
  scale_x_date(breaks = seq(1960, 2100, 2) %>% paste0("-01-01") %>% as.Date,
               labels = date_format("%Y")) +
  scale_y_continuous(breaks = 0.01*seq(-100, 100, 1),
                     labels = percent_format(a = 1)) +
  scale_color_identity() + add_5flags +
  theme(legend.position = c(0.75, 0.90),
        legend.title = element_blank())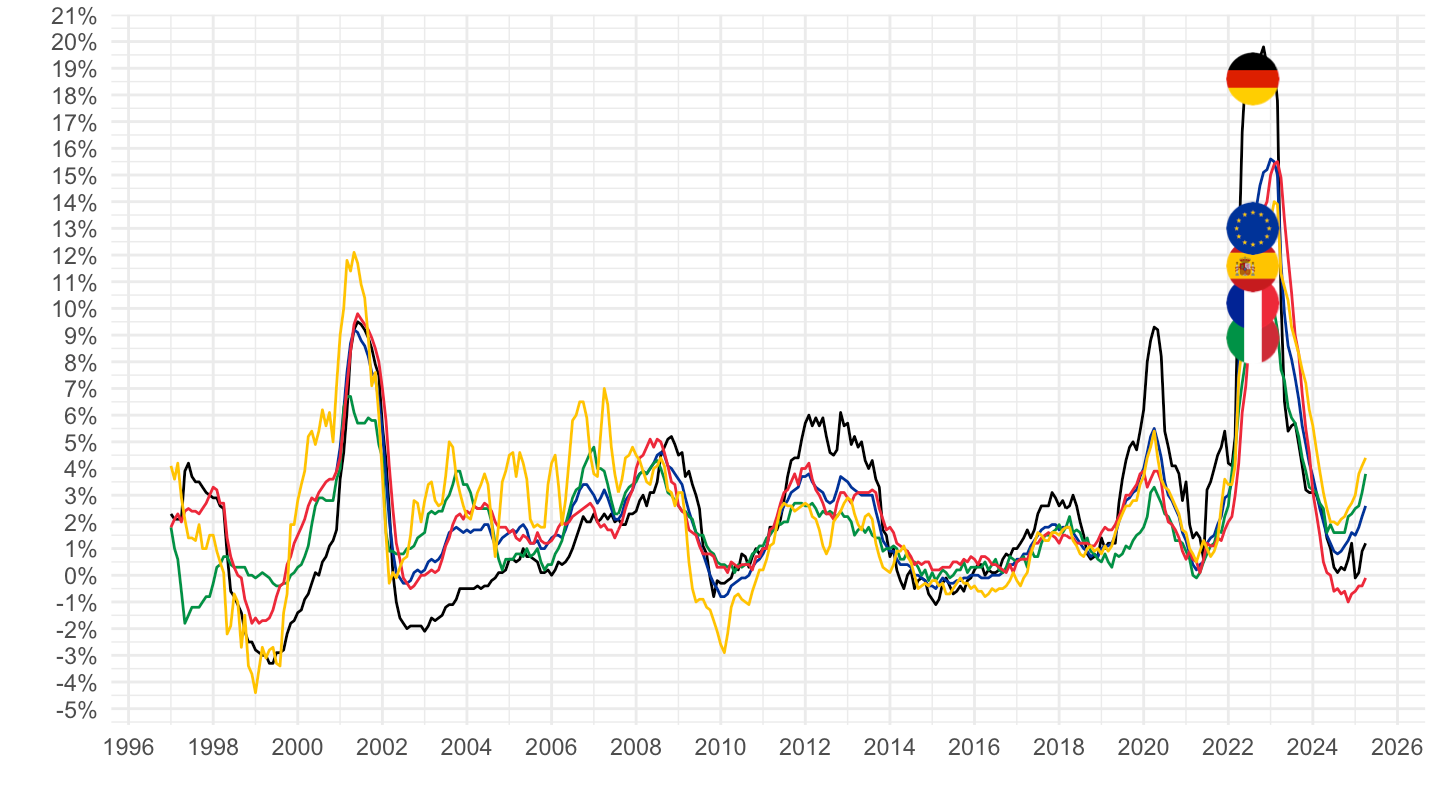
2016-
Code
prc_hicp_manr %>%
  filter(coicop == "CP0112",
         geo %in% c("FR", "DE", "ES", "IT", "EA20")) %>%
  month_to_date %>%
  filter(date >= as.Date("2016-01-01")) %>%
  left_join(geo, by = "geo") %>%
  mutate(Geo = ifelse(geo == "EA20", "Europe", Geo)) %>%
  left_join(colors, by = c("Geo" = "country")) %>%
  mutate(values = values/100) %>%
  ggplot(.) + geom_line(aes(x = date, y = values, color = color)) +
  theme_minimal() + xlab("") + ylab("") +
  scale_x_date(breaks = seq(1960, 2100, 1) %>% paste0("-01-01") %>% as.Date,
               labels = date_format("%Y")) +
  scale_y_continuous(breaks = 0.01*seq(-20, 100, 1),
                     labels = percent_format(a = 1)) +
  scale_color_identity() + add_5flags +
  theme(legend.position = c(0.75, 0.90),
        legend.title = element_blank())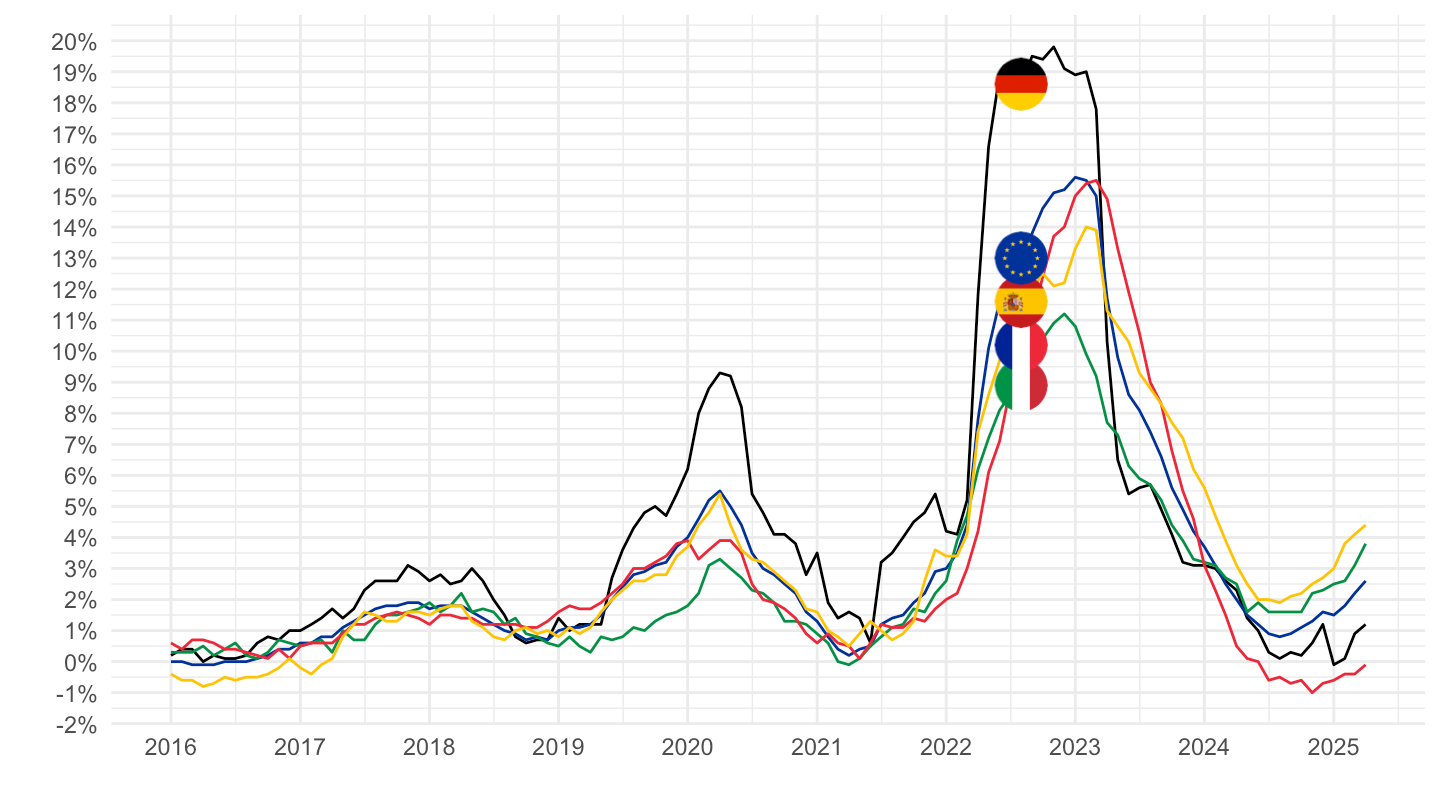
2020-
Code
prc_hicp_manr %>%
  filter(coicop == "CP0112",
         geo %in% c("FR", "DE", "ES", "IT", "EA20")) %>%
  month_to_date %>%
  filter(date >= as.Date("2020-01-01")) %>%
  left_join(geo, by = "geo") %>%
  mutate(Geo = ifelse(geo == "EA20", "Europe", Geo)) %>%
  left_join(colors, by = c("Geo" = "country")) %>%
  mutate(values = values/100) %>%
  ggplot(.) + geom_line(aes(x = date, y = values, color = color)) +
  theme_minimal() + xlab("") + ylab("") +
  scale_x_date(breaks = seq.Date(as.Date("2019-12-01"), as.Date("2100-01-01"), "3 months"),
               labels = date_format("%b %Y")) +
  scale_y_continuous(breaks = 0.01*seq(-20, 100, 1),
                     labels = percent_format(a = 1)) +
  scale_color_identity() + add_5flags +
  theme(legend.position = c(0.75, 0.90),
        legend.title = element_blank(),
        axis.text.x = element_text(angle = 45, vjust = 1, hjust = 1))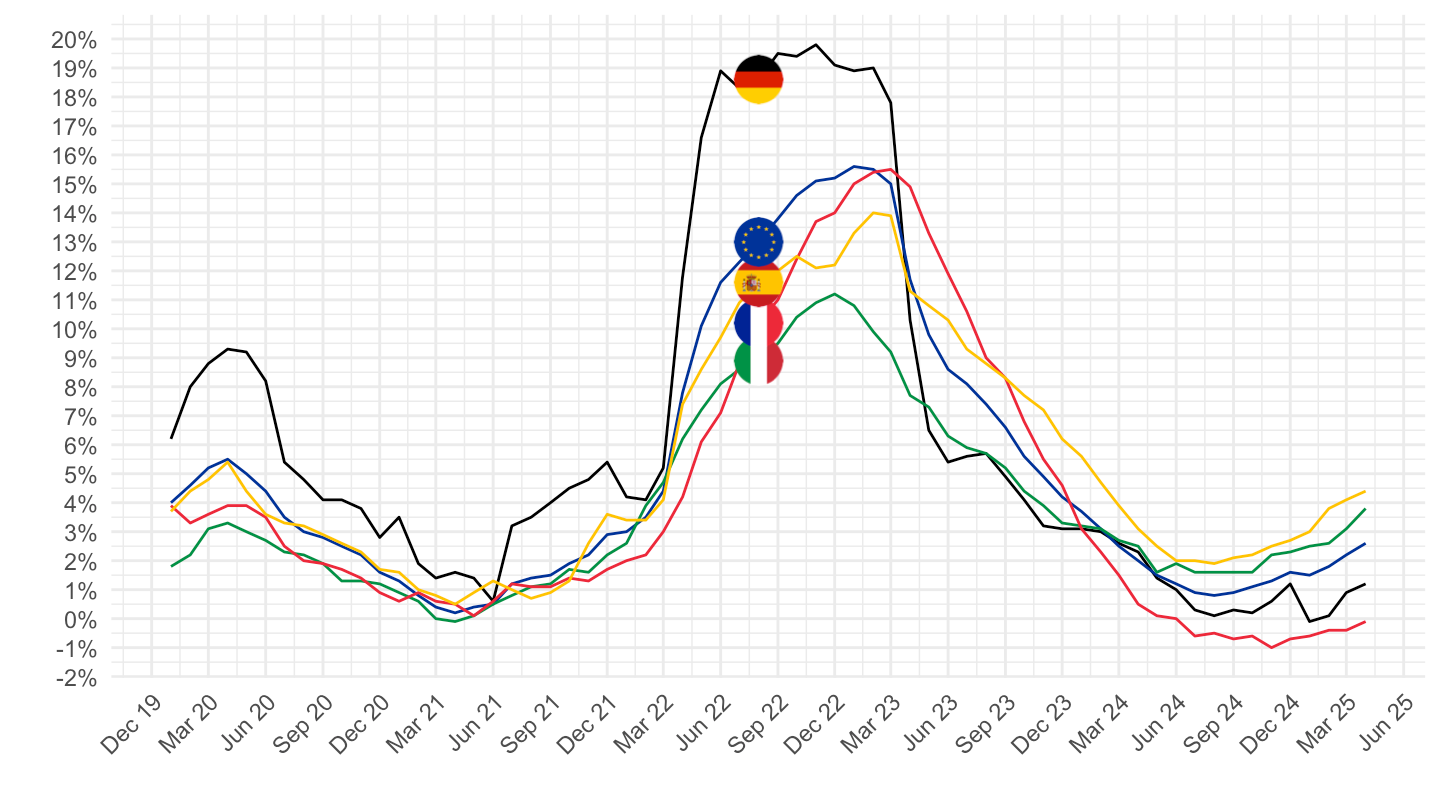
CP0114 - Milk, cheese and eggs
All
Code
prc_hicp_manr %>%
  filter(coicop == "CP0114",
         geo %in% c("FR", "DE", "ES", "IT", "EA20")) %>%
  month_to_date %>%
  left_join(geo, by = "geo") %>%
  mutate(Geo = ifelse(geo == "EA20", "Europe", Geo)) %>%
  left_join(colors, by = c("Geo" = "country")) %>%
  mutate(values = values/100) %>%
  ggplot(.) + geom_line(aes(x = date, y = values, color = color)) +
  theme_minimal() + xlab("") + ylab("") +
  scale_x_date(breaks = seq(1960, 2100, 2) %>% paste0("-01-01") %>% as.Date,
               labels = date_format("%Y")) +
  scale_y_continuous(breaks = 0.01*seq(-100, 100, 1),
                     labels = percent_format(a = 1)) +
  scale_color_identity() + add_5flags +
  theme(legend.position = c(0.75, 0.90),
        legend.title = element_blank())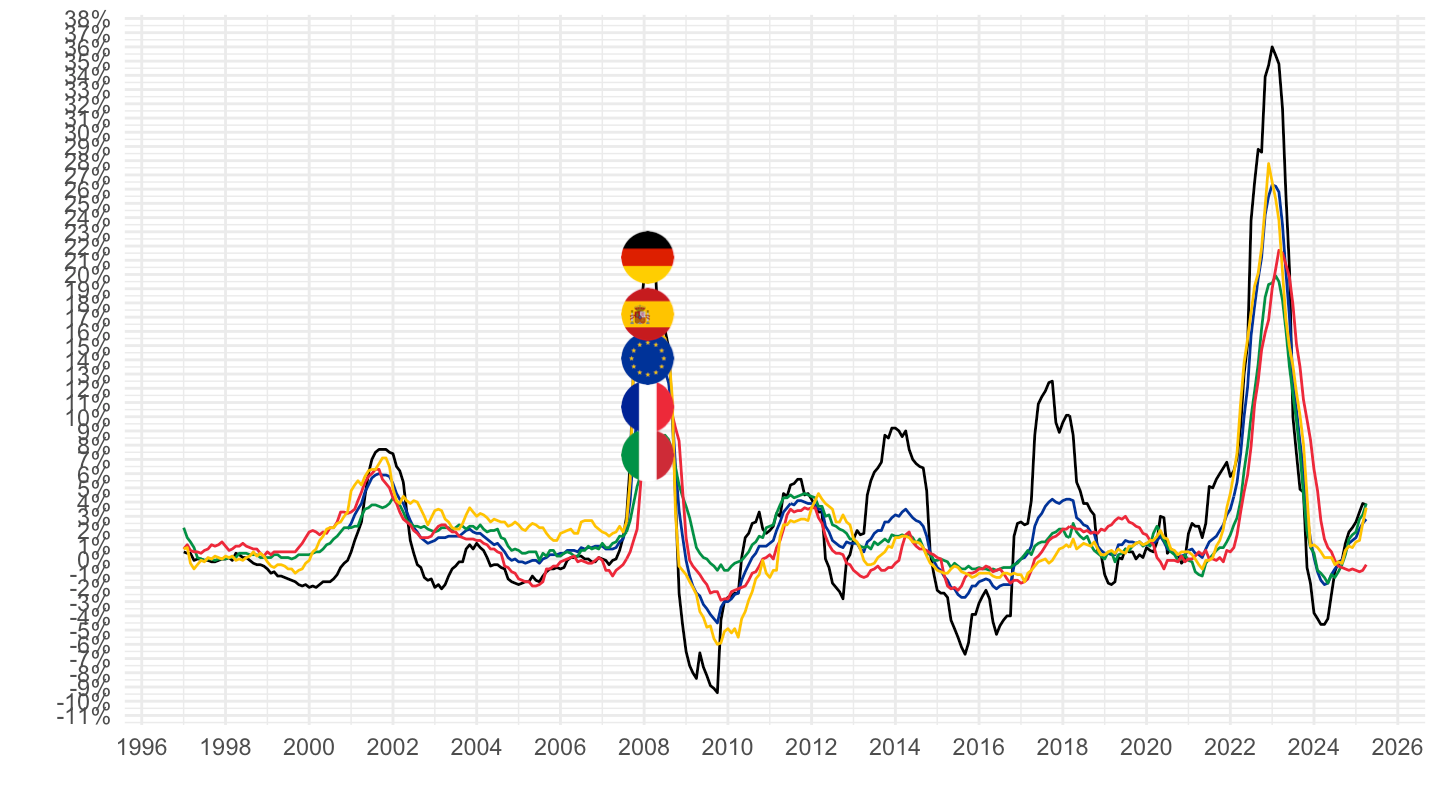
2016-
Code
prc_hicp_manr %>%
  filter(coicop == "CP0114",
         geo %in% c("FR", "DE", "ES", "IT", "EA20")) %>%
  month_to_date %>%
  filter(date >= as.Date("2016-01-01")) %>%
  left_join(geo, by = "geo") %>%
  mutate(Geo = ifelse(geo == "EA20", "Europe", Geo)) %>%
  left_join(colors, by = c("Geo" = "country")) %>%
  mutate(values = values/100) %>%
  ggplot(.) + geom_line(aes(x = date, y = values, color = color)) +
  theme_minimal() + xlab("") + ylab("") +
  scale_x_date(breaks = seq(1960, 2100, 1) %>% paste0("-01-01") %>% as.Date,
               labels = date_format("%Y")) +
  scale_y_continuous(breaks = 0.01*seq(-20, 100, 1),
                     labels = percent_format(a = 1)) +
  scale_color_identity() + add_5flags +
  theme(legend.position = c(0.75, 0.90),
        legend.title = element_blank())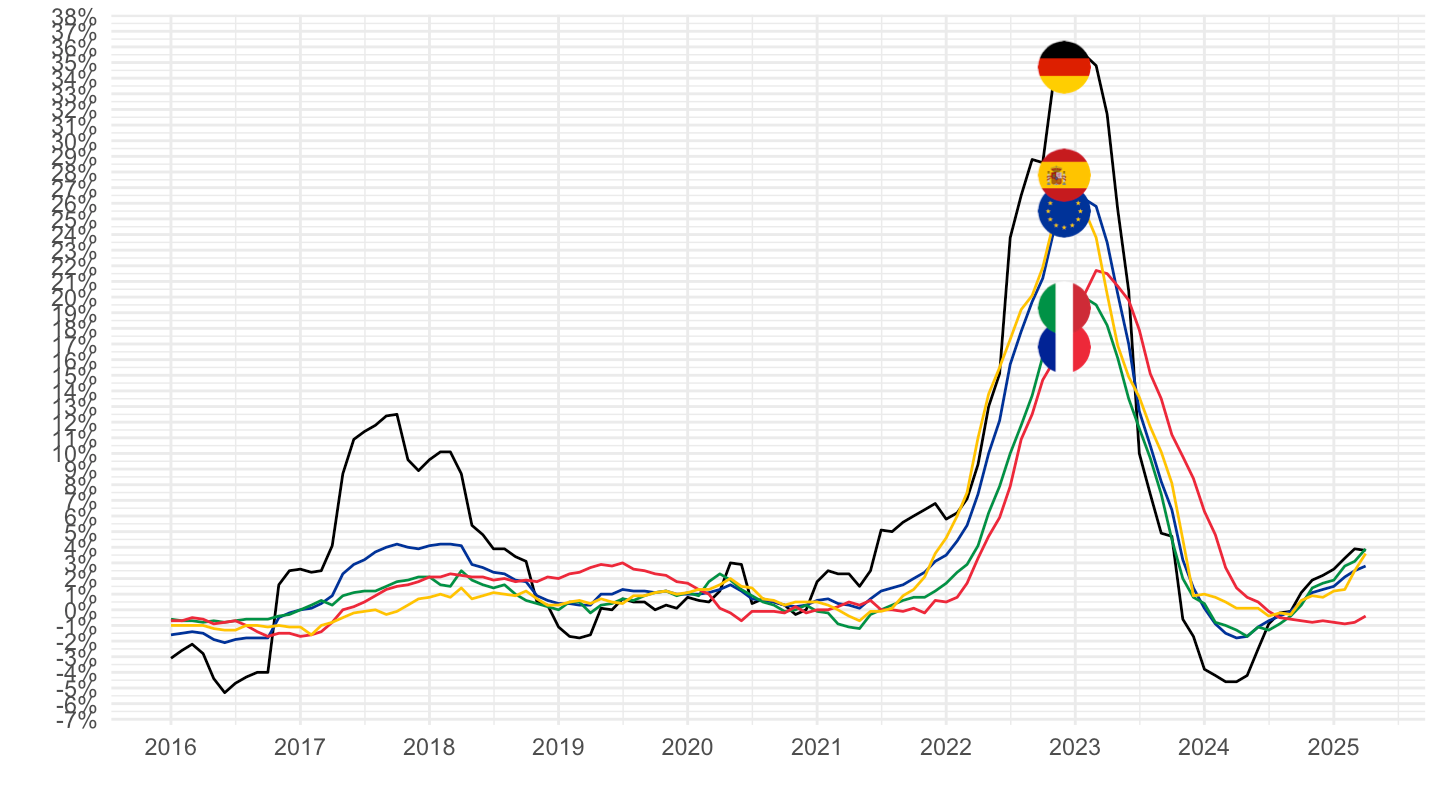
2020-
Code
prc_hicp_manr %>%
  filter(coicop == "CP0114",
         geo %in% c("FR", "DE", "ES", "IT", "EA20")) %>%
  month_to_date %>%
  filter(date >= as.Date("2020-01-01")) %>%
  left_join(geo, by = "geo") %>%
  mutate(Geo = ifelse(geo == "EA20", "Europe", Geo)) %>%
  left_join(colors, by = c("Geo" = "country")) %>%
  mutate(values = values/100) %>%
  ggplot(.) + geom_line(aes(x = date, y = values, color = color)) +
  theme_minimal() + xlab("") + ylab("") +
  scale_x_date(breaks = seq.Date(as.Date("2019-12-01"), as.Date("2100-01-01"), "3 months"),
               labels = date_format("%b %Y")) +
  scale_y_continuous(breaks = 0.01*seq(-20, 100, 1),
                     labels = percent_format(a = 1)) +
  scale_color_identity() + add_5flags +
  theme(legend.position = c(0.75, 0.90),
        legend.title = element_blank(),
        axis.text.x = element_text(angle = 45, vjust = 1, hjust = 1))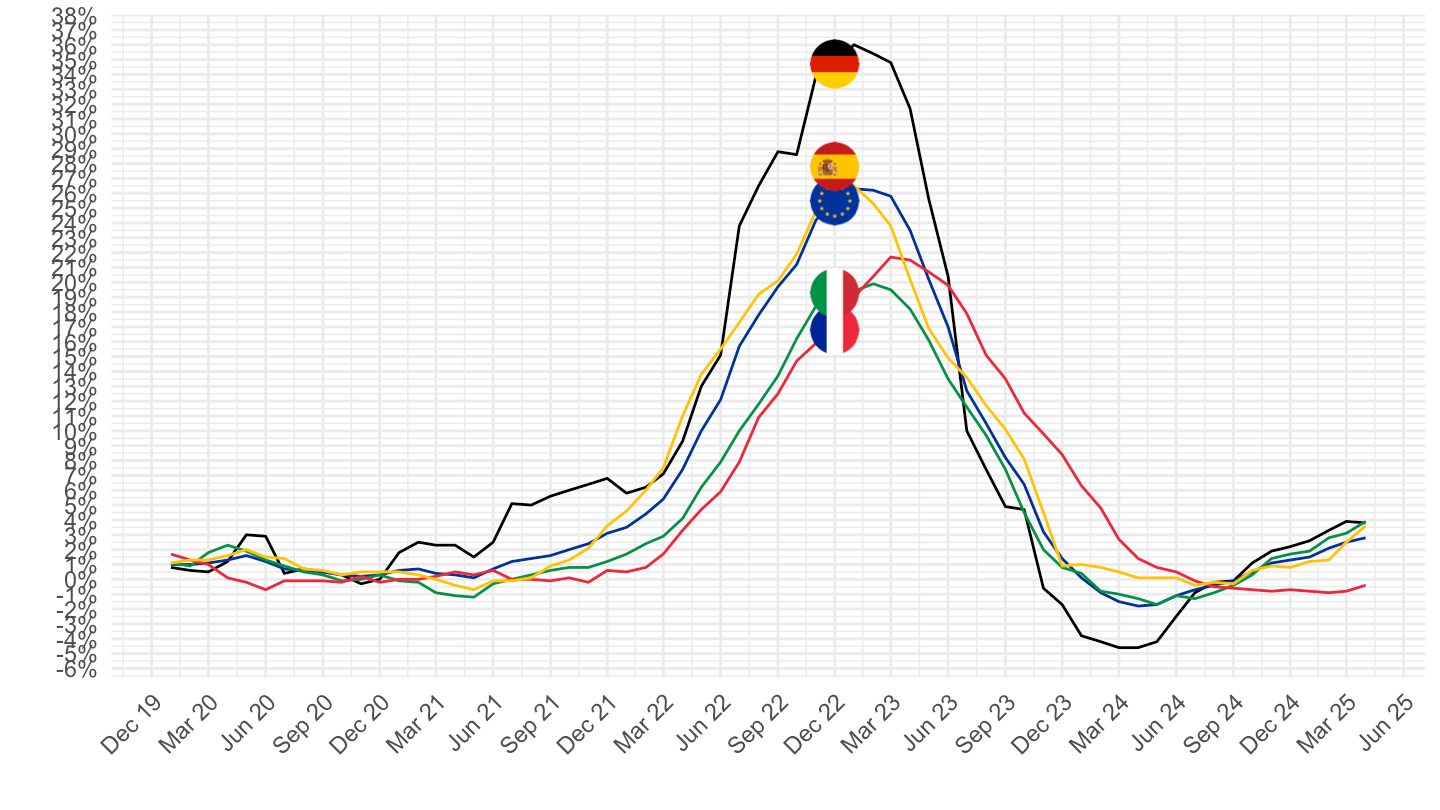
CP0117 - Vegetables
All
Code
prc_hicp_manr %>%
  filter(coicop == "CP0117",
         geo %in% c("FR", "DE", "ES", "IT", "EA20")) %>%
  month_to_date %>%
  left_join(geo, by = "geo") %>%
  mutate(Geo = ifelse(geo == "EA20", "Europe", Geo)) %>%
  left_join(colors, by = c("Geo" = "country")) %>%
  mutate(values = values/100) %>%
  ggplot(.) + geom_line(aes(x = date, y = values, color = color)) +
  theme_minimal() + xlab("") + ylab("") +
  scale_x_date(breaks = seq(1960, 2100, 2) %>% paste0("-01-01") %>% as.Date,
               labels = date_format("%Y")) +
  scale_y_continuous(breaks = 0.01*seq(-100, 100, 1),
                     labels = percent_format(a = 1)) +
  scale_color_identity() + add_5flags +
  theme(legend.position = c(0.75, 0.90),
        legend.title = element_blank())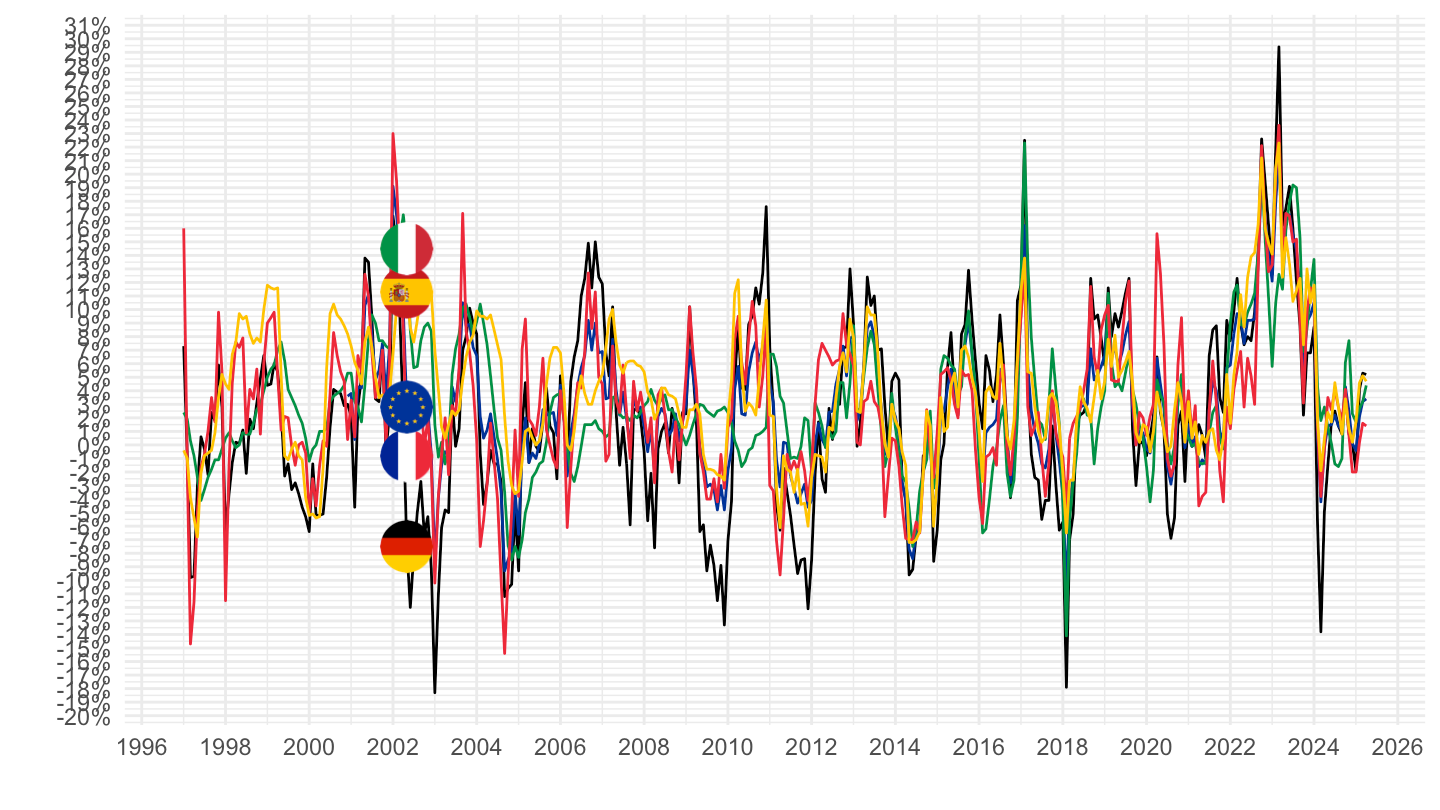
2016-
Code
prc_hicp_manr %>%
  filter(coicop == "CP0117",
         geo %in% c("FR", "DE", "ES", "IT", "EA20")) %>%
  month_to_date %>%
  filter(date >= as.Date("2016-01-01")) %>%
  left_join(geo, by = "geo") %>%
  mutate(Geo = ifelse(geo == "EA20", "Europe", Geo)) %>%
  left_join(colors, by = c("Geo" = "country")) %>%
  mutate(values = values/100) %>%
  ggplot(.) + geom_line(aes(x = date, y = values, color = color)) +
  theme_minimal() + xlab("") + ylab("") +
  scale_x_date(breaks = seq(1960, 2100, 1) %>% paste0("-01-01") %>% as.Date,
               labels = date_format("%Y")) +
  scale_y_continuous(breaks = 0.01*seq(-20, 100, 1),
                     labels = percent_format(a = 1)) +
  scale_color_identity() + add_5flags +
  theme(legend.position = c(0.75, 0.90),
        legend.title = element_blank())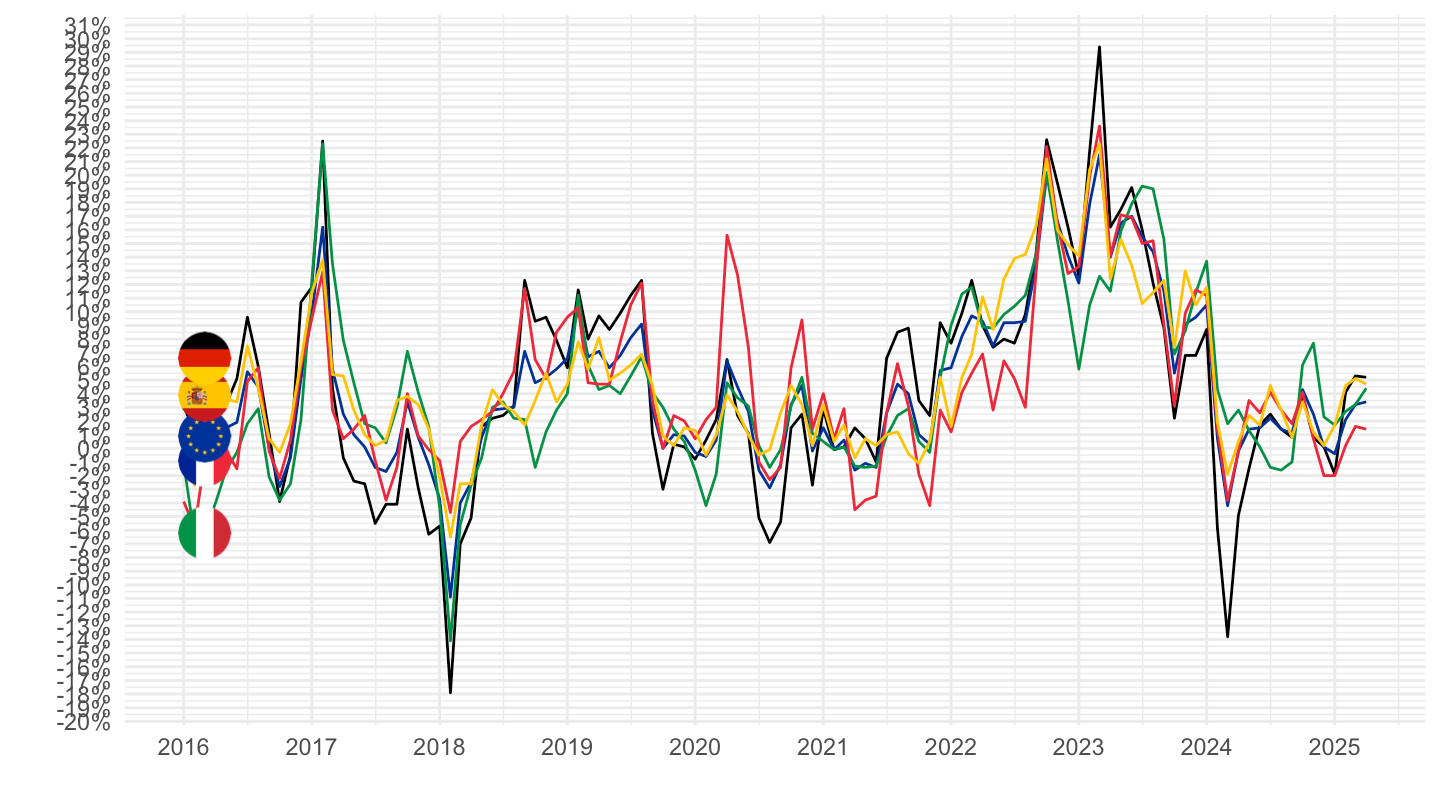
2020-
Code
prc_hicp_manr %>%
  filter(coicop == "CP0117",
         geo %in% c("FR", "DE", "ES", "IT", "EA20")) %>%
  month_to_date %>%
  filter(date >= as.Date("2020-01-01")) %>%
  left_join(geo, by = "geo") %>%
  mutate(Geo = ifelse(geo == "EA20", "Europe", Geo)) %>%
  left_join(colors, by = c("Geo" = "country")) %>%
  mutate(values = values/100) %>%
  ggplot(.) + geom_line(aes(x = date, y = values, color = color)) +
  theme_minimal() + xlab("") + ylab("") +
  scale_x_date(breaks = seq.Date(as.Date("2019-12-01"), as.Date("2100-01-01"), "3 months"),
               labels = date_format("%b %Y")) +
  scale_y_continuous(breaks = 0.01*seq(-20, 100, 1),
                     labels = percent_format(a = 1)) +
  scale_color_identity() + add_5flags +
  theme(legend.position = c(0.75, 0.90),
        legend.title = element_blank(),
        axis.text.x = element_text(angle = 45, vjust = 1, hjust = 1))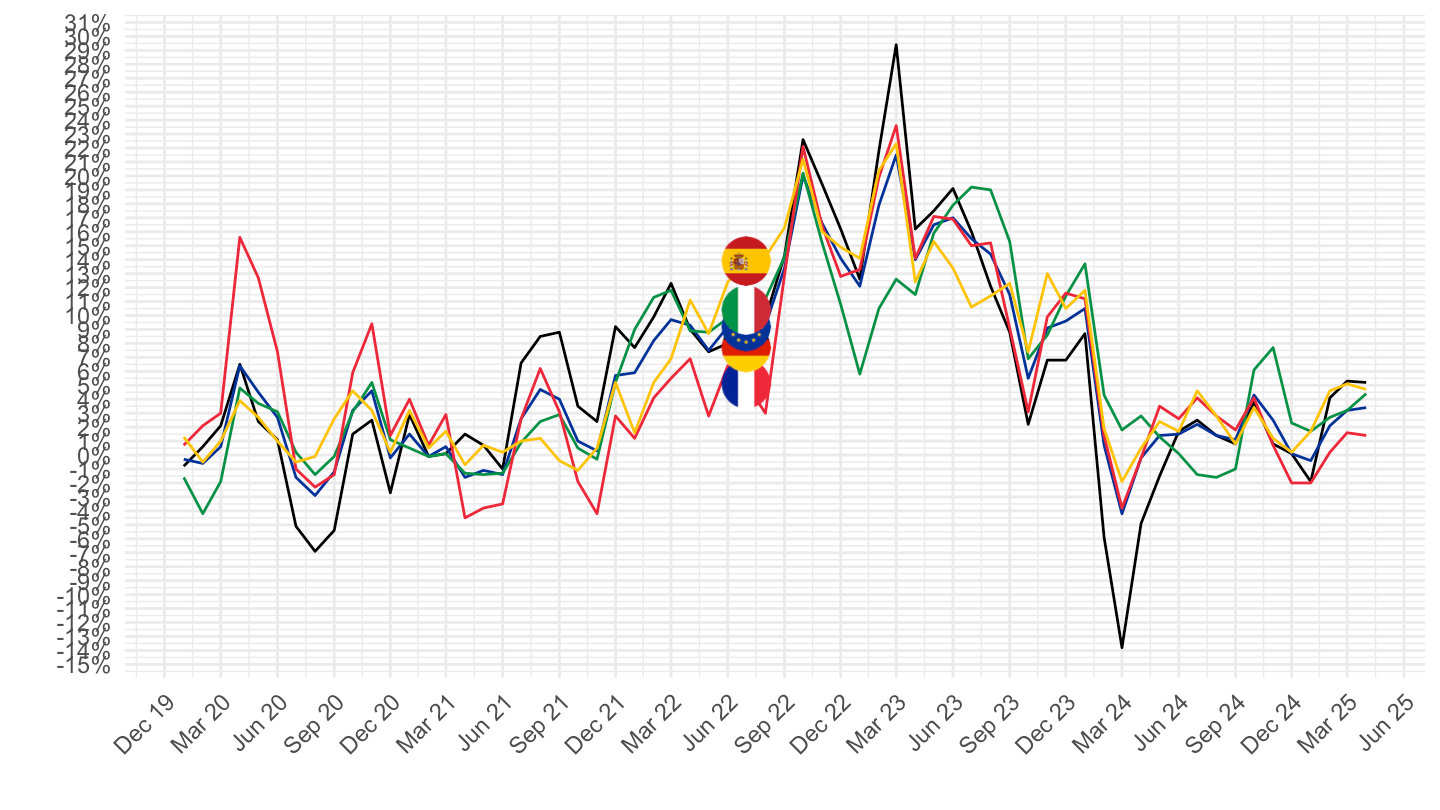
CP07332 - International flights
All
Code
prc_hicp_manr %>%
  filter(coicop == "CP07332",
         geo %in% c("FR", "DE", "ES", "IT", "EA20")) %>%
  month_to_date %>%
  left_join(geo, by = "geo") %>%
  mutate(Geo = ifelse(geo == "EA20", "Europe", Geo)) %>%
  left_join(colors, by = c("Geo" = "country")) %>%
  mutate(values = values/100) %>%
  ggplot(.) + geom_line(aes(x = date, y = values, color = color)) +
  theme_minimal() + xlab("") + ylab("") +
  scale_x_date(breaks = seq(1960, 2100, 2) %>% paste0("-01-01") %>% as.Date,
               labels = date_format("%Y")) +
  scale_y_continuous(breaks = 0.01*seq(-100, 100, 5),
                     labels = percent_format(a = 1)) +
  scale_color_identity() + add_5flags +
  theme(legend.position = c(0.75, 0.90),
        legend.title = element_blank())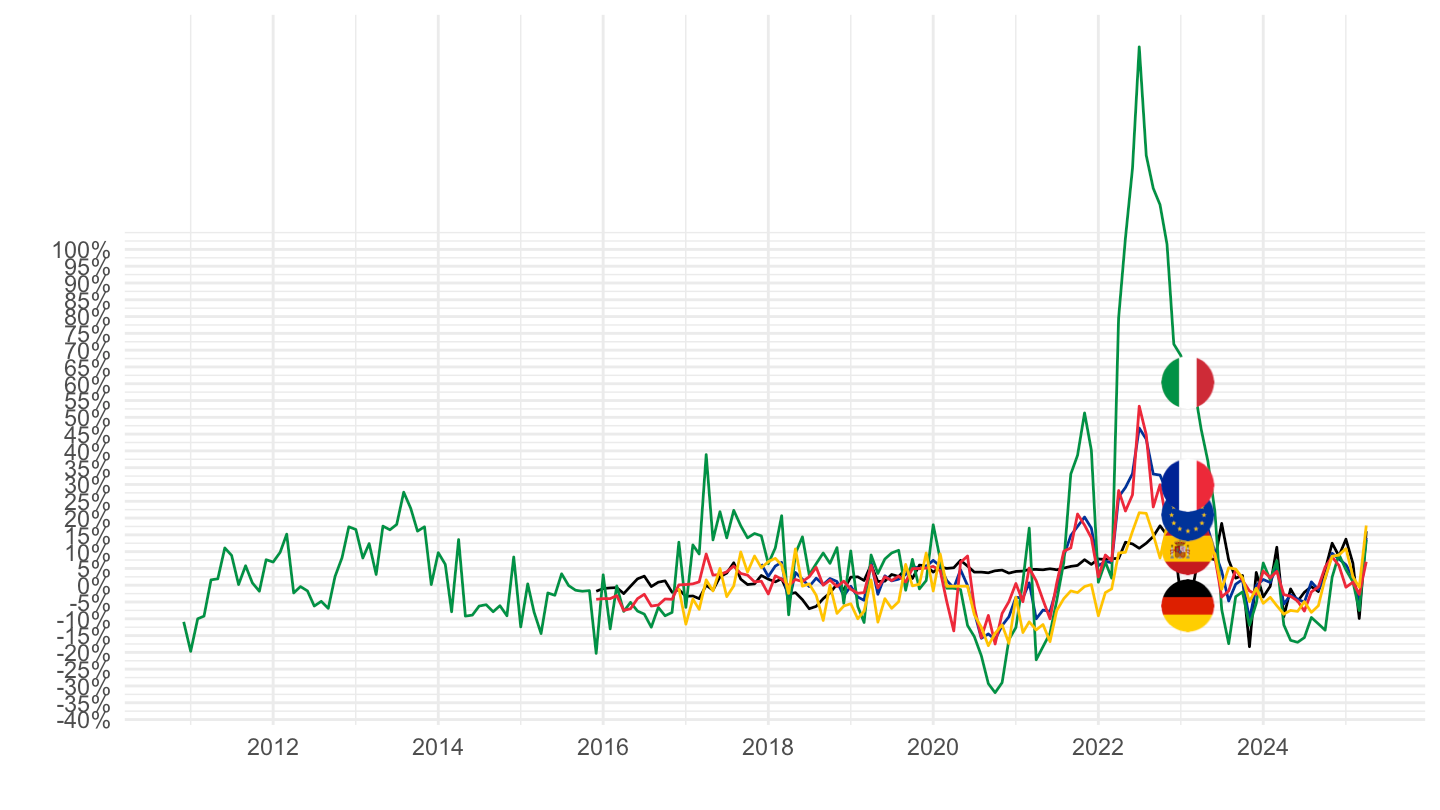
2016-
Code
prc_hicp_manr %>%
  filter(coicop == "CP07332",
         geo %in% c("FR", "DE", "ES", "IT", "EA20")) %>%
  month_to_date %>%
  filter(date >= as.Date("2016-01-01")) %>%
  left_join(geo, by = "geo") %>%
  mutate(Geo = ifelse(geo == "EA20", "Europe", Geo)) %>%
  left_join(colors, by = c("Geo" = "country")) %>%
  mutate(values = values/100) %>%
  ggplot(.) + geom_line(aes(x = date, y = values, color = color)) +
  theme_minimal() + xlab("") + ylab("") +
  scale_x_date(breaks = seq(1960, 2100, 1) %>% paste0("-01-01") %>% as.Date,
               labels = date_format("%Y")) +
  scale_y_continuous(breaks = 0.01*seq(-20, 100, 5),
                     labels = percent_format(a = 1)) +
  scale_color_identity() + add_5flags +
  theme(legend.position = c(0.75, 0.90),
        legend.title = element_blank())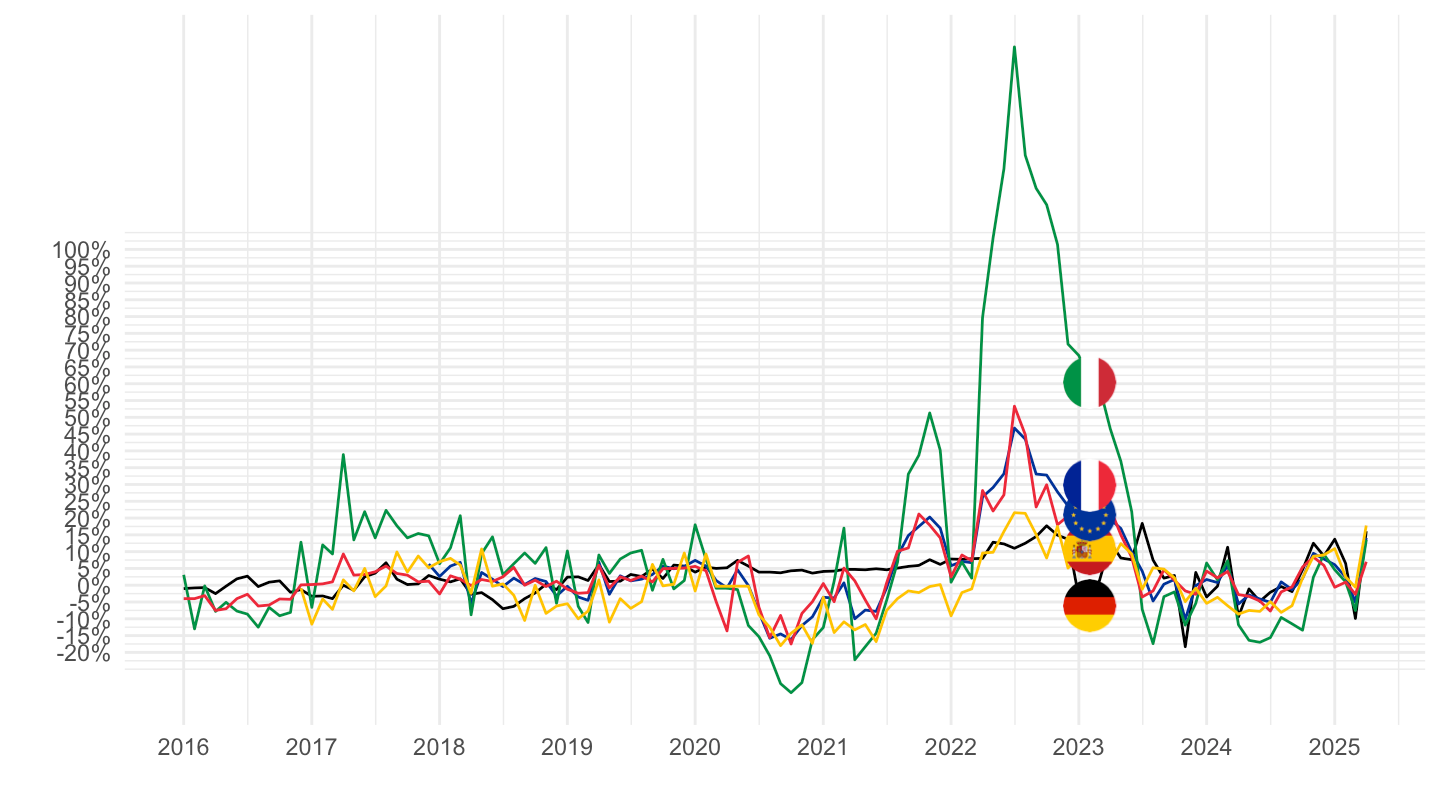
2020-
Code
prc_hicp_manr %>%
  filter(coicop == "CP07332",
         geo %in% c("FR", "DE", "ES", "IT", "EA20")) %>%
  month_to_date %>%
  filter(date >= as.Date("2020-01-01")) %>%
  left_join(geo, by = "geo") %>%
  mutate(Geo = ifelse(geo == "EA20", "Europe", Geo)) %>%
  left_join(colors, by = c("Geo" = "country")) %>%
  mutate(values = values/100) %>%
  ggplot(.) + geom_line(aes(x = date, y = values, color = color)) +
  theme_minimal() + xlab("") + ylab("") +
  scale_x_date(breaks = seq.Date(as.Date("2019-12-01"), as.Date("2100-01-01"), "3 months"),
               labels = date_format("%b %Y")) +
  scale_y_continuous(breaks = 0.01*seq(-20, 100, 10),
                     labels = percent_format(a = 1)) +
  scale_color_identity() + add_5flags +
  theme(legend.position = c(0.75, 0.90),
        legend.title = element_blank(),
        axis.text.x = element_text(angle = 45, vjust = 1, hjust = 1))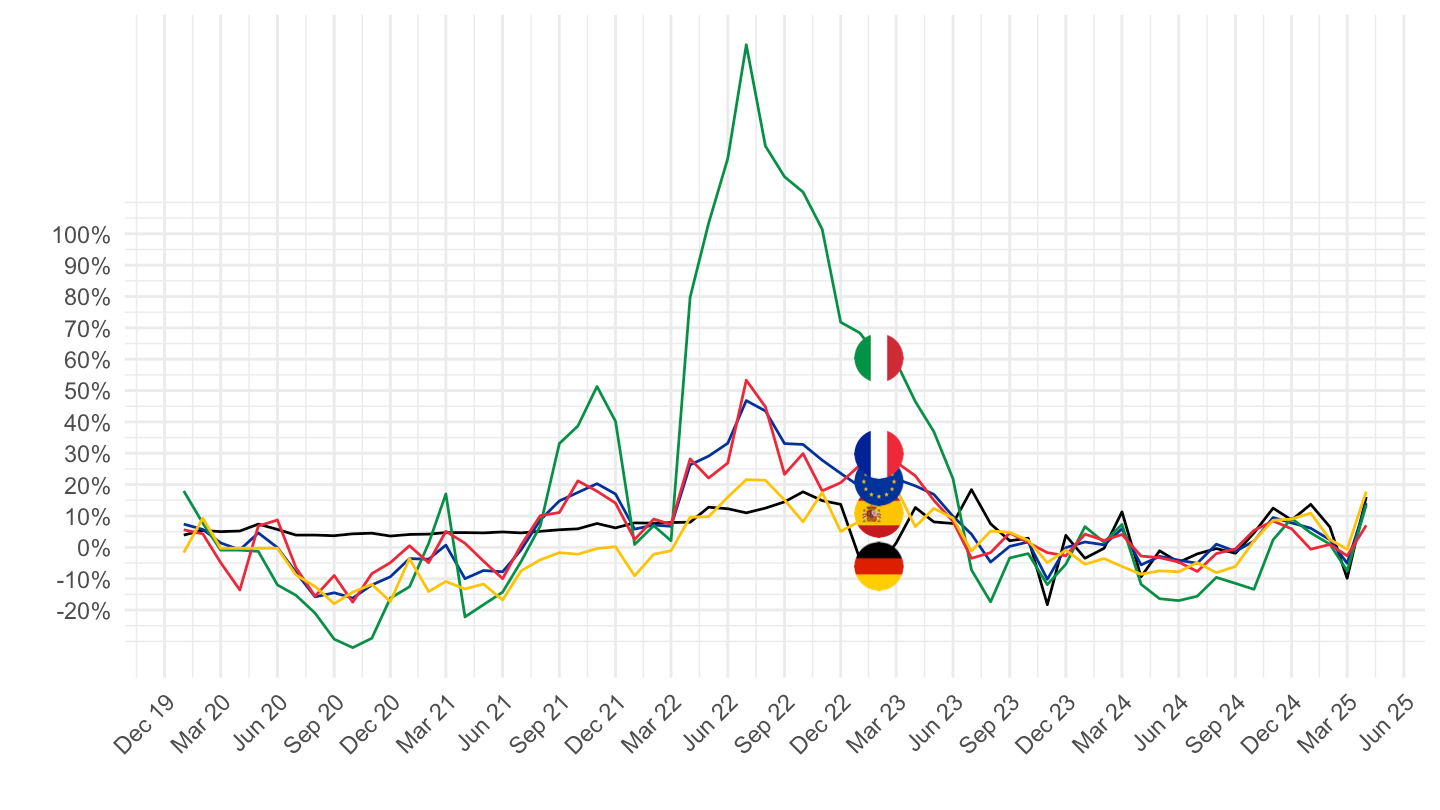
CP0722 - Fuels and lubricants for personal transport equipment
All
Code
prc_hicp_manr %>%
  filter(coicop == "CP0722",
         geo %in% c("FR", "DE", "ES", "IT", "EA20")) %>%
  month_to_date %>%
  left_join(geo, by = "geo") %>%
  mutate(Geo = ifelse(geo == "EA20", "Europe", Geo)) %>%
  left_join(colors, by = c("Geo" = "country")) %>%
  mutate(values = values/100) %>%
  ggplot(.) + geom_line(aes(x = date, y = values, color = color)) +
  theme_minimal() + xlab("") + ylab("") +
  scale_x_date(breaks = seq(1960, 2100, 2) %>% paste0("-01-01") %>% as.Date,
               labels = date_format("%Y")) +
  scale_y_continuous(breaks = 0.01*seq(-100, 100, 5),
                     labels = percent_format(a = 1)) +
  scale_color_identity() + add_5flags +
  theme(legend.position = c(0.75, 0.90),
        legend.title = element_blank())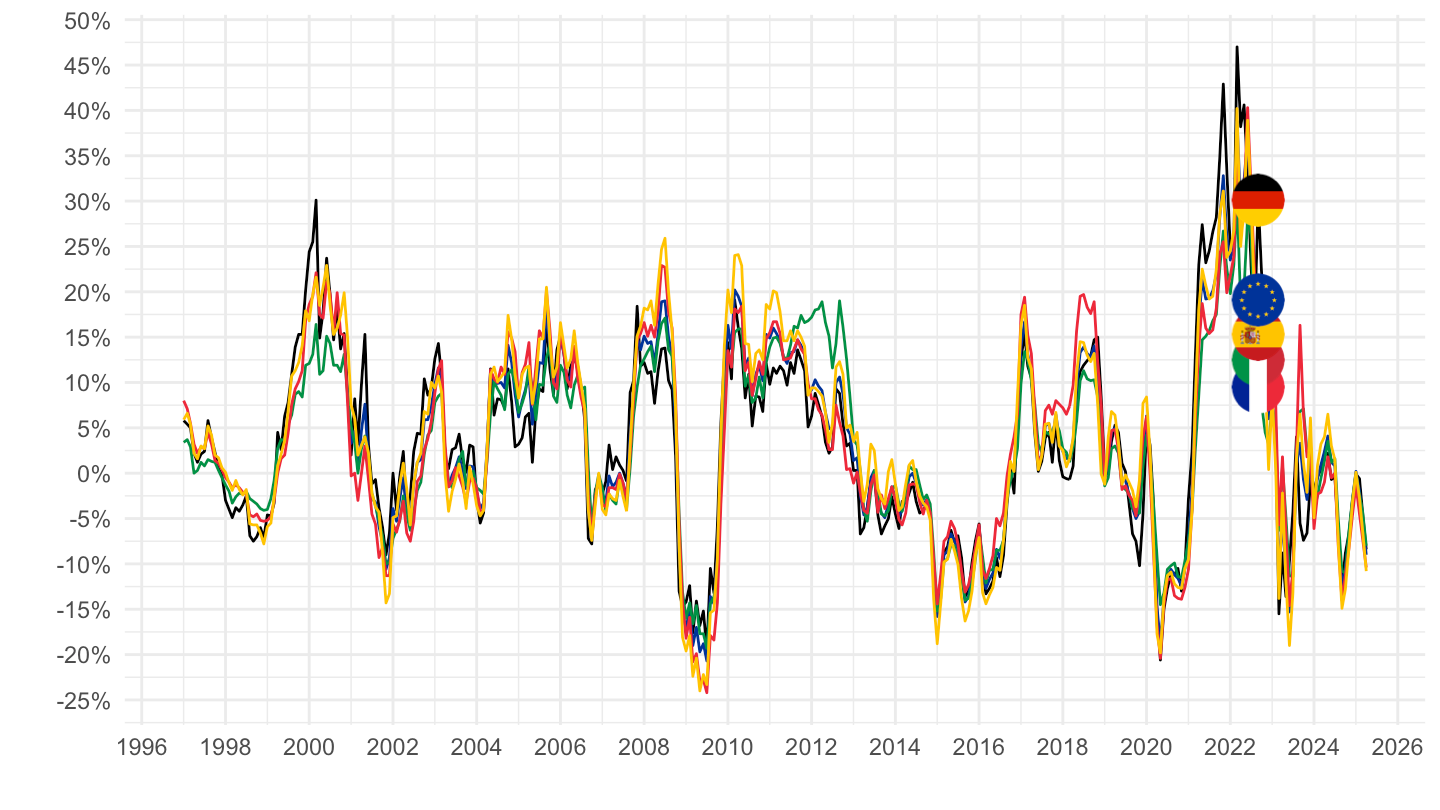
2016-
Code
prc_hicp_manr %>%
  filter(coicop == "CP0722",
         geo %in% c("FR", "DE", "ES", "IT", "EA20")) %>%
  month_to_date %>%
  filter(date >= as.Date("2016-01-01")) %>%
  left_join(geo, by = "geo") %>%
  mutate(Geo = ifelse(geo == "EA20", "Europe", Geo)) %>%
  left_join(colors, by = c("Geo" = "country")) %>%
  mutate(values = values/100) %>%
  ggplot(.) + geom_line(aes(x = date, y = values, color = color)) +
  theme_minimal() + xlab("") + ylab("") +
  scale_x_date(breaks = seq(1960, 2100, 1) %>% paste0("-01-01") %>% as.Date,
               labels = date_format("%Y")) +
  scale_y_continuous(breaks = 0.01*seq(-20, 100, 10),
                     labels = percent_format(a = 1)) +
  scale_color_identity() + add_5flags +
  theme(legend.position = c(0.75, 0.90),
        legend.title = element_blank())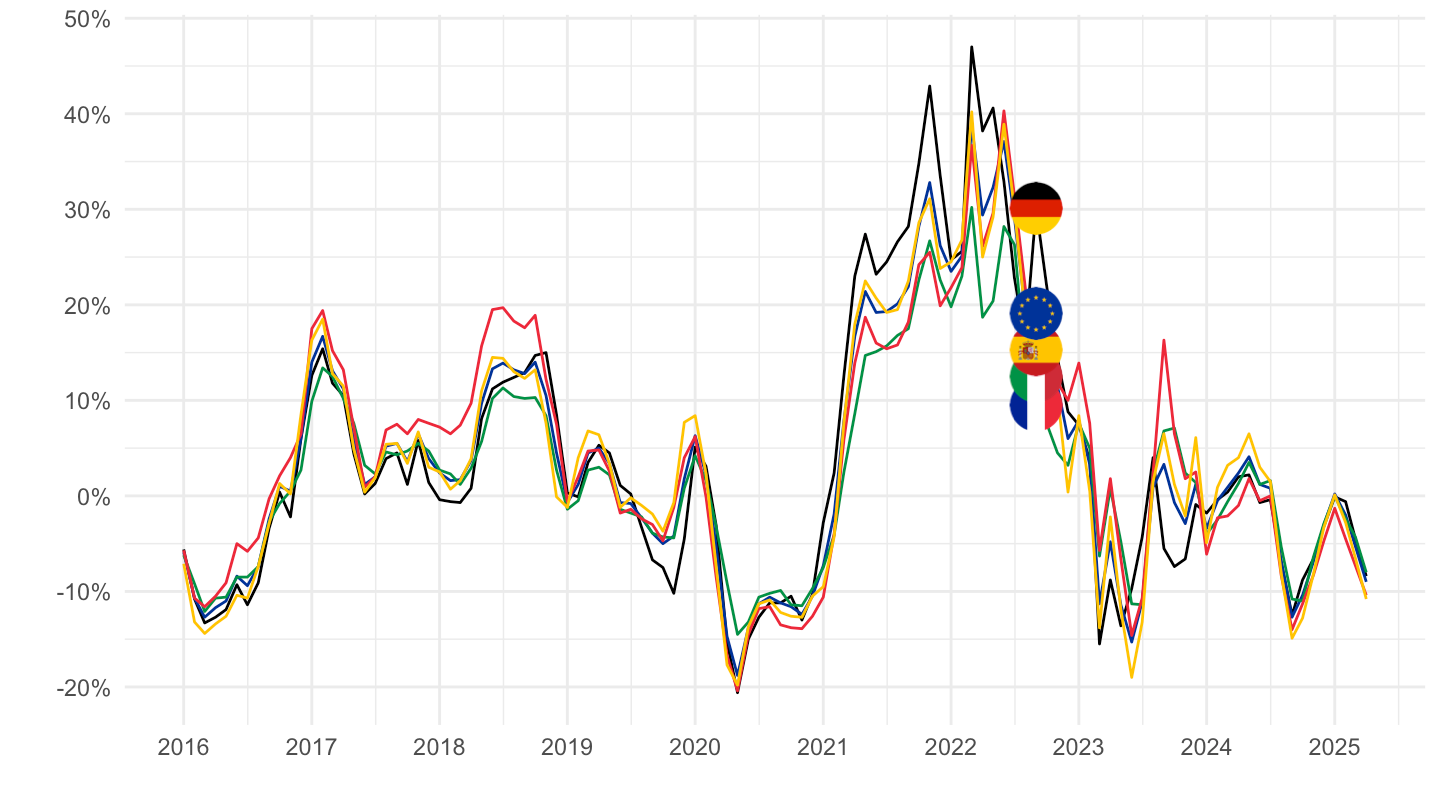
2020-
Code
prc_hicp_manr %>%
  filter(coicop == "CP0722",
         geo %in% c("FR", "DE", "ES", "IT", "EA20")) %>%
  month_to_date %>%
  filter(date >= as.Date("2020-01-01")) %>%
  left_join(geo, by = "geo") %>%
  mutate(Geo = ifelse(geo == "EA20", "Europe", Geo)) %>%
  left_join(colors, by = c("Geo" = "country")) %>%
  mutate(values = values/100) %>%
  ggplot(.) + geom_line(aes(x = date, y = values, color = color)) +
  theme_minimal() + xlab("") + ylab("") +
  scale_x_date(breaks = seq.Date(as.Date("2019-12-01"), as.Date("2100-01-01"), "3 months"),
               labels = date_format("%b %Y")) +
  scale_y_continuous(breaks = 0.01*seq(-20, 100, 10),
                     labels = percent_format(a = 1)) +
  scale_color_identity() + add_5flags +
  theme(legend.position = c(0.75, 0.90),
        legend.title = element_blank(),
        axis.text.x = element_text(angle = 45, vjust = 1, hjust = 1))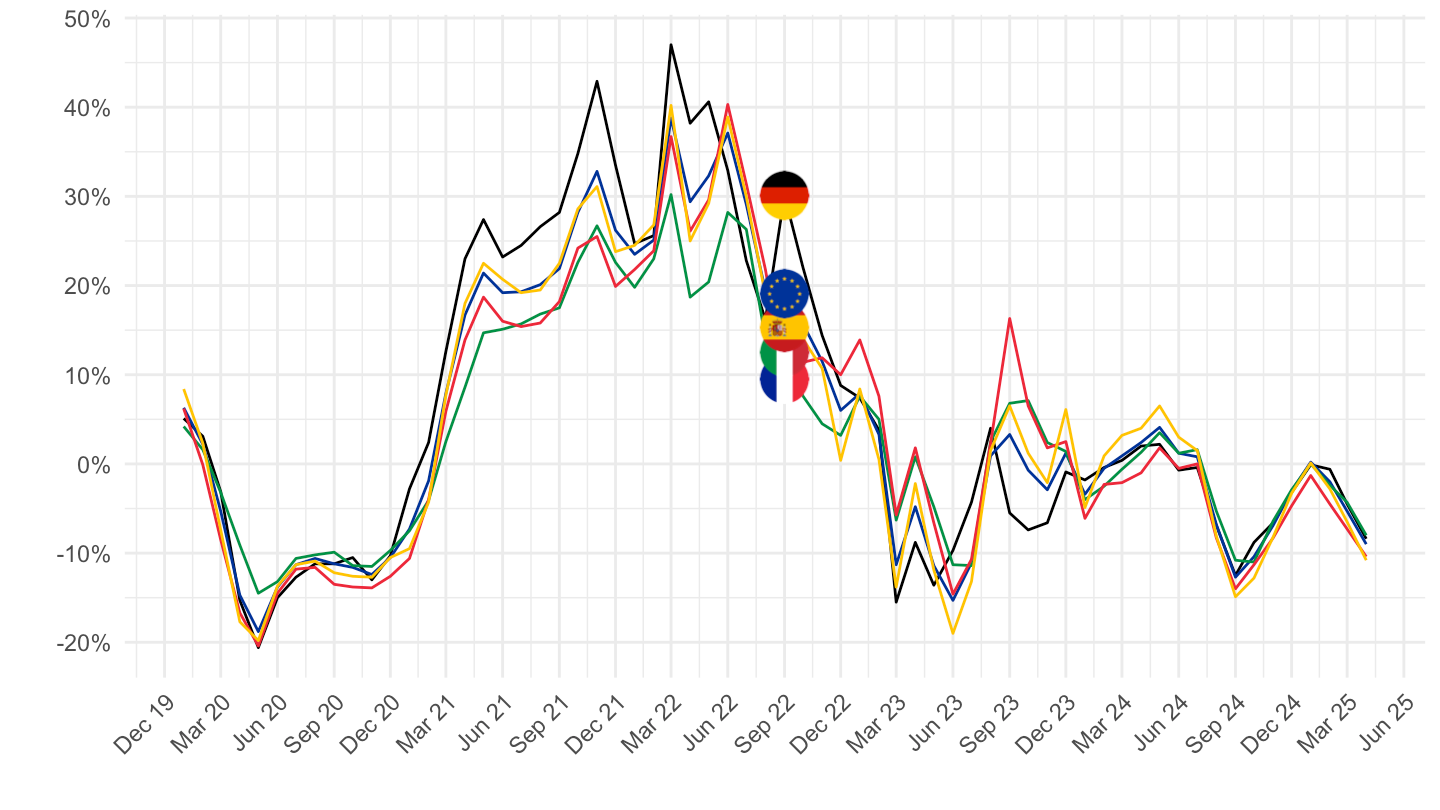
CP072 - Operation of personal transport equipment
All
Code
prc_hicp_manr %>%
  filter(coicop == "CP072",
         geo %in% c("FR", "DE", "ES", "IT", "EA20")) %>%
  month_to_date %>%
  left_join(geo, by = "geo") %>%
  mutate(Geo = ifelse(geo == "EA20", "Europe", Geo)) %>%
  left_join(colors, by = c("Geo" = "country")) %>%
  mutate(values = values/100) %>%
  ggplot(.) + geom_line(aes(x = date, y = values, color = color)) +
  theme_minimal() + xlab("") + ylab("") +
  scale_x_date(breaks = seq(1960, 2100, 2) %>% paste0("-01-01") %>% as.Date,
               labels = date_format("%Y")) +
  scale_y_continuous(breaks = 0.01*seq(-100, 100, 5),
                     labels = percent_format(a = 1)) +
  scale_color_identity() + add_5flags +
  theme(legend.position = c(0.75, 0.90),
        legend.title = element_blank())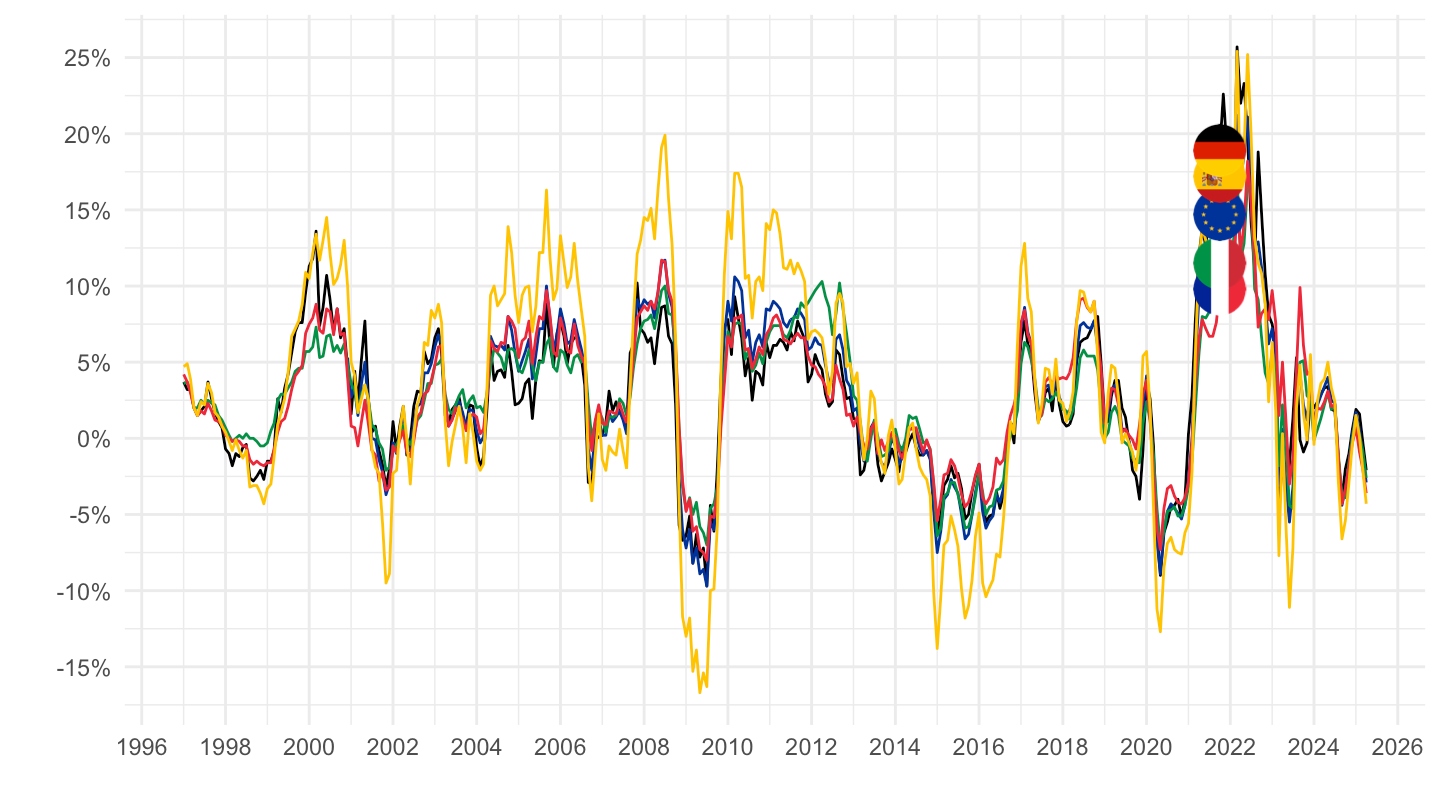
2016-
Code
prc_hicp_manr %>%
  filter(coicop == "CP072",
         geo %in% c("FR", "DE", "ES", "IT", "EA20")) %>%
  month_to_date %>%
  filter(date >= as.Date("2016-01-01")) %>%
  left_join(geo, by = "geo") %>%
  mutate(Geo = ifelse(geo == "EA20", "Europe", Geo)) %>%
  left_join(colors, by = c("Geo" = "country")) %>%
  mutate(values = values/100) %>%
  ggplot(.) + geom_line(aes(x = date, y = values, color = color)) +
  theme_minimal() + xlab("") + ylab("") +
  scale_x_date(breaks = seq(1960, 2100, 1) %>% paste0("-01-01") %>% as.Date,
               labels = date_format("%Y")) +
  scale_y_continuous(breaks = 0.01*seq(-20, 100, 10),
                     labels = percent_format(a = 1)) +
  scale_color_identity() + add_5flags +
  theme(legend.position = c(0.75, 0.90),
        legend.title = element_blank())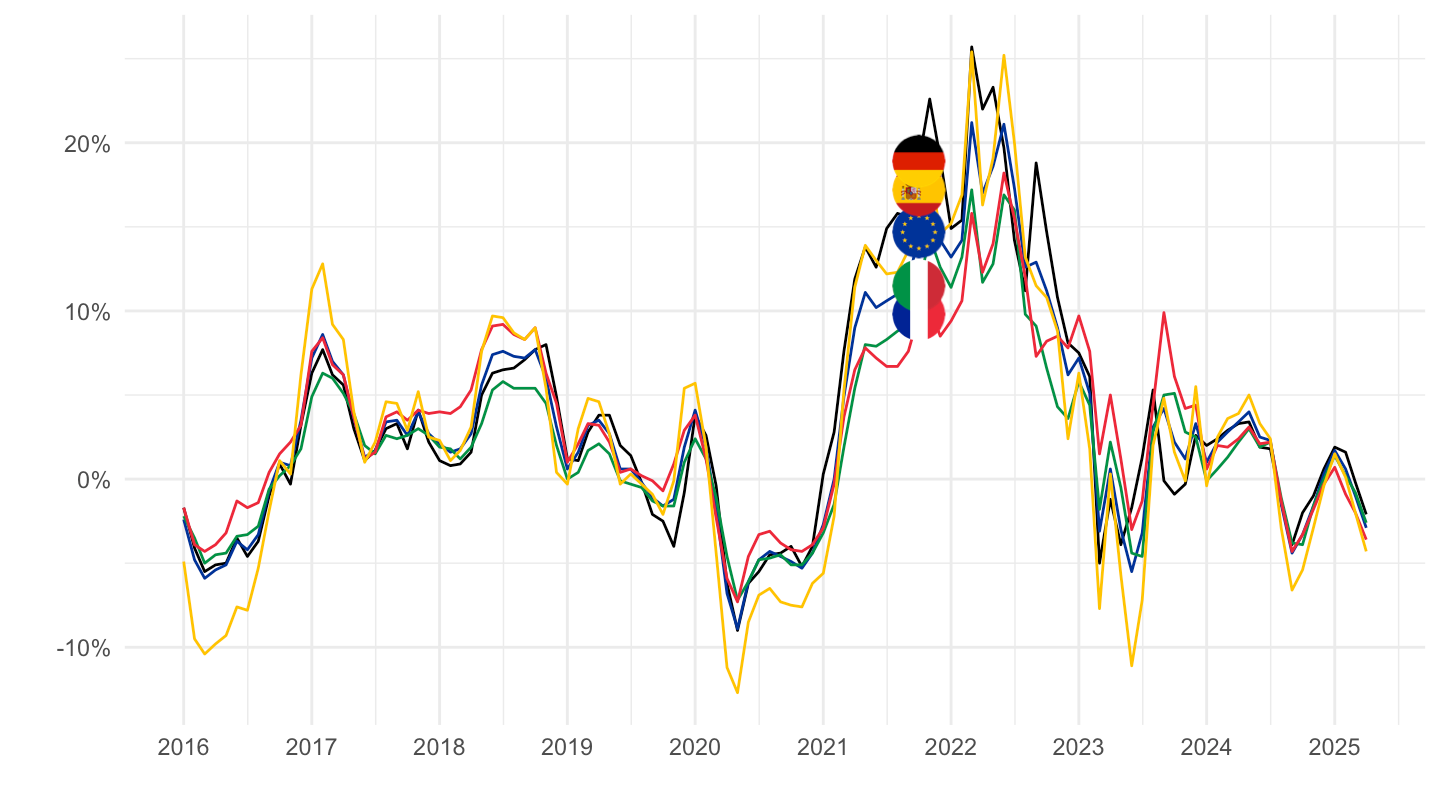
2020-
Code
prc_hicp_manr %>%
  filter(coicop == "CP072",
         geo %in% c("FR", "DE", "ES", "IT", "EA20")) %>%
  month_to_date %>%
  filter(date >= as.Date("2020-01-01")) %>%
  left_join(geo, by = "geo") %>%
  mutate(Geo = ifelse(geo == "EA20", "Europe", Geo)) %>%
  left_join(colors, by = c("Geo" = "country")) %>%
  mutate(values = values/100) %>%
  ggplot(.) + geom_line(aes(x = date, y = values, color = color)) +
  theme_minimal() + xlab("") + ylab("") +
  scale_x_date(breaks = seq.Date(as.Date("2019-12-01"), as.Date("2100-01-01"), "3 months"),
               labels = date_format("%b %Y")) +
  scale_y_continuous(breaks = 0.01*seq(-20, 100, 5),
                     labels = percent_format(a = 1)) +
  scale_color_identity() + add_5flags +
  theme(legend.position = c(0.75, 0.90),
        legend.title = element_blank(),
        axis.text.x = element_text(angle = 45, vjust = 1, hjust = 1))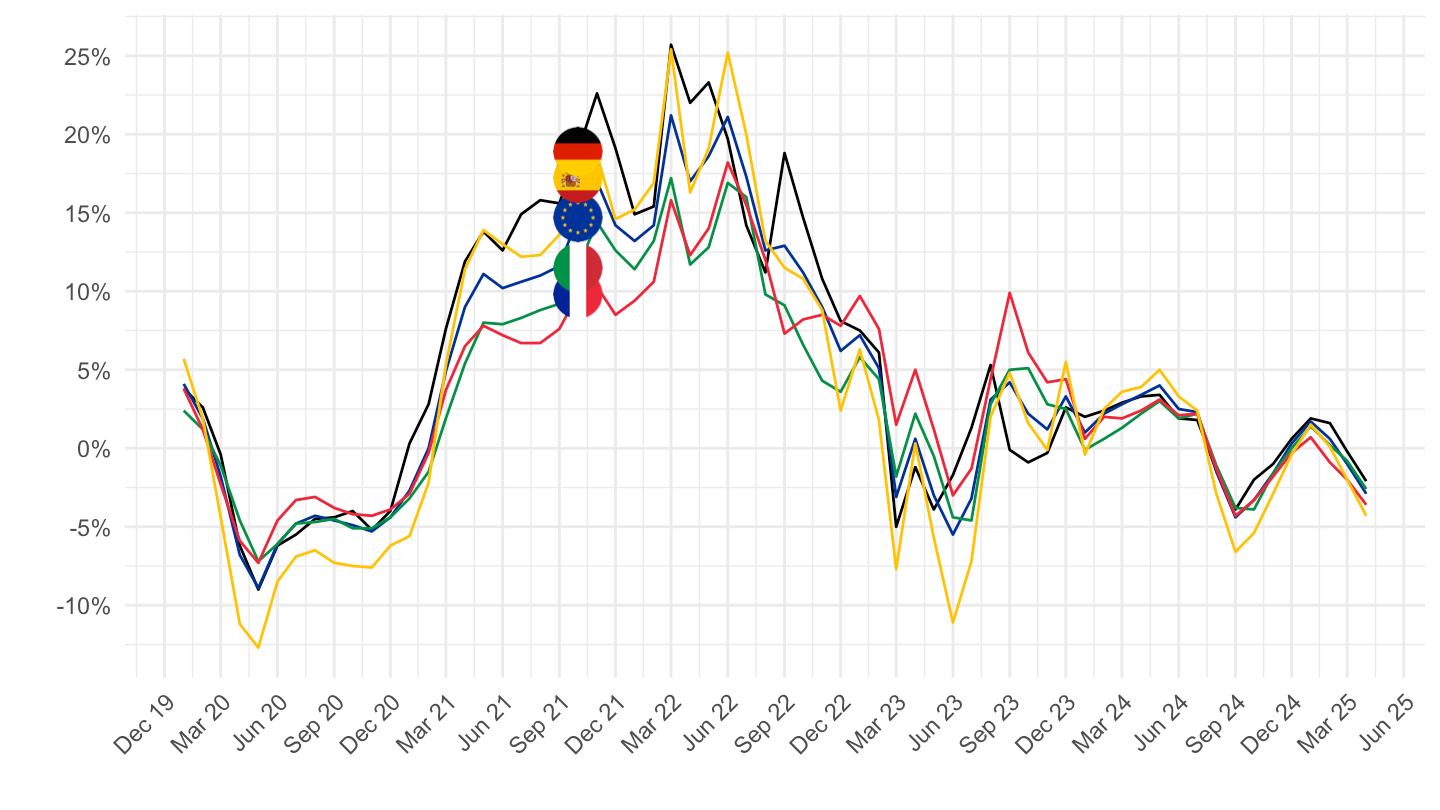
CP0451 - Electricity
All
Code
prc_hicp_manr %>%
  filter(coicop == "CP0451",
         geo %in% c("FR", "DE", "ES", "IT", "EA20")) %>%
  month_to_date %>%
  left_join(geo, by = "geo") %>%
  mutate(Geo = ifelse(geo == "EA20", "Europe", Geo)) %>%
  left_join(colors, by = c("Geo" = "country")) %>%
  mutate(values = values/100) %>%
  ggplot(.) + geom_line(aes(x = date, y = values, color = color)) +
  theme_minimal() + xlab("") + ylab("") +
  scale_x_date(breaks = seq(1960, 2100, 2) %>% paste0("-01-01") %>% as.Date,
               labels = date_format("%Y")) +
  scale_y_continuous(breaks = 0.01*seq(-100, 100, 5),
                     labels = percent_format(a = 1)) +
  scale_color_identity() + add_5flags +
  theme(legend.position = c(0.75, 0.90),
        legend.title = element_blank())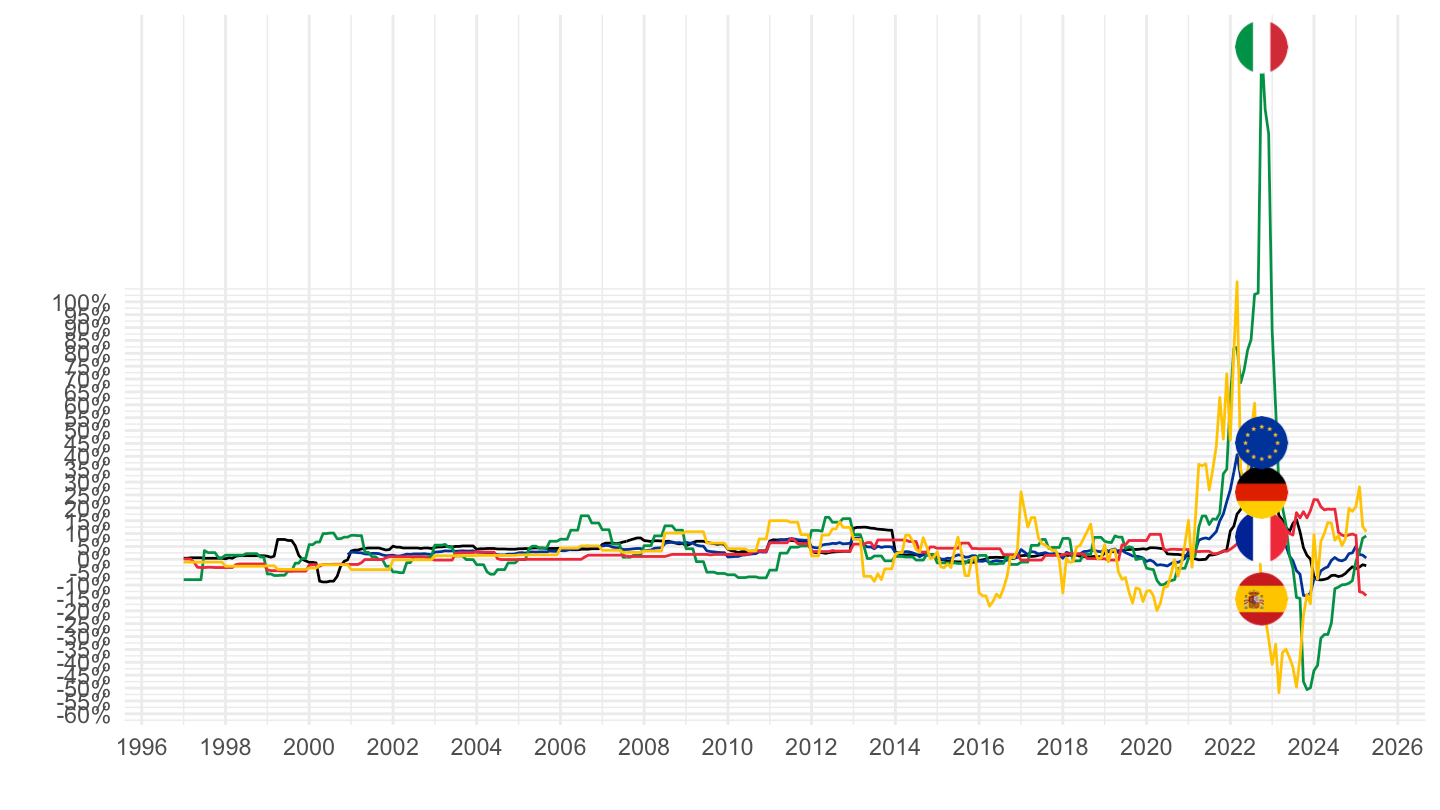
2016-
Code
prc_hicp_manr %>%
  filter(coicop == "CP0451",
         geo %in% c("FR", "DE", "ES", "IT", "EA20")) %>%
  month_to_date %>%
  filter(date >= as.Date("2016-01-01")) %>%
  left_join(geo, by = "geo") %>%
  mutate(Geo = ifelse(geo == "EA20", "Europe", Geo)) %>%
  left_join(colors, by = c("Geo" = "country")) %>%
  mutate(values = values/100) %>%
  ggplot(.) + geom_line(aes(x = date, y = values, color = color)) +
  theme_minimal() + xlab("") + ylab("") +
  scale_x_date(breaks = seq(1960, 2100, 1) %>% paste0("-01-01") %>% as.Date,
               labels = date_format("%Y")) +
  scale_y_continuous(breaks = 0.01*seq(-20, 100, 5),
                     labels = percent_format(a = 1)) +
  scale_color_identity() + add_5flags +
  theme(legend.position = c(0.75, 0.90),
        legend.title = element_blank())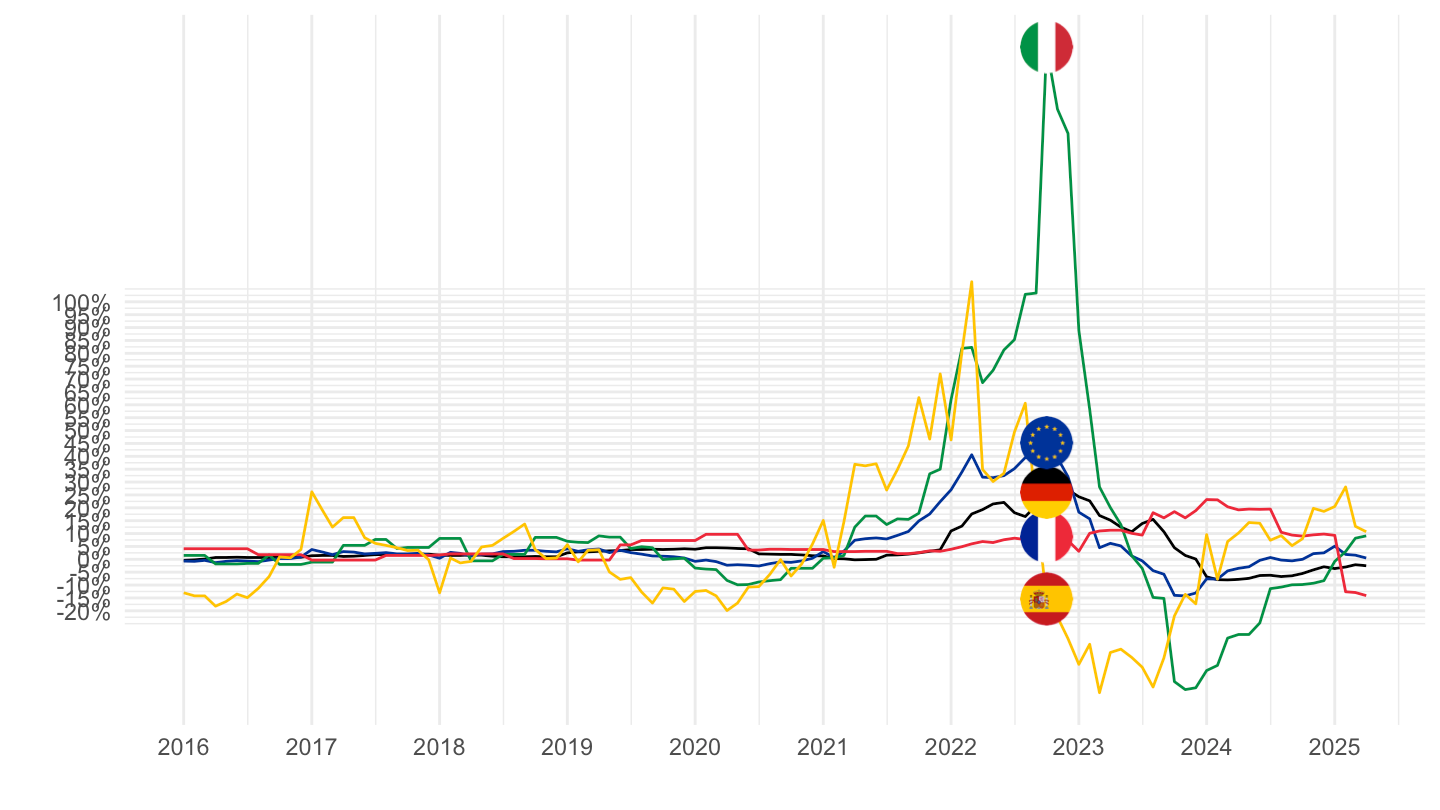
2020-
Code
prc_hicp_manr %>%
  filter(coicop == "CP0451",
         geo %in% c("FR", "DE", "ES", "IT", "EA20")) %>%
  month_to_date %>%
  filter(date >= as.Date("2020-01-01")) %>%
  left_join(geo, by = "geo") %>%
  mutate(Geo = ifelse(geo == "EA20", "Europe", Geo)) %>%
  left_join(colors, by = c("Geo" = "country")) %>%
  mutate(values = values/100) %>%
  ggplot(.) + geom_line(aes(x = date, y = values, color = color)) +
  theme_minimal() + xlab("") + ylab("") +
  scale_x_date(breaks = seq.Date(as.Date("2019-12-01"), as.Date("2100-01-01"), "3 months"),
               labels = date_format("%b %Y")) +
  scale_y_continuous(breaks = 0.01*seq(-100, 300, 10),
                     labels = percent_format(a = 1)) +
  scale_color_identity() + add_5flags +
  theme(legend.position = c(0.75, 0.90),
        legend.title = element_blank(),
        axis.text.x = element_text(angle = 45, vjust = 1, hjust = 1))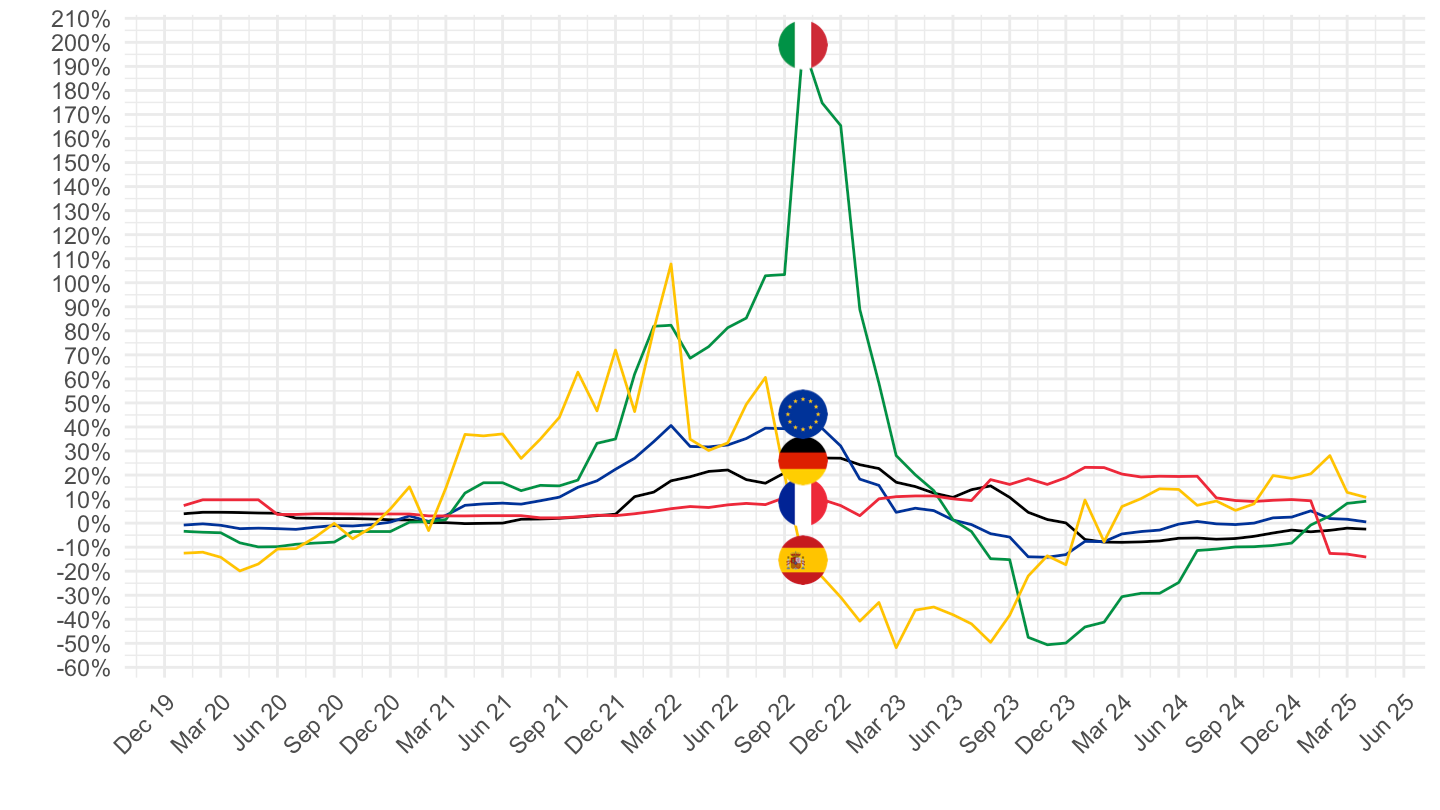
CP0452 - Gas
All
Code
prc_hicp_manr %>%
  filter(coicop == "CP0452",
         geo %in% c("FR", "DE", "ES", "IT", "EA20")) %>%
  month_to_date %>%
  left_join(geo, by = "geo") %>%
  mutate(Geo = ifelse(geo == "EA20", "Europe", Geo)) %>%
  left_join(colors, by = c("Geo" = "country")) %>%
  mutate(values = values/100) %>%
  ggplot(.) + geom_line(aes(x = date, y = values, color = color)) +
  theme_minimal() + xlab("") + ylab("") +
  scale_x_date(breaks = seq(1960, 2100, 2) %>% paste0("-01-01") %>% as.Date,
               labels = date_format("%Y")) +
  scale_y_continuous(breaks = 0.01*seq(-100, 100, 5),
                     labels = percent_format(a = 1)) +
  scale_color_identity() + add_5flags +
  theme(legend.position = c(0.75, 0.90),
        legend.title = element_blank())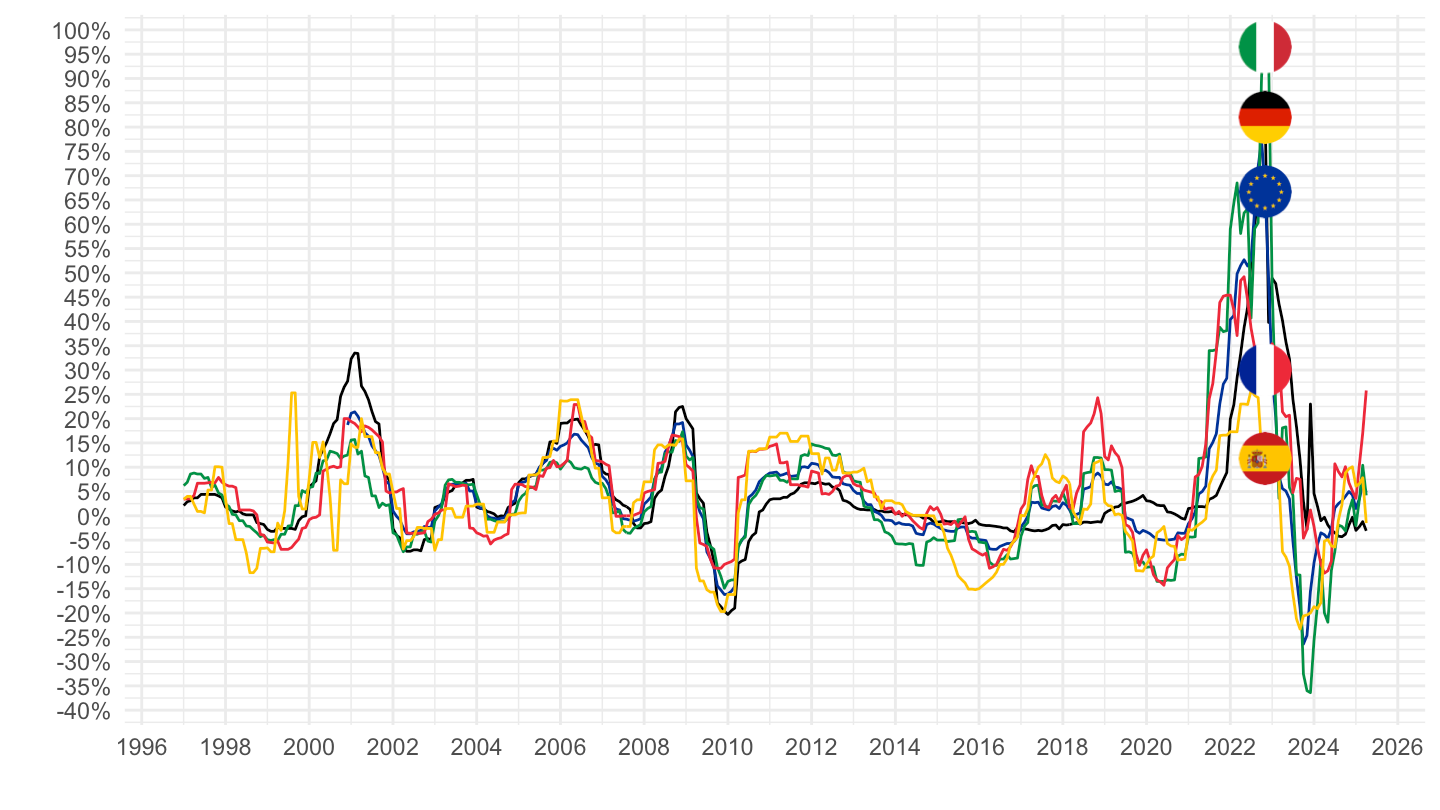
2016-
Code
prc_hicp_manr %>%
  filter(coicop == "CP0452",
         geo %in% c("FR", "DE", "ES", "IT", "EA20")) %>%
  month_to_date %>%
  filter(date >= as.Date("2016-01-01")) %>%
  left_join(geo, by = "geo") %>%
  mutate(Geo = ifelse(geo == "EA20", "Europe", Geo)) %>%
  left_join(colors, by = c("Geo" = "country")) %>%
  mutate(values = values/100) %>%
  ggplot(.) + geom_line(aes(x = date, y = values, color = color)) +
  theme_minimal() + xlab("") + ylab("") +
  scale_x_date(breaks = seq(1960, 2100, 1) %>% paste0("-01-01") %>% as.Date,
               labels = date_format("%Y")) +
  scale_y_continuous(breaks = 0.01*seq(-20, 100, 5),
                     labels = percent_format(a = 1)) +
  scale_color_identity() + add_5flags +
  theme(legend.position = c(0.75, 0.90),
        legend.title = element_blank())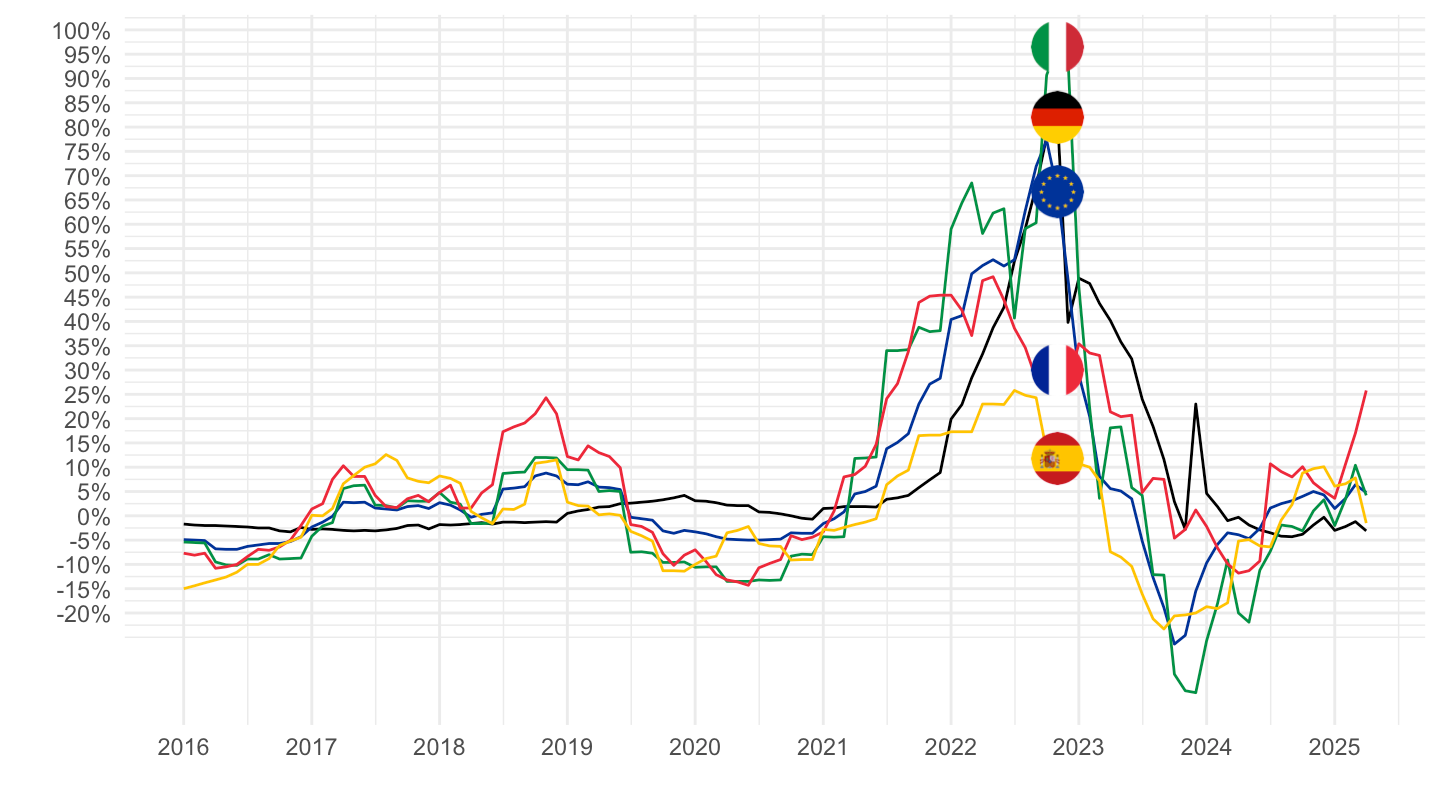
2020-
Code
prc_hicp_manr %>%
  filter(coicop == "CP0452",
         geo %in% c("FR", "DE", "ES", "IT", "EA20")) %>%
  month_to_date %>%
  filter(date >= as.Date("2020-01-01")) %>%
  left_join(geo, by = "geo") %>%
  mutate(Geo = ifelse(geo == "EA20", "Europe", Geo)) %>%
  left_join(colors, by = c("Geo" = "country")) %>%
  mutate(values = values/100) %>%
  ggplot(.) + geom_line(aes(x = date, y = values, color = color)) +
  theme_minimal() + xlab("") + ylab("") +
  scale_x_date(breaks = seq.Date(as.Date("2019-12-01"), as.Date("2100-01-01"), "3 months"),
               labels = date_format("%b %Y")) +
  scale_y_continuous(breaks = 0.01*seq(-20, 100, 10),
                     labels = percent_format(a = 1)) +
  scale_color_identity() + add_5flags +
  theme(legend.position = c(0.75, 0.90),
        legend.title = element_blank(),
        axis.text.x = element_text(angle = 45, vjust = 1, hjust = 1))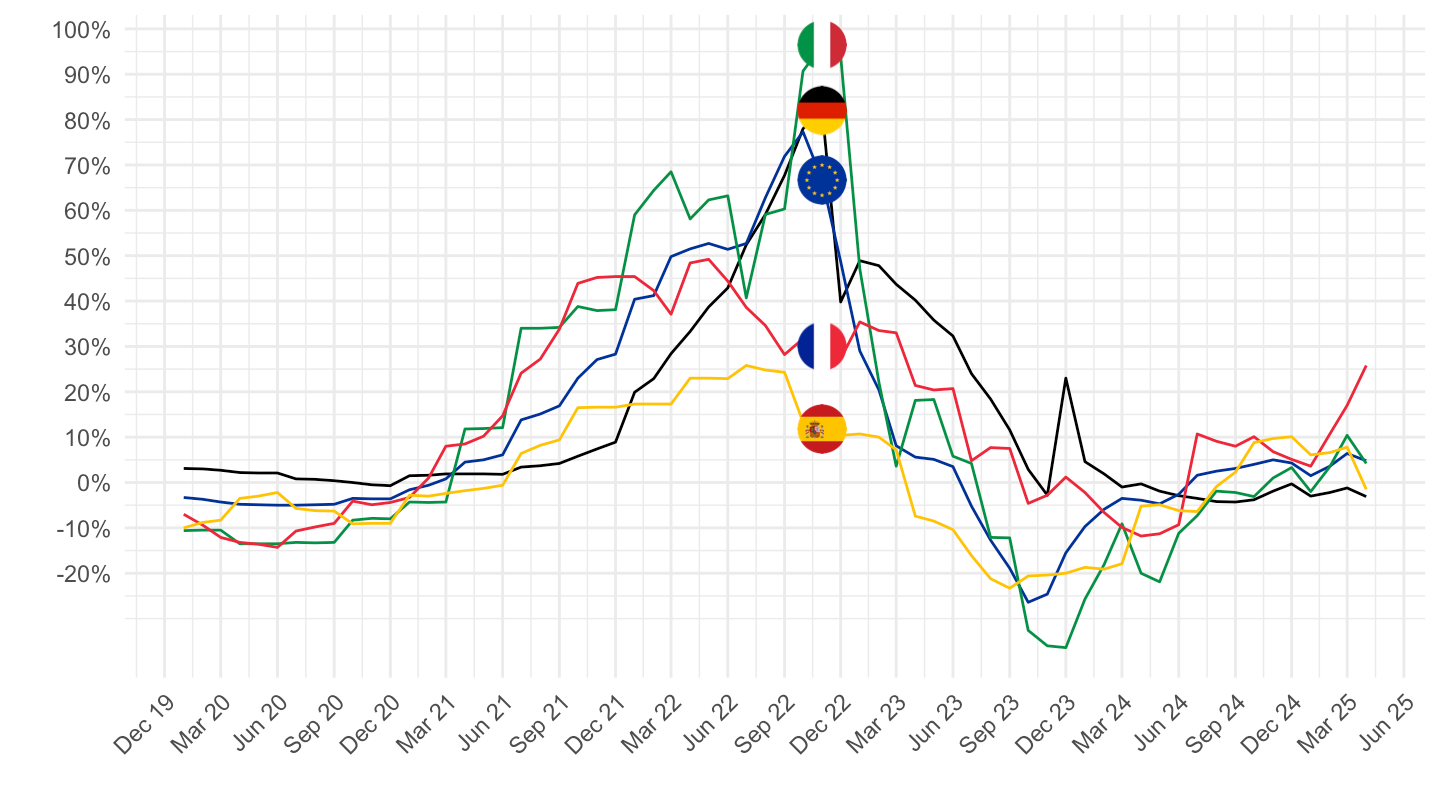
CP0453 - Liquid fuels
All
Code
prc_hicp_manr %>%
  filter(coicop == "CP0453",
         geo %in% c("FR", "DE", "ES", "IT", "EA20")) %>%
  month_to_date %>%
  left_join(geo, by = "geo") %>%
  mutate(Geo = ifelse(geo == "EA20", "Europe", Geo)) %>%
  left_join(colors, by = c("Geo" = "country")) %>%
  mutate(values = values/100) %>%
  ggplot(.) + geom_line(aes(x = date, y = values, color = color)) +
  theme_minimal() + xlab("") + ylab("") +
  scale_x_date(breaks = seq(1960, 2100, 2) %>% paste0("-01-01") %>% as.Date,
               labels = date_format("%Y")) +
  scale_y_continuous(breaks = 0.01*seq(-100, 100, 5),
                     labels = percent_format(a = 1)) +
  scale_color_identity() + add_5flags +
  theme(legend.position = c(0.75, 0.90),
        legend.title = element_blank())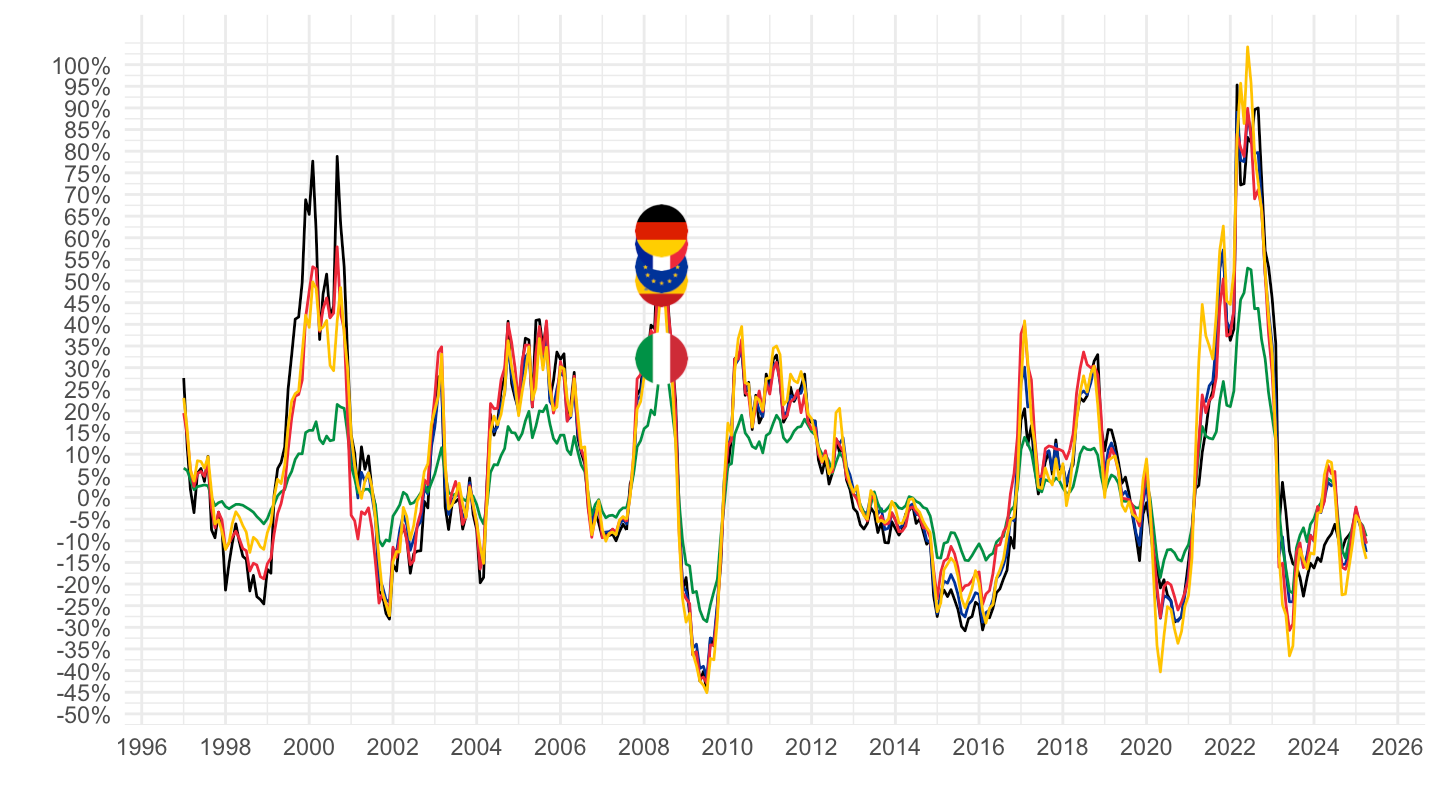
2016-
Code
prc_hicp_manr %>%
  filter(coicop == "CP0453",
         geo %in% c("FR", "DE", "ES", "IT", "EA20")) %>%
  month_to_date %>%
  filter(date >= as.Date("2016-01-01")) %>%
  left_join(geo, by = "geo") %>%
  mutate(Geo = ifelse(geo == "EA20", "Europe", Geo)) %>%
  left_join(colors, by = c("Geo" = "country")) %>%
  mutate(values = values/100) %>%
  ggplot(.) + geom_line(aes(x = date, y = values, color = color)) +
  theme_minimal() + xlab("") + ylab("") +
  scale_x_date(breaks = seq(1960, 2100, 1) %>% paste0("-01-01") %>% as.Date,
               labels = date_format("%Y")) +
  scale_y_continuous(breaks = 0.01*seq(-20, 100, 5),
                     labels = percent_format(a = 1)) +
  scale_color_identity() + add_5flags +
  theme(legend.position = c(0.75, 0.90),
        legend.title = element_blank())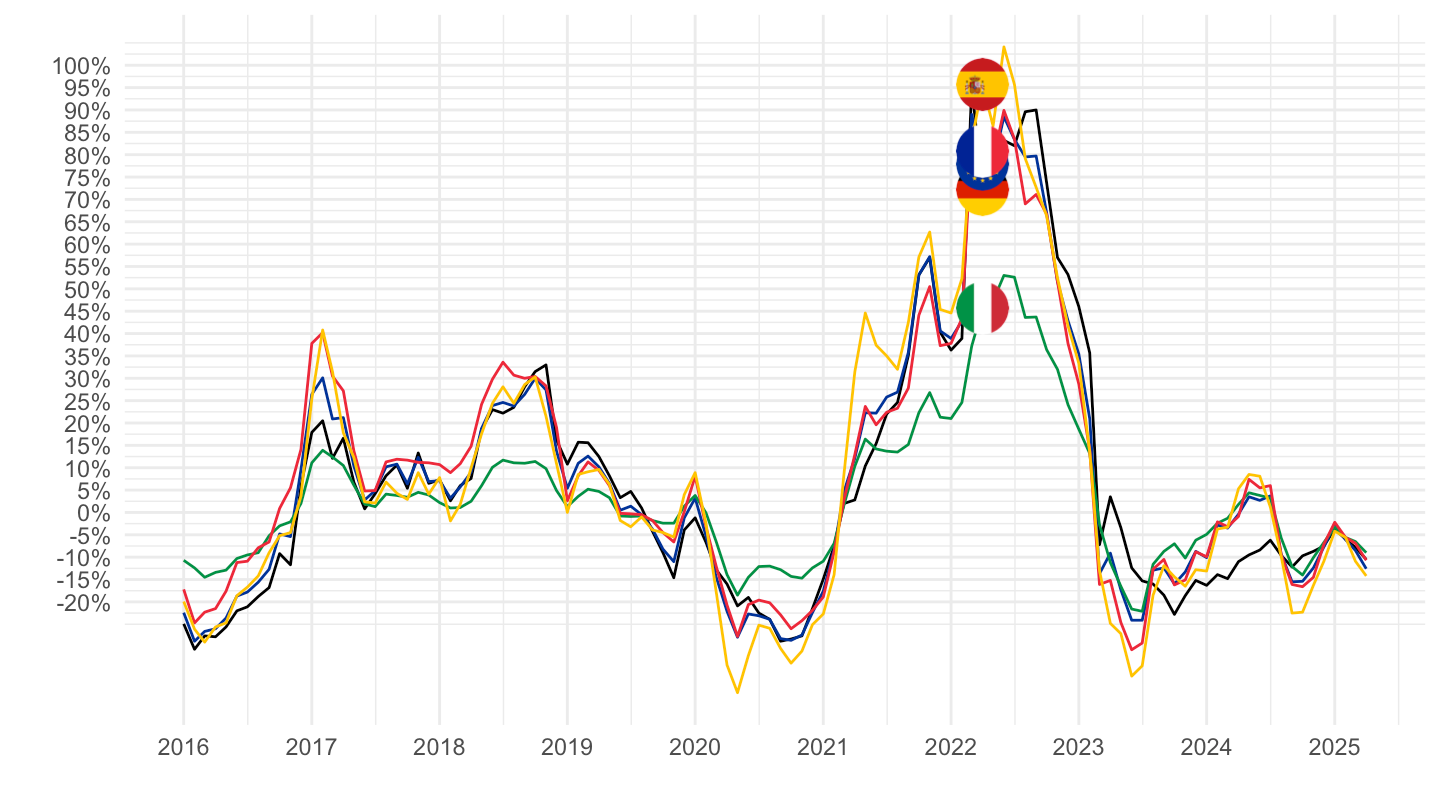
2020-
Code
prc_hicp_manr %>%
  filter(coicop == "CP0453",
         geo %in% c("FR", "DE", "ES", "IT", "EA20")) %>%
  month_to_date %>%
  filter(date >= as.Date("2020-01-01")) %>%
  left_join(geo, by = "geo") %>%
  mutate(Geo = ifelse(geo == "EA20", "Europe", Geo)) %>%
  left_join(colors, by = c("Geo" = "country")) %>%
  mutate(values = values/100) %>%
  ggplot(.) + geom_line(aes(x = date, y = values, color = color)) +
  theme_minimal() + xlab("") + ylab("") +
  scale_x_date(breaks = seq.Date(as.Date("2019-12-01"), as.Date("2100-01-01"), "3 months"),
               labels = date_format("%b %Y")) +
  scale_y_continuous(breaks = 0.01*seq(-20, 100, 10),
                     labels = percent_format(a = 1)) +
  scale_color_identity() + add_5flags +
  theme(legend.position = c(0.75, 0.90),
        legend.title = element_blank(),
        axis.text.x = element_text(angle = 45, vjust = 1, hjust = 1))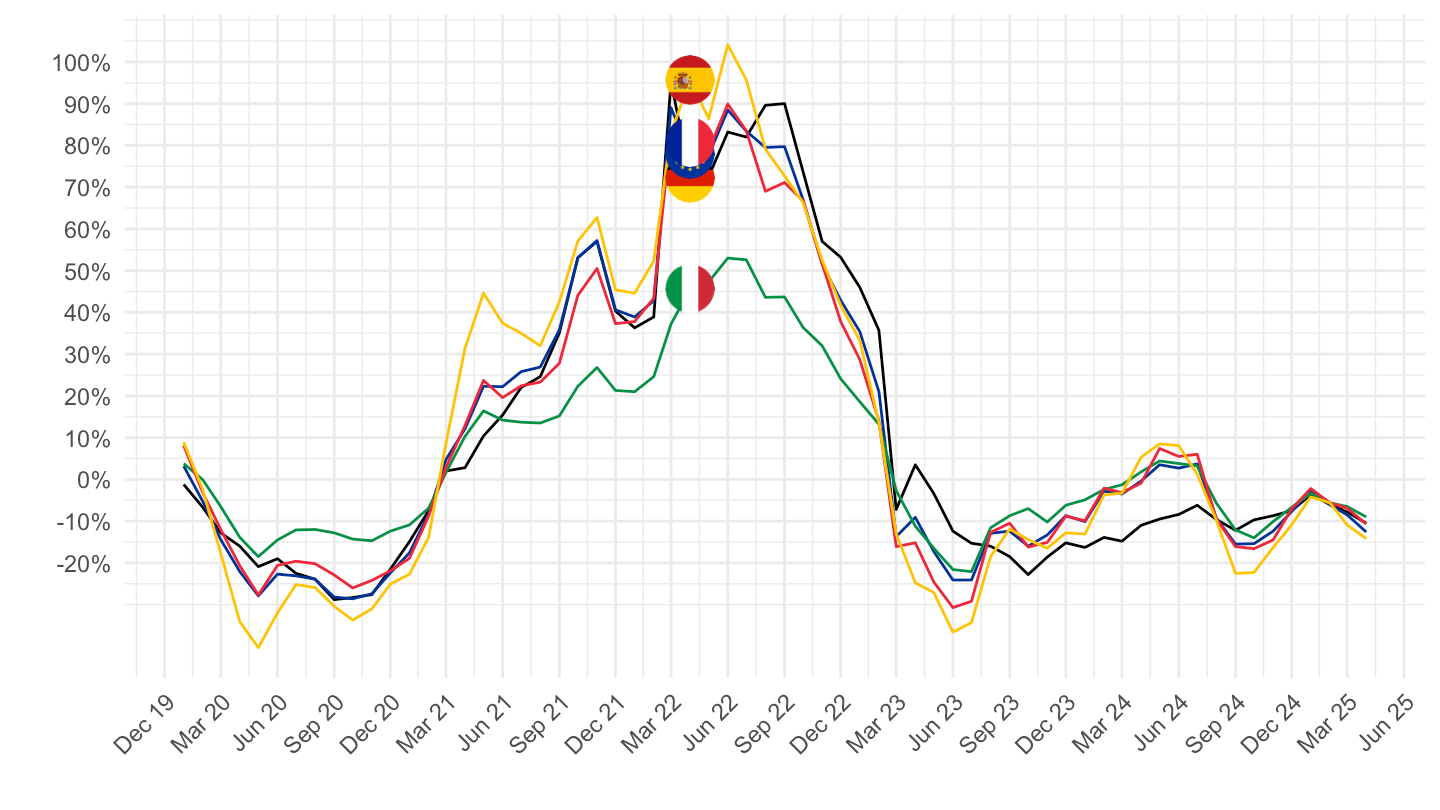
CP0454 - Solid fuels
All
Code
prc_hicp_manr %>%
  filter(coicop == "CP0454",
         geo %in% c("FR", "DE", "ES", "IT", "EA20")) %>%
  month_to_date %>%
  left_join(geo, by = "geo") %>%
  mutate(Geo = ifelse(geo == "EA20", "Europe", Geo)) %>%
  left_join(colors, by = c("Geo" = "country")) %>%
  mutate(values = values/100) %>%
  ggplot(.) + geom_line(aes(x = date, y = values, color = color)) +
  theme_minimal() + xlab("") + ylab("") +
  scale_x_date(breaks = seq(1960, 2100, 2) %>% paste0("-01-01") %>% as.Date,
               labels = date_format("%Y")) +
  scale_y_continuous(breaks = 0.01*seq(-100, 100, 5),
                     labels = percent_format(a = 1)) +
  scale_color_identity() + add_5flags +
  theme(legend.position = c(0.75, 0.90),
        legend.title = element_blank())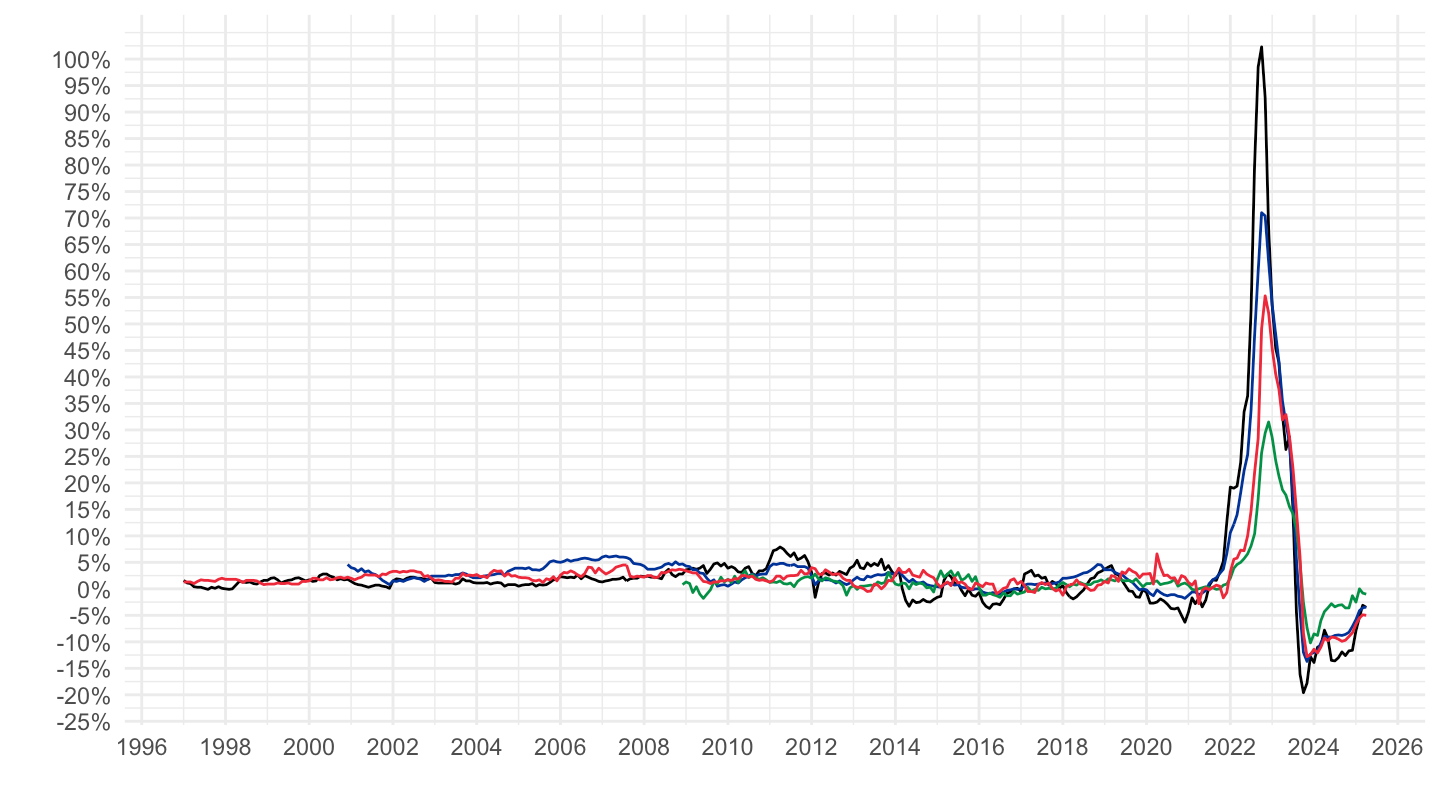
2016-
Code
prc_hicp_manr %>%
  filter(coicop == "CP0454",
         geo %in% c("FR", "DE", "ES", "IT", "EA20")) %>%
  month_to_date %>%
  filter(date >= as.Date("2016-01-01")) %>%
  left_join(geo, by = "geo") %>%
  mutate(Geo = ifelse(geo == "EA20", "Europe", Geo)) %>%
  left_join(colors, by = c("Geo" = "country")) %>%
  mutate(values = values/100) %>%
  ggplot(.) + geom_line(aes(x = date, y = values, color = color)) +
  theme_minimal() + xlab("") + ylab("") +
  scale_x_date(breaks = seq(1960, 2100, 1) %>% paste0("-01-01") %>% as.Date,
               labels = date_format("%Y")) +
  scale_y_continuous(breaks = 0.01*seq(-20, 100, 5),
                     labels = percent_format(a = 1)) +
  scale_color_identity() + add_5flags +
  theme(legend.position = c(0.75, 0.90),
        legend.title = element_blank())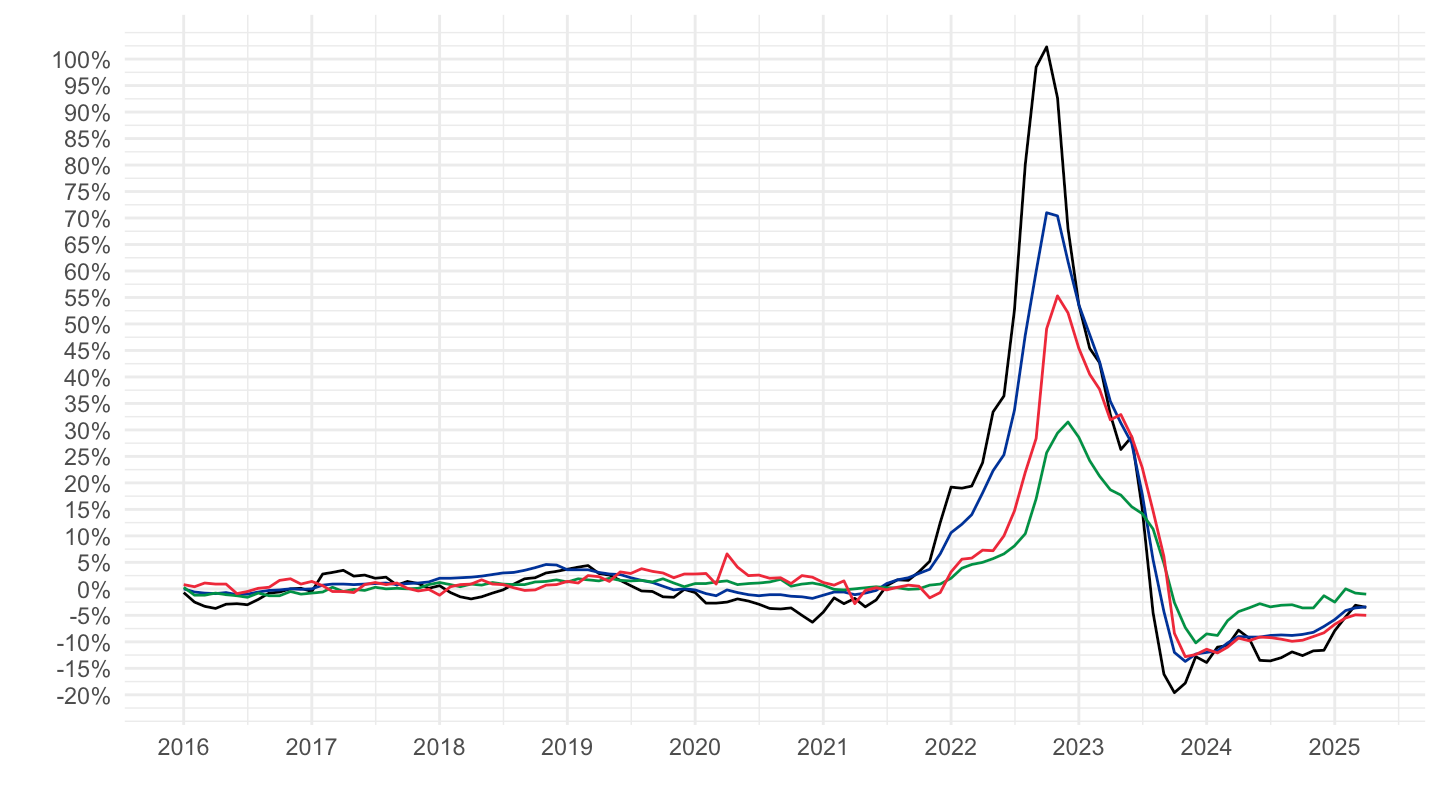
2020-
Code
prc_hicp_manr %>%
  filter(coicop == "CP0454",
         geo %in% c("FR", "DE", "ES", "IT", "EA20")) %>%
  month_to_date %>%
  filter(date >= as.Date("2020-01-01")) %>%
  left_join(geo, by = "geo") %>%
  mutate(Geo = ifelse(geo == "EA20", "Europe", Geo)) %>%
  left_join(colors, by = c("Geo" = "country")) %>%
  mutate(values = values/100) %>%
  ggplot(.) + geom_line(aes(x = date, y = values, color = color)) +
  theme_minimal() + xlab("") + ylab("") +
  scale_x_date(breaks = seq.Date(as.Date("2019-12-01"), as.Date("2100-01-01"), "3 months"),
               labels = date_format("%b %Y")) +
  scale_y_continuous(breaks = 0.01*seq(-20, 100, 5),
                     labels = percent_format(a = 1)) +
  scale_color_identity() + add_4flags +
  theme(legend.position = c(0.75, 0.90),
        legend.title = element_blank(),
        axis.text.x = element_text(angle = 45, vjust = 1, hjust = 1))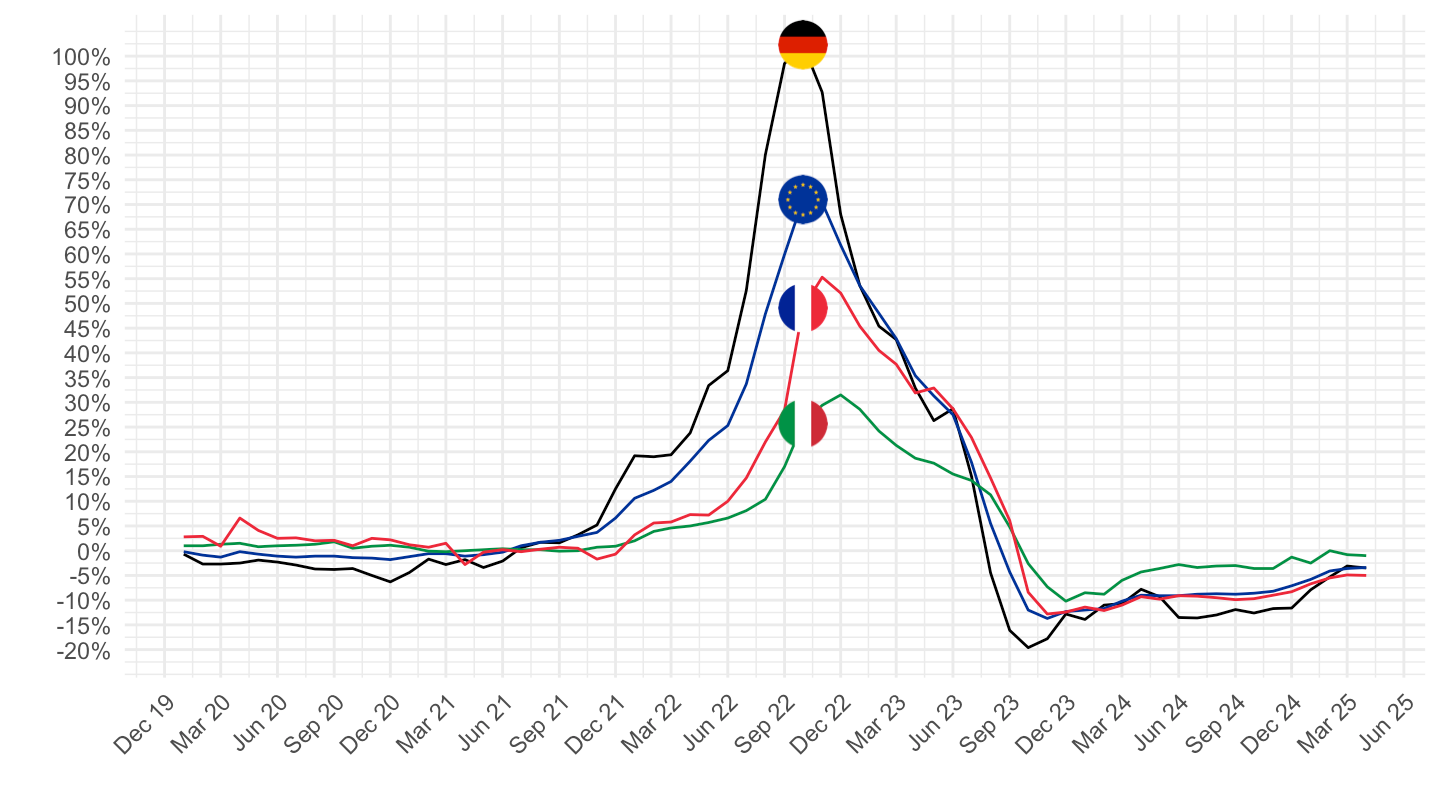
CP045 - Electricity, gas and other fuels
All
Code
prc_hicp_manr %>%
  filter(coicop == "CP045",
         geo %in% c("FR", "DE", "ES", "IT", "EA20")) %>%
  month_to_date %>%
  left_join(geo, by = "geo") %>%
  mutate(Geo = ifelse(geo == "EA20", "Europe", Geo)) %>%
  left_join(colors, by = c("Geo" = "country")) %>%
  mutate(values = values/100) %>%
  ggplot(.) + geom_line(aes(x = date, y = values, color = color)) +
  theme_minimal() + xlab("") + ylab("") +
  scale_x_date(breaks = seq(1960, 2100, 2) %>% paste0("-01-01") %>% as.Date,
               labels = date_format("%Y")) +
  scale_y_continuous(breaks = 0.01*seq(-100, 100, 5),
                     labels = percent_format(a = 1)) +
  scale_color_identity() + add_5flags +
  theme(legend.position = c(0.75, 0.90),
        legend.title = element_blank())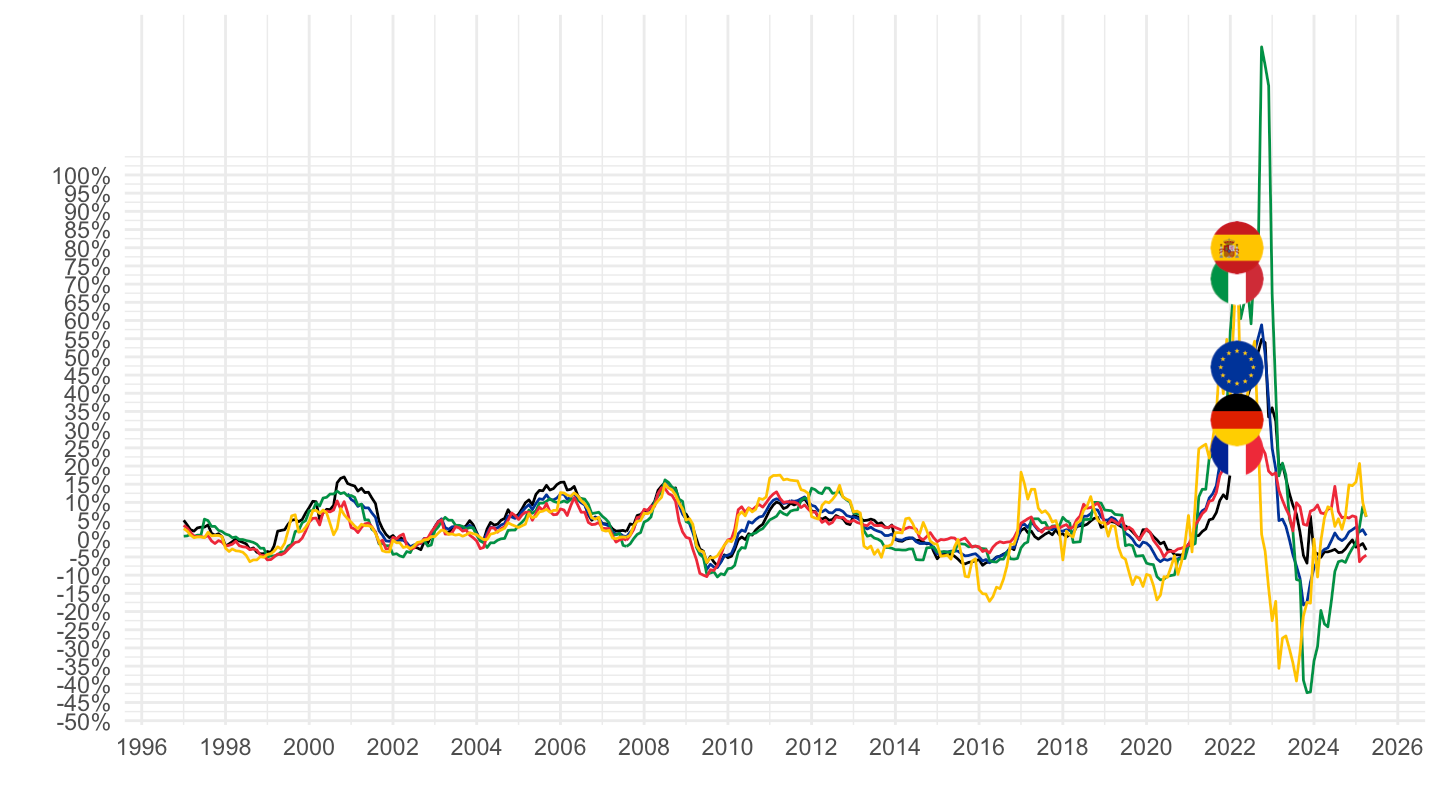
2016-
Code
prc_hicp_manr %>%
  filter(coicop == "CP045",
         geo %in% c("FR", "DE", "ES", "IT", "EA20")) %>%
  month_to_date %>%
  filter(date >= as.Date("2016-01-01")) %>%
  left_join(geo, by = "geo") %>%
  mutate(Geo = ifelse(geo == "EA20", "Europe", Geo)) %>%
  left_join(colors, by = c("Geo" = "country")) %>%
  mutate(values = values/100) %>%
  ggplot(.) + geom_line(aes(x = date, y = values, color = color)) +
  theme_minimal() + xlab("") + ylab("") +
  scale_x_date(breaks = seq(1960, 2100, 1) %>% paste0("-01-01") %>% as.Date,
               labels = date_format("%Y")) +
  scale_y_continuous(breaks = 0.01*seq(-20, 100, 5),
                     labels = percent_format(a = 1)) +
  scale_color_identity() + add_5flags +
  theme(legend.position = c(0.75, 0.90),
        legend.title = element_blank())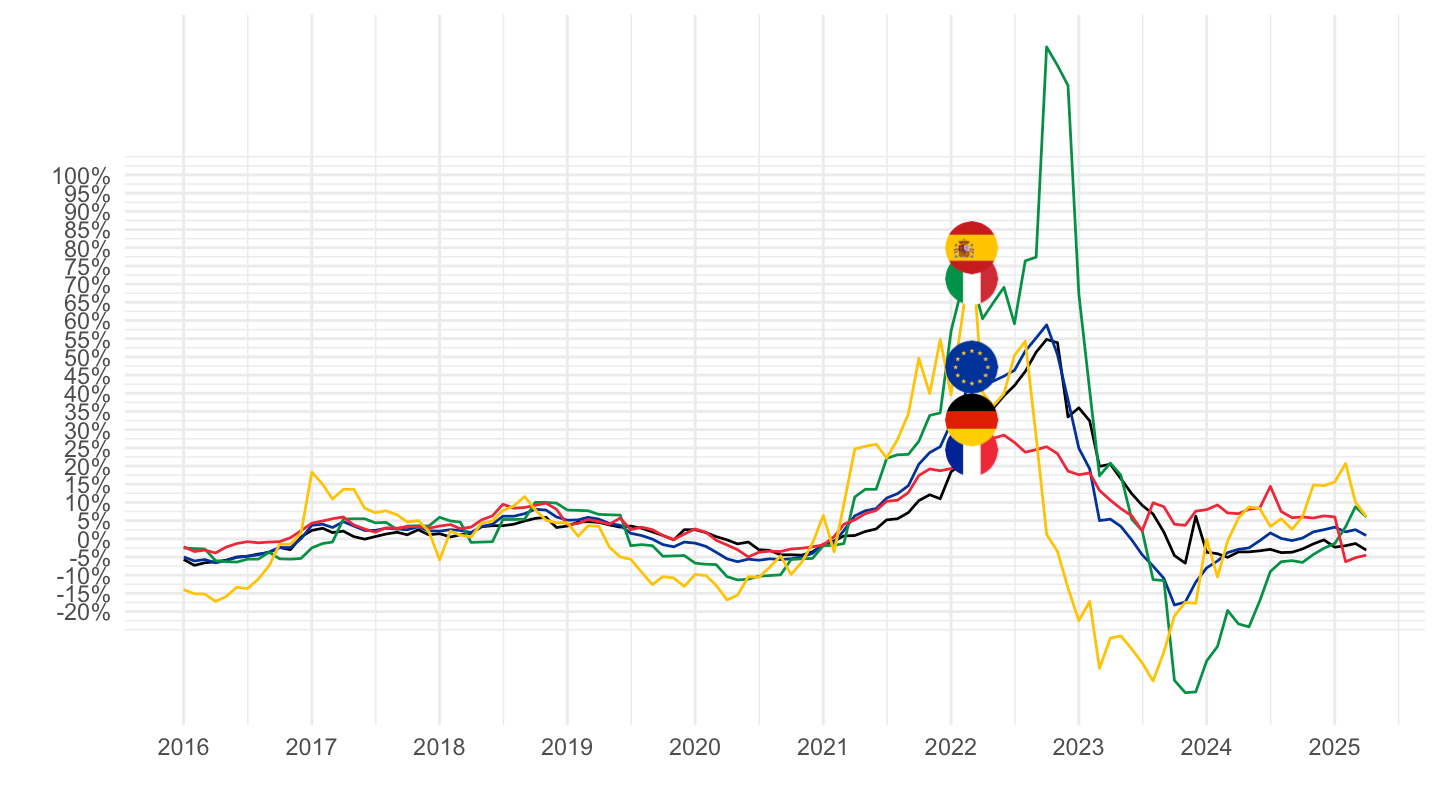
2020-
Code
prc_hicp_manr %>%
  filter(coicop == "CP045",
         geo %in% c("FR", "DE", "ES", "IT", "EA20")) %>%
  month_to_date %>%
  filter(date >= as.Date("2020-01-01")) %>%
  left_join(geo, by = "geo") %>%
  mutate(Geo = ifelse(geo == "EA20", "Europe", Geo)) %>%
  left_join(colors, by = c("Geo" = "country")) %>%
  mutate(values = values/100) %>%
  ggplot(.) + geom_line(aes(x = date, y = values, color = color)) +
  theme_minimal() + xlab("") + ylab("") +
  scale_x_date(breaks = seq.Date(as.Date("2019-12-01"), as.Date("2100-01-01"), "3 months"),
               labels = date_format("%b %Y")) +
  scale_y_continuous(breaks = 0.01*seq(-20, 100, 10),
                     labels = percent_format(a = 1)) +
  scale_color_identity() + add_5flags +
  theme(legend.position = c(0.75, 0.90),
        legend.title = element_blank(),
        axis.text.x = element_text(angle = 45, vjust = 1, hjust = 1))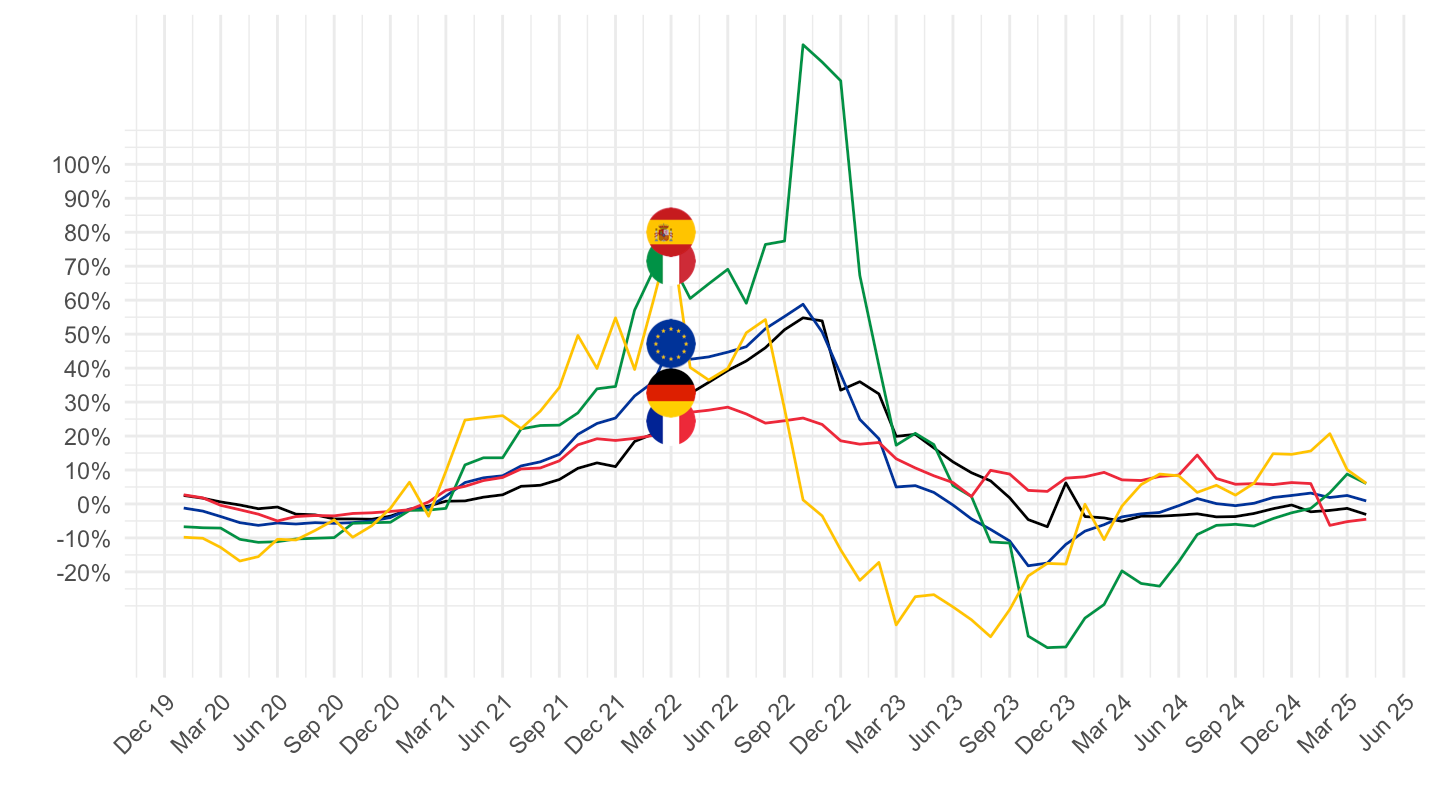
CP0455 - Heat energy
All
Code
prc_hicp_manr %>%
  filter(coicop == "CP0455",
         geo %in% c("FR", "DE", "ES", "IT", "EA20")) %>%
  month_to_date %>%
  left_join(geo, by = "geo") %>%
  mutate(Geo = ifelse(geo == "EA20", "Europe", Geo)) %>%
  left_join(colors, by = c("Geo" = "country")) %>%
  mutate(values = values/100) %>%
  ggplot(.) + geom_line(aes(x = date, y = values, color = color)) +
  theme_minimal() + xlab("") + ylab("") +
  scale_x_date(breaks = seq(1960, 2100, 2) %>% paste0("-01-01") %>% as.Date,
               labels = date_format("%Y")) +
  scale_y_continuous(breaks = 0.01*seq(-100, 100, 5),
                     labels = percent_format(a = 1)) +
  scale_color_identity() + add_5flags +
  theme(legend.position = c(0.75, 0.90),
        legend.title = element_blank())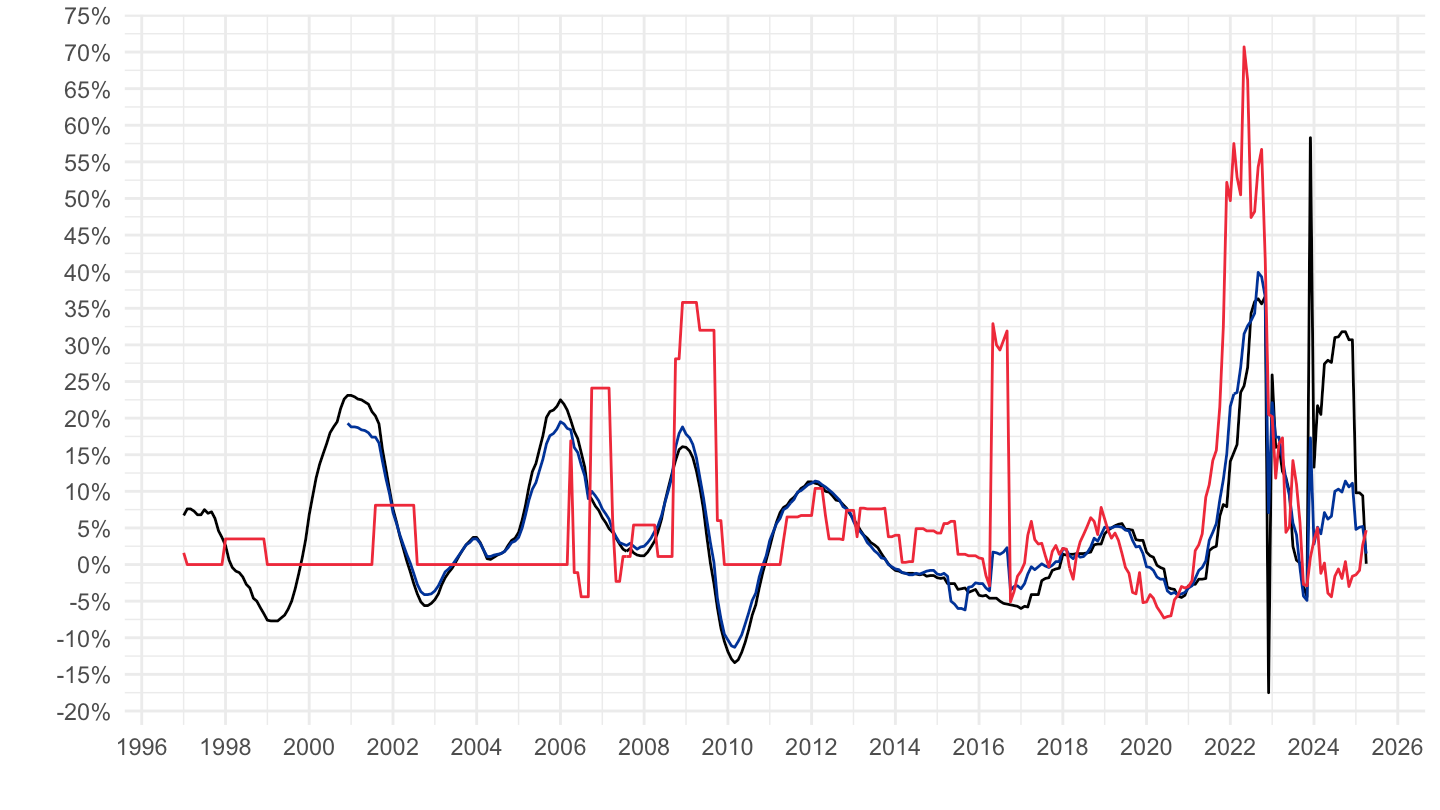
2016-
Code
prc_hicp_manr %>%
  filter(coicop == "CP0455",
         geo %in% c("FR", "DE", "ES", "IT", "EA20")) %>%
  month_to_date %>%
  filter(date >= as.Date("2016-01-01")) %>%
  left_join(geo, by = "geo") %>%
  mutate(Geo = ifelse(geo == "EA20", "Europe", Geo)) %>%
  left_join(colors, by = c("Geo" = "country")) %>%
  mutate(values = values/100) %>%
  ggplot(.) + geom_line(aes(x = date, y = values, color = color)) +
  theme_minimal() + xlab("") + ylab("") +
  scale_x_date(breaks = seq(1960, 2100, 1) %>% paste0("-01-01") %>% as.Date,
               labels = date_format("%Y")) +
  scale_y_continuous(breaks = 0.01*seq(-20, 100, 5),
                     labels = percent_format(a = 1)) +
  scale_color_identity() + add_5flags +
  theme(legend.position = c(0.75, 0.90),
        legend.title = element_blank())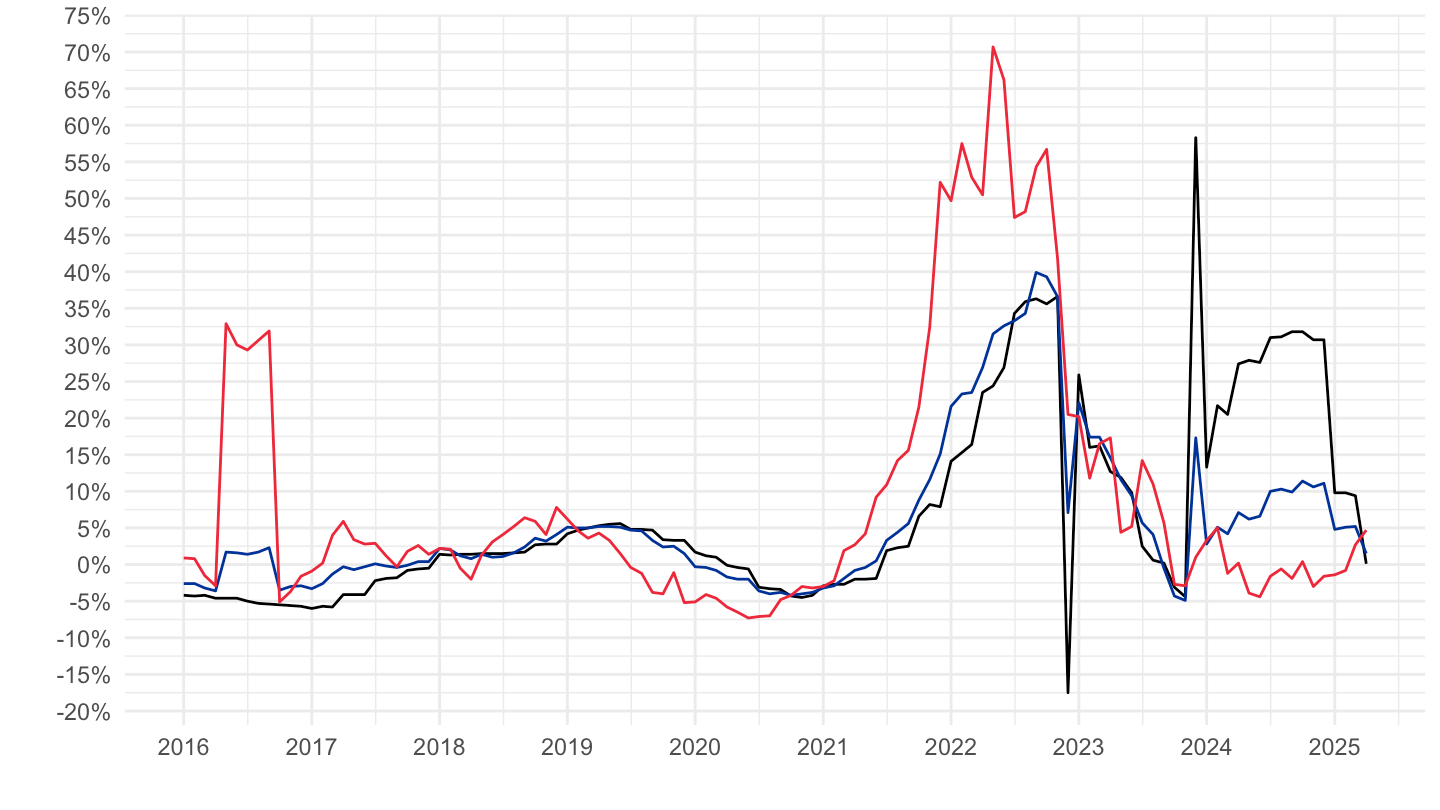
2020-
Code
prc_hicp_manr %>%
  filter(coicop == "CP0455",
         geo %in% c("FR", "DE", "ES", "IT", "EA20")) %>%
  month_to_date %>%
  filter(date >= as.Date("2020-01-01")) %>%
  left_join(geo, by = "geo") %>%
  mutate(Geo = ifelse(geo == "EA20", "Europe", Geo)) %>%
  left_join(colors, by = c("Geo" = "country")) %>%
  mutate(values = values/100) %>%
  ggplot(.) + geom_line(aes(x = date, y = values, color = color)) +
  theme_minimal() + xlab("") + ylab("") +
  scale_x_date(breaks = seq.Date(as.Date("2019-12-01"), as.Date("2100-01-01"), "3 months"),
               labels = date_format("%b %Y")) +
  scale_y_continuous(breaks = 0.01*seq(-20, 100, 10),
                     labels = percent_format(a = 1)) +
  scale_color_identity() + add_3flags +
  theme(legend.position = c(0.75, 0.90),
        legend.title = element_blank(),
        axis.text.x = element_text(angle = 45, vjust = 1, hjust = 1))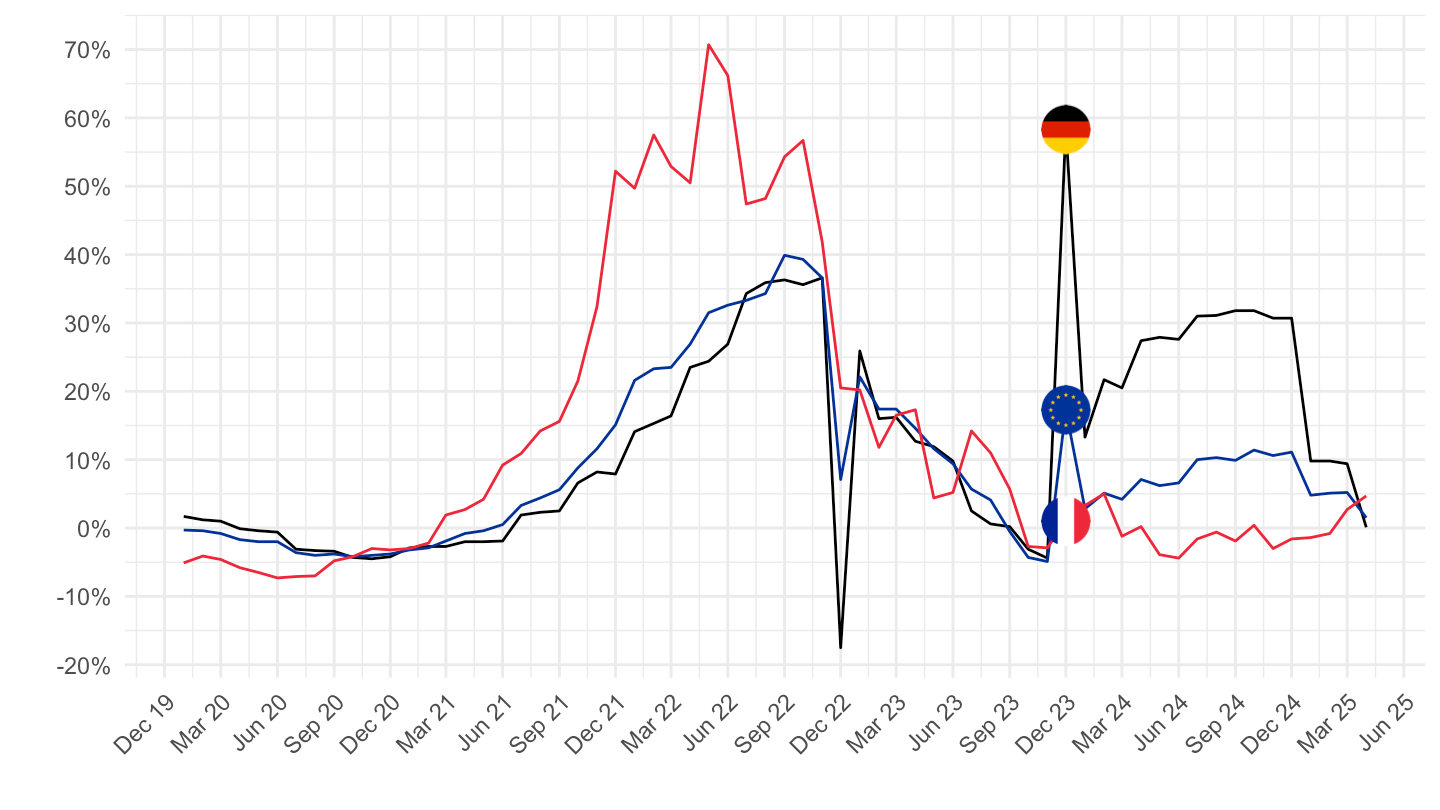
NRG
All
Code
prc_hicp_manr %>%
  filter(coicop == "NRG",
         geo %in% c("FR", "DE", "ES", "IT", "EA20")) %>%
  month_to_date %>%
  left_join(geo, by = "geo") %>%
  mutate(Geo = ifelse(geo == "EA20", "Europe", Geo)) %>%
  left_join(colors, by = c("Geo" = "country")) %>%
  mutate(values = values/100) %>%
  ggplot(.) + geom_line(aes(x = date, y = values, color = color)) +
  theme_minimal() + xlab("") + ylab("") +
  scale_x_date(breaks = seq(1960, 2100, 2) %>% paste0("-01-01") %>% as.Date,
               labels = date_format("%Y")) +
  scale_y_continuous(breaks = 0.01*seq(-100, 100, 5),
                     labels = percent_format(a = 1)) +
  scale_color_identity() + add_5flags +
  theme(legend.position = c(0.75, 0.90),
        legend.title = element_blank())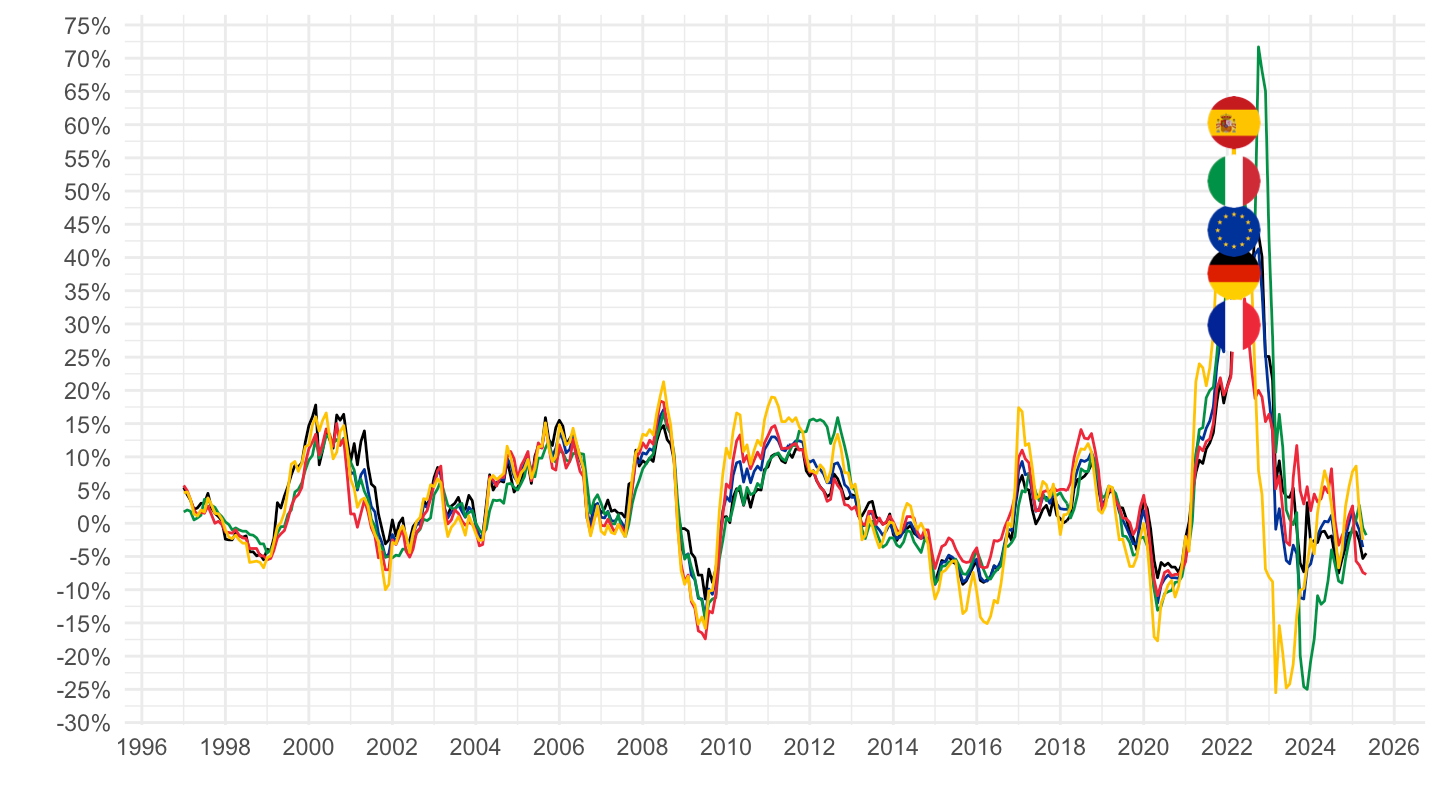
2016-
Code
prc_hicp_manr %>%
  filter(coicop == "NRG",
         geo %in% c("FR", "DE", "ES", "IT", "EA20")) %>%
  month_to_date %>%
  filter(date >= as.Date("2016-01-01")) %>%
  left_join(geo, by = "geo") %>%
  mutate(Geo = ifelse(geo == "EA20", "Europe", Geo)) %>%
  left_join(colors, by = c("Geo" = "country")) %>%
  mutate(values = values/100) %>%
  ggplot(.) + geom_line(aes(x = date, y = values, color = color)) +
  theme_minimal() + xlab("") + ylab("") +
  scale_x_date(breaks = seq(1960, 2100, 1) %>% paste0("-01-01") %>% as.Date,
               labels = date_format("%Y")) +
  scale_y_continuous(breaks = 0.01*seq(-20, 100, 5),
                     labels = percent_format(a = 1)) +
  scale_color_identity() + add_5flags +
  theme(legend.position = c(0.75, 0.90),
        legend.title = element_blank())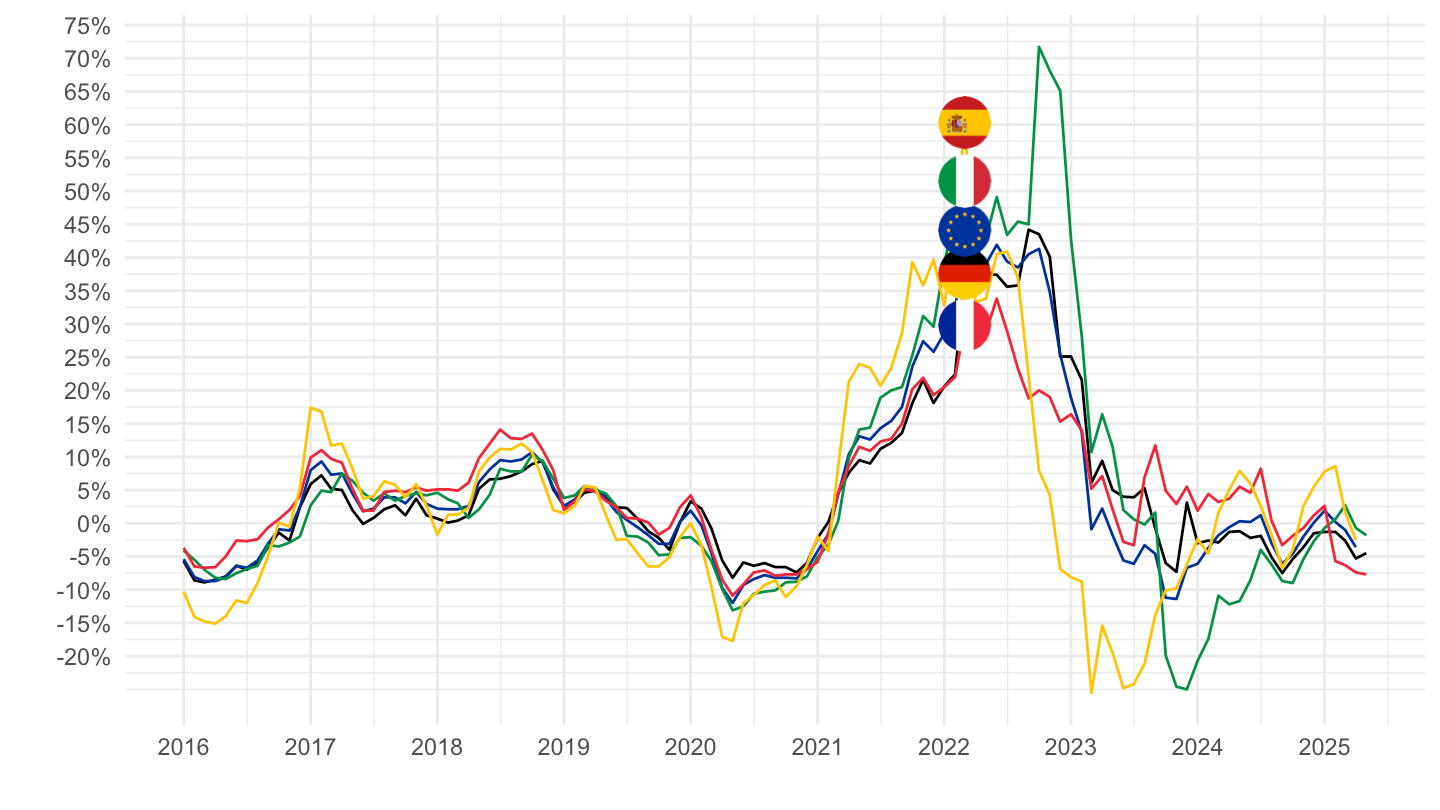
2020-
Code
prc_hicp_manr %>%
  filter(coicop == "NRG",
         geo %in% c("FR", "DE", "ES", "IT", "EA20")) %>%
  month_to_date %>%
  filter(date >= as.Date("2020-01-01")) %>%
  left_join(geo, by = "geo") %>%
  mutate(Geo = ifelse(geo == "EA20", "Europe", Geo)) %>%
  left_join(colors, by = c("Geo" = "country")) %>%
  mutate(values = values/100) %>%
  ggplot(.) + geom_line(aes(x = date, y = values, color = color)) +
  theme_minimal() + xlab("") + ylab("") +
  scale_x_date(breaks = seq.Date(as.Date("2019-12-01"), as.Date("2100-01-01"), "3 months"),
               labels = date_format("%b %Y")) +
  scale_y_continuous(breaks = 0.01*seq(-20, 100, 10),
                     labels = percent_format(a = 1)) +
  scale_color_identity() + add_5flags +
  theme(legend.position = c(0.75, 0.90),
        legend.title = element_blank(),
        axis.text.x = element_text(angle = 45, vjust = 1, hjust = 1))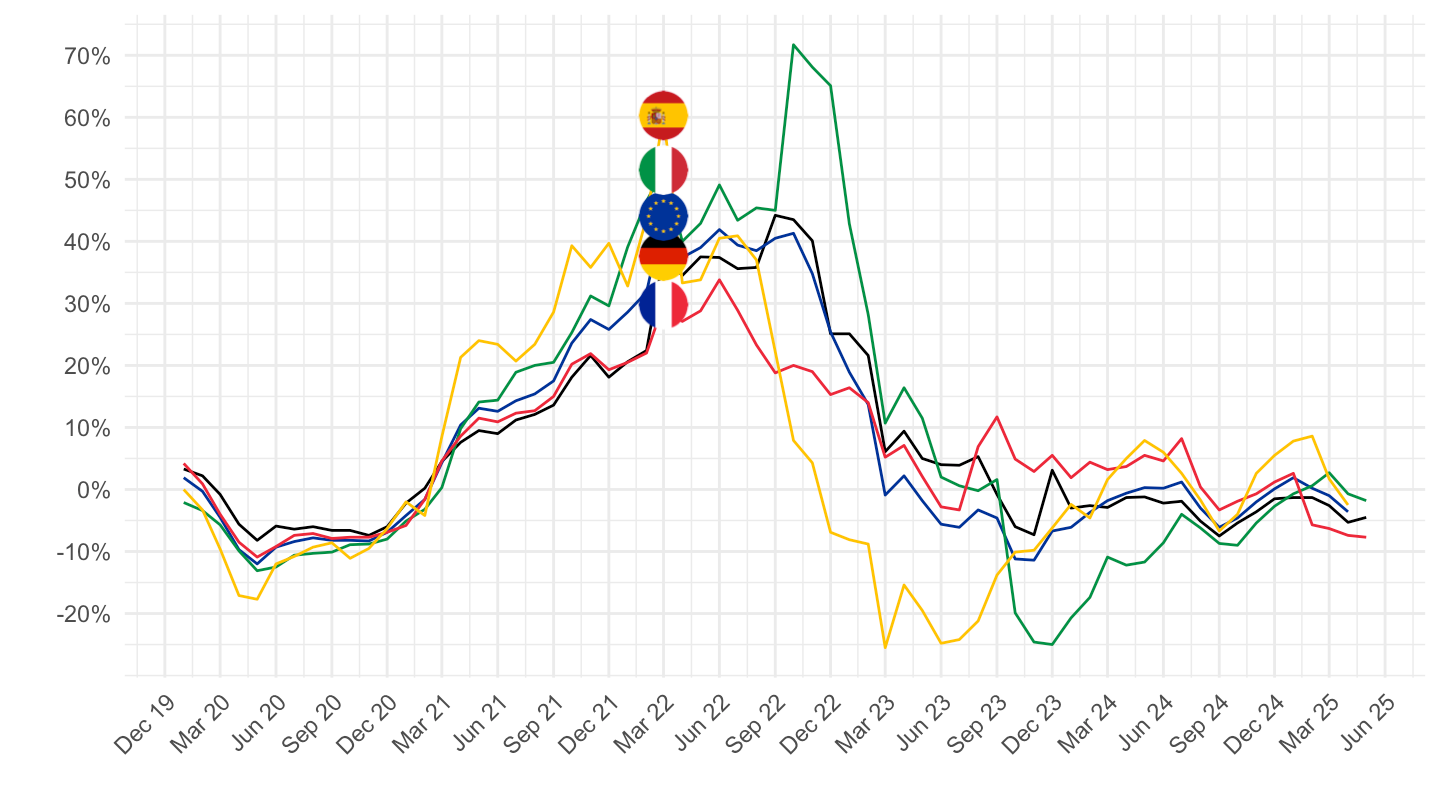
SERV_TRA
All
Code
prc_hicp_manr %>%
  filter(coicop == "SERV_TRA",
         geo %in% c("FR", "DE", "ES", "IT", "EA20")) %>%
  month_to_date %>%
  left_join(geo, by = "geo") %>%
  mutate(Geo = ifelse(geo == "EA20", "Europe", Geo)) %>%
  left_join(colors, by = c("Geo" = "country")) %>%
  mutate(values = values/100) %>%
  ggplot(.) + geom_line(aes(x = date, y = values, color = color)) +
  theme_minimal() + xlab("") + ylab("") +
  scale_x_date(breaks = seq(1960, 2100, 2) %>% paste0("-01-01") %>% as.Date,
               labels = date_format("%Y")) +
  scale_y_continuous(breaks = 0.01*seq(-100, 100, 5),
                     labels = percent_format(a = 1)) +
  scale_color_identity() + add_5flags +
  theme(legend.position = c(0.75, 0.90),
        legend.title = element_blank())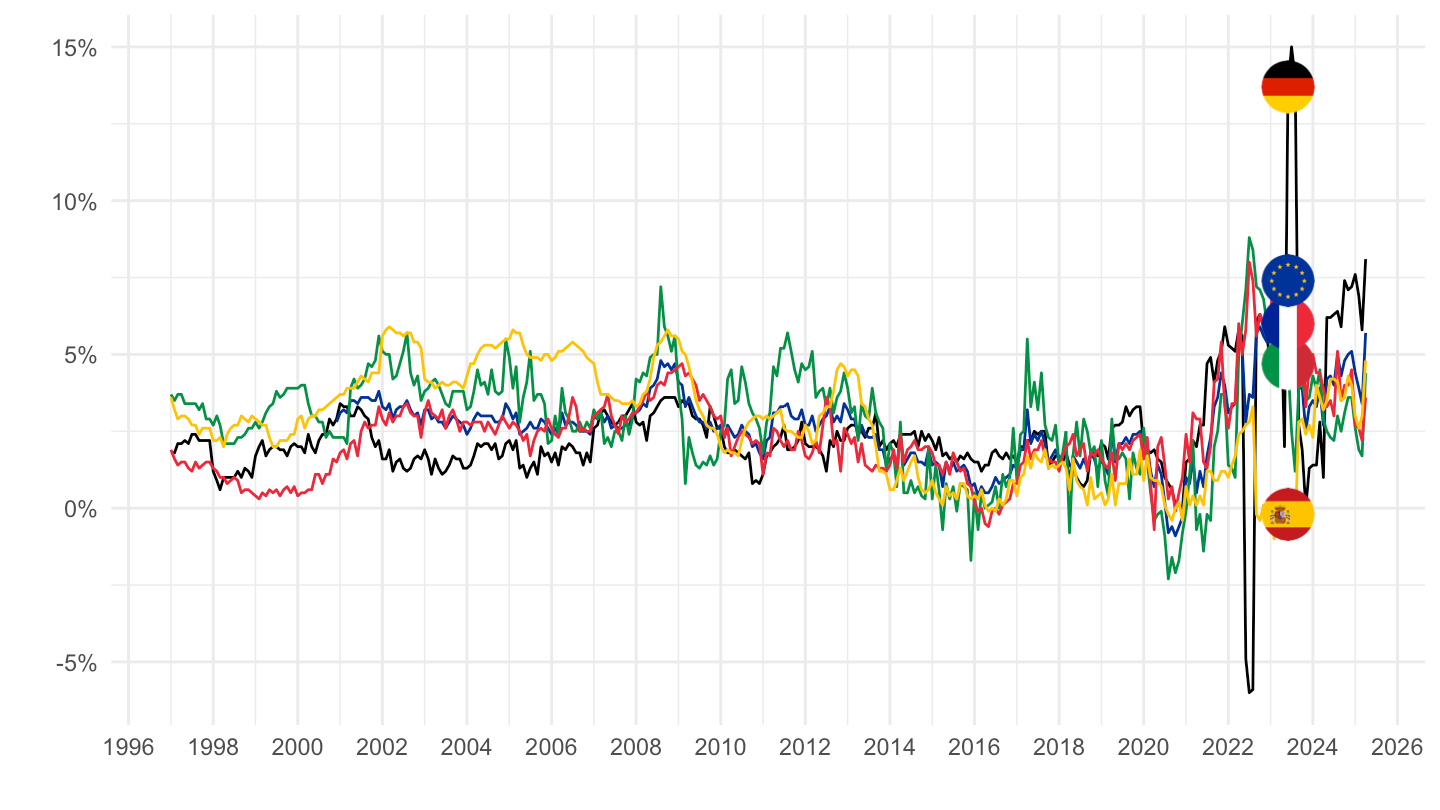
2016-
Code
prc_hicp_manr %>%
  filter(coicop == "SERV_TRA",
         geo %in% c("FR", "DE", "ES", "IT", "EA20")) %>%
  month_to_date %>%
  filter(date >= as.Date("2016-01-01")) %>%
  left_join(geo, by = "geo") %>%
  mutate(Geo = ifelse(geo == "EA20", "Europe", Geo)) %>%
  left_join(colors, by = c("Geo" = "country")) %>%
  mutate(values = values/100) %>%
  ggplot(.) + geom_line(aes(x = date, y = values, color = color)) +
  theme_minimal() + xlab("") + ylab("") +
  scale_x_date(breaks = seq(1960, 2100, 1) %>% paste0("-01-01") %>% as.Date,
               labels = date_format("%Y")) +
  scale_y_continuous(breaks = 0.01*seq(-20, 100, 5),
                     labels = percent_format(a = 1)) +
  scale_color_identity() + add_5flags +
  theme(legend.position = c(0.75, 0.90),
        legend.title = element_blank())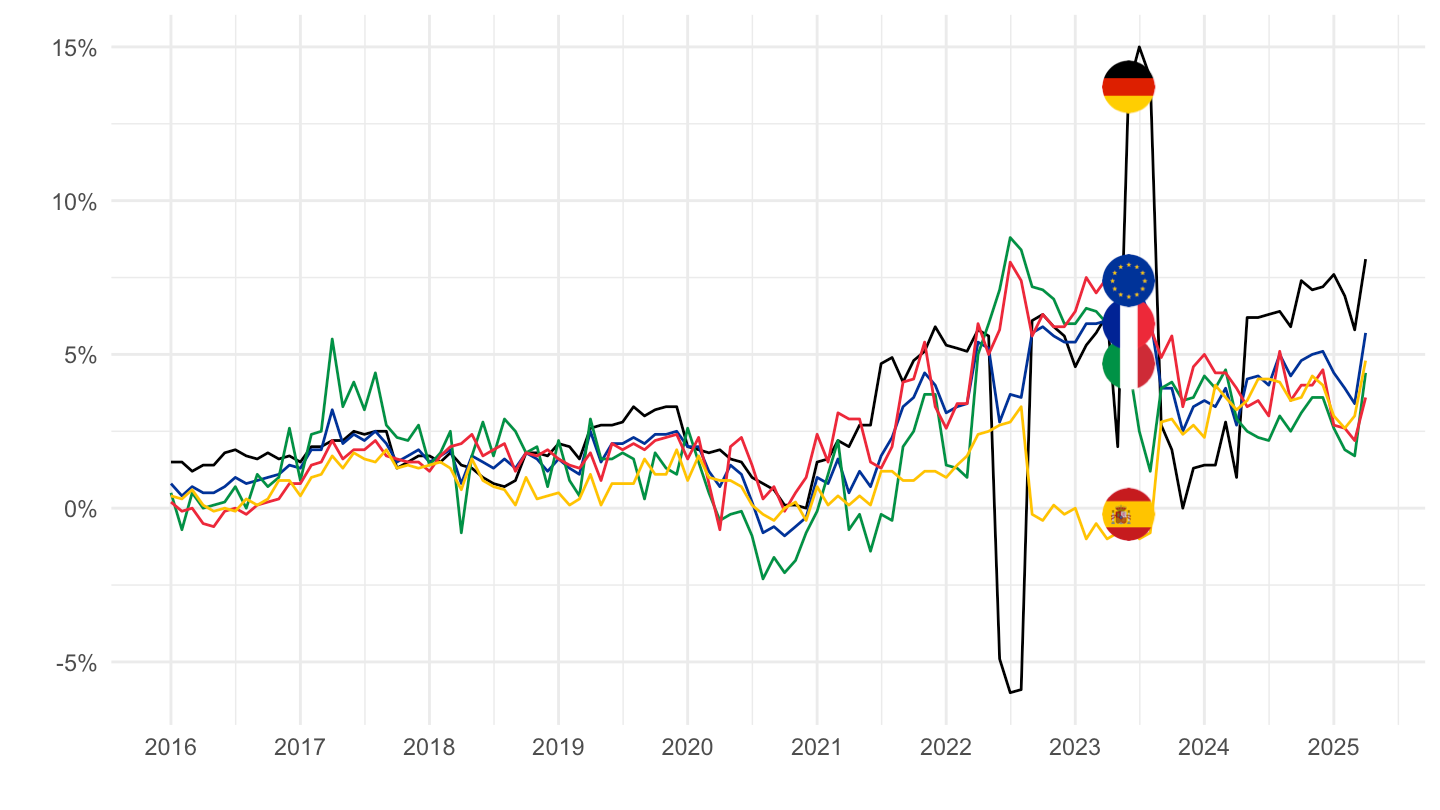
2020-
Code
prc_hicp_manr %>%
  filter(coicop == "SERV_TRA",
         geo %in% c("FR", "DE", "ES", "IT", "EA20")) %>%
  month_to_date %>%
  filter(date >= as.Date("2020-01-01")) %>%
  left_join(geo, by = "geo") %>%
  mutate(Geo = ifelse(geo == "EA20", "Europe", Geo)) %>%
  left_join(colors, by = c("Geo" = "country")) %>%
  mutate(values = values/100) %>%
  ggplot(.) + geom_line(aes(x = date, y = values, color = color)) +
  theme_minimal() + xlab("") + ylab("") +
  scale_x_date(breaks = seq.Date(as.Date("2019-12-01"), as.Date("2100-01-01"), "3 months"),
               labels = date_format("%b %Y")) +
  scale_y_continuous(breaks = 0.01*seq(-20, 100, 1),
                     labels = percent_format(a = 1)) +
  scale_color_identity() + add_5flags +
  theme(legend.position = c(0.75, 0.90),
        legend.title = element_blank(),
        axis.text.x = element_text(angle = 45, vjust = 1, hjust = 1))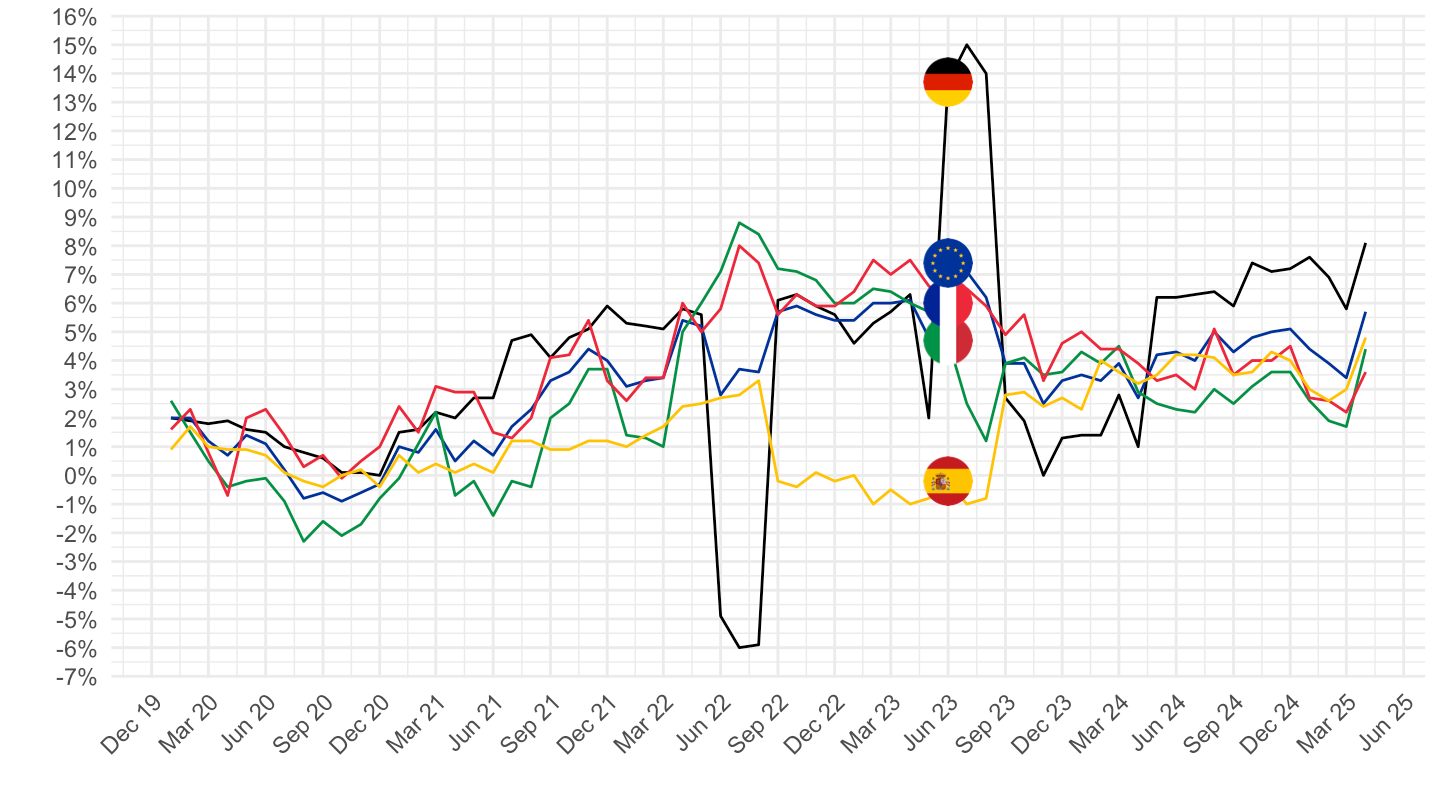
FUEL
All
Code
prc_hicp_manr %>%
  filter(coicop == "FUEL",
         geo %in% c("FR", "DE", "ES", "IT", "EA20")) %>%
  month_to_date %>%
  left_join(geo, by = "geo") %>%
  mutate(Geo = ifelse(geo == "EA20", "Europe", Geo)) %>%
  left_join(colors, by = c("Geo" = "country")) %>%
  mutate(values = values/100) %>%
  ggplot(.) + geom_line(aes(x = date, y = values, color = color)) +
  theme_minimal() + xlab("") + ylab("") +
  scale_x_date(breaks = seq(1960, 2100, 2) %>% paste0("-01-01") %>% as.Date,
               labels = date_format("%Y")) +
  scale_y_continuous(breaks = 0.01*seq(-100, 100, 5),
                     labels = percent_format(a = 1)) +
  scale_color_identity() + add_5flags +
  theme(legend.position = c(0.75, 0.90),
        legend.title = element_blank())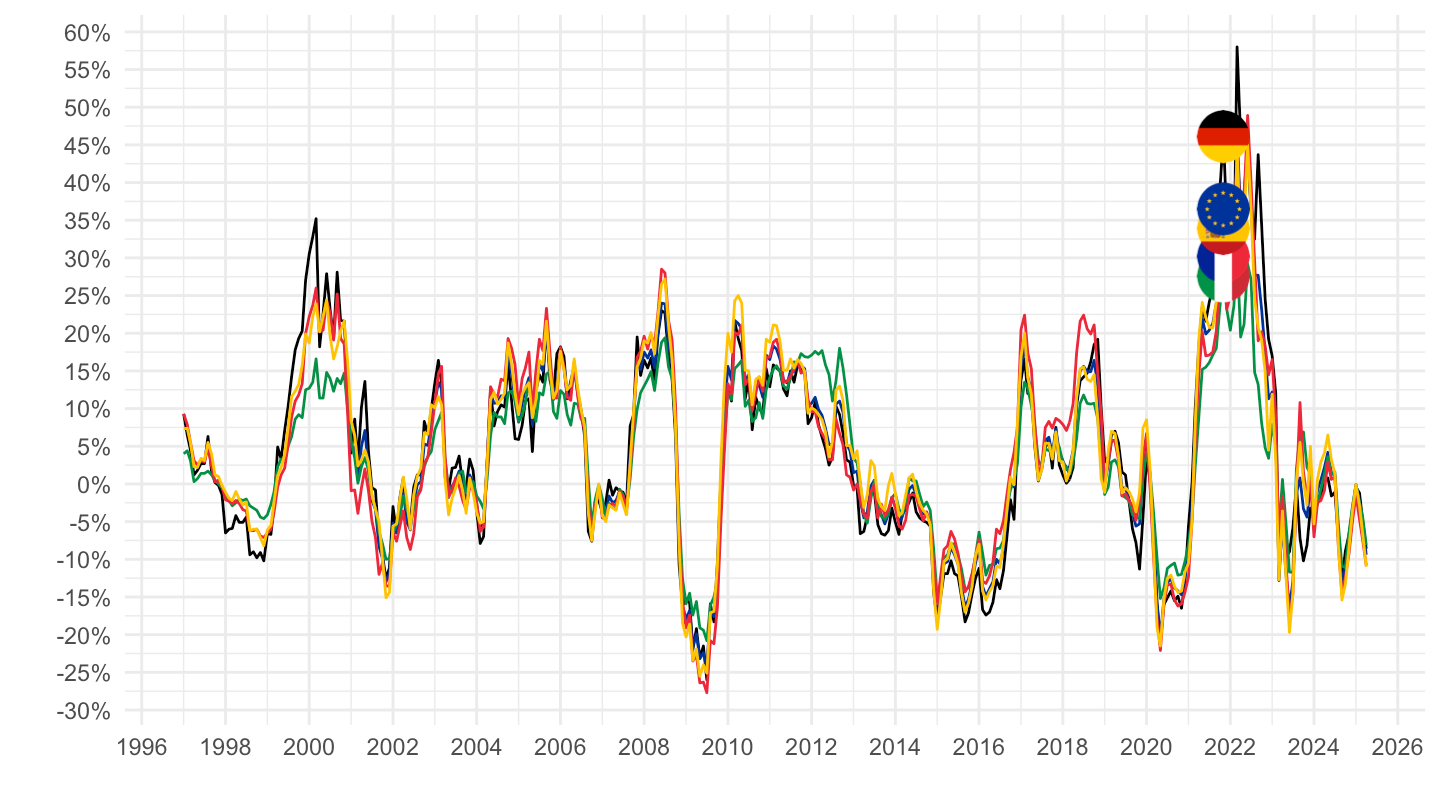
2016-
Code
prc_hicp_manr %>%
  filter(coicop == "FUEL",
         geo %in% c("FR", "DE", "ES", "IT", "EA20")) %>%
  month_to_date %>%
  filter(date >= as.Date("2016-01-01")) %>%
  left_join(geo, by = "geo") %>%
  mutate(Geo = ifelse(geo == "EA20", "Europe", Geo)) %>%
  left_join(colors, by = c("Geo" = "country")) %>%
  mutate(values = values/100) %>%
  ggplot(.) + geom_line(aes(x = date, y = values, color = color)) +
  theme_minimal() + xlab("") + ylab("") +
  scale_x_date(breaks = seq(1960, 2100, 1) %>% paste0("-01-01") %>% as.Date,
               labels = date_format("%Y")) +
  scale_y_continuous(breaks = 0.01*seq(-20, 100, 5),
                     labels = percent_format(a = 1)) +
  scale_color_identity() + add_5flags +
  theme(legend.position = c(0.75, 0.90),
        legend.title = element_blank())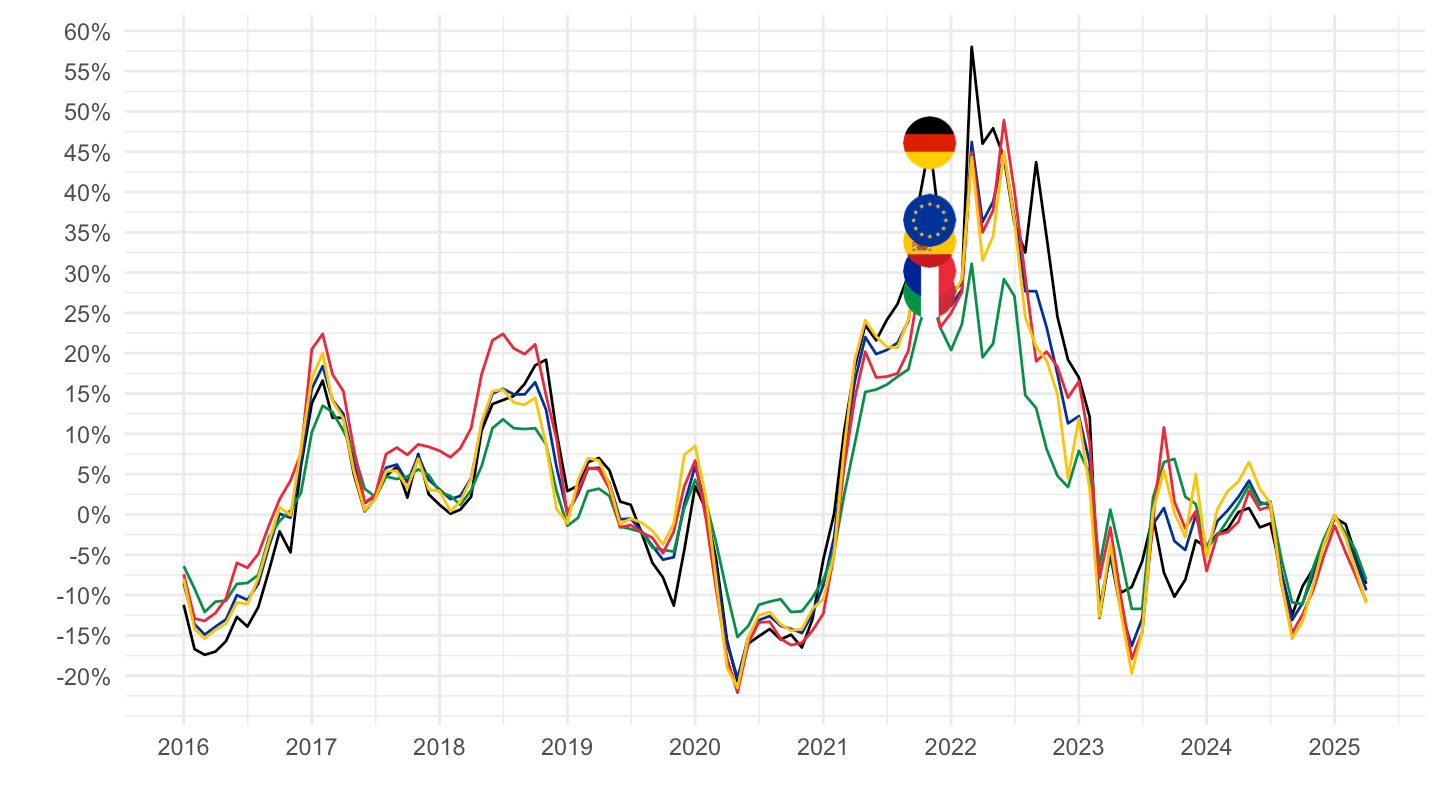
2020-
Code
prc_hicp_manr %>%
  filter(coicop == "FUEL",
         geo %in% c("FR", "DE", "ES", "IT", "EA20")) %>%
  month_to_date %>%
  filter(date >= as.Date("2020-01-01")) %>%
  left_join(geo, by = "geo") %>%
  mutate(Geo = ifelse(geo == "EA20", "Europe", Geo)) %>%
  left_join(colors, by = c("Geo" = "country")) %>%
  mutate(values = values/100) %>%
  ggplot(.) + geom_line(aes(x = date, y = values, color = color)) +
  theme_minimal() + xlab("") + ylab("") +
  scale_x_date(breaks = seq.Date(as.Date("2019-12-01"), as.Date("2100-01-01"), "3 months"),
               labels = date_format("%b %Y")) +
  scale_y_continuous(breaks = 0.01*seq(-20, 100, 10),
                     labels = percent_format(a = 1)) +
  scale_color_identity() + add_5flags +
  theme(legend.position = c(0.75, 0.90),
        legend.title = element_blank(),
        axis.text.x = element_text(angle = 45, vjust = 1, hjust = 1))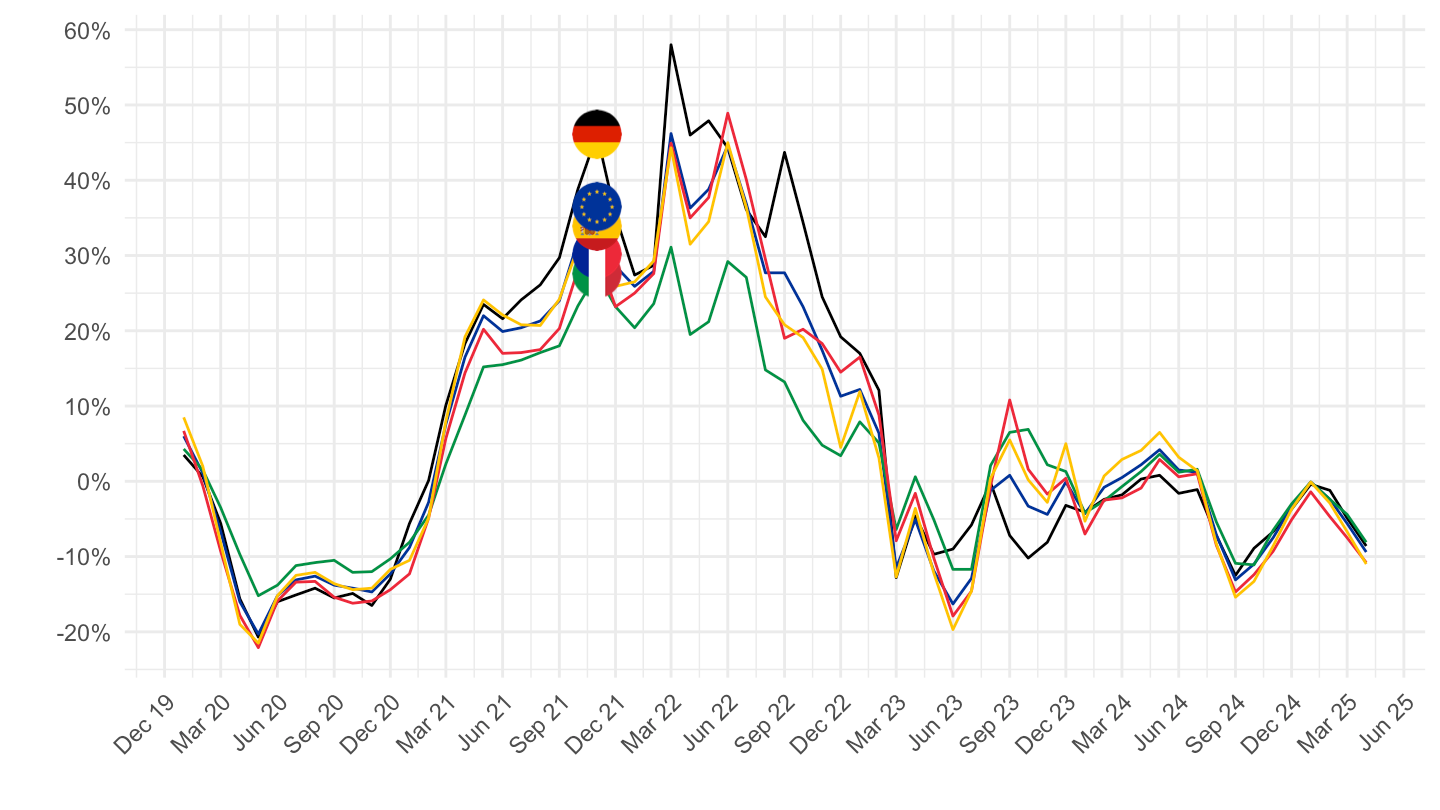
France, Germany, Italy, United Kingdom
CP00
All
Code
prc_hicp_manr %>%
  filter(coicop == "CP00",
         geo %in% c("FR", "DE", "UK", "IT")) %>%
  month_to_date %>%
  left_join(geo, by = "geo") %>%
  left_join(colors, by = c("Geo" = "country")) %>%
  mutate(values = values/100) %>%
  ggplot(.) + geom_line(aes(x = date, y = values, color = color)) +
  theme_minimal() + xlab("") + ylab("") +
  scale_x_date(breaks = seq(1960, 2100, 2) %>% paste0("-01-01") %>% as.Date,
               labels = date_format("%Y")) +
  scale_y_continuous(breaks = 0.01*seq(-20, 20, 1),
                     labels = percent_format(a = 1)) +
  scale_color_identity() + add_flags +
  theme(legend.position = c(0.75, 0.90),
        legend.title = element_blank())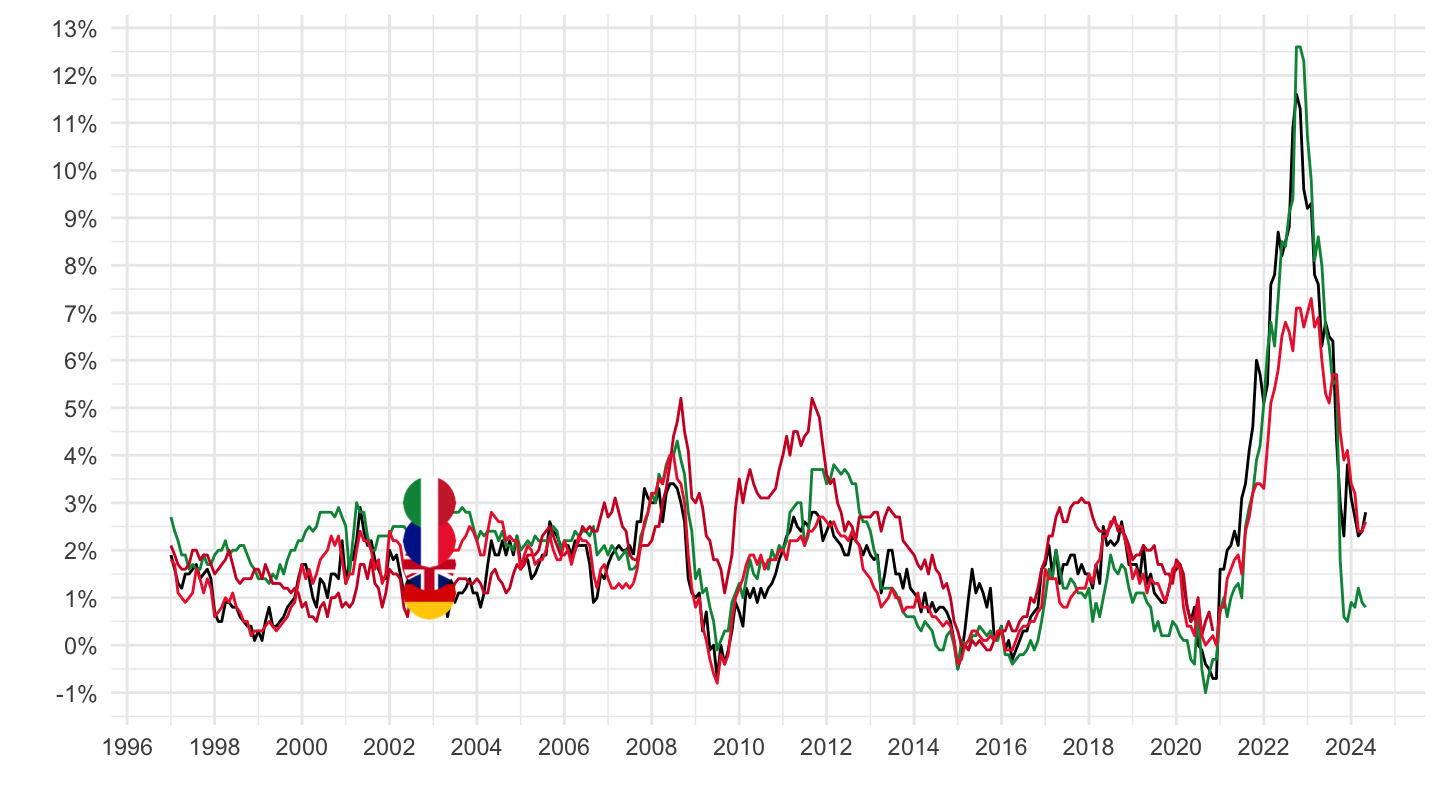
2016-
Code
prc_hicp_manr %>%
  filter(coicop == "CP00",
         geo %in% c("FR", "DE", "UK", "IT")) %>%
  month_to_date %>%
  filter(date >= as.Date("2016-01-01")) %>%
  left_join(geo, by = "geo") %>%
  left_join(colors, by = c("Geo" = "country")) %>%
  mutate(values = values/100) %>%
  ggplot(.) + geom_line(aes(x = date, y = values, color = color)) +
  theme_minimal() + xlab("") + ylab("") +
  scale_x_date(breaks = seq(1960, 2100, 1) %>% paste0("-01-01") %>% as.Date,
               labels = date_format("%Y")) +
  scale_y_continuous(breaks = 0.01*seq(-20, 20, 1),
                     labels = percent_format(a = 1)) +
  scale_color_identity() + add_4flags +
  theme(legend.position = c(0.75, 0.90),
        legend.title = element_blank())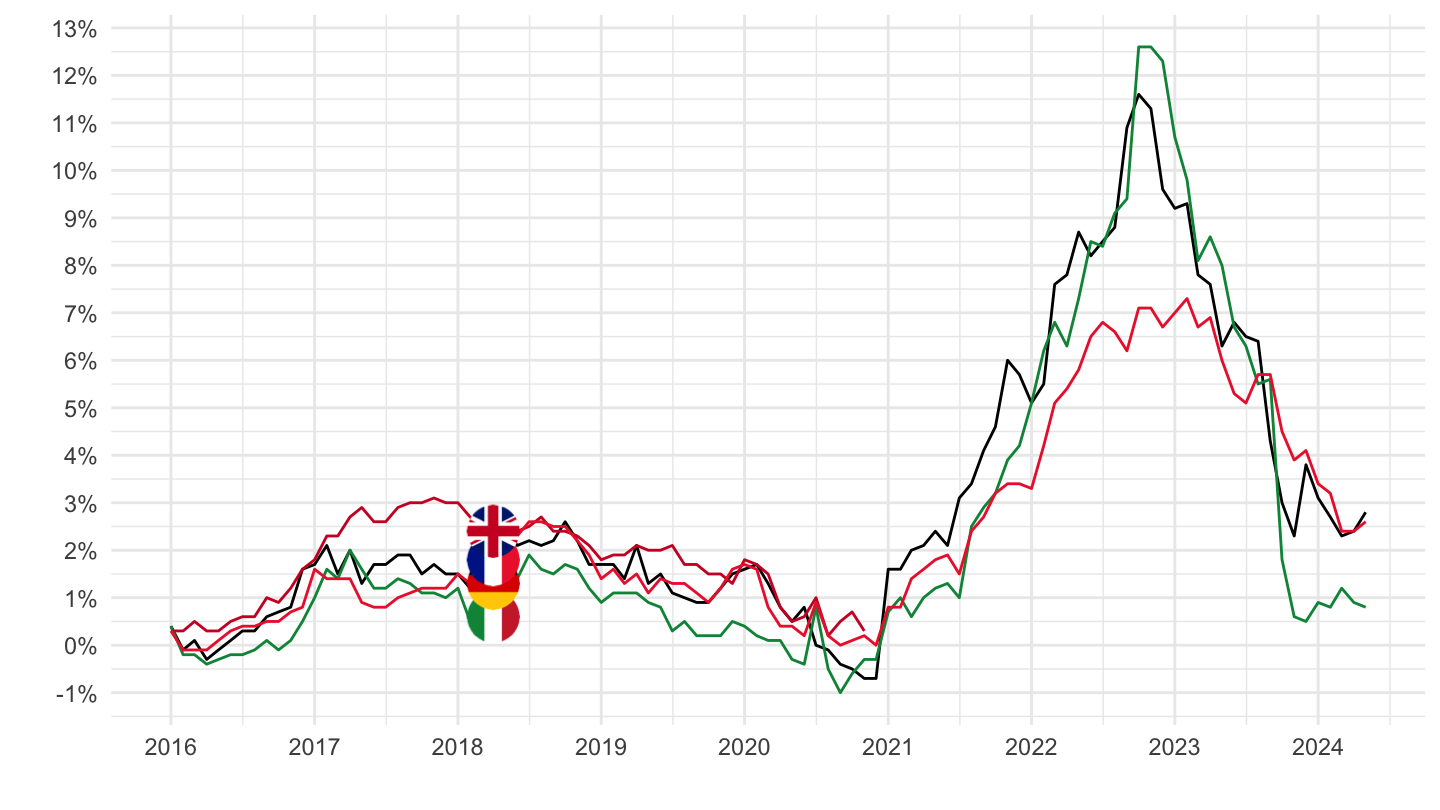
2020-
Code
prc_hicp_manr %>%
  filter(coicop == "CP00",
         geo %in% c("FR", "DE", "UK", "IT")) %>%
  month_to_date %>%
  filter(date >= as.Date("2020-01-01")) %>%
  left_join(geo, by = "geo") %>%
  left_join(colors, by = c("Geo" = "country")) %>%
  mutate(values = values/100) %>%
  ggplot(.) + geom_line(aes(x = date, y = values, color = color)) +
  theme_minimal() + xlab("") + ylab("") +
  scale_x_date(breaks = "3 months",
               labels = date_format("%b %Y")) +
  scale_y_continuous(breaks = 0.01*seq(-20, 20, 1),
                     labels = percent_format(a = 1)) +
  scale_color_identity() + add_4flags +
  theme(legend.position = c(0.75, 0.90),
        legend.title = element_blank(),
        axis.text.x = element_text(angle = 45, vjust = 1, hjust = 1))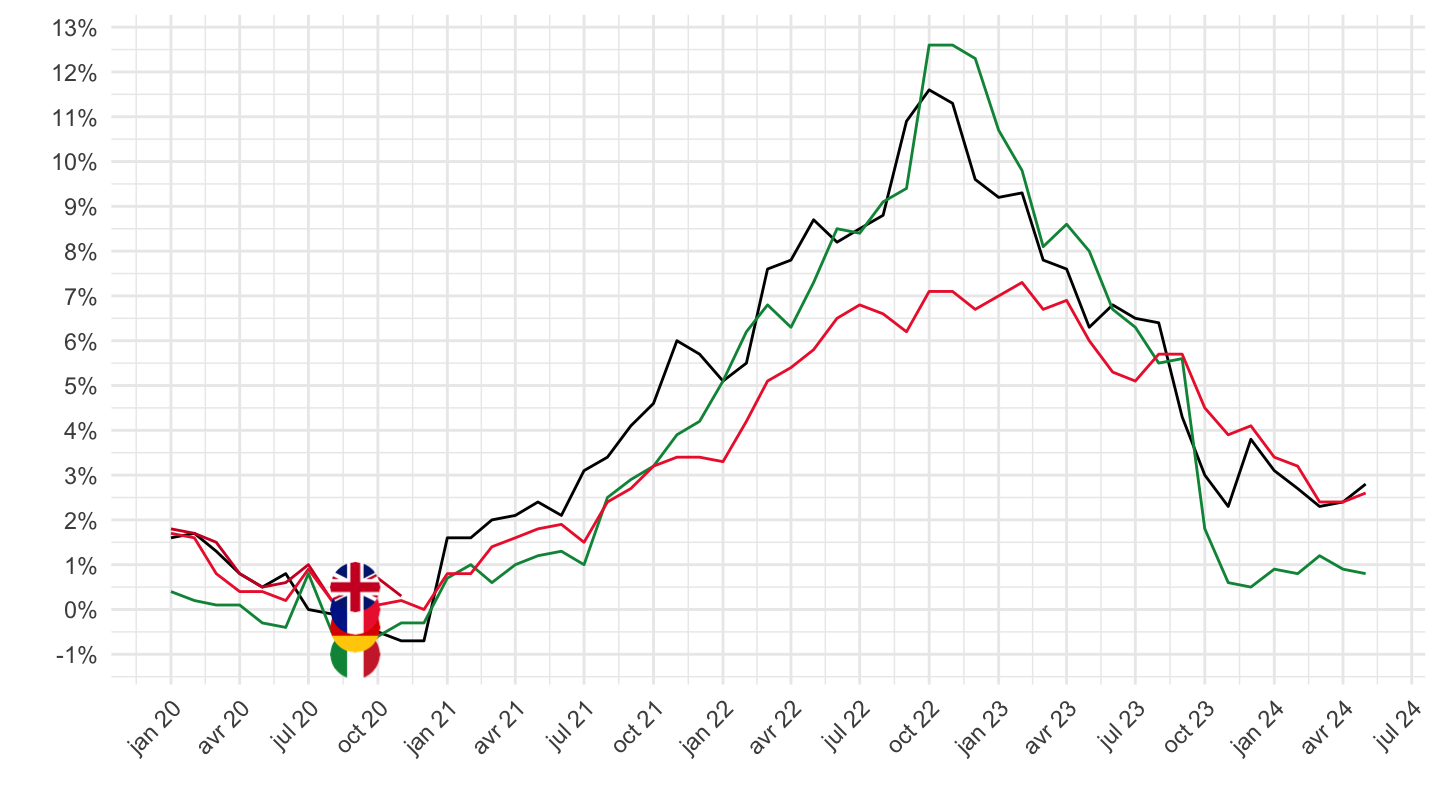
France, Germany, Italy, Spain
TOT_X_NRG_FOOD - Core Inflation
All
Code
prc_hicp_manr %>%
  filter(coicop == "TOT_X_NRG_FOOD",
         geo %in% c("FR", "DE", "ES", "IT", "EA20")) %>%
  month_to_date %>%
  left_join(geo, by = "geo") %>%
  mutate(Geo = ifelse(geo == "EA20", "Europe", Geo)) %>%
  left_join(colors, by = c("Geo" = "country")) %>%
  mutate(values = values/100) %>%
  ggplot(.) + geom_line(aes(x = date, y = values, color = color)) +
  theme_minimal() + xlab("") + ylab("Core Inflation (%)") +
  scale_x_date(breaks = seq(1960, 2100, 2) %>% paste0("-01-01") %>% as.Date,
               labels = date_format("%Y")) +
  scale_y_continuous(breaks = 0.01*seq(-20, 20, 1),
                     labels = percent_format(a = 1)) +
  scale_color_identity() + add_flags +
  theme(legend.position = c(0.75, 0.90),
        legend.title = element_blank())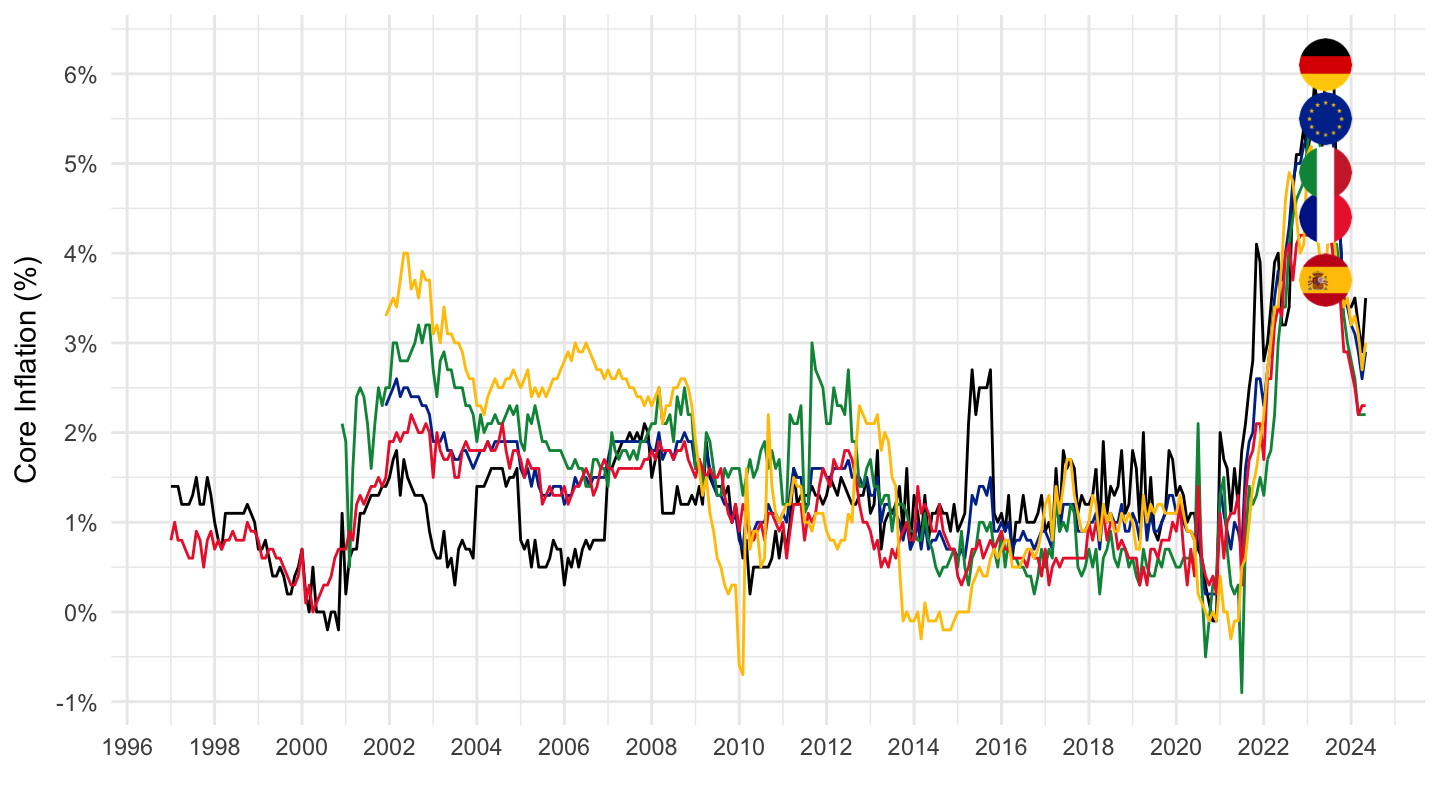
2016-
Code
prc_hicp_manr %>%
  filter(coicop == "TOT_X_NRG_FOOD",
         geo %in% c("FR", "DE", "ES", "IT", "EA20")) %>%
  month_to_date %>%
  filter(date >= as.Date("2016-01-01")) %>%
  left_join(geo, by = "geo") %>%
  mutate(Geo = ifelse(geo == "EA20", "Europe", Geo)) %>%
  left_join(colors, by = c("Geo" = "country")) %>%
  mutate(values = values/100) %>%
  ggplot(.) + geom_line(aes(x = date, y = values, color = color)) +
  theme_minimal() + xlab("") + ylab("Core Inflation (%)") +
  scale_x_date(breaks = seq(1960, 2100, 1) %>% paste0("-01-01") %>% as.Date,
               labels = date_format("%Y")) +
  scale_y_continuous(breaks = 0.01*seq(-20, 20, 1),
                     labels = percent_format(a = 1)) +
  scale_color_identity() + add_5flags +
  theme(legend.position = c(0.75, 0.90),
        legend.title = element_blank())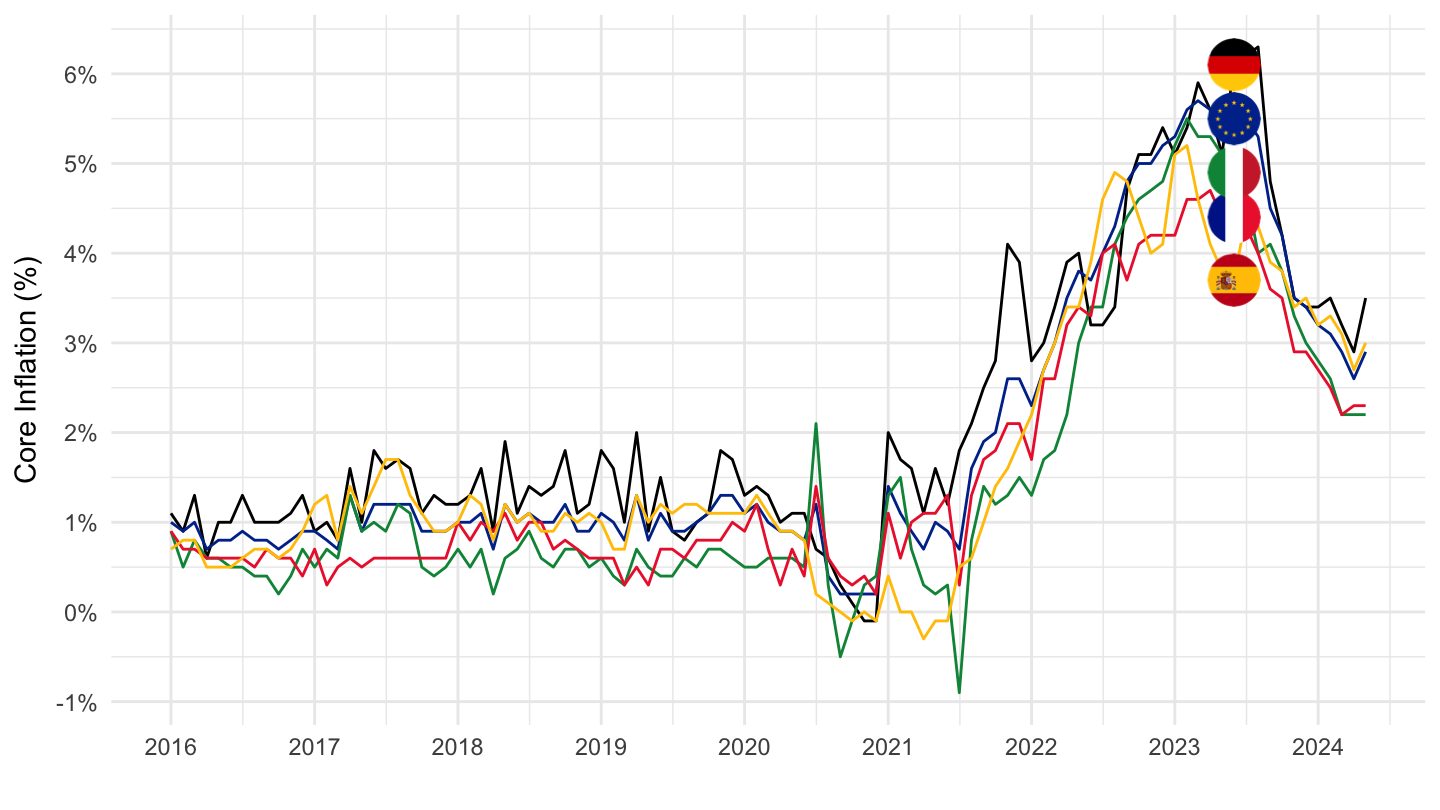
2020-
Code
prc_hicp_manr %>%
  filter(coicop == "TOT_X_NRG_FOOD",
         geo %in% c("FR", "DE", "ES", "IT", "EA20")) %>%
  month_to_date %>%
  filter(date >= as.Date("2020-01-01")) %>%
  left_join(geo, by = "geo") %>%
  mutate(Geo = ifelse(geo == "EA20", "Europe", Geo)) %>%
  left_join(colors, by = c("Geo" = "country")) %>%
  mutate(values = values/100) %>%
  ggplot(.) + geom_line(aes(x = date, y = values, color = color)) +
  theme_minimal() + xlab("") + ylab("Core Inflation (%)") +
  scale_x_date(breaks = "3 months",
               labels = date_format("%b %Y")) +
  scale_y_continuous(breaks = 0.01*seq(-20, 20, 1),
                     labels = percent_format(a = 1)) +
  scale_color_identity() + add_5flags +
  theme(legend.position = c(0.75, 0.90),
        legend.title = element_blank(),
        axis.text.x = element_text(angle = 45, vjust = 1, hjust = 1))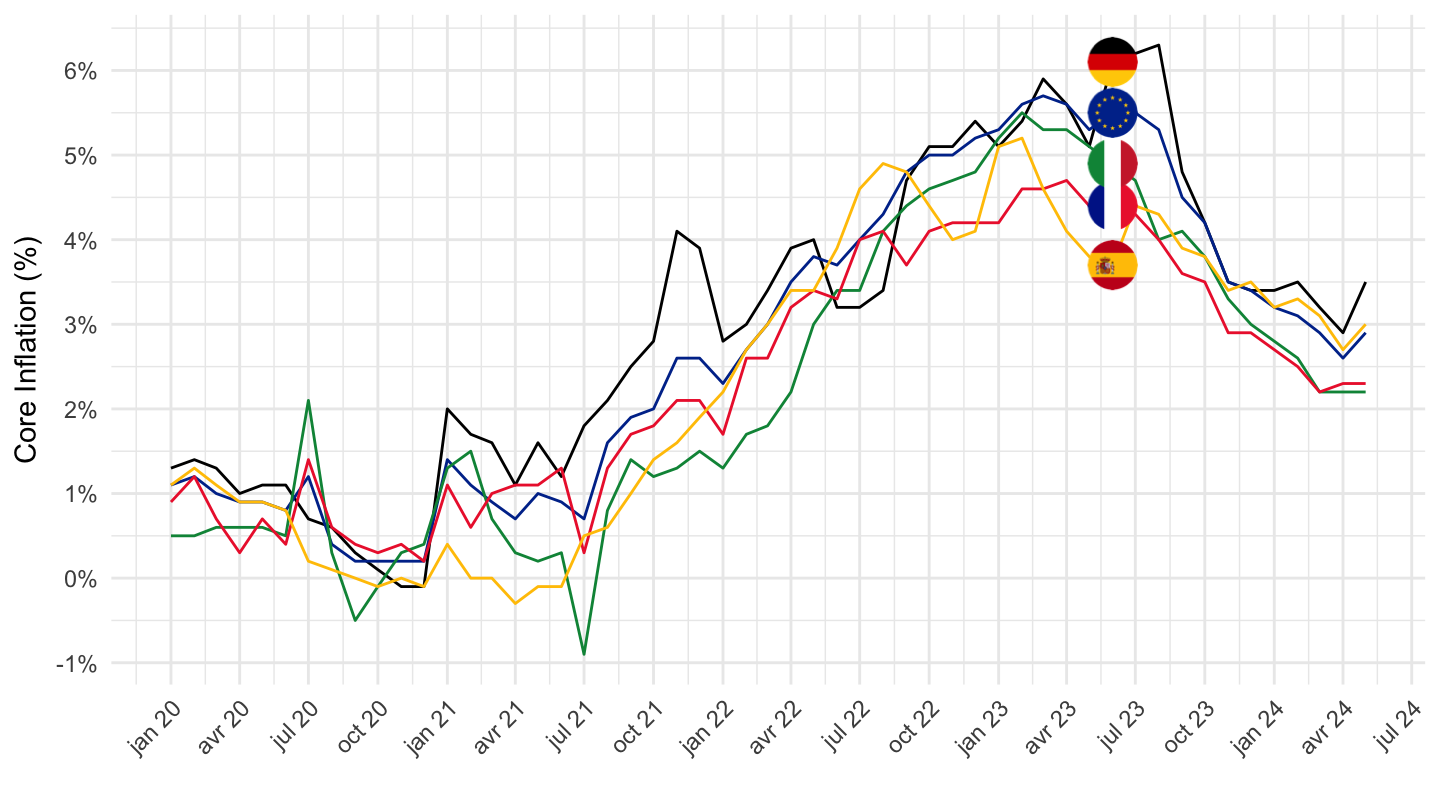
2 years
Code
prc_hicp_manr %>%
  filter(coicop == "TOT_X_NRG_FOOD",
         geo %in% c("FR", "DE", "ES", "IT", "EA20")) %>%
  month_to_date %>%
  filter(date >= Sys.Date() - years(2)) %>%
  left_join(geo, by = "geo") %>%
  mutate(Geo = ifelse(geo == "EA20", "Europe", Geo)) %>%
  left_join(colors, by = c("Geo" = "country")) %>%
  mutate(values = values/100) %>%
  ggplot(.) + geom_line(aes(x = date, y = values, color = color)) +
  theme_minimal() + xlab("") + ylab("Core Inflation (%)") +
  scale_x_date(breaks = "1 month",
               labels = date_format("%b %Y")) +
  scale_y_continuous(breaks = 0.01*seq(-20, 20, 1),
                     labels = percent_format(a = 1)) +
  scale_color_identity() + add_5flags +
  theme(legend.position = c(0.75, 0.90),
        legend.title = element_blank(),
        axis.text.x = element_text(angle = 45, vjust = 1, hjust = 1))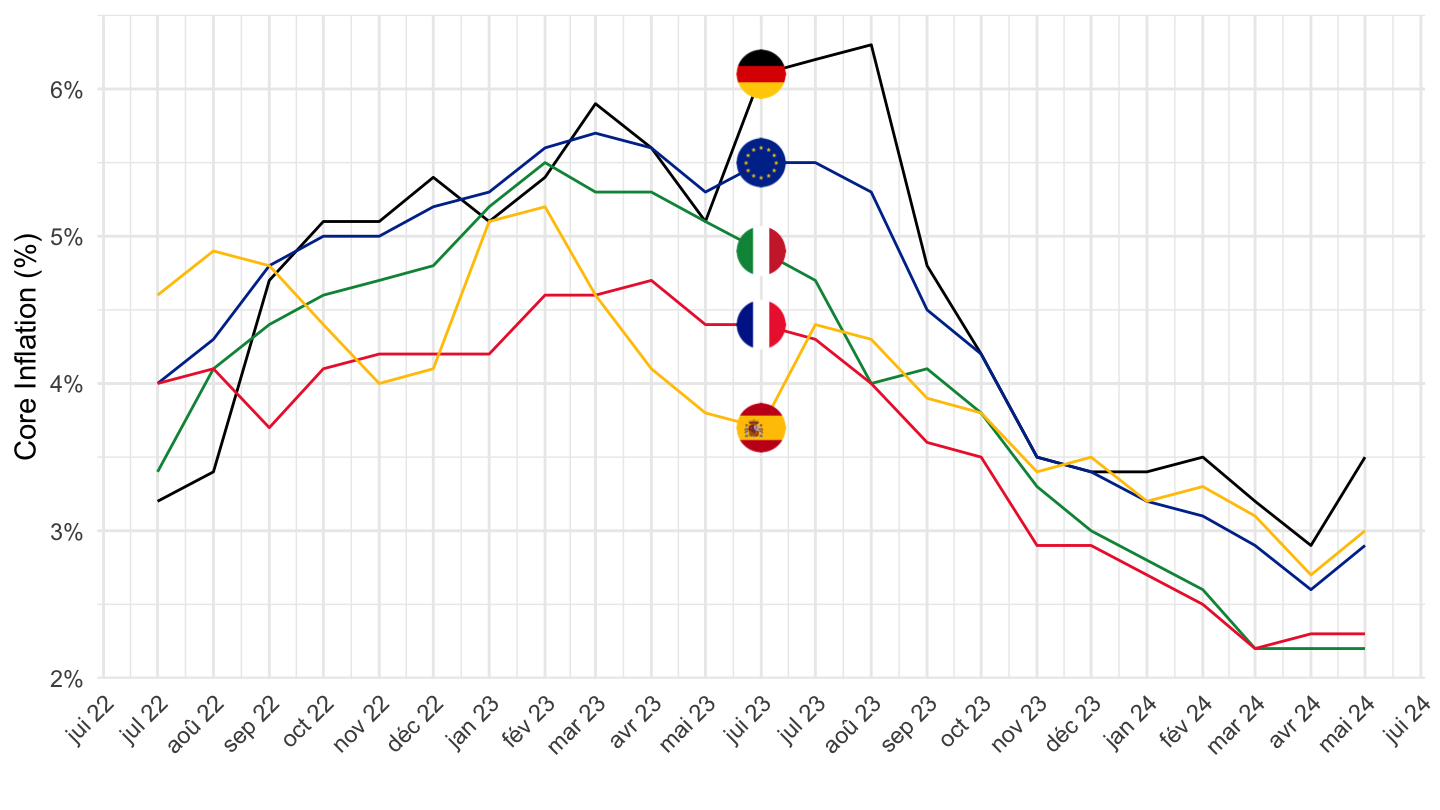
1 year
Code
prc_hicp_manr %>%
  filter(coicop == "TOT_X_NRG_FOOD",
         geo %in% c("FR", "DE", "ES", "IT", "EA20")) %>%
  month_to_date %>%
  filter(date >= Sys.Date() - years(1)) %>%
  left_join(geo, by = "geo") %>%
  mutate(Geo = ifelse(geo == "EA20", "Europe", Geo)) %>%
  left_join(colors, by = c("Geo" = "country")) %>%
  mutate(values = values/100) %>%
  ggplot(.) + geom_line(aes(x = date, y = values, color = color)) +
  theme_minimal() + xlab("") + ylab("Core Inflation (%)") +
  scale_x_date(breaks = "1 month",
               labels = date_format("%b %Y")) +
  scale_y_continuous(breaks = 0.01*seq(-20, 20, .2),
                     labels = percent_format(a = .1)) +
  scale_color_identity() + add_5flags +
  theme(legend.position = c(0.75, 0.90),
        legend.title = element_blank(),
        axis.text.x = element_text(angle = 45, vjust = 1, hjust = 1))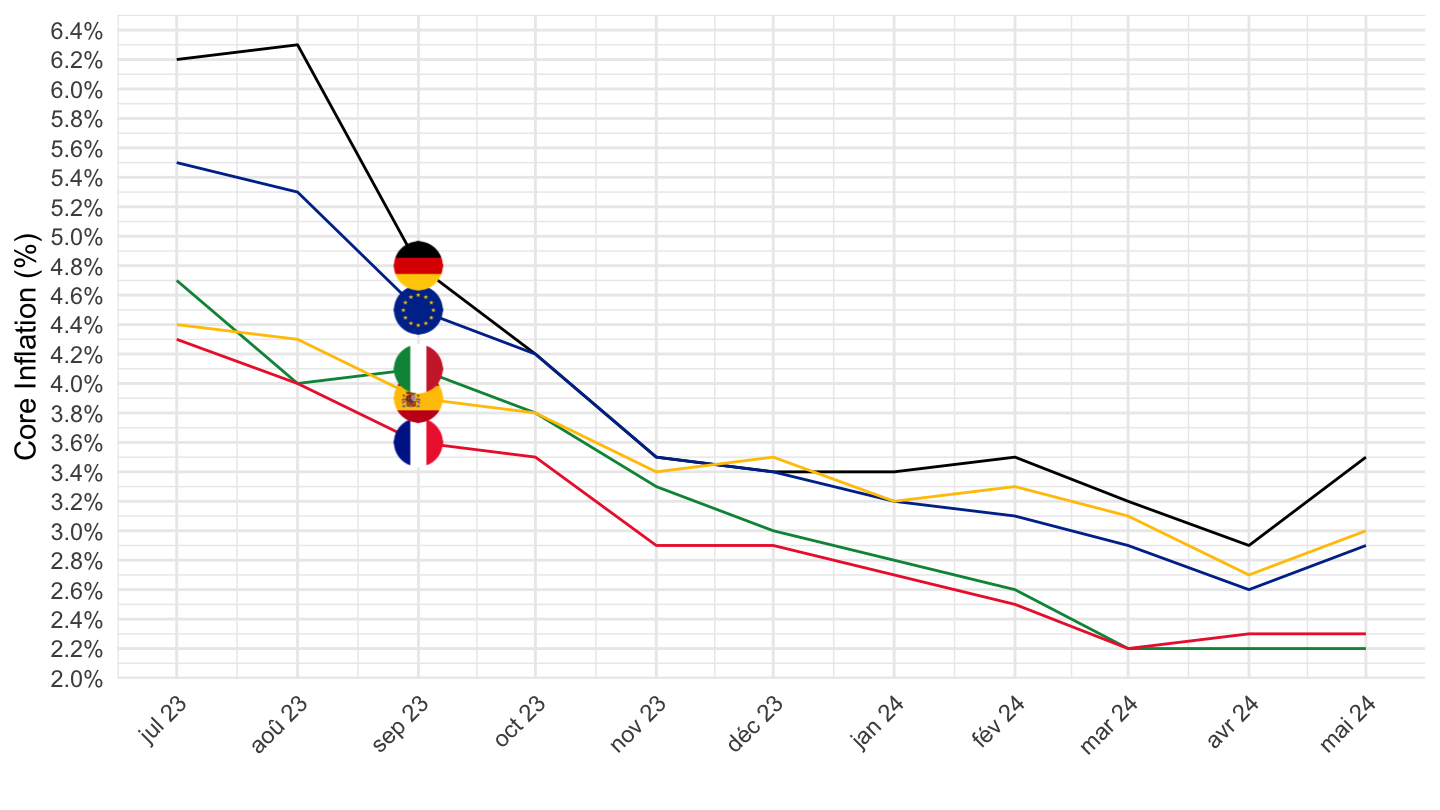
CP00
All
Code
prc_hicp_manr %>%
  filter(coicop == "CP00",
         geo %in% c("FR", "DE", "ES", "IT")) %>%
  month_to_date %>%
  left_join(geo, by = "geo") %>%
  left_join(colors, by = c("Geo" = "country")) %>%
  mutate(values = values/100) %>%
  ggplot(.) + geom_line(aes(x = date, y = values, color = color)) +
  theme_minimal() + xlab("") + ylab("") +
  scale_x_date(breaks = seq(1960, 2100, 2) %>% paste0("-01-01") %>% as.Date,
               labels = date_format("%Y")) +
  scale_y_continuous(breaks = 0.01*seq(-20, 20, 1),
                     labels = percent_format(a = 1)) +
  scale_color_identity() + add_flags +
  theme(legend.position = c(0.75, 0.90),
        legend.title = element_blank())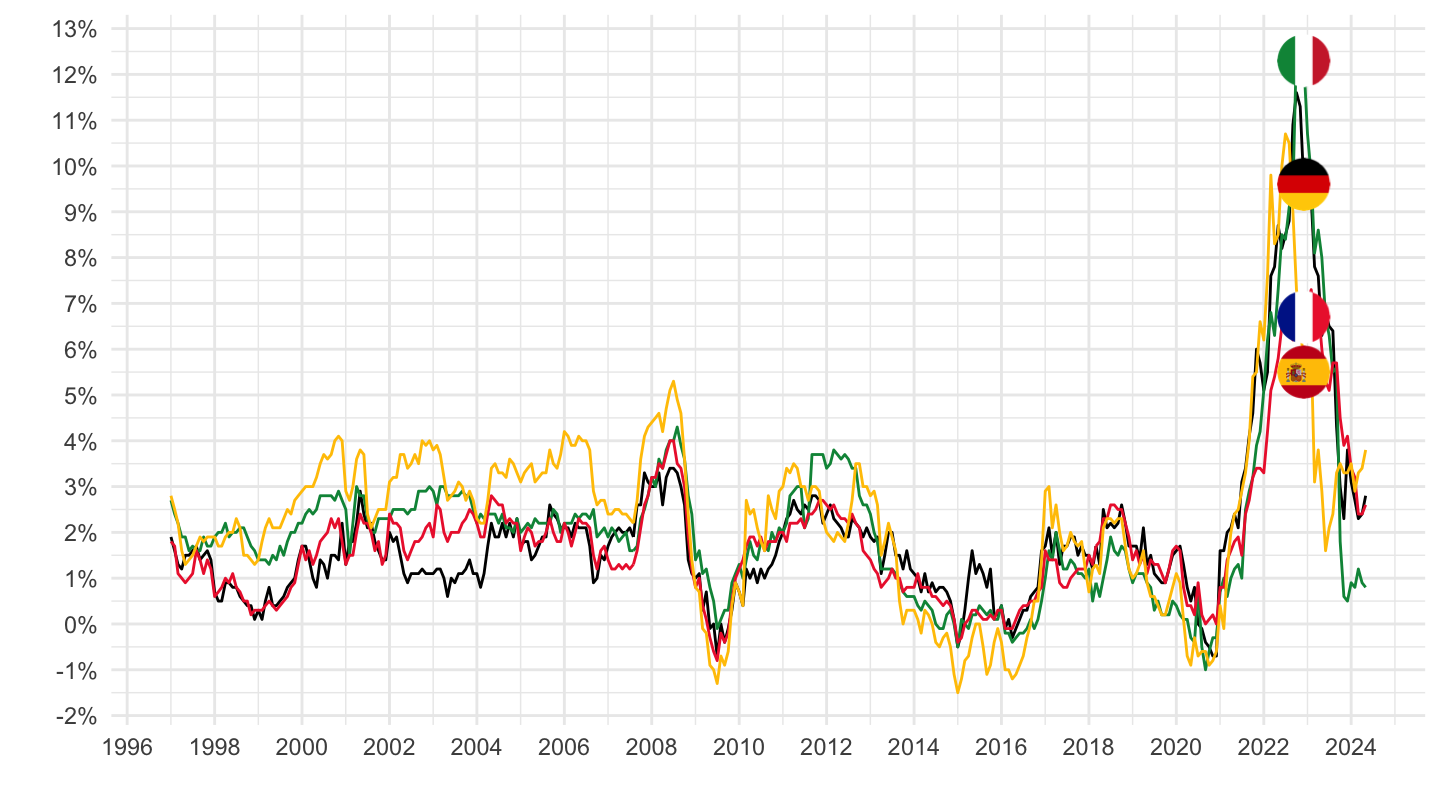
2016-
Code
prc_hicp_manr %>%
  filter(coicop == "CP00",
         geo %in% c("FR", "DE", "ES", "IT")) %>%
  month_to_date %>%
  filter(date >= as.Date("2016-01-01")) %>%
  left_join(geo, by = "geo") %>%
  left_join(colors, by = c("Geo" = "country")) %>%
  mutate(values = values/100) %>%
  ggplot(.) + geom_line(aes(x = date, y = values, color = color)) +
  theme_minimal() + xlab("") + ylab("") +
  scale_x_date(breaks = seq(1960, 2100, 1) %>% paste0("-01-01") %>% as.Date,
               labels = date_format("%Y")) +
  scale_y_continuous(breaks = 0.01*seq(-20, 20, 1),
                     labels = percent_format(a = 1)) +
  scale_color_identity() + add_4flags +
  theme(legend.position = c(0.75, 0.90),
        legend.title = element_blank())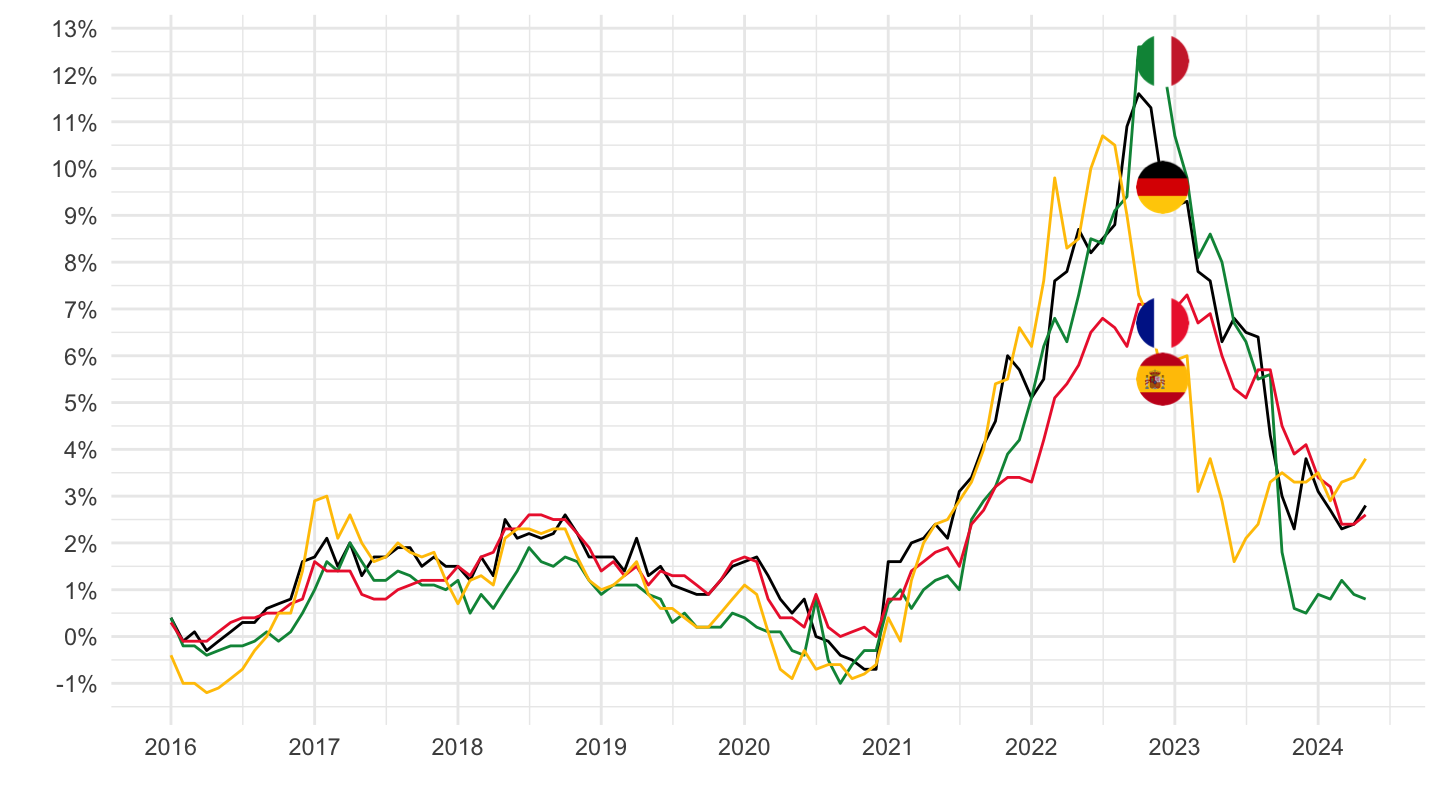
2020-
Code
prc_hicp_manr %>%
  filter(coicop == "CP00",
         geo %in% c("FR", "DE", "ES", "IT", "EA20")) %>%
  month_to_date %>%
  filter(date >= as.Date("2020-01-01")) %>%
  left_join(geo, by = "geo") %>%
  left_join(colors, by = c("Geo" = "country")) %>%
  mutate(values = values/100) %>%
  ggplot(.) + geom_line(aes(x = date, y = values, color = color)) +
  theme_minimal() + xlab("") + ylab("") +
  scale_x_date(breaks = "3 months",
               labels = date_format("%b %Y")) +
  scale_y_continuous(breaks = 0.01*seq(-20, 20, 1),
                     labels = percent_format(a = 1)) +
  scale_color_identity() + add_4flags +
  theme(legend.position = c(0.75, 0.90),
        legend.title = element_blank(),
        axis.text.x = element_text(angle = 45, vjust = 1, hjust = 1))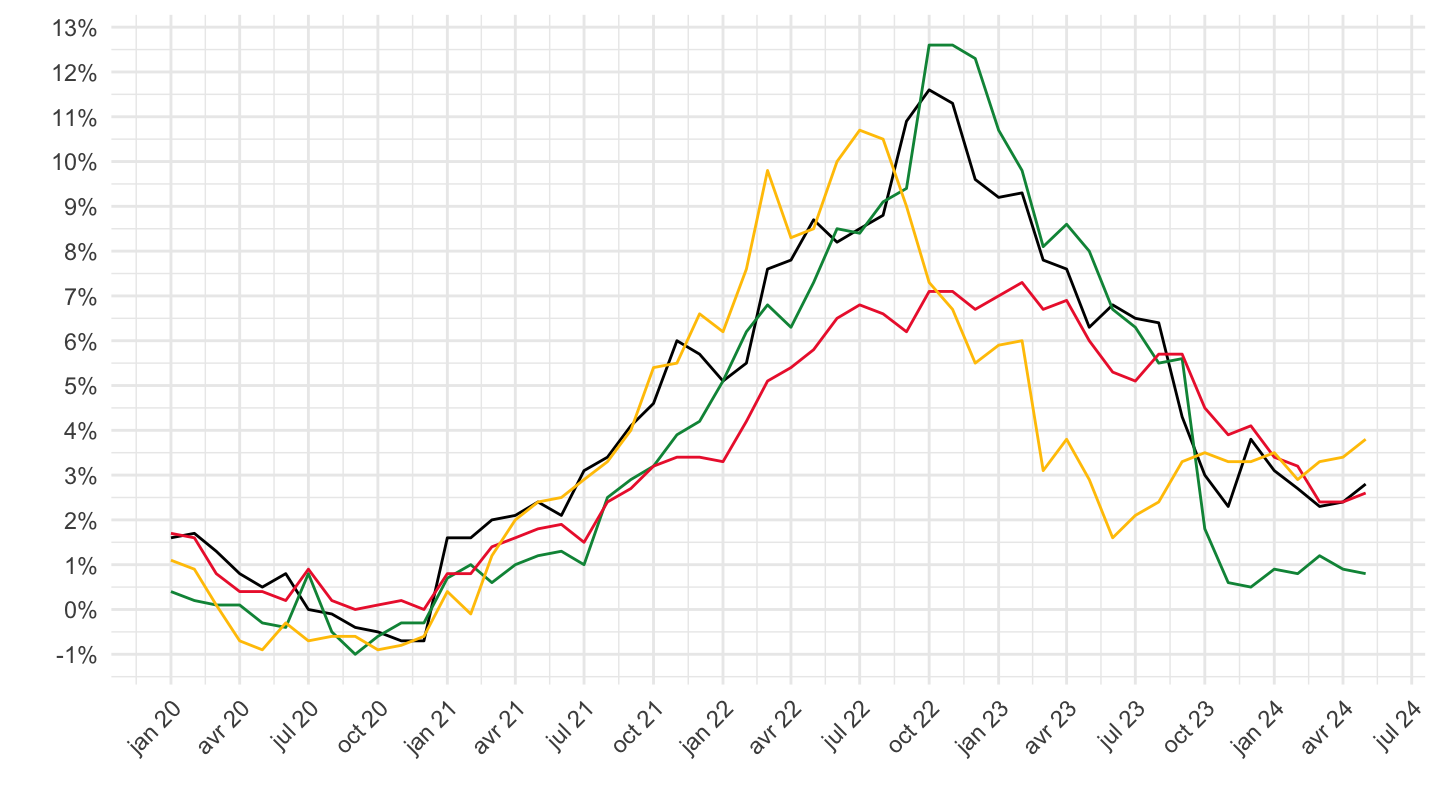
CP01 - Food and non-alcoholic beverages
2016-
Code
prc_hicp_manr %>%
  filter(coicop == "CP01",
         geo %in% c("FR", "DE", "ES", "IT")) %>%
  month_to_date %>%
  filter(date >= as.Date("2016-01-01")) %>%
  left_join(geo, by = "geo") %>%
  left_join(colors, by = c("Geo" = "country")) %>%
  mutate(values = values/100) %>%
  ggplot(.) + geom_line(aes(x = date, y = values, color = color)) +
  theme_minimal() + xlab("") + ylab("") +
  scale_x_date(breaks = seq(1960, 2100, 1) %>% paste0("-01-01") %>% as.Date,
               labels = date_format("%Y")) +
  scale_y_continuous(breaks = 0.01*seq(-20, 20, 1),
                     labels = percent_format(a = 1)) +
  scale_color_identity() + add_4flags +
  theme(legend.position = c(0.75, 0.90),
        legend.title = element_blank())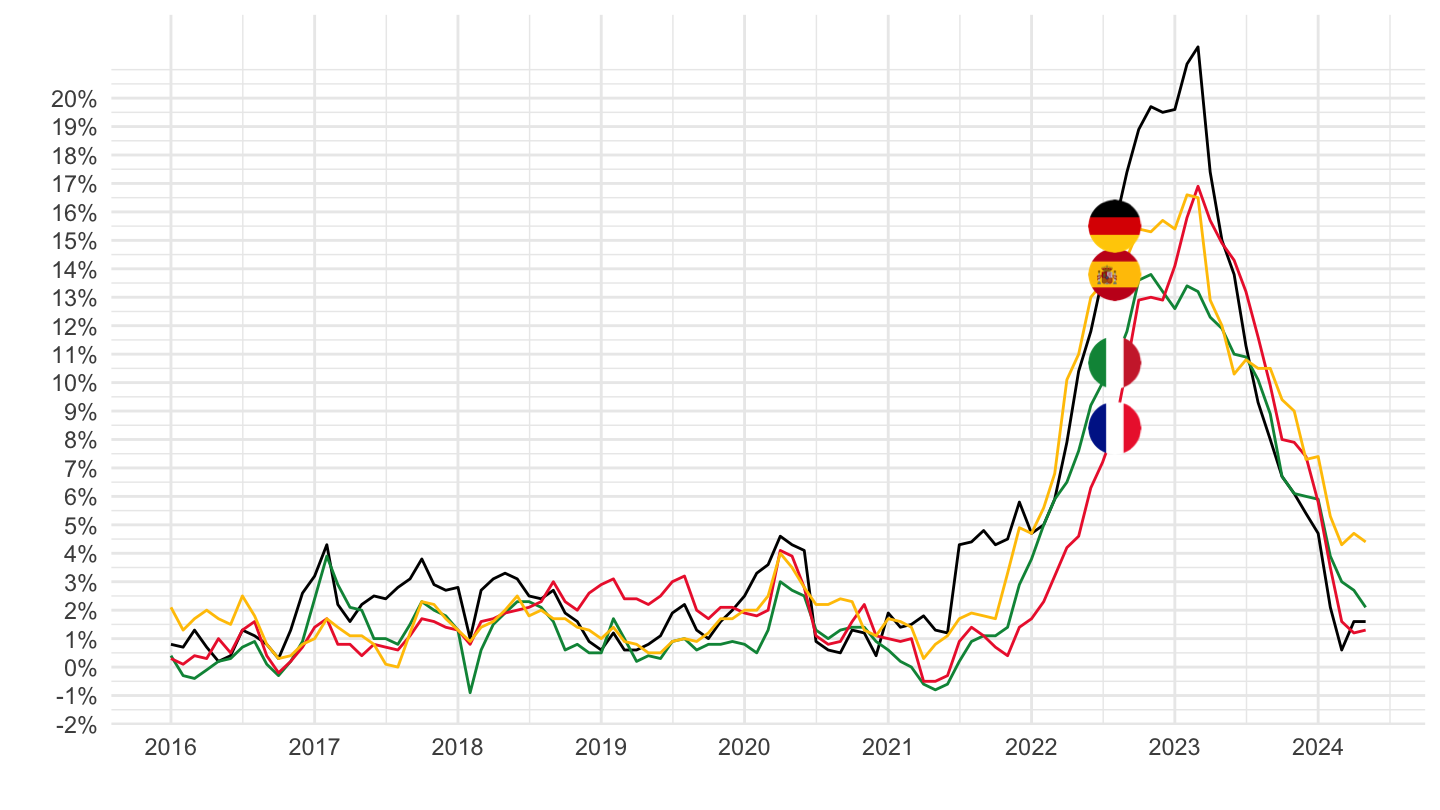
2 years
Code
prc_hicp_manr %>%
  filter(coicop == "CP01",
         geo %in% c("FR", "DE", "ES", "IT")) %>%
  month_to_date %>%
  filter(date >= Sys.Date() - years(2)) %>%
  left_join(geo, by = "geo") %>%
  left_join(colors, by = c("Geo" = "country")) %>%
  mutate(values = values/100) %>%
  ggplot(.) + geom_line(aes(x = date, y = values, color = color)) +
  theme_minimal() + xlab("") + ylab("") +
  scale_x_date(breaks = "2 months",
               labels = date_format("%b %Y")) +
  scale_y_continuous(breaks = 0.01*seq(-20, 40, 2),
                     labels = percent_format(a = 1)) +
  scale_color_identity() + add_4flags +
  theme(legend.position = c(0.75, 0.90),
        legend.title = element_blank(),
        axis.text.x = element_text(angle = 45, vjust = 1, hjust = 1))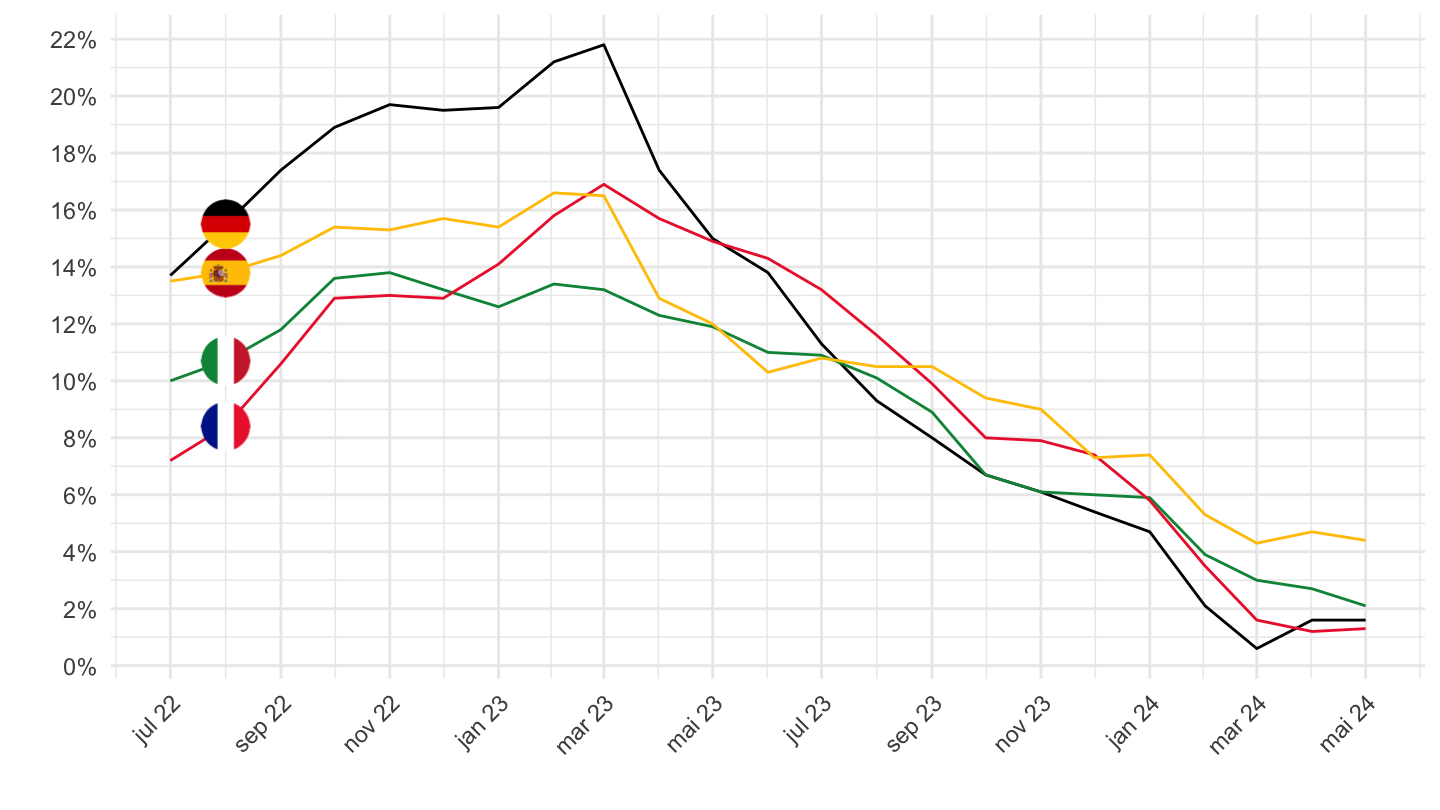
CP02 - Alcoholic beverages, tobacco and narcotics
All
Code
prc_hicp_manr %>%
  filter(coicop == "CP02",
         geo %in% c("FR", "DE", "ES", "IT")) %>%
  month_to_date %>%
  left_join(geo, by = "geo") %>%
  left_join(colors, by = c("Geo" = "country")) %>%
  mutate(values = values/100) %>%
  ggplot(.) + geom_line(aes(x = date, y = values, color = color)) +
  theme_minimal() + xlab("") + ylab("") +
  scale_x_date(breaks = seq(1960, 2100, 2) %>% paste0("-01-01") %>% as.Date,
               labels = date_format("%Y")) +
  scale_y_continuous(breaks = 0.01*seq(-20, 20, 1),
                     labels = percent_format(a = 1)) +
  scale_color_identity() + add_4flags +
  theme(legend.position = c(0.75, 0.90),
        legend.title = element_blank())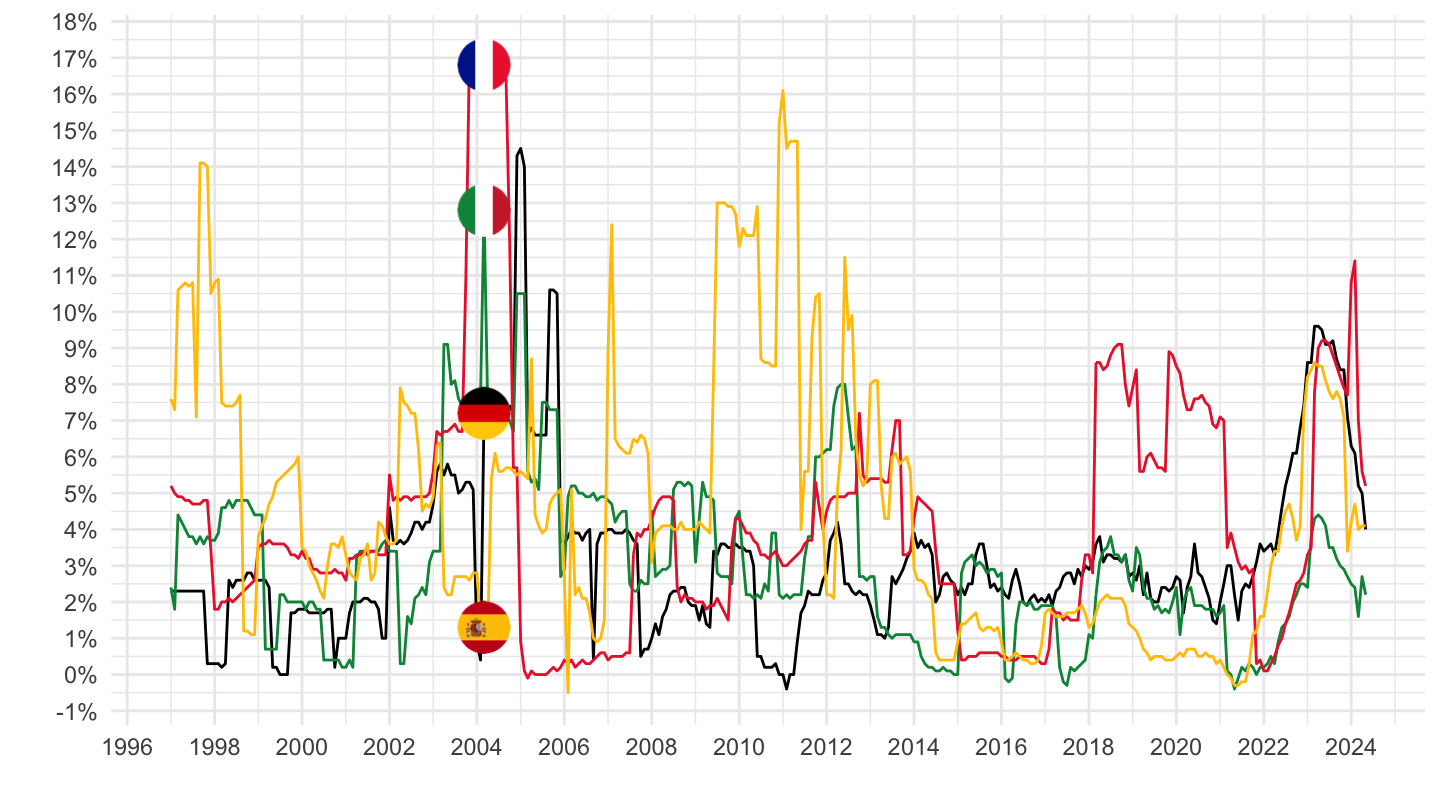
2010-
Code
prc_hicp_manr %>%
  filter(coicop == "CP02",
         geo %in% c("FR", "DE", "ES", "IT")) %>%
  month_to_date %>%
  filter(date >= as.Date("2010-01-01")) %>%
  left_join(geo, by = "geo") %>%
  left_join(colors, by = c("Geo" = "country")) %>%
  mutate(values = values/100) %>%
  ggplot(.) + geom_line(aes(x = date, y = values, color = color)) +
  theme_minimal() + xlab("") + ylab("") +
  scale_x_date(breaks = seq(1960, 2100, 1) %>% paste0("-01-01") %>% as.Date,
               labels = date_format("%Y")) +
  scale_y_continuous(breaks = 0.01*seq(-20, 20, 1),
                     labels = percent_format(a = 1)) +
  scale_color_identity() + add_4flags +
  theme(legend.position = c(0.75, 0.90),
        legend.title = element_blank())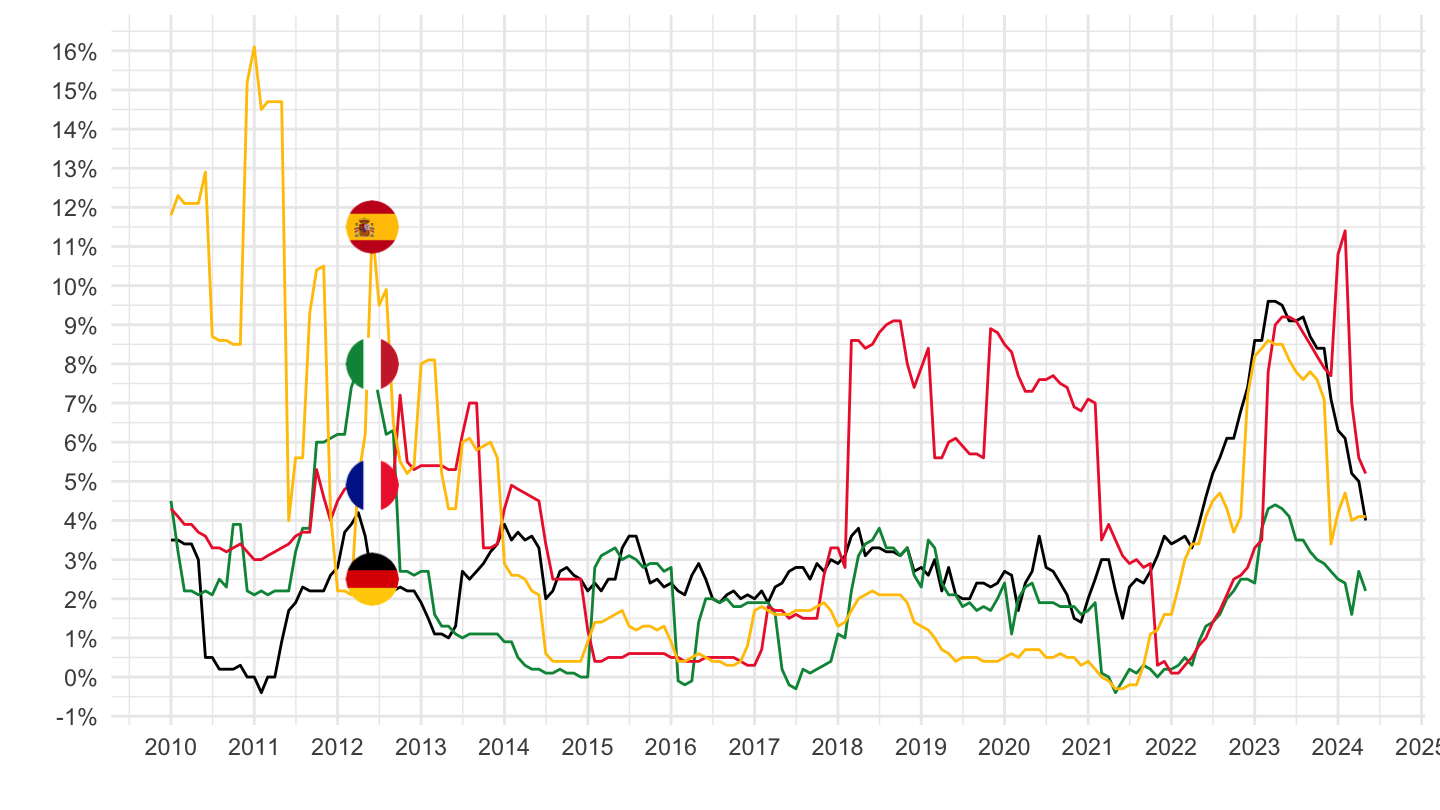
2016-
Code
prc_hicp_manr %>%
  filter(coicop == "CP02",
         geo %in% c("FR", "DE", "ES", "IT")) %>%
  month_to_date %>%
  filter(date >= as.Date("2016-01-01")) %>%
  left_join(geo, by = "geo") %>%
  left_join(colors, by = c("Geo" = "country")) %>%
  mutate(values = values/100) %>%
  ggplot(.) + geom_line(aes(x = date, y = values, color = color)) +
  theme_minimal() + xlab("") + ylab("") +
  scale_x_date(breaks = seq(1960, 2100, 1) %>% paste0("-01-01") %>% as.Date,
               labels = date_format("%Y")) +
  scale_y_continuous(breaks = 0.01*seq(-20, 20, 1),
                     labels = percent_format(a = 1)) +
  scale_color_identity() + add_4flags +
  theme(legend.position = c(0.75, 0.90),
        legend.title = element_blank())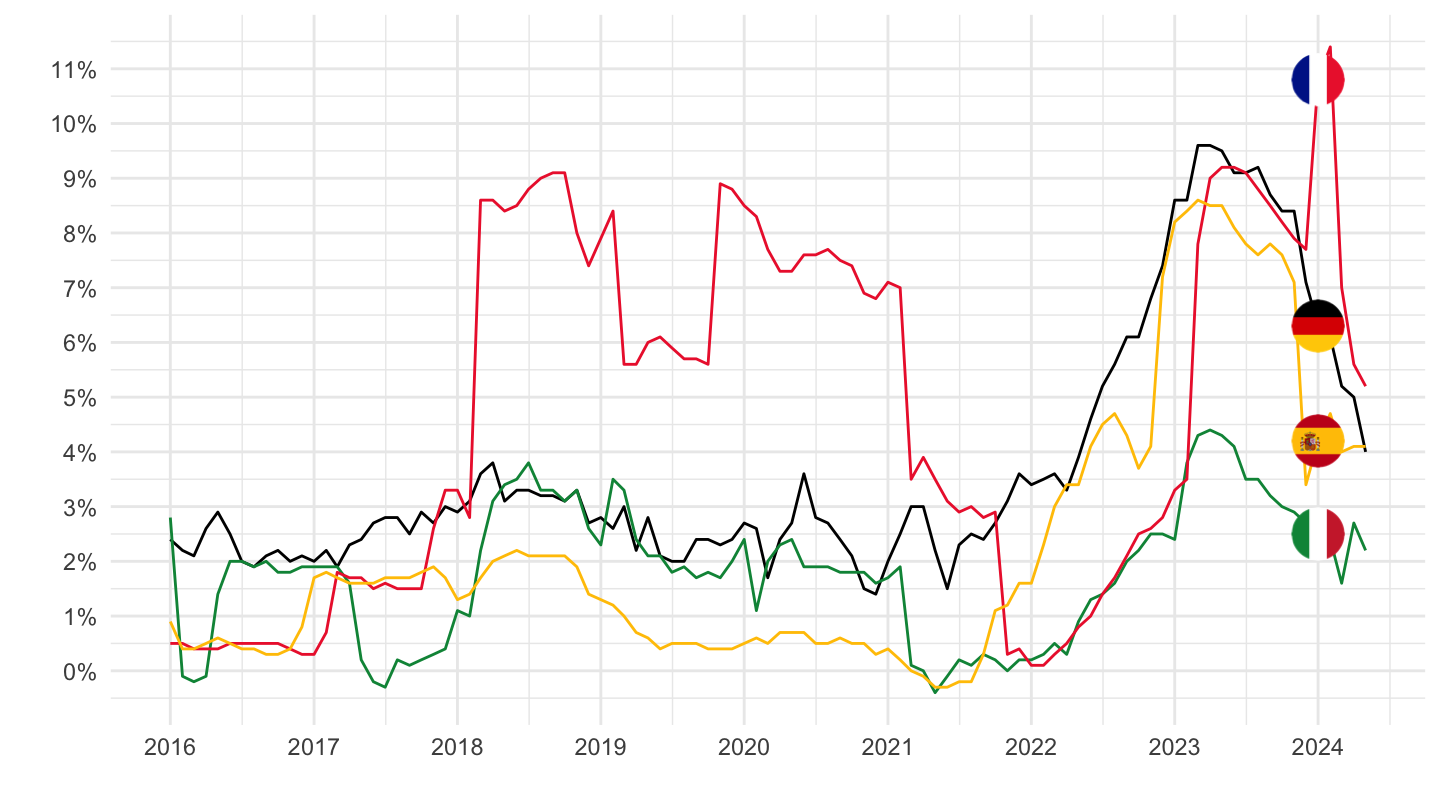
2 years
Code
prc_hicp_manr %>%
  filter(coicop == "CP02",
         geo %in% c("FR", "DE", "ES", "IT")) %>%
  month_to_date %>%
  filter(date >= Sys.Date() - years(2)) %>%
  left_join(geo, by = "geo") %>%
  left_join(colors, by = c("Geo" = "country")) %>%
  mutate(values = values/100) %>%
  ggplot(.) + geom_line(aes(x = date, y = values, color = color)) +
  theme_minimal() + xlab("") + ylab("") +
  scale_x_date(breaks = "2 months",
               labels = date_format("%b %Y")) +
  scale_y_continuous(breaks = 0.01*seq(-20, 40, 1),
                     labels = percent_format(a = 1)) +
  scale_color_identity() + add_4flags +
  theme(legend.position = c(0.75, 0.90),
        legend.title = element_blank(),
        axis.text.x = element_text(angle = 45, vjust = 1, hjust = 1))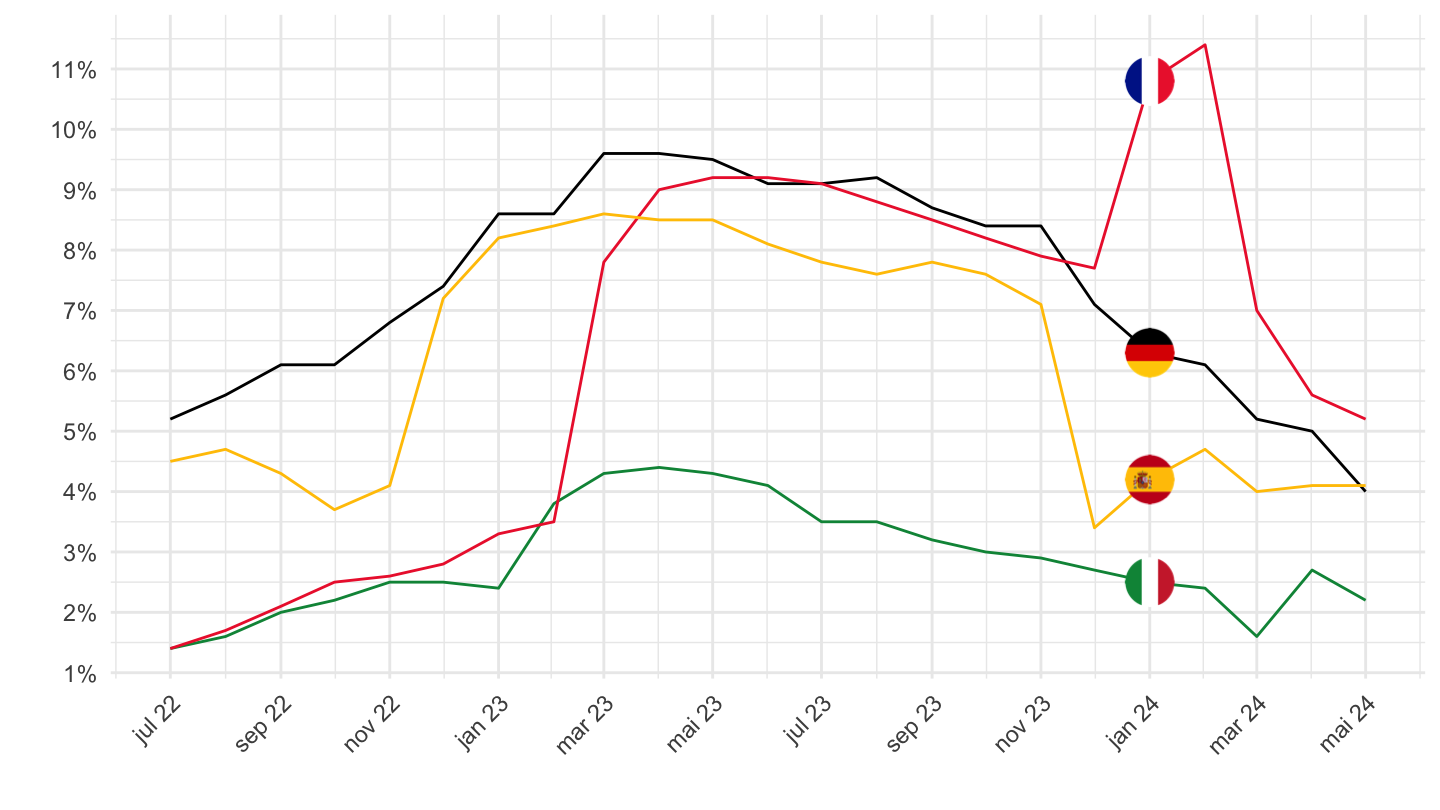
CP03 - Clothing and footwear
2016-
Code
prc_hicp_manr %>%
  filter(coicop == "CP03",
         geo %in% c("FR", "DE", "ES", "IT")) %>%
  month_to_date %>%
  filter(date >= as.Date("2016-01-01")) %>%
  left_join(geo, by = "geo") %>%
  left_join(colors, by = c("Geo" = "country")) %>%
  mutate(values = values/100) %>%
  ggplot(.) + geom_line(aes(x = date, y = values, color = color)) +
  theme_minimal() + xlab("") + ylab("") +
  scale_x_date(breaks = seq(1960, 2100, 1) %>% paste0("-01-01") %>% as.Date,
               labels = date_format("%Y")) +
  scale_y_continuous(breaks = 0.01*seq(-20, 20, 1),
                     labels = percent_format(a = 1)) +
  scale_color_identity() + add_4flags +
  theme(legend.position = c(0.75, 0.90),
        legend.title = element_blank())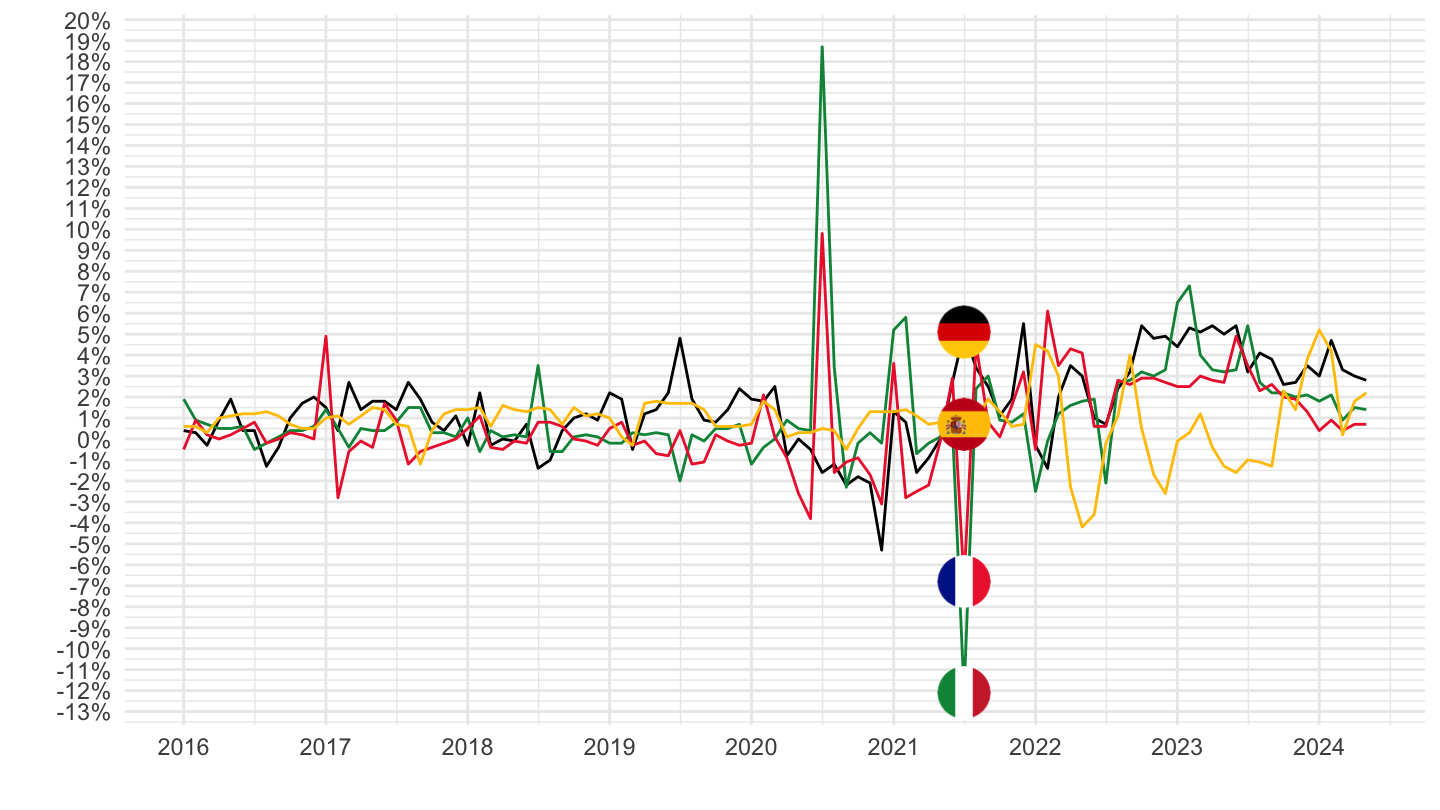
2 years
Code
prc_hicp_manr %>%
  filter(coicop == "CP03",
         geo %in% c("FR", "DE", "ES", "IT")) %>%
  month_to_date %>%
  filter(date >= Sys.Date() - years(2)) %>%
  left_join(geo, by = "geo") %>%
  left_join(colors, by = c("Geo" = "country")) %>%
  mutate(values = values/100) %>%
  ggplot(.) + geom_line(aes(x = date, y = values, color = color)) +
  theme_minimal() + xlab("") + ylab("") +
  scale_x_date(breaks = "2 months",
               labels = date_format("%b %Y")) +
  scale_y_continuous(breaks = 0.01*seq(-20, 40, 1),
                     labels = percent_format(a = 1)) +
  scale_color_identity() + add_4flags +
  theme(legend.position = c(0.75, 0.90),
        legend.title = element_blank(),
        axis.text.x = element_text(angle = 45, vjust = 1, hjust = 1))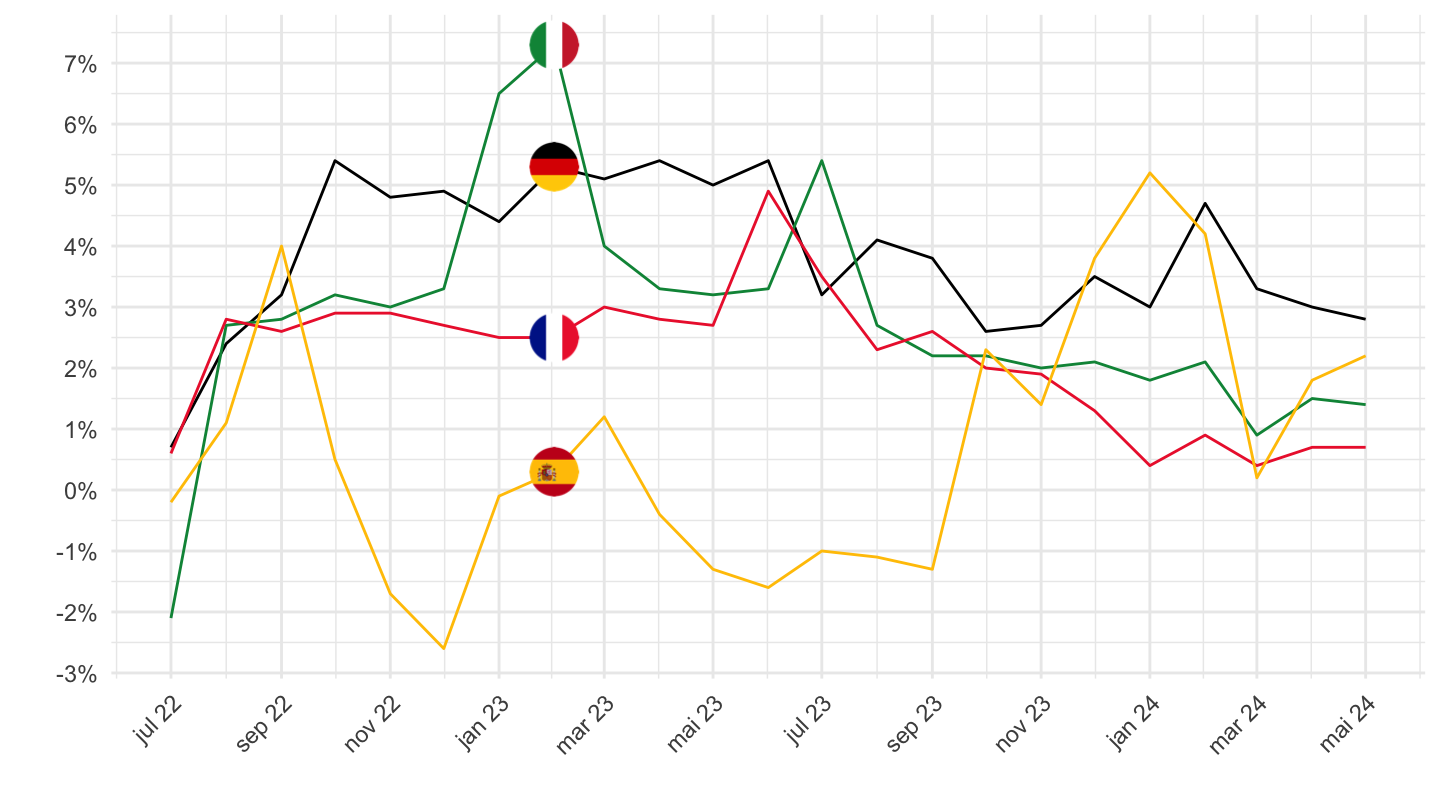
CP04 - Housing, water, electricity, gas and other fuels
2016-
Code
prc_hicp_manr %>%
  filter(coicop == "CP04",
         geo %in% c("FR", "DE", "ES", "IT")) %>%
  month_to_date %>%
  filter(date >= as.Date("2016-01-01")) %>%
  left_join(geo, by = "geo") %>%
  left_join(colors, by = c("Geo" = "country")) %>%
  mutate(values = values/100) %>%
  ggplot(.) + geom_line(aes(x = date, y = values, color = color)) +
  theme_minimal() + xlab("") + ylab("") +
  scale_x_date(breaks = seq(1960, 2100, 1) %>% paste0("-01-01") %>% as.Date,
               labels = date_format("%Y")) +
  scale_y_continuous(breaks = 0.01*seq(-20, 20, 1),
                     labels = percent_format(a = 1)) +
  scale_color_identity() + add_4flags +
  theme(legend.position = c(0.75, 0.90),
        legend.title = element_blank())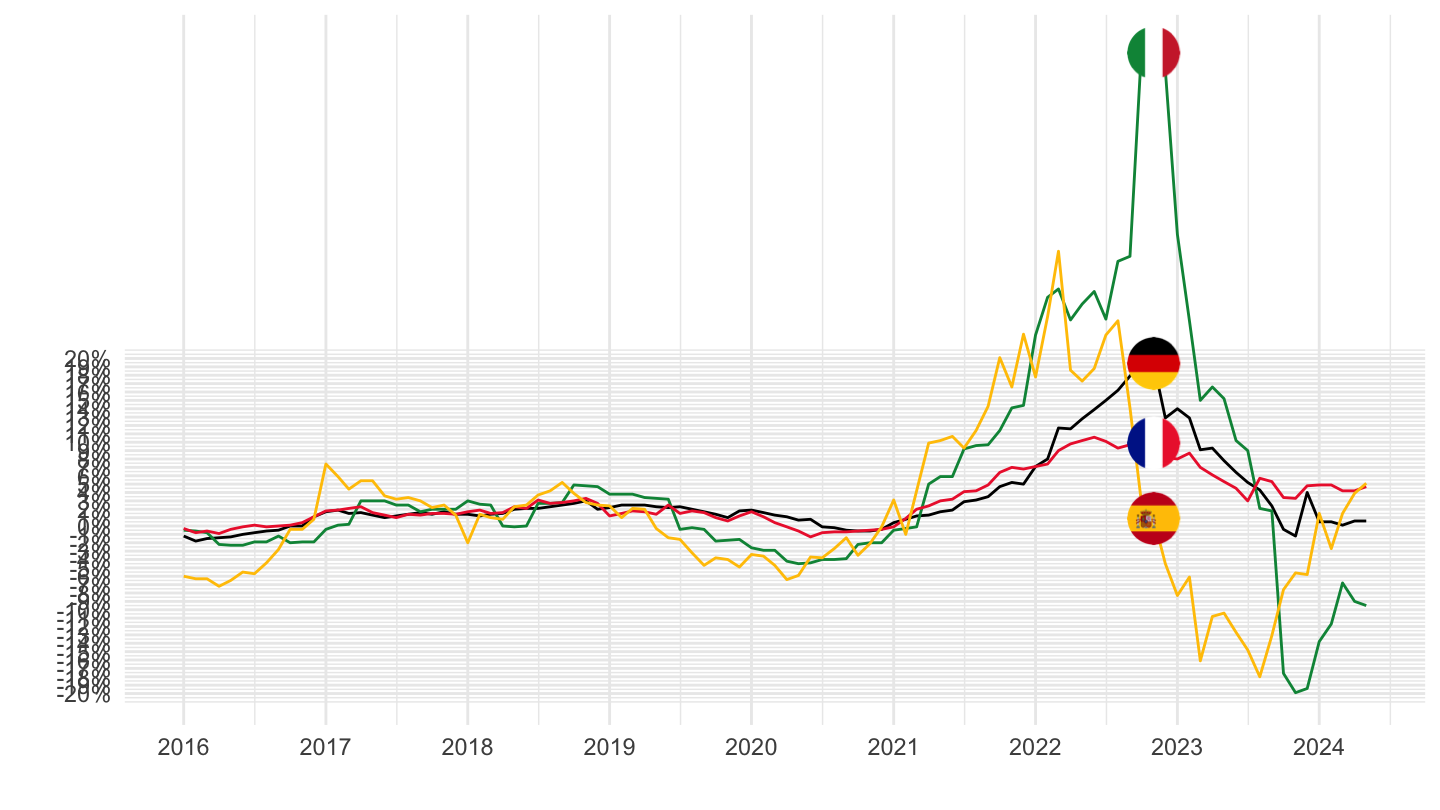
2 years
Code
prc_hicp_manr %>%
  filter(coicop == "CP04",
         geo %in% c("FR", "DE", "ES", "IT")) %>%
  month_to_date %>%
  filter(date >= Sys.Date() - years(2)) %>%
  left_join(geo, by = "geo") %>%
  left_join(colors, by = c("Geo" = "country")) %>%
  mutate(values = values/100) %>%
  ggplot(.) + geom_line(aes(x = date, y = values, color = color)) +
  theme_minimal() + xlab("") + ylab("") +
  scale_x_date(breaks = "2 months",
               labels = date_format("%b %Y")) +
  scale_y_continuous(breaks = 0.01*seq(-20, 100, 5),
                     labels = percent_format(a = 1)) +
  scale_color_identity() + add_4flags +
  theme(legend.position = c(0.75, 0.90),
        legend.title = element_blank(),
        axis.text.x = element_text(angle = 45, vjust = 1, hjust = 1))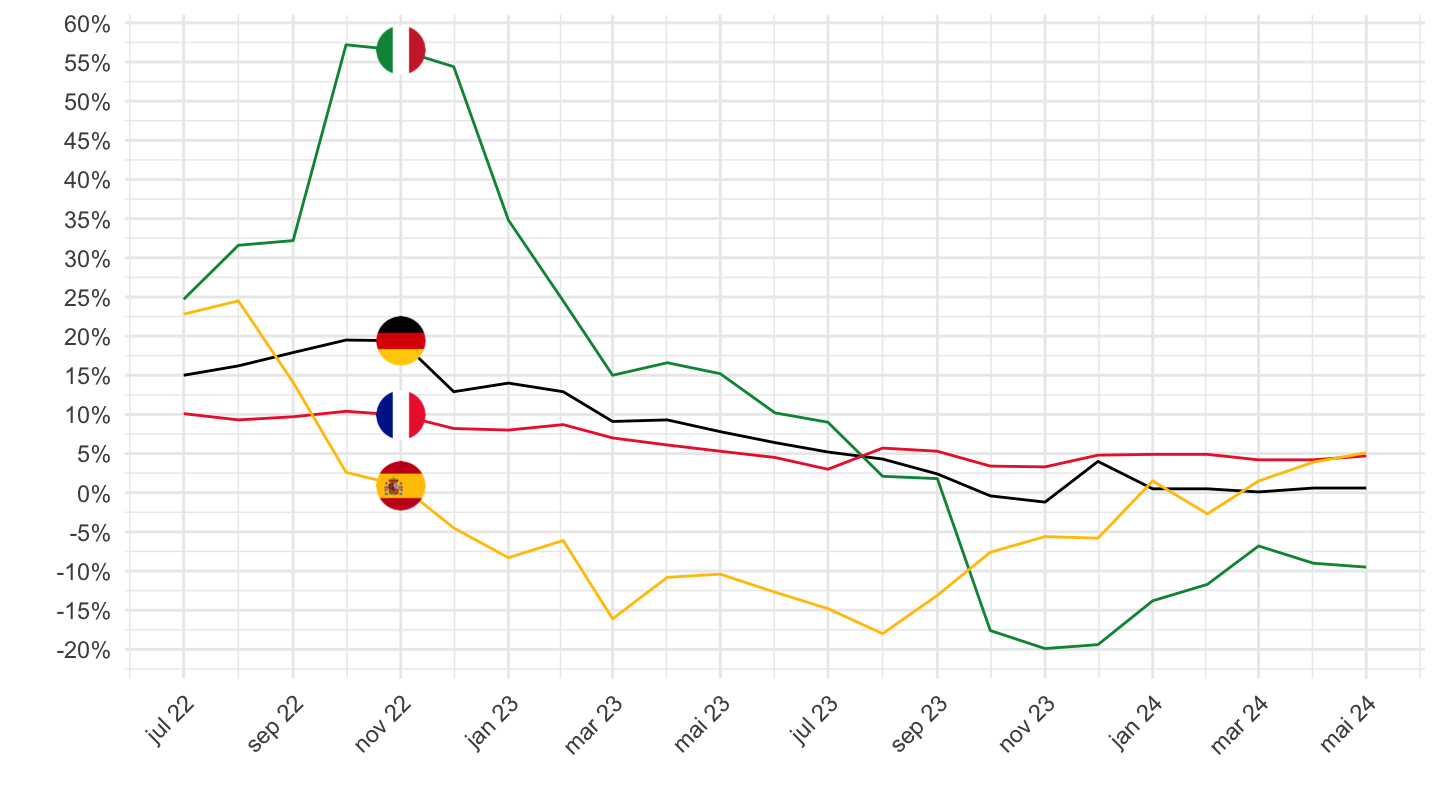
CP05 - Furnishings
2016-
Code
prc_hicp_manr %>%
  filter(coicop == "CP05",
         geo %in% c("FR", "DE", "ES", "IT")) %>%
  month_to_date %>%
  filter(date >= as.Date("2016-01-01")) %>%
  left_join(geo, by = "geo") %>%
  left_join(colors, by = c("Geo" = "country")) %>%
  mutate(values = values/100) %>%
  ggplot(.) + geom_line(aes(x = date, y = values, color = color)) +
  theme_minimal() + xlab("") + ylab("") +
  scale_x_date(breaks = seq(1960, 2100, 1) %>% paste0("-01-01") %>% as.Date,
               labels = date_format("%Y")) +
  scale_y_continuous(breaks = 0.01*seq(-20, 20, 1),
                     labels = percent_format(a = 1)) +
  scale_color_identity() + add_4flags +
  theme(legend.position = c(0.75, 0.90),
        legend.title = element_blank())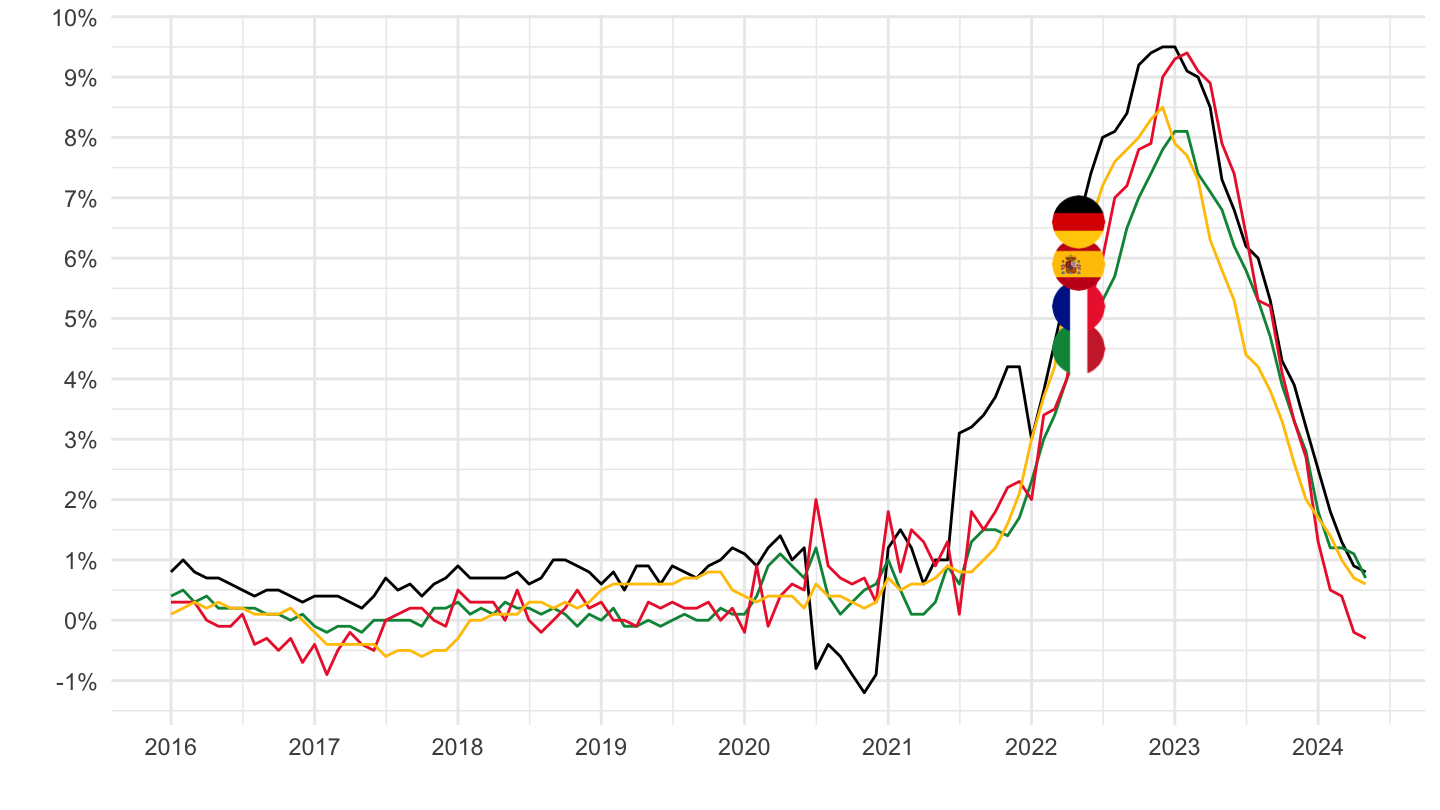
CP06 - Health
2016-
Code
prc_hicp_manr %>%
  filter(coicop == "CP06",
         geo %in% c("FR", "DE", "ES", "IT")) %>%
  month_to_date %>%
  filter(date >= as.Date("2016-01-01")) %>%
  left_join(geo, by = "geo") %>%
  left_join(colors, by = c("Geo" = "country")) %>%
  mutate(values = values/100) %>%
  ggplot(.) + geom_line(aes(x = date, y = values, color = color)) +
  theme_minimal() + xlab("") + ylab("") +
  scale_x_date(breaks = seq(1960, 2100, 1) %>% paste0("-01-01") %>% as.Date,
               labels = date_format("%Y")) +
  scale_y_continuous(breaks = 0.01*seq(-20, 20, 0.5),
                     labels = percent_format(a = .1)) +
  scale_color_identity() + add_4flags +
  theme(legend.position = c(0.75, 0.90),
        legend.title = element_blank())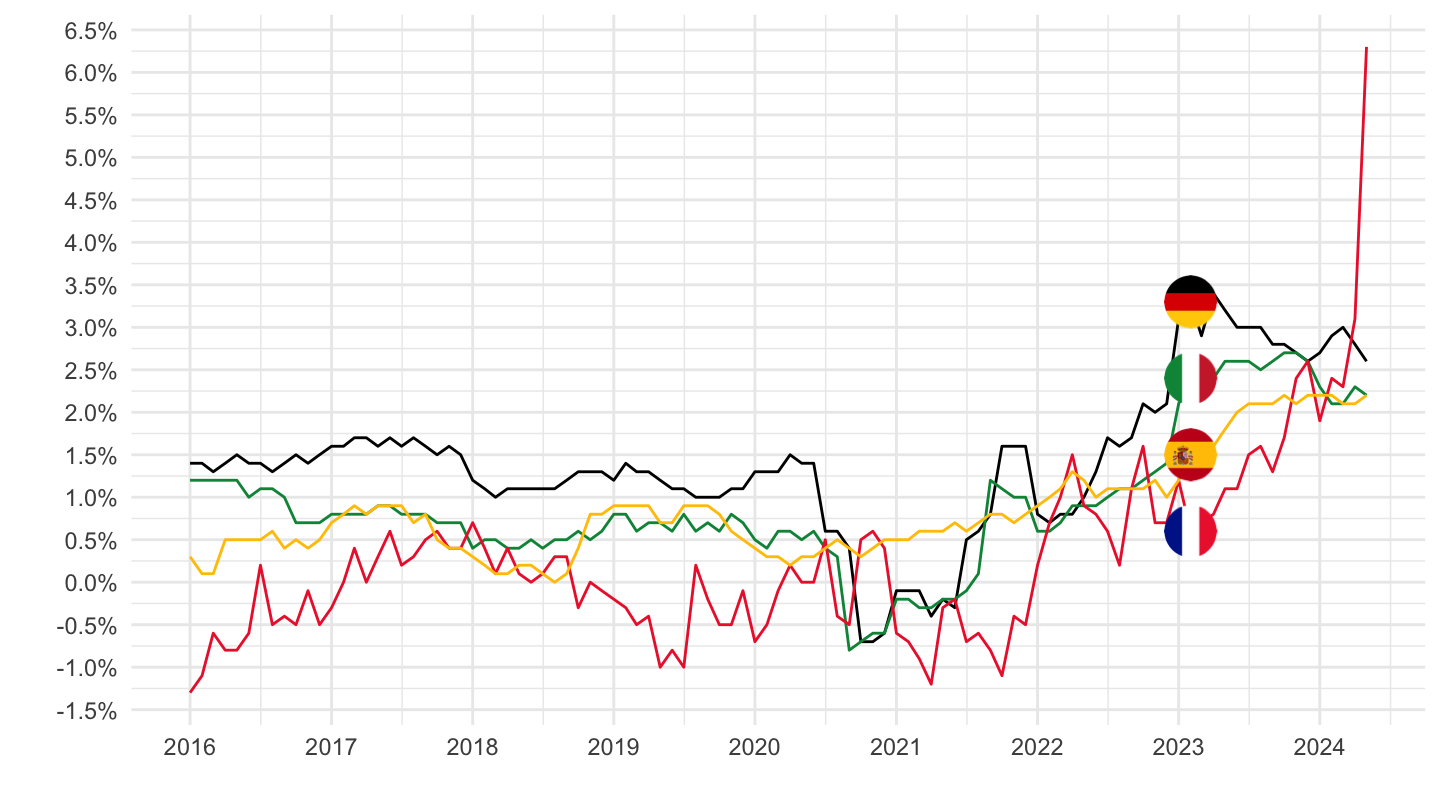
2020-
Code
prc_hicp_manr %>%
  filter(coicop == "CP06",
         geo %in% c("FR", "DE", "ES", "IT")) %>%
  month_to_date %>%
  filter(date >= as.Date("2020-01-01")) %>%
  left_join(geo, by = "geo") %>%
  left_join(colors, by = c("Geo" = "country")) %>%
  mutate(values = values/100) %>%
  ggplot(.) + geom_line(aes(x = date, y = values, color = color)) +
  theme_minimal() + xlab("") + ylab("") +
  scale_x_date(breaks = "2 months",
               labels = date_format("%b %Y")) +
  scale_y_continuous(breaks = 0.01*seq(-20, 20, 0.5),
                     labels = percent_format(a = .1)) +
  scale_color_identity() + add_4flags +
  theme(legend.position = c(0.75, 0.90),
        legend.title = element_blank(),
        axis.text.x = element_text(angle = 45, vjust = 1, hjust = 1))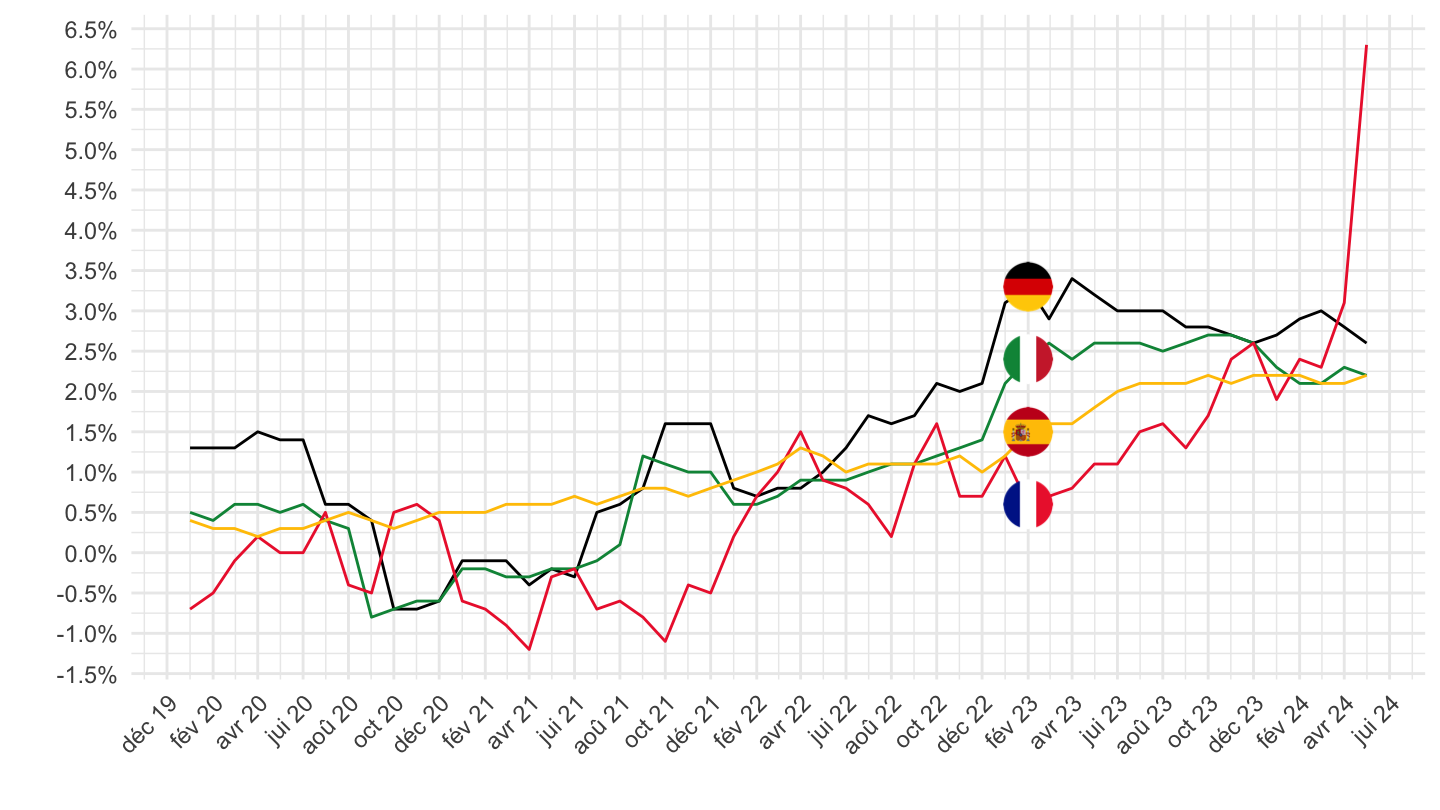
2021-
Code
prc_hicp_manr %>%
  filter(coicop == "CP06",
         geo %in% c("FR", "DE", "ES", "IT")) %>%
  month_to_date %>%
  filter(date >= as.Date("2020-01-01")) %>%
  left_join(geo, by = "geo") %>%
  left_join(colors, by = c("Geo" = "country")) %>%
  mutate(values = values/100) %>%
  ggplot(.) + geom_line(aes(x = date, y = values, color = color)) +
  theme_minimal() + xlab("") + ylab("") +
  scale_x_date(breaks = "2 months",
               labels = date_format("%b %Y")) +
  scale_y_continuous(breaks = 0.01*seq(-20, 20, 0.5),
                     labels = percent_format(a = .1)) +
  scale_color_identity() + add_4flags +
  theme(legend.position = c(0.75, 0.90),
        legend.title = element_blank(),
        axis.text.x = element_text(angle = 45, vjust = 1, hjust = 1))
2 years
Code
prc_hicp_manr %>%
  filter(coicop == "CP06",
         geo %in% c("FR", "DE", "ES", "IT")) %>%
  month_to_date %>%
  filter(date >= Sys.Date() - years(2)) %>%
  left_join(geo, by = "geo") %>%
  left_join(colors, by = c("Geo" = "country")) %>%
  mutate(values = values/100) %>%
  ggplot(.) + geom_line(aes(x = date, y = values, color = color)) +
  theme_minimal() + xlab("") + ylab("") +
  scale_x_date(breaks = "2 months",
               labels = date_format("%b %Y")) +
  scale_y_continuous(breaks = 0.01*seq(-20, 40, 1),
                     labels = percent_format(a = 1)) +
  scale_color_identity() + add_4flags +
  theme(legend.position = c(0.75, 0.90),
        legend.title = element_blank(),
        axis.text.x = element_text(angle = 45, vjust = 1, hjust = 1))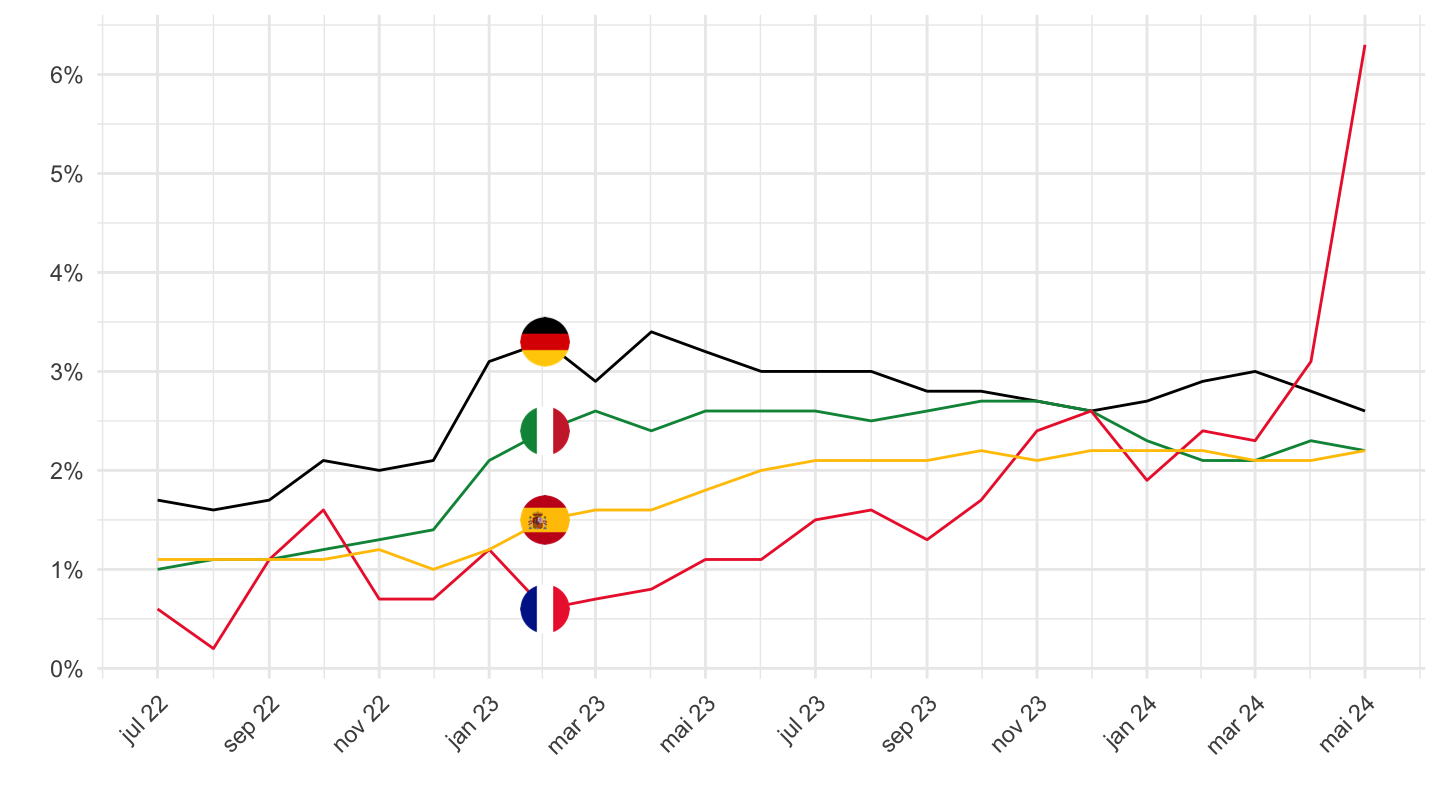
CP063
2020-
Code
prc_hicp_manr %>%
  filter(coicop == "CP0612",
         geo %in% c("FR", "DE", "ES", "IT")) %>%
  month_to_date %>%
  filter(date >= as.Date("2020-01-01")) %>%
  left_join(geo, by = "geo") %>%
  left_join(colors, by = c("Geo" = "country")) %>%
  mutate(values = values/100) %>%
  ggplot(.) + geom_line(aes(x = date, y = values, color = color)) +
  theme_minimal() + xlab("") + ylab("CP0612 - Other medical products") +
  scale_x_date(breaks = "3 months",
               labels = date_format("%b %Y")) +
  scale_y_continuous(breaks = 0.01*seq(-40, 20, 2),
                     labels = percent_format(a = 1)) +
  scale_color_identity() + add_4flags +
  theme(legend.position = c(0.75, 0.90),
        legend.title = element_blank(),
        axis.text.x = element_text(angle = 45, vjust = 1, hjust = 1))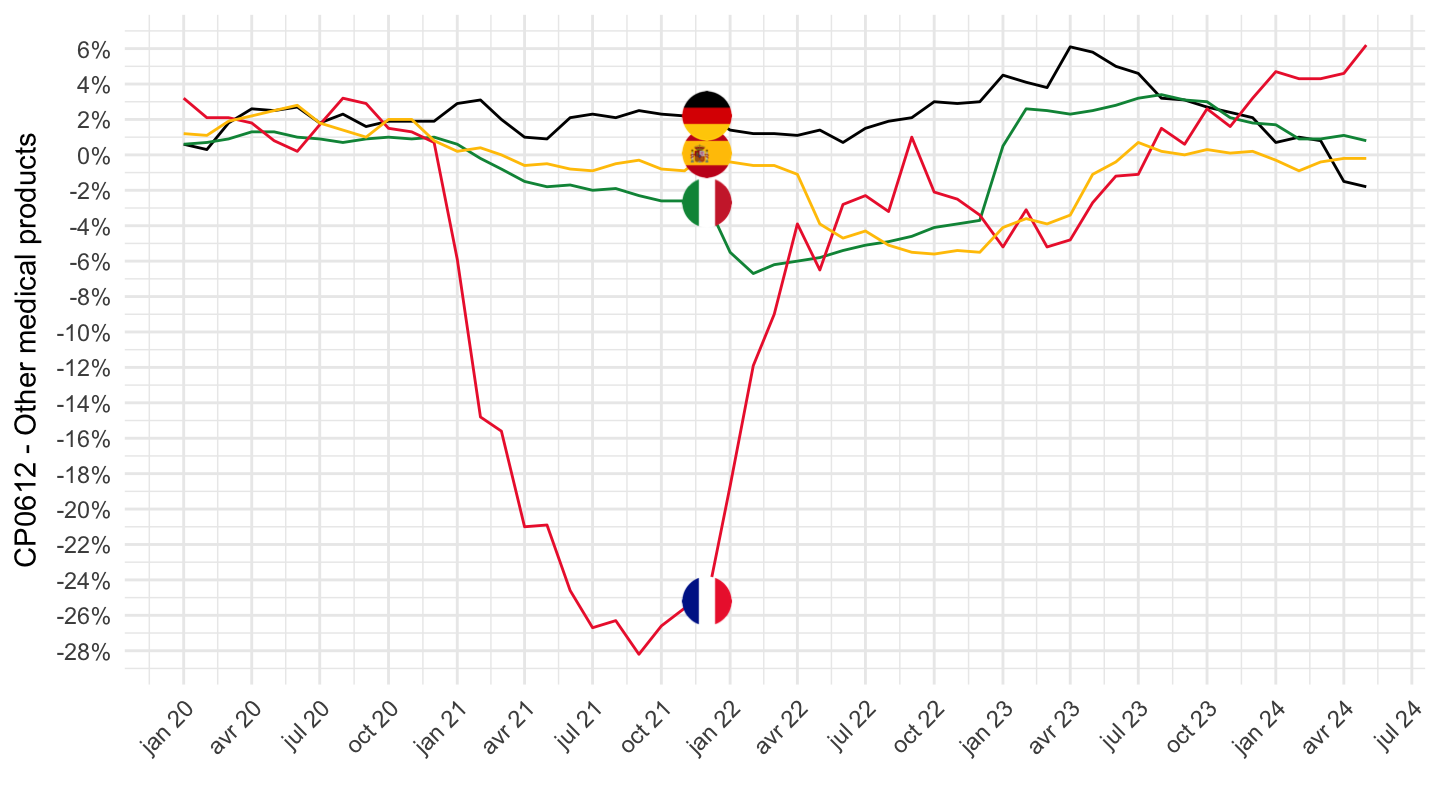
2 years
Code
prc_hicp_manr %>%
  filter(coicop == "CP063",
         geo %in% c("FR", "DE", "ES", "IT")) %>%
  month_to_date %>%
  filter(date >= Sys.Date() - years(2)) %>%
  left_join(geo, by = "geo") %>%
  left_join(colors, by = c("Geo" = "country")) %>%
  mutate(values = values/100) %>%
  ggplot(.) + geom_line(aes(x = date, y = values, color = color)) +
  theme_minimal() + xlab("") + ylab("") +
  scale_x_date(breaks = "2 months",
               labels = date_format("%b %Y")) +
  scale_y_continuous(breaks = 0.01*seq(-20, 40, 1),
                     labels = percent_format(a = 1)) +
  scale_color_identity() + add_4flags +
  theme(legend.position = c(0.75, 0.90),
        legend.title = element_blank(),
        axis.text.x = element_text(angle = 45, vjust = 1, hjust = 1))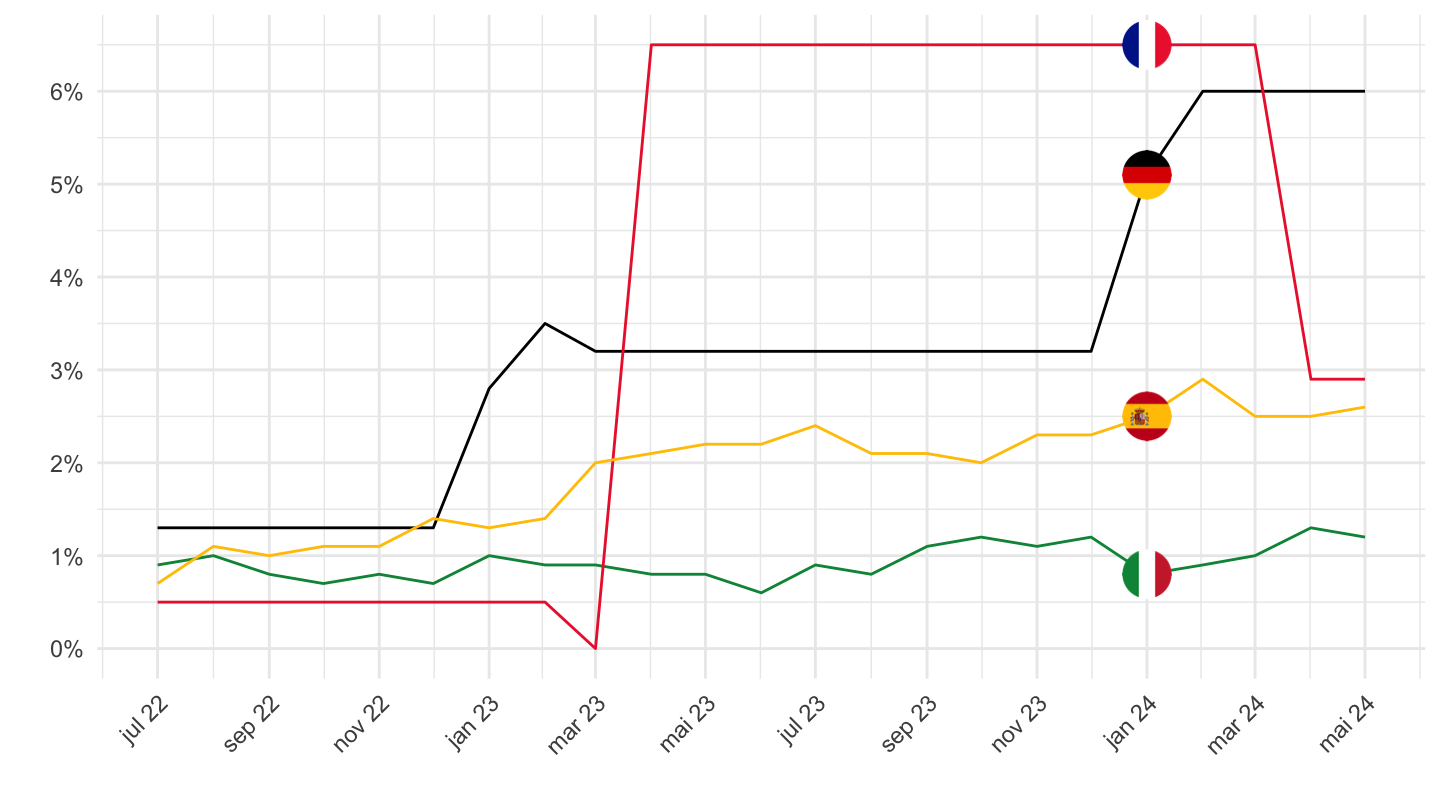
CP07 - Transport
2016-
Code
prc_hicp_manr %>%
  filter(coicop == "CP07",
         geo %in% c("FR", "DE", "ES", "IT")) %>%
  month_to_date %>%
  filter(date >= as.Date("2016-01-01")) %>%
  left_join(geo, by = "geo") %>%
  left_join(colors, by = c("Geo" = "country")) %>%
  mutate(values = values/100) %>%
  ggplot(.) + geom_line(aes(x = date, y = values, color = color)) +
  theme_minimal() + xlab("") + ylab("") +
  scale_x_date(breaks = seq(1960, 2100, 1) %>% paste0("-01-01") %>% as.Date,
               labels = date_format("%Y")) +
  scale_y_continuous(breaks = 0.01*seq(-20, 20, 1),
                     labels = percent_format(a = 1)) +
  scale_color_identity() + add_4flags +
  theme(legend.position = c(0.75, 0.90),
        legend.title = element_blank())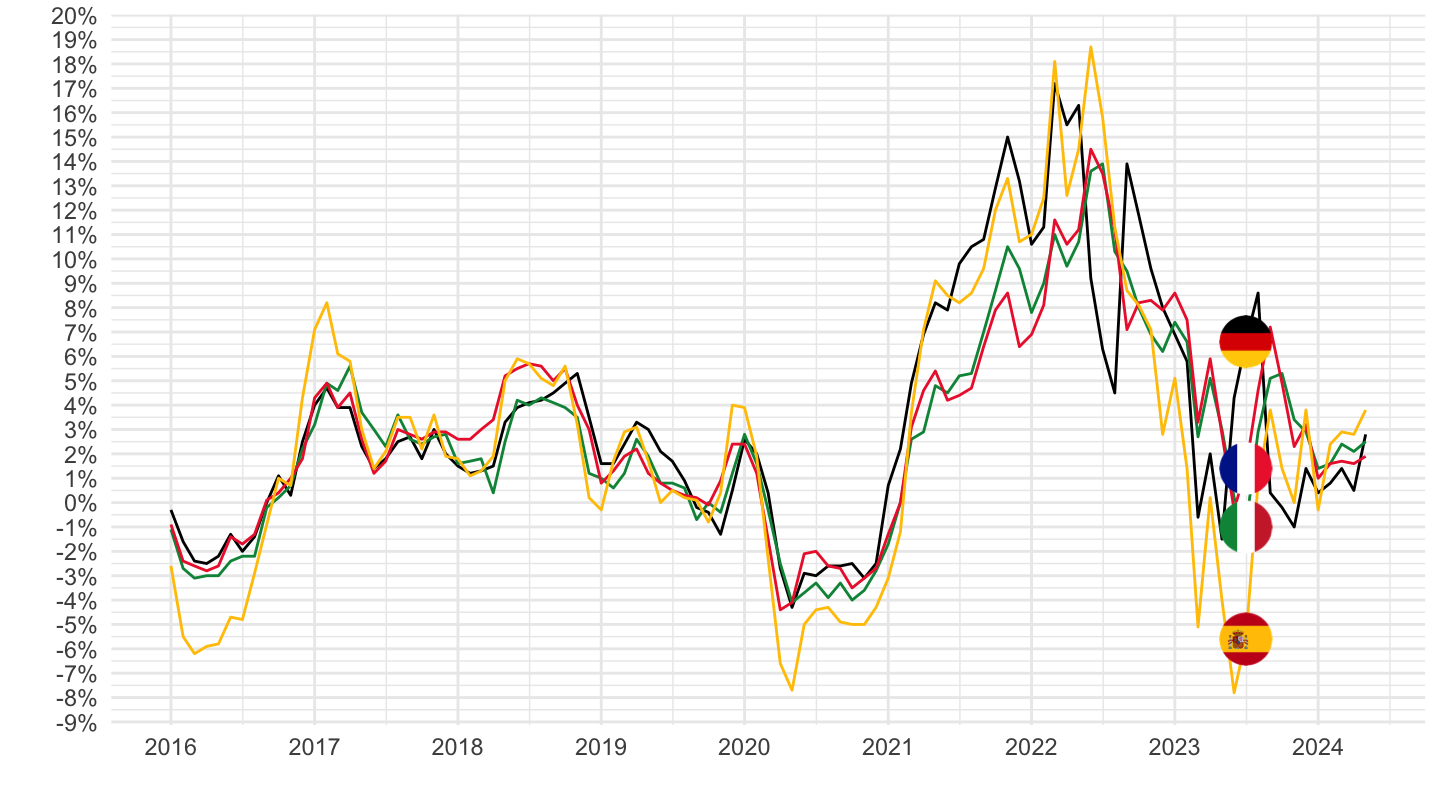
2021-
Code
prc_hicp_manr %>%
  filter(coicop == "CP07",
         geo %in% c("FR", "DE", "ES", "IT")) %>%
  month_to_date %>%
  filter(date >= as.Date("2021-01-01")) %>%
  left_join(geo, by = "geo") %>%
  left_join(colors, by = c("Geo" = "country")) %>%
  mutate(values = values/100) %>%
  ggplot(.) + geom_line(aes(x = date, y = values, color = color)) +
  theme_minimal() + xlab("") + ylab("") +
  scale_x_date(breaks = "2 months",
               labels = date_format("%b %Y")) +
  scale_y_continuous(breaks = 0.01*seq(-20, 20, 2),
                     labels = percent_format(a = 1)) +
  scale_color_identity() + add_4flags +
  theme(legend.position = c(0.75, 0.90),
        legend.title = element_blank(),
        axis.text.x = element_text(angle = 45, vjust = 1, hjust = 1))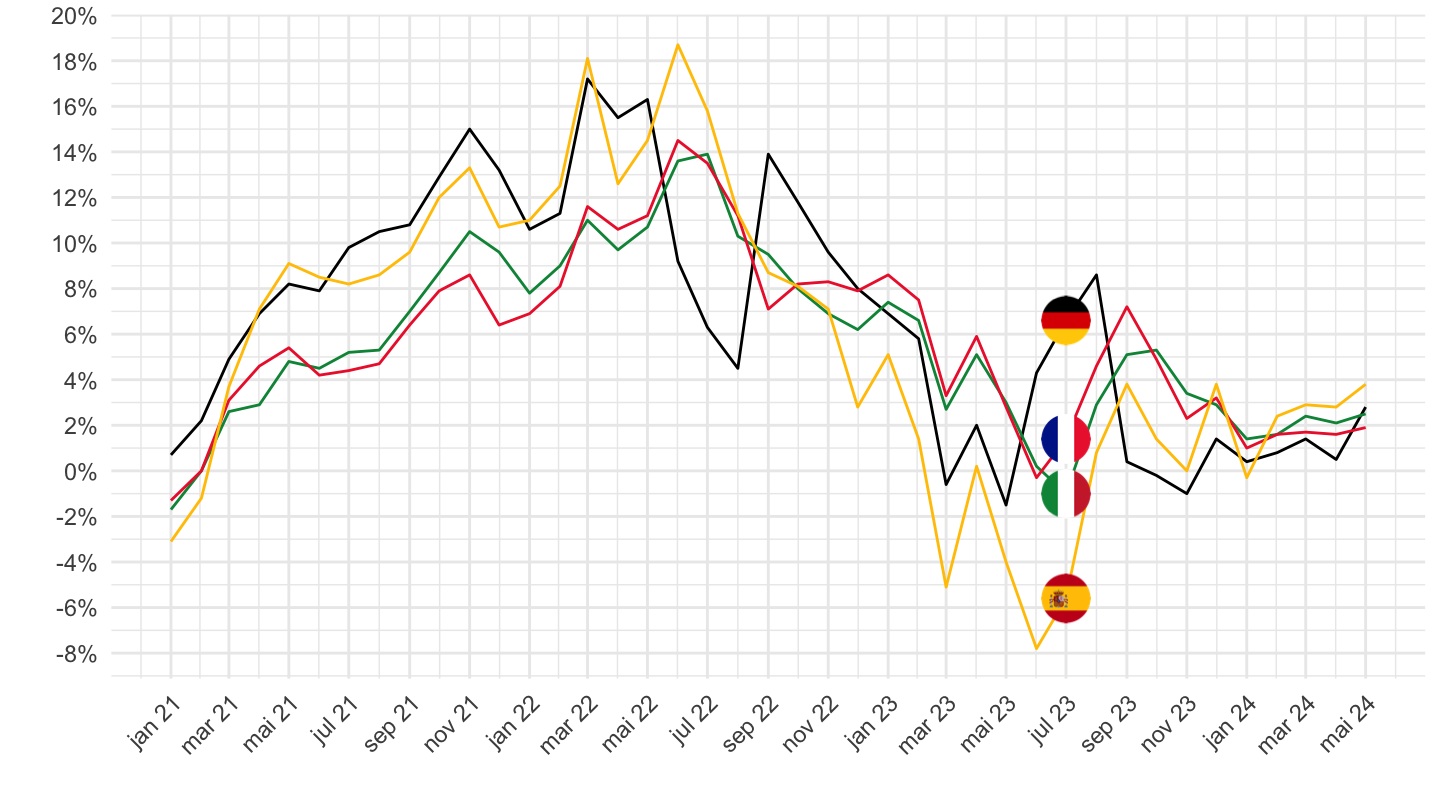
2 years
Code
prc_hicp_manr %>%
  filter(coicop == "CP07",
         geo %in% c("FR", "DE", "ES", "IT")) %>%
  month_to_date %>%
  filter(date >= Sys.Date() - years(2)) %>%
  left_join(geo, by = "geo") %>%
  left_join(colors, by = c("Geo" = "country")) %>%
  mutate(values = values/100) %>%
  ggplot(.) + geom_line(aes(x = date, y = values, color = color)) +
  theme_minimal() + xlab("") + ylab("") +
  scale_x_date(breaks = "2 months",
               labels = date_format("%b %Y")) +
  scale_y_continuous(breaks = 0.01*seq(-20, 20, 2),
                     labels = percent_format(a = 1)) +
  scale_color_identity() + add_4flags +
  theme(legend.position = c(0.75, 0.90),
        legend.title = element_blank(),
        axis.text.x = element_text(angle = 45, vjust = 1, hjust = 1))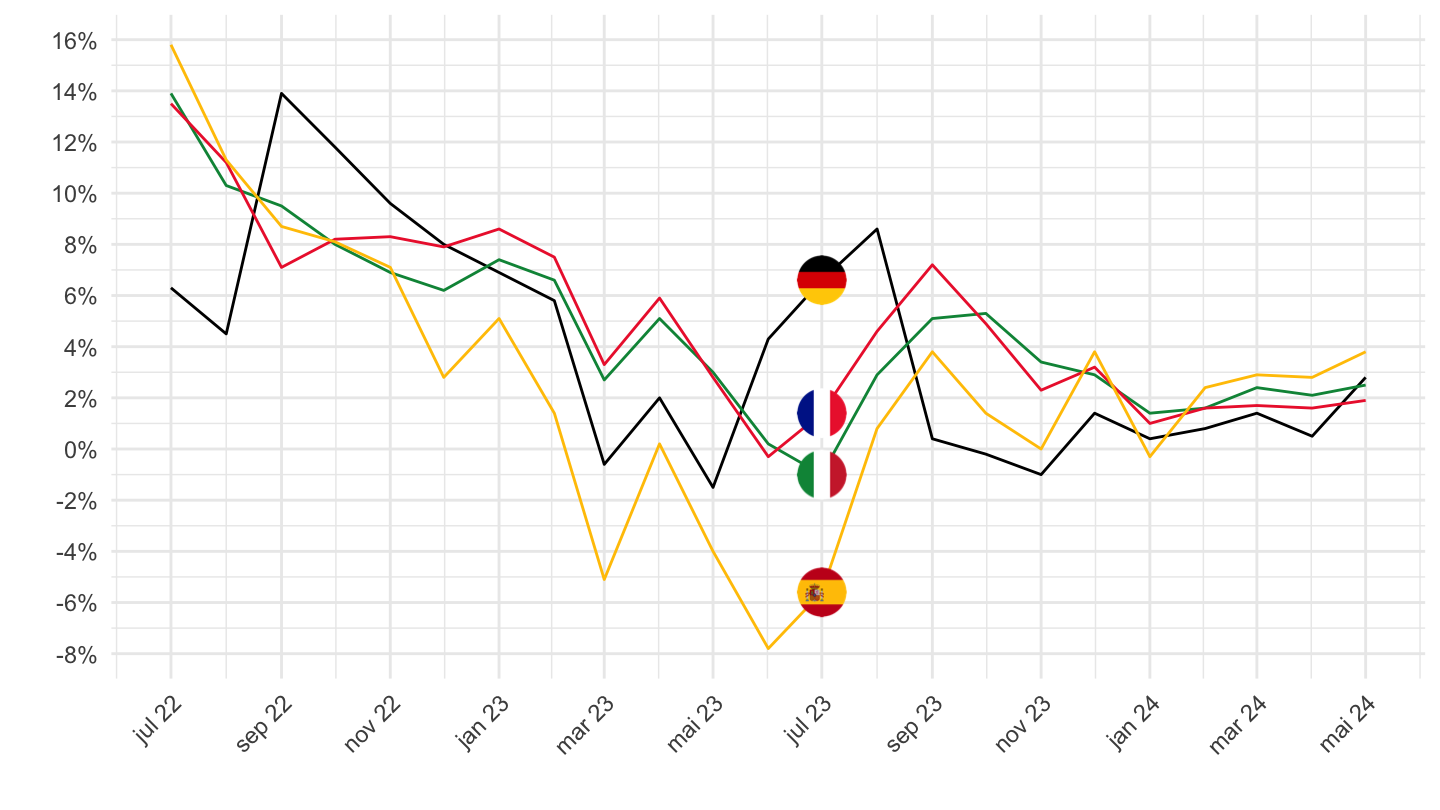
CP08 - Communications
2016-
Code
prc_hicp_manr %>%
  filter(coicop == "CP08",
         geo %in% c("FR", "DE", "ES", "IT")) %>%
  month_to_date %>%
  filter(date >= as.Date("2016-01-01")) %>%
  left_join(geo, by = "geo") %>%
  left_join(colors, by = c("Geo" = "country")) %>%
  mutate(values = values/100) %>%
  ggplot(.) + geom_line(aes(x = date, y = values, color = color)) +
  theme_minimal() + xlab("") + ylab("") +
  scale_x_date(breaks = seq(1960, 2100, 1) %>% paste0("-01-01") %>% as.Date,
               labels = date_format("%Y")) +
  scale_y_continuous(breaks = 0.01*seq(-20, 20, 1),
                     labels = percent_format(a = 1)) +
  scale_color_identity() + add_4flags +
  theme(legend.position = c(0.75, 0.90),
        legend.title = element_blank())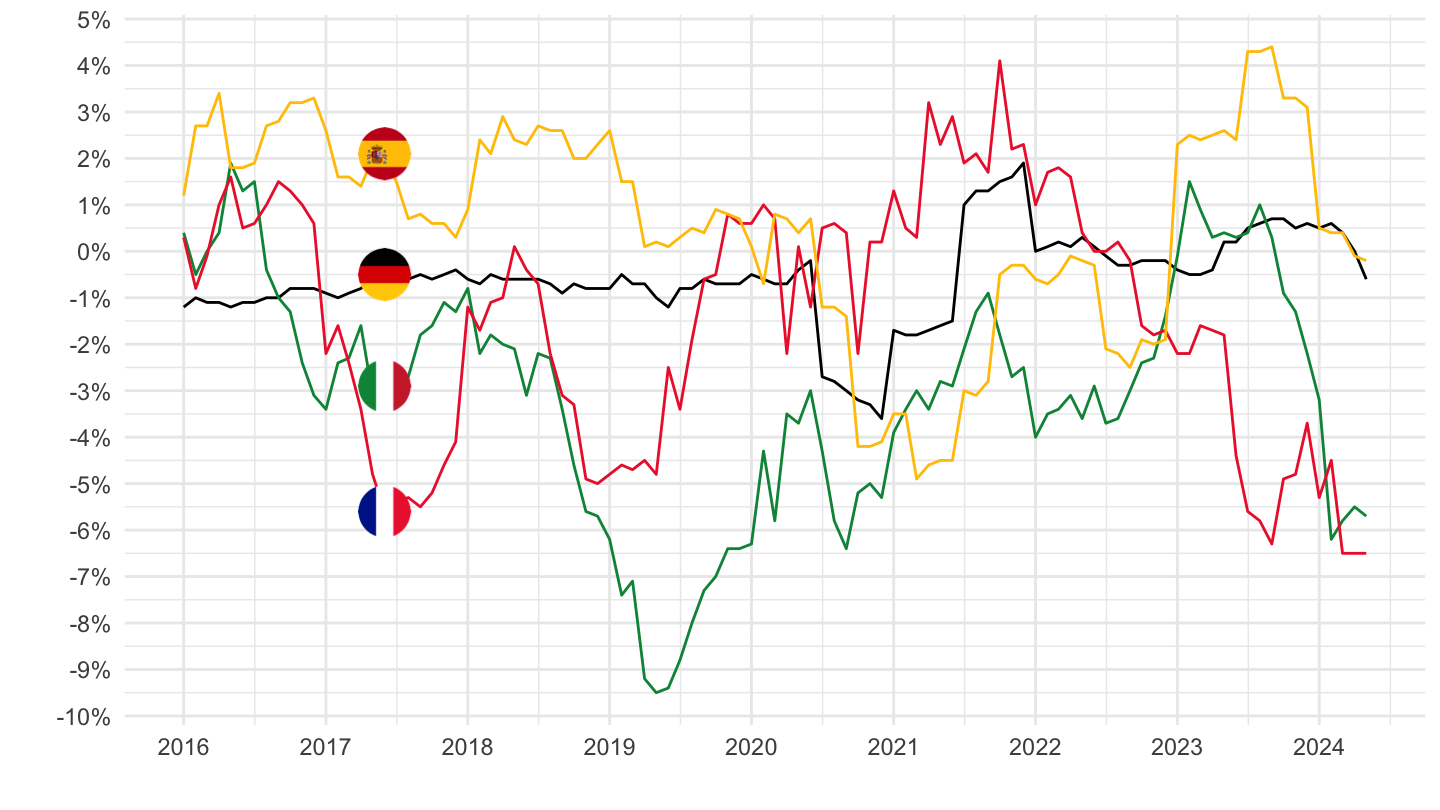
2 years
Code
prc_hicp_manr %>%
  filter(coicop == "CP08",
         geo %in% c("FR", "DE", "ES", "IT")) %>%
  month_to_date %>%
  filter(date >= Sys.Date() - years(2)) %>%
  left_join(geo, by = "geo") %>%
  left_join(colors, by = c("Geo" = "country")) %>%
  mutate(values = values/100) %>%
  ggplot(.) + geom_line(aes(x = date, y = values, color = color)) +
  theme_minimal() + xlab("") + ylab("") +
  scale_x_date(breaks = "2 months",
               labels = date_format("%b %Y")) +
  scale_y_continuous(breaks = 0.01*seq(-20, 20, 2),
                     labels = percent_format(a = 1)) +
  scale_color_identity() + add_4flags +
  theme(legend.position = c(0.75, 0.90),
        legend.title = element_blank(),
        axis.text.x = element_text(angle = 45, vjust = 1, hjust = 1))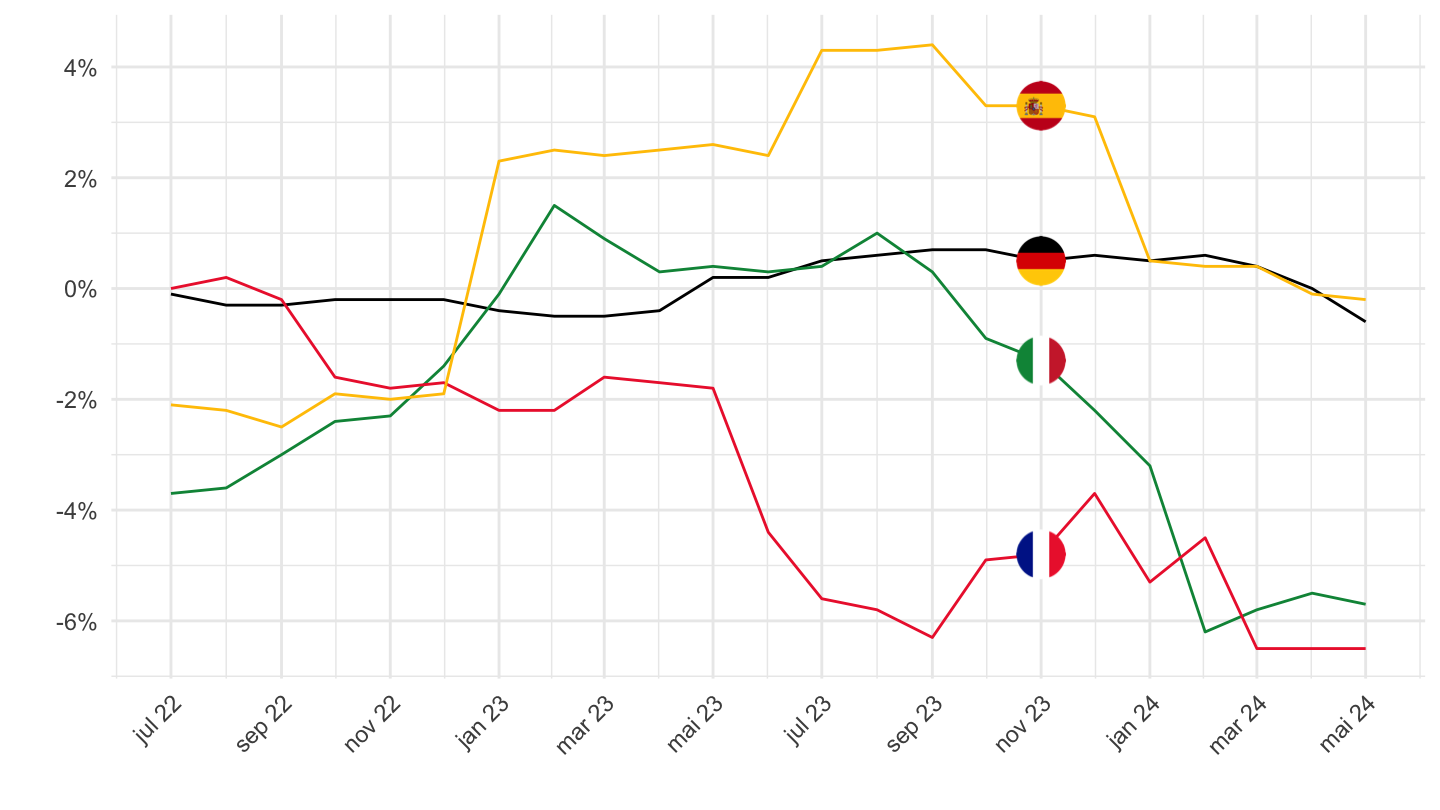
CP09 - Recreation and culture
2016-
Code
prc_hicp_manr %>%
  filter(coicop == "CP09",
         geo %in% c("FR", "DE", "ES", "IT")) %>%
  month_to_date %>%
  filter(date >= as.Date("2016-01-01")) %>%
  left_join(geo, by = "geo") %>%
  left_join(colors, by = c("Geo" = "country")) %>%
  mutate(values = values/100) %>%
  ggplot(.) + geom_line(aes(x = date, y = values, color = color)) +
  theme_minimal() + xlab("") + ylab("") +
  scale_x_date(breaks = seq(1960, 2100, 1) %>% paste0("-01-01") %>% as.Date,
               labels = date_format("%Y")) +
  scale_y_continuous(breaks = 0.01*seq(-20, 20, 1),
                     labels = percent_format(a = 1)) +
  scale_color_identity() + add_4flags +
  theme(legend.position = c(0.75, 0.90),
        legend.title = element_blank())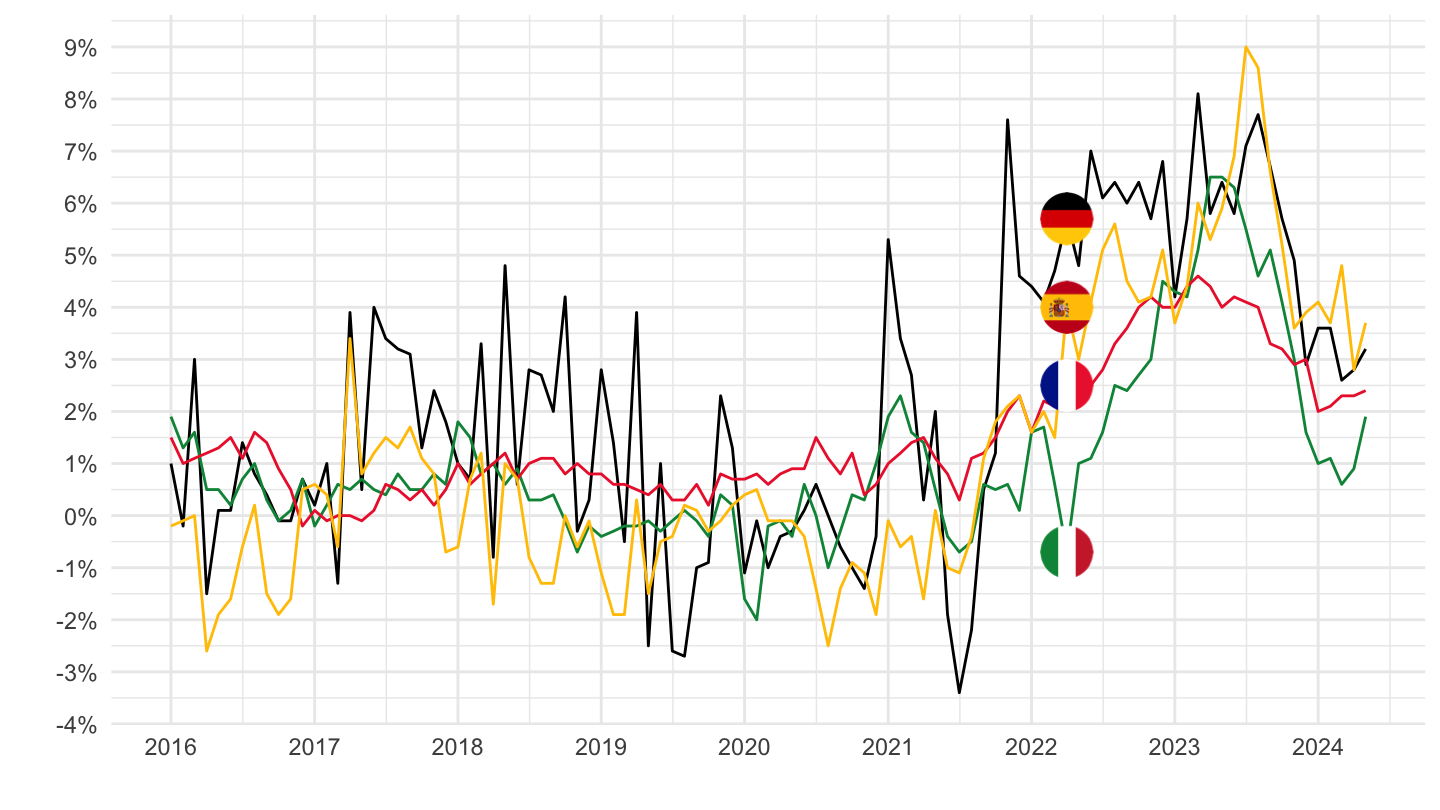
2 years
Code
prc_hicp_manr %>%
  filter(coicop == "CP09",
         geo %in% c("FR", "DE", "ES", "IT")) %>%
  month_to_date %>%
  filter(date >= Sys.Date() - years(2)) %>%
  left_join(geo, by = "geo") %>%
  left_join(colors, by = c("Geo" = "country")) %>%
  mutate(values = values/100) %>%
  ggplot(.) + geom_line(aes(x = date, y = values, color = color)) +
  theme_minimal() + xlab("") + ylab("") +
  scale_x_date(breaks = "2 months",
               labels = date_format("%b %Y")) +
  scale_y_continuous(breaks = 0.01*seq(-20, 20, 1),
                     labels = percent_format(a = 1)) +
  scale_color_identity() + add_4flags +
  theme(legend.position = c(0.75, 0.90),
        legend.title = element_blank(),
        axis.text.x = element_text(angle = 45, vjust = 1, hjust = 1))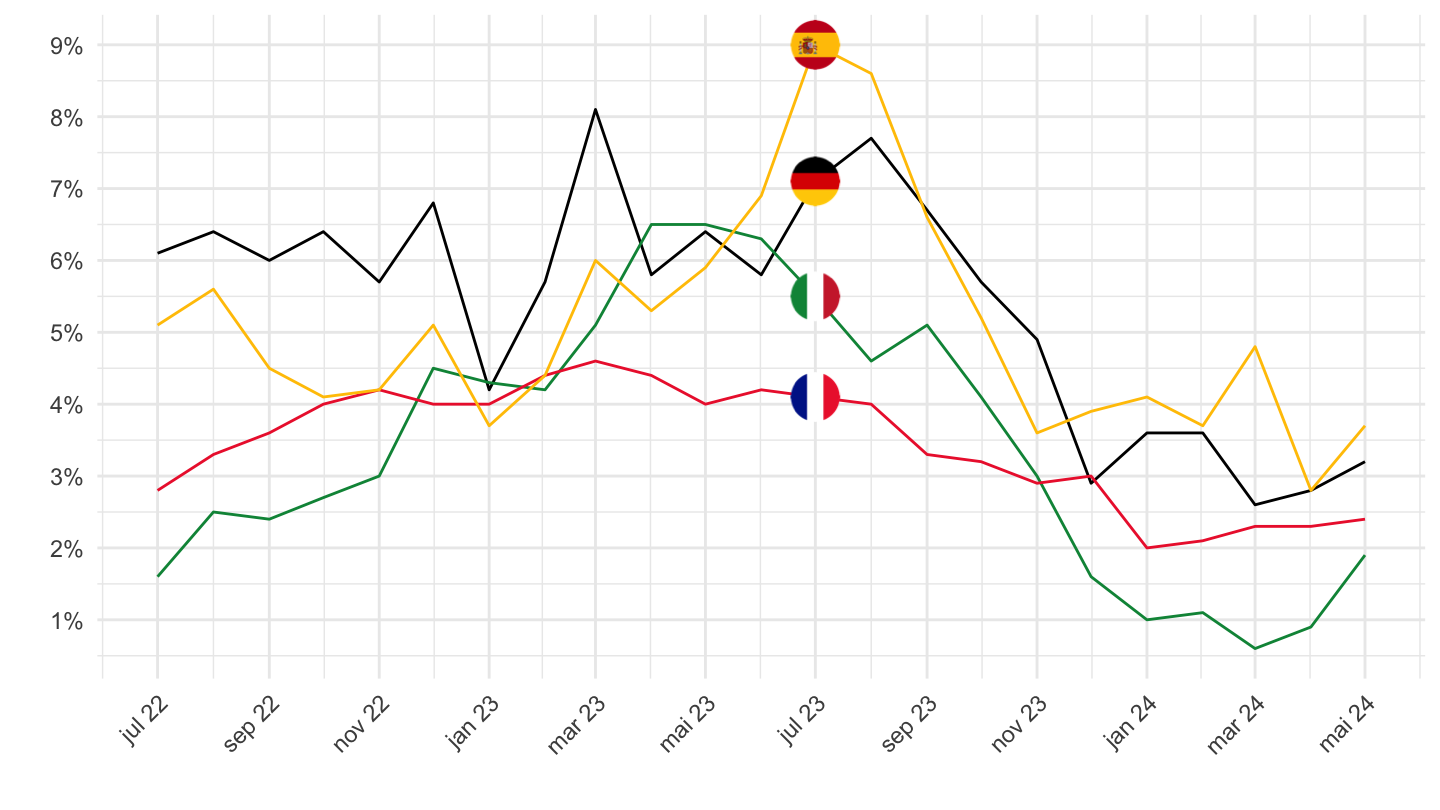
CP10 - Education
2016-
Code
prc_hicp_manr %>%
  filter(coicop == "CP10",
         geo %in% c("FR", "DE", "ES", "IT")) %>%
  month_to_date %>%
  filter(date >= as.Date("2016-01-01")) %>%
  left_join(geo, by = "geo") %>%
  left_join(colors, by = c("Geo" = "country")) %>%
  mutate(values = values/100) %>%
  ggplot(.) + geom_line(aes(x = date, y = values, color = color)) +
  theme_minimal() + xlab("") + ylab("") +
  scale_x_date(breaks = seq(1960, 2100, 1) %>% paste0("-01-01") %>% as.Date,
               labels = date_format("%Y")) +
  scale_y_continuous(breaks = 0.01*seq(-20, 20, 1),
                     labels = percent_format(a = 1)) +
  scale_color_identity() + add_4flags +
  theme(legend.position = c(0.75, 0.90),
        legend.title = element_blank())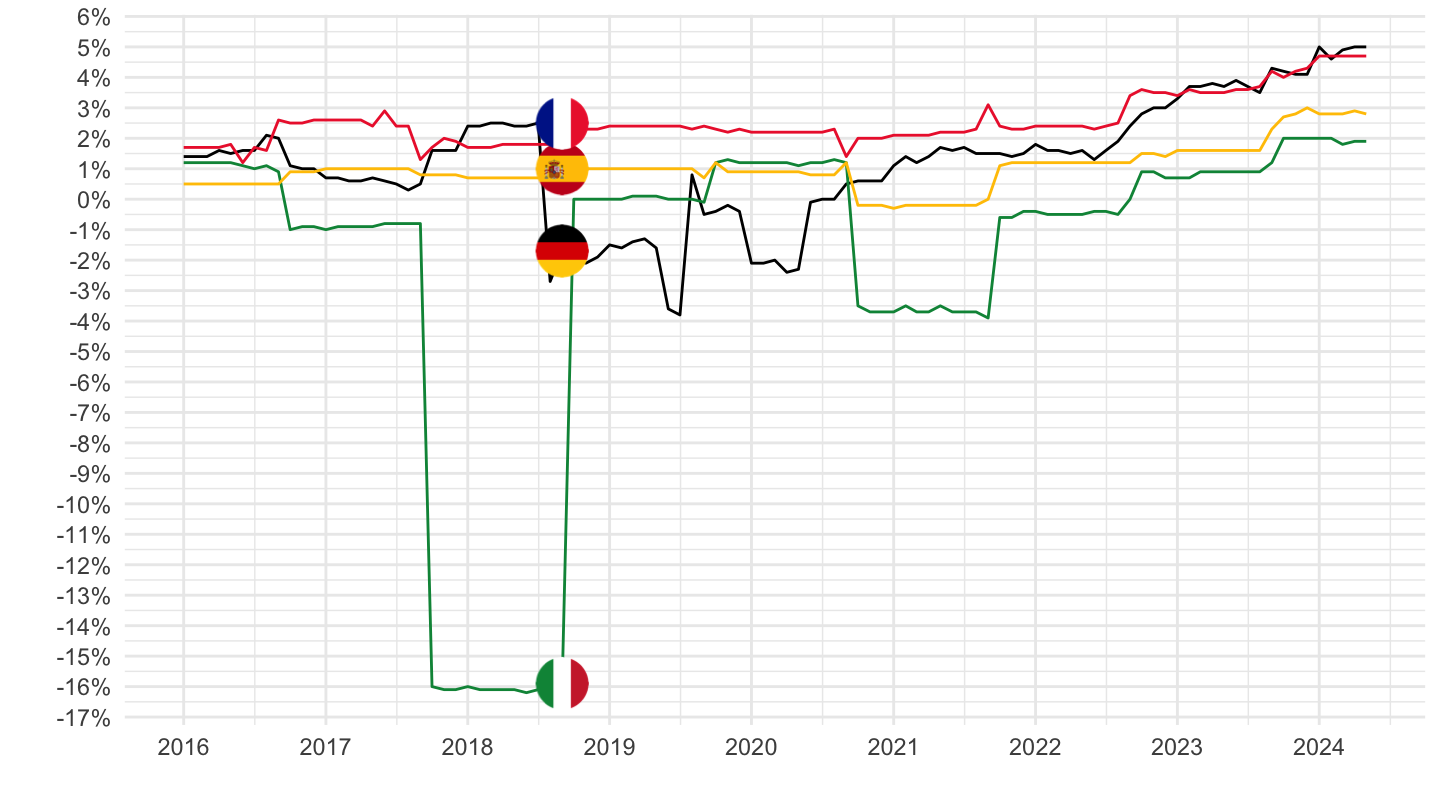
2 years
Code
prc_hicp_manr %>%
  filter(coicop == "CP10",
         geo %in% c("FR", "DE", "ES", "IT")) %>%
  month_to_date %>%
  filter(date >= Sys.Date() - years(2)) %>%
  left_join(geo, by = "geo") %>%
  left_join(colors, by = c("Geo" = "country")) %>%
  mutate(values = values/100) %>%
  ggplot(.) + geom_line(aes(x = date, y = values, color = color)) +
  theme_minimal() + xlab("") + ylab("") +
  scale_x_date(breaks = "2 months",
               labels = date_format("%b %Y")) +
  scale_y_continuous(breaks = 0.01*seq(-20, 20, 1),
                     labels = percent_format(a = 1)) +
  scale_color_identity() + add_4flags +
  theme(legend.position = c(0.75, 0.90),
        legend.title = element_blank(),
        axis.text.x = element_text(angle = 45, vjust = 1, hjust = 1))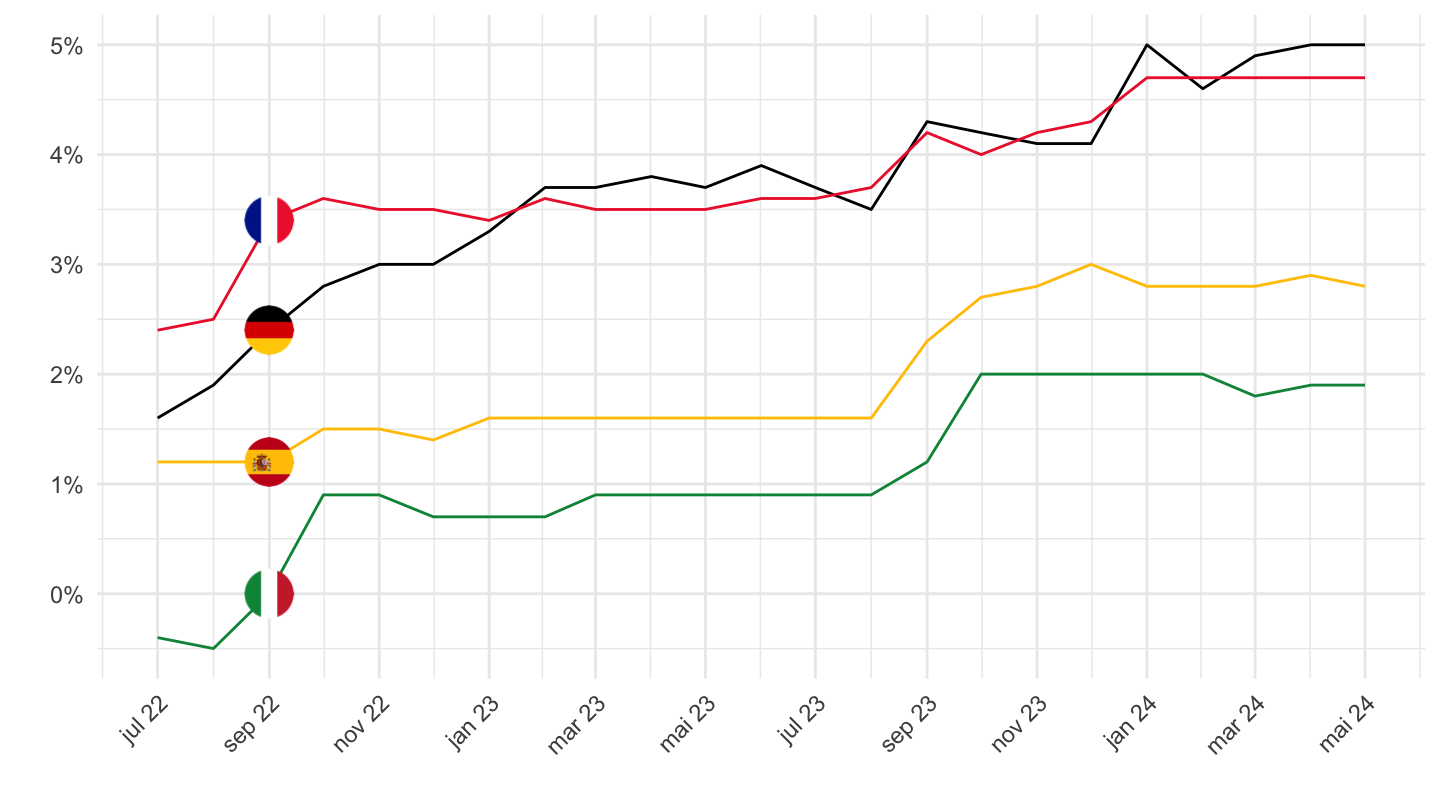
CP11 - Restaurants and hotels
2016-
Code
prc_hicp_manr %>%
  filter(coicop == "CP11",
         geo %in% c("FR", "DE", "ES", "IT")) %>%
  month_to_date %>%
  filter(date >= as.Date("2016-01-01")) %>%
  left_join(geo, by = "geo") %>%
  left_join(colors, by = c("Geo" = "country")) %>%
  mutate(values = values/100) %>%
  ggplot(.) + geom_line(aes(x = date, y = values, color = color)) +
  theme_minimal() + xlab("") + ylab("") +
  scale_x_date(breaks = seq(1960, 2100, 1) %>% paste0("-01-01") %>% as.Date,
               labels = date_format("%Y")) +
  scale_y_continuous(breaks = 0.01*seq(-20, 20, 1),
                     labels = percent_format(a = 1)) +
  scale_color_identity() + add_4flags +
  theme(legend.position = c(0.75, 0.90),
        legend.title = element_blank())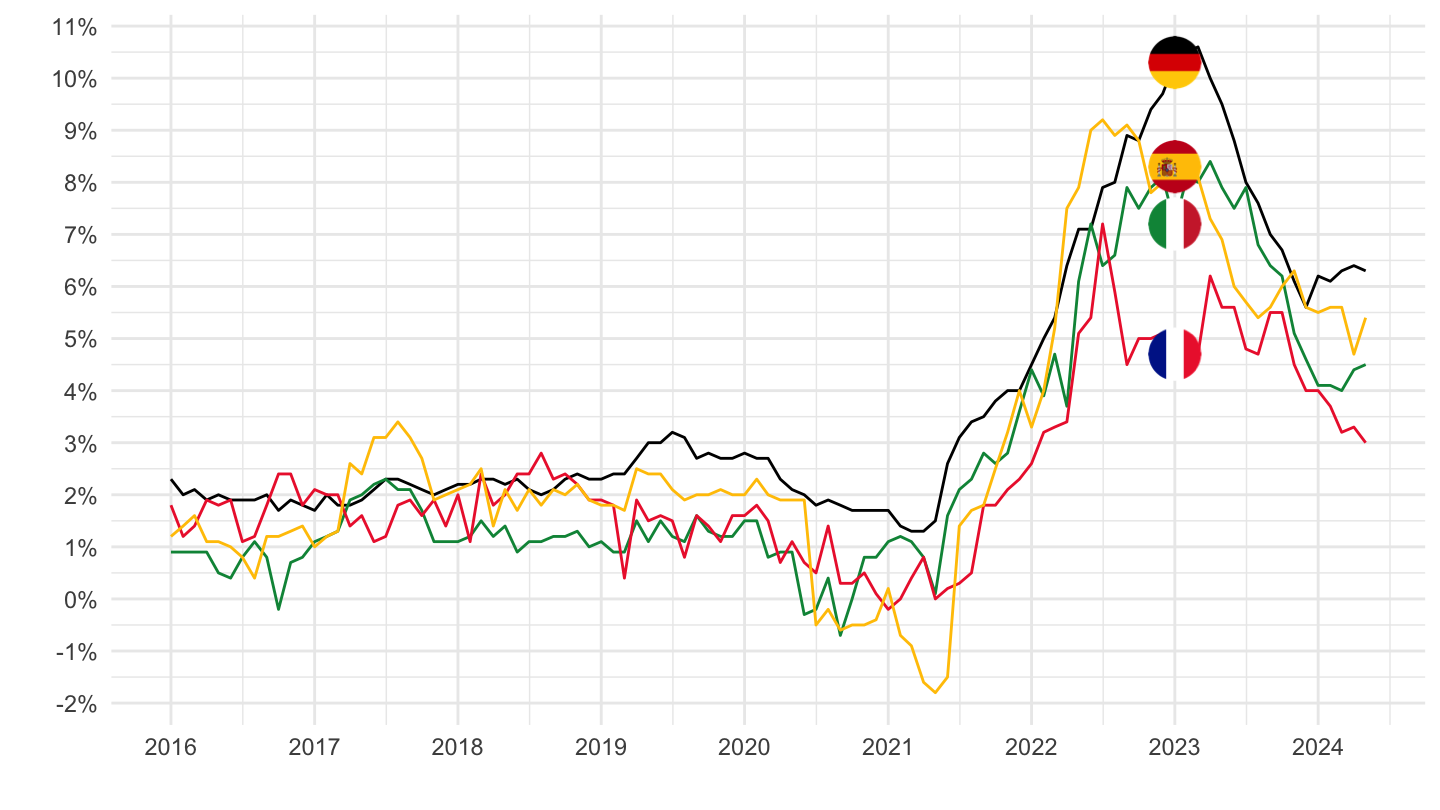
2 years
Code
prc_hicp_manr %>%
  filter(coicop == "CP11",
         geo %in% c("FR", "DE", "ES", "IT")) %>%
  month_to_date %>%
  filter(date >= Sys.Date() - years(2)) %>%
  left_join(geo, by = "geo") %>%
  left_join(colors, by = c("Geo" = "country")) %>%
  mutate(values = values/100) %>%
  ggplot(.) + geom_line(aes(x = date, y = values, color = color)) +
  theme_minimal() + xlab("") + ylab("") +
  scale_x_date(breaks = "2 months",
               labels = date_format("%b %Y")) +
  scale_y_continuous(breaks = 0.01*seq(-20, 20, 1),
                     labels = percent_format(a = 1)) +
  scale_color_identity() + add_4flags +
  theme(legend.position = c(0.75, 0.90),
        legend.title = element_blank(),
        axis.text.x = element_text(angle = 45, vjust = 1, hjust = 1))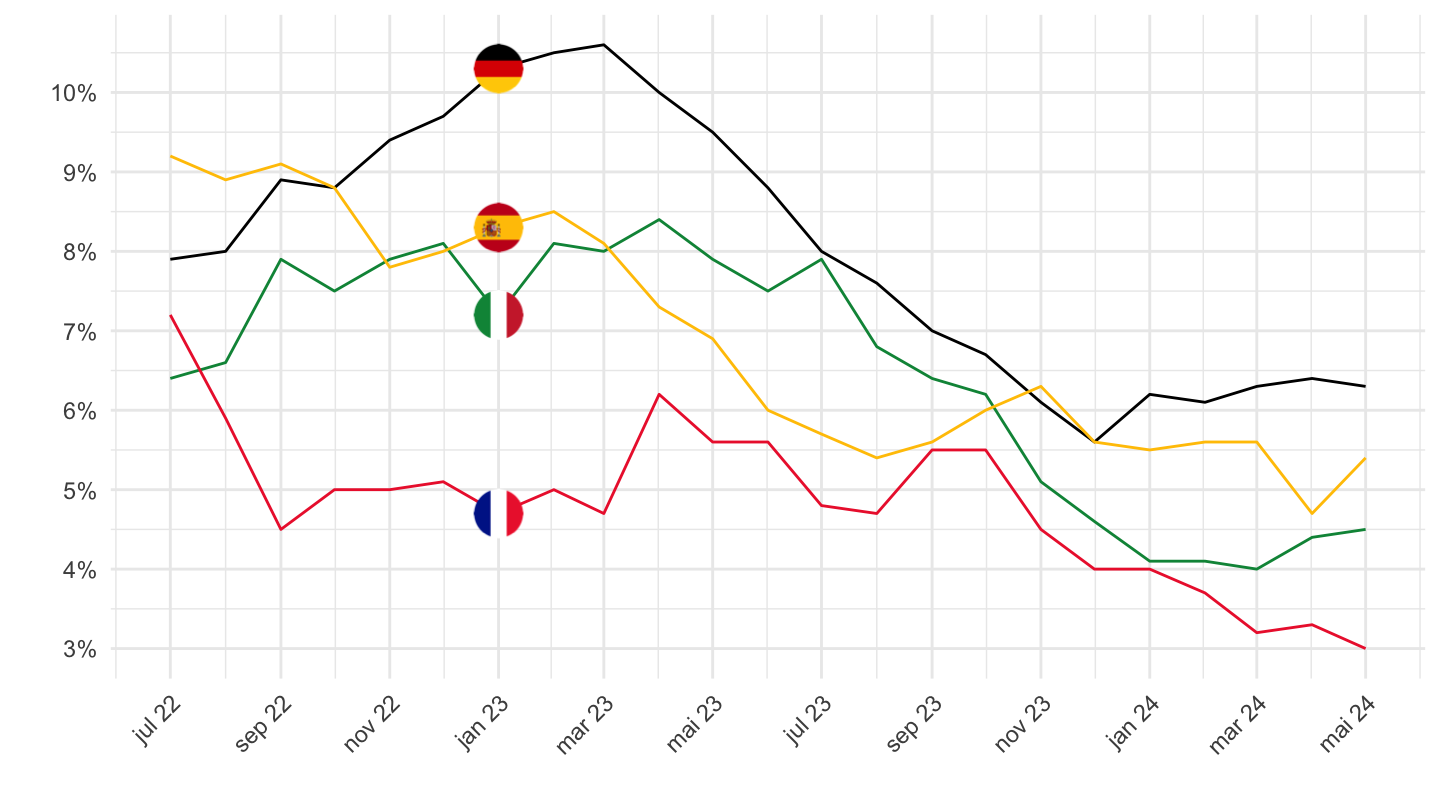
CP12 - Miscellenaous
2016-
Code
prc_hicp_manr %>%
  filter(coicop == "CP12",
         geo %in% c("FR", "DE", "ES", "IT")) %>%
  month_to_date %>%
  filter(date >= as.Date("2016-01-01")) %>%
  left_join(geo, by = "geo") %>%
  left_join(colors, by = c("Geo" = "country")) %>%
  mutate(values = values/100) %>%
  ggplot(.) + geom_line(aes(x = date, y = values, color = color)) +
  theme_minimal() + xlab("") + ylab("") +
  scale_x_date(breaks = seq(1960, 2100, 1) %>% paste0("-01-01") %>% as.Date,
               labels = date_format("%Y")) +
  scale_y_continuous(breaks = 0.01*seq(-20, 20, 1),
                     labels = percent_format(a = 1)) +
  scale_color_identity() + add_4flags +
  theme(legend.position = c(0.75, 0.90),
        legend.title = element_blank())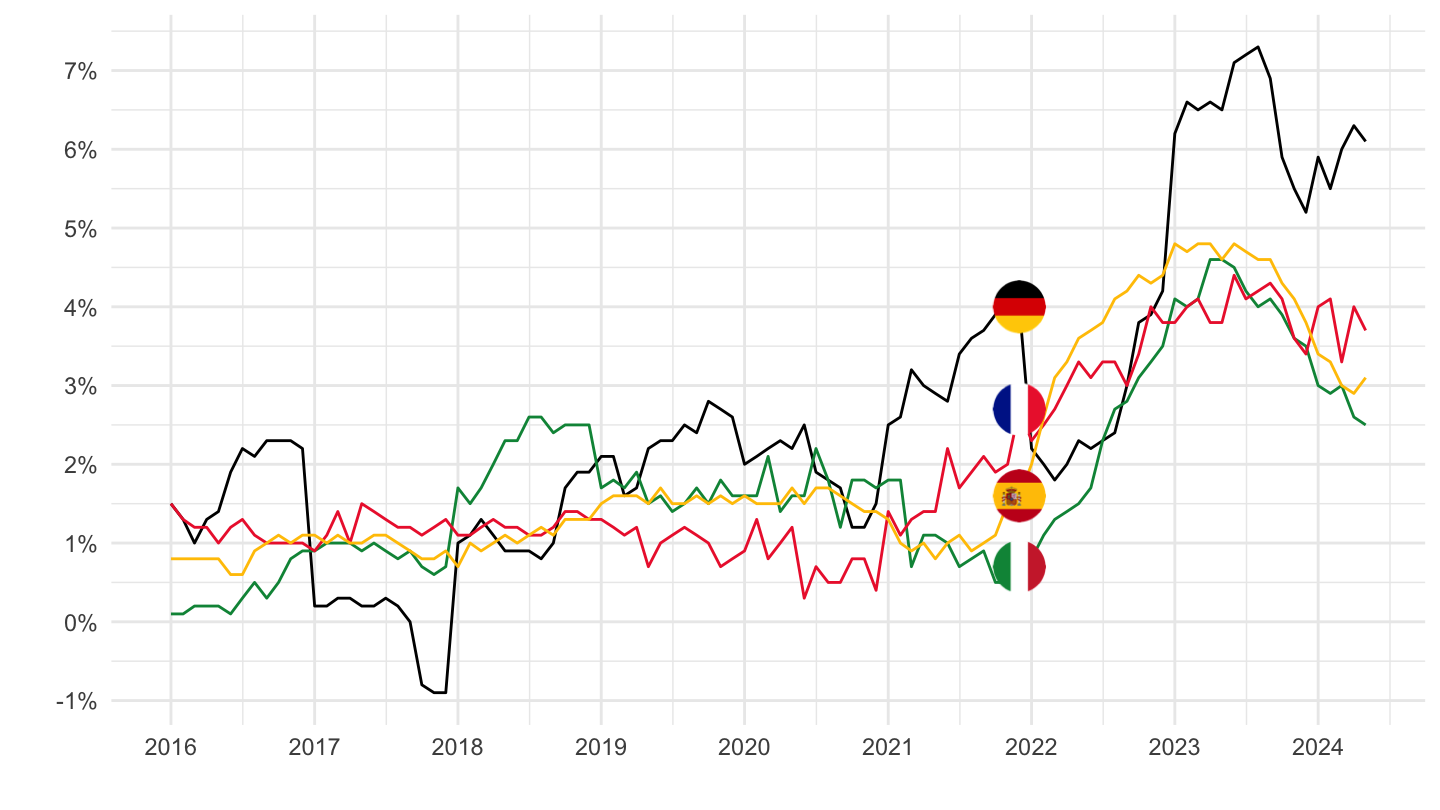
2 years
Code
prc_hicp_manr %>%
  filter(coicop == "CP12",
         geo %in% c("FR", "DE", "ES", "IT")) %>%
  month_to_date %>%
  filter(date >= Sys.Date() - years(2)) %>%
  left_join(geo, by = "geo") %>%
  left_join(colors, by = c("Geo" = "country")) %>%
  mutate(values = values/100) %>%
  ggplot(.) + geom_line(aes(x = date, y = values, color = color)) +
  theme_minimal() + xlab("") + ylab("") +
  scale_x_date(breaks = "2 months",
               labels = date_format("%b %Y")) +
  scale_y_continuous(breaks = 0.01*seq(-20, 20, 1),
                     labels = percent_format(a = 1)) +
  scale_color_identity() + add_4flags +
  theme(legend.position = c(0.75, 0.90),
        legend.title = element_blank(),
        axis.text.x = element_text(angle = 45, vjust = 1, hjust = 1))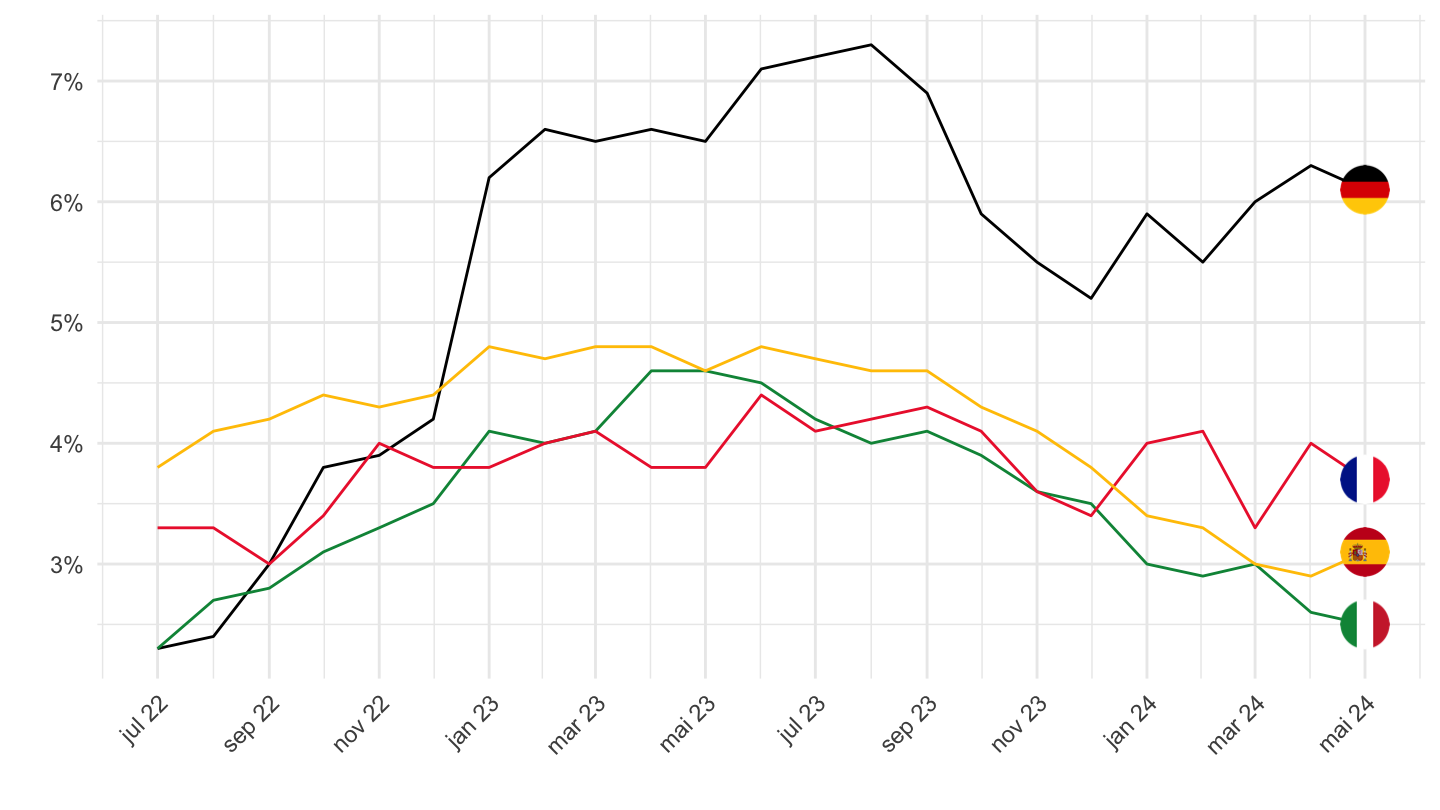
Countries
France
Code
prc_hicp_manr %>%
  filter(coicop %in% c("CP00", "CP04", "CP11", "CP01"),
         geo %in% c("FR")) %>%
  month_to_date %>%
  left_join(coicop, by = "coicop") %>%
  ggplot(.) + geom_line(aes(x = date, y = values/100, color = Coicop)) +
  theme_minimal() + xlab("") + ylab("") +
  scale_x_date(breaks = seq(1960, 2100, 2) %>% paste0("-01-01") %>% as.Date,
               labels = date_format("%Y")) +
  scale_y_continuous(breaks = 0.01*seq(-20, 20, 1),
                     labels = percent_format(a = 1)) +

  theme(legend.position = c(0.75, 0.9),
        legend.title = element_blank())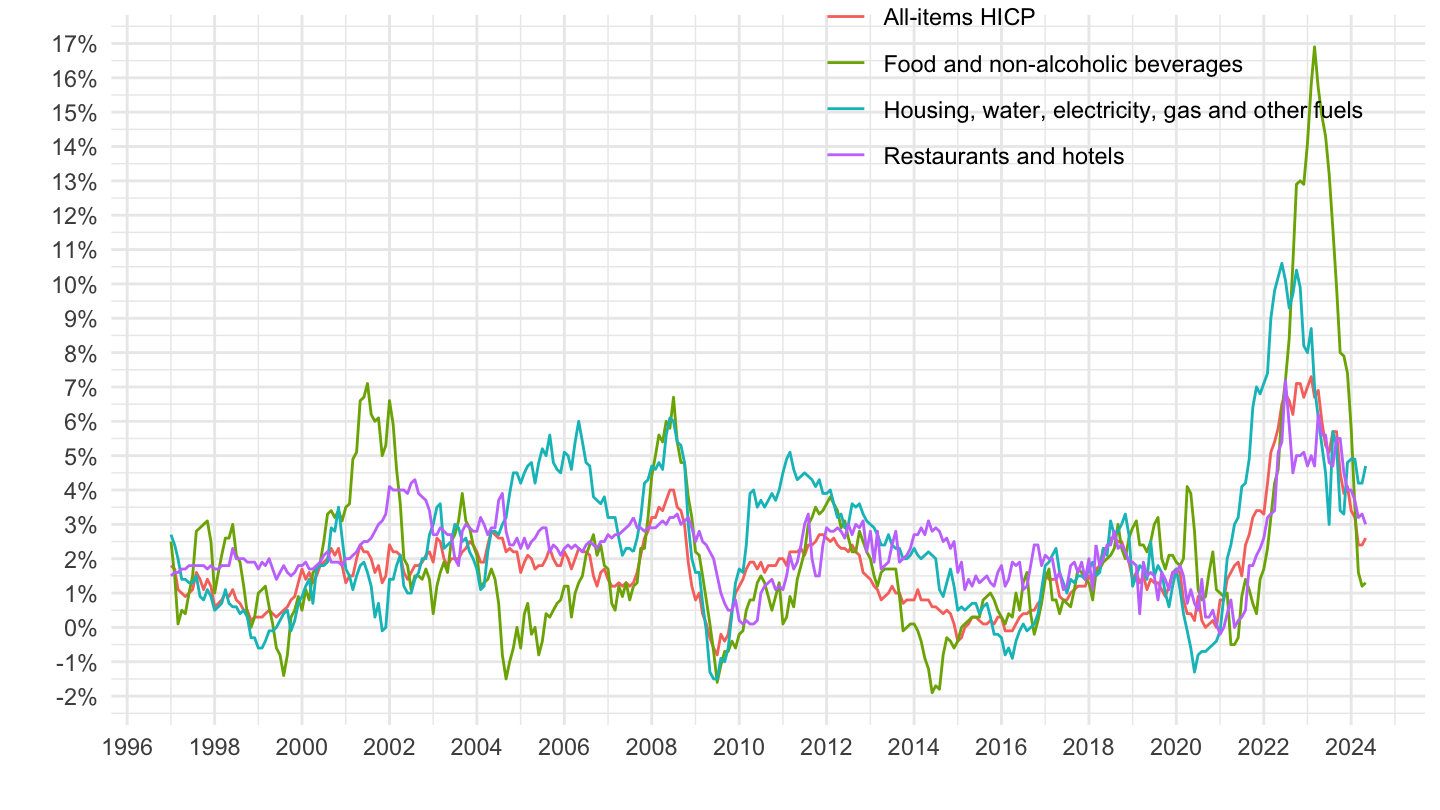
Slovakia
All
Code
prc_hicp_manr %>%
  filter(coicop %in% c("CP00", "CP04", "CP11", "CP01"),
         geo %in% c("SK")) %>%
  month_to_date %>%
  left_join(coicop, by = "coicop") %>%
  ggplot(.) + geom_line(aes(x = date, y = values/100, color = Coicop)) +
  theme_minimal() + xlab("") + ylab("") +
  scale_x_date(breaks = seq(1960, 2100, 2) %>% paste0("-01-01") %>% as.Date,
               labels = date_format("%Y")) +
  scale_y_continuous(breaks = 0.01*seq(-20, 20, 1),
                     labels = percent_format(a = 1)) +

  theme(legend.position = c(0.75, 0.9),
        legend.title = element_blank())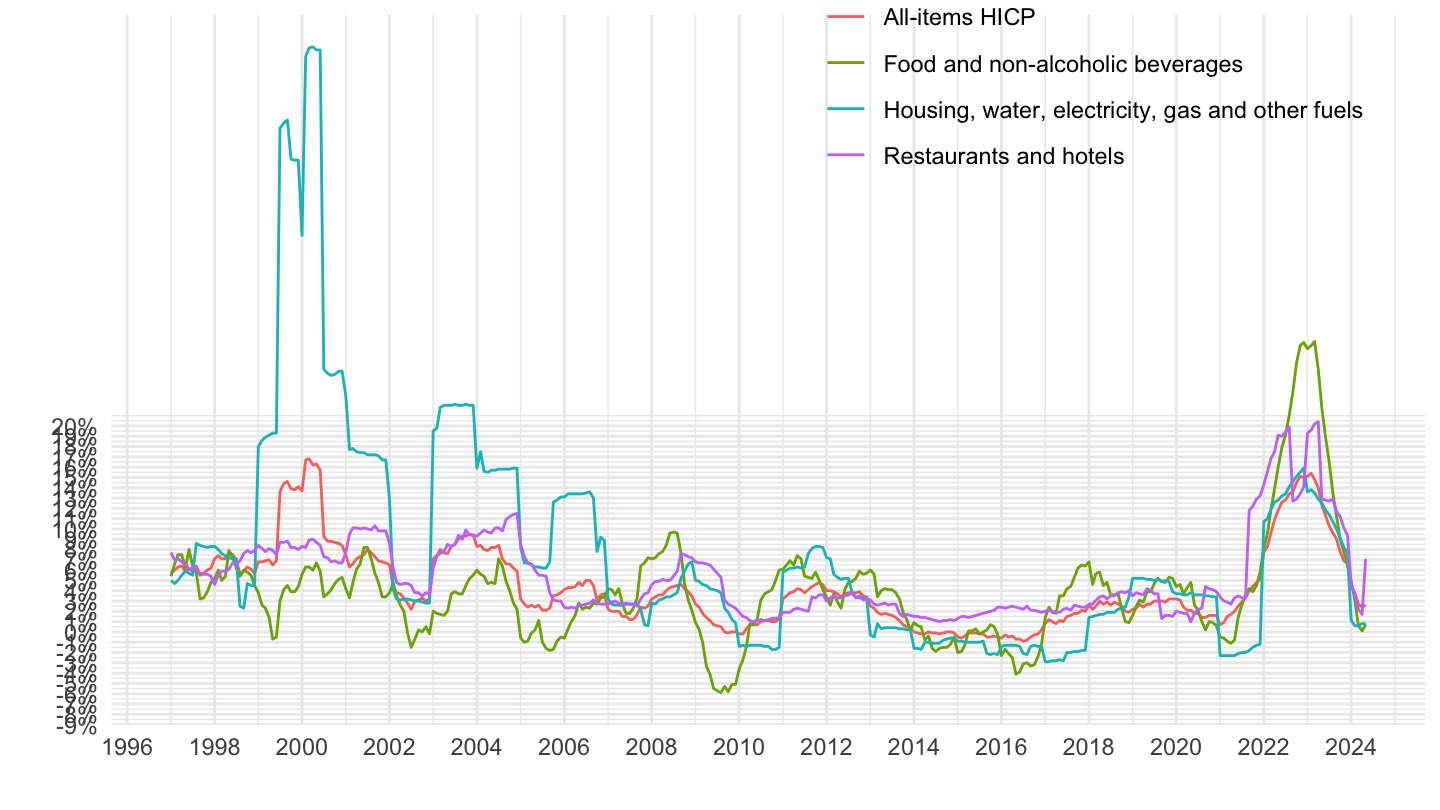
2018-
Code
prc_hicp_manr %>%
  filter(coicop %in% c("CP00", "CP04", "CP11", "CP01"),
         geo %in% c("SK")) %>%
  month_to_date %>%
  filter(date >= as.Date("2018-01-01")) %>%
  left_join(coicop, by = "coicop") %>%
  ggplot(.) + geom_line(aes(x = date, y = values/100, color = Coicop)) +
  theme_minimal() + xlab("") + ylab("") +
  scale_x_date(breaks = seq(1960, 2100, 1) %>% paste0("-01-01") %>% as.Date,
               labels = date_format("%Y")) +
  scale_y_continuous(breaks = 0.01*seq(-20, 100, 2),
                     labels = percent_format(a = 1)) +

  theme(legend.position = c(0.3, 0.8),
        legend.title = element_blank())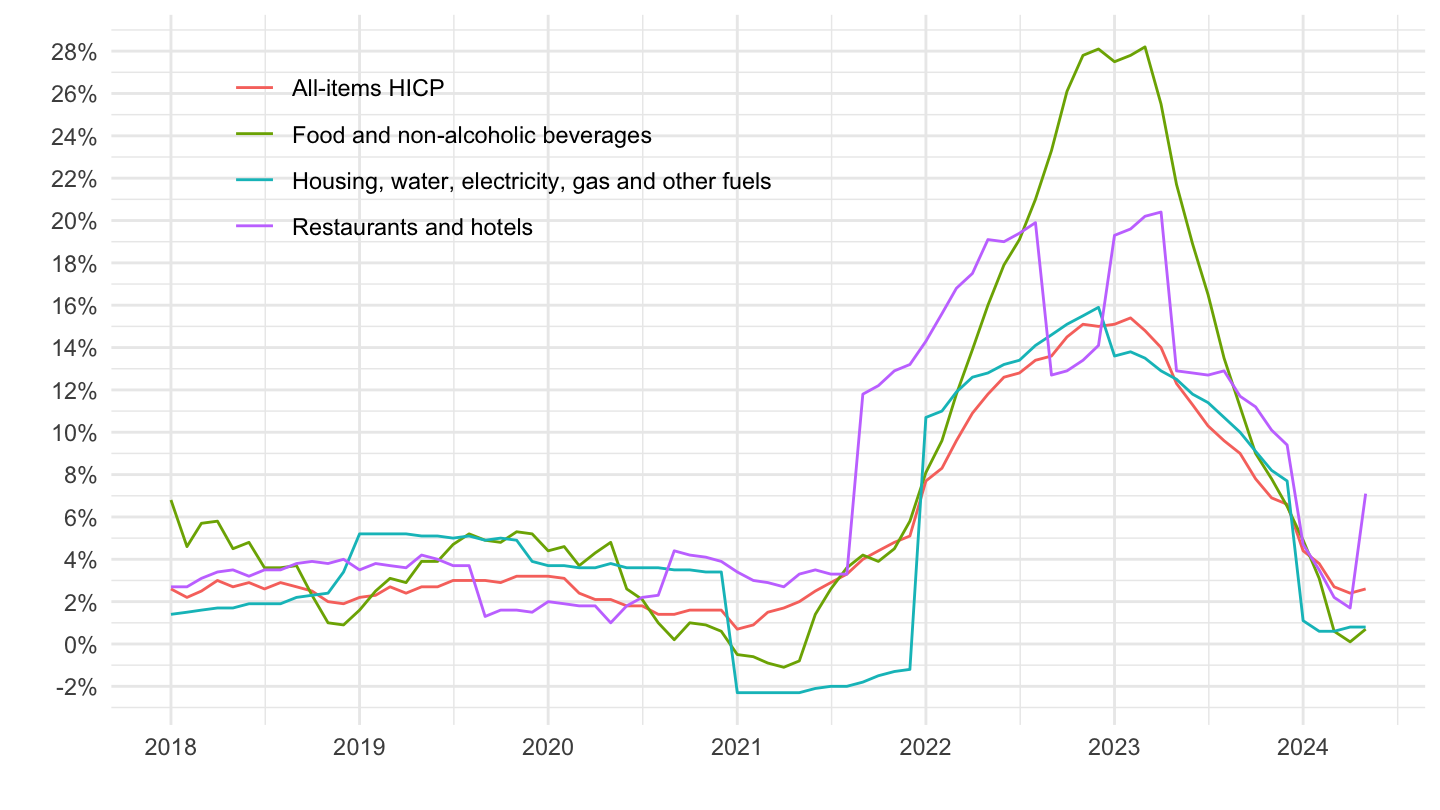
Germany
Code
prc_hicp_manr %>%
  filter(coicop %in% c("CP00", "CP04", "CP11", "CP01"),
         geo %in% c("DE")) %>%
  month_to_date %>%
  left_join(coicop, by = "coicop") %>%
  ggplot(.) + geom_line(aes(x = date, y = values/100, color = Coicop)) +
  theme_minimal() + xlab("") + ylab("") +
  scale_x_date(breaks = seq(1960, 2100, 2) %>% paste0("-01-01") %>% as.Date,
               labels = date_format("%Y")) +
  scale_y_continuous(breaks = 0.01*seq(-20, 20, 1),
                     labels = percent_format(a = 1)) +

  theme(legend.position = c(0.75, 0.9),
        legend.title = element_blank())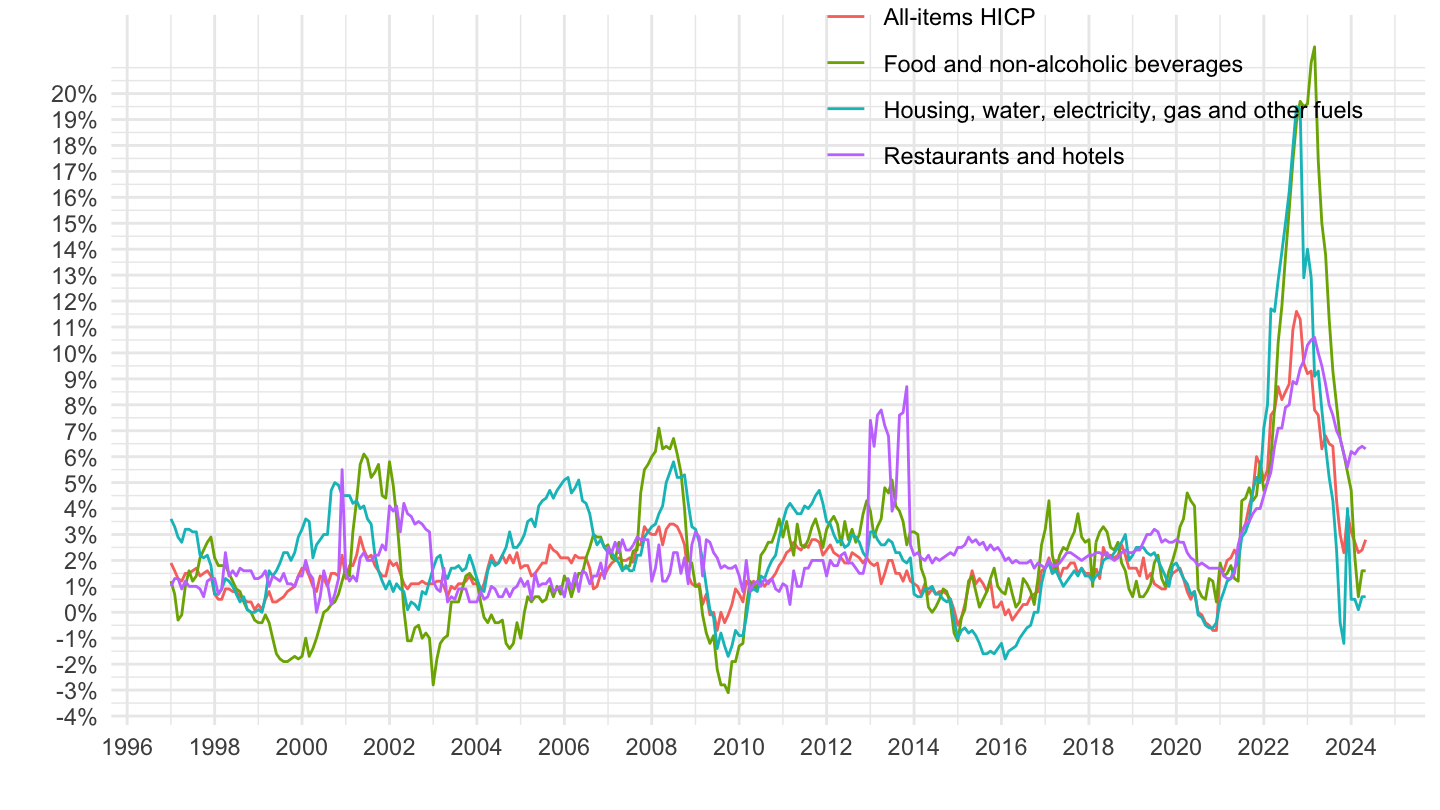
Code
prc_hicp_manr %>%
  filter(coicop %in% c("CP00", "CP04"),
         geo %in% c("DE")) %>%
  month_to_date %>%
  left_join(coicop, by = "coicop") %>%
  ggplot(.) + geom_line(aes(x = date, y = values/100, color = Coicop)) +
  theme_minimal() + xlab("") + ylab("") +
  scale_x_date(breaks = seq(1960, 2100, 2) %>% paste0("-01-01") %>% as.Date,
               labels = date_format("%Y")) +
  scale_y_continuous(breaks = 0.01*seq(-20, 20, 1),
                     labels = percent_format(a = 1)) +

  theme(legend.position = c(0.75, 0.9),
        legend.title = element_blank())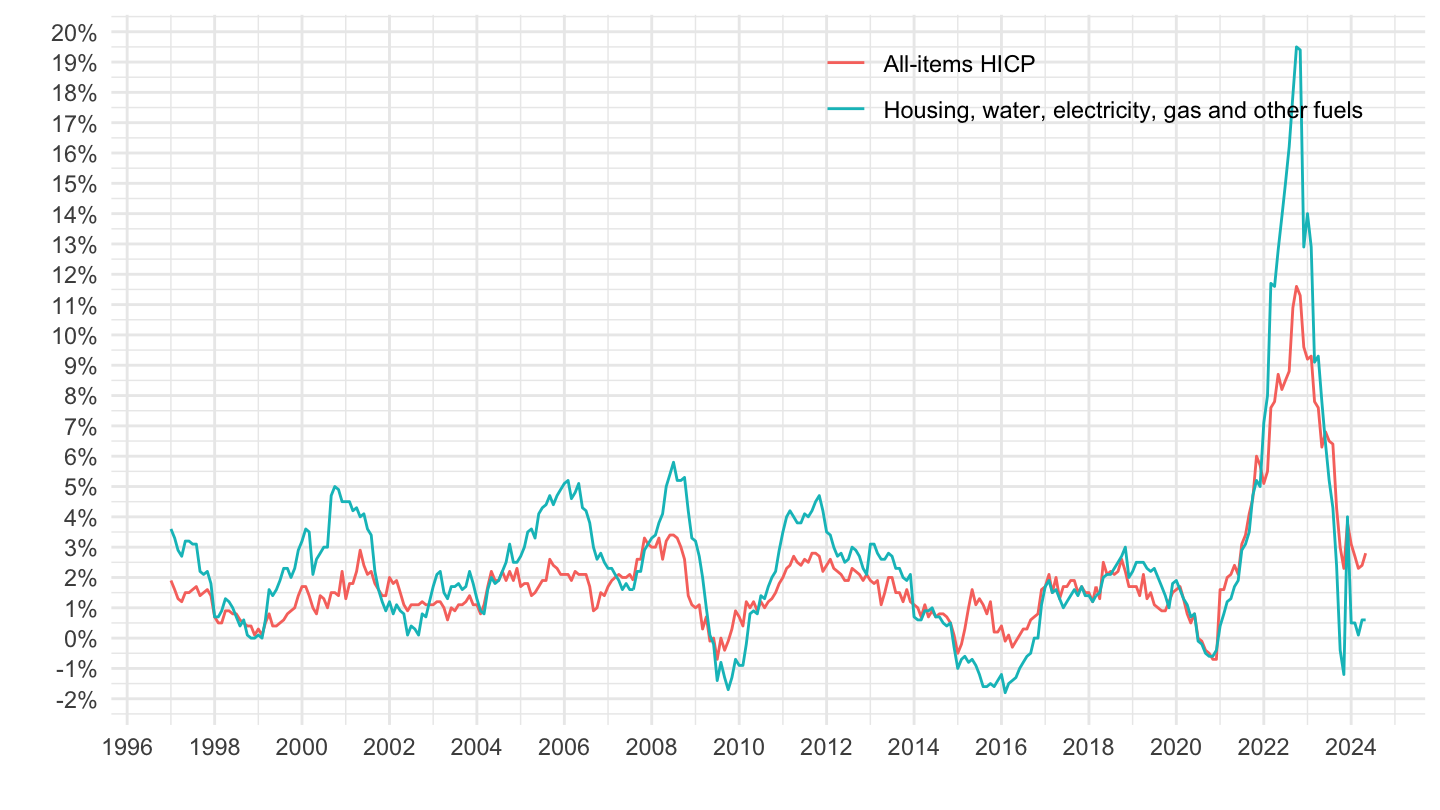
Spain
Code
prc_hicp_manr %>%
  filter(coicop %in% c("CP00", "CP04", "CP11", "CP01"),
         geo %in% c("ES")) %>%
  month_to_date %>%
  left_join(coicop, by = "coicop") %>%
  ggplot(.) + geom_line(aes(x = date, y = values/100, color = Coicop)) +
  theme_minimal() + xlab("") + ylab("") +
  scale_x_date(breaks = seq(1960, 2100, 2) %>% paste0("-01-01") %>% as.Date,
               labels = date_format("%Y")) +
  scale_y_continuous(breaks = 0.01*seq(-20, 20, 1),
                     labels = percent_format(a = 1)) +

  theme(legend.position = c(0.25, 0.8),
        legend.title = element_blank())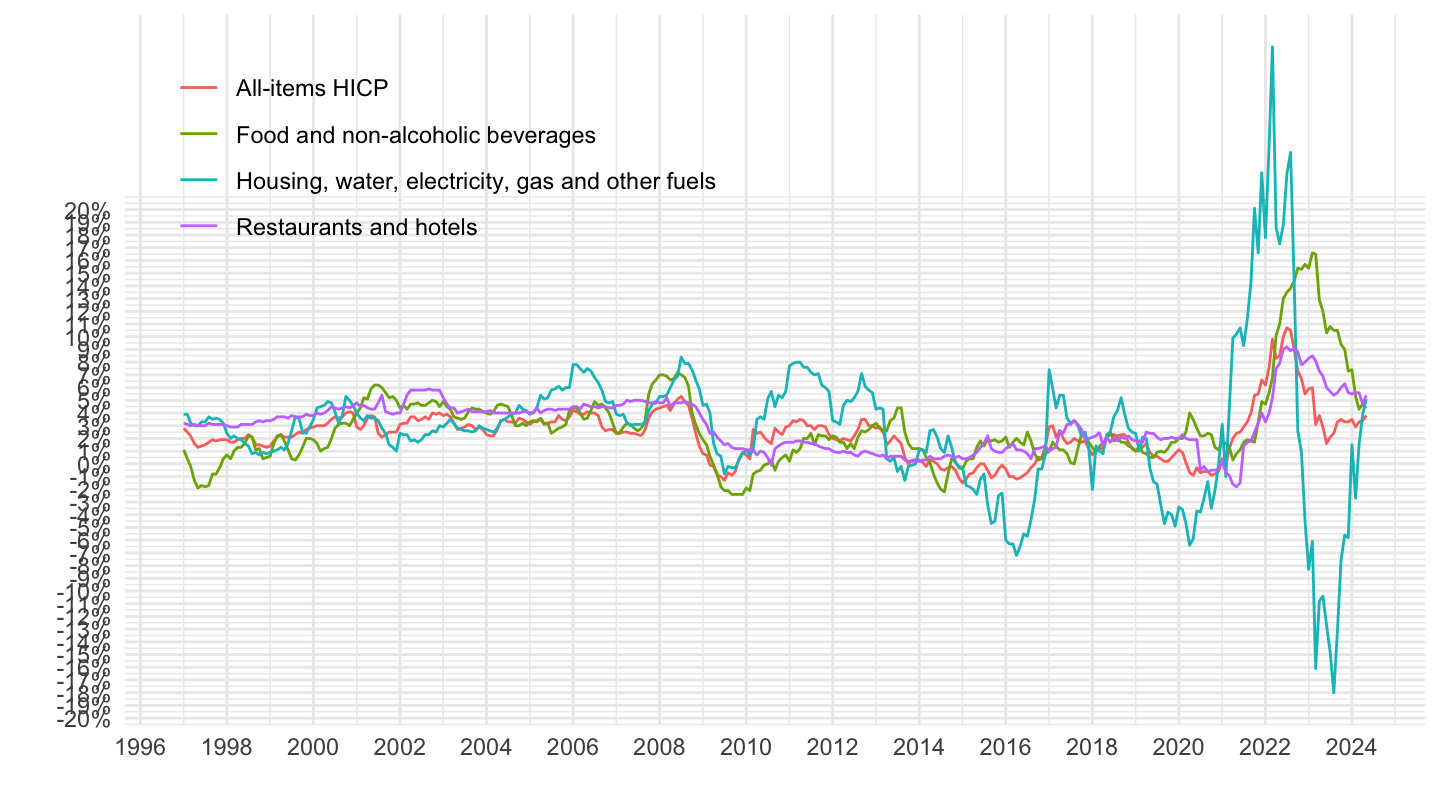
Greece
Code
prc_hicp_manr %>%
  filter(coicop %in% c("CP00", "CP04", "CP11", "CP01"),
         geo %in% c("EL")) %>%
  month_to_date %>%
  left_join(coicop, by = "coicop") %>%
  ggplot(.) + geom_line(aes(x = date, y = values/100, color = Coicop)) +
  theme_minimal() + xlab("") + ylab("") +
  scale_x_date(breaks = seq(1960, 2100, 2) %>% paste0("-01-01") %>% as.Date,
               labels = date_format("%Y")) +
  scale_y_continuous(breaks = 0.01*seq(-20, 20, 1),
                     labels = percent_format(a = 1)) +

  theme(legend.position = c(0.25, 0.2),
        legend.title = element_blank())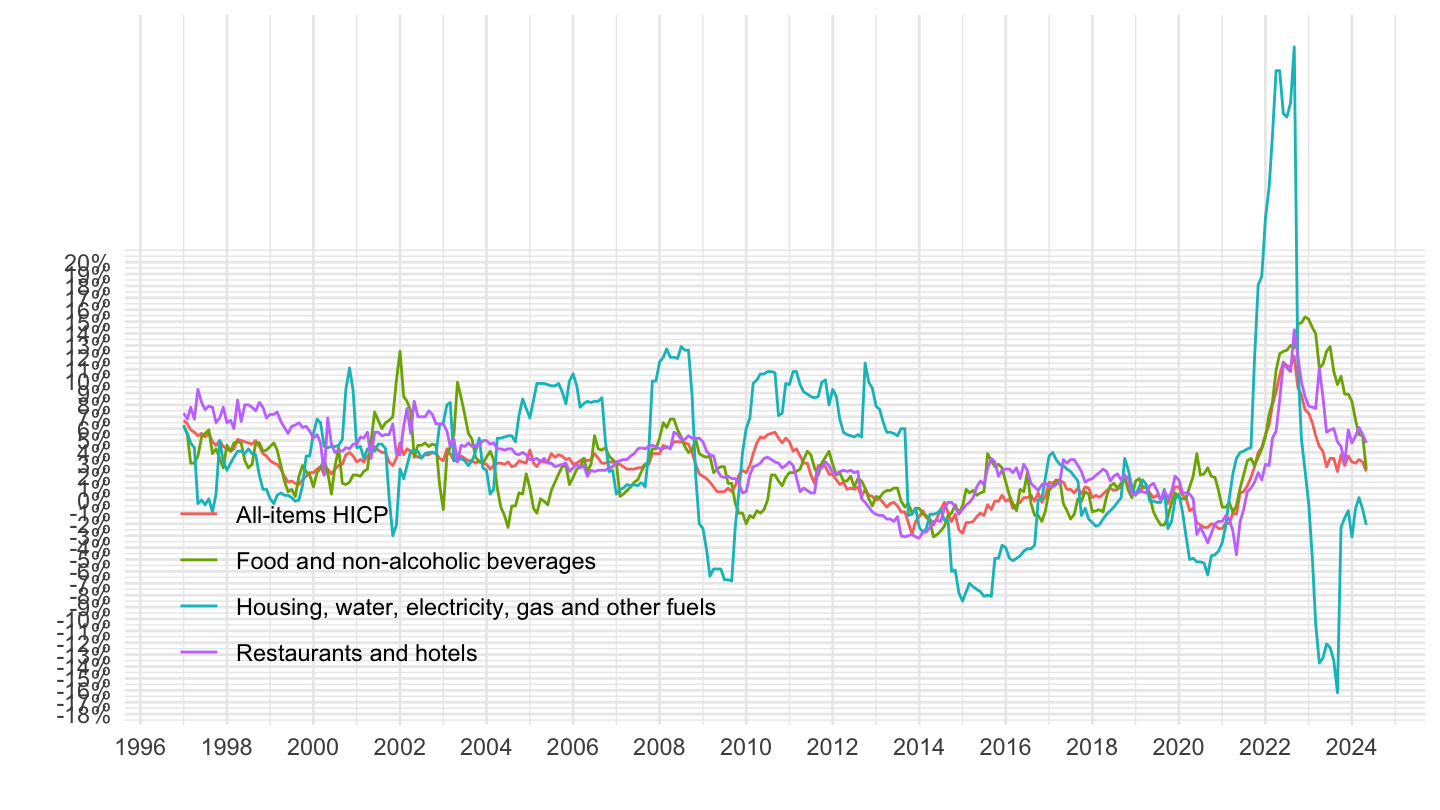
Euro area VS European Union
All
Code
prc_hicp_manr %>%
  filter(coicop == "CP00",
         geo %in% c("EA", "EU")) %>%
  month_to_date %>%
  left_join(geo, by = "geo") %>%
  left_join(colors, by = c("Geo" = "country")) %>%
  mutate(values = values/100) %>%
  ggplot(.) + geom_line(aes(x = date, y = values, color = Geo)) +
  theme_minimal() + xlab("") + ylab("") +
  scale_x_date(breaks = seq(1960, 2100, 2) %>% paste0("-01-01") %>% as.Date,
               labels = date_format("%Y")) +
  scale_y_continuous(breaks = 0.01*seq(-20, 20, 1),
                     labels = percent_format(a = 1)) +
  theme(legend.position = c(0.55, 0.90),
        legend.title = element_blank())