Budget de famille 2017
Données - INSEE
Info
Données sur l’inflation en France
| source | dataset | Title | .html | .rData |
|---|---|---|---|---|
| insee | ILC-ILAT-ICC | Indices pour la révision d’un bail commercial ou professionnel | 2026-07-23 | 2026-07-23 |
| insee | INDICES_LOYERS | Indices des loyers d'habitation (ILH) | 2026-07-23 | 2026-07-23 |
| insee | IPC-1970-1980 | Indice des prix à la consommation - Base 1970, 1980 | 2026-07-23 | 2026-07-23 |
| insee | IPC-1990 | Indices des prix à la consommation - Base 1990 | 2026-07-23 | 2026-07-23 |
| insee | IPC-2015 | Indice des prix à la consommation - Base 2015 | 2026-07-23 | 2026-07-23 |
| insee | IPC-PM-2015 | Prix moyens de vente de détail | 2026-07-23 | 2026-07-23 |
| insee | IPCH-2015 | Indices des prix à la consommation harmonisés | 2026-07-23 | 2026-07-23 |
| insee | IPCH-IPC-2015-ensemble | Indices des prix à la consommation harmonisés | 2026-07-23 | 2026-07-23 |
| insee | IPGD-2015 | Indice des prix dans la grande distribution | 2026-07-23 | 2026-07-23 |
| insee | IPLA-IPLNA-2015 | Indices des prix des logements neufs et Indices Notaires-Insee des prix des logements anciens | 2026-07-23 | 2026-07-23 |
| insee | IPPI-2015 | Indices de prix de production et d'importation dans l'industrie | 2026-07-23 | 2026-07-23 |
| insee | IRL | Indice pour la révision d’un loyer d’habitation | 2026-07-23 | 2026-07-23 |
| insee | SERIES_LOYERS | Variation des loyers | 2026-07-23 | 2026-07-23 |
| insee | T_CONSO_EFF_FONCTION | Consommation effective des ménages par fonction | 2026-07-23 | 2025-12-22 |
| insee | bdf2017 | Budget de famille 2017 | 2026-07-23 | 2023-11-21 |
| insee | echantillon-agglomerations-IPC-2024 | Échantillon d’agglomérations enquêtées de l’IPC en 2024 | 2026-07-23 | 2026-01-27 |
| insee | echantillon-agglomerations-IPC-2025 | Échantillon d’agglomérations enquêtées de l’IPC en 2025 | 2026-07-23 | 2026-01-27 |
| insee | liste-varietes-IPC-2024 | Liste des variétés pour la mesure de l'IPC en 2024 | 2026-07-23 | 2025-04-02 |
| insee | liste-varietes-IPC-2025 | Liste des variétés pour la mesure de l'IPC en 2025 | 2026-07-23 | 2026-01-27 |
| insee | ponderations-elementaires-IPC-2024 | Pondérations élémentaires 2024 intervenant dans le calcul de l’IPC | 2026-07-23 | 2025-04-02 |
| insee | ponderations-elementaires-IPC-2025 | Pondérations élémentaires 2025 intervenant dans le calcul de l’IPC | 2026-07-23 | 2026-01-27 |
| insee | table_conso_moyenne_par_categorie_menages | Montants de consommation selon différentes catégories de ménages | 2026-07-23 | 2026-01-27 |
| insee | table_poste_au_sein_sous_classe_ecoicopv2_france_entiere_ | Ventilation de chaque sous-classe (niveau 4 de la COICOP v2) en postes et leurs pondérations | 2026-07-23 | 2026-01-27 |
| insee | tranches_unitesurbaines | Poids de chaque tranche d’unités urbaines dans la consommation | 2026-07-23 | 2026-01-27 |
LAST_COMPILE
| LAST_COMPILE |
|---|
| 2026-07-24 |
Versions
Bibliographie
Info
AGPR : Âge de la personne de référence
CSPR : Catégorie socioprofessionnelle de la personne de référence
DECUC : Niveau de vie par décile
EQUIP : Taux d’équipement
NOMENCLATURE : Nomenclature des produits
NOMENCLATURE2 : Nomenclature agrégée
STATUT : Statut d’occupation du logement selon le niveau de vie par quintile
STRATE : Catégorie de commune de résidence
TYPMEN : Type de ménage
ZEAT : Zone d’étude et d’aménagement du territoire
ZEAT2 : Zone d’étude et d’aménagement du territoire
MENAGES_IPC_CAT
Code
bdf2017 %>%
  left_join(MENAGES_IPC_CAT, by = "MENAGES_IPC_CAT") %>%
  group_by(MENAGES_IPC_CAT, Menages_ipc_cat) %>%
  summarise(Nobs = n()) %>%
  arrange(-Nobs) %>%
print_table_conditional()| MENAGES_IPC_CAT | Menages_ipc_cat | Nobs |
|---|---|---|
| STATUT | Statut d'occupation du logement selon le niveau de vie par quintile | 8476 |
| DECUC | Niveau de vie par décile | 7172 |
| CSPR | Catégorie socioprofessionnelle de la personne de référence | 5868 |
| AGPR | Âge de la personne de référence | 5216 |
| STRATE | Catégorie de commune de résidence | 3912 |
| TYPMEN | Type de ménage | 3912 |
| ZEAT | Zone d'étude et d'aménagement du territoire | 3260 |
| ZEAT2 | Zone d'étude et d'aménagement du territoire | 2934 |
MENAGES_IPC_CAT, MENAGES_IPC
Code
bdf2017 %>%
  group_by(MENAGES_IPC_CAT, MENAGES_IPC) %>%
  summarise(Nobs = n()) %>%
  arrange(-Nobs) %>%
  print_table_conditional()
REF_AREA
Code
bdf2017 %>%
  group_by(REF_AREA) %>%
  summarise(Nobs = n()) %>%
  arrange(-Nobs) %>%
print_table_conditional()| REF_AREA | Nobs |
|---|---|
| FE | 20538 |
| FM | 20212 |
NOMENCLATURE - bdf2017
Tous
Code
bdf2017 %>%
  left_join(NOMENCLATURE, by = "NOMENCLATURE") %>%
  group_by(NOMENCLATURE, Nomenclature) %>%
  summarise(Nobs = n()) %>%
  arrange(-Nobs) %>%
  print_table_conditional()
NOMENCLATURE - tm106
Tous
Code
tm106 %>%
  left_join(NOMENCLATURE, by = "NOMENCLATURE") %>%
  group_by(NOMENCLATURE, Nomenclature) %>%
  summarise(Nobs = n()) %>%
  arrange(-Nobs) %>%
  print_table_conditional()
2-digit
Code
tm106 %>%
  filter(nchar(NOMENCLATURE) == 2) %>%
  left_join(NOMENCLATURE, by = "NOMENCLATURE") %>%
  group_by(NOMENCLATURE, Nomenclature) %>%
  summarise(Nobs = n()) %>%
  arrange(-Nobs) %>%
print_table_conditional()| NOMENCLATURE | Nomenclature | Nobs |
|---|---|---|
| 01 | 01 - PRODUITS ALIMENTAIRES ET BOISSONS NON-ALCOOLISEES | 11 |
| 02 | 02 - BOISSONS ALCOOLISEES ET TABAC | 11 |
| 03 | 03 - ARTICLES D’HABILLEMENT ET CHAUSSURES | 11 |
| 04 | 04 - LOGEMENT, EAU, GAZ, ELECTRICITE ET AUTRES COMBUSTIBLES | 11 |
| 05 | 05 - MEUBLES, ARTICLES DE MENAGE ET ENTRETIEN COURANT DE LA MAISON | 11 |
| 06 | 06 - SANTE | 11 |
| 07 | 07 - TRANSPORTS | 11 |
| 08 | 08 - COMMUNICATIONS | 11 |
| 09 | 09 - LOISIRS ET CULTURE | 11 |
| 10 | 10 - ENSEIGNEMENT | 11 |
| 11 | 11 - RESTAURATION ET HÔTELS | 11 |
| 12 | 12 - BIENS ET SERVICES DIVERS | 11 |
| 13 | 13 - HORS CHAMP DE LA CONSOMMATION (IMPOTS ET TAXES, GROS TRAVAUX, REMBOURSEMENT PRET, CADEAUX) | 11 |
3-digit
Code
tm106 %>%
  filter(nchar(NOMENCLATURE) == 3) %>%
  left_join(NOMENCLATURE, by = "NOMENCLATURE") %>%
  group_by(NOMENCLATURE, Nomenclature) %>%
  summarise(Nobs = n()) %>%
  arrange(-Nobs) %>%
  print_table_conditional()
4-digit
Code
tm106 %>%
  filter(nchar(NOMENCLATURE) == 4) %>%
  left_join(NOMENCLATURE, by = "NOMENCLATURE") %>%
  group_by(NOMENCLATURE, Nomenclature) %>%
  summarise(Nobs = n()) %>%
  arrange(-Nobs) %>%
  print_table_conditional()
4-digit
Code
tm106 %>%
  filter(nchar(NOMENCLATURE) == 4) %>%
  left_join(NOMENCLATURE, by = "NOMENCLATURE") %>%
  group_by(NOMENCLATURE, Nomenclature) %>%
  summarise(Nobs = n()) %>%
  arrange(-Nobs) %>%
  print_table_conditional()
5-digit
Code
tm106 %>%
  filter(nchar(NOMENCLATURE) == 5) %>%
  left_join(NOMENCLATURE, by = "NOMENCLATURE") %>%
  group_by(NOMENCLATURE, Nomenclature) %>%
  summarise(Nobs = n()) %>%
  arrange(-Nobs) %>%
  print_table_conditional()
ZEAT2
Code
tm101 %>%
  left_join(ZEAT2, by = "ZEAT2") %>%
  group_by(ZEAT2, Zeat2) %>%
  summarise(Nobs = n()) %>%
  arrange(-Nobs) %>%
print_table_conditional()| ZEAT2 | Zeat2 | Nobs |
|---|---|---|
| 1 | REGION PARISIENNE | 326 |
| 2 | BASSIN PARISIEN | 326 |
| 3 | NORD | 326 |
| 4 | EST | 326 |
| 5 | OUEST | 326 |
| 7 | SUD OUEST | 326 |
| 8 | CENTRE EST | 326 |
| 9 | MEDITERRANEE | 326 |
| TOT | Ensemble | 326 |
AGPR
Code
tm102 %>%
  left_join(AGPR, by = "AGPR") %>%
  group_by(AGPR, Agpr) %>%
  summarise(Nobs = n()) %>%
  arrange(-Nobs) %>%
print_table_conditional()| AGPR | Agpr | Nobs |
|---|---|---|
| 1 | Moins de 25 ans | 326 |
| 2 | De 25 à 34 ans | 326 |
| 3 | De 35 à 44 ans | 326 |
| 4 | De 45 à 54 ans | 326 |
| 5 | De 55 à 64 ans | 326 |
| 6 | De 65 à 74 ans | 326 |
| 7 | 75 ans et plus | 326 |
| TOT | Ensemble | 326 |
CSPR
Code
tm103 %>%
  left_join(CSPR, by = "CSPR") %>%
  group_by(CSPR, Cspr) %>%
  summarise(Nobs = n()) %>%
  arrange(-Nobs) %>%
print_table_conditional()| CSPR | Cspr | Nobs |
|---|---|---|
| 1 | Agriculteurs | 326 |
| 2 | Artisans, commerçants et chefs d entreprise | 326 |
| 3 | Cadres | 326 |
| 4 | Professions intermédiaires | 326 |
| 5 | Employés | 326 |
| 6 | Ouvriers | 326 |
| 7 | Retraités | 326 |
| 8 | Autres inactifs | 326 |
| TOT | Ensemble | 326 |
STRATE
Code
tm104 %>%
  left_join(STRATE, by = "STRATE") %>%
  group_by(STRATE, Strate) %>%
  summarise(Nobs = n()) %>%
  arrange(-Nobs) %>%
print_table_conditional()| STRATE | Strate | Nobs |
|---|---|---|
| 0 | Rural | 326 |
| 1 | Petites villes (- de 20 000 hab.) | 326 |
| 2 | Villes moyennes (de 20 000 à 100 000 hab.) | 326 |
| 3 | Grandes villes (+ de 100 000 hab.) | 326 |
| 4 | Complexe agglo Paris | 326 |
| TOT | Ensemble | 326 |
TYPMEN
Code
tm105 %>%
  left_join(TYPMEN, by = "TYPMEN") %>%
  group_by(TYPMEN, Typmen) %>%
  summarise(Nobs = n()) %>%
  arrange(-Nobs) %>%
print_table_conditional()| TYPMEN | Typmen | Nobs |
|---|---|---|
| 1 | Personnes seules | 326 |
| 2 | Familles monoparentales | 326 |
| 3 | Couples sans enfant | 326 |
| 4 | Couples avec enfants | 326 |
| 5 | Autres ménages | 326 |
| TOT | Ensemble | 326 |
DECUC
Code
tm106 %>%
  left_join(DECUC, by = "DECUC") %>%
  group_by(DECUC, Decuc) %>%
  summarise(Nobs = n()) %>%
  arrange(-Nobs) %>%
print_table_conditional()| DECUC | Decuc | Nobs |
|---|---|---|
| 1 | Décile 1 | 326 |
| 10 | Décile 10 | 326 |
| 2 | Décile 2 | 326 |
| 3 | Décile 3 | 326 |
| 4 | Décile 4 | 326 |
| 5 | Décile 5 | 326 |
| 6 | Décile 6 | 326 |
| 7 | Décile 7 | 326 |
| 8 | Décile 8 | 326 |
| 9 | Décile 9 | 326 |
| TOT | Ensemble | 326 |
Alimentation - Focus
Décile 1 vs Décile 10
Code
weights <- bdf2017 %>%
  filter(MENAGES_IPC_CAT == "DECUC",
         MENAGES_IPC %in% c("1", "10"),
         substr(NOMENCLATURE, 1, 2) == "01" | NOMENCLATURE == "CTOTALE",
         REF_AREA == "FE") %>%
  select_if(~ n_distinct(.) > 1) %>%
  group_by(MENAGES_IPC) %>%
  mutate(OBS_VALUE = OBS_VALUE/OBS_VALUE[NOMENCLATURE == "CTOTALE"]) %>%
  filter(NOMENCLATURE != "CTOTALE", NOMENCLATURE != "01") %>%
  transmute(COICOP2016 = NOMENCLATURE, MENAGES_IPC, weights = OBS_VALUE) %>%
  ungroup

inflation <- `IPC-2015` %>%
  filter(NATURE == "INDICE",
         INDICATEUR == "IPC",
         FREQ == "M",
         MENAGES_IPC == "ENSEMBLE",
         COICOP2016 != "SO",
         substr(COICOP2016, 1, 2) == "01",
         PRIX_CONSO == "SO",
         REF_AREA %in% c("FE")) %>%
  month_to_date %>%
  select_if(~ n_distinct(.) > 1) %>%
  group_by(COICOP2016) %>%
  arrange(date) %>%
  mutate(inflation = OBS_VALUE/lag(OBS_VALUE, 12)-1) %>%
  select(date, COICOP2016, inflation) %>%
  ungroup %>%
  filter(date >= as.Date("2021-01-01"))

weights %>%
  mutate(COICOP2016_nchar = nchar(COICOP2016)) %>%
  full_join(inflation) %>%
  group_by(COICOP2016_nchar, MENAGES_IPC, date) %>%
  summarise(inflation_sum = sum(inflation*weights/sum(weights))) %>%
  ggplot + geom_line(aes(x = date, y = inflation_sum, color = factor(COICOP2016_nchar), linetype = MENAGES_IPC))
Somme des poids
Par décile
Code
bdf2017 %>%
  filter(MENAGES_IPC_CAT == "DECUC",
         REF_AREA == "FE") %>%
  group_by(MENAGES_IPC) %>%
  mutate(OBS_VALUE = OBS_VALUE/OBS_VALUE[NOMENCLATURE == "CTOTALE"]) %>%
  ungroup %>%
  select(NOMENCLATURE, DECUC = MENAGES_IPC, OBS_VALUE) %>%
  left_join(DECUC, by = "DECUC") %>%
  # 13: hors champ de la consommation -----
  filter(NOMENCLATURE != "CTOTALE",
         substr(NOMENCLATURE, 1, 2) != "13") %>%
  mutate(NOMENCLATURE_DIGIT = nchar(NOMENCLATURE)) %>%
  group_by(NOMENCLATURE_DIGIT, DECUC2) %>%
  summarise(OBS_VALUE = sum(OBS_VALUE),
            Nobs = n()) %>%
  arrange(NOMENCLATURE_DIGIT, DECUC2) %>%
  print_table_conditional()
Par âge
Code
bdf2017 %>%
  filter(MENAGES_IPC_CAT == "AGPR",
         REF_AREA == "FE") %>%
  group_by(MENAGES_IPC) %>%
  mutate(OBS_VALUE = OBS_VALUE/OBS_VALUE[NOMENCLATURE == "CTOTALE"]) %>%
  ungroup %>%
  select(NOMENCLATURE, AGPR = MENAGES_IPC, OBS_VALUE) %>%
  left_join(AGPR, by = "AGPR") %>%
  # 13: hors champ de la consommation -----
  filter(NOMENCLATURE != "CTOTALE",
         substr(NOMENCLATURE, 1, 2) != "13") %>%
  mutate(NOMENCLATURE_DIGIT = nchar(NOMENCLATURE)) %>%
  group_by(NOMENCLATURE_DIGIT, AGPR2) %>%
  summarise(OBS_VALUE = sum(OBS_VALUE),
            Nobs = n()) %>%
  arrange(NOMENCLATURE_DIGIT, AGPR2) %>%
  print_table_conditional()
Par strate (type ville)
Code
bdf2017 %>%
  filter(MENAGES_IPC_CAT == "STRATE",
         REF_AREA == "FE") %>%
  group_by(MENAGES_IPC) %>%
  mutate(OBS_VALUE = OBS_VALUE/OBS_VALUE[NOMENCLATURE == "CTOTALE"]) %>%
  ungroup %>%
  select(NOMENCLATURE, STRATE = MENAGES_IPC, OBS_VALUE) %>%
  left_join(STRATE, by = "STRATE") %>%
  # 13: hors champ de la consommation -----
  filter(NOMENCLATURE != "CTOTALE",
         substr(NOMENCLATURE, 1, 2) != "13") %>%
  mutate(NOMENCLATURE_DIGIT = nchar(NOMENCLATURE)) %>%
  group_by(NOMENCLATURE_DIGIT, Strate) %>%
  summarise(OBS_VALUE = sum(OBS_VALUE),
            Nobs = n()) %>%
  arrange(NOMENCLATURE_DIGIT, Strate) %>%
print_table_conditional()| NOMENCLATURE_DIGIT | Strate | OBS_VALUE | Nobs |
|---|---|---|---|
| 2 | Complexe agglo Paris | 1.0000000 | 12 |
| 2 | Ensemble | 1.0000365 | 12 |
| 2 | Grandes villes (+ de 100 000 hab.) | 0.9999627 | 12 |
| 2 | Petites villes (- de 20 000 hab.) | 1.0000000 | 12 |
| 2 | Rural | 1.0000000 | 12 |
| 2 | Villes moyennes (de 20 000 à 100 000 hab.) | 1.0000000 | 12 |
| 3 | Complexe agglo Paris | 1.0000000 | 48 |
| 3 | Ensemble | 1.0000000 | 48 |
| 3 | Grandes villes (+ de 100 000 hab.) | 1.0001118 | 48 |
| 3 | Petites villes (- de 20 000 hab.) | 1.0000376 | 48 |
| 3 | Rural | 1.0001479 | 48 |
| 3 | Villes moyennes (de 20 000 à 100 000 hab.) | 0.9999607 | 48 |
| 4 | Complexe agglo Paris | 0.9999371 | 105 |
| 4 | Ensemble | 1.0000000 | 105 |
| 4 | Grandes villes (+ de 100 000 hab.) | 1.0002237 | 105 |
| 4 | Petites villes (- de 20 000 hab.) | 1.0001129 | 105 |
| 4 | Rural | 1.0001479 | 105 |
| 4 | Villes moyennes (de 20 000 à 100 000 hab.) | 0.9999607 | 105 |
| 5 | Complexe agglo Paris | 0.9999685 | 138 |
| 5 | Ensemble | 1.0000365 | 138 |
| 5 | Grandes villes (+ de 100 000 hab.) | 1.0002237 | 138 |
| 5 | Petites villes (- de 20 000 hab.) | 1.0001129 | 138 |
| 5 | Rural | 1.0001109 | 138 |
| 5 | Villes moyennes (de 20 000 à 100 000 hab.) | 0.9998820 | 138 |
Alimentation - Tous
DECUC
% de la consommation
Code
tm106 %>%
  filter(NOMENCLATURE %in% c("011", "0111", "0112", "0113", "CTOTALE"),
         DECUC != "TOT") %>%
  left_join(NOMENCLATURE, by = "NOMENCLATURE") %>%
  left_join(DECUC, by = "DECUC") %>%
  mutate(DECUC = DECUC %>% as.numeric) %>%
  group_by(DECUC) %>%
  mutate(CONSO = CONSO/CONSO[NOMENCLATURE == "CTOTALE"]) %>%
  filter(NOMENCLATURE != "CTOTALE") %>%
  ggplot + geom_line(aes(x = DECUC2, y = CONSO, color = Nomenclature, group = Nomenclature)) +
  theme_minimal() + xlab("") + ylab("% de la Consommation Totale") +
  scale_y_continuous(breaks = 0.01*seq(-30, 50, 0.5),
                     labels = percent_format(accuracy = .1)) +
  #
  theme(legend.position = c(0.4, 0.15),
        legend.title = element_blank())
% du revenu
Code
tm106 %>%
  filter(NOMENCLATURE %in% c("011", "0111", "0112", "0113"),
         DECUC != "TOT") %>%
  left_join(NOMENCLATURE, by = "NOMENCLATURE") %>%
  left_join(DECUC, by = "DECUC") %>%
  left_join(revenu_dispo_decile, by = "DECUC") %>%
  mutate(DECUC = DECUC %>% as.numeric) %>%
  group_by(DECUC) %>%
  ggplot + geom_line(aes(x = DECUC2, y = CONSO/revenu_dispo_decile, color = Nomenclature, group = Nomenclature)) +
  theme_minimal() + xlab("") + ylab("% du revenu") +
  scale_y_continuous(breaks = 0.01*seq(-30, 50, 2),
                     labels = percent_format(accuracy = 1)) +
  #
  theme(legend.position = c(0.4, 0.15),
        legend.title = element_blank())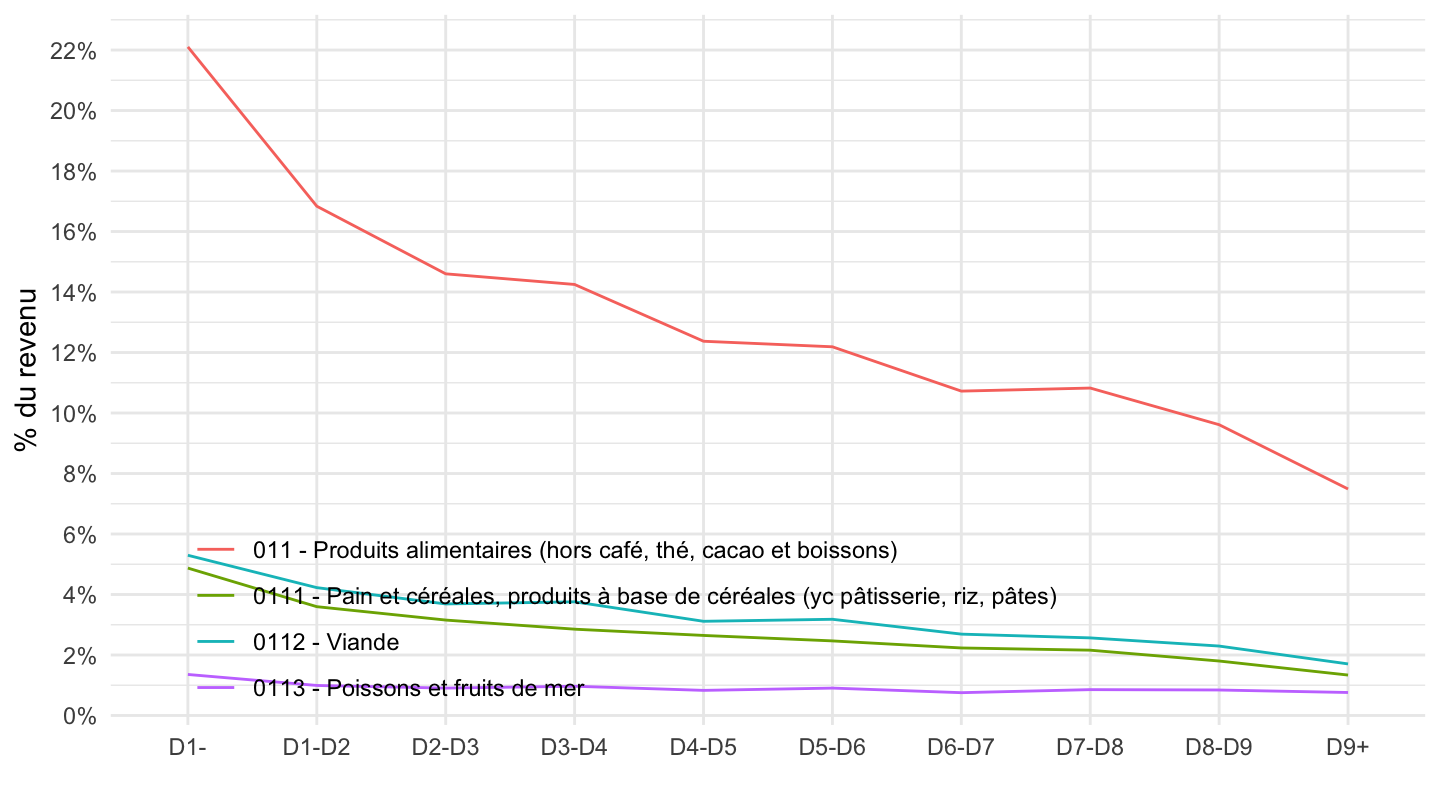
Alimentation
DECUC
% de la consommation
Code
bdf2017 %>%
  filter(NOMENCLATURE %in% c("0111", "0112", "0113", "0114", "0115",
                             "0116", "0117", "0118", "0119", "CTOTALE"),
         MENAGES_IPC != "TOT",
         MENAGES_IPC_CAT == "DECUC",
         REF_AREA == "FE") %>%
  rename(DECUC = MENAGES_IPC) %>%
  left_join(NOMENCLATURE, by = "NOMENCLATURE") %>%
  left_join(DECUC, by = "DECUC") %>%
  mutate(DECUC = DECUC %>% as.numeric) %>%
  group_by(DECUC) %>%
  mutate(OBS_VALUE = OBS_VALUE/OBS_VALUE[NOMENCLATURE == "CTOTALE"]) %>%
  filter(NOMENCLATURE != "CTOTALE") %>%
  ggplot + geom_line(aes(x = DECUC2, y = OBS_VALUE, color = Nomenclature, group = Nomenclature)) +
  theme_minimal() + xlab("") + ylab("% de la Consommation Totale") +
  scale_y_continuous(breaks = 0.01*seq(-30, 50, 0.5),
                     labels = percent_format(accuracy = .1)) +
  theme(legend.position = c(0.4, 0.6),
        legend.title = element_blank())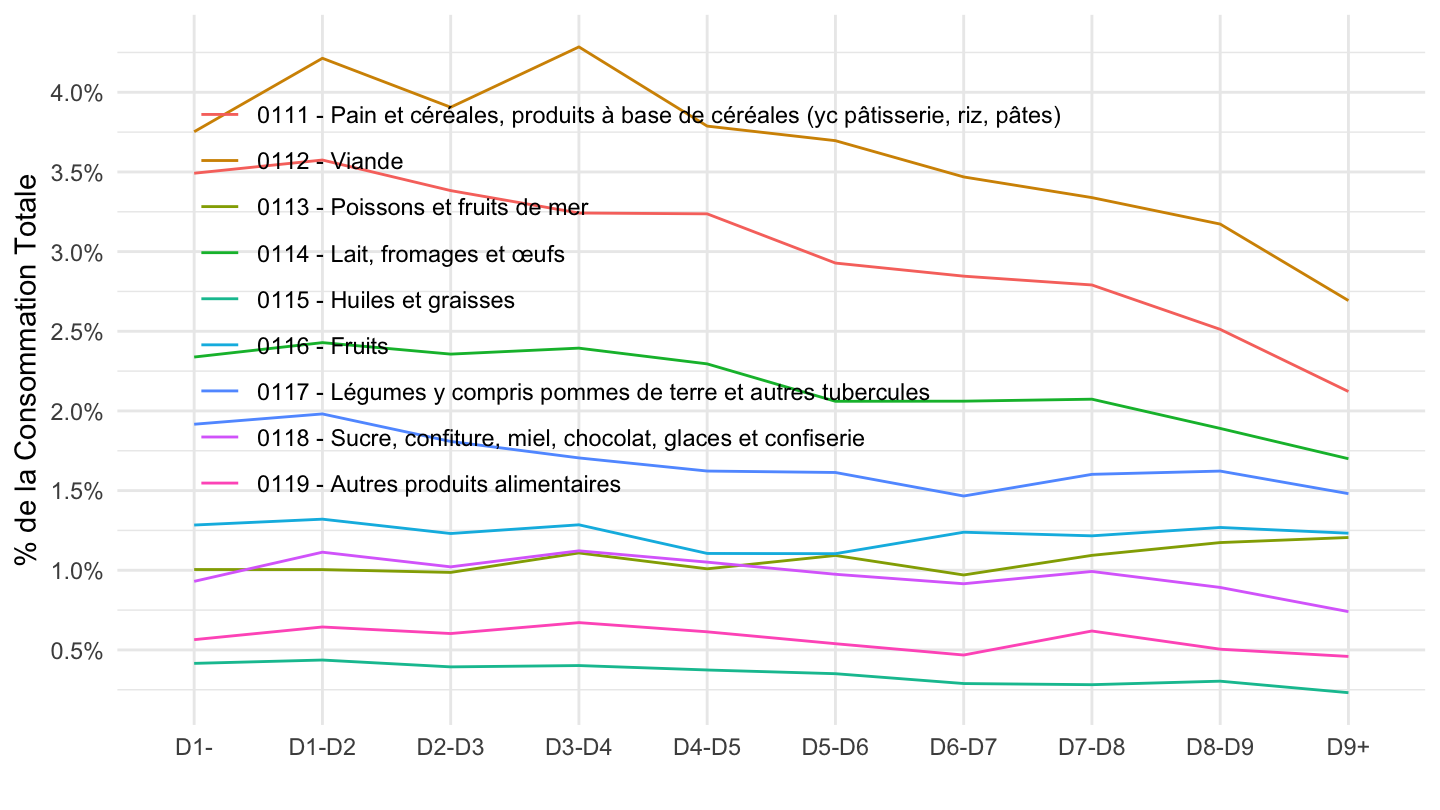
% du revenu
Code
bdf2017 %>%
  filter(NOMENCLATURE %in% c("0111", "0112", "0113", "0114", "0115",
                             "0116", "0117", "0118", "0119", "CTOTALE"),
         MENAGES_IPC != "TOT",
         MENAGES_IPC_CAT == "DECUC",
         REF_AREA == "FE") %>%
  rename(DECUC = MENAGES_IPC) %>%
  left_join(NOMENCLATURE, by = "NOMENCLATURE") %>%
  left_join(DECUC, by = "DECUC") %>%
  left_join(revenu_dispo_decile, by = "DECUC") %>%
  mutate(DECUC = DECUC %>% as.numeric) %>%
  group_by(DECUC) %>%
  filter(NOMENCLATURE != "CTOTALE") %>%
  ggplot + geom_line(aes(x = DECUC2, y = OBS_VALUE/revenu_dispo_decile, color = Nomenclature, group = Nomenclature)) +
  theme_minimal() + xlab("") + ylab("% de la Consommation Totale") +
  scale_y_continuous(breaks = 0.01*seq(-30, 50, 0.5),
                     labels = percent_format(accuracy = .1)) +
  #
  theme(legend.position = c(0.4, 0.6),
        legend.title = element_blank())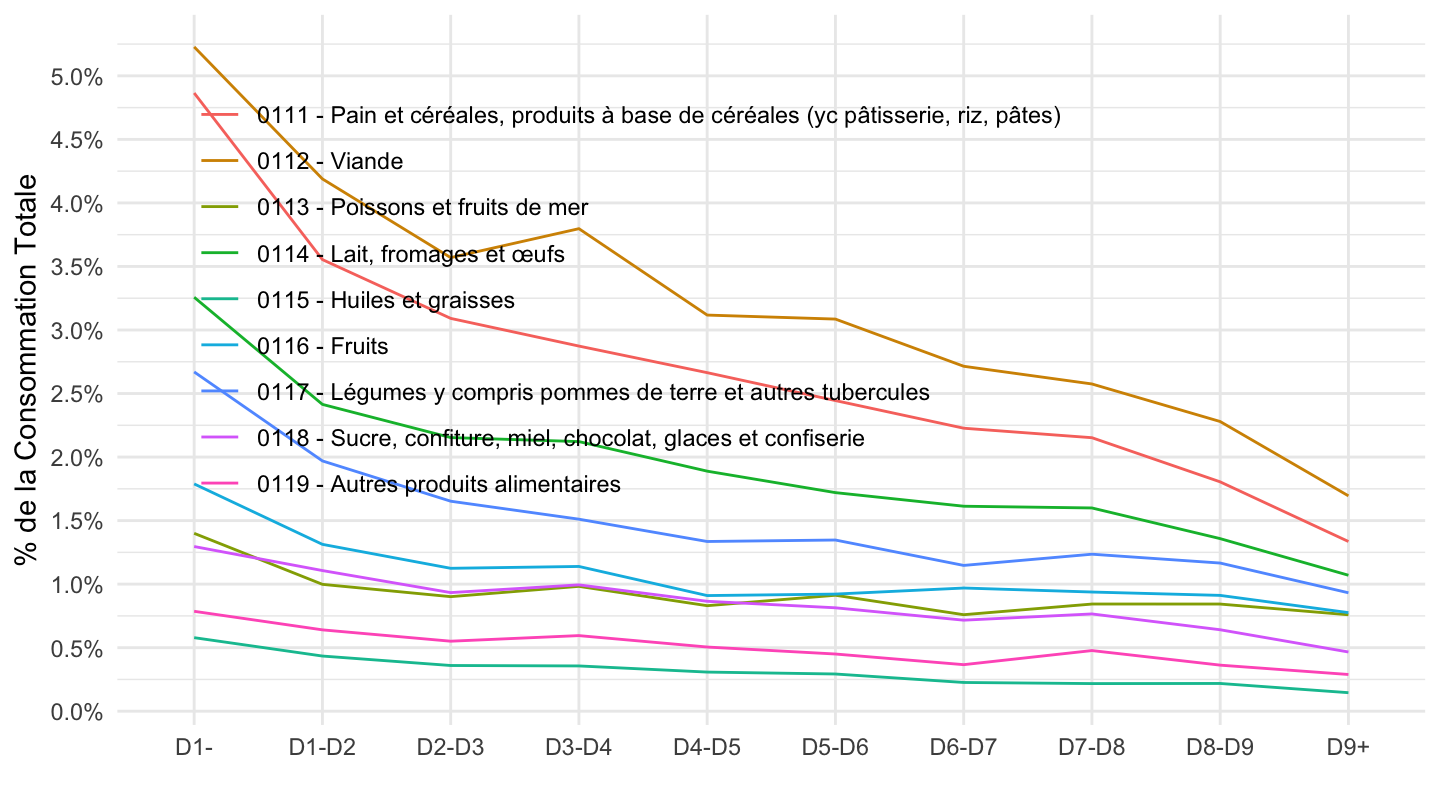
Pains et Céréales (0111), Pain (01112)
CSPR
Code
tm103 %>%
  filter(NOMENCLATURE %in% c("0111", "01112", "CTOTALE"),
         CSPR != "TOT") %>%
  left_join(NOMENCLATURE, by = "NOMENCLATURE") %>%
  left_join(CSPR, by = "CSPR") %>%
  group_by(CSPR) %>%
  mutate(CONSO = CONSO/CONSO[NOMENCLATURE == "CTOTALE"]) %>%
  mutate(Cspr = gsub(" ", " \n", Cspr),
         Cspr = ifelse(CSPR == "2", "Artisans, \ncommerçants \net chefs \nd'entreprise", Cspr)) %>%
  filter(NOMENCLATURE != "CTOTALE") %>%
  ggplot + geom_line(aes(x = paste0(CSPR, " - ", Cspr), y = CONSO, color = Nomenclature, group = Nomenclature)) +
  theme_minimal() + xlab("") + ylab("% de la Consommation Totale (Budget de famille 2017)") +
  scale_y_continuous(breaks = 0.01*seq(-30, 50, 0.5),
                     labels = percent_format(accuracy = .1)) +

  theme(legend.position = c(0.4, 0.9),
        legend.title = element_blank())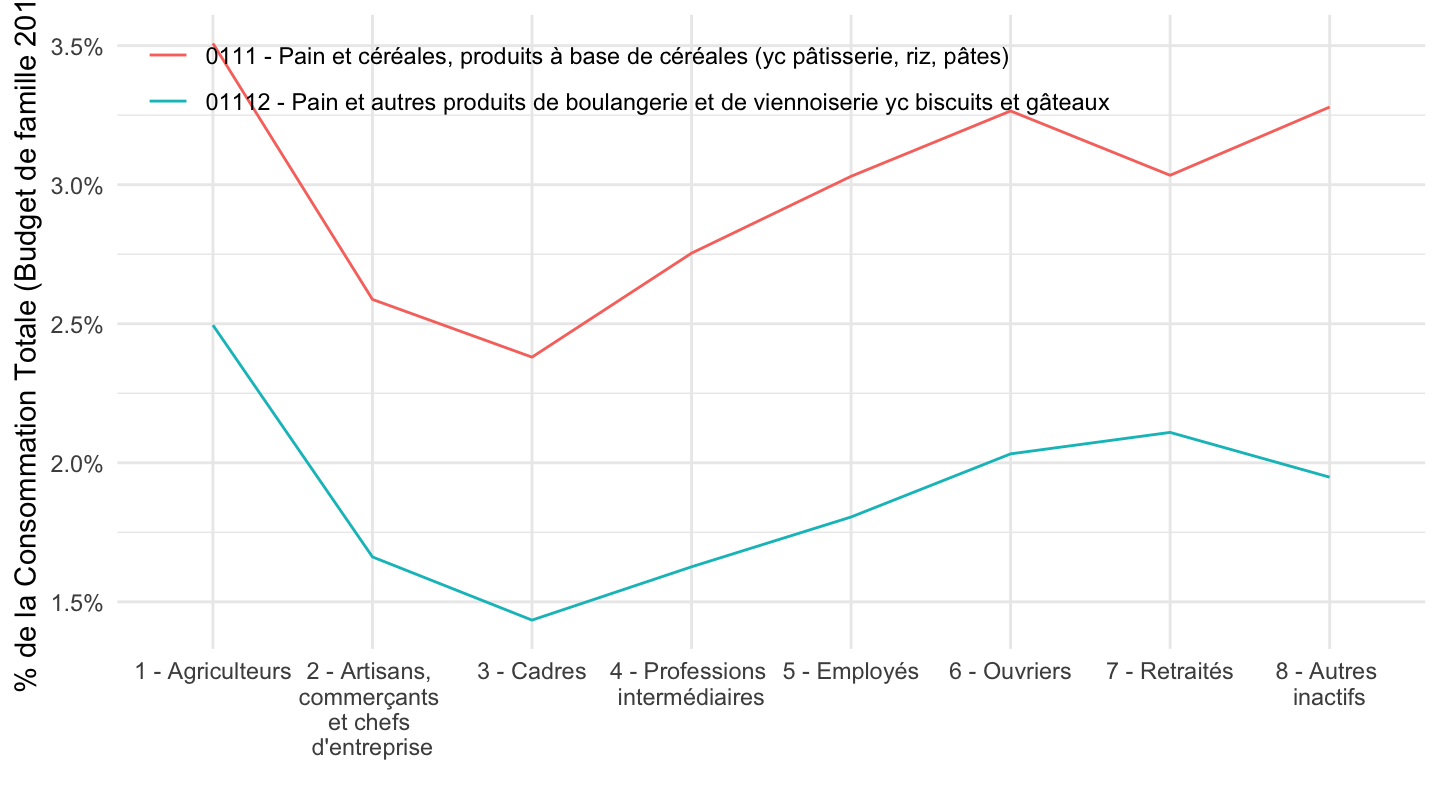
AGPR
Code
tm102 %>%
  filter(NOMENCLATURE %in% c("0111", "01112", "CTOTALE")) %>%
  left_join(NOMENCLATURE, by = "NOMENCLATURE") %>%
  left_join(AGPR, by = "AGPR") %>%
  filter(AGPR != "TOT") %>%
  group_by(AGPR) %>%
  mutate(AGPR2 = gsub(" ", " \n", AGPR2)) %>%
  mutate(CONSO = CONSO/CONSO[NOMENCLATURE == "CTOTALE"]) %>%
  filter(NOMENCLATURE != "CTOTALE") %>%
  ggplot + geom_line(aes(x = AGPR2, y = CONSO, color = Nomenclature, group = Nomenclature)) +
  theme_minimal() + xlab("") + ylab("% de la Consommation Totale (Budget de famille 2017)") +
  scale_y_continuous(breaks = 0.01*seq(-30, 50, 0.2),
                     labels = percent_format(accuracy = .1)) +

  theme(legend.position = c(0.55, 0.9),
        legend.title = element_blank())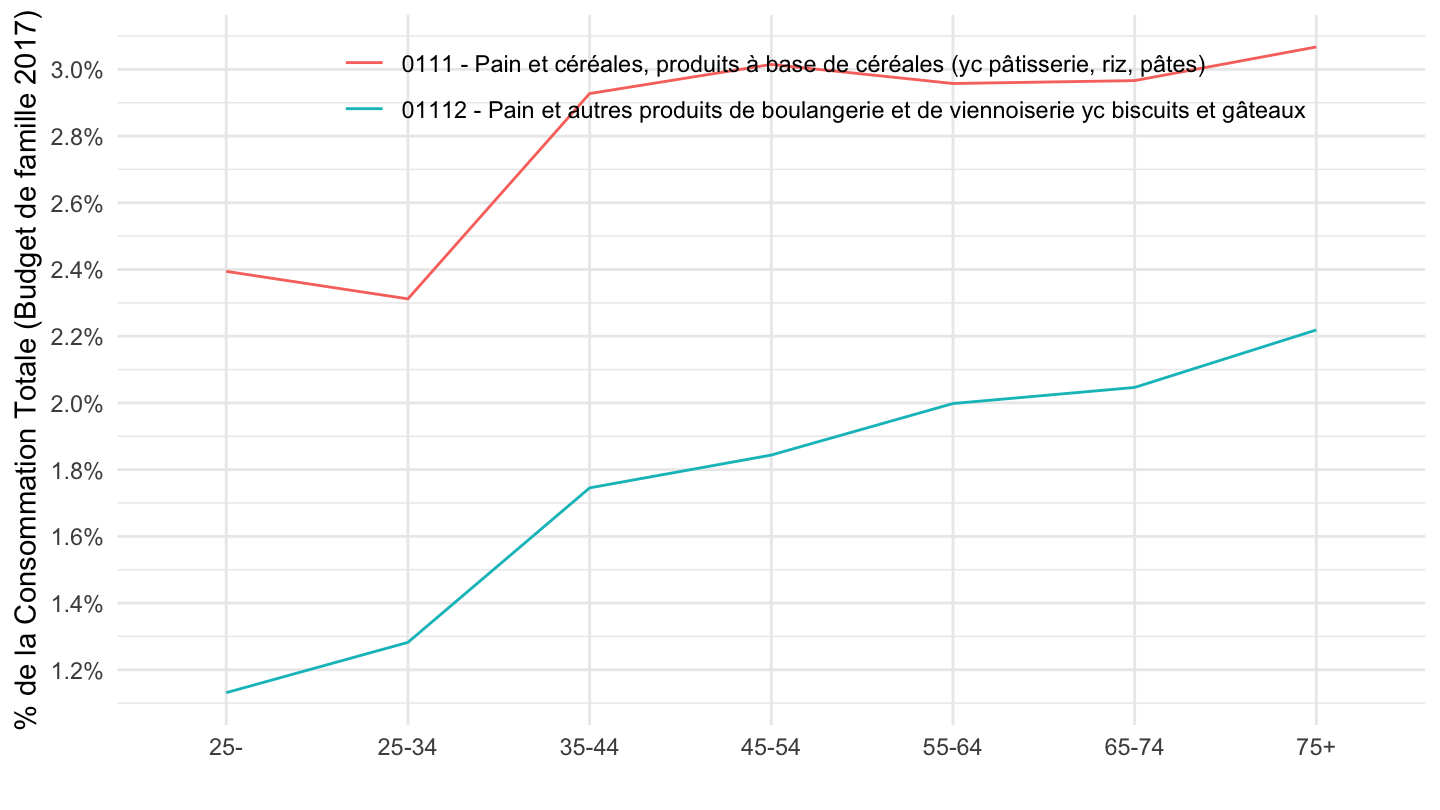
DECUC
Code
tm106 %>%
  filter(NOMENCLATURE %in% c("0111", "01112", "01113", "CTOTALE"),
         DECUC != "TOT") %>%
  left_join(NOMENCLATURE, by = "NOMENCLATURE") %>%
  left_join(DECUC, by = "DECUC") %>%
  mutate(DECUC = DECUC %>% as.numeric) %>%
  group_by(DECUC) %>%
  mutate(CONSO = CONSO/CONSO[NOMENCLATURE == "CTOTALE"]) %>%
  filter(NOMENCLATURE != "CTOTALE") %>%
  ggplot + geom_line(aes(x = DECUC2, y = CONSO, color = Nomenclature, group = Nomenclature)) +
  theme_minimal() + xlab("") + ylab("% de la Consommation Totale") +
  scale_y_continuous(breaks = 0.01*seq(-30, 50, 0.5),
                     labels = percent_format(accuracy = .1)) +
  #
  theme(legend.position = c(0.4, 0.3),
        legend.title = element_blank())
STRATE
Code
tm104 %>%
  filter(NOMENCLATURE %in% c("0111", "01112", "CTOTALE"),
         STRATE != "TOT") %>%
  left_join(NOMENCLATURE, by = "NOMENCLATURE") %>%
  left_join(STRATE, by = "STRATE") %>%
  group_by(STRATE) %>%
  mutate(CONSO = CONSO/CONSO[NOMENCLATURE == "CTOTALE"]) %>%
  filter(NOMENCLATURE != "CTOTALE") %>%
  mutate(Strate = gsub("\\(", "\n\\(", Strate)) %>%
  ggplot + geom_line(aes(x = paste0(STRATE, " - ", Strate), y = CONSO, color = Nomenclature, group = Nomenclature)) +
  theme_minimal() + xlab("") + ylab("% de la Consommation Totale") +
  scale_y_continuous(breaks = 0.01*seq(-30, 50, 0.5),
                     labels = percent_format(accuracy = .1),
                     limits = c(0, 0.032)) +

  theme(legend.position = c(0.4, 0.15),
        legend.title = element_blank())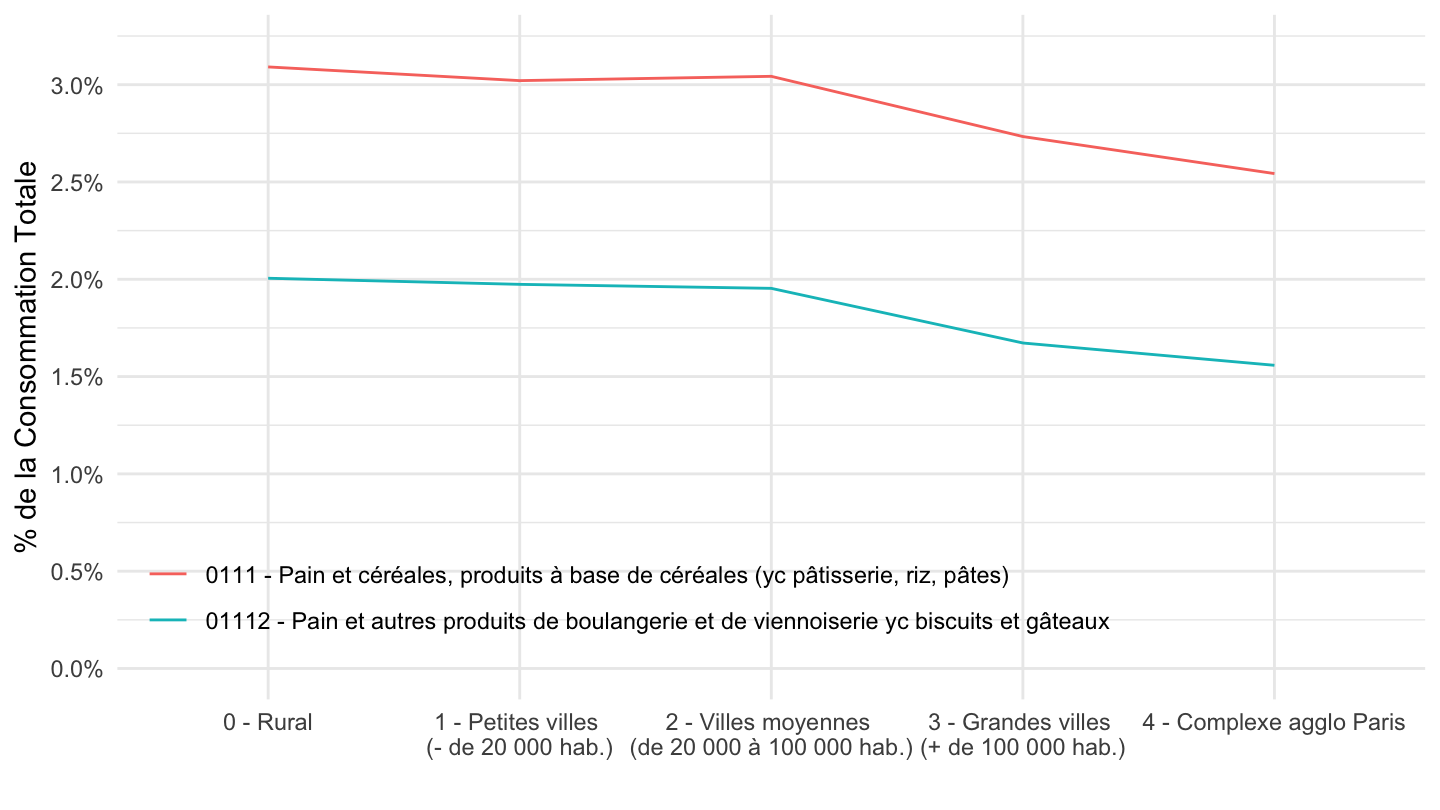
TYPMEN
Code
tm105 %>%
  filter(NOMENCLATURE %in% c("0111", "01112", "CTOTALE")) %>%
  left_join(NOMENCLATURE, by = "NOMENCLATURE") %>%
  left_join(TYPMEN, by = "TYPMEN") %>%
  filter(TYPMEN != "TOT") %>%
  group_by(TYPMEN) %>%
  mutate(CONSO = CONSO/CONSO[NOMENCLATURE == "CTOTALE"]) %>%
  filter(NOMENCLATURE != "CTOTALE") %>%
  mutate(Typmen = gsub(" ", " \n", Typmen)) %>%
  ggplot + geom_line(aes(x = paste0(TYPMEN, " - ", Typmen), y = CONSO, color = Nomenclature, group = Nomenclature)) +
  theme_minimal() + xlab("") + ylab("% de la Consommation Totale (Budget de famille 2017)") +
  scale_y_continuous(breaks = 0.01*seq(-30, 50, 0.2),
                     labels = percent_format(accuracy = .1)) +

  theme(legend.position = c(0.4, 0.9),
        legend.title = element_blank())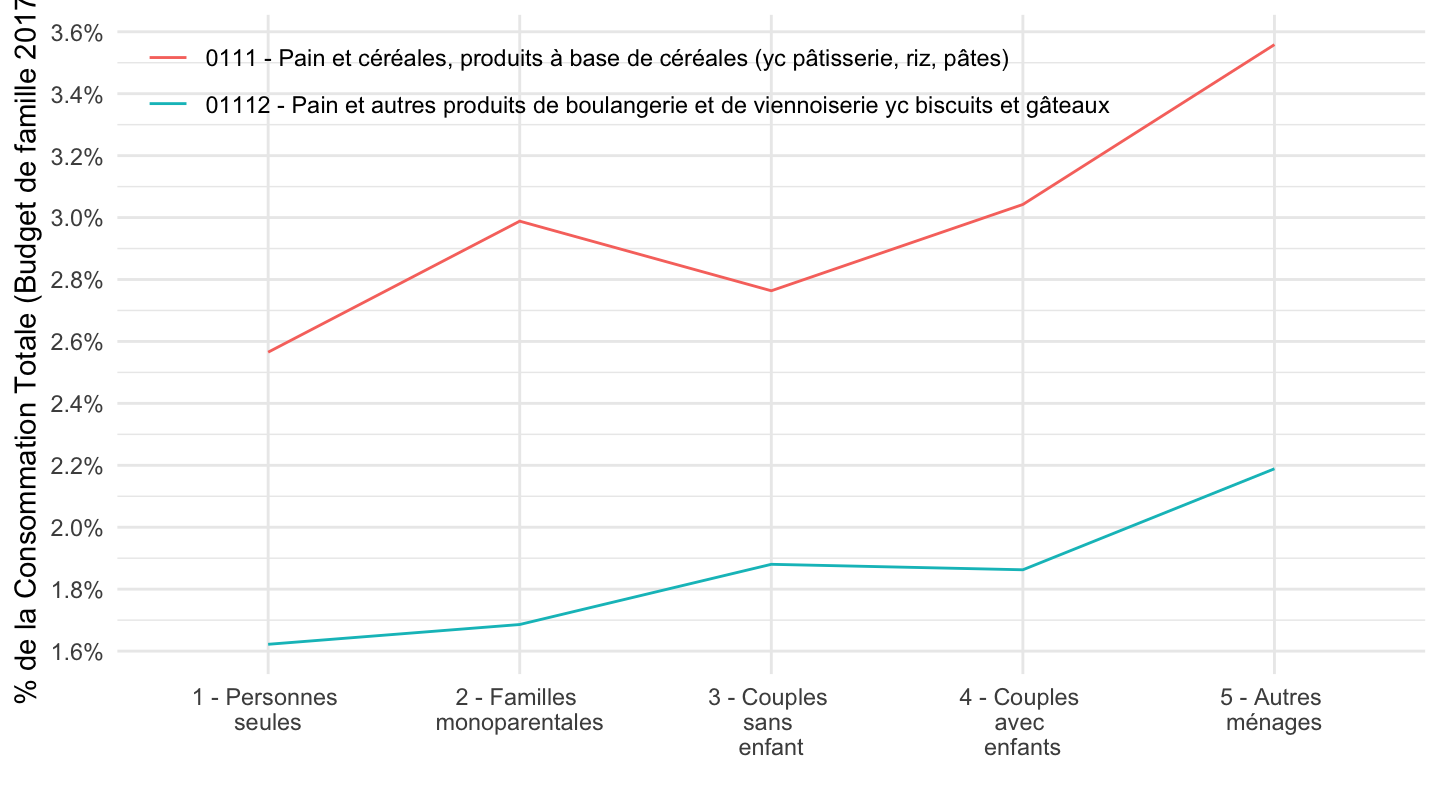
ZEAT2
Code
tm101 %>%
  filter(NOMENCLATURE %in% c("0111", "01112", "CTOTALE")) %>%
  left_join(NOMENCLATURE, by = "NOMENCLATURE") %>%
  left_join(ZEAT2, by = "ZEAT2") %>%
  filter(ZEAT2 != "TOT") %>%
  group_by(ZEAT2) %>%
  mutate(CONSO = CONSO/CONSO[NOMENCLATURE == "CTOTALE"]) %>%
  filter(NOMENCLATURE != "CTOTALE") %>%
  mutate(Zeat2 = gsub(" ", " \n", Zeat2)) %>%
  ggplot + geom_line(aes(x = Zeat2, y = CONSO, color = Nomenclature, group = Nomenclature)) +
  theme_minimal() + xlab("") + ylab("% de la Consommation Totale (Budget de famille 2017)") +
  scale_y_continuous(breaks = 0.01*seq(-30, 50, 0.5),
                     labels = percent_format(accuracy = .1)) +

  theme(legend.position = c(0.4, 0.2),
        legend.title = element_blank())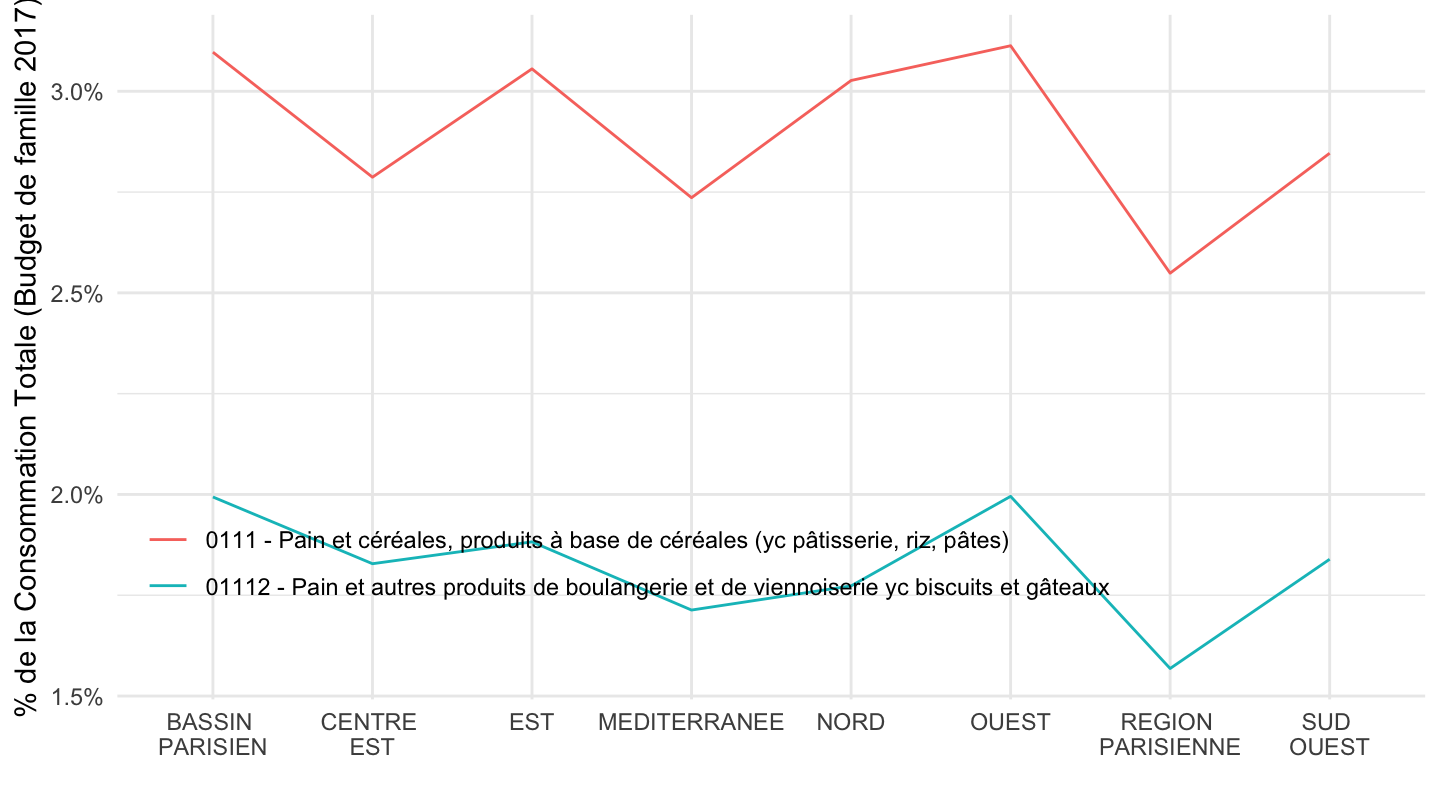
HORS CHAMP DE LA CONSOMMATION (IMPOTS ET TAXES, GROS TRAVAUX, REMBOURSEMENT PRET, CADEAUX)
DECUC
% de la consommation
All
Code
tm106 %>%
  filter(NOMENCLATURE %in% c("131", "132", "133", "134", "135", "CTOTALE"),
         DECUC != "TOT") %>%
  left_join(NOMENCLATURE, by = "NOMENCLATURE") %>%
  left_join(DECUC, by = "DECUC") %>%
  mutate(DECUC = DECUC %>% as.numeric) %>%
  group_by(DECUC) %>%
  mutate(CONSO = CONSO/CONSO[NOMENCLATURE == "CTOTALE"]) %>%
  filter(NOMENCLATURE != "CTOTALE") %>%
  ggplot + geom_line(aes(x = DECUC2, y = CONSO, color = Nomenclature, group = Nomenclature)) +
  theme_minimal() + xlab("") + ylab("% de la Consommation Totale") +
  scale_y_continuous(breaks = 0.01*seq(-30, 50, 1),
                     labels = percent_format(accuracy = .1)) +
  #
  theme(legend.position = c(0.4, 0.8),
        legend.title = element_blank())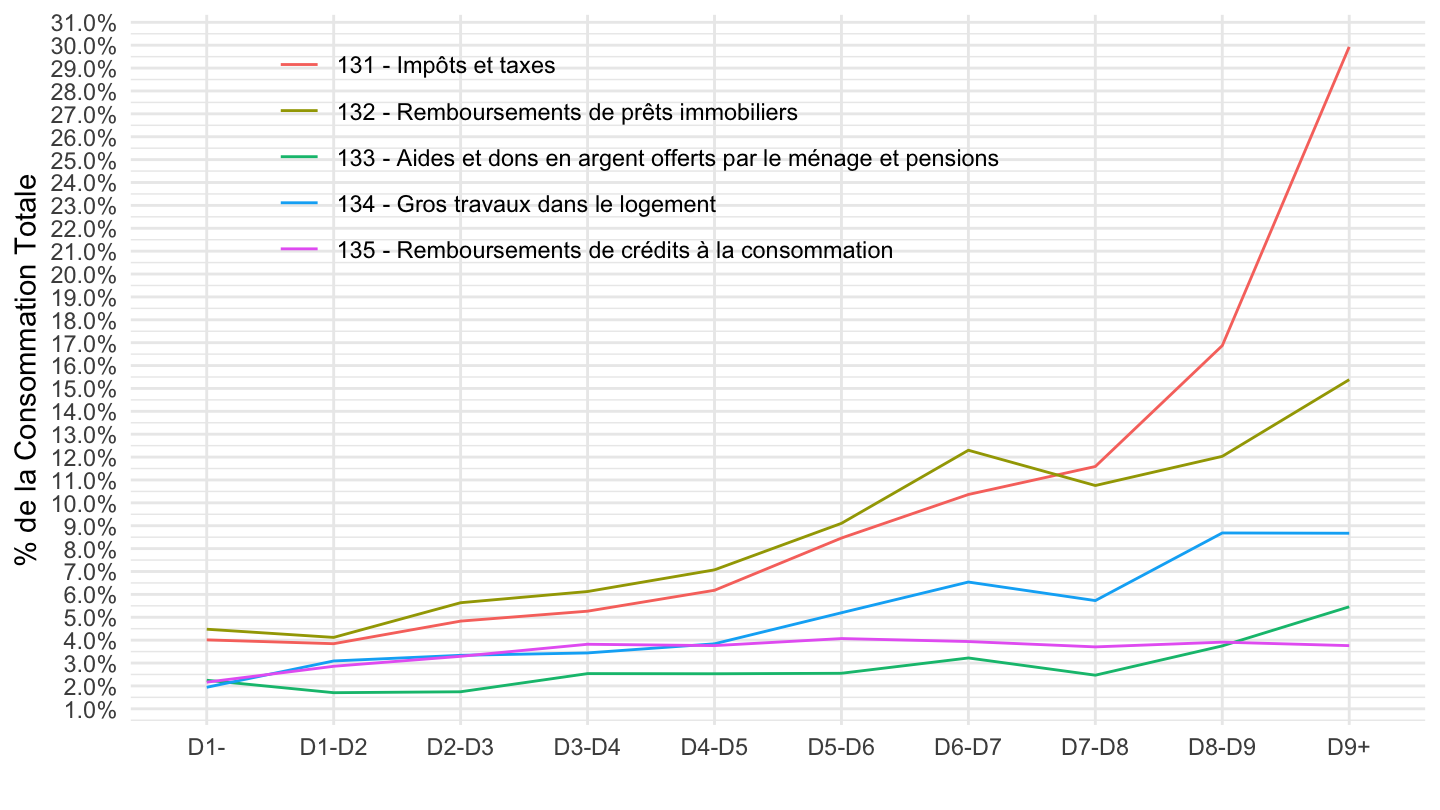
All
Code
tm106 %>%
  filter(NOMENCLATURE %in% c("132", "133", "134", "135", "CTOTALE"),
         DECUC != "TOT") %>%
  left_join(NOMENCLATURE, by = "NOMENCLATURE") %>%
  left_join(DECUC, by = "DECUC") %>%
  mutate(DECUC = DECUC %>% as.numeric) %>%
  group_by(DECUC) %>%
  mutate(CONSO = CONSO/CONSO[NOMENCLATURE == "CTOTALE"]) %>%
  filter(NOMENCLATURE != "CTOTALE") %>%
  ggplot + geom_line(aes(x = DECUC2, y = CONSO, color = Nomenclature, group = Nomenclature)) +
  theme_minimal() + xlab("") + ylab("% de la Consommation Totale") +
  scale_y_continuous(breaks = 0.01*seq(-30, 50, 1),
                     labels = percent_format(accuracy = .1)) +
  #
  theme(legend.position = c(0.4, 0.8),
        legend.title = element_blank())
Remboursements de prêts immobiliers, Loyers
DECUC
% de la consommation
Code
tm106 %>%
  filter(NOMENCLATURE %in% c("132Z", "0411", "0412", "CTOTALE"),
         DECUC != "TOT") %>%
  left_join(NOMENCLATURE, by = "NOMENCLATURE") %>%
  left_join(DECUC, by = "DECUC") %>%
  mutate(DECUC = DECUC %>% as.numeric) %>%
  group_by(DECUC) %>%
  mutate(CONSO = CONSO/CONSO[NOMENCLATURE == "CTOTALE"]) %>%
  filter(NOMENCLATURE != "CTOTALE") %>%
  ggplot + geom_line(aes(x = DECUC2, y = CONSO, color = Nomenclature, group = Nomenclature)) +
  theme_minimal() + xlab("") + ylab("% de la Consommation Totale") +
  scale_y_continuous(breaks = 0.01*seq(-30, 50, 0.5),
                     labels = percent_format(accuracy = .1)) +
  #
  theme(legend.position = c(0.4, 0.15),
        legend.title = element_blank())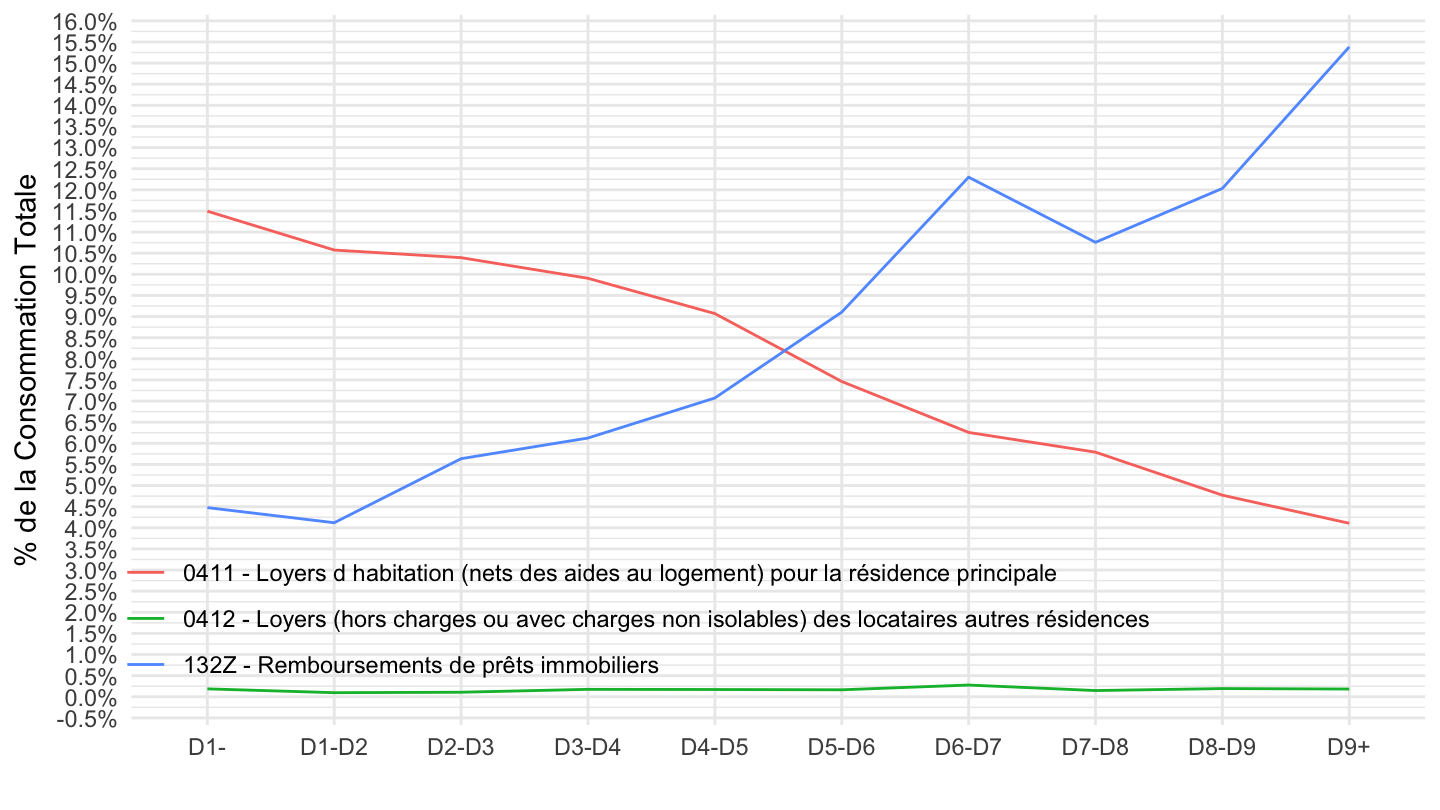
Remboursements de prêts immobiliers, Loyers
DECUC
% de la consommation
Code
tm106 %>%
  filter(NOMENCLATURE %in% c("132Z", "0411", "CTOTALE"),
         DECUC != "TOT") %>%
  left_join(NOMENCLATURE, by = "NOMENCLATURE") %>%
  left_join(DECUC, by = "DECUC") %>%
  mutate(DECUC = DECUC %>% as.numeric) %>%
  group_by(DECUC) %>%
  mutate(CONSO = CONSO/CONSO[NOMENCLATURE == "CTOTALE"]) %>%
  filter(NOMENCLATURE != "CTOTALE") %>%
  ggplot + geom_line(aes(x = DECUC2, y = CONSO, color = Nomenclature, group = Nomenclature)) +
  theme_minimal() + xlab("") + ylab("% de la Consommation Totale") +
  scale_y_continuous(breaks = 0.01*seq(-30, 50, 0.5),
                     labels = percent_format(accuracy = .1)) +
  #
  theme(legend.position = c(0.4, 0.8),
        legend.title = element_blank())
% du revenu
Code
tm106 %>%
  filter(NOMENCLATURE %in% c("132Z", "0411", "CTOTALE"),
         DECUC != "TOT") %>%
  left_join(NOMENCLATURE, by = "NOMENCLATURE") %>%
  left_join(DECUC, by = "DECUC") %>%
  left_join(revenu_dispo_decile, by = "DECUC") %>%
  mutate(DECUC = DECUC %>% as.numeric) %>%
  group_by(DECUC) %>%
  filter(NOMENCLATURE != "CTOTALE") %>%
  ggplot + geom_line(aes(x = DECUC2, y = CONSO/revenu_dispo_decile, color = Nomenclature, group = Nomenclature)) +
  theme_minimal() + xlab("") + ylab("% du revenu") +
  scale_y_continuous(breaks = 0.01*seq(-30, 50, 0.5),
                     labels = percent_format(accuracy = .1)) +
  theme(legend.position = c(0.6, 0.8),
        legend.title = element_blank())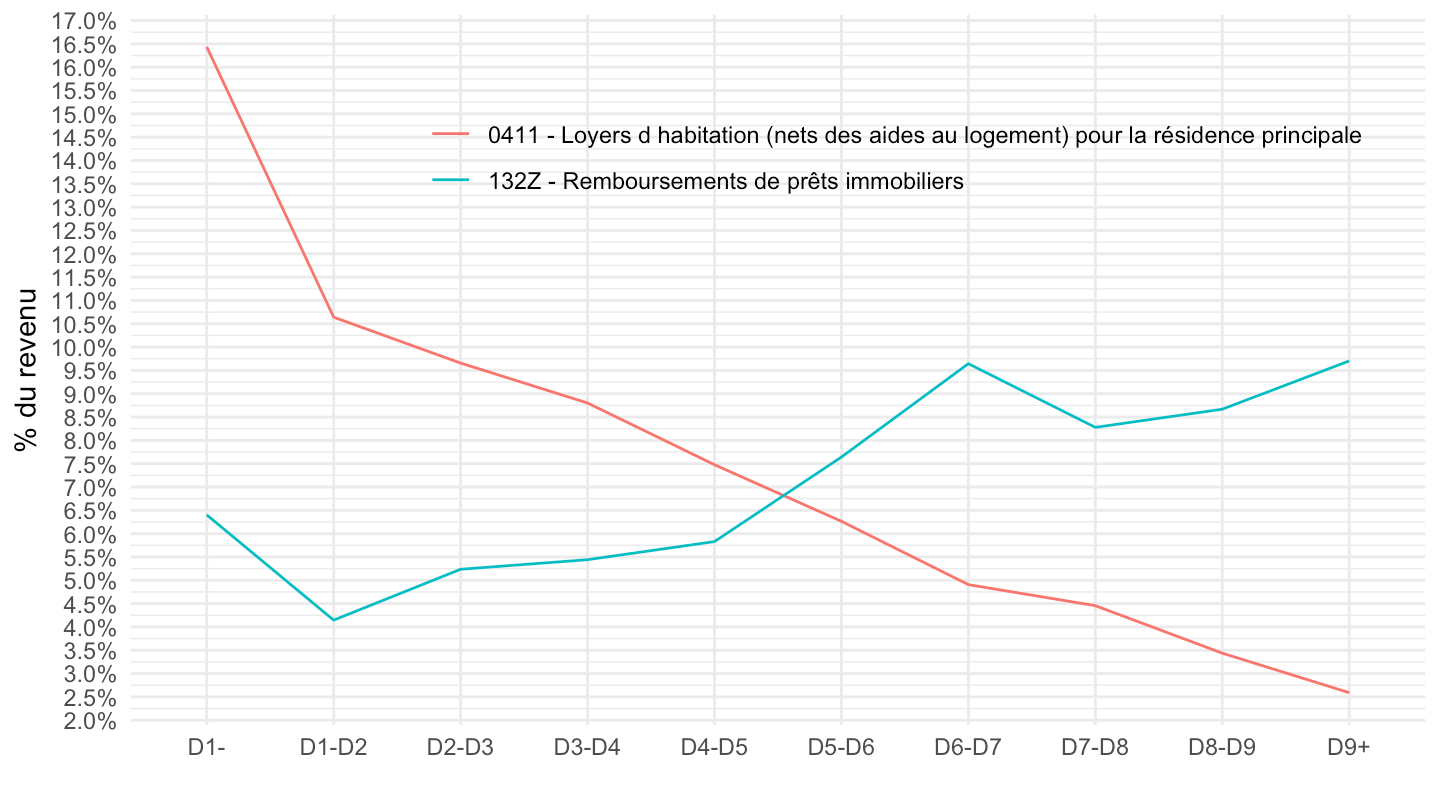
Consommation totale
% du revenu
Code
tm106 %>%
  filter(NOMENCLATURE %in% c("CTOTALE"),
         DECUC != "TOT") %>%
  left_join(NOMENCLATURE, by = "NOMENCLATURE") %>%
  left_join(DECUC, by = "DECUC") %>%
  left_join(revenu_dispo_decile, by = "DECUC") %>%
  mutate(DECUC = DECUC %>% as.numeric) %>%
  group_by(DECUC) %>%
  ggplot + geom_line(aes(x = DECUC2, y = CONSO/revenu_dispo_decile, color = Nomenclature, group = Nomenclature)) +
  theme_minimal() + xlab("") + ylab("% du revenu") +
  scale_y_continuous(breaks = 0.01*seq(-30, 200, 5),
                     labels = percent_format(accuracy = 1)) +
  theme(legend.position = c(0.6, 0.8),
        legend.title = element_blank())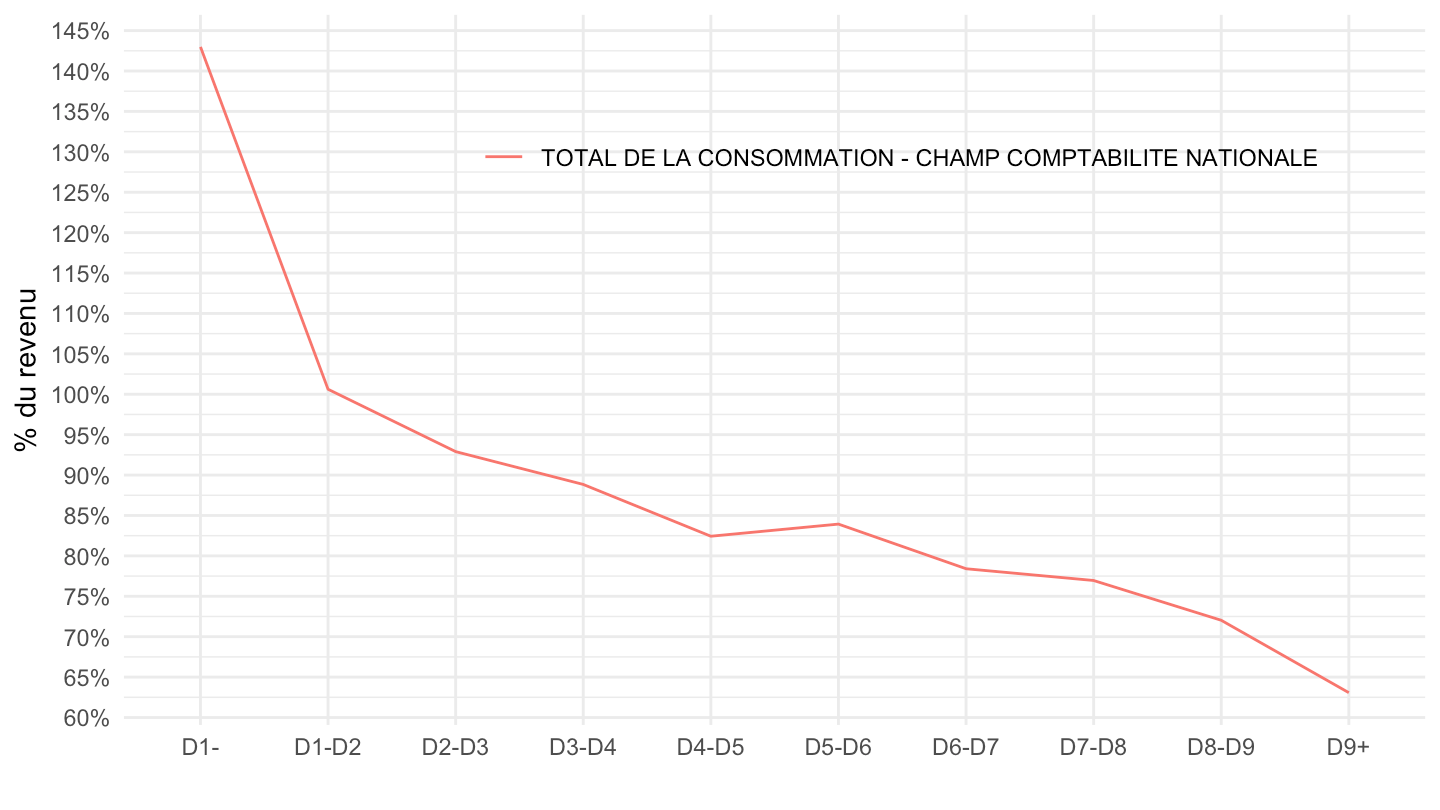
Epargne totale
% du revenu
Code
tm106 %>%
  filter(NOMENCLATURE %in% c("CTOTALE"),
         DECUC != "TOT") %>%
  left_join(NOMENCLATURE, by = "NOMENCLATURE") %>%
  left_join(DECUC, by = "DECUC") %>%
  left_join(revenu_dispo_decile, by = "DECUC") %>%
  mutate(DECUC = DECUC %>% as.numeric) %>%
  group_by(DECUC) %>%
  ggplot + geom_line(aes(x = DECUC2, y = 1-CONSO/revenu_dispo_decile, group = Nomenclature)) +
  theme_minimal() + xlab("") + ylab("% du revenu") +
  scale_y_continuous(breaks = 0.01*seq(-100, 200, 5),
                     labels = percent_format(accuracy = 1)) +
  theme(legend.position = c(0.6, 0.8),
        legend.title = element_blank())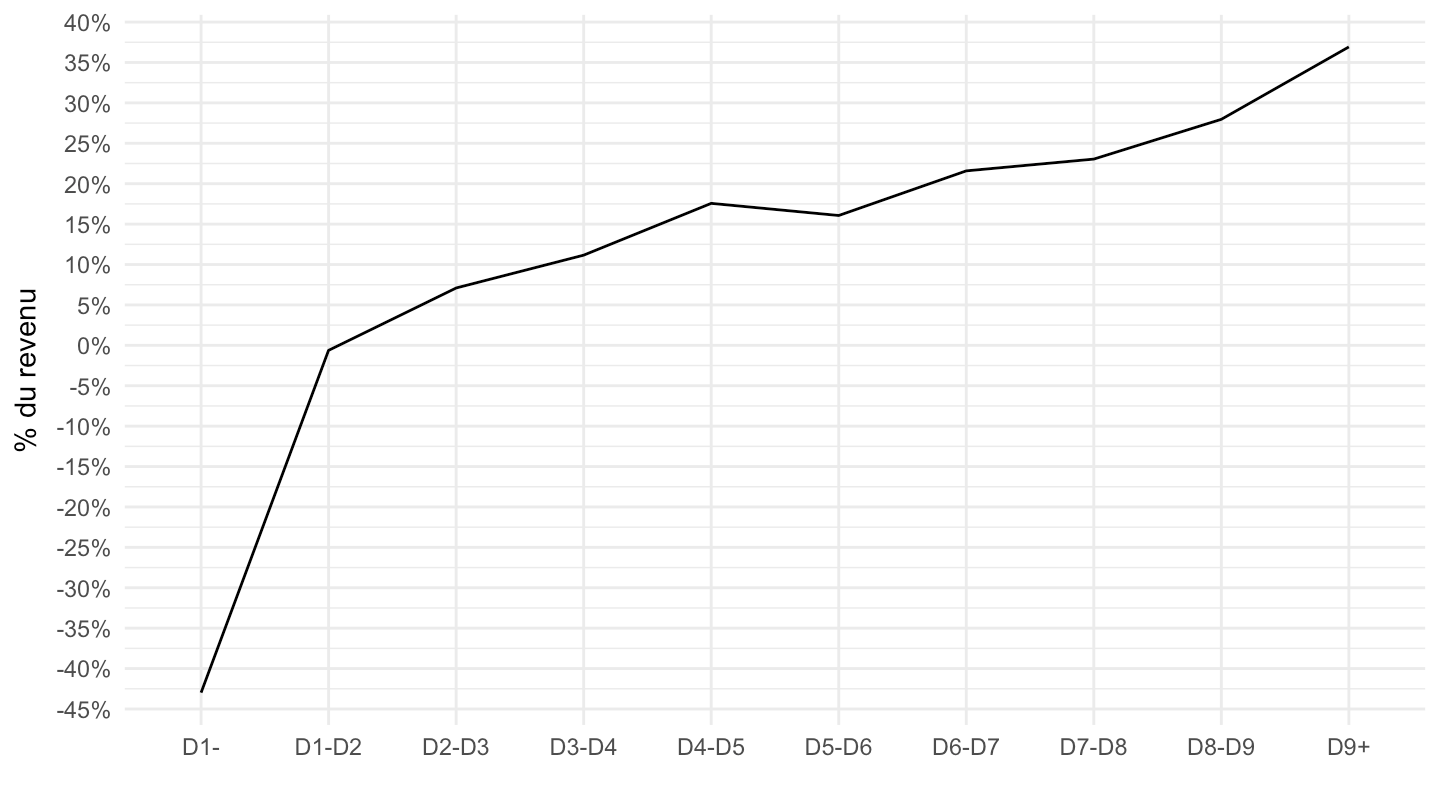
Electricité, Gaz, Electricite + gaz
DECUC
% de la consommation
Code
tm106 %>%
  filter(NOMENCLATURE %in% c("0451", "045", "0452","CTOTALE"),
         DECUC != "TOT") %>%
  left_join(NOMENCLATURE, by = "NOMENCLATURE") %>%
  left_join(DECUC, by = "DECUC") %>%
  mutate(DECUC = DECUC %>% as.numeric) %>%
  group_by(DECUC) %>%
  mutate(CONSO = CONSO/CONSO[NOMENCLATURE == "CTOTALE"]) %>%
  filter(NOMENCLATURE != "CTOTALE") %>%
  ggplot + geom_line(aes(x = DECUC2, y = CONSO, color = Nomenclature, group = Nomenclature)) +
  theme_minimal() + xlab("") + ylab("% de la Consommation Totale") +
  scale_y_continuous(breaks = 0.01*seq(-30, 50, 0.5),
                     labels = percent_format(accuracy = .1),
                     limits = c(0, 0.065)) +
  #
  theme(legend.position = c(0.4, 0.15),
        legend.title = element_blank())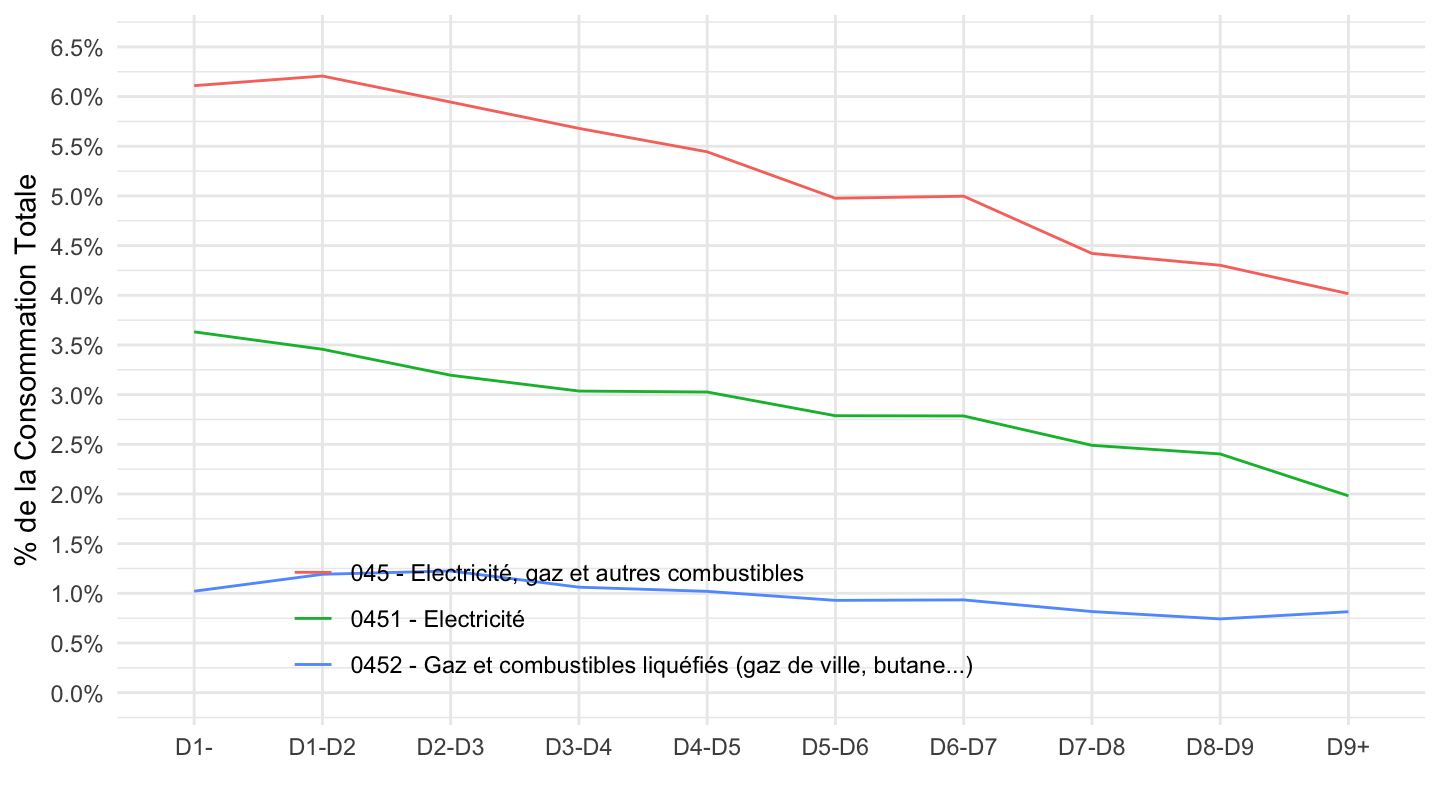
% du revenu
Code
tm106 %>%
  filter(NOMENCLATURE %in% c("0451", "045", "0452","CTOTALE"),
         DECUC != "TOT") %>%
  left_join(NOMENCLATURE, by = "NOMENCLATURE") %>%
  left_join(DECUC, by = "DECUC") %>%
  left_join(revenu_dispo_decile, by = "DECUC") %>%
  mutate(DECUC = DECUC %>% as.numeric) %>%
  group_by(DECUC) %>%
  filter(NOMENCLATURE != "CTOTALE") %>%
  ggplot + geom_line(aes(x = DECUC2, y = CONSO/revenu_dispo_decile, color = Nomenclature, group = Nomenclature)) +
  theme_minimal() + xlab("") + ylab("% du revenu") +
  scale_y_continuous(breaks = 0.01*seq(-30, 50, 0.5),
                     labels = percent_format(accuracy = .1),
                     limits = c(0, 0.09)) +
  theme(legend.position = c(0.6, 0.8),
        legend.title = element_blank())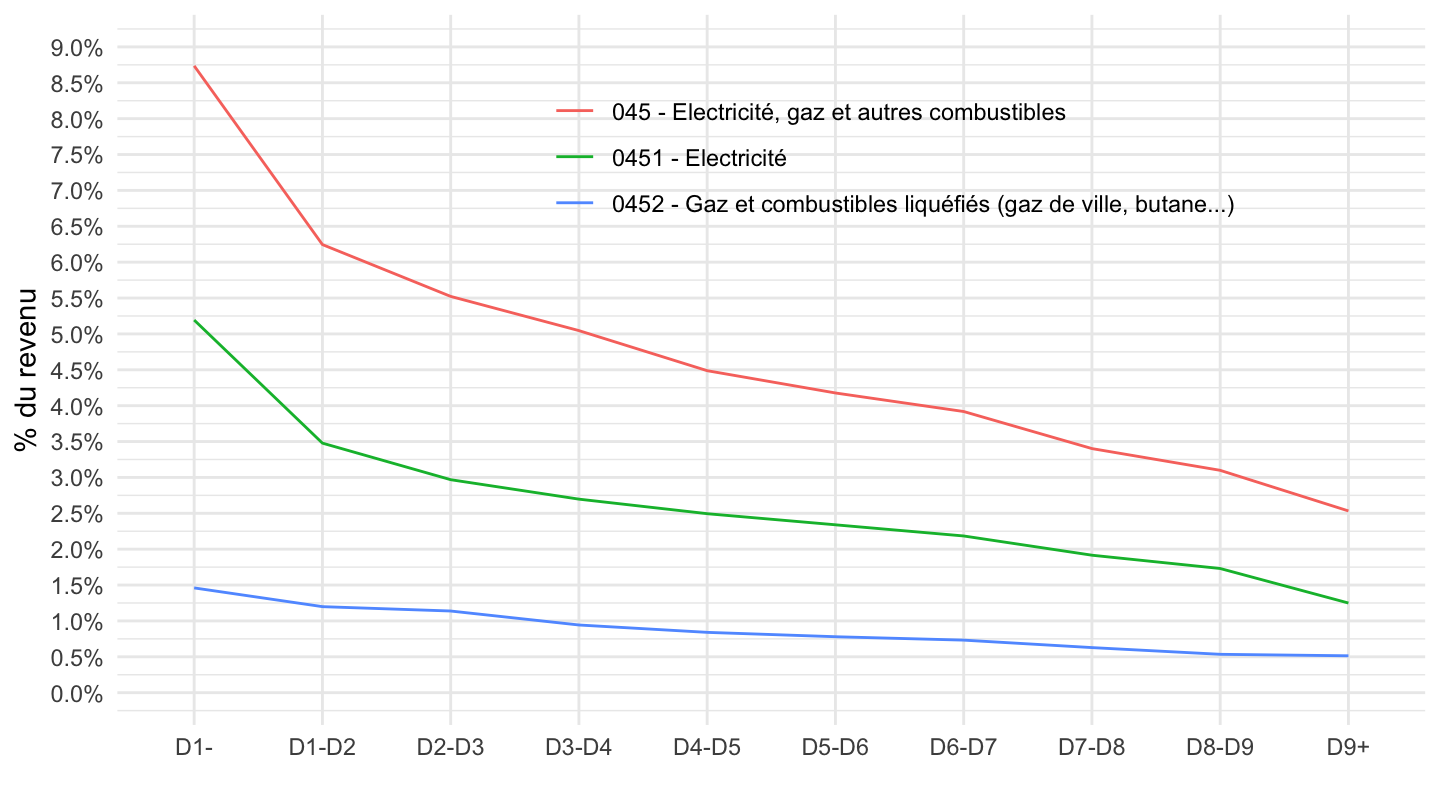
Carburants et lubrifiants, antigel (0722), Electricité (045)
CSPR
Code
tm103 %>%
  filter(NOMENCLATURE %in% c("0722", "045", "CTOTALE"),
         CSPR != "TOT") %>%
  left_join(NOMENCLATURE, by = "NOMENCLATURE") %>%
  left_join(CSPR, by = "CSPR") %>%
  group_by(CSPR) %>%
  mutate(CONSO = CONSO/CONSO[NOMENCLATURE == "CTOTALE"]) %>%
  mutate(Cspr = gsub(" ", " \n", Cspr),
         Cspr = ifelse(CSPR == "2", "Artisans, \ncommerçants \net chefs \nd'entreprise", Cspr)) %>%
  filter(NOMENCLATURE != "CTOTALE") %>%
  ggplot + geom_line(aes(x = paste0(CSPR, " - ", Cspr), y = CONSO, color = Nomenclature, group = Nomenclature)) +
  theme_minimal() + xlab("") + ylab("% de la Consommation Totale (Budget de famille 2017)") +
  scale_y_continuous(breaks = 0.01*seq(-30, 50, 0.5),
                     labels = percent_format(accuracy = .1)) +
  #
  theme(legend.position = c(0.4, 0.9),
        legend.title = element_blank())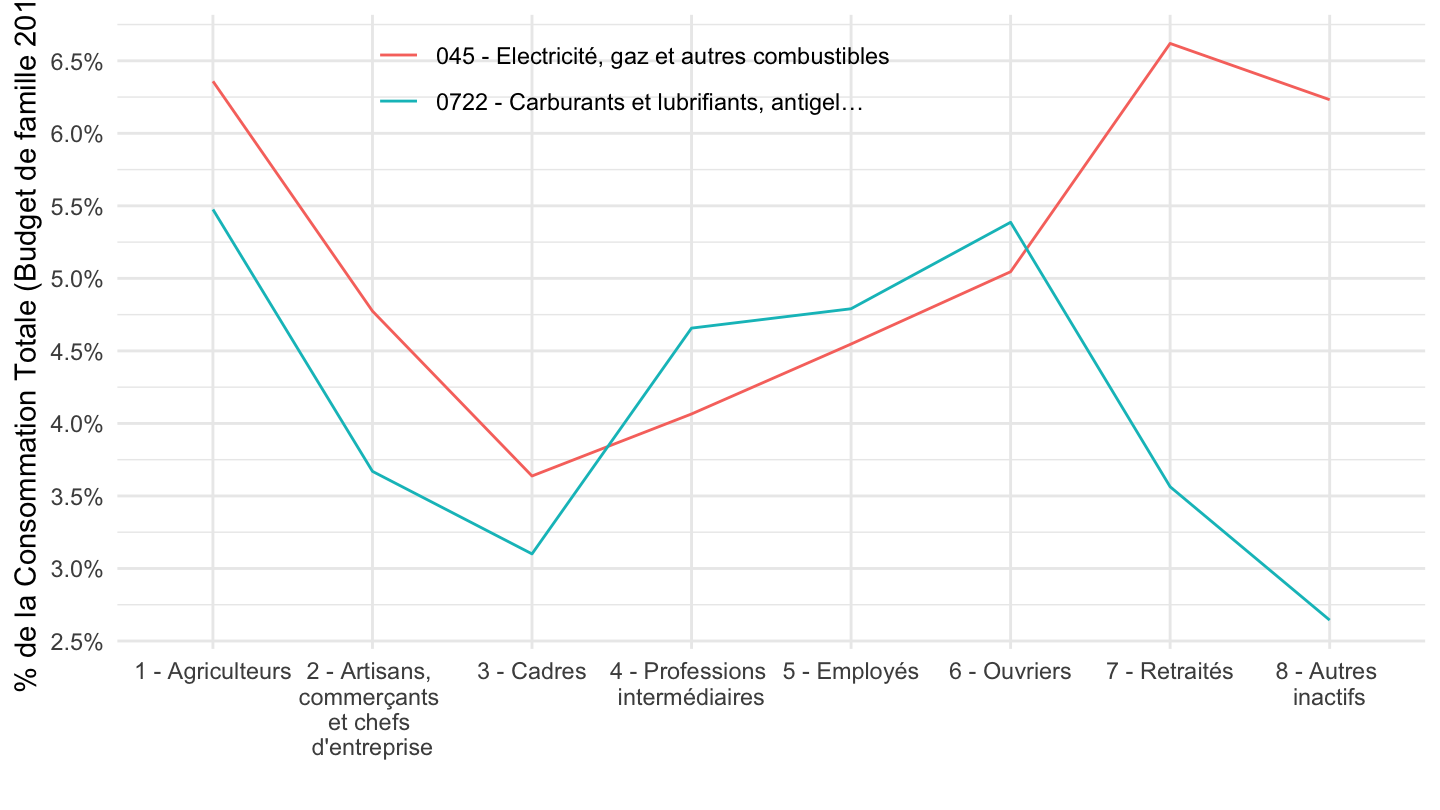
AGPR
% de la consommation
Code
tm102 %>%
  filter(NOMENCLATURE %in% c("0722", "045", "CTOTALE")) %>%
  left_join(NOMENCLATURE, by = "NOMENCLATURE") %>%
  left_join(AGPR, by = "AGPR") %>%
  filter(AGPR != "TOT") %>%
  group_by(AGPR) %>%
  mutate(AGPR2 = gsub(" ", " \n", AGPR2)) %>%
  mutate(CONSO = CONSO/CONSO[NOMENCLATURE == "CTOTALE"]) %>%
  filter(NOMENCLATURE != "CTOTALE") %>%
  ggplot + geom_line(aes(x = AGPR2, y = CONSO, color = Nomenclature, group = Nomenclature)) +
  theme_minimal() + xlab("") + ylab("% de la Consommation Totale") +
  scale_y_continuous(breaks = 0.01*seq(-30, 50, 1),
                     labels = percent_format(accuracy = 1),
                     limits = c(0, 0.08)) +
  #
  theme(legend.position = c(0.35, 0.9),
        legend.title = element_blank())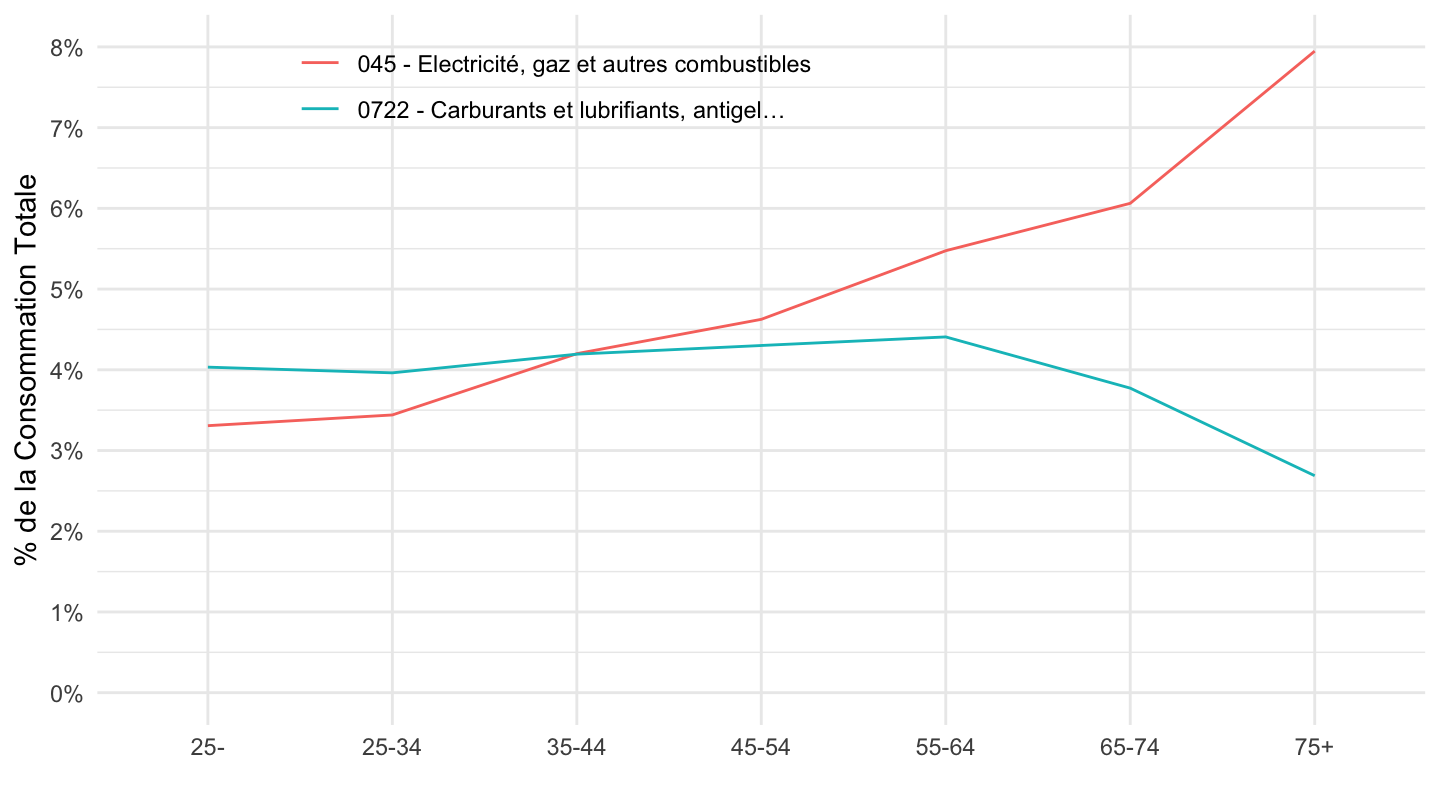
DECUC
% de la consommation
Code
tm106 %>%
  filter(NOMENCLATURE %in% c("0722", "045", "CTOTALE"),
         DECUC != "TOT") %>%
  left_join(NOMENCLATURE, by = "NOMENCLATURE") %>%
  left_join(DECUC, by = "DECUC") %>%
  mutate(DECUC = DECUC %>% as.numeric) %>%
  group_by(DECUC) %>%
  mutate(CONSO = CONSO/CONSO[NOMENCLATURE == "CTOTALE"]) %>%
  filter(NOMENCLATURE != "CTOTALE") %>%
  ggplot + geom_line(aes(x = DECUC2, y = CONSO, color = Nomenclature, group = Nomenclature)) +
  theme_minimal() + xlab("") + ylab("% de la Consommation Totale") +
  scale_y_continuous(breaks = 0.01*seq(-30, 50, 0.5),
                     labels = percent_format(accuracy = .1),
                     limits = c(0, 0.065)) +
  #
  theme(legend.position = c(0.4, 0.15),
        legend.title = element_blank())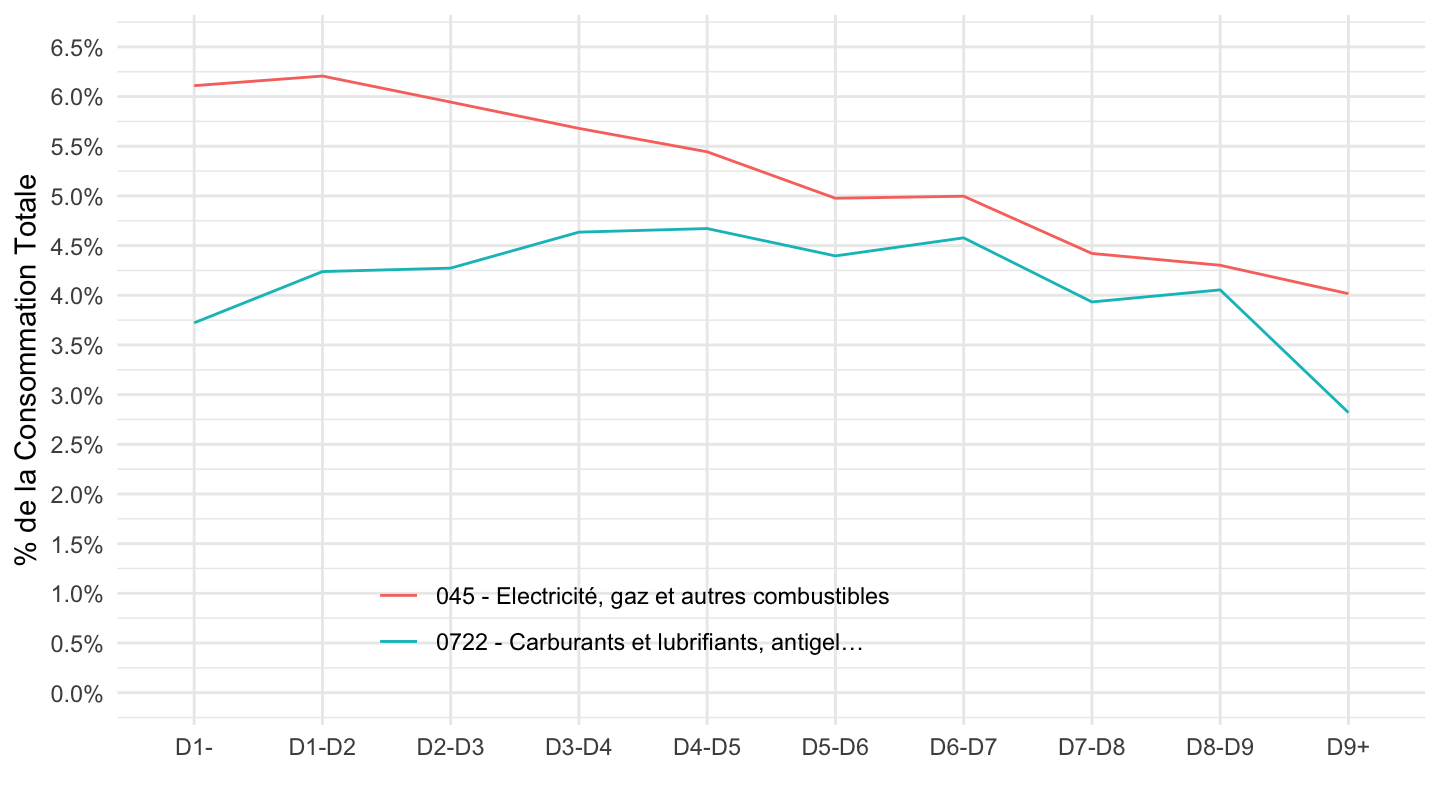
% du revenu
Code
tm106 %>%
  filter(NOMENCLATURE %in% c("0722", "045"),
         DECUC != "TOT") %>%
  left_join(NOMENCLATURE, by = "NOMENCLATURE") %>%
  left_join(DECUC, by = "DECUC") %>%
  left_join(revenu_dispo_decile, by = "DECUC") %>%
  mutate(DECUC = DECUC %>% as.numeric) %>%
  group_by(DECUC) %>%
  ggplot + geom_line(aes(x = DECUC2, y = CONSO/revenu_dispo_decile, color = Nomenclature, group = Nomenclature)) +
  theme_minimal() + xlab("") + ylab("% du revenu") +
  scale_y_continuous(breaks = 0.01*seq(-30, 50, 0.5),
                     labels = percent_format(accuracy = .1),
                     limits = c(0, 0.09)) +
  #
  theme(legend.position = c(0.4, 0.15),
        legend.title = element_blank())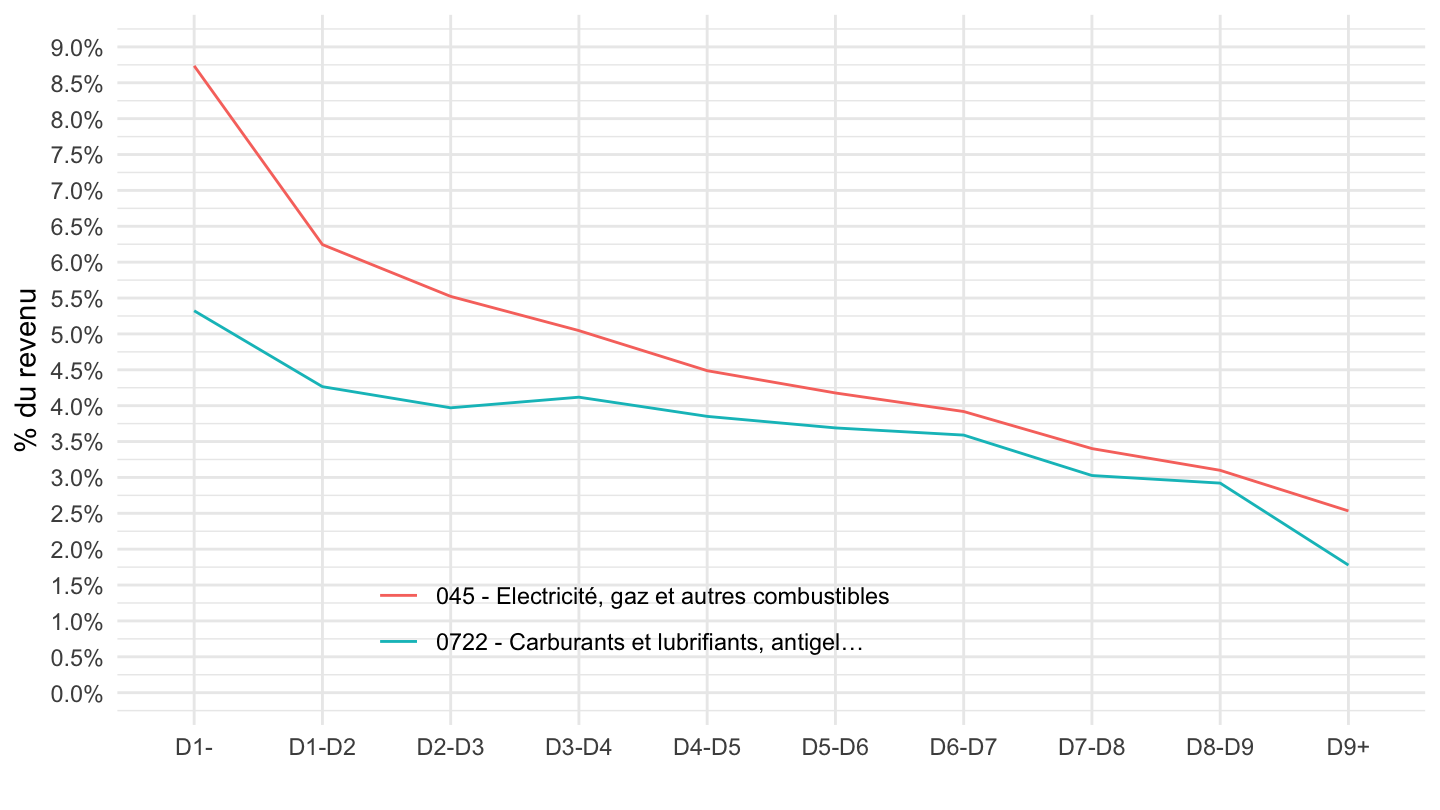
STRATE
Code
tm104 %>%
  filter(NOMENCLATURE %in% c("0722", "045", "CTOTALE"),
         STRATE != "TOT") %>%
  left_join(NOMENCLATURE, by = "NOMENCLATURE") %>%
  left_join(STRATE, by = "STRATE") %>%
  group_by(STRATE) %>%
  mutate(CONSO = CONSO/CONSO[NOMENCLATURE == "CTOTALE"]) %>%
  filter(NOMENCLATURE != "CTOTALE") %>%
  mutate(Strate = gsub("\\(", "\n\\(", Strate)) %>%
  ggplot + geom_line(aes(x = paste0(STRATE, " - ", Strate), y = CONSO, color = Nomenclature, group = Nomenclature)) +
  theme_minimal() + xlab("") + ylab("% de la Consommation Totale") +
  scale_y_continuous(breaks = 0.01*seq(-30, 50, 0.5),
                     labels = percent_format(accuracy = .1),
                     limits = c(0, 0.065)) +
  #
  theme(legend.position = c(0.4, 0.15),
        legend.title = element_blank())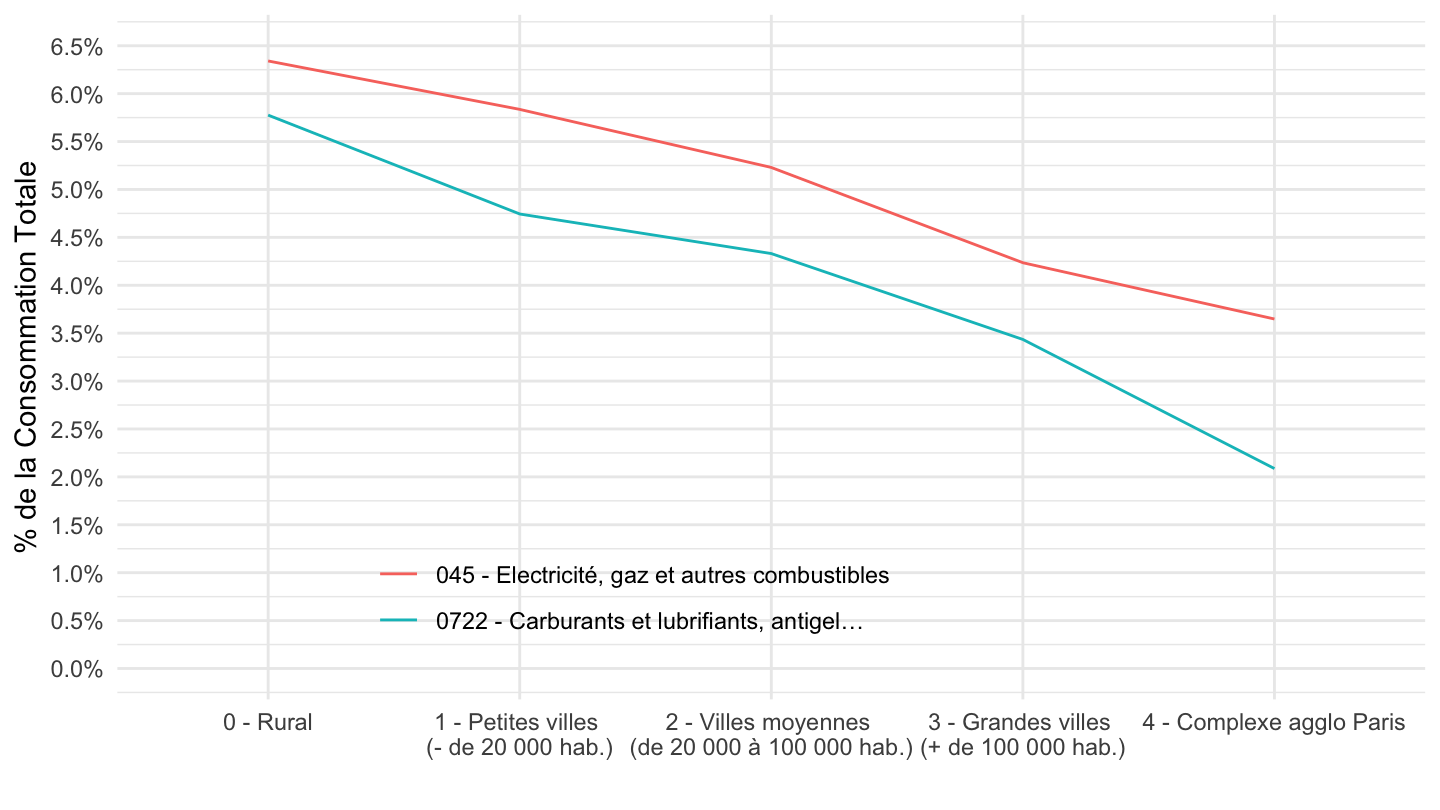
TYPMEN
Code
tm105 %>%
  filter(NOMENCLATURE %in% c("0722", "045", "CTOTALE")) %>%
  left_join(NOMENCLATURE, by = "NOMENCLATURE") %>%
  left_join(TYPMEN, by = "TYPMEN") %>%
  filter(TYPMEN != "TOT") %>%
  group_by(TYPMEN) %>%
  mutate(CONSO = CONSO/CONSO[NOMENCLATURE == "CTOTALE"]) %>%
  filter(NOMENCLATURE != "CTOTALE") %>%
  mutate(Typmen = gsub(" ", " \n", Typmen)) %>%
  ggplot + geom_line(aes(x = paste0(TYPMEN, " - ", Typmen), y = CONSO, color = Nomenclature, group = Nomenclature)) +
  theme_minimal() + xlab("") + ylab("% de la Consommation Totale (Budget de famille 2017)") +
  scale_y_continuous(breaks = 0.01*seq(-30, 50, 0.2),
                     labels = percent_format(accuracy = .1)) +

  theme(legend.position = c(0.4, 0.9),
        legend.title = element_blank())
ZEAT2
Code
tm101 %>%
  filter(NOMENCLATURE %in% c("0722", "045", "CTOTALE")) %>%
  left_join(NOMENCLATURE, by = "NOMENCLATURE") %>%
  left_join(ZEAT2, by = "ZEAT2") %>%
  filter(ZEAT2 != "TOT") %>%
  group_by(ZEAT2) %>%
  mutate(CONSO = CONSO/CONSO[NOMENCLATURE == "CTOTALE"]) %>%
  filter(NOMENCLATURE != "CTOTALE") %>%
  mutate(Zeat2 = gsub(" ", " \n", Zeat2)) %>%
  ggplot + geom_line(aes(x = Zeat2, y = CONSO, color = Nomenclature, group = Nomenclature)) +
  theme_minimal() + xlab("") + ylab("% de la Consommation Totale (Budget de famille 2017)") +
  scale_y_continuous(breaks = 0.01*seq(-30, 50, 0.5),
                     labels = percent_format(accuracy = .1)) +

  theme(legend.position = c(0.4, 0.2),
        legend.title = element_blank())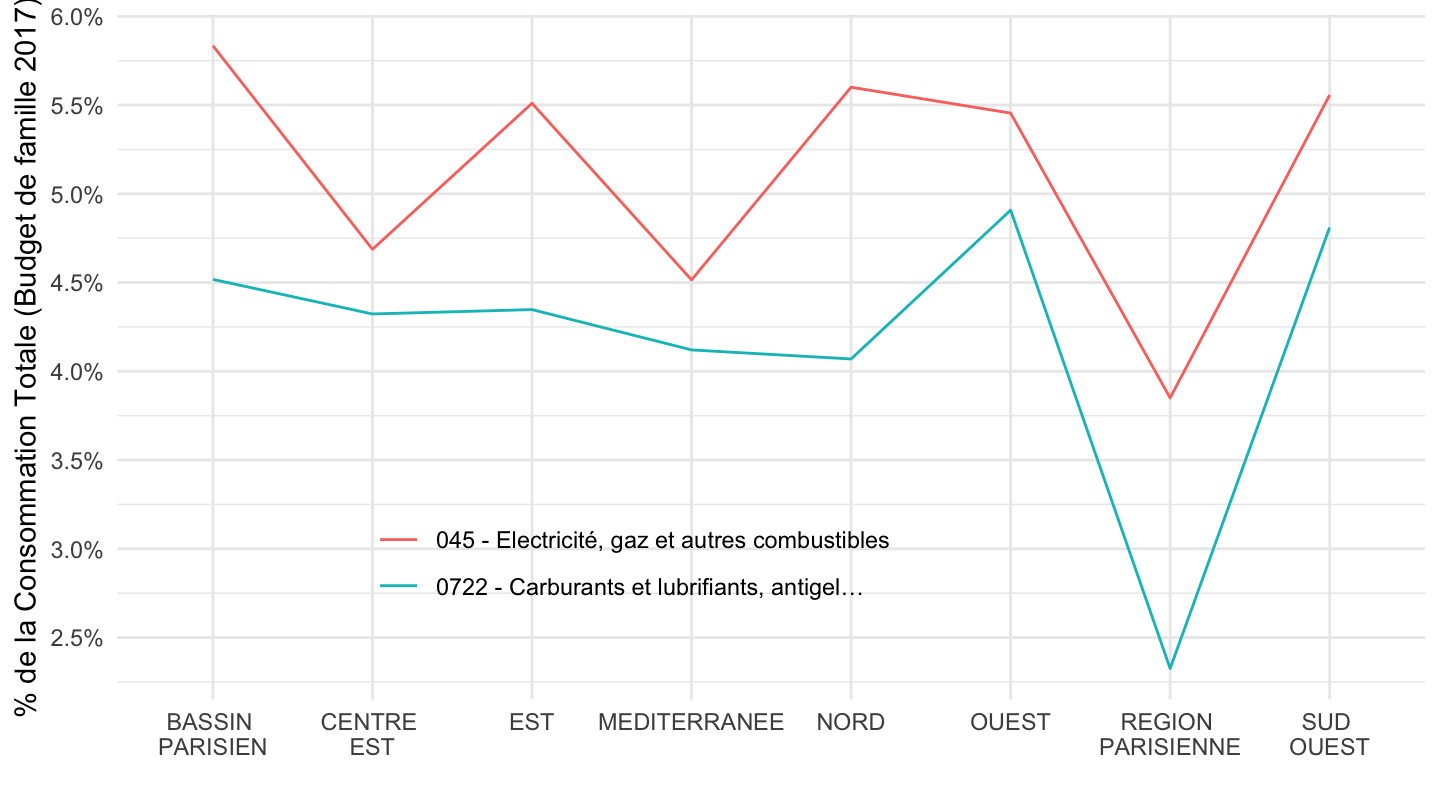
Communications (081), Services de téléphone (0813)
CSPR
Code
tm103 %>%
  filter(NOMENCLATURE %in% c("081", "0813", "CTOTALE"),
         CSPR != "TOT") %>%
  left_join(NOMENCLATURE, by = "NOMENCLATURE") %>%
  left_join(CSPR, by = "CSPR") %>%
  group_by(CSPR) %>%
  mutate(CONSO = CONSO/CONSO[NOMENCLATURE == "CTOTALE"]) %>%
  mutate(Cspr = gsub(" ", " \n", Cspr),
         Cspr = ifelse(CSPR == "2", "Artisans, \ncommerçants \net chefs \nd'entreprise", Cspr)) %>%
  filter(NOMENCLATURE != "CTOTALE") %>%
  ggplot + geom_line(aes(x = paste0(CSPR, " - ", Cspr), y = CONSO, color = Nomenclature, group = Nomenclature)) +
  theme_minimal() + xlab("") + ylab("% de la Consommation Totale (Budget de famille 2017)") +
  scale_y_continuous(breaks = 0.01*seq(-30, 50, 0.5),
                     labels = percent_format(accuracy = .1)) +

  theme(legend.position = c(0.4, 0.9),
        legend.title = element_blank())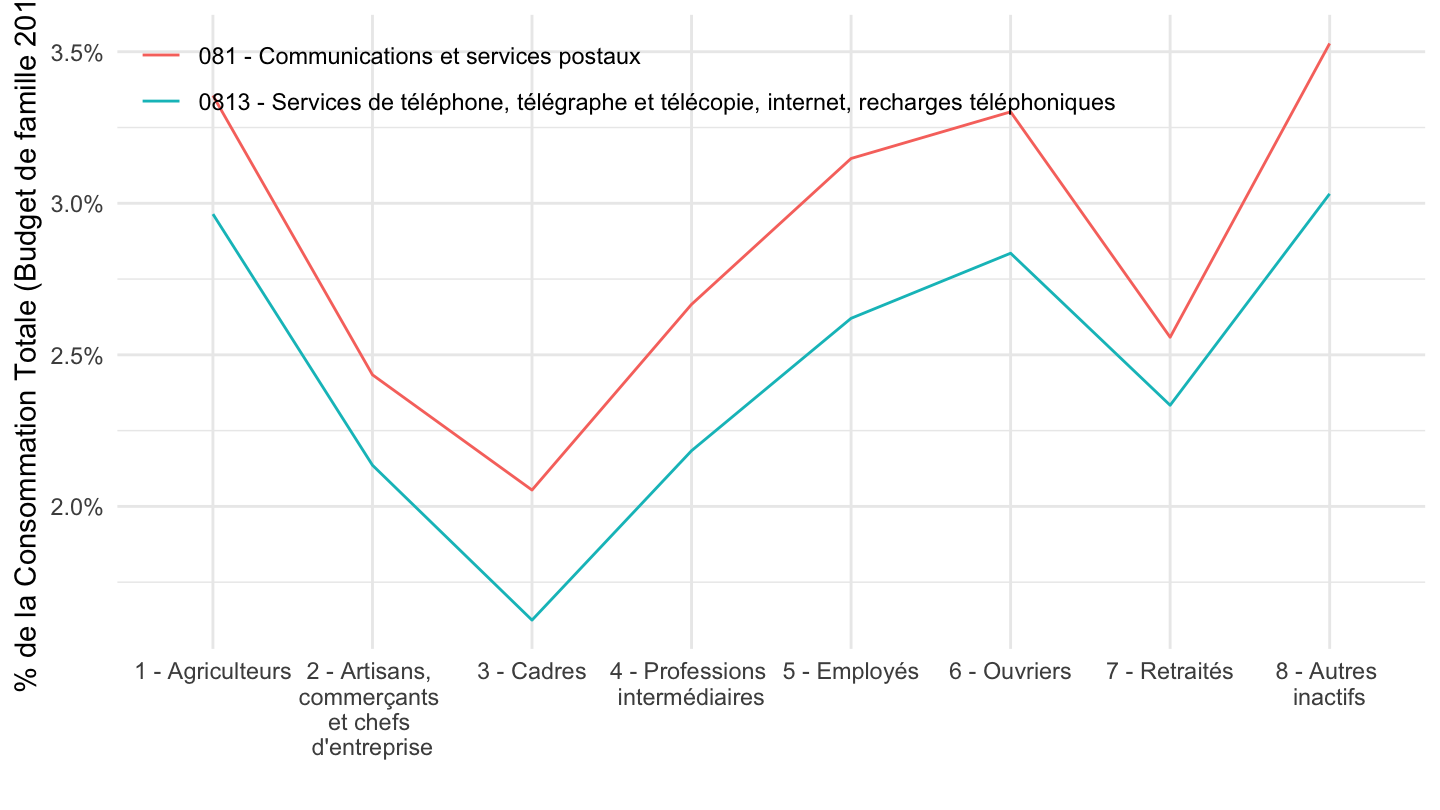
AGPR
Code
tm102 %>%
  filter(NOMENCLATURE %in% c("081", "0813", "CTOTALE")) %>%
  left_join(NOMENCLATURE, by = "NOMENCLATURE") %>%
  left_join(AGPR, by = "AGPR") %>%
  filter(AGPR != "TOT") %>%
  group_by(AGPR) %>%
  mutate(AGPR2 = gsub(" ", " \n", AGPR2)) %>%
  mutate(CONSO = CONSO/CONSO[NOMENCLATURE == "CTOTALE"]) %>%
  filter(NOMENCLATURE != "CTOTALE") %>%
  ggplot + geom_line(aes(x = AGPR2, y = CONSO, color = Nomenclature, group = Nomenclature)) +
  theme_minimal() + xlab("") + ylab("% de la Consommation Totale (Budget de famille 2017)") +
  scale_y_continuous(breaks = 0.01*seq(-30, 50, 0.2),
                     labels = percent_format(accuracy = .1),
                     limits = c(0, 0.037)) +

  theme(legend.position = c(0.55, 0.9),
        legend.title = element_blank())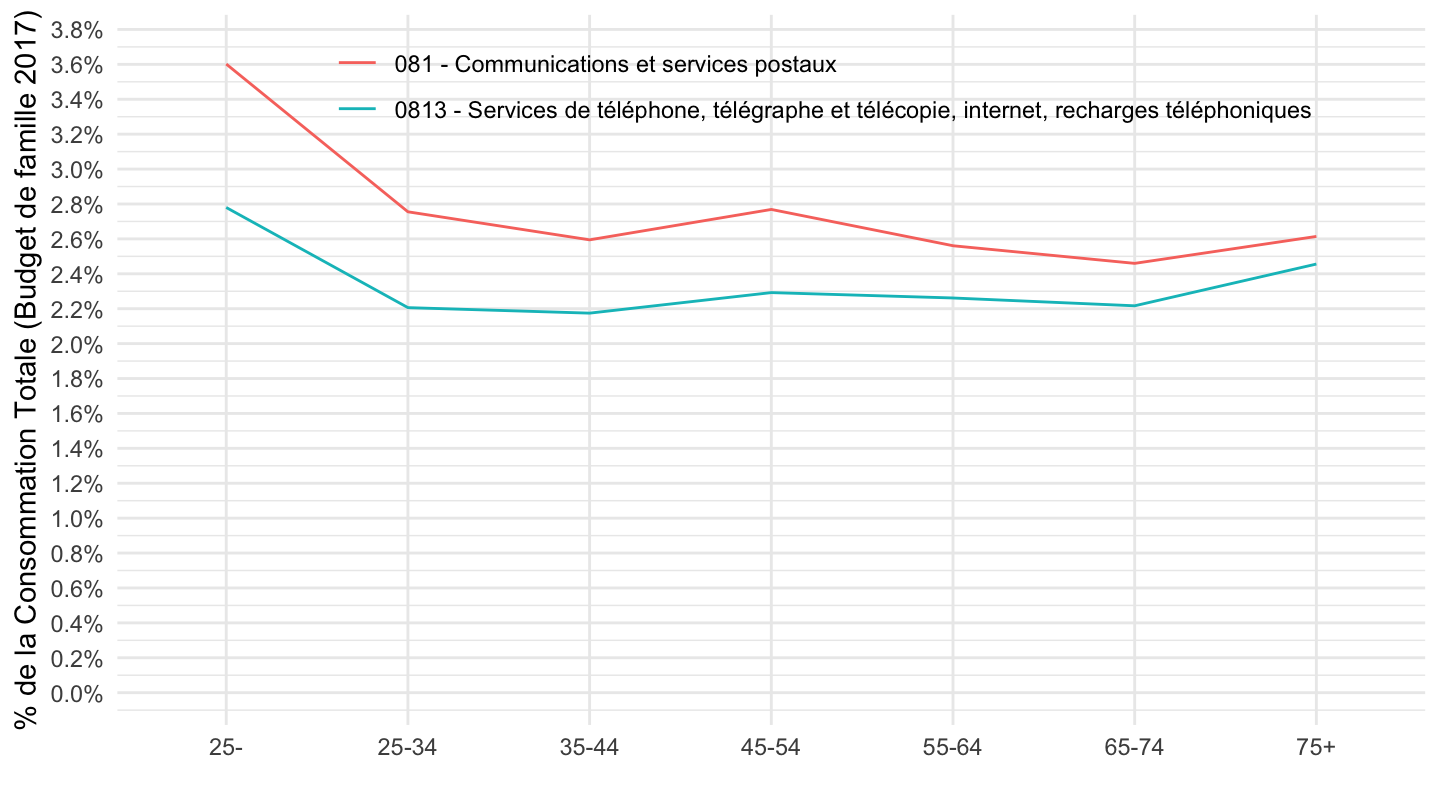
DECUC
Code
tm106 %>%
  filter(NOMENCLATURE %in% c("081", "0813", "CTOTALE"),
         DECUC != "TOT") %>%
  left_join(NOMENCLATURE, by = "NOMENCLATURE") %>%
  left_join(DECUC, by = "DECUC") %>%
  mutate(DECUC = DECUC %>% as.numeric) %>%
  group_by(DECUC) %>%
  mutate(CONSO = CONSO/CONSO[NOMENCLATURE == "CTOTALE"]) %>%
  filter(NOMENCLATURE != "CTOTALE") %>%
  ggplot + geom_line(aes(x = DECUC2, y = CONSO, color = Nomenclature, group = Nomenclature)) +
  theme_minimal() + xlab("") + ylab("% de la Consommation Totale") +
  scale_y_continuous(breaks = 0.01*seq(-30, 50, 0.5),
                     labels = percent_format(accuracy = .1),
                     limits = c(0, 0.039)) +

  theme(legend.position = c(0.4, 0.15),
        legend.title = element_blank())
STRATE
Code
tm104 %>%
  filter(NOMENCLATURE %in% c("081", "0813", "CTOTALE"),
         STRATE != "TOT") %>%
  left_join(NOMENCLATURE, by = "NOMENCLATURE") %>%
  left_join(STRATE, by = "STRATE") %>%
  group_by(STRATE) %>%
  mutate(CONSO = CONSO/CONSO[NOMENCLATURE == "CTOTALE"]) %>%
  filter(NOMENCLATURE != "CTOTALE") %>%
  mutate(Strate = gsub("\\(", "\n\\(", Strate)) %>%
  ggplot + geom_line(aes(x = paste0(STRATE, " - ", Strate), y = CONSO, color = Nomenclature, group = Nomenclature)) +
  theme_minimal() + xlab("") + ylab("% de la Consommation Totale") +
  scale_y_continuous(breaks = 0.01*seq(-30, 50, 0.1),
                     labels = percent_format(accuracy = .1),
                     limits = c(0, 0.029)) +

  theme(legend.position = c(0.4, 0.15),
        legend.title = element_blank())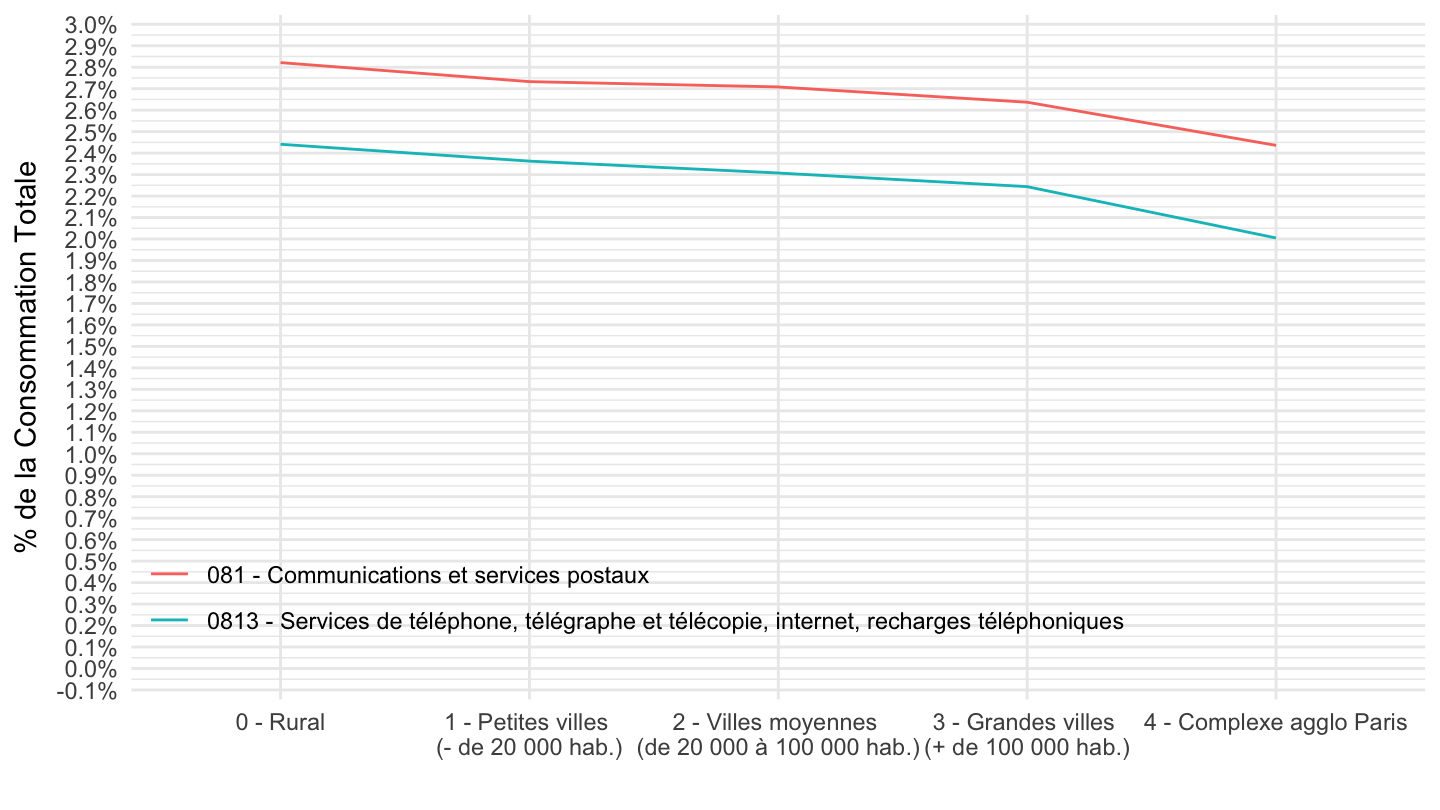
TYPMEN
Code
tm105 %>%
  filter(NOMENCLATURE %in% c("081", "0813", "CTOTALE")) %>%
  left_join(NOMENCLATURE, by = "NOMENCLATURE") %>%
  left_join(TYPMEN, by = "TYPMEN") %>%
  filter(TYPMEN != "TOT") %>%
  group_by(TYPMEN) %>%
  mutate(CONSO = CONSO/CONSO[NOMENCLATURE == "CTOTALE"]) %>%
  filter(NOMENCLATURE != "CTOTALE") %>%
  mutate(Typmen = gsub(" ", " \n", Typmen)) %>%
  ggplot + geom_line(aes(x = paste0(TYPMEN, " - ", Typmen), y = CONSO, color = Nomenclature, group = Nomenclature)) +
  theme_minimal() + xlab("") + ylab("% de la Consommation Totale (Budget de famille 2017)") +
  scale_y_continuous(breaks = 0.01*seq(-30, 50, 0.1),
                     labels = percent_format(accuracy = .1)) +

  theme(legend.position = c(0.4, 0.9),
        legend.title = element_blank())
ZEAT2
Code
tm101 %>%
  filter(NOMENCLATURE %in% c("081", "0813", "CTOTALE")) %>%
  left_join(NOMENCLATURE, by = "NOMENCLATURE") %>%
  left_join(ZEAT2, by = "ZEAT2") %>%
  filter(ZEAT2 != "TOT") %>%
  group_by(ZEAT2) %>%
  mutate(CONSO = CONSO/CONSO[NOMENCLATURE == "CTOTALE"]) %>%
  filter(NOMENCLATURE != "CTOTALE") %>%
  mutate(Zeat2 = gsub(" ", " \n", Zeat2)) %>%
  ggplot + geom_line(aes(x = Zeat2, y = CONSO, color = Nomenclature, group = Nomenclature)) +
  theme_minimal() + xlab("") + ylab("% de la Consommation Totale (Budget de famille 2017)") +
  scale_y_continuous(breaks = 0.01*seq(-30, 50, 0.1),
                     labels = percent_format(accuracy = .1)) +

  theme(legend.position = c(0.4, 0.7),
        legend.title = element_blank())
Pâtes
DECUC
Code
tm106 %>%
  filter(NOMENCLATURE %in% c("01113", "CTOTALE"),
         DECUC != "TOT") %>%
  left_join(NOMENCLATURE, by = "NOMENCLATURE") %>%
  left_join(DECUC, by = "DECUC") %>%
  mutate(DECUC = DECUC %>% as.numeric) %>%
  group_by(DECUC) %>%
  mutate(CONSO = CONSO/CONSO[NOMENCLATURE == "CTOTALE"]) %>%
  filter(NOMENCLATURE != "CTOTALE") %>%
  ggplot + geom_line(aes(x = DECUC2, y = CONSO, color = Nomenclature, group = Nomenclature)) +
  theme_minimal() + xlab("") + ylab("% de la Consommation Totale") +
  scale_y_continuous(breaks = 0.01*seq(-30, 50, 0.01),
                     labels = percent_format(accuracy = .01)) +
  #
  theme(legend.position = c(0.4, 0.3),
        legend.title = element_blank())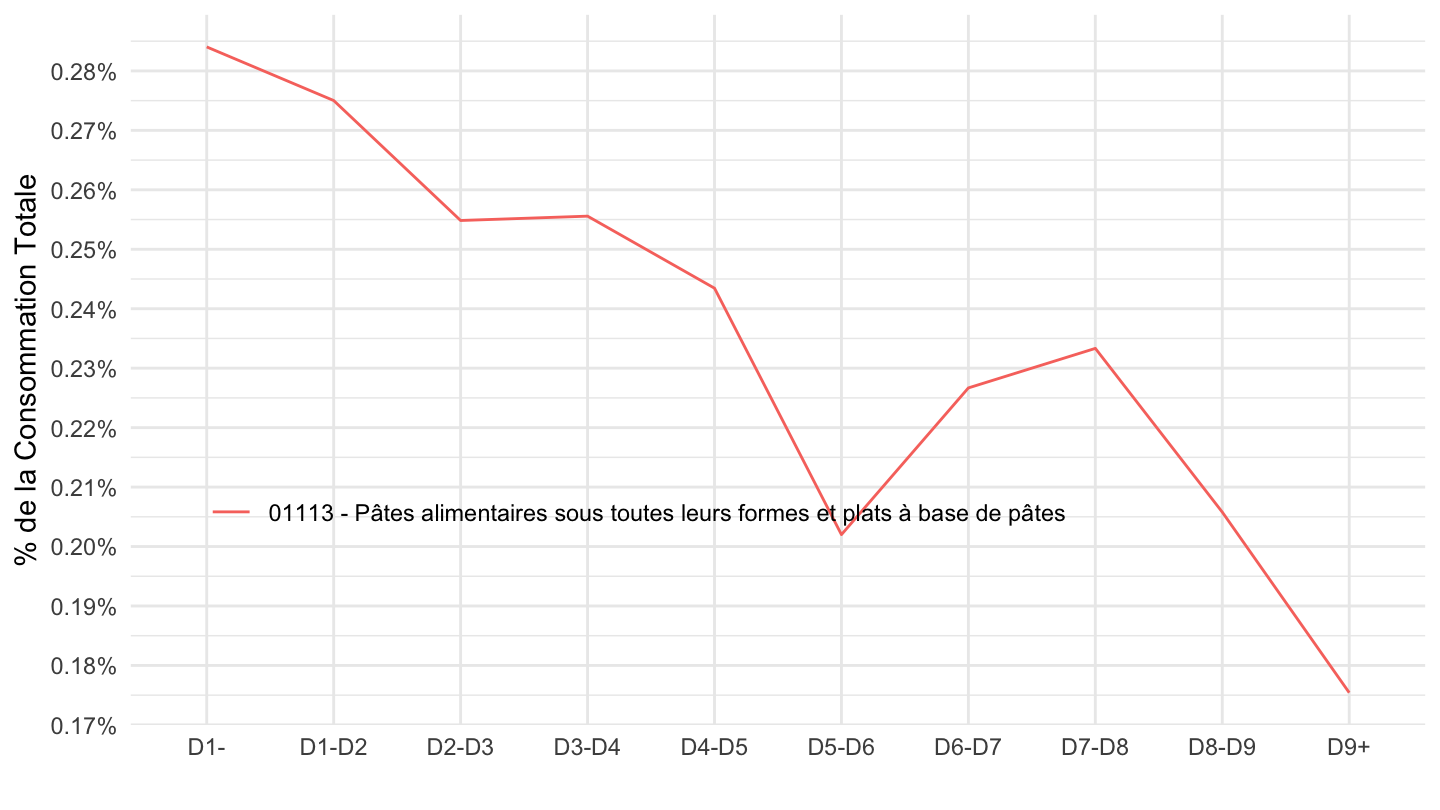
% du revenu
Code
tm106 %>%
  filter(NOMENCLATURE %in% c("01113"),
         DECUC != "TOT") %>%
  left_join(NOMENCLATURE, by = "NOMENCLATURE") %>%
  left_join(DECUC, by = "DECUC") %>%
  left_join(revenu_dispo_decile, by = "DECUC") %>%
  mutate(DECUC = DECUC %>% as.numeric) %>%
  group_by(DECUC) %>%
  ggplot + geom_line(aes(x = DECUC2, y = CONSO/revenu_dispo_decile, color = Nomenclature, group = Nomenclature)) +
  theme_minimal() + xlab("") + ylab("% du revenu") +
  scale_y_continuous(breaks = 0.01*seq(-30, 50, 0.02),
                     labels = percent_format(accuracy = .01)) +
  #
  theme(legend.position = c(0.4, 0.15),
        legend.title = element_blank())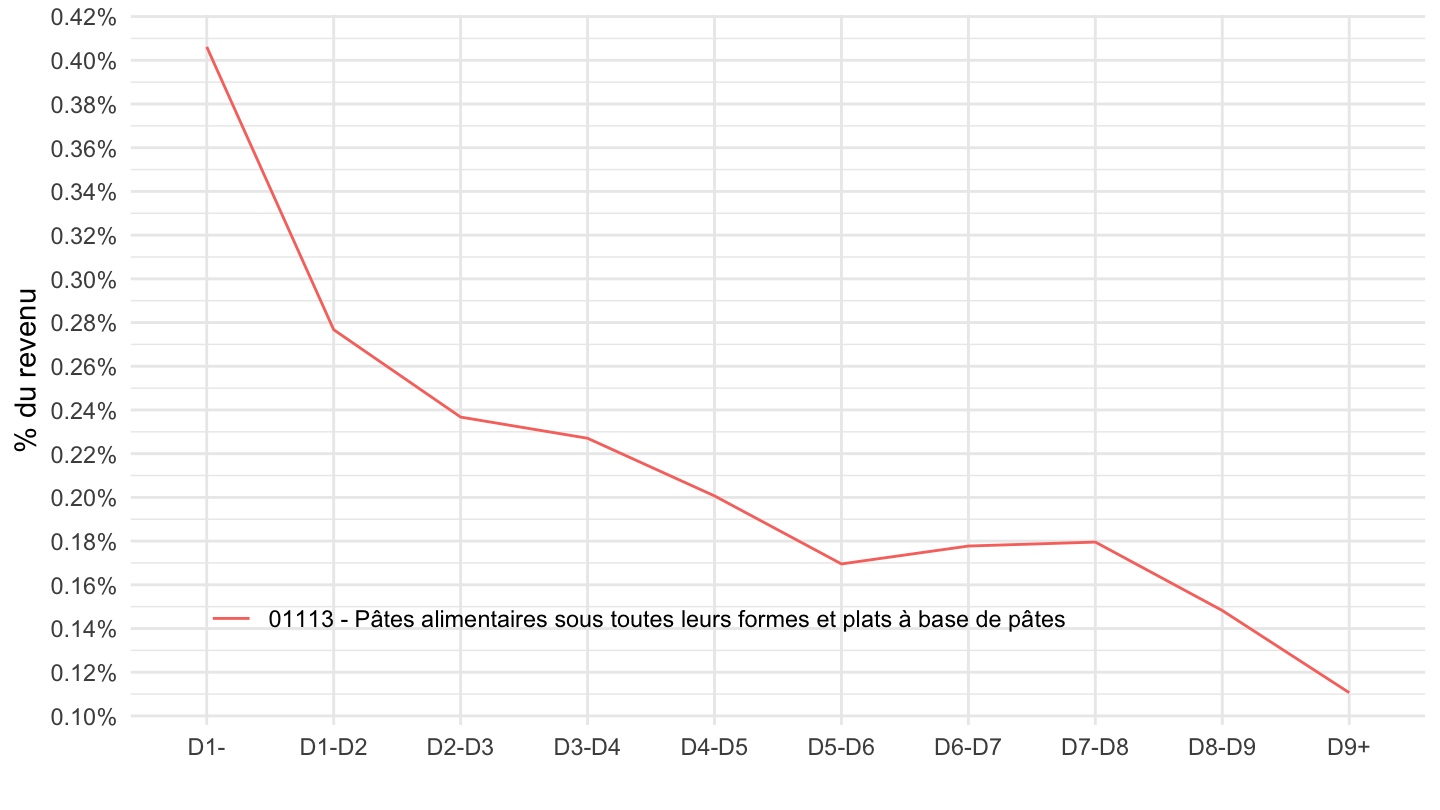
Santé (06), Assurances liées à la santé (1253)
CSPR
Code
tm103 %>%
  filter(NOMENCLATURE %in% c("1253", "06", "CTOTALE"),
         CSPR != "TOT", CSPR != "8") %>%
  left_join(NOMENCLATURE, by = "NOMENCLATURE") %>%
  left_join(CSPR, by = "CSPR") %>%
  group_by(CSPR) %>%
  mutate(CONSO = CONSO/CONSO[NOMENCLATURE == "CTOTALE"]) %>%
  mutate(Cspr = gsub(" ", " \n", Cspr),
         Cspr = ifelse(CSPR == "2", "Artisans, \ncommerçants \net chefs \nd'entreprise", Cspr)) %>%
  filter(NOMENCLATURE != "CTOTALE") %>%
  ggplot + geom_line(aes(x = paste0(CSPR, " - ", Cspr), y = CONSO, color = Nomenclature, group = Nomenclature)) +
  theme_minimal() + xlab("") + ylab("% de la Consommation Totale (Budget de famille 2017)") +
  scale_y_continuous(breaks = 0.01*seq(-30, 50, 0.5),
                     labels = percent_format(accuracy = .1),
                     limits = c(0, 0.07)) +

  theme(legend.position = c(0.4, 0.9),
        legend.title = element_blank())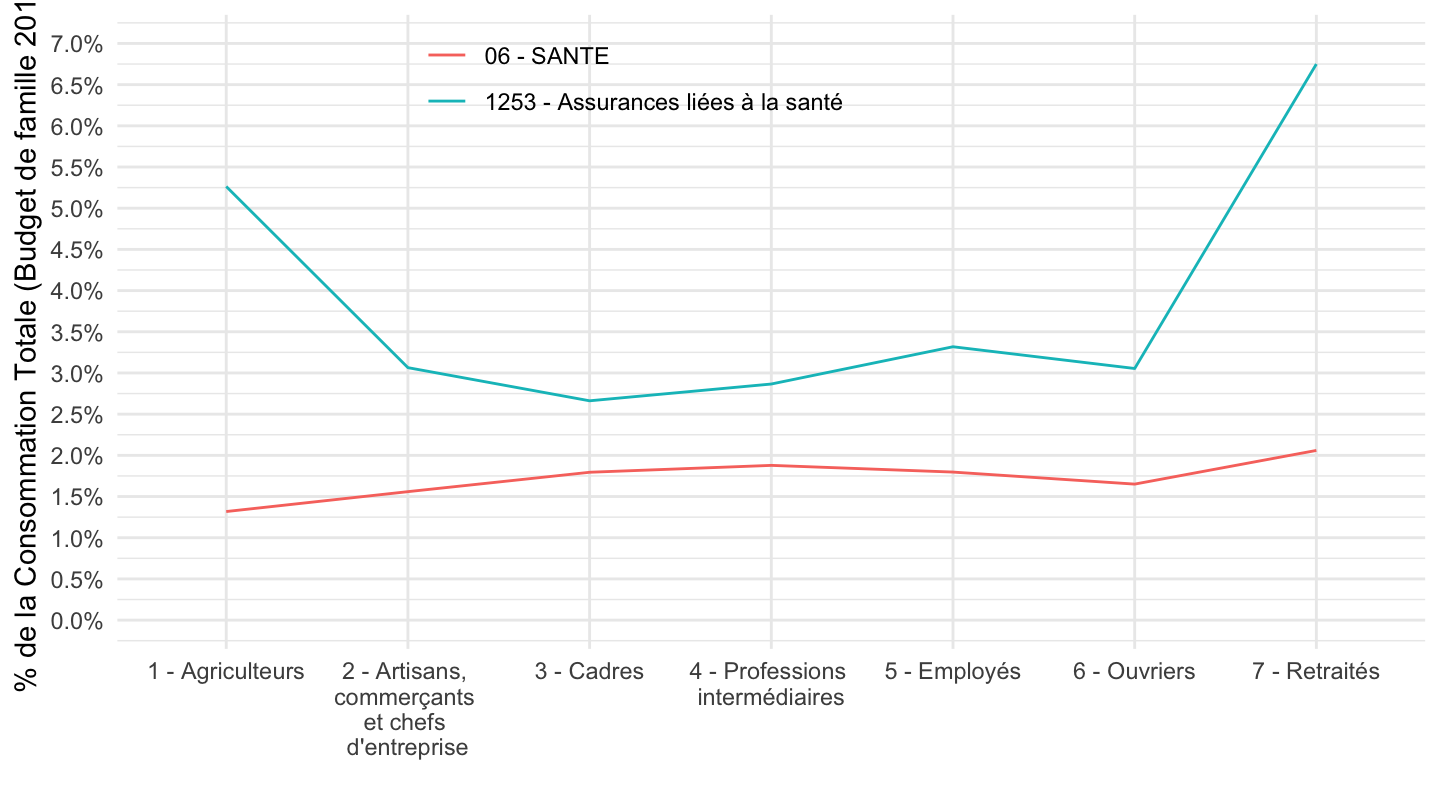
AGPR
Code
tm102 %>%
  filter(NOMENCLATURE %in% c("1253", "06", "CTOTALE")) %>%
  left_join(NOMENCLATURE, by = "NOMENCLATURE") %>%
  left_join(AGPR, by = "AGPR") %>%
  filter(AGPR != "TOT") %>%
  group_by(AGPR) %>%
  mutate(AGPR2 = gsub(" ", " \n", AGPR2)) %>%
  mutate(CONSO = CONSO/CONSO[NOMENCLATURE == "CTOTALE"]) %>%
  filter(NOMENCLATURE != "CTOTALE") %>%
  ggplot + geom_line(aes(x = AGPR2, y = CONSO, color = Nomenclature, group = Nomenclature)) +
  theme_minimal() + xlab("") + ylab("% de la Consommation Totale (Budget de famille 2017)") +
  scale_y_continuous(breaks = 0.01*seq(-30, 50, 0.5),
                     labels = percent_format(accuracy = .1),
                     limits = c(0, 0.085)) +

  theme(legend.position = c(0.2, 0.9),
        legend.title = element_blank())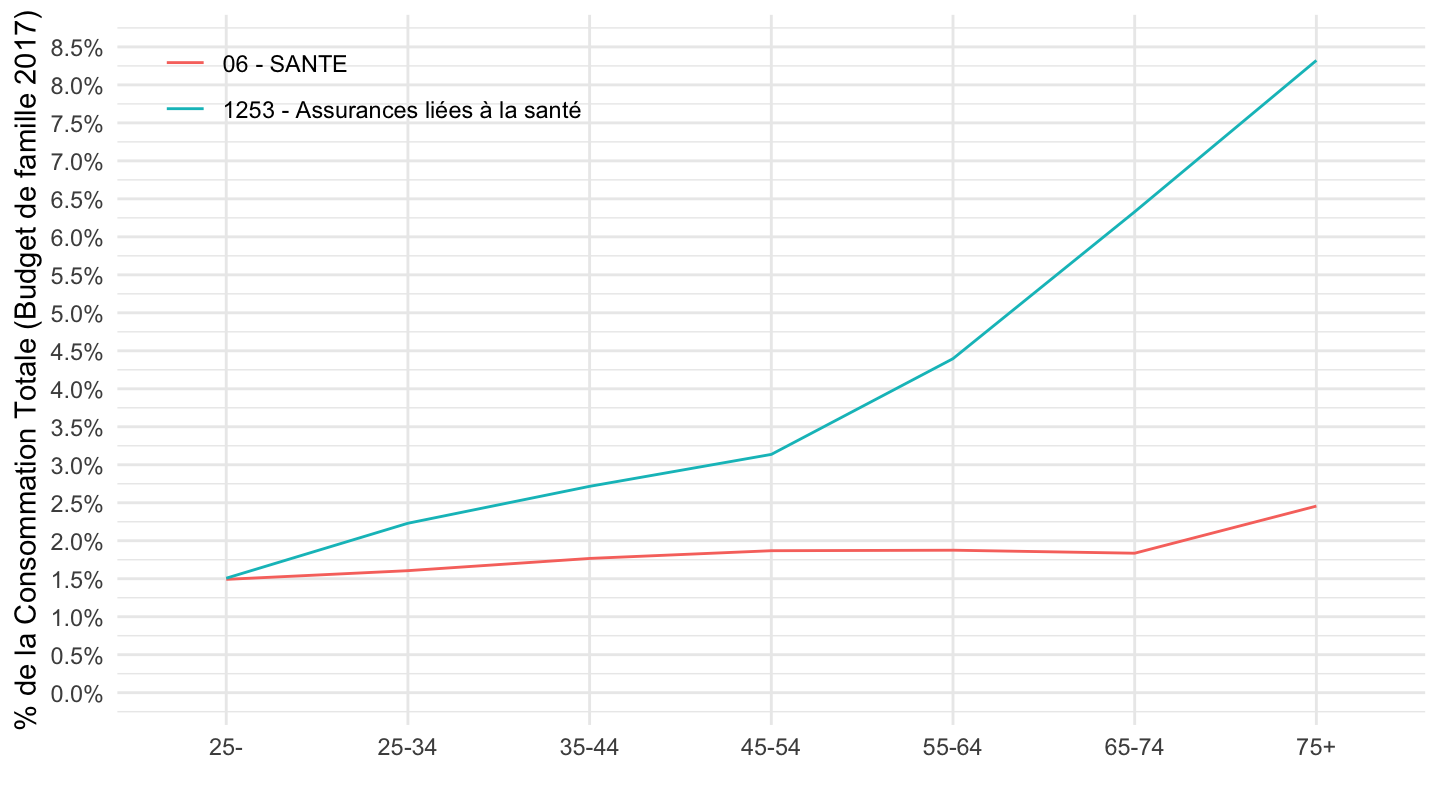
DECUC
% de la consommation
Code
tm106 %>%
  filter(NOMENCLATURE %in% c("1253", "06", "CTOTALE"),
         DECUC != "TOT") %>%
  left_join(NOMENCLATURE, by = "NOMENCLATURE") %>%
  left_join(DECUC, by = "DECUC") %>%
  mutate(DECUC = DECUC %>% as.numeric) %>%
  group_by(DECUC) %>%
  mutate(CONSO = CONSO/CONSO[NOMENCLATURE == "CTOTALE"]) %>%
  filter(NOMENCLATURE != "CTOTALE") %>%
  ggplot + geom_line(aes(x = DECUC2, y = CONSO, color = Nomenclature, group = Nomenclature)) +
  theme_minimal() + xlab("") + ylab("% de la Consommation Totale") +
  scale_y_continuous(breaks = 0.01*seq(-30, 50, 0.5),
                     labels = percent_format(accuracy = .1)) +

  theme(legend.position = c(0.8, 0.9),
        legend.title = element_blank())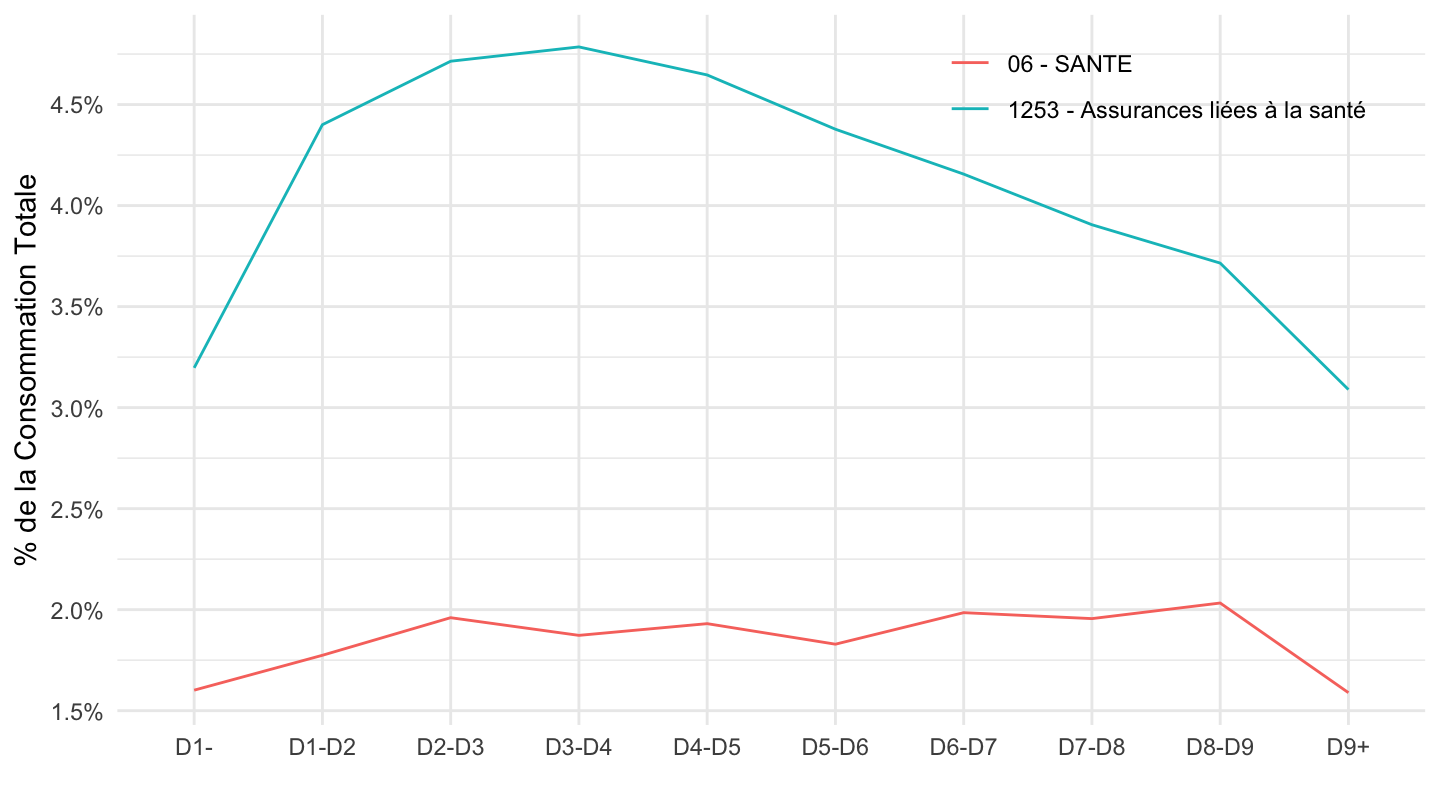
% du revenu
Code
tm106 %>%
  filter(NOMENCLATURE %in% c("1253", "06"),
         DECUC != "TOT") %>%
  left_join(NOMENCLATURE, by = "NOMENCLATURE") %>%
  left_join(DECUC, by = "DECUC") %>%
  left_join(revenu_dispo_decile, by = "DECUC") %>%
  mutate(DECUC = DECUC %>% as.numeric) %>%
  group_by(DECUC) %>%
  ggplot + geom_line(aes(x = DECUC2, y = CONSO/revenu_dispo_decile, color = Nomenclature, group = Nomenclature)) +
  theme_minimal() + xlab("") + ylab("% du revenu") +
  scale_y_continuous(breaks = 0.01*seq(-30, 50, 0.5),
                     labels = percent_format(accuracy = .1),
                     limits = c(0, 0.05)) +

  theme(legend.position = c(0.4, 0.15),
        legend.title = element_blank())
STRATE
Code
tm104 %>%
  filter(NOMENCLATURE %in% c("1253", "06", "CTOTALE"),
         STRATE != "TOT") %>%
  left_join(NOMENCLATURE, by = "NOMENCLATURE") %>%
  left_join(STRATE, by = "STRATE") %>%
  group_by(STRATE) %>%
  mutate(CONSO = CONSO/CONSO[NOMENCLATURE == "CTOTALE"]) %>%
  filter(NOMENCLATURE != "CTOTALE") %>%
  mutate(Strate = gsub("\\(", "\n\\(", Strate)) %>%
  ggplot + geom_line(aes(x = paste0(STRATE, " - ", Strate), y = CONSO, color = Nomenclature, group = Nomenclature)) +
  theme_minimal() + xlab("") + ylab("% de la Consommation Totale") +
  scale_y_continuous(breaks = 0.01*seq(-30, 50, 0.5),
                     labels = percent_format(accuracy = .1)) +

  theme(legend.position = c(0.8, 0.9),
        legend.title = element_blank())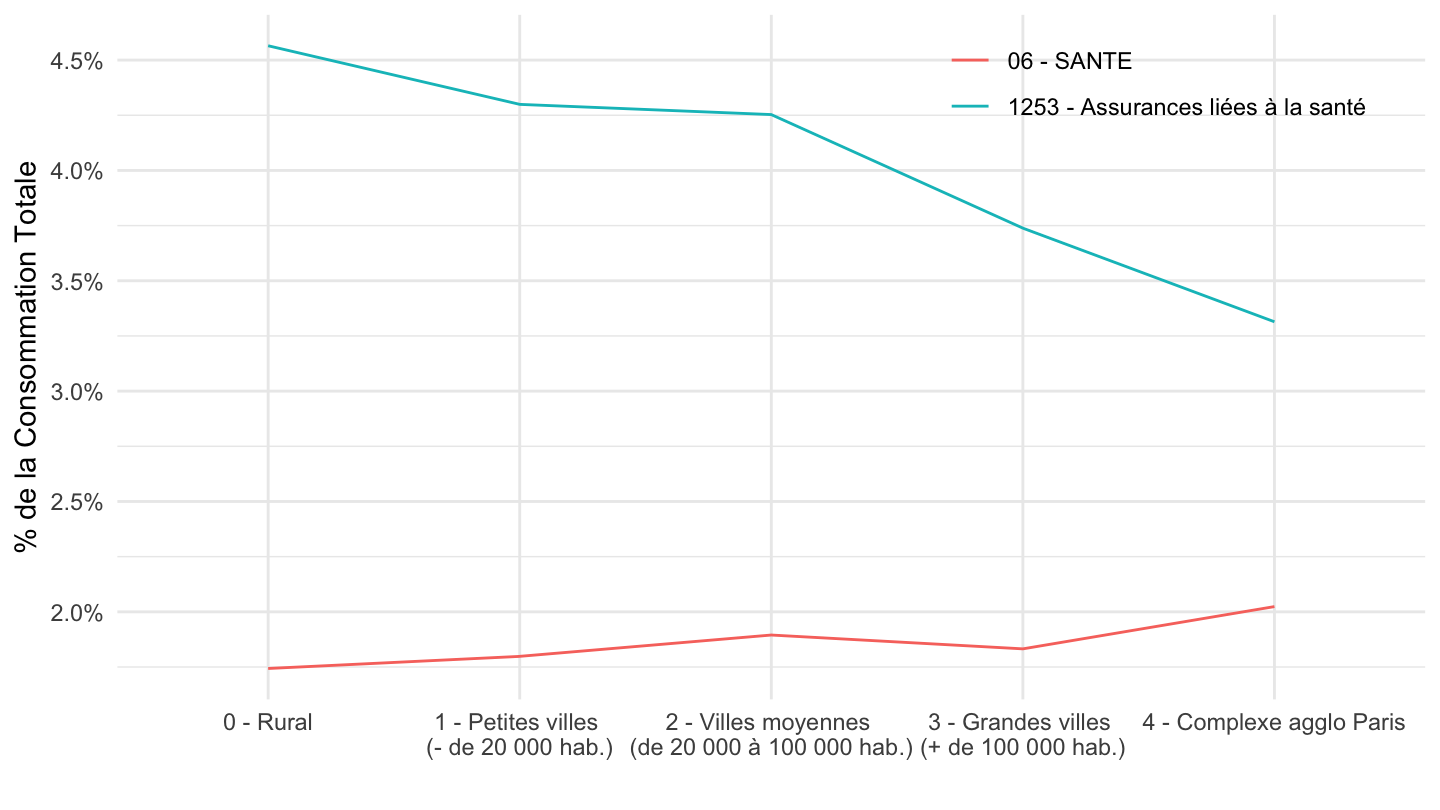
TYPMEN
Code
tm105 %>%
  filter(NOMENCLATURE %in% c("1253", "06", "CTOTALE")) %>%
  left_join(NOMENCLATURE, by = "NOMENCLATURE") %>%
  left_join(TYPMEN, by = "TYPMEN") %>%
  filter(TYPMEN != "TOT") %>%
  group_by(TYPMEN) %>%
  mutate(CONSO = CONSO/CONSO[NOMENCLATURE == "CTOTALE"]) %>%
  filter(NOMENCLATURE != "CTOTALE") %>%
  mutate(Typmen = gsub(" ", " \n", Typmen)) %>%
  ggplot + geom_line(aes(x = paste0(TYPMEN, " - ", Typmen), y = CONSO, color = Nomenclature, group = Nomenclature)) +
  theme_minimal() + xlab("") + ylab("% de la Consommation Totale (Budget de famille 2017)") +
  scale_y_continuous(breaks = 0.01*seq(-30, 50, 0.5),
                     labels = percent_format(accuracy = .1)) +

  theme(legend.position = c(0.2, 0.9),
        legend.title = element_blank())
ZEAT2
Code
tm101 %>%
  filter(NOMENCLATURE %in% c("1253", "06", "CTOTALE")) %>%
  left_join(NOMENCLATURE, by = "NOMENCLATURE") %>%
  left_join(ZEAT2, by = "ZEAT2") %>%
  filter(ZEAT2 != "TOT") %>%
  group_by(ZEAT2) %>%
  mutate(CONSO = CONSO/CONSO[NOMENCLATURE == "CTOTALE"]) %>%
  filter(NOMENCLATURE != "CTOTALE") %>%
  mutate(Zeat2 = gsub(" ", " \n", Zeat2)) %>%
  ggplot + geom_line(aes(x = Zeat2, y = CONSO, color = Nomenclature, group = Nomenclature)) +
  theme_minimal() + xlab("") + ylab("% de la Consommation Totale (Budget de famille 2017)") +
  scale_y_continuous(breaks = 0.01*seq(-30, 50, 0.5),
                     labels = percent_format(accuracy = .1)) +

  theme(legend.position = c(0.2, 0.7),
        legend.title = element_blank())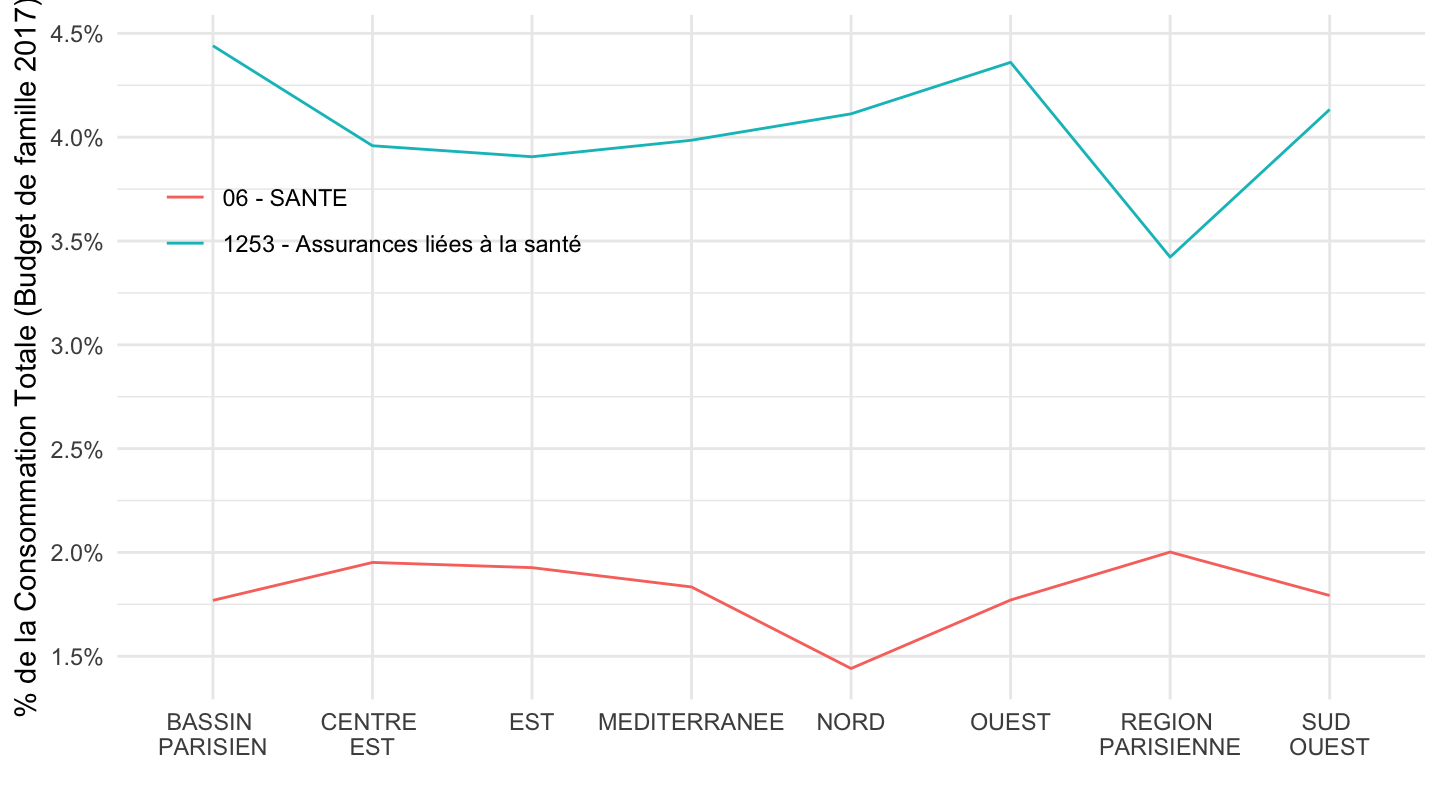
Catégories Socioprofessionelles
%
Code
tm103 %>%
  filter(CSPR %in% c("TOT", "3", "4", "5", "6")) %>%
  left_join(CSPR, by = "CSPR") %>%
  left_join(NOMENCLATURE, by = "NOMENCLATURE") %>%
  select(NOMENCLATURE, Nomenclature, Cspr, CONSO) %>%
  spread(Cspr, CONSO) %>%
  mutate_at(vars(-1, -2), funs(round(100*./.[NOMENCLATURE == "CTOTALE"],2))) %>%
  print_table_conditional()
Tabac, Enseignement Supérieur, Communications
Code
tm103 %>%
  filter(NOMENCLATURE %in% c("1013", "022", "081", "CTOTALE"),
         CSPR %in% c("3", "4", "5", "6", "7")) %>%
  left_join(NOMENCLATURE, by = "NOMENCLATURE") %>%
  left_join(CSPR, by = "CSPR") %>%
  group_by(CSPR) %>%
  mutate(CONSO = CONSO/CONSO[NOMENCLATURE == "CTOTALE"]) %>%
  filter(NOMENCLATURE != "CTOTALE") %>%
  ggplot + geom_line(aes(x = paste0(CSPR, " - ", Cspr), y = CONSO, color = Nomenclature, group = Nomenclature)) +
  theme_minimal() + xlab("") + ylab("% de la Consommation Totale") +
  scale_y_continuous(breaks = 0.01*seq(-30, 50, 0.5),
                     labels = percent_format(accuracy = .1)) +
  #scale_x_continuous(breaks = seq(0, 10, 1)) +

  theme(legend.position = c(0.2, 0.9),
        legend.title = element_blank())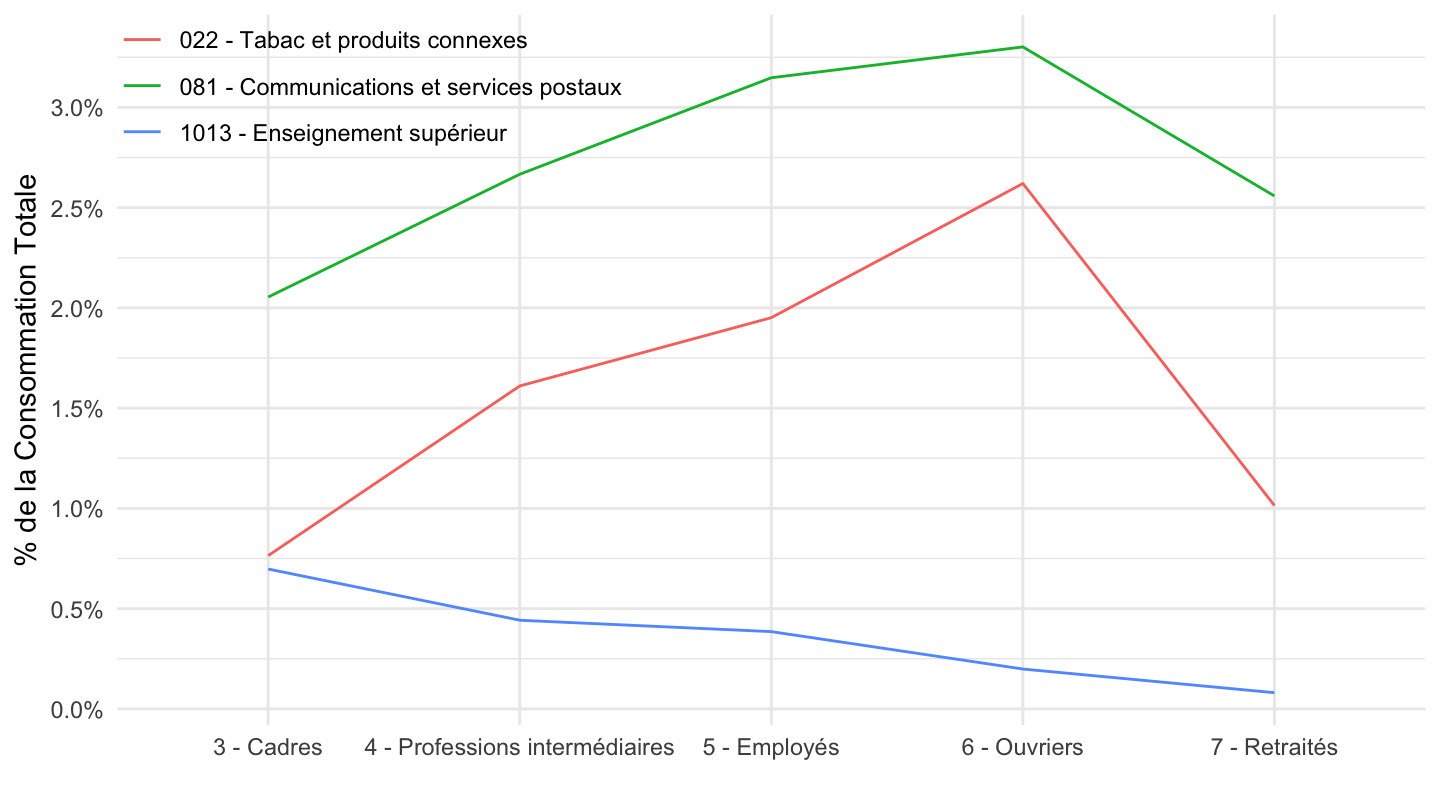
Enseignement, Achats de téléphones, Services
Code
tm103 %>%
  filter(NOMENCLATURE %in% c("0813", "0812", "10", "CTOTALE"),
         CSPR %in% c("3", "4", "5", "6", "7")) %>%
  left_join(NOMENCLATURE, by = "NOMENCLATURE") %>%
  left_join(CSPR, by = "CSPR") %>%
  group_by(CSPR) %>%
  mutate(CONSO = CONSO/CONSO[NOMENCLATURE == "CTOTALE"]) %>%
  filter(NOMENCLATURE != "CTOTALE") %>%
  ggplot + geom_line(aes(x = paste0(CSPR, " - ", Cspr), y = CONSO, color = Nomenclature, group = Nomenclature)) +
  theme_minimal() + xlab("") + ylab("% de la Consommation Totale") +
  scale_y_continuous(breaks = 0.01*seq(-30, 50, 0.5),
                     labels = percent_format(accuracy = .1)) +
  #scale_x_continuous(breaks = seq(0, 10, 1)) +

  theme(legend.position = c(0.4, 0.9),
        legend.title = element_blank())
Enseignement secondaire, Enseignement supérieur, Assurances liées à la santé
Code
tm103 %>%
  filter(NOMENCLATURE %in% c("1253", "1013", "1012", "CTOTALE"),
         CSPR %in% c("3", "4", "5", "6", "7")) %>%
  left_join(NOMENCLATURE, by = "NOMENCLATURE") %>%
  left_join(CSPR, by = "CSPR") %>%
  group_by(CSPR) %>%
  mutate(CONSO = CONSO/CONSO[NOMENCLATURE == "CTOTALE"]) %>%
  filter(NOMENCLATURE != "CTOTALE") %>%
  ggplot + geom_line(aes(x = paste0(CSPR, " - ", Cspr), y = CONSO, color = Nomenclature, group = Nomenclature)) +
  theme_minimal() + xlab("") + ylab("% de la Consommation Totale") +
  scale_y_continuous(breaks = 0.01*seq(-30, 50, 0.5),
                     labels = percent_format(accuracy = .1)) +
  #scale_x_continuous(breaks = seq(0, 10, 1)) +

  theme(legend.position = c(0.4, 0.9),
        legend.title = element_blank())
Santé, Assurances liées à la santé
Code
tm103 %>%
  filter(NOMENCLATURE %in% c("1253", "06", "061", "CTOTALE"),
         CSPR %in% c("3", "4", "5", "6", "7")) %>%
  left_join(NOMENCLATURE, by = "NOMENCLATURE") %>%
  left_join(CSPR, by = "CSPR") %>%
  group_by(CSPR) %>%
  mutate(CONSO = CONSO/CONSO[NOMENCLATURE == "CTOTALE"]) %>%
  filter(NOMENCLATURE != "CTOTALE") %>%
  ggplot + geom_line(aes(x = paste0(CSPR, " - ", Cspr), y = CONSO, color = Nomenclature, group = Nomenclature)) +
  theme_minimal() + xlab("") + ylab("% de la Consommation Totale") +
  scale_y_continuous(breaks = 0.01*seq(-30, 50, 0.5),
                     labels = percent_format(accuracy = .1)) +
  #scale_x_continuous(breaks = seq(0, 10, 1)) +

  theme(legend.position = c(0.4, 0.9),
        legend.title = element_blank())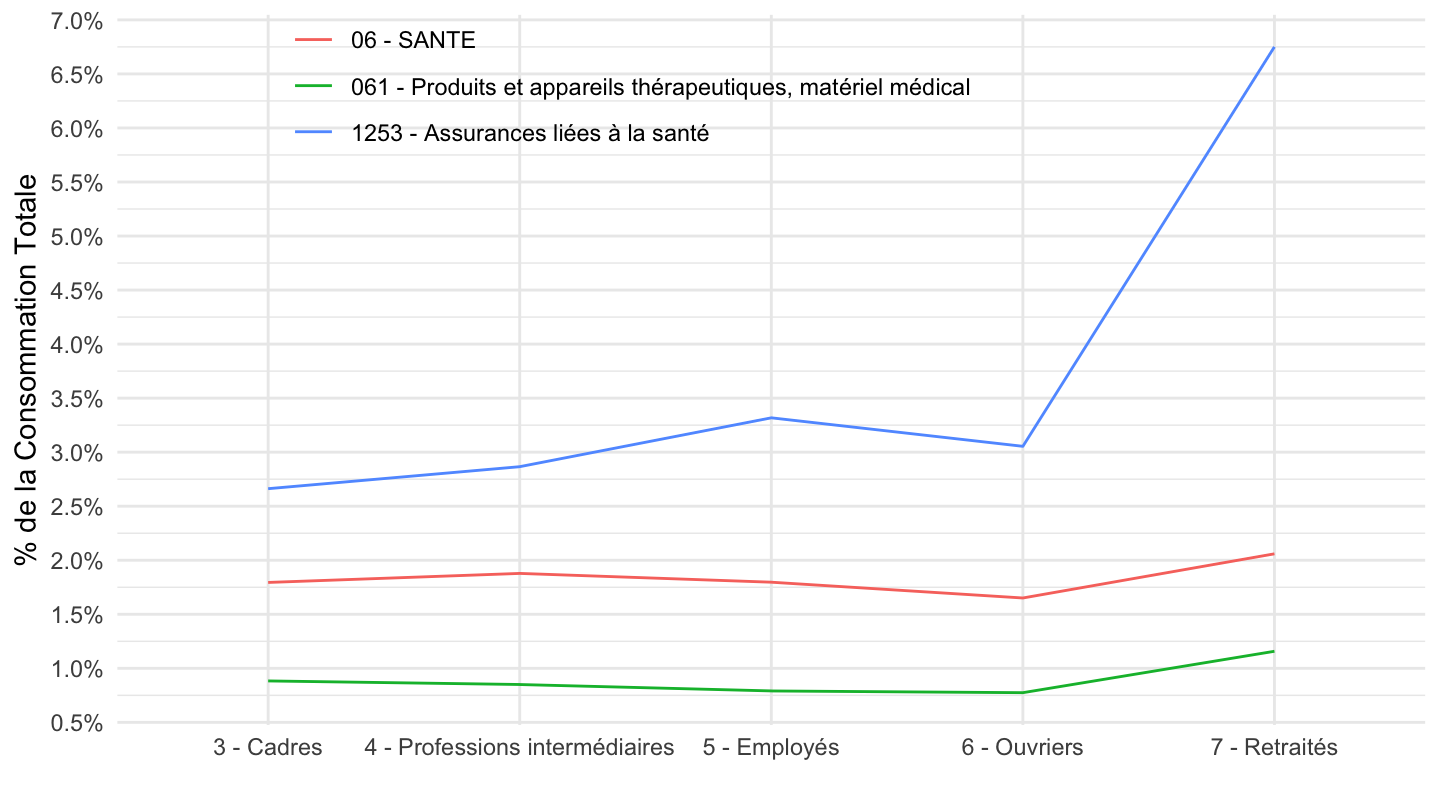
Déciles
% du revenu disponible
Code
tm106 %>%
  filter(DECUC %in% c("1", "4", "7", "10")) %>%
  left_join(revenu_dispo_decile, by = "DECUC") %>%
  left_join(DECUC, by = "DECUC") %>%
  left_join(NOMENCLATURE, by = "NOMENCLATURE") %>%
  transmute(NOMENCLATURE, Nomenclature, DECUC2,
            CONSO = round(100*CONSO/revenu_dispo_decile, 2)) %>%
  spread(DECUC2, CONSO) %>%
  print_table_conditional()
% de la Consommation
Tous
Code
tm106 %>%
  filter(DECUC %in% c("1", "4", "7", "10", "TOT")) %>%
  left_join(DECUC, by = "DECUC") %>%
  left_join(NOMENCLATURE, by = "NOMENCLATURE") %>%
  select(NOMENCLATURE, Nomenclature, DECUC2, CONSO) %>%
  spread(DECUC2, CONSO) %>%
  mutate_at(vars(-1, -2), funs(round(100*./.[NOMENCLATURE == "CTOTALE"],2))) %>%
  print_table_conditional()
2-digit
Code
tm106 %>%
  filter(nchar(NOMENCLATURE) == 2 | NOMENCLATURE == "CTOTALE") %>%
  filter(DECUC %in% c("1", "4", "7", "10", "TOT")) %>%
  left_join(DECUC, by = "DECUC") %>%
  left_join(NOMENCLATURE, by = "NOMENCLATURE") %>%
  select(NOMENCLATURE, Nomenclature, DECUC2, CONSO) %>%
  spread(DECUC2, CONSO) %>%
  mutate_at(vars(-1, -2), funs(round(100*./.[NOMENCLATURE == "CTOTALE"],2))) %>%
print_table_conditional()| NOMENCLATURE | Nomenclature | D1- | D3-D4 | D6-D7 | D9+ | TOT |
|---|---|---|---|---|---|---|
| 01 | 01 - PRODUITS ALIMENTAIRES ET BOISSONS NON-ALCOOLISEES | 17.44 | 17.91 | 15.57 | 13.56 | 16.08 |
| 02 | 02 - BOISSONS ALCOOLISEES ET TABAC | 3.57 | 3.42 | 2.85 | 2.25 | 2.89 |
| 03 | 03 - ARTICLES D’HABILLEMENT ET CHAUSSURES | 5.45 | 4.61 | 4.91 | 4.86 | 5.00 |
| 04 | 04 - LOGEMENT, EAU, GAZ, ELECTRICITE ET AUTRES COMBUSTIBLES | 22.75 | 19.65 | 15.49 | 12.01 | 16.29 |
| 05 | 05 - MEUBLES, ARTICLES DE MENAGE ET ENTRETIEN COURANT DE LA MAISON | 3.60 | 4.32 | 5.76 | 8.02 | 5.67 |
| 06 | 06 - SANTE | 1.60 | 1.87 | 1.99 | 1.59 | 1.85 |
| 07 | 07 - TRANSPORTS | 13.61 | 15.11 | 17.33 | 18.11 | 16.28 |
| 08 | 08 - COMMUNICATIONS | 3.84 | 3.09 | 2.65 | 1.82 | 2.66 |
| 09 | 09 - LOISIRS ET CULTURE | 7.84 | 8.02 | 9.66 | 11.05 | 9.40 |
| 10 | 10 - ENSEIGNEMENT | 1.88 | 0.69 | 0.54 | 0.98 | 0.78 |
| 11 | 11 - RESTAURATION ET HÔTELS | 5.36 | 6.16 | 6.80 | 10.28 | 7.23 |
| 12 | 12 - BIENS ET SERVICES DIVERS | 13.08 | 15.14 | 16.46 | 15.47 | 15.87 |
| 13 | 13 - HORS CHAMP DE LA CONSOMMATION (IMPOTS ET TAXES, GROS TRAVAUX, REMBOURSEMENT PRET, CADEAUX) | 14.85 | 21.19 | 36.36 | 63.20 | 34.97 |
| CTOTALE | TOTAL DE LA CONSOMMATION - CHAMP COMPTABILITE NATIONALE | 100.00 | 100.00 | 100.00 | 100.00 | 100.00 |
3-digit
Code
tm106 %>%
  filter(nchar(NOMENCLATURE) == 3 | NOMENCLATURE == "CTOTALE") %>%
  filter(DECUC %in% c("1", "4", "7", "10", "TOT")) %>%
  left_join(DECUC, by = "DECUC") %>%
  left_join(NOMENCLATURE, by = "NOMENCLATURE") %>%
  select(NOMENCLATURE, Nomenclature, DECUC2, CONSO) %>%
  spread(DECUC2, CONSO) %>%
  mutate_at(vars(-1, -2), funs(round(100*./.[NOMENCLATURE == "CTOTALE"],2))) %>%
  print_table_conditional()
4-digit
Code
tm106 %>%
  filter(nchar(NOMENCLATURE) == 4 | NOMENCLATURE == "CTOTALE") %>%
  filter(DECUC %in% c("1", "4", "7", "10", "TOT")) %>%
  left_join(DECUC, by = "DECUC") %>%
  left_join(NOMENCLATURE, by = "NOMENCLATURE") %>%
  select(NOMENCLATURE, Nomenclature, DECUC2, CONSO) %>%
  spread(DECUC2, CONSO) %>%
  mutate_at(vars(-1, -2), funs(round(100*./.[NOMENCLATURE == "CTOTALE"],2))) %>%
  print_table_conditional()
5-digit
Code
tm106 %>%
  filter(nchar(NOMENCLATURE) == 5 | NOMENCLATURE == "CTOTALE") %>%
  filter(DECUC %in% c("1", "4", "7", "10", "TOT")) %>%
  left_join(DECUC, by = "DECUC") %>%
  left_join(NOMENCLATURE, by = "NOMENCLATURE") %>%
  select(NOMENCLATURE, Nomenclature, DECUC2, CONSO) %>%
  spread(DECUC2, CONSO) %>%
  mutate_at(vars(-1, -2), funs(round(100*./.[NOMENCLATURE == "CTOTALE"],2))) %>%
  print_table_conditional()
Euros
Code
tm106 %>%
  filter(DECUC %in% c("TOT", "1", "4", "7", "10")) %>%
  left_join(DECUC, by = "DECUC") %>%
  left_join(NOMENCLATURE, by = "NOMENCLATURE") %>%
  select(NOMENCLATURE, Nomenclature, Decuc, CONSO) %>%
  spread(Decuc, CONSO) %>%
  print_table_conditional()
Biais du 1er décile
Code
tm106 %>%
  filter(DECUC %in% c("TOT", "1", "10")) %>%
  left_join(DECUC, by = "DECUC") %>%
  left_join(NOMENCLATURE, by = "NOMENCLATURE") %>%
  select(NOMENCLATURE, Nomenclature, Decuc, CONSO) %>%
  spread(Decuc, CONSO) %>%
  mutate_at(vars(-1, -2), funs(round(100*./.[NOMENCLATURE == "CTOTALE"],2))) %>%
  mutate(`Décile 1 - Ensemble` = round(`Décile 1`/`Ensemble`-1,2)) %>%
  arrange(-`Décile 1 - Ensemble`) %>%
  print_table_conditional()
Biais du 10ème décile
Code
tm106 %>%
  filter(DECUC %in% c("TOT", "1", "10")) %>%
  left_join(DECUC, by = "DECUC") %>%
  left_join(NOMENCLATURE, by = "NOMENCLATURE") %>%
  select(NOMENCLATURE, Nomenclature, Decuc, CONSO) %>%
  spread(Decuc, CONSO) %>%
  mutate_at(vars(-1, -2), funs(round(100*./.[NOMENCLATURE == "CTOTALE"],2))) %>%
  mutate(`Décile 10 - Ensemble` = round(`Décile 10`/`Ensemble`-1, 2)) %>%
  arrange(-`Décile 10 - Ensemble`) %>%
  print_table_conditional()
Communications (081), Services de téléphone (0813)
Code
tm106 %>%
  filter(NOMENCLATURE %in% c("081", "0813", "CTOTALE"),
         DECUC != "TOT") %>%
  left_join(NOMENCLATURE, by = "NOMENCLATURE") %>%
  left_join(DECUC, by = "DECUC") %>%
  mutate(DECUC = DECUC %>% as.numeric) %>%
  group_by(DECUC) %>%
  mutate(CONSO = CONSO/CONSO[NOMENCLATURE == "CTOTALE"]) %>%
  filter(NOMENCLATURE != "CTOTALE") %>%
  ggplot + geom_line(aes(x = DECUC2, y = CONSO, color = Nomenclature, group = Nomenclature)) +
  theme_minimal() + xlab("") + ylab("% de la Consommation Totale") +
  scale_y_continuous(breaks = 0.01*seq(-30, 50, 0.5),
                     labels = percent_format(accuracy = .1)) +

  theme(legend.position = c(0.6, 0.9),
        legend.title = element_blank())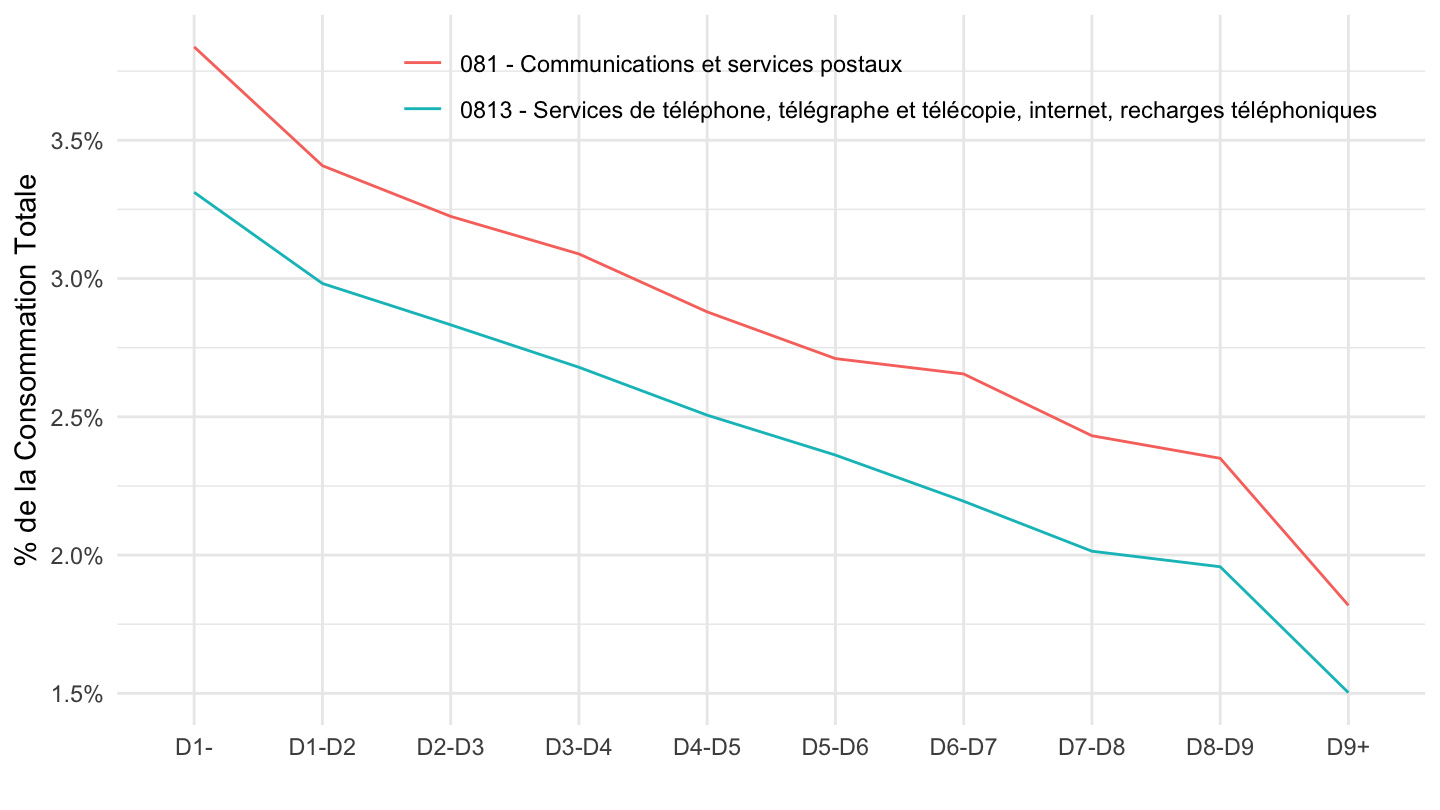
Tabac (022), Enseignement Supérieur (1013), Communications (081)
% de la consommation
Code
tm106 %>%
  filter(NOMENCLATURE %in% c("1013", "022", "081", "CTOTALE"),
         DECUC != "TOT") %>%
  left_join(DECUC, by = "DECUC") %>%
  left_join(NOMENCLATURE, by = "NOMENCLATURE") %>%
  mutate(DECUC = DECUC %>% as.numeric) %>%
  group_by(DECUC) %>%
  mutate(value = CONSO/CONSO[NOMENCLATURE == "CTOTALE"]) %>%
  filter(NOMENCLATURE != "CTOTALE") %>%
  select(DECUC2, value, Nomenclature, everything()) %>%
  ggplot + geom_line(aes(x = DECUC2, y = value, color = Nomenclature, group = Nomenclature)) +
  theme_minimal() + xlab("") + ylab("% de la Consommation Totale") +
  scale_y_continuous(breaks = 0.01*seq(-30, 50, 0.5),
                     labels = percent_format(accuracy = .1)) +

  theme(legend.position = c(0.7, 0.9),
        legend.title = element_blank())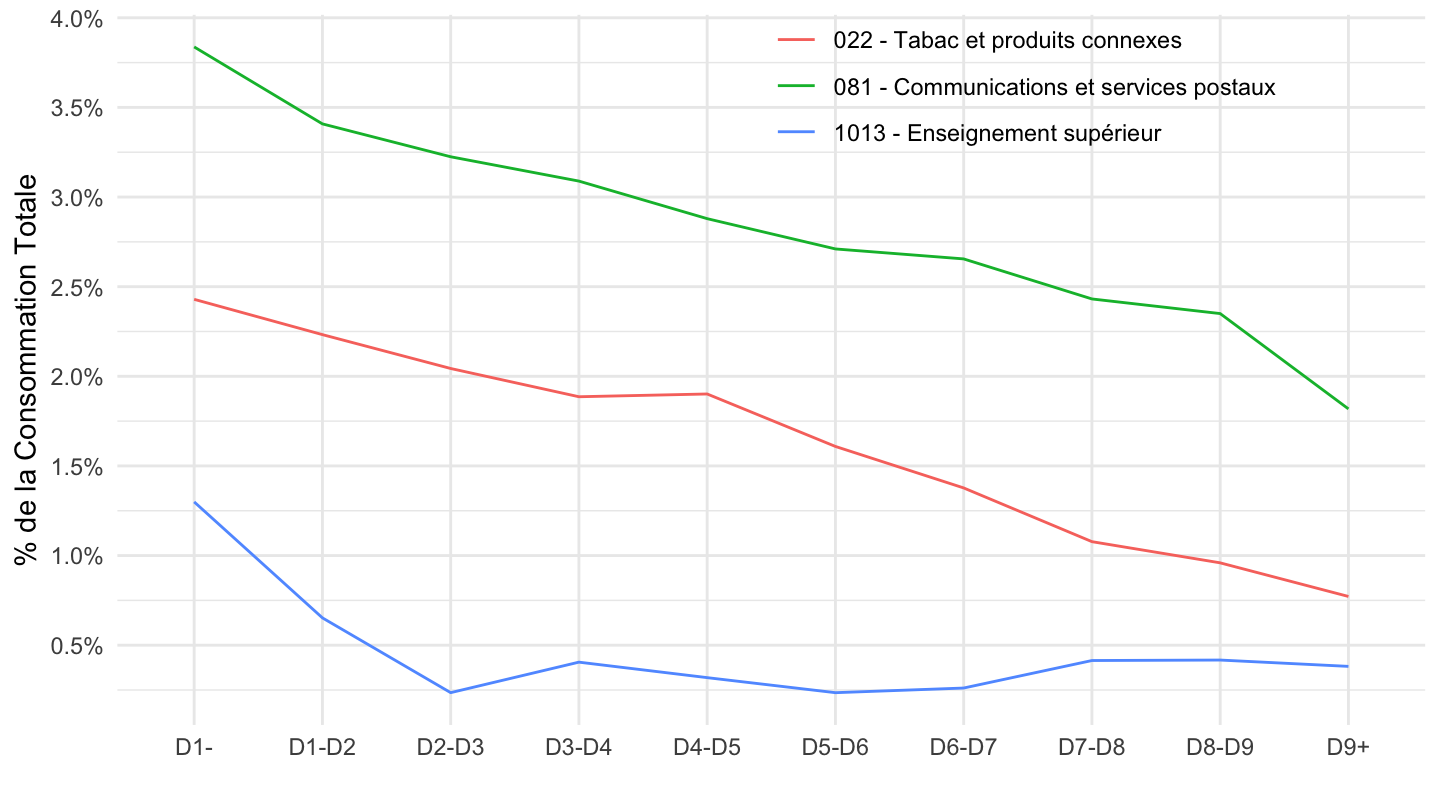
% du revenu disponible
Code
tm106 %>%
  filter(NOMENCLATURE %in% c("1013", "022", "081"),
         DECUC != "TOT") %>%
  left_join(DECUC, by = "DECUC") %>%
  left_join(NOMENCLATURE, by = "NOMENCLATURE") %>%
  left_join(revenu_dispo_decile, by = "DECUC") %>%
  mutate(DECUC = DECUC %>% as.numeric) %>%
  filter(NOMENCLATURE != "CTOTALE") %>%
  mutate(value = CONSO/revenu_dispo_decile) %>%
  select(DECUC2, value, Nomenclature, everything()) %>%
  ggplot + geom_line(aes(x = DECUC2, y = value, color = Nomenclature, group = Nomenclature)) +
  theme_minimal() + xlab("") + ylab("% de la Consommation Totale") +
  scale_y_continuous(breaks = 0.01*seq(-30, 50, 0.5),
                     labels = percent_format(accuracy = .1)) +

  theme(legend.position = c(0.7, 0.9),
        legend.title = element_blank())
Tabac (022), Loyer (041)
% de la consommation
Code
tm106 %>%
  filter(NOMENCLATURE %in% c("041", "022", "CTOTALE"),
         DECUC != "TOT") %>%
  left_join(DECUC, by = "DECUC") %>%
  left_join(NOMENCLATURE, by = "NOMENCLATURE") %>%
  mutate(DECUC = DECUC %>% as.numeric) %>%
  group_by(DECUC) %>%
  mutate(value = CONSO/CONSO[NOMENCLATURE == "CTOTALE"]) %>%
  filter(NOMENCLATURE != "CTOTALE") %>%
  select(DECUC2, value, Nomenclature, everything()) %>%
  ggplot + geom_line(aes(x = DECUC2, y = value, color = Nomenclature, group = Nomenclature)) +
  theme_minimal() + xlab("") + ylab("% de la Consommation Totale") +
  scale_y_continuous(breaks = 0.01*seq(-30, 50, 0.5),
                     labels = percent_format(accuracy = .1)) +

  theme(legend.position = c(0.7, 0.9),
        legend.title = element_blank())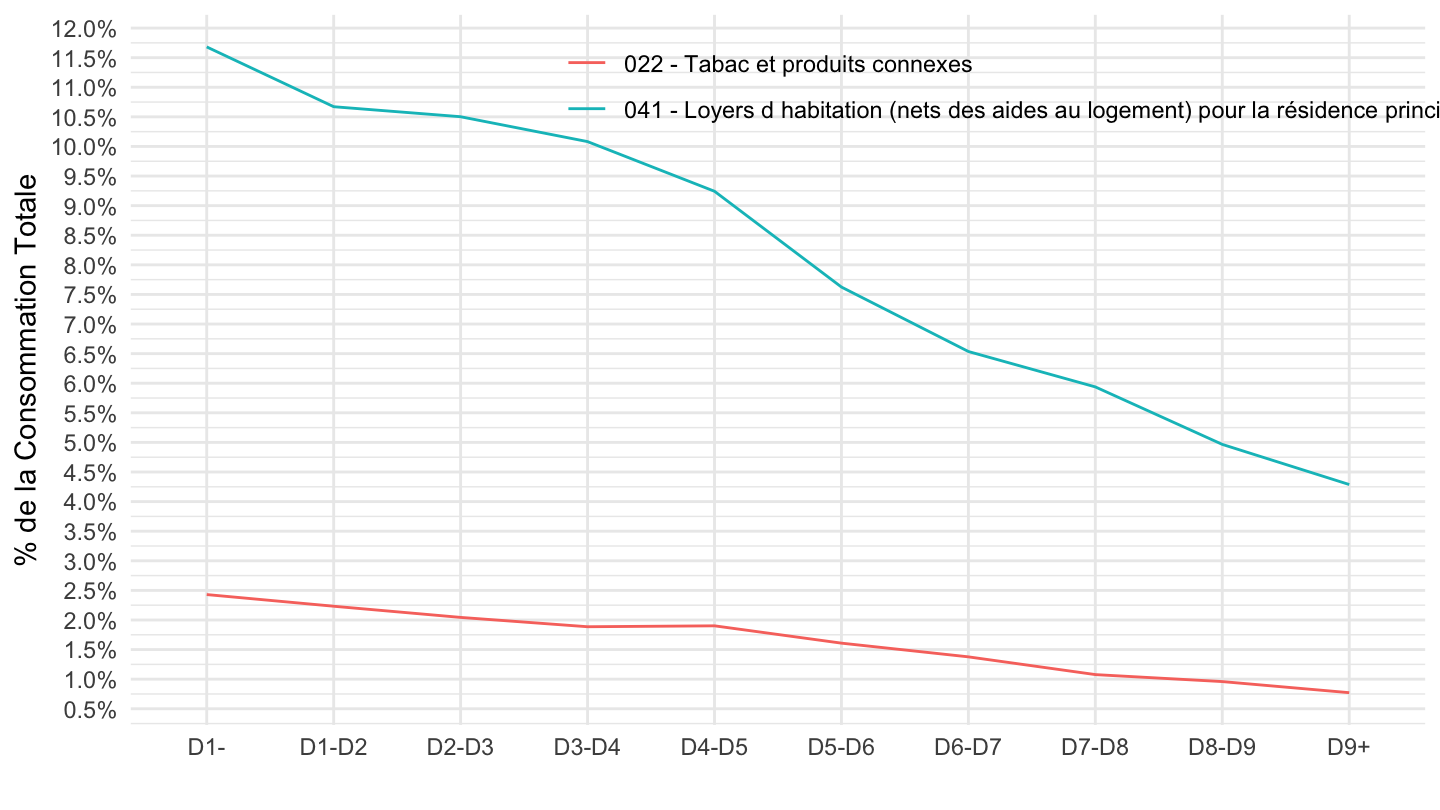
% du revenu disponible
Code
tm106 %>%
  filter(NOMENCLATURE %in% c("041", "022"),
         DECUC != "TOT") %>%
  left_join(DECUC, by = "DECUC") %>%
  left_join(NOMENCLATURE, by = "NOMENCLATURE") %>%
  left_join(revenu_dispo_decile, by = "DECUC") %>%
  mutate(DECUC = DECUC %>% as.numeric) %>%
  filter(NOMENCLATURE != "CTOTALE") %>%
  mutate(value = CONSO/revenu_dispo_decile) %>%
  select(DECUC2, value, Nomenclature, everything()) %>%
  ggplot + geom_line(aes(x = DECUC2, y = value, color = Nomenclature, group = Nomenclature)) +
  theme_minimal() + xlab("") + ylab("% ddu revenu disponible") +
  scale_y_continuous(breaks = 0.01*seq(-30, 50, 1),
                     labels = percent_format(accuracy = 1)) +
  #
  theme(legend.position = c(0.5, 0.9),
        legend.title = element_blank())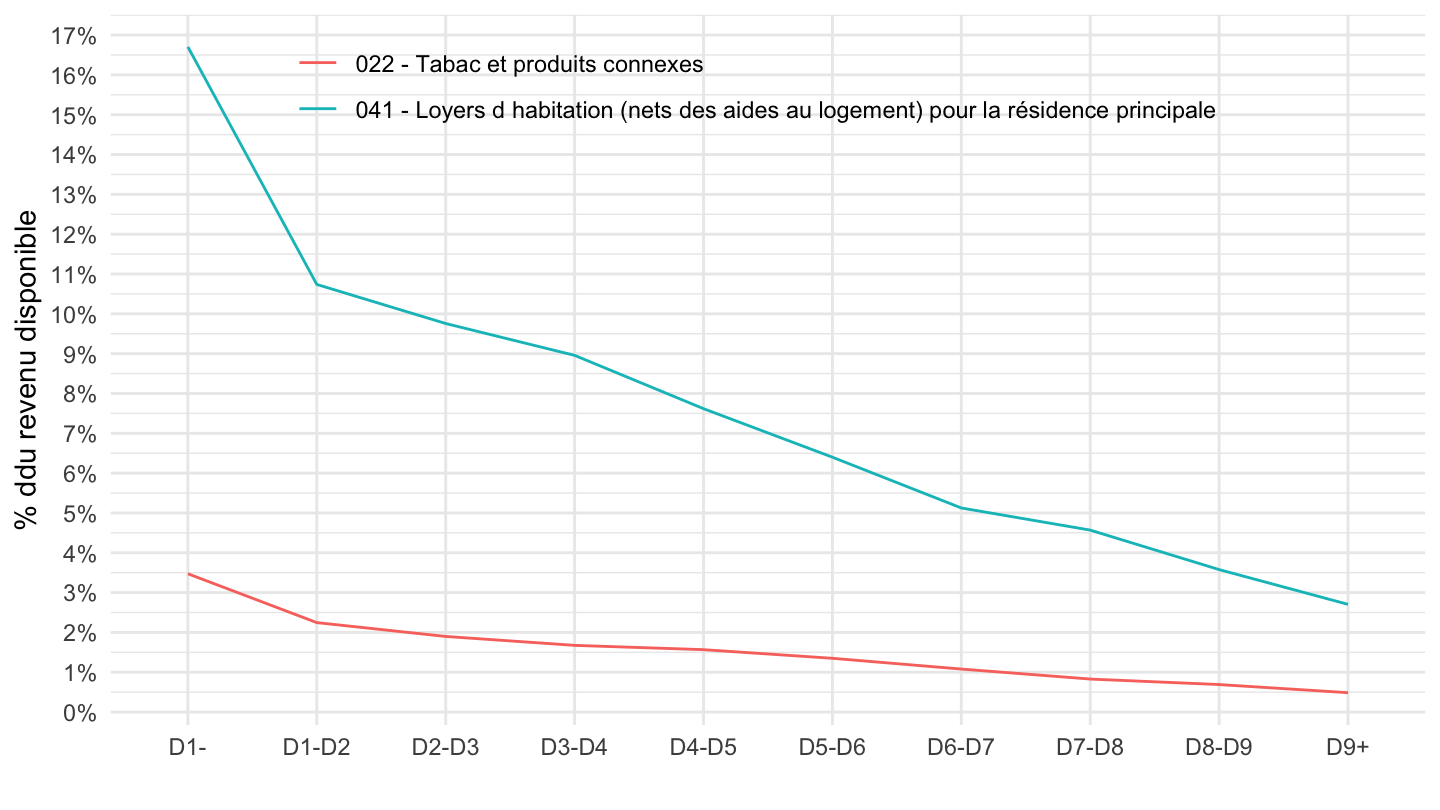
Tabac (022), Loyer (041)
% de la consommation
Code
tm106 %>%
  filter(NOMENCLATURE %in% c("011", "041", "022", "CTOTALE"),
         DECUC != "TOT") %>%
  left_join(DECUC, by = "DECUC") %>%
  left_join(NOMENCLATURE, by = "NOMENCLATURE") %>%
  mutate(DECUC = DECUC %>% as.numeric) %>%
  group_by(DECUC) %>%
  mutate(value = CONSO/CONSO[NOMENCLATURE == "CTOTALE"]) %>%
  filter(NOMENCLATURE != "CTOTALE") %>%
  select(DECUC2, value, Nomenclature, everything()) %>%
  ggplot + geom_line(aes(x = DECUC2, y = value, color = Nomenclature, group = Nomenclature)) +
  theme_minimal() + xlab("") + ylab("% de la Consommation Totale") +
  scale_y_continuous(breaks = 0.01*seq(-30, 50, 1),
                     labels = percent_format(accuracy = .1)) +
  theme(legend.position = c(0.6, 0.9),
        legend.title = element_blank())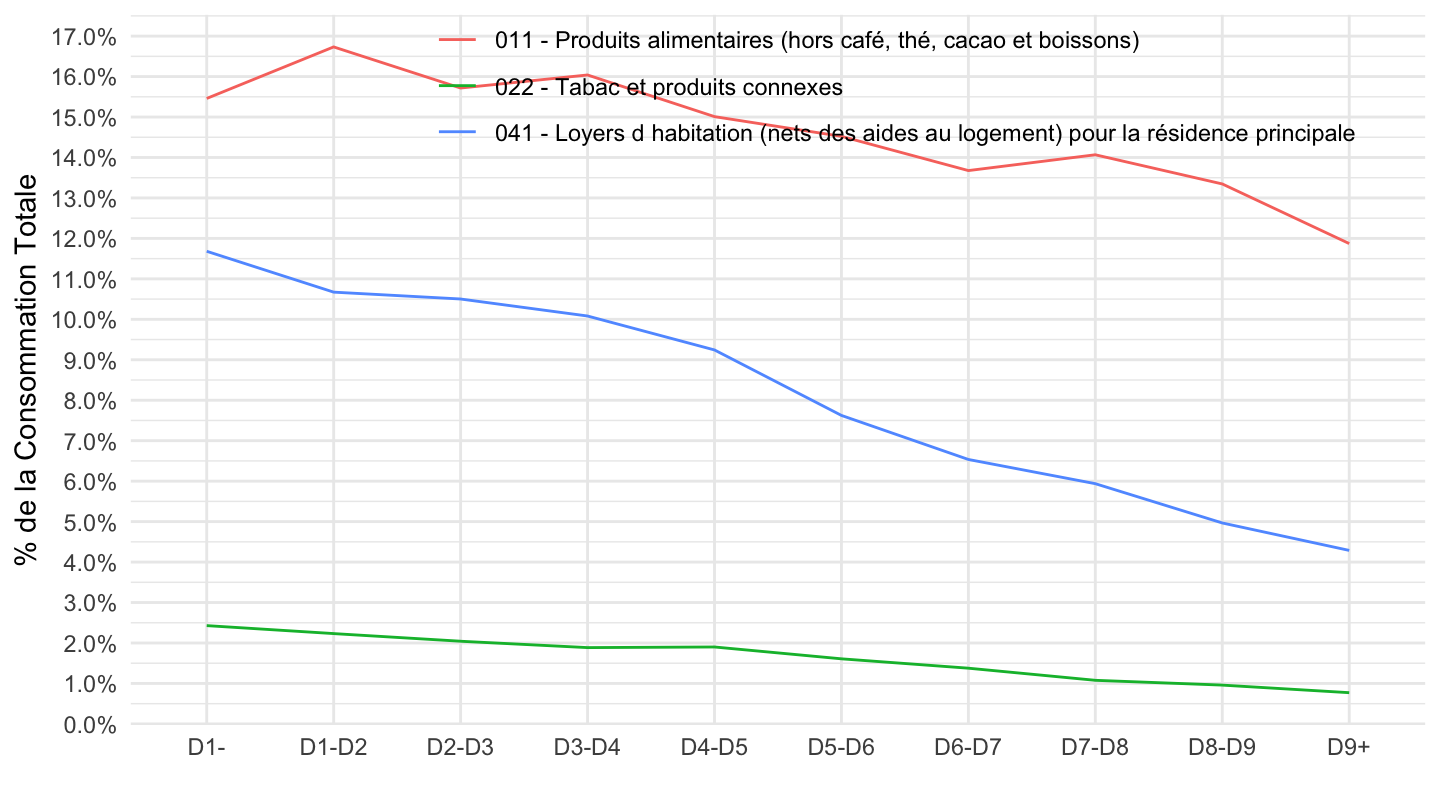
% du revenu disponible
Code
tm106 %>%
  filter(NOMENCLATURE %in% c("011", "041", "022"),
         DECUC != "TOT") %>%
  left_join(DECUC, by = "DECUC") %>%
  left_join(NOMENCLATURE, by = "NOMENCLATURE") %>%
  left_join(revenu_dispo_decile, by = "DECUC") %>%
  mutate(DECUC = DECUC %>% as.numeric) %>%
  filter(NOMENCLATURE != "CTOTALE") %>%
  mutate(value = CONSO/revenu_dispo_decile) %>%
  select(DECUC2, value, Nomenclature, everything()) %>%
  ggplot + geom_line(aes(x = DECUC2, y = value, color = Nomenclature, group = Nomenclature)) +
  theme_minimal() + xlab("") + ylab("% ddu revenu disponible") +
  scale_y_continuous(breaks = 0.01*seq(-30, 50, 1),
                     labels = percent_format(accuracy = 1)) +
  #
  theme(legend.position = c(0.5, 0.9),
        legend.title = element_blank())
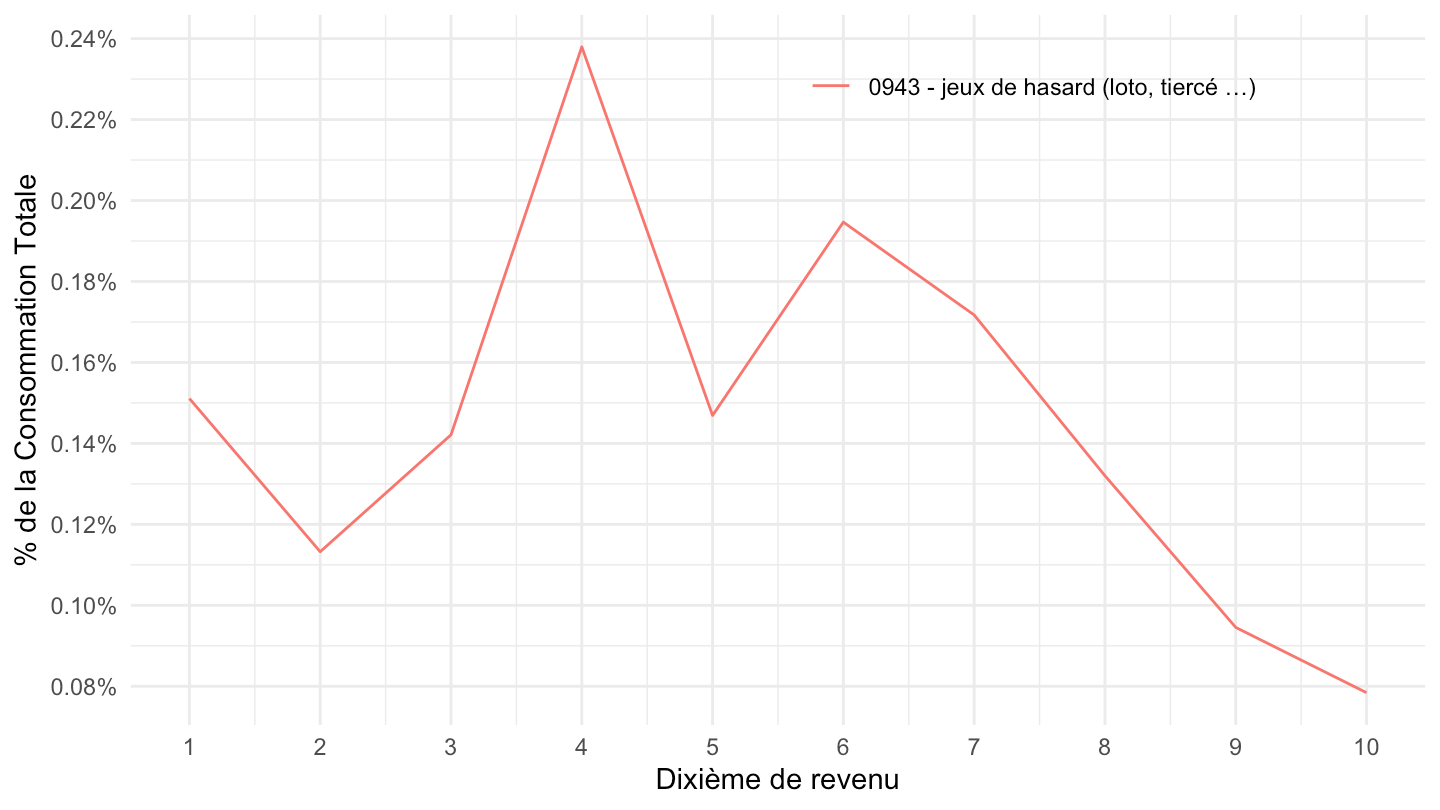
Jeux de hasard (0943)
% de la consommation
Code
tm106 %>%
  filter(NOMENCLATURE %in% c("0943", "CTOTALE"),
         DECUC != "TOT") %>%
  left_join(NOMENCLATURE, by = "NOMENCLATURE") %>%
  left_join(DECUC, by = "DECUC") %>%
  mutate(DECUC = DECUC %>% as.numeric) %>%
  group_by(DECUC) %>%
  mutate(CONSO = CONSO/CONSO[NOMENCLATURE == "CTOTALE"]) %>%
  filter(NOMENCLATURE != "CTOTALE") %>%
  ggplot + geom_line(aes(x = DECUC3, y = CONSO, color = Nomenclature, group = Nomenclature)) +
  theme_minimal() + xlab("") + ylab("% de la Consommation Totale") +
  scale_y_continuous(breaks = 0.01*seq(-30, 50, 0.02),
                     labels = percent_format(accuracy = .01)) +

  theme(legend.position = c(0.7, 0.9),
        legend.title = element_blank()) +
  theme(
    axis.text.x = element_text(angle = 45, hjust = 1)
  )
% du revenu disponible
Code
tm106 %>%
  filter(NOMENCLATURE %in% c("0943"),
         DECUC != "TOT") %>%
  left_join(DECUC, by = "DECUC") %>%
  left_join(NOMENCLATURE, by = "NOMENCLATURE") %>%
  left_join(revenu_dispo_decile, by = "DECUC") %>%
  mutate(DECUC = DECUC %>% as.numeric) %>%
  arrange(DECUC2) %>%
  ggplot + geom_line(aes(x = DECUC, y = CONSO/revenu_dispo_decile, color = Nomenclature, group = Nomenclature)) +
  theme_minimal() + xlab("Dixième de revenu") + ylab("% du revenu disponible") +
  scale_y_continuous(breaks = 0.01*seq(-30, 50, 0.05),
                     labels = percent_format(accuracy = .01)) +
  scale_x_continuous(breaks = seq(1, 10, 1)) +

  theme(legend.position = c(0.7, 0.9),
        legend.title = element_blank())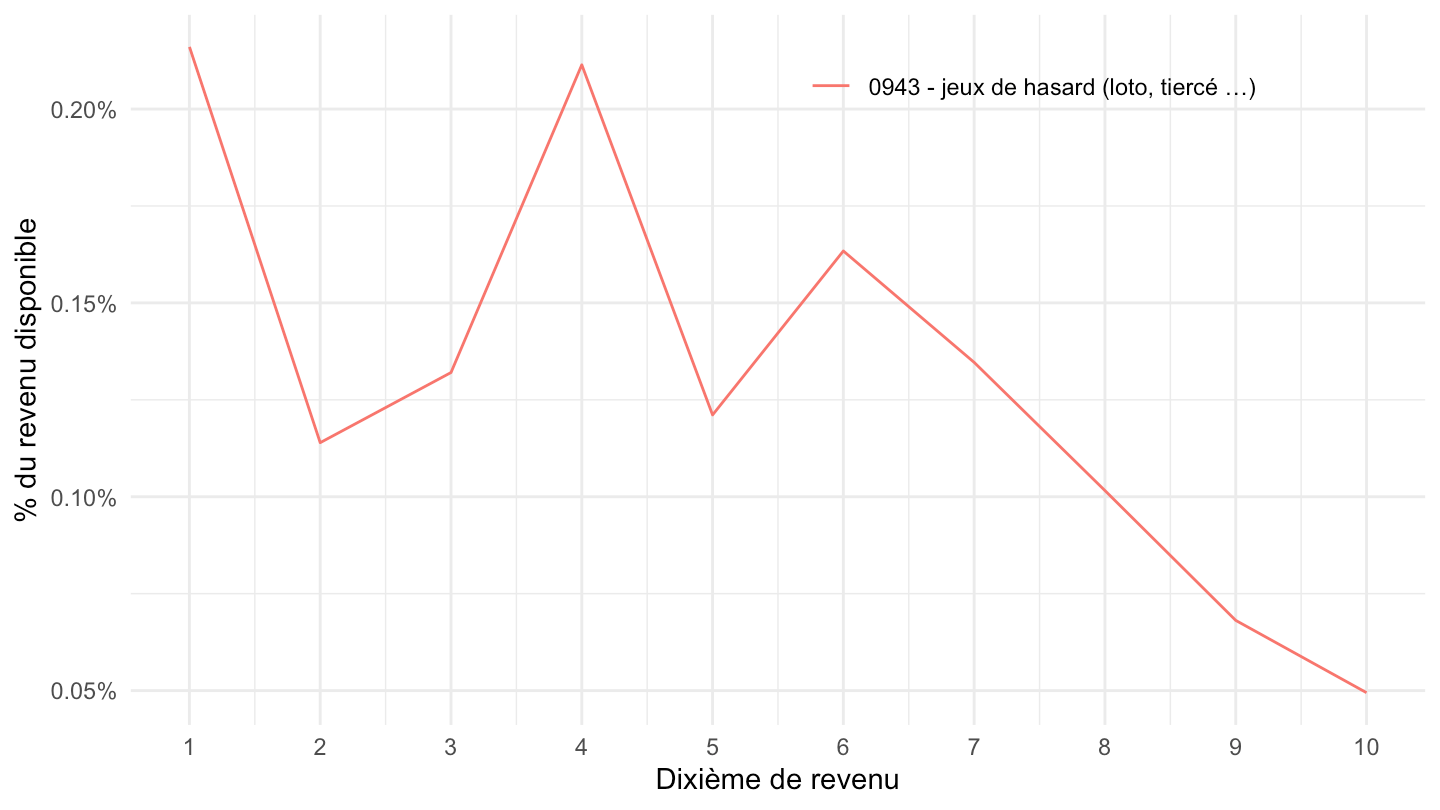
Tabac (022)
% de la consommation
Code
tm106 %>%
  filter(NOMENCLATURE %in% c("022", "CTOTALE"),
         DECUC != "TOT") %>%
  left_join(DECUC, by = "DECUC") %>%
  left_join(NOMENCLATURE, by = "NOMENCLATURE") %>%
  mutate(DECUC = DECUC %>% as.numeric) %>%
  group_by(DECUC) %>%
  mutate(value = CONSO/CONSO[NOMENCLATURE == "CTOTALE"]) %>%
  filter(NOMENCLATURE != "CTOTALE") %>%
  select(DECUC2, value, Nomenclature, everything()) %>%
  ggplot + geom_line(aes(x = DECUC, y = value, color = Nomenclature, group = Nomenclature)) +
  theme_minimal() + xlab("Dixième de revenu") + ylab("% de la Consommation Totale") +
  scale_y_continuous(breaks = 0.01*seq(-30, 50, 0.2),
                     labels = percent_format(accuracy = .1)) +
  scale_x_continuous(breaks = seq(1, 10, 1)) +

  theme(legend.position = c(0.7, 0.9),
        legend.title = element_blank())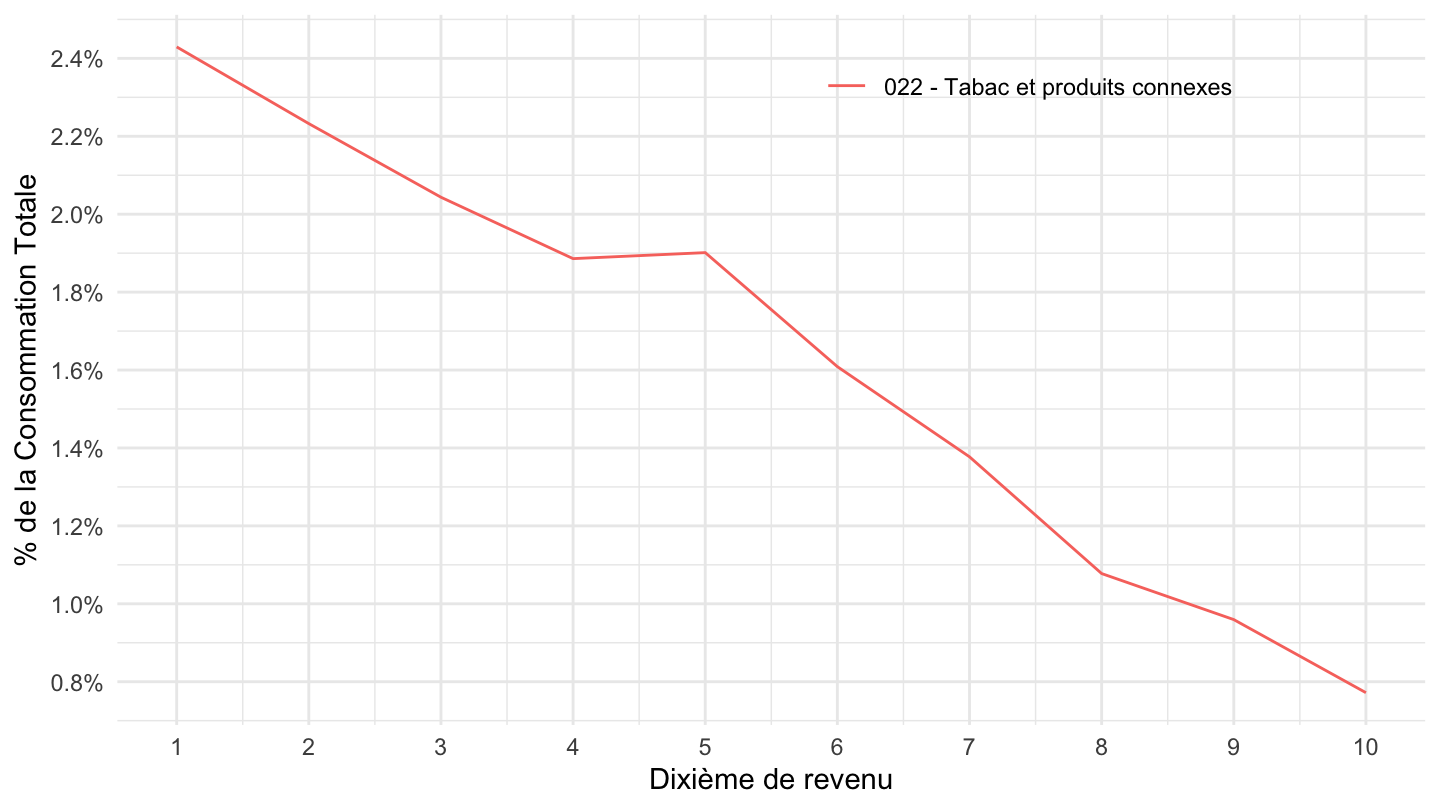
% du revenu disponible
Code
tm106 %>%
  filter(NOMENCLATURE %in% c("022"),
         DECUC != "TOT") %>%
  left_join(DECUC, by = "DECUC") %>%
  left_join(NOMENCLATURE, by = "NOMENCLATURE") %>%
  left_join(revenu_dispo_decile, by = "DECUC") %>%
  mutate(DECUC = DECUC %>% as.numeric) %>%
  arrange(DECUC2) %>%
  ggplot + geom_line(aes(x = DECUC, y = CONSO/revenu_dispo_decile, color = Nomenclature, group = Nomenclature)) +
  theme_minimal() + xlab("Dixième de revenu") + ylab("% du revenu disponible") +
  scale_y_continuous(breaks = 0.01*seq(-30, 50, 0.5),
                     labels = percent_format(accuracy = .1),
                     limits = c(0, 0.035)) +
  scale_x_continuous(breaks = seq(1, 10, 1)) +

  theme(legend.position = c(0.7, 0.9),
        legend.title = element_blank())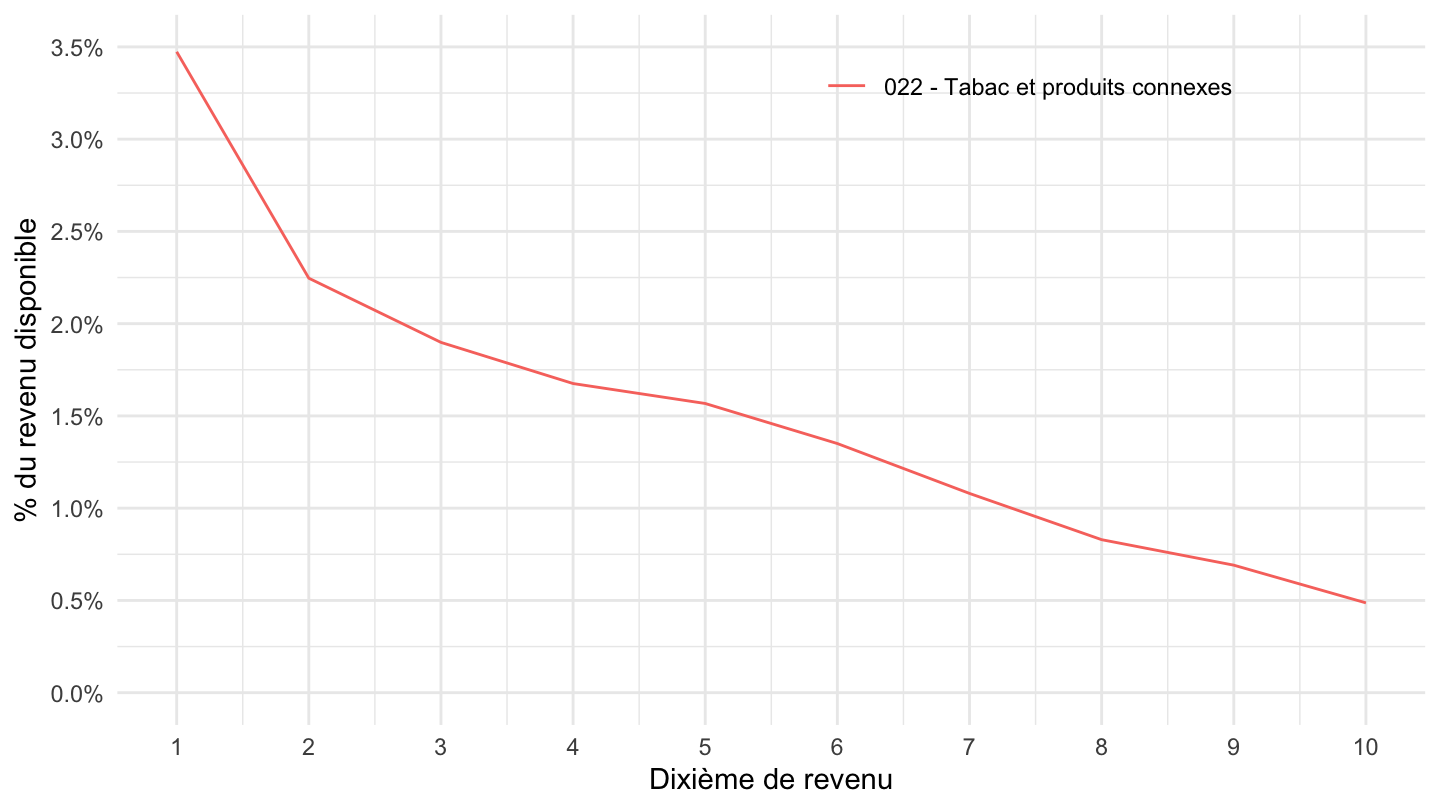
Services de communications (081, 0811, 0812, 0813)
Code
tm106 %>%
  filter(NOMENCLATURE %in% c("081", "0811", "0812", "0813", "CTOTALE")) %>%
  left_join(NOMENCLATURE, by = "NOMENCLATURE") %>%
  mutate(DECUC = DECUC %>% as.numeric) %>%
  group_by(DECUC) %>%
  mutate(CONSO = CONSO/CONSO[NOMENCLATURE == "CTOTALE"]) %>%
  filter(NOMENCLATURE != "CTOTALE") %>%
  ggplot + geom_line(aes(x = DECUC, y = CONSO, color = Nomenclature)) +
  theme_minimal() + xlab("Décile") + ylab("% de la Consommation Totale") +
  scale_y_continuous(breaks = 0.01*seq(-30, 50, 0.5),
                     labels = percent_format(accuracy = .1)) +
  scale_x_continuous(breaks = seq(0, 10, 1)) +

  theme(legend.position = c(0.7, 0.9),
        legend.title = element_blank())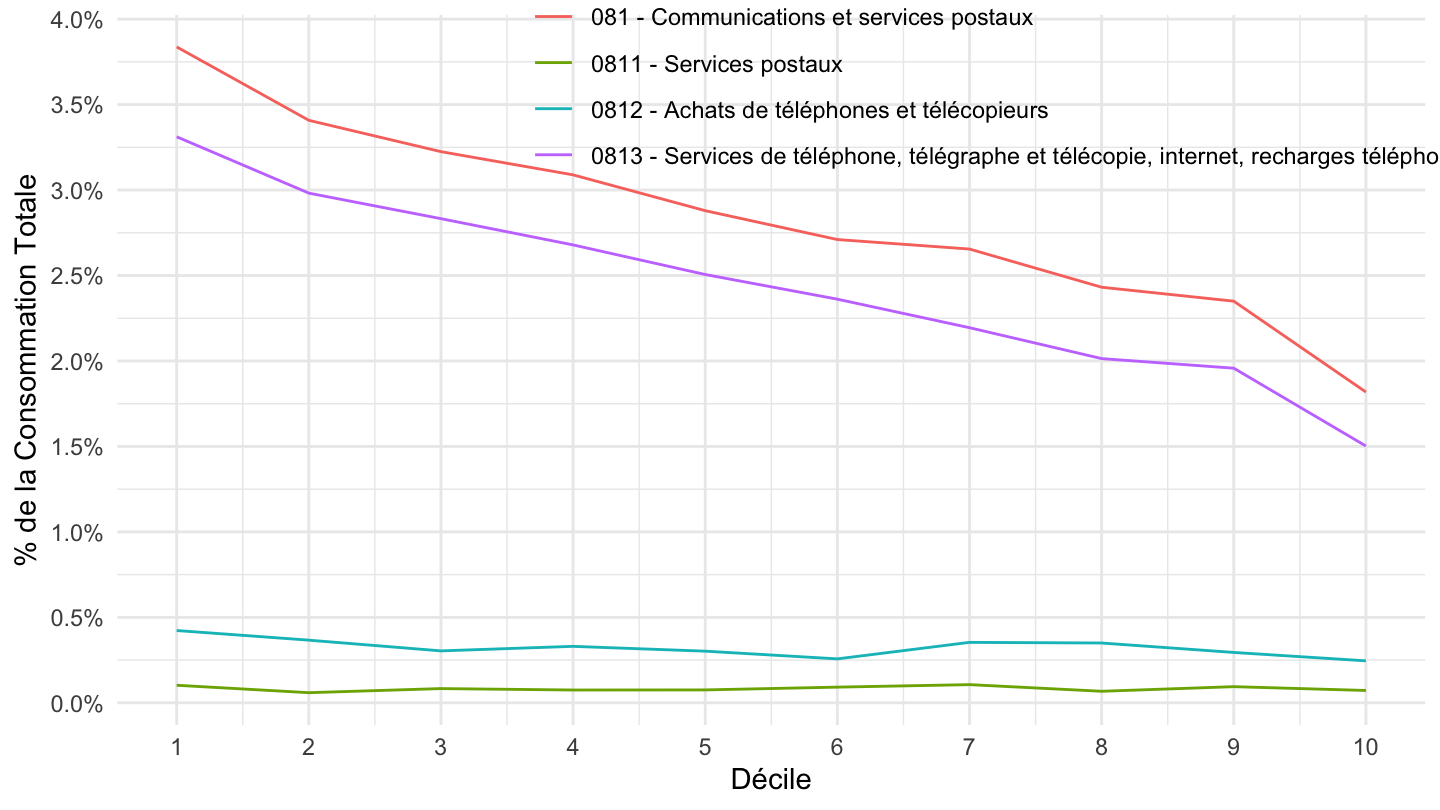
Communications, Services de téléphone
Code
tm106 %>%
  filter(NOMENCLATURE %in% c("0811", "0812", "CTOTALE")) %>%
  left_join(NOMENCLATURE, by = "NOMENCLATURE") %>%
  mutate(DECUC = DECUC %>% as.numeric) %>%
  group_by(DECUC) %>%
  mutate(CONSO = CONSO/CONSO[NOMENCLATURE == "CTOTALE"]) %>%
  filter(NOMENCLATURE != "CTOTALE") %>%
  ggplot + geom_line(aes(x = DECUC, y = CONSO, color = Nomenclature)) +
  theme_minimal() + xlab("Décile") + ylab("% de la Consommation Totale") +
  scale_y_continuous(breaks = 0.01*seq(-30, 50,0.05),
                     labels = percent_format(accuracy = .01)) +
  scale_x_continuous(breaks = seq(0, 10, 1)) +

  theme(legend.position = c(0.6, 0.9),
        legend.title = element_blank())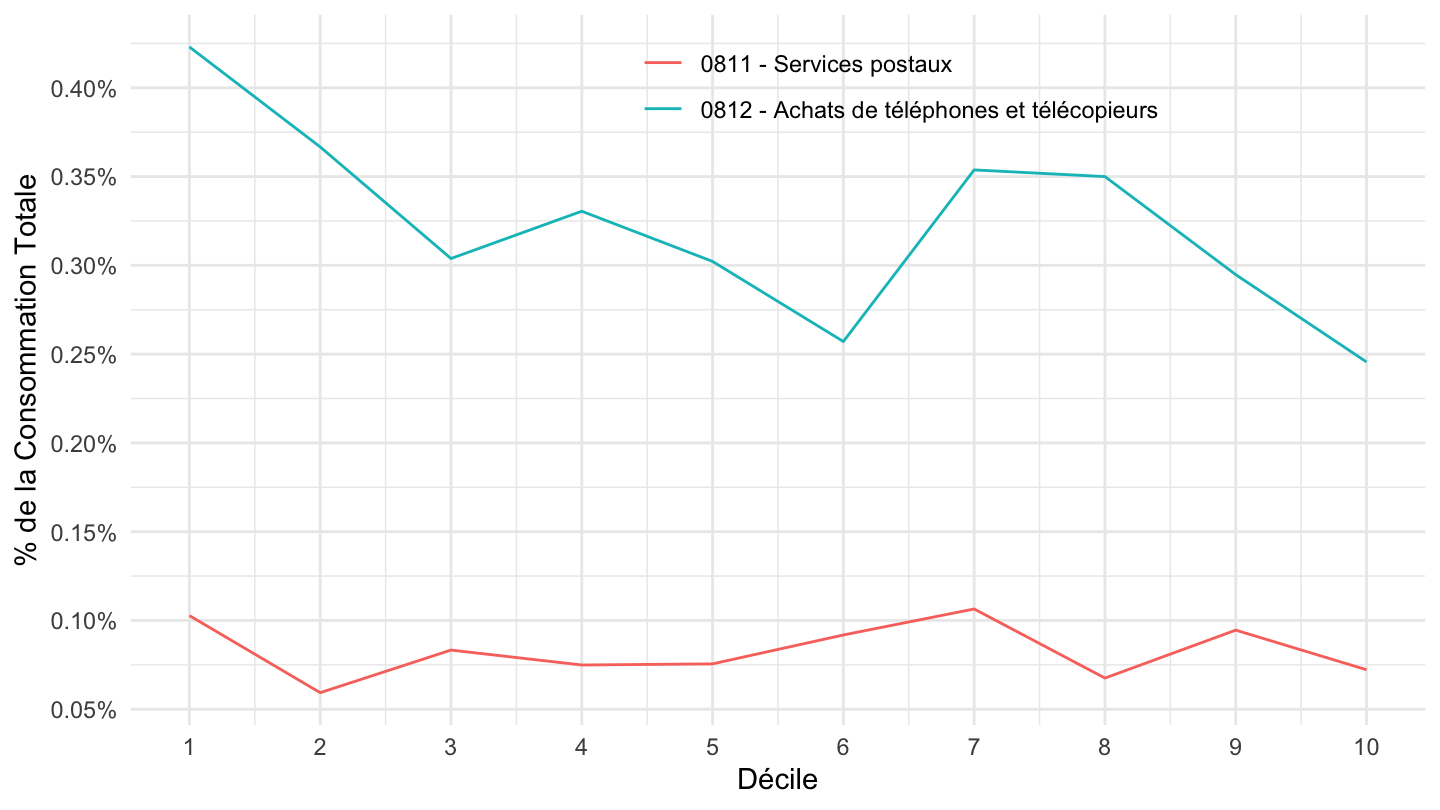
Alimentation, Logement, Loyer
Code
tm106 %>%
  filter(NOMENCLATURE %in% c("01", "04", "041", "CTOTALE")) %>%
  left_join(NOMENCLATURE, by = "NOMENCLATURE") %>%
  mutate(DECUC = DECUC %>% as.numeric) %>%
  group_by(DECUC) %>%
  mutate(CONSO = CONSO/CONSO[NOMENCLATURE == "CTOTALE"]) %>%
  filter(NOMENCLATURE != "CTOTALE") %>%
  ggplot + geom_line(aes(x = DECUC, y = CONSO, color = Nomenclature)) +
  theme_minimal() + xlab("Décile") + ylab("% de la Consommation Totale") +
  scale_y_continuous(breaks = 0.01*seq(-30, 50, 0.5),
                     labels = percent_format(accuracy = .1)) +
  scale_x_continuous(breaks = seq(0, 10, 1)) +

  theme(legend.position = c(0.7, 0.9),
        legend.title = element_blank())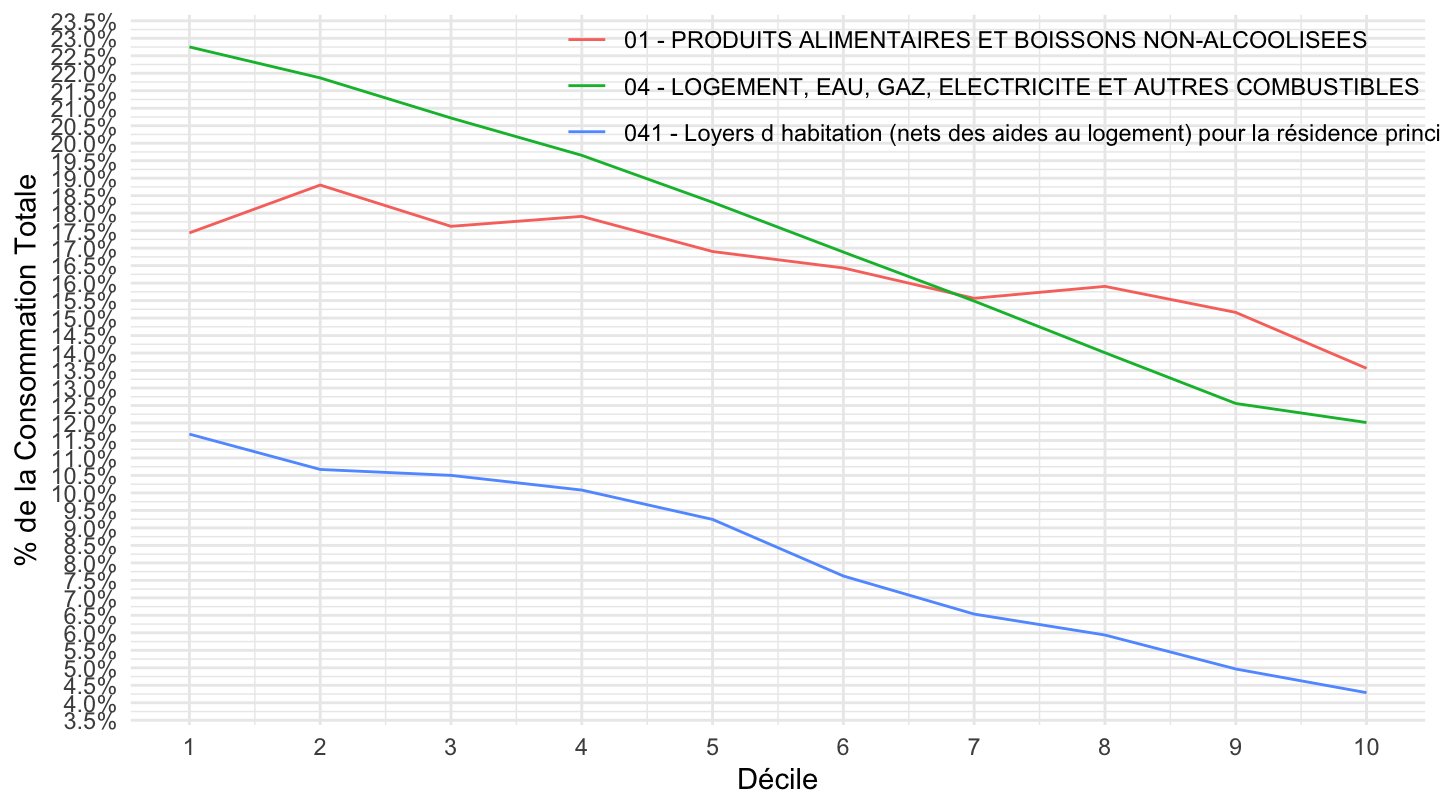
Alimentation, Electricité, Frais utilisation
Code
tm106 %>%
  filter(NOMENCLATURE %in% c("01", "072", "045", "CTOTALE")) %>%
  left_join(NOMENCLATURE, by = "NOMENCLATURE") %>%
  mutate(DECUC = DECUC %>% as.numeric) %>%
  group_by(DECUC) %>%
  mutate(CONSO = CONSO/CONSO[NOMENCLATURE == "CTOTALE"]) %>%
  filter(NOMENCLATURE != "CTOTALE") %>%
  ggplot + geom_line(aes(x = DECUC, y = CONSO, color = Nomenclature)) +
  theme_minimal() + xlab("Décile") + ylab("% de la Consommation Totale") +
  scale_y_continuous(breaks = 0.01*seq(-30, 50, 0.5),
                     labels = percent_format(accuracy = .1)) +
  scale_x_continuous(breaks = seq(0, 10, 1)) +

  theme(legend.position = c(0.7, 0.9),
        legend.title = element_blank())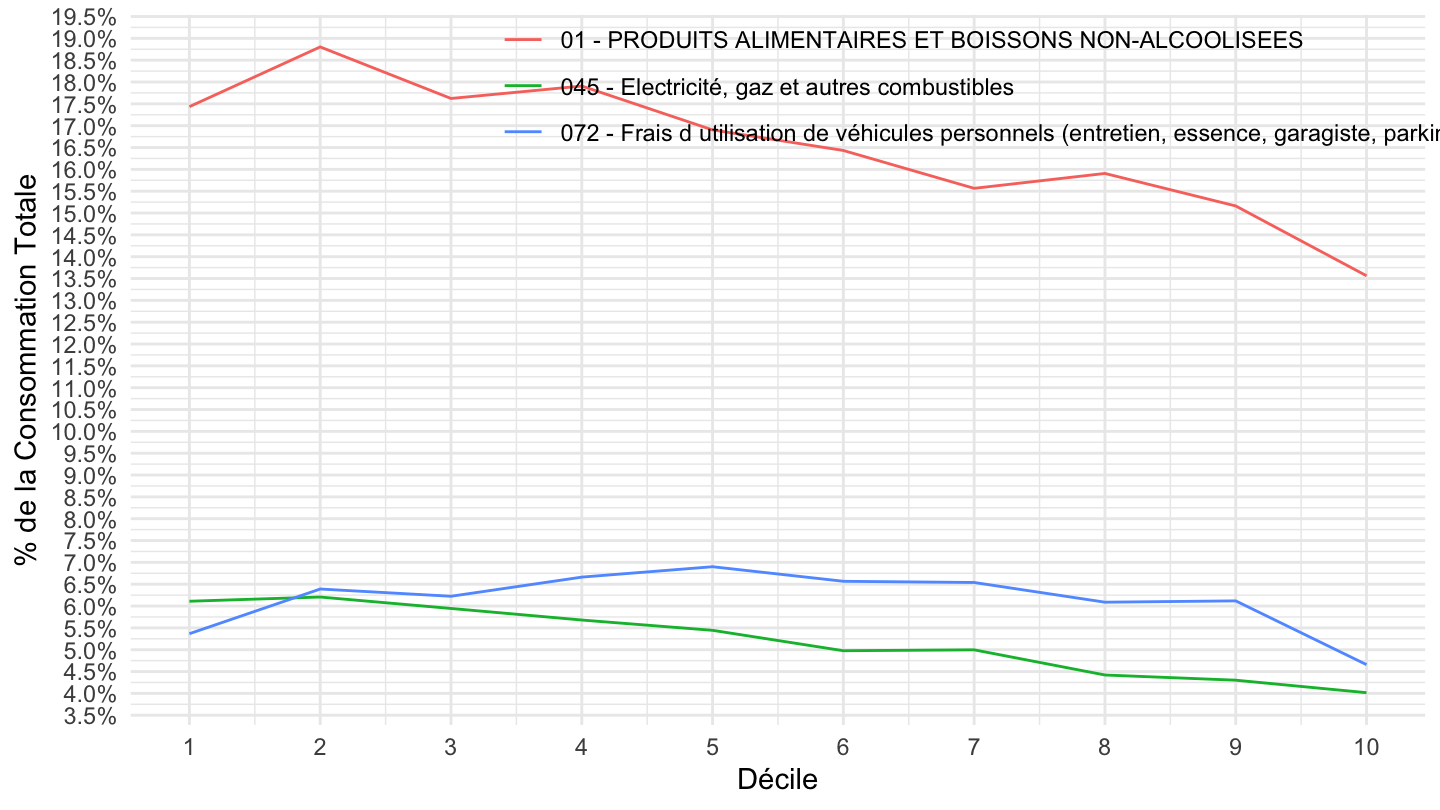
Carburants et lubrifiants, antigel (0722), Electricité + gaz (045)
% de la consommation
Code
tm106 %>%
  filter(NOMENCLATURE %in% c("045", "0722", "CTOTALE"),
         DECUC != "TOT") %>%
  left_join(DECUC, by = "DECUC") %>%
  left_join(NOMENCLATURE, by = "NOMENCLATURE") %>%
  mutate(DECUC = DECUC %>% as.numeric) %>%
  group_by(DECUC) %>%
  mutate(value = CONSO/CONSO[NOMENCLATURE == "CTOTALE"]) %>%
  filter(NOMENCLATURE != "CTOTALE") %>%
  select(DECUC2, value, Nomenclature, everything()) %>%
  ggplot + geom_line(aes(x = DECUC2, y = value, color = Nomenclature, group = Nomenclature)) +
  theme_minimal() + xlab("") + ylab("% de la Consommation Totale") +
  scale_y_continuous(breaks = 0.01*seq(-30, 50, 0.5),
                     labels = percent_format(accuracy = .1)) +

  theme(legend.position = c(0.7, 0.9),
        legend.title = element_blank())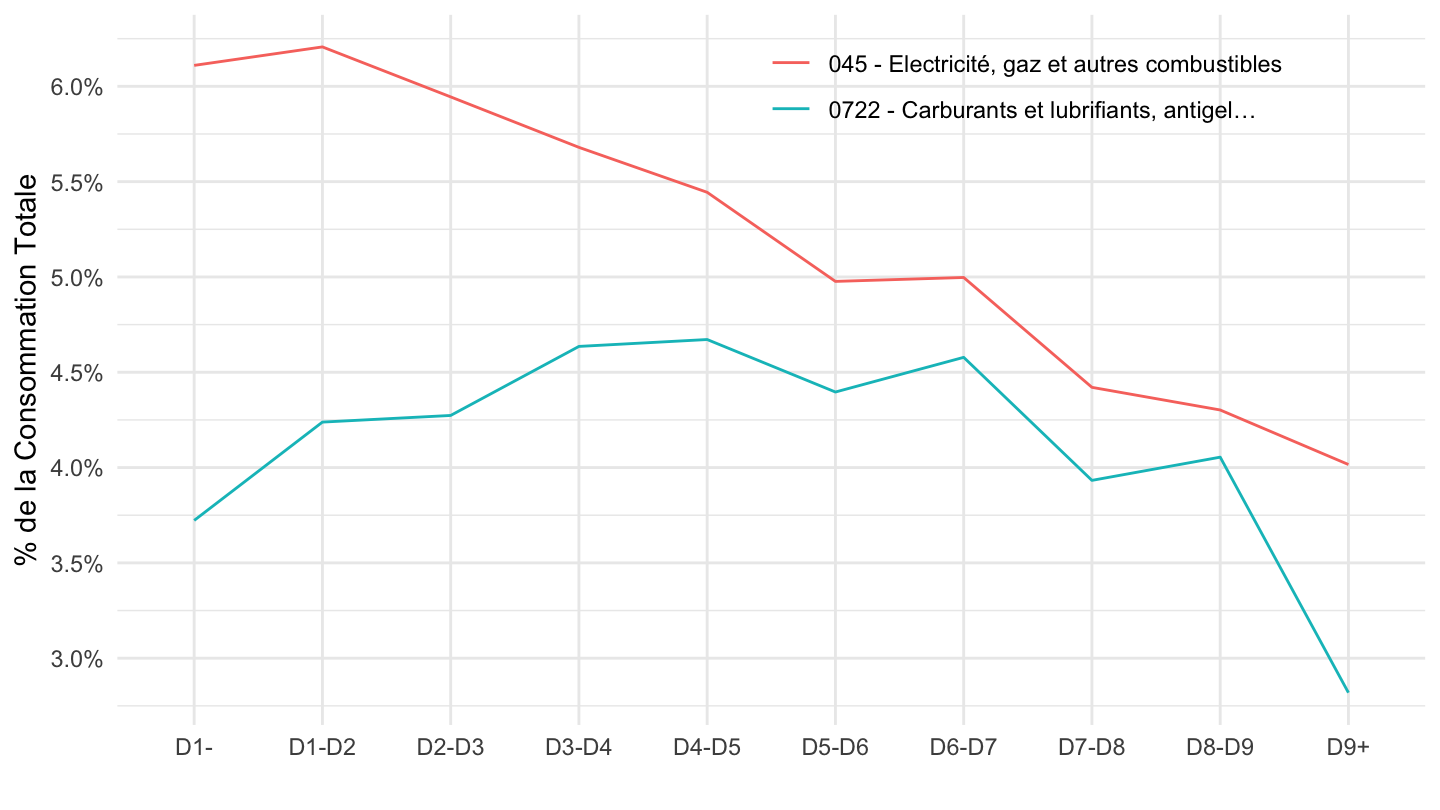
% du revenu disponible
Code
tm106 %>%
  filter(NOMENCLATURE %in% c("045", "0722"),
         DECUC != "TOT") %>%
  left_join(DECUC, by = "DECUC") %>%
  left_join(NOMENCLATURE, by = "NOMENCLATURE") %>%
  left_join(revenu_dispo_decile, by = "DECUC") %>%
  mutate(DECUC = DECUC %>% as.numeric) %>%
  filter(NOMENCLATURE != "CTOTALE") %>%
  mutate(value = CONSO/revenu_dispo_decile) %>%
  select(DECUC2, value, Nomenclature, everything()) %>%
  ggplot + geom_line(aes(x = DECUC2, y = value, color = Nomenclature, group = Nomenclature)) +
  theme_minimal() + xlab("") + ylab("% ddu revenu disponible") +
  scale_y_continuous(breaks = 0.01*seq(-30, 50, 1),
                     labels = percent_format(accuracy = 1)) +
  #
  theme(legend.position = c(0.5, 0.9),
        legend.title = element_blank())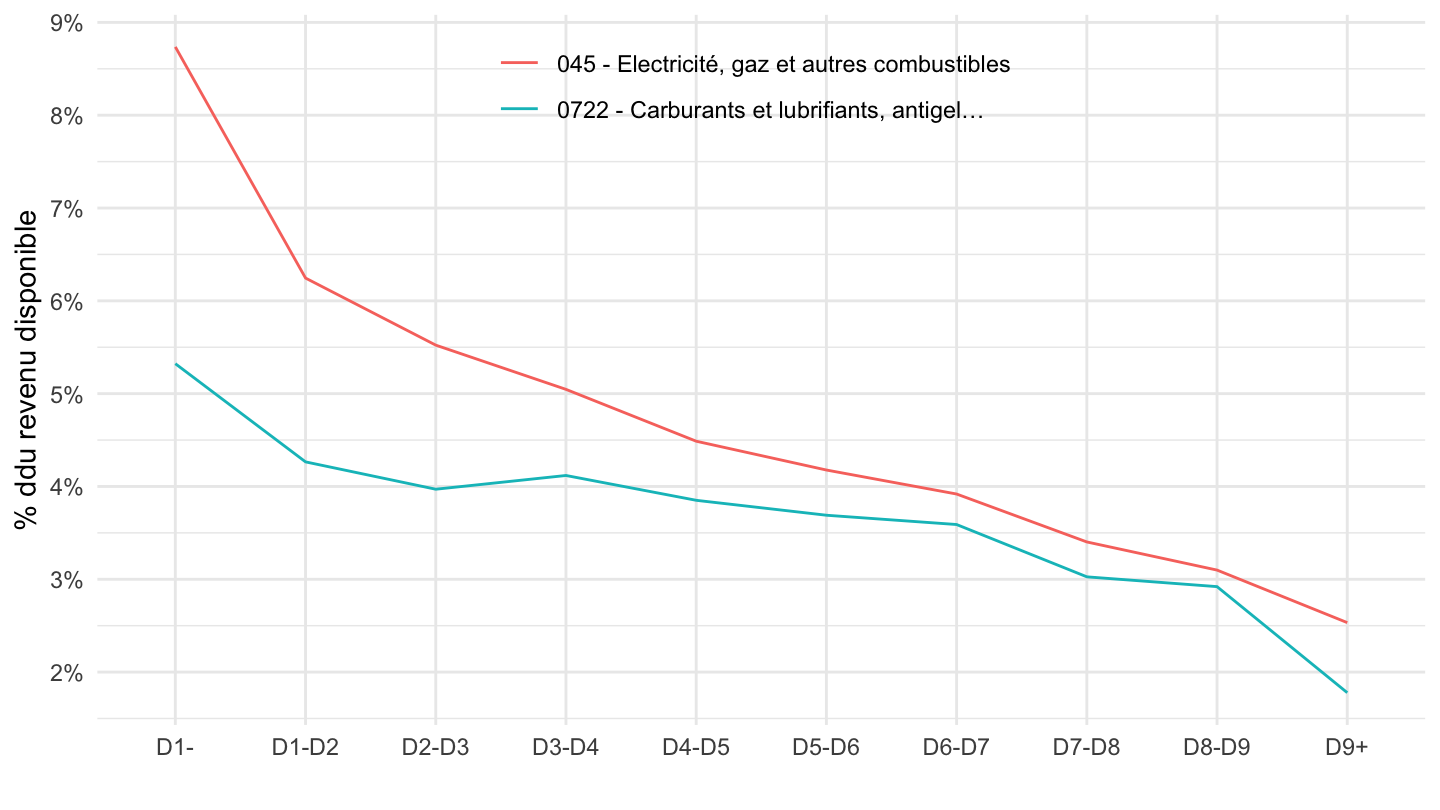
Carburants et lubrifiants, antigel (0722), Electricité (045), Pains et Céréales (0111)
Code
tm106 %>%
  filter(NOMENCLATURE %in% c("045", "0722", "0111", "CTOTALE"),
         DECUC != "TOT") %>%
  left_join(NOMENCLATURE, by = "NOMENCLATURE") %>%
  left_join(DECUC, by = "DECUC") %>%
  mutate(DECUC = DECUC %>% as.numeric) %>%
  group_by(DECUC) %>%
  mutate(CONSO = CONSO/CONSO[NOMENCLATURE == "CTOTALE"]) %>%
  filter(NOMENCLATURE != "CTOTALE") %>%
  ggplot + geom_line(aes(x = DECUC2, y = CONSO, color = Nomenclature, group = Nomenclature)) +
  theme_minimal() + xlab("") + ylab("% de la Consommation Totale") +
  scale_y_continuous(breaks = 0.01*seq(-30, 50, 0.5),
                     labels = percent_format(accuracy = .1),
                     limits = c(0, 0.065)) +

  theme(legend.position = c(0.5, 0.2),
        legend.title = element_blank())
Electricité (045), Pains et Céréales (0111), Pâtes
Code
tm106 %>%
  filter(NOMENCLATURE %in% c("045", "01113", "0111", "CTOTALE")) %>%
  left_join(NOMENCLATURE, by = "NOMENCLATURE") %>%
  left_join(DECUC, by = "DECUC") %>%
  mutate(DECUC = DECUC %>% as.numeric) %>%
  group_by(DECUC) %>%
  mutate(CONSO = CONSO/CONSO[NOMENCLATURE == "CTOTALE"]) %>%
  filter(NOMENCLATURE != "CTOTALE") %>%
  ggplot + geom_line(aes(x = DECUC2, y = CONSO, color = Nomenclature, group = Nomenclature)) +
  theme_minimal() + xlab("Décile") + ylab("% de la Consommation Totale") +
  scale_y_continuous(breaks = 0.01*seq(-30, 50, 0.5),
                     labels = percent_format(accuracy = .1)) +

  theme(legend.position = c(0.5, 0.9),
        legend.title = element_blank())
Enseignement, Achats de téléphones, Services
Code
tm106 %>%
  filter(NOMENCLATURE %in% c("0813", "0812", "10", "CTOTALE")) %>%
  left_join(NOMENCLATURE, by = "NOMENCLATURE") %>%
  mutate(DECUC = DECUC %>% as.numeric) %>%
  group_by(DECUC) %>%
  mutate(CONSO = CONSO/CONSO[NOMENCLATURE == "CTOTALE"]) %>%
  filter(NOMENCLATURE != "CTOTALE") %>%
  ggplot + geom_line(aes(x = DECUC, y = CONSO, color = Nomenclature)) +
  theme_minimal() + xlab("Décile") + ylab("% de la Consommation Totale") +
  scale_y_continuous(breaks = 0.01*seq(-30, 50, 0.5),
                     labels = percent_format(accuracy = .1)) +
  scale_x_continuous(breaks = seq(0, 10, 1)) +

  theme(legend.position = c(0.7, 0.9),
        legend.title = element_blank())
Enseignement secondaire, Enseignement supérieur, Assurances liées à la santé
Code
tm106 %>%
  filter(NOMENCLATURE %in% c("1011", "1013", "1012", "CTOTALE")) %>%
  left_join(NOMENCLATURE, by = "NOMENCLATURE") %>%
  mutate(DECUC = DECUC %>% as.numeric) %>%
  group_by(DECUC) %>%
  mutate(CONSO = CONSO/CONSO[NOMENCLATURE == "CTOTALE"]) %>%
  filter(NOMENCLATURE != "CTOTALE") %>%
  ggplot + geom_line(aes(x = DECUC, y = CONSO, color = Nomenclature)) +
  theme_minimal() + xlab("Décile") + ylab("% de la Consommation Totale") +
  scale_y_continuous(breaks = 0.01*seq(-30, 50, 0.5),
                     labels = percent_format(accuracy = .1)) +
  scale_x_continuous(breaks = seq(0, 10, 1)) +

  theme(legend.position = c(0.7, 0.9),
        legend.title = element_blank())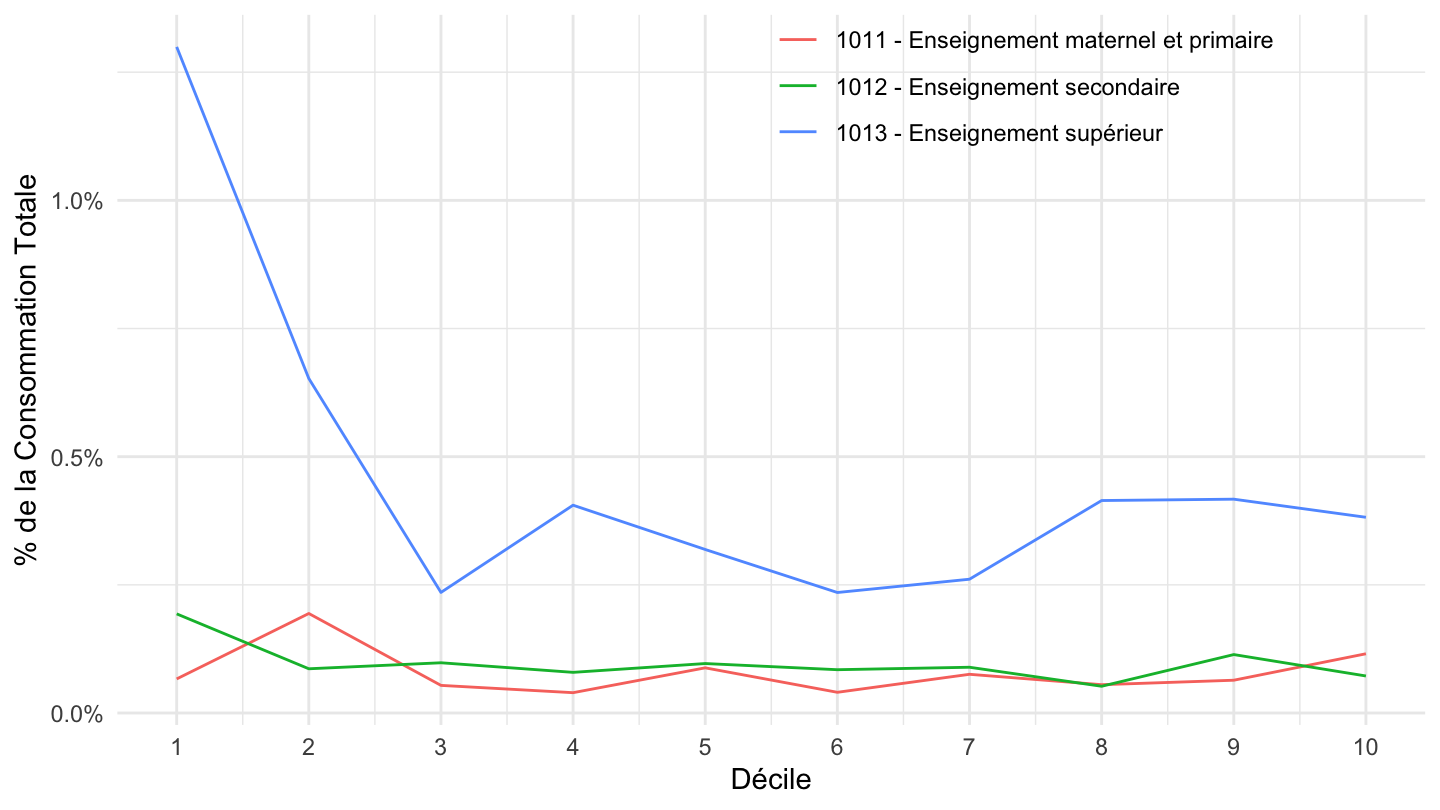
Enseignement secondaire, Enseignement supérieur, Assurances liées à la santé
Code
tm106 %>%
  filter(NOMENCLATURE %in% c("1253", "1013", "1012", "CTOTALE")) %>%
  left_join(NOMENCLATURE, by = "NOMENCLATURE") %>%
  mutate(DECUC = DECUC %>% as.numeric) %>%
  group_by(DECUC) %>%
  mutate(CONSO = CONSO/CONSO[NOMENCLATURE == "CTOTALE"]) %>%
  filter(NOMENCLATURE != "CTOTALE") %>%
  ggplot + geom_line(aes(x = DECUC, y = CONSO, color = Nomenclature)) +
  theme_minimal() + xlab("Décile") + ylab("% de la Consommation Totale") +
  scale_y_continuous(breaks = 0.01*seq(-30, 50, 0.5),
                     labels = percent_format(accuracy = .1)) +
  scale_x_continuous(breaks = seq(0, 10, 1)) +

  theme(legend.position = c(0.7, 0.9),
        legend.title = element_blank())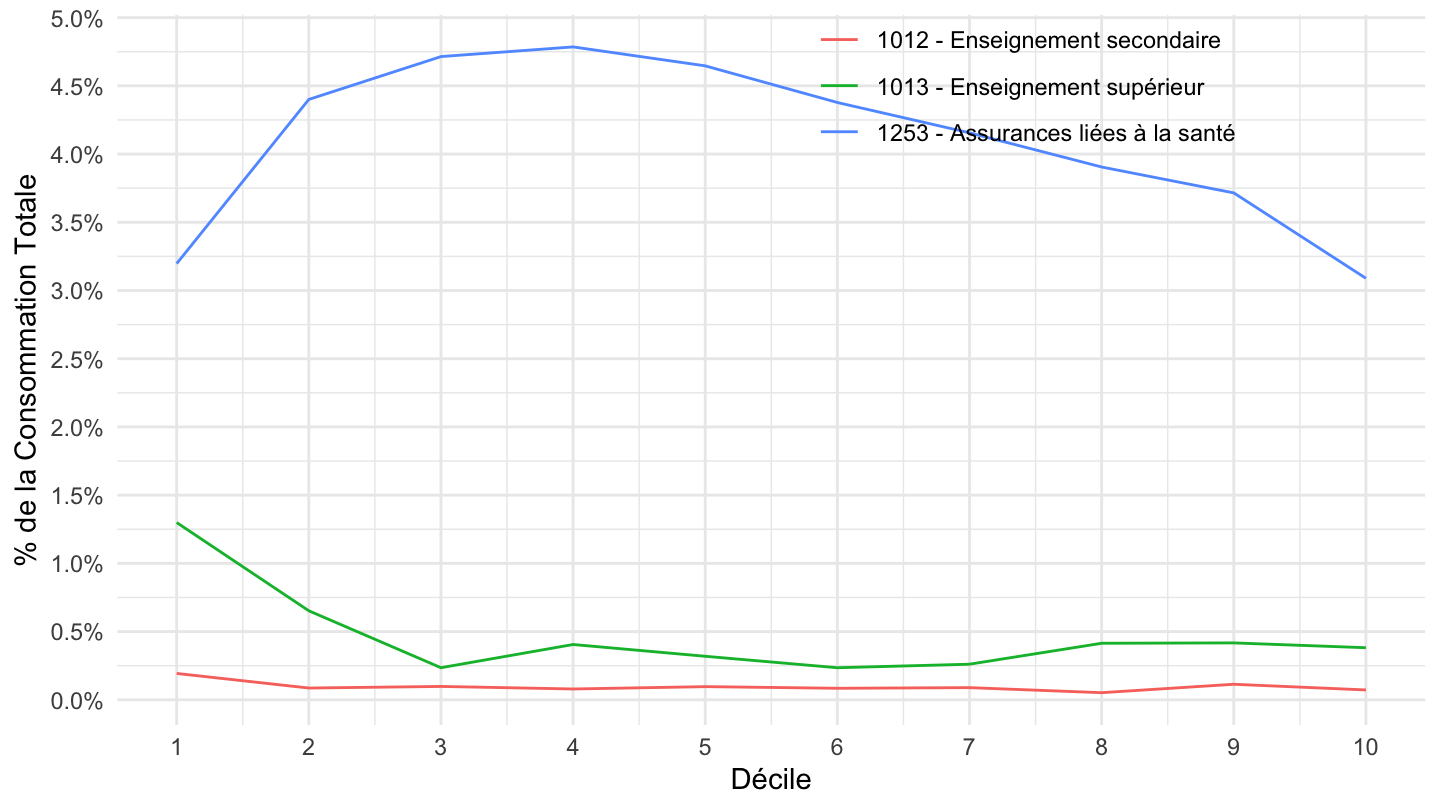
Santé, Assurances liées à la santé
Code
tm106 %>%
  filter(NOMENCLATURE %in% c("1253", "06", "061", "CTOTALE")) %>%
  left_join(NOMENCLATURE, by = "NOMENCLATURE") %>%
  mutate(DECUC = DECUC %>% as.numeric) %>%
  group_by(DECUC) %>%
  mutate(CONSO = CONSO/CONSO[NOMENCLATURE == "CTOTALE"]) %>%
  filter(NOMENCLATURE != "CTOTALE") %>%
  ggplot + geom_line(aes(x = DECUC, y = CONSO, color = Nomenclature)) +
  theme_minimal() + xlab("Décile") + ylab("% de la Consommation Totale") +
  scale_y_continuous(breaks = 0.01*seq(-30, 50, 0.5),
                     labels = percent_format(accuracy = .1)) +
  scale_x_continuous(breaks = seq(0, 10, 1)) +

  theme(legend.position = c(0.7, 0.9),
        legend.title = element_blank())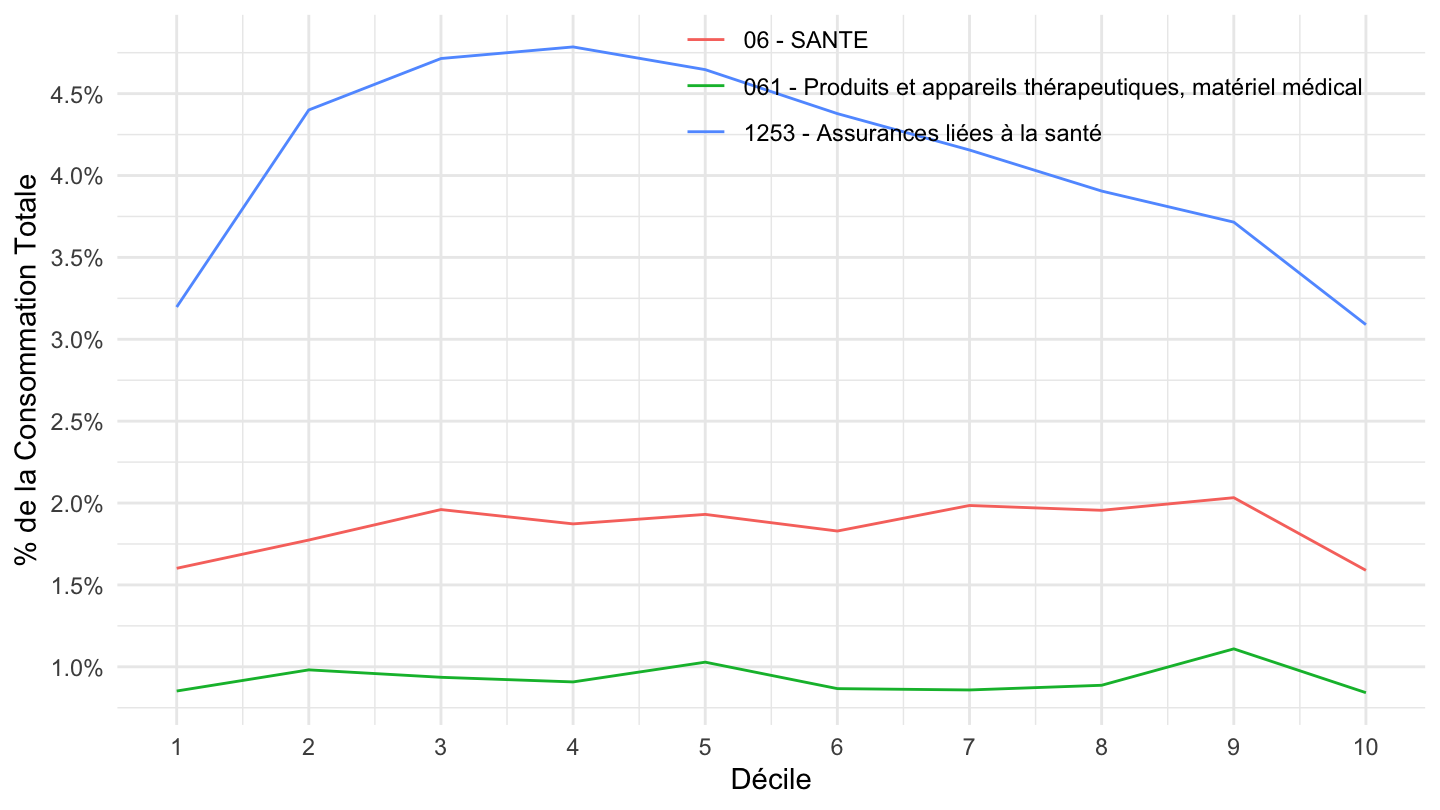
IPC par déciles ?
Code
load_data("insee/IPC-2015.RData")
load_data("insee/IPCH-2015.RData")