Contributions to euro area annual inflation (in percentage points)
Data - Eurostat
Info
Last observation: Monthly: 2025M12 (N = 419)
First observation: Monthly: 2002M01 (N = 134)
Last data update: 23 jul 2026, 22:37. Last compile: 24 jul 2026, 03:16
Structure
coicop
Main decomposition
2019-
Code
prc_hicp_ctrb %>%
  filter(coicop %in% c("FOOD", "NRG", "IGD_NNRG", "SERV"),
         geo == "EA") %>%
  select(-geo, -unit) %>%

  month_to_date %>%
  filter(date >= as.Date("2019-01-01")) %>%
  mutate(Coicop_factor = factor(coicop, levels = c("SERV", "IGD_NNRG", "NRG", "FOOD"),
                         labels = c("Services", "Manufactured goods",
                                    "Energy", "Food"))) %>%
  ggplot(., aes(x = date, y = values/100)) +
  geom_col(aes(fill = Coicop_factor), alpha = 1) +
  theme_minimal() + xlab("") + ylab("Contributions to inflation") +
  scale_fill_manual(values = c("orange", "red", "blue", "darkgreen")) +
  scale_x_date(breaks ="3 months",
               labels = date_format("%b %Y")) +
  scale_y_continuous(breaks = 0.01*seq(-10, 30, 1),
                     labels = percent_format(accuracy = 1)) +
  theme(legend.position = c(0.3, 0.75),
        legend.title = element_blank(),
        axis.text.x = element_text(angle = 45, vjust = 1, hjust = 1))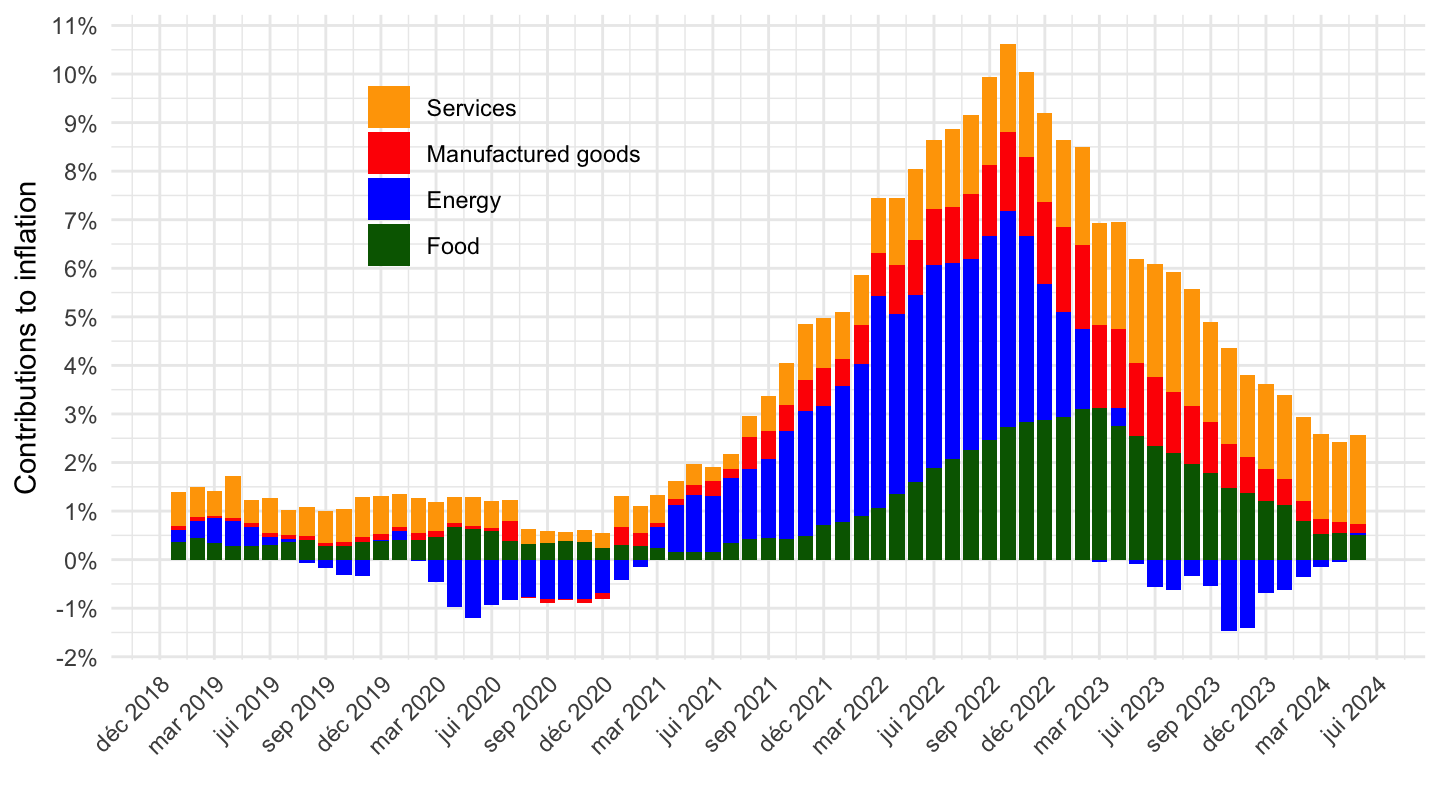
2020-
Code
prc_hicp_ctrb %>%
  filter(coicop %in% c("FOOD", "NRG", "IGD_NNRG", "SERV"),
         geo == "EA") %>%
  select(-geo, -unit) %>%

  month_to_date %>%
  filter(date >= as.Date("2020-01-01")) %>%
  mutate(Coicop_factor = factor(coicop, levels = c("SERV", "IGD_NNRG", "NRG", "FOOD"),
                         labels = c("Services", "Manufactured goods",
                                    "Energy", "Food"))) %>%
  ggplot(., aes(x = date, y = values/100)) +
  geom_col(aes(fill = Coicop_factor), alpha = 1) +
  theme_minimal() + xlab("") + ylab("Contributions to inflation") +
  scale_fill_manual(values = c("orange", "red", "blue", "darkgreen")) +
  scale_x_date(breaks ="3 months",
               labels = date_format("%b %Y")) +
  scale_y_continuous(breaks = 0.01*seq(-10, 30, 1),
                     labels = percent_format(accuracy = 1)) +
  theme(legend.position = c(0.3, 0.75),
        legend.title = element_blank(),
        axis.text.x = element_text(angle = 45, vjust = 1, hjust = 1))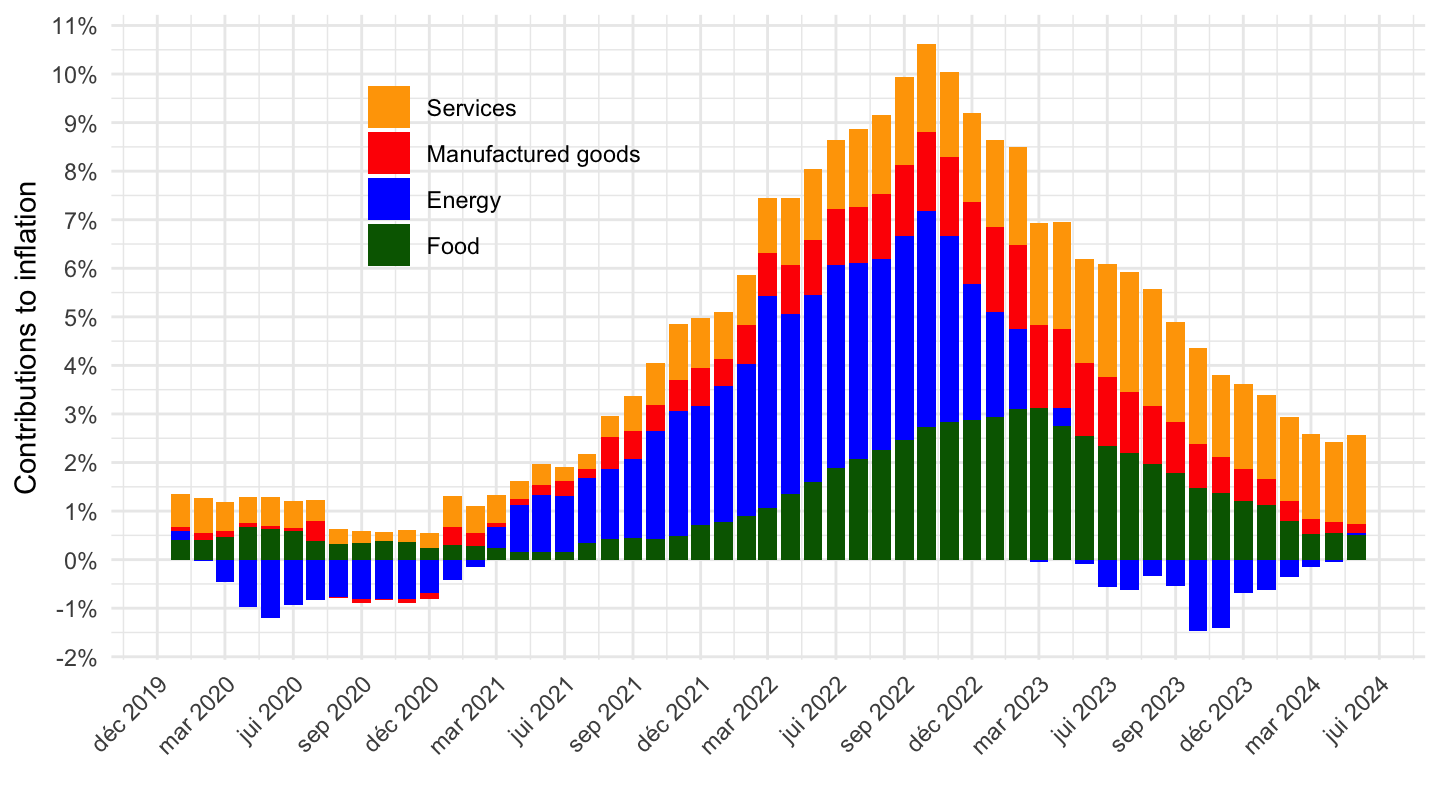
2021-
Code
line <- prc_hicp_manr %>%
  filter(coicop %in% c("CP00", "TOT_X_NRG_FOOD"),
         geo == "EA") %>%
  month_to_date %>%
  filter(date >= as.Date("2021-01-01")) %>%
  mutate(line_en = factor(coicop, levels = c("CP00", "TOT_X_NRG_FOOD"),
                          labels = c("HICP inflation", "Core inflation (without energy, food)")))

prc_hicp_ctrb %>%
  filter(coicop %in% c("FOOD", "NRG", "IGD_NNRG", "SERV"),
         geo == "EA") %>%
  select(-geo, -unit) %>%

  month_to_date %>%
  filter(date >= as.Date("2021-01-01")) %>%
  mutate(Coicop_factor = factor(coicop, levels = c("SERV", "IGD_NNRG", "NRG", "FOOD"),
                         labels = c("Services", "Manufactured goods",
                                    "Energy", "Food"))) %>%
  ggplot(., aes(x = date, y = values/100)) +
  geom_col(aes(fill = Coicop_factor), alpha = 1) +
  geom_line(data = line, aes(linetype = line_en), size = 1.2) +
  theme_minimal() + xlab("") + ylab("Contributions to inflation") +
  scale_fill_manual(values = c("orange", "red", "blue", "darkgreen")) +
  scale_x_date(breaks = "2 months",
               expand = c(.01, 0), date_labels = "%b %Y") +
  scale_y_continuous(breaks = 0.01*seq(-10, 30, 1),
                     labels = percent_format(accuracy = 1)) +
  theme(legend.position = c(0.2, 0.75),
        legend.title = element_blank(),
        axis.text.x = element_text(angle = 45, vjust = 1, hjust = 1))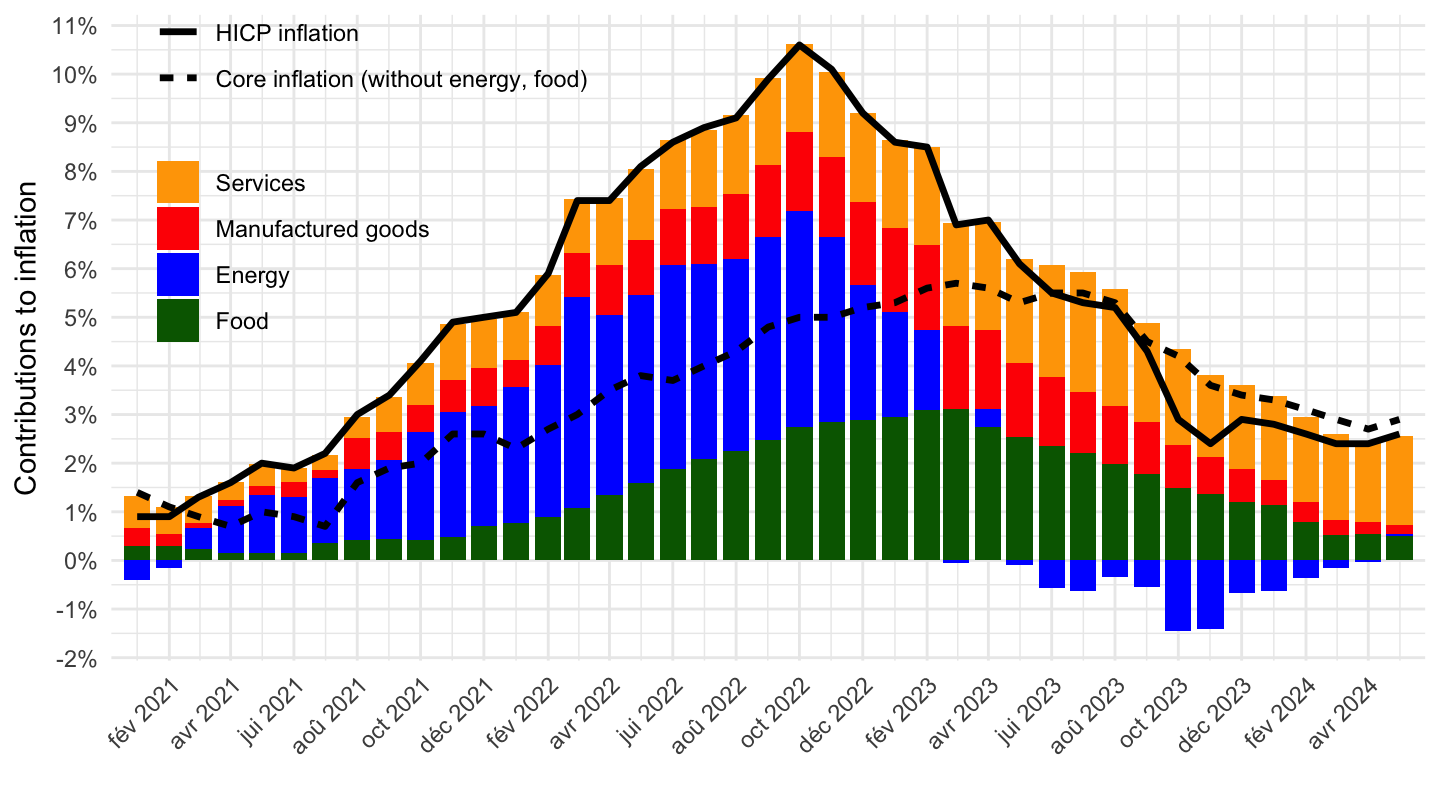
2022-
Code
line <- prc_hicp_manr %>%
  filter(coicop %in% c("CP00", "TOT_X_NRG_FOOD"),
         geo == "EA") %>%
  month_to_date %>%
  filter(date >= as.Date("2022-01-01")) %>%
  mutate(line_en = factor(coicop, levels = c("CP00", "TOT_X_NRG_FOOD"),
                          labels = c("HICP inflation", "Core inflation (without energy, food)")))

prc_hicp_ctrb %>%
  filter(coicop %in% c("FOOD", "NRG", "IGD_NNRG", "SERV"),
         geo == "EA") %>%
  select(-geo, -unit) %>%

  month_to_date %>%
  filter(date >= as.Date("2022-01-01")) %>%
  mutate(Coicop_factor = factor(coicop, levels = c("SERV", "IGD_NNRG", "NRG", "FOOD"),
                         labels = c("Services", "Manufactured goods",
                                    "Energy", "Food"))) %>%
  ggplot(., aes(x = date, y = values/100)) +
  geom_col(aes(fill = Coicop_factor), alpha = 1) +
  geom_line(data = line, aes(linetype = line_en), size = 1.2) +
  theme_minimal() + xlab("") + ylab("Contributions to inflation") +
  scale_fill_manual(values = c("orange", "red", "blue", "darkgreen")) +
  scale_x_date(breaks = "1 month",
               expand = c(.01, 0), date_labels = "%b %Y") +
  scale_y_continuous(breaks = 0.01*seq(-10, 30, 1),
                     labels = percent_format(accuracy = 1)) +
  theme(legend.position = c(0.2, 0.75),
        legend.title = element_blank(),
        axis.text.x = element_text(angle = 45, vjust = 1, hjust = 1))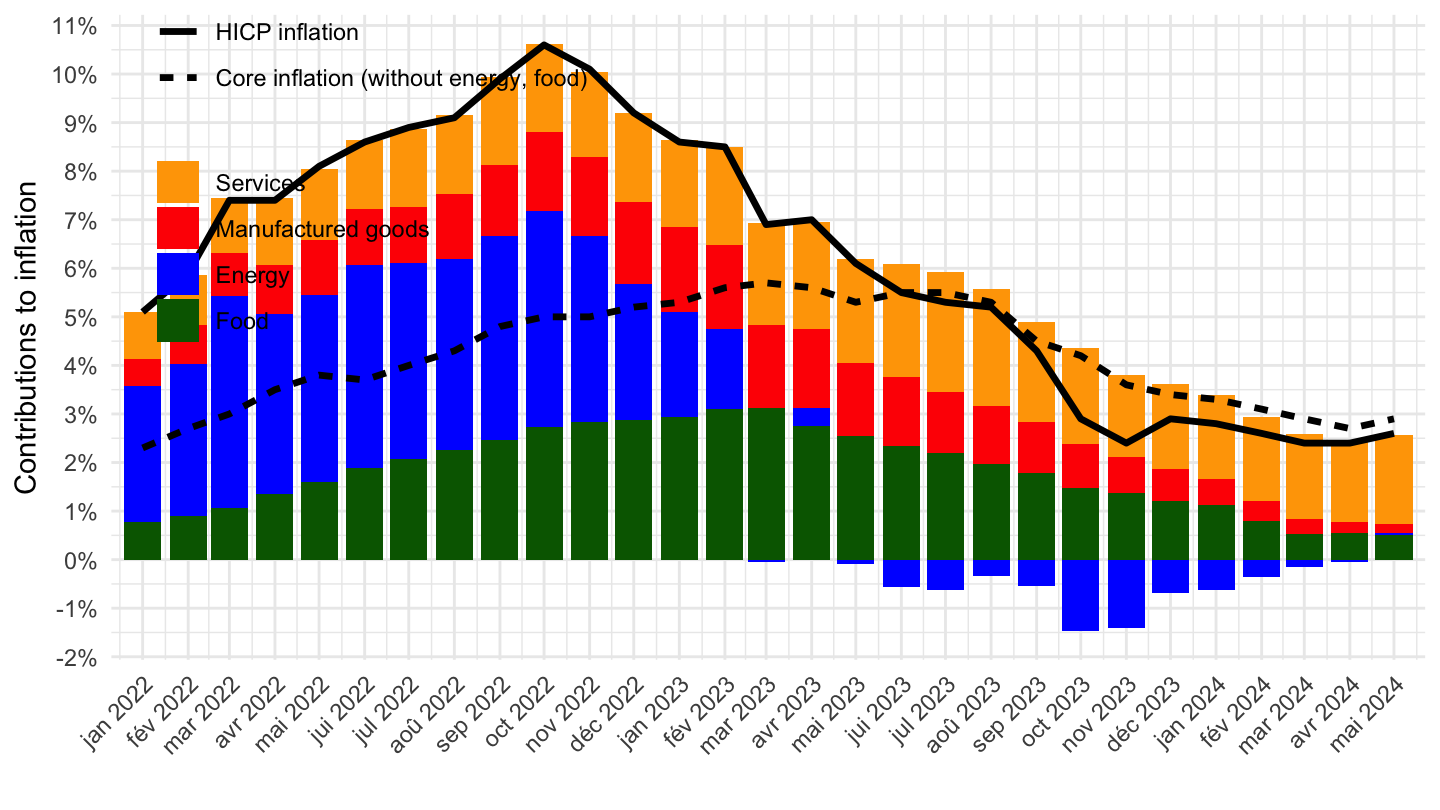
Last: Biggest contributions to inflation
Only Last
Code
last_time <- prc_hicp_ctrb %>%
  group_by(time) %>%
  summarise(Nobs = n()) %>%
  arrange(desc(time)) %>%
  head(1) %>%
  pull(time)

prc_hicp_ctrb %>%
  filter(time == last_time) %>%
  select_if(function(col) length(unique(col)) > 1) %>%

  arrange(-values) %>%
  select(coicop, Coicop, everything()) %>%
  print_table_conditional()
Average December 2021 - March 2022
Code
prc_hicp_ctrb %>%
  filter(time %in% c("2021M12", "2021M01", "2021M02", "2022M03")) %>%
  select_if(~ n_distinct(.) > 1) %>%

  group_by(coicop, Coicop) %>%
  summarise(values = mean(values)) %>%
  arrange(-values) %>%
  print_table_conditional()
Inflation since October 2021
Energy Aggregate
Code
i_g("https://fgeerolf.com/bib/eurostat/NRG_aggregate.png")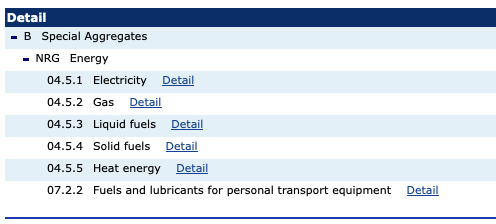
Stack up
Code
prc_hicp_ctrb %>%
  filter(coicop %in% c("CP0451", "CP0452", "CP0453", "CP0454", "CP0455", "CP0722"),
         geo == "EA") %>%
  select(-geo, -unit) %>%

  month_to_date %>%
  filter(date >= as.Date("2019-01-01")) %>%
  ggplot(., aes(x = date, y = values/100)) +
  geom_col(aes(fill = Coicop), alpha = 1) +
  theme_minimal() + xlab("") + ylab("Contributions to inflation, Energy Aggregate") +
  scale_x_date(breaks ="3 months",
               labels = date_format("%b %Y")) +
  scale_y_continuous(breaks = 0.01*seq(-10, 30, 1),
                     labels = percent_format(accuracy = 1)) +
  theme(legend.position = c(0.3, 0.75),
        legend.title = element_blank(),
        axis.text.x = element_text(angle = 45, vjust = 1, hjust = 1))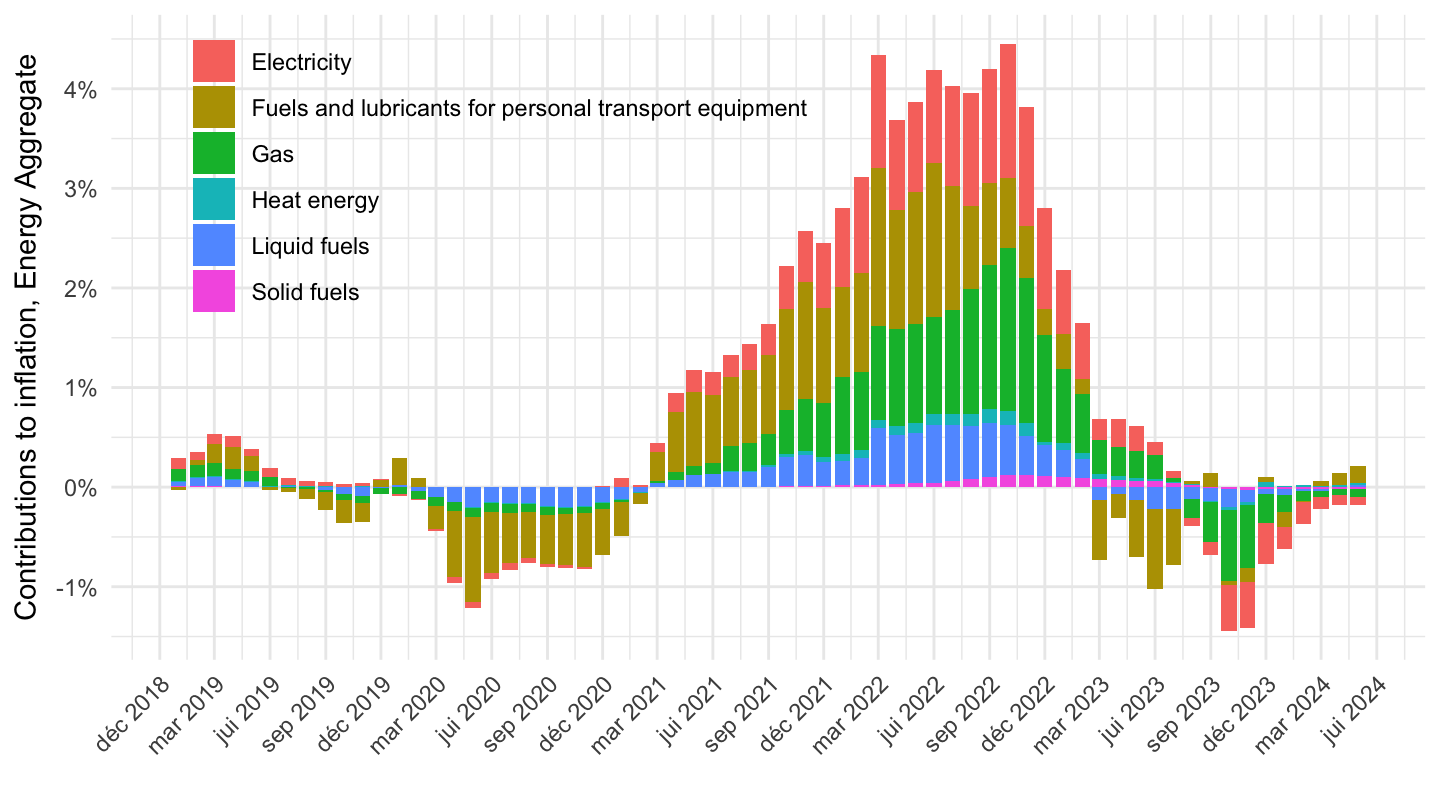
All
All
Code
prc_hicp_ctrb %>%
  filter(coicop %in% c("CP045", "CP072", "CP01", "CP111"),
         geo == "EA") %>%
  select(-geo, -unit) %>%
  spread(coicop, values) %>%
  transmute(time,
            `Energy, Transport` = CP045 + CP072,
            `Energy, Transport, Food` = CP045 + CP072 + CP01,
            `Energy, Transport, Food, Catering` = CP045 + CP072 + CP01 + CP111) %>%
  gather(Coicop, values, -time) %>%
  month_to_date %>%
  ggplot + geom_line(aes(x = date, y = values/100, color = Coicop)) +
  theme_minimal() + xlab("") + ylab("Contributions to inflation") +
  scale_x_date(breaks ="2 years",
               labels = date_format("%Y")) +
  scale_y_continuous(breaks = 0.01*seq(-10, 30, 1),
                     labels = percent_format(accuracy = 1)) +
  theme(legend.position = c(0.25, 0.85),
legend.title = element_blank())![]()
2017-
Code
prc_hicp_ctrb %>%
  filter(coicop %in% c("CP045", "CP072", "CP01", "CP111"),
         geo == "EA") %>%
  select(-geo, -unit) %>%
  spread(coicop, values) %>%
  transmute(time,
            `Energy, Transport` = CP045 + CP072,
            `Energy, Transport, Food` = CP045 + CP072 + CP01,
            `Energy, Transport, Food, Catering` = CP045 + CP072 + CP01 + CP111) %>%
  gather(Coicop, values, -time) %>%
  month_to_date %>%
  filter(date >= as.Date("2017-01-01")) %>%
  ggplot + geom_line(aes(x = date, y = values/100, color = Coicop)) +
  theme_minimal() + xlab("") + ylab("Contributions to inflation") +
  scale_x_date(breaks ="1 year",
               labels = date_format("%Y")) +
  scale_y_continuous(breaks = 0.01*seq(-10, 30, 1),
                     labels = percent_format(accuracy = 1)) +
  theme(legend.position = c(0.25, 0.85),
legend.title = element_blank())![]()
2020-
Code
prc_hicp_ctrb %>%
  filter(coicop %in% c("CP045", "CP072", "CP01", "CP111"),
         geo == "EA") %>%
  select(-geo, -unit) %>%
  spread(coicop, values) %>%
  transmute(time,
            `Energy, Transport` = CP045 + CP072,
            `Energy, Transport, Food` = CP045 + CP072 + CP01,
            `Energy, Transport, Food, Catering` = CP045 + CP072 + CP01 + CP111) %>%
  gather(Coicop, values, -time) %>%
  month_to_date %>%
  filter(date >= as.Date("2020-01-01")) %>%
  ggplot + geom_line(aes(x = date, y = values/100, color = Coicop)) +
  theme_minimal() + xlab("") + ylab("Contributions to inflation") +
  scale_x_date(breaks = seq.Date(from = as.Date("2019-10-01"), to = as.Date("2100-10-01"), by = "3 months"),
               labels = date_format("%b %Y")) +
  scale_y_continuous(breaks = 0.01*seq(-10, 30, 1),
                     labels = percent_format(accuracy = 1)) +
  theme(legend.position = c(0.25, 0.85),
        legend.title = element_blank(),
axis.text.x = element_text(angle = 45, vjust = 1, hjust = 1))![]()
New Aggregate
Composition
All
Code
prc_hicp_ctrb %>%
  filter(coicop %in% c("CP045", "CP072", "CP01", "CP11"),
         geo == "EA") %>%
  select(-geo, -unit) %>%

  month_to_date %>%
  ggplot(., aes(x = date, y = values/100)) +
  geom_col(aes(fill = Coicop), alpha = 1) +
  theme_minimal() + xlab("") + ylab("Contributions to inflation") +
  scale_x_date(breaks ="2 years",
               labels = date_format("%Y")) +
  scale_y_continuous(breaks = 0.01*seq(-10, 30, 1),
                     labels = percent_format(accuracy = 1)) +
  theme(legend.position = c(0.25, 0.85),
        legend.title = element_blank())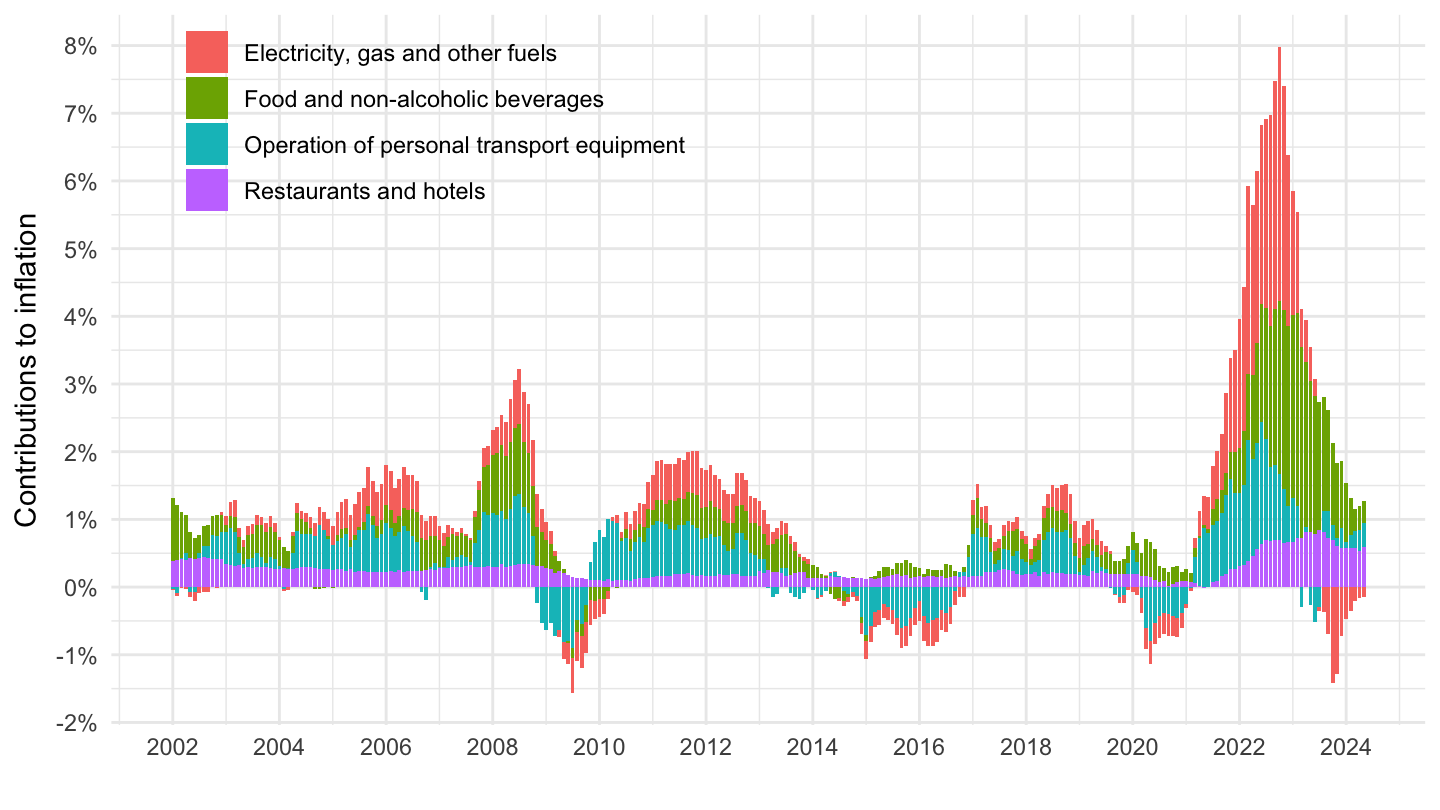
2017-
Code
prc_hicp_ctrb %>%
  filter(coicop %in% c("CP045", "CP072", "CP01", "CP11"),
         geo == "EA") %>%
  select(-geo, -unit) %>%

  month_to_date %>%
  filter(date >= as.Date("2017-01-01")) %>%
  ggplot(., aes(x = date, y = values/100)) +
  geom_col(aes(fill = Coicop), alpha = 1) +
  theme_minimal() + xlab("") + ylab("Contributions to inflation") +
  scale_x_date(breaks ="1 year",
               labels = date_format("%Y")) +
  scale_y_continuous(breaks = 0.01*seq(-10, 30, 1),
                     labels = percent_format(accuracy = 1)) +
  theme(legend.position = c(0.25, 0.85),
        legend.title = element_blank())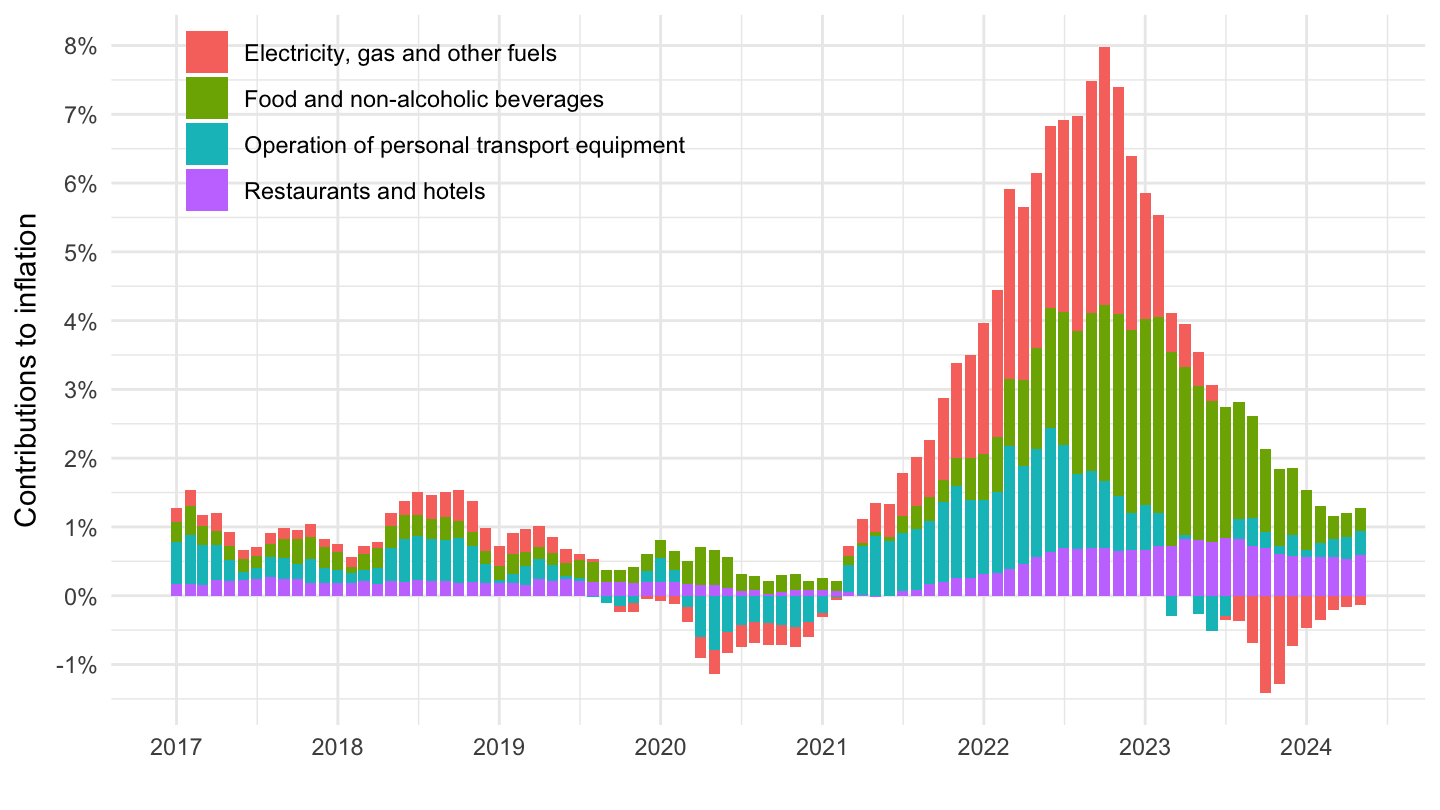
2019-
Code
prc_hicp_ctrb %>%
  filter(coicop %in% c("CP045", "CP072", "CP01", "CP11"),
         geo == "EA") %>%
  select(-geo, -unit) %>%

  month_to_date %>%
  filter(date >= as.Date("2019-01-01")) %>%
  ggplot(., aes(x = date, y = values/100)) +
  geom_col(aes(fill = Coicop), alpha = 1) +
  theme_minimal() + xlab("") + ylab("Contributions to inflation") +
  scale_x_date(breaks ="3 months",
               labels = date_format("%b %Y")) +
  scale_y_continuous(breaks = 0.01*seq(-10, 30, 1),
                     labels = percent_format(accuracy = 1)) +
  theme(legend.position = c(0.25, 0.85),
        legend.title = element_blank(),
        axis.text.x = element_text(angle = 45, vjust = 1, hjust = 1))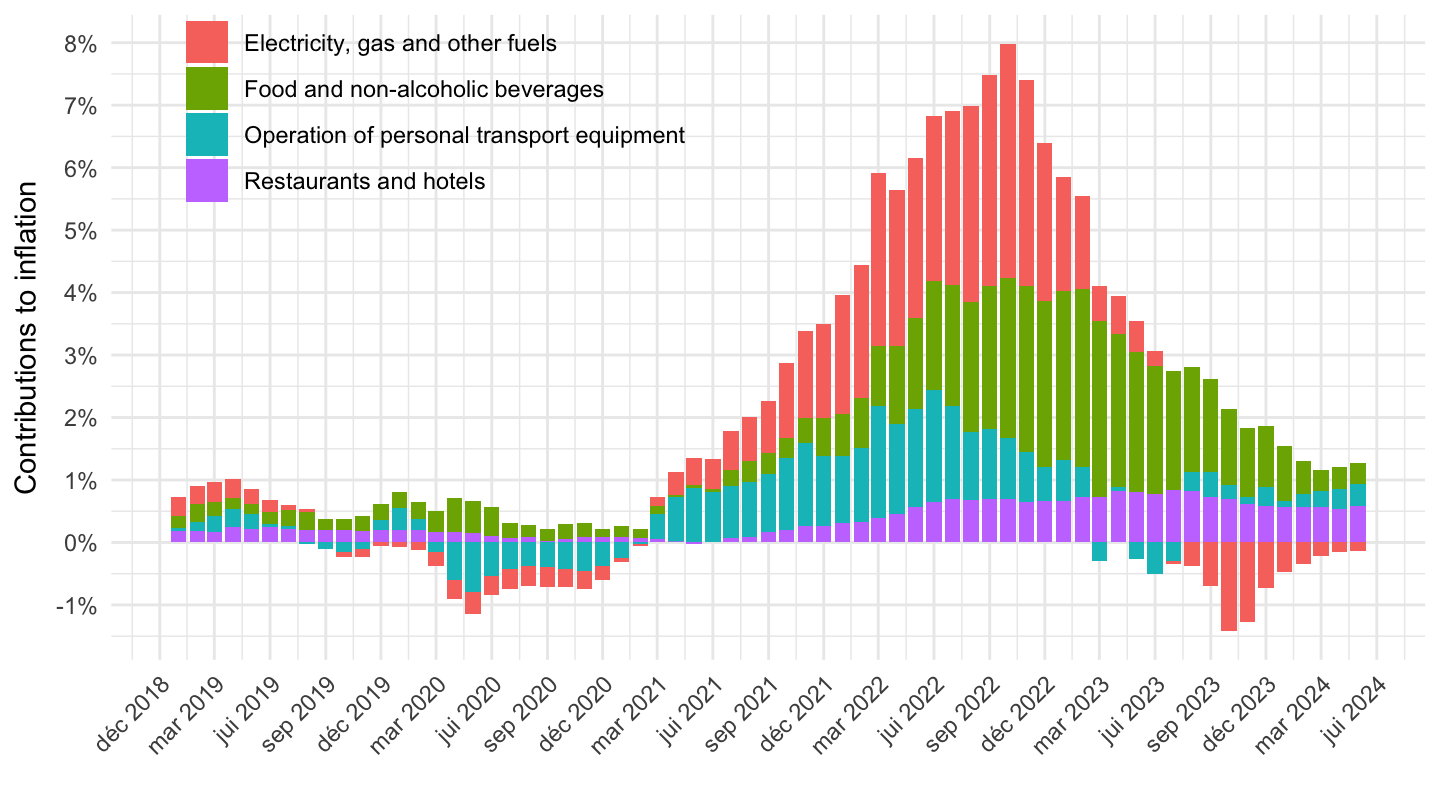
All
Code
prc_hicp_manr %>%
  filter(coicop == "CP00",
         geo == "EA") %>%
  select(-geo, -unit) %>%

  bind_rows(prc_hicp_ctrb_CP045_CP072_CP01_CP111) %>%
  month_to_date %>%
  ggplot + geom_line(aes(x = date, y = values/100, color = Coicop)) +
  theme_minimal() + xlab("") + ylab("Contributions to inflation") +
  scale_x_date(breaks ="2 years",
               labels = date_format("%Y")) +
  scale_y_continuous(breaks = 0.01*seq(-10, 30, 1),
                     labels = percent_format(accuracy = 1)) +
  theme(legend.position = c(0.25, 0.85),
        legend.title = element_blank())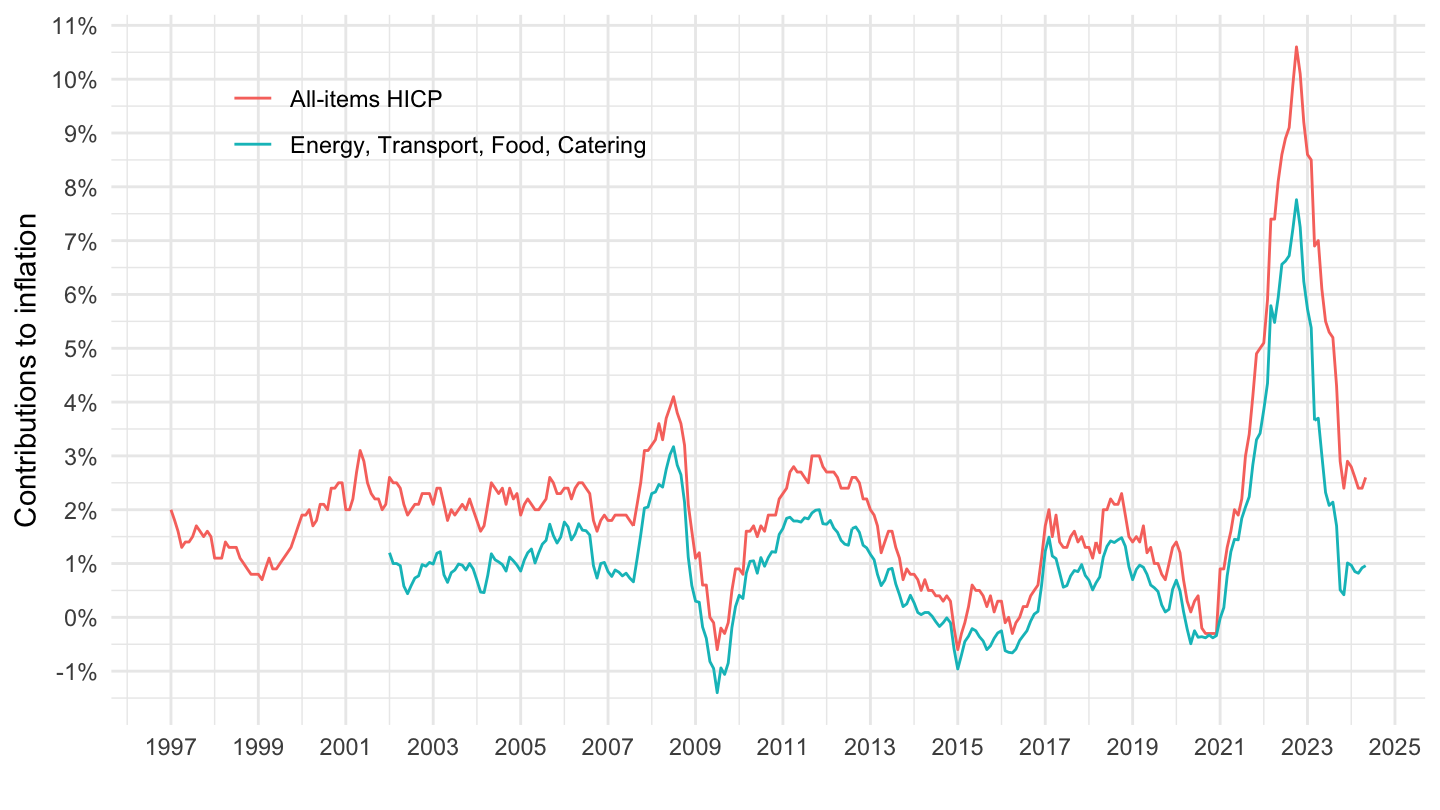
Bars
Code
prc_hicp_manr %>%
  filter(coicop == "CP00",
         geo == "EA") %>%
  select(-geo, -unit) %>%

  bind_rows(prc_hicp_ctrb_CP045_CP072_CP01_CP111) %>%
  select(time, Coicop, values) %>%
  spread(Coicop, values) %>%
  month_to_date %>%
  transmute(date, `Super Core inflation` = `All-items HICP`-`Energy, Transport, Food, Catering`) %>%
  gather(Coicop, values, -date) %>%
  filter(Coicop != "All-items HICP") %>%
  ggplot(., aes(x = date, y = values/100)) +
  geom_col(aes(fill = Coicop), alpha = 1) +
  theme_minimal() + xlab("") + ylab("Contributions to inflation") +
  scale_x_date(breaks ="2 years",
               labels = date_format("%Y")) +
  scale_y_continuous(breaks = 0.01*seq(-10, 30, 1),
                     labels = percent_format(accuracy = 1)) +
  theme(legend.position = c(0.25, 0.85),
        legend.title = element_blank())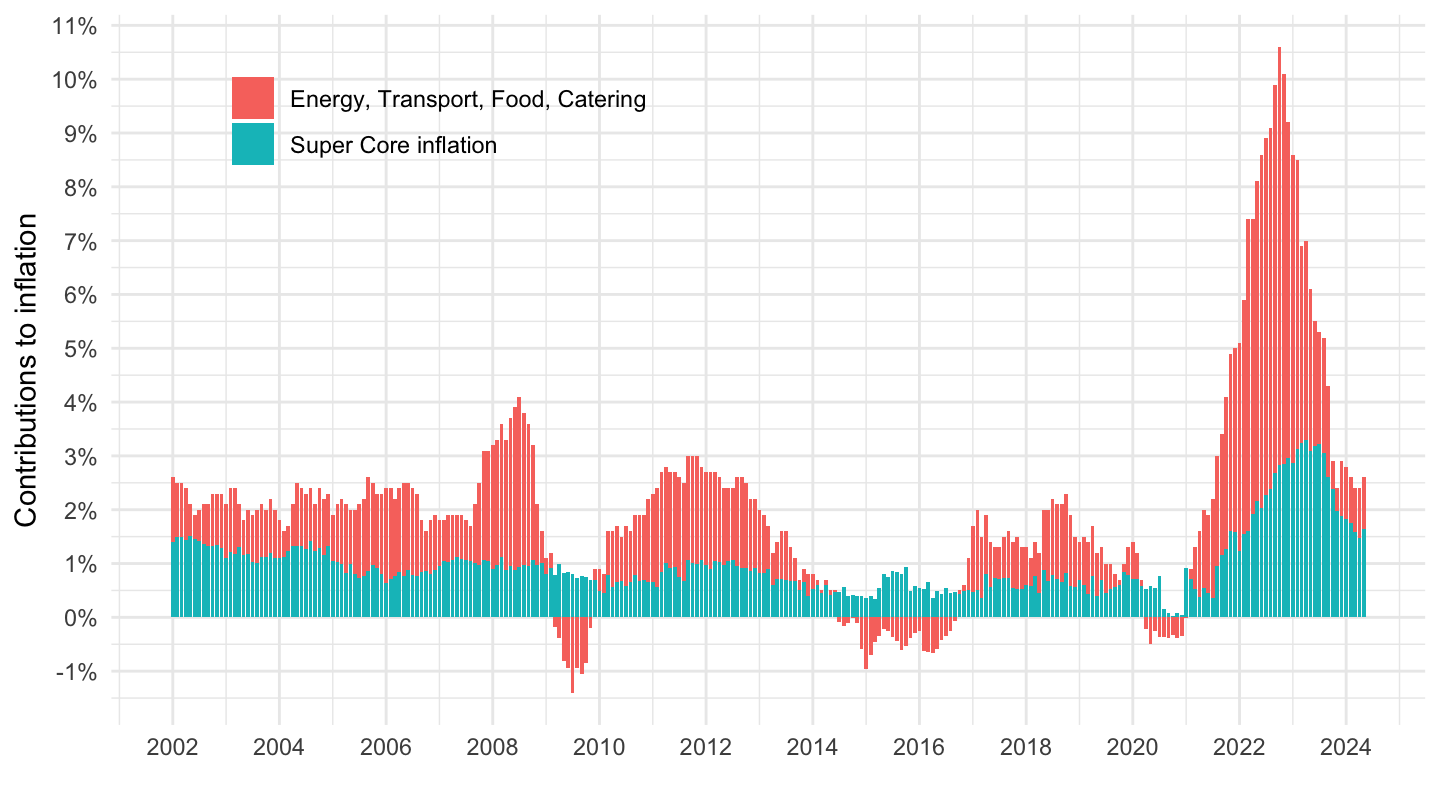
2017-
Code
prc_hicp_manr %>%
  filter(coicop == "CP00",
         geo == "EA") %>%
  select(-geo, -unit) %>%

  bind_rows(prc_hicp_ctrb_CP045_CP072_CP01_CP111) %>%
  month_to_date %>%
  filter(date >= as.Date("2017-01-01")) %>%
  ggplot + geom_line(aes(x = date, y = values/100, color = Coicop)) +
  theme_minimal() + xlab("") + ylab("Contributions to inflation") +
  scale_x_date(breaks ="1 year",
               labels = date_format("%Y")) +
  scale_y_continuous(breaks = 0.01*seq(-10, 30, 1),
                     labels = percent_format(accuracy = 1)) +
  theme(legend.position = c(0.25, 0.85),
        legend.title = element_blank())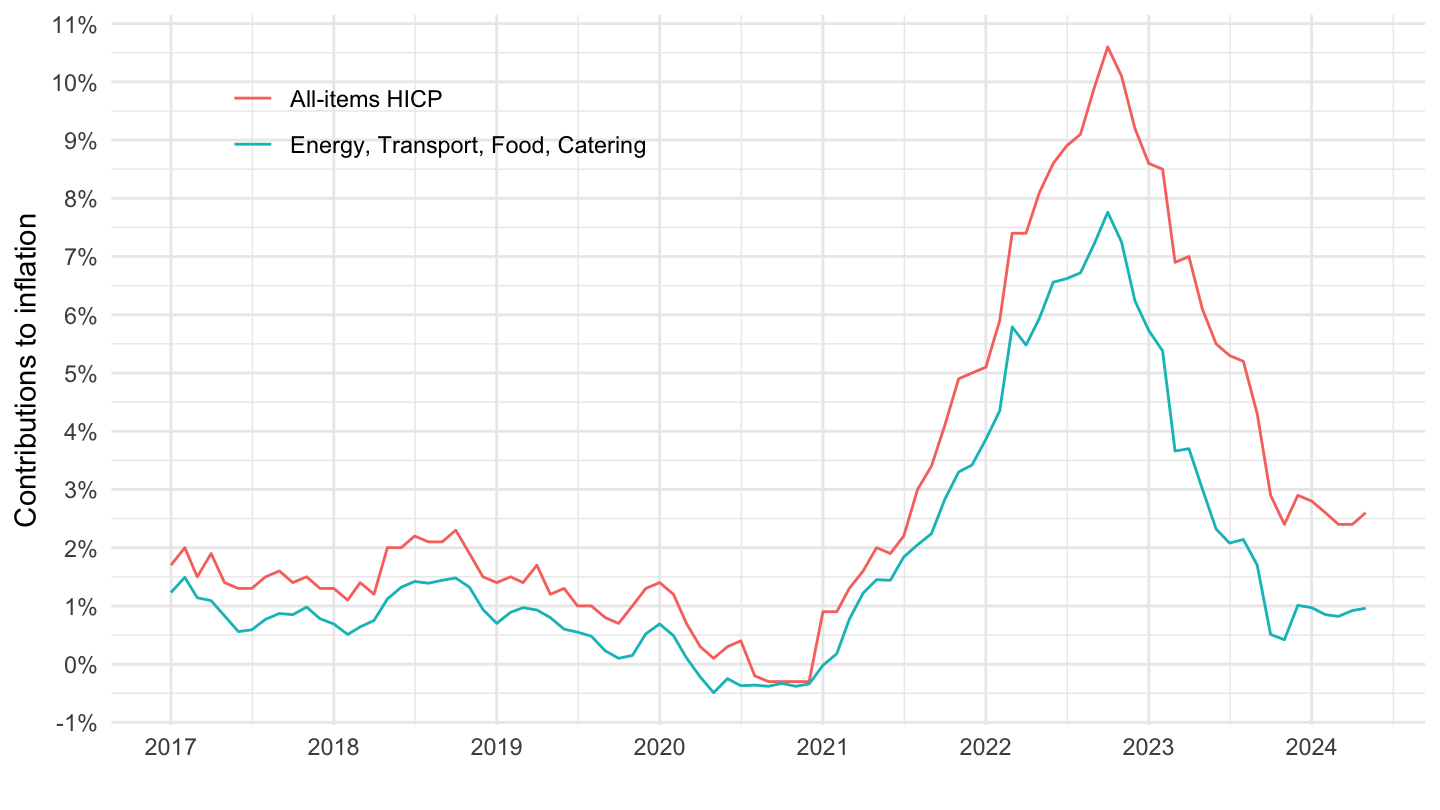
Bars
Code
prc_hicp_manr %>%
  filter(coicop == "CP00",
         geo == "EA") %>%
  select(-geo, -unit) %>%

  bind_rows(prc_hicp_ctrb_CP045_CP072_CP01_CP111) %>%
  select(time, Coicop, values) %>%
  spread(Coicop, values) %>%
  month_to_date %>%
  transmute(date, `Super Core inflation` = `All-items HICP`-`Energy, Transport, Food, Catering`) %>%
  gather(Coicop, values, -date) %>%
  filter(Coicop != "All-items HICP") %>%
  ggplot(., aes(x = date, y = values/100)) +
  geom_col(aes(fill = Coicop), alpha = 1) +
  theme_minimal() + xlab("") + ylab("Contributions to inflation") +
  scale_x_date(breaks ="1 year",
               labels = date_format("%Y")) +
  scale_y_continuous(breaks = 0.01*seq(-10, 30, 1),
                     labels = percent_format(accuracy = 1)) +
  geom_line(aes(x = as.Date("2022-02-24")), linetype = "dashed") +
  theme(legend.position = c(0.25, 0.85),
        legend.title = element_blank())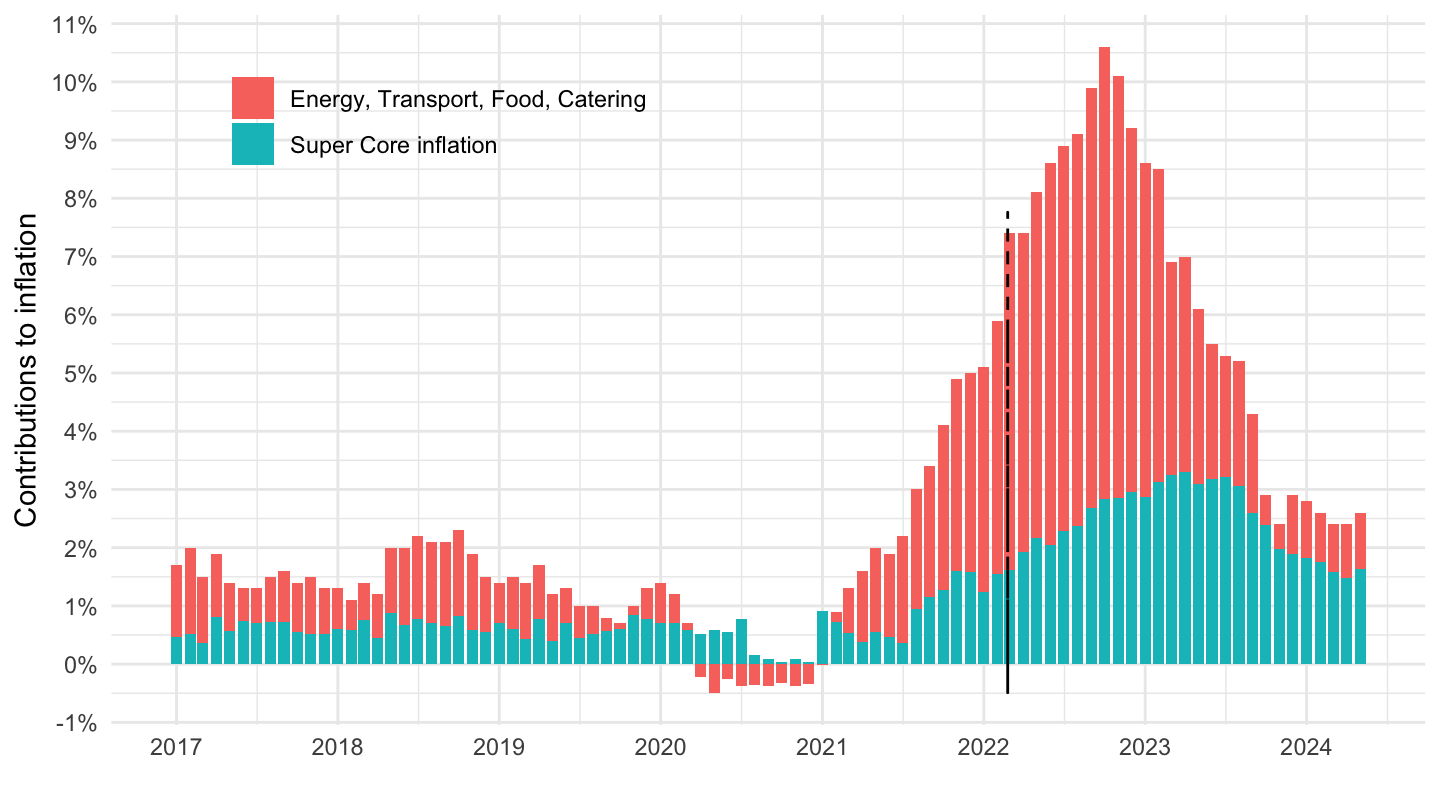
2020-
Lines
Code
prc_hicp_manr %>%
  filter(coicop == "CP00",
         geo == "EA") %>%
  select(-geo, -unit) %>%

  bind_rows(prc_hicp_ctrb_CP045_CP072_CP01_CP111) %>%
  month_to_date %>%
  filter(date >= as.Date("2020-01-01")) %>%
  ggplot + geom_line(aes(x = date, y = values/100, color = Coicop)) +
  theme_minimal() + xlab("") + ylab("Contributions to inflation") +
  scale_x_date(breaks = seq.Date(from = as.Date("2019-10-01"), to = as.Date("2100-10-01"), by = "3 months"),
               labels = date_format("%Y %b")) +
  scale_y_continuous(breaks = 0.01*seq(-10, 30, 1),
                     labels = percent_format(accuracy = 1)) +
  theme(legend.position = c(0.25, 0.85),
        legend.title = element_blank(),
        axis.text.x = element_text(angle = 45, vjust = 1, hjust = 1))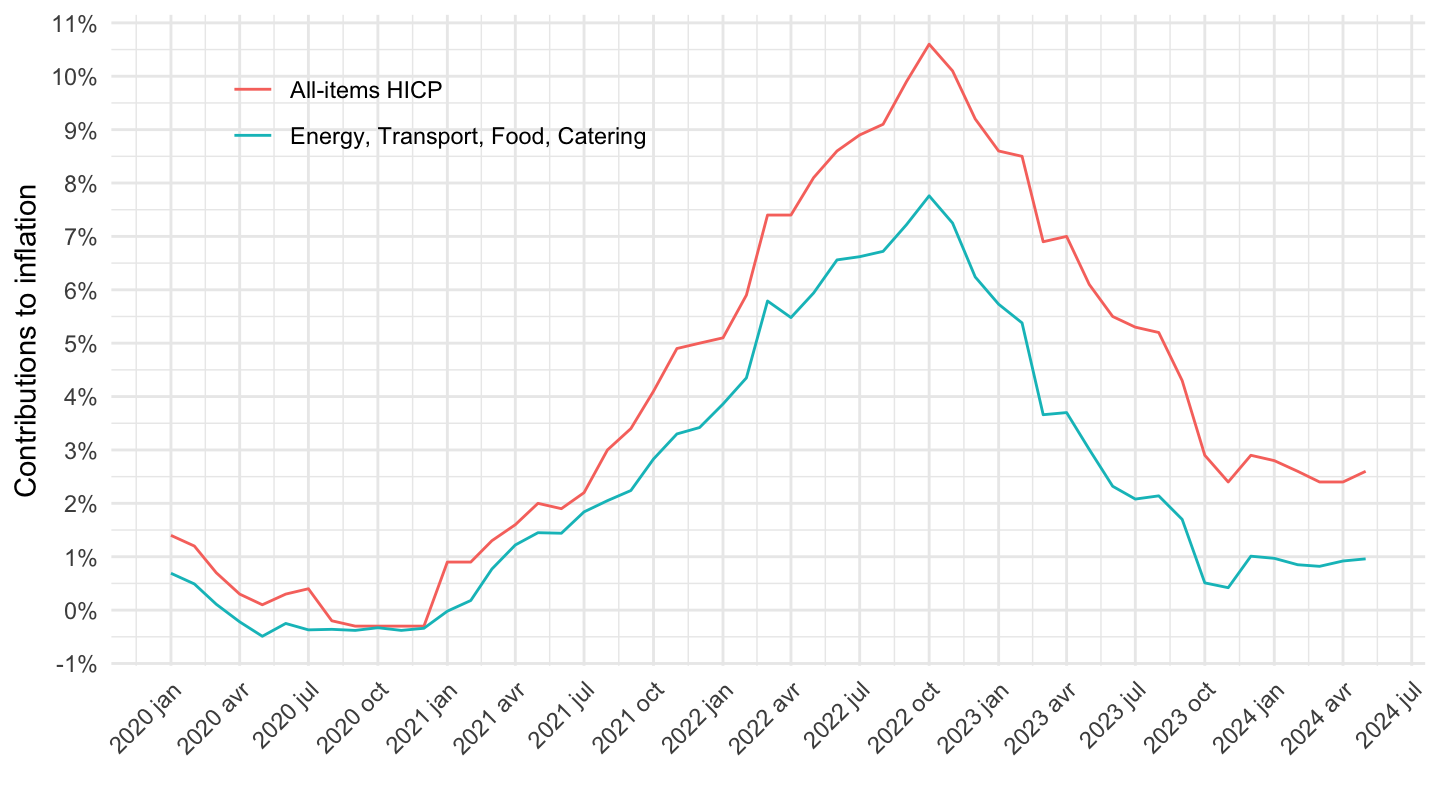
Table
All
Code
prc_hicp_ctrb %>%
  filter(time %in% c("2021M10", "2022M09")) %>%
  select_if(~ n_distinct(.) > 1) %>%
  spread(time, values) %>%

  mutate(difference = `2022M09` - `2021M10`) %>%
  select(coicop, Coicop, everything()) %>%
  arrange(-difference) %>%
  print_table_conditional()
Only CP - 20 first
All
Code
prc_hicp_ctrb %>%
  filter(time %in% c("2021M10", "2022M09"),
         substr(coicop, 1, 2) == "CP") %>%
  select_if(~ n_distinct(.) > 1) %>%
  spread(time, values) %>%

  mutate(difference = `2022M09` - `2021M10`) %>%
  select(coicop, Coicop, everything()) %>%
  arrange(-difference) %>%
  filter(difference > 0.1) %>%
  print_table_conditional()
2-digit
Code
prc_hicp_ctrb %>%
  filter(time %in% c("2021M10", "2022M09"),
         substr(coicop, 1, 2) == "CP",
         nchar(coicop) == 4) %>%
  select_if(~ n_distinct(.) > 1) %>%
  spread(time, values) %>%

  mutate(difference = `2022M09` - `2021M10`) %>%
  select(coicop, Coicop, everything()) %>%
  arrange(-`2022M09`) %>%
  filter(`2022M09` > 0.1) %>%
print_table_conditional() | coicop | Coicop | 2021M10 | 2022M09 | difference |
|---|---|---|---|---|
| CP04 | Housing, water, electricity, gas and other fuels | 1.40 | 3.71 | 2.31 |
| CP01 | Food and non-alcoholic beverages | 0.32 | 2.30 | 1.98 |
| CP07 | Transport | 1.45 | 1.58 | 0.13 |
| CP11 | Restaurants and hotels | 0.20 | 0.70 | 0.50 |
| CP05 | Furnishings, household equipment and routine household maintenance | 0.15 | 0.52 | 0.37 |
| CP09 | Recreation and culture | 0.12 | 0.37 | 0.25 |
| CP12 | Miscellaneous goods and services | 0.20 | 0.33 | 0.13 |
| CP02 | Alcoholic beverages, tobacco and narcotics | 0.11 | 0.18 | 0.07 |
| CP03 | Clothing and footwear | 0.04 | 0.17 | 0.13 |
3-digit
Code
prc_hicp_ctrb %>%
  filter(time %in% c("2021M10", "2022M09"),
         substr(coicop, 1, 2) == "CP",
         nchar(coicop) == 5) %>%
  select_if(~ n_distinct(.) > 1) %>%
  spread(time, values) %>%

  mutate(difference = `2022M09` - `2021M10`) %>%
  select(coicop, Coicop, everything()) %>%
  arrange(-`2022M09`) %>%
  filter(`2022M09` > 0.1) %>%
print_table_conditional() | coicop | Coicop | 2021M10 | 2022M09 | difference |
|---|---|---|---|---|
| CP045 | Electricity, gas and other fuels | 1.19 | 3.37 | 2.18 |
| CP011 | Food | 0.29 | 2.15 | 1.86 |
| CP072 | Operation of personal transport equipment | 1.16 | 1.11 | -0.05 |
| CP111 | Catering services | 0.16 | 0.44 | 0.28 |
| CP071 | Purchase of vehicles | 0.17 | 0.33 | 0.16 |
| CP112 | Accommodation services | 0.04 | 0.25 | 0.21 |
| CP051 | Furniture and furnishings, carpets and other floor coverings | 0.08 | 0.20 | 0.12 |
| CP056 | Goods and services for routine household maintenance | 0.02 | 0.16 | 0.14 |
| CP121 | Personal care | 0.04 | 0.16 | 0.12 |
| CP012 | Non-alcoholic beverages | 0.03 | 0.15 | 0.12 |
| CP031 | Clothing | 0.03 | 0.14 | 0.11 |
| CP041 | Actual rentals for housing | 0.09 | 0.14 | 0.05 |
| CP093 | Other recreational items and equipment, gardens and pets | 0.06 | 0.14 | 0.08 |
| CP043 | Maintenance and repair of the dwelling | 0.06 | 0.13 | 0.07 |
| CP073 | Transport services | 0.12 | 0.13 | 0.01 |
| CP021 | Alcoholic beverages | 0.03 | 0.11 | 0.08 |
4-digit
Code
prc_hicp_ctrb %>%
  filter(time %in% c("2021M10", "2022M09"),
         substr(coicop, 1, 2) == "CP",
         nchar(coicop) == 6) %>%
  select_if(~ n_distinct(.) > 1) %>%
  spread(time, values) %>%

  mutate(difference = `2022M09` - `2021M10`) %>%
  select(coicop, Coicop, everything()) %>%
  arrange(-`2022M09`) %>%
  filter(`2022M09` > 0.1) %>%
print_table_conditional()| coicop | Coicop | 2021M10 | 2022M09 | difference |
|---|---|---|---|---|
| CP0452 | Gas | 0.44 | 1.45 | 1.01 |
| CP0451 | Electricity | 0.43 | 1.15 | 0.72 |
| CP0722 | Fuels and lubricants for personal transport equipment | 1.02 | 0.82 | -0.20 |
| CP0453 | Liquid fuels | 0.29 | 0.54 | 0.25 |
| CP0112 | Meat | 0.07 | 0.50 | 0.43 |
| CP0114 | Milk, cheese and eggs | 0.05 | 0.44 | 0.39 |
| CP0111 | Bread and cereals | 0.06 | 0.42 | 0.36 |
| CP1111 | Restaurants, cafés and the like | 0.14 | 0.42 | 0.28 |
| CP0711 | Motor cars | 0.15 | 0.31 | 0.16 |
| CP0117 | Vegetables | 0.02 | 0.25 | 0.23 |
| CP0511 | Furniture and furnishings | 0.08 | 0.18 | 0.10 |
| CP0723 | Maintenance and repair of personal transport equipment | 0.08 | 0.16 | 0.08 |
| CP0115 | Oils and fats | 0.04 | 0.14 | 0.10 |
| CP0455 | Heat energy | 0.03 | 0.14 | 0.11 |
| CP0113 | Fish and seafood | 0.03 | 0.13 | 0.10 |
| CP0411 | Actual rentals paid by tenants | 0.08 | 0.13 | 0.05 |
| CP0312 | Garments | 0.03 | 0.12 | 0.09 |
| CP0561 | Non-durable household goods | 0.01 | 0.12 | 0.11 |
| CP0733 | Passenger transport by air | 0.08 | 0.12 | 0.04 |
| CP1213 | Other appliances, articles and products for personal care | 0.02 | 0.11 | 0.09 |
5-digit
Code
prc_hicp_ctrb %>%
  filter(time %in% c("2021M10", "2022M09"),
         substr(coicop, 1, 2) == "CP",
         nchar(coicop) == 7) %>%
  select_if(~ n_distinct(.) > 1) %>%
  spread(time, values) %>%

  mutate(difference = `2022M09` - `2021M10`) %>%
  select(coicop, Coicop, everything()) %>%
  arrange(-`2022M09`) %>%
  filter(`2022M09` > 0.1) %>%
print_table_conditional() | coicop | Coicop | 2021M10 | 2022M09 | difference |
|---|---|---|---|---|
| CP04521 | Natural gas and town gas | 0.41 | 1.42 | 1.01 |
| CP07221 | Diesel | 0.46 | 0.50 | 0.04 |
| CP07222 | Petrol | 0.54 | 0.29 | -0.25 |
| CP11111 | Restaurants, cafés and dancing establishments | 0.09 | 0.28 | 0.19 |
| CP11201 | Hotels, motels, inns and similar accommodation services | 0.04 | 0.24 | 0.20 |
| CP01145 | Cheese and curd | 0.02 | 0.19 | 0.17 |
| CP07111 | New motor cars | 0.11 | 0.17 | 0.06 |
| CP01113 | Bread | 0.03 | 0.16 | 0.13 |
| CP05111 | Household furniture | 0.07 | 0.16 | 0.09 |
| CP01171 | Fresh or chilled vegetables other than potatoes and other tubers | -0.01 | 0.15 | 0.16 |
| CP01127 | Dried, salted or smoked meat | 0.02 | 0.14 | 0.12 |
| CP07112 | Second-hand motor cars | 0.04 | 0.14 | 0.10 |
| CP11112 | Fast food and take away food services | 0.05 | 0.14 | 0.09 |
| CP01114 | Other bakery products | 0.01 | 0.12 | 0.11 |
| CP01124 | Poultry | 0.02 | 0.12 | 0.10 |
| CP07332 | International flights | 0.08 | 0.11 | 0.03 |
| CP12132 | Articles for personal hygiene and wellness, esoteric products and beauty products | 0.02 | 0.11 | 0.09 |
Main components since
Energy Bills - “AP_NRG”, “NRG”, “CP045”, “CP0722”
All
Code
prc_hicp_ctrb %>%
  filter(coicop %in% c("NRG", "CP045", "CP0722")) %>%
  month_to_date %>%

  ggplot + geom_line(aes(x = date, y = values/100, color = Coicop)) +
  theme_minimal() + xlab("") + ylab("Contributions to inflation") +
  scale_x_date(breaks ="2 years",
               labels = date_format("%Y")) +
  scale_y_continuous(breaks = 0.01*seq(-10, 30, 0.5),
                     labels = percent_format(accuracy = .1)) +
  #
  theme(legend.position = c(0.3, 0.9),
        legend.title = element_blank())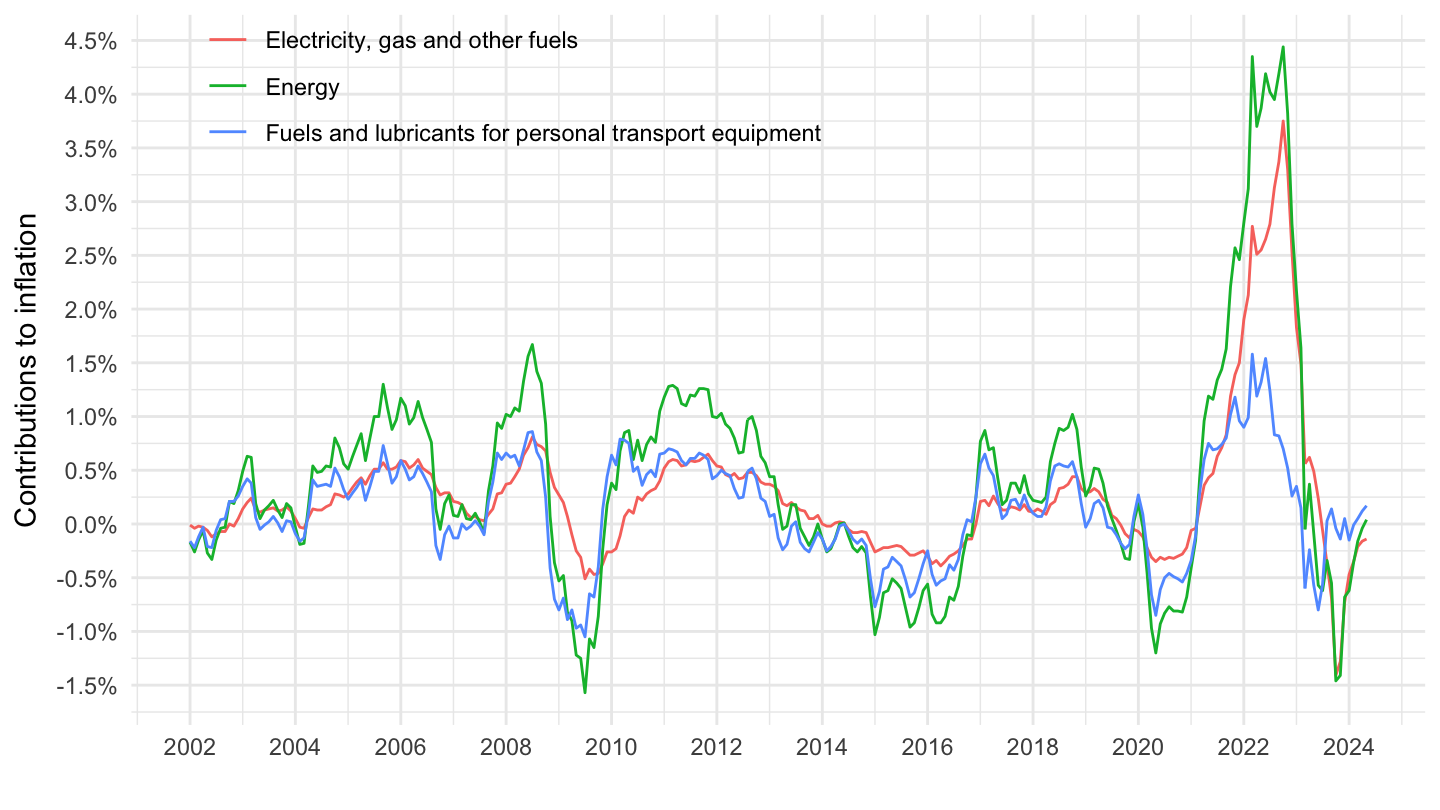
2017-
Code
prc_hicp_ctrb %>%
  filter(coicop %in% c("AP_NRG", "NRG", "CP045", "CP0722")) %>%
  month_to_date %>%

  filter(date >= as.Date("2017-01-01")) %>%
  ggplot + geom_line(aes(x = date, y = values/100, color = Coicop)) +
  theme_minimal() + xlab("") + ylab("Contributions to inflation") +
  scale_x_date(breaks ="1 year",
               labels = date_format("%Y")) +
  scale_y_continuous(breaks = 0.01*seq(-10, 30, 0.5),
                     labels = percent_format(accuracy = .1)) +
  #
  theme(legend.position = c(0.3, 0.9),
        legend.title = element_blank())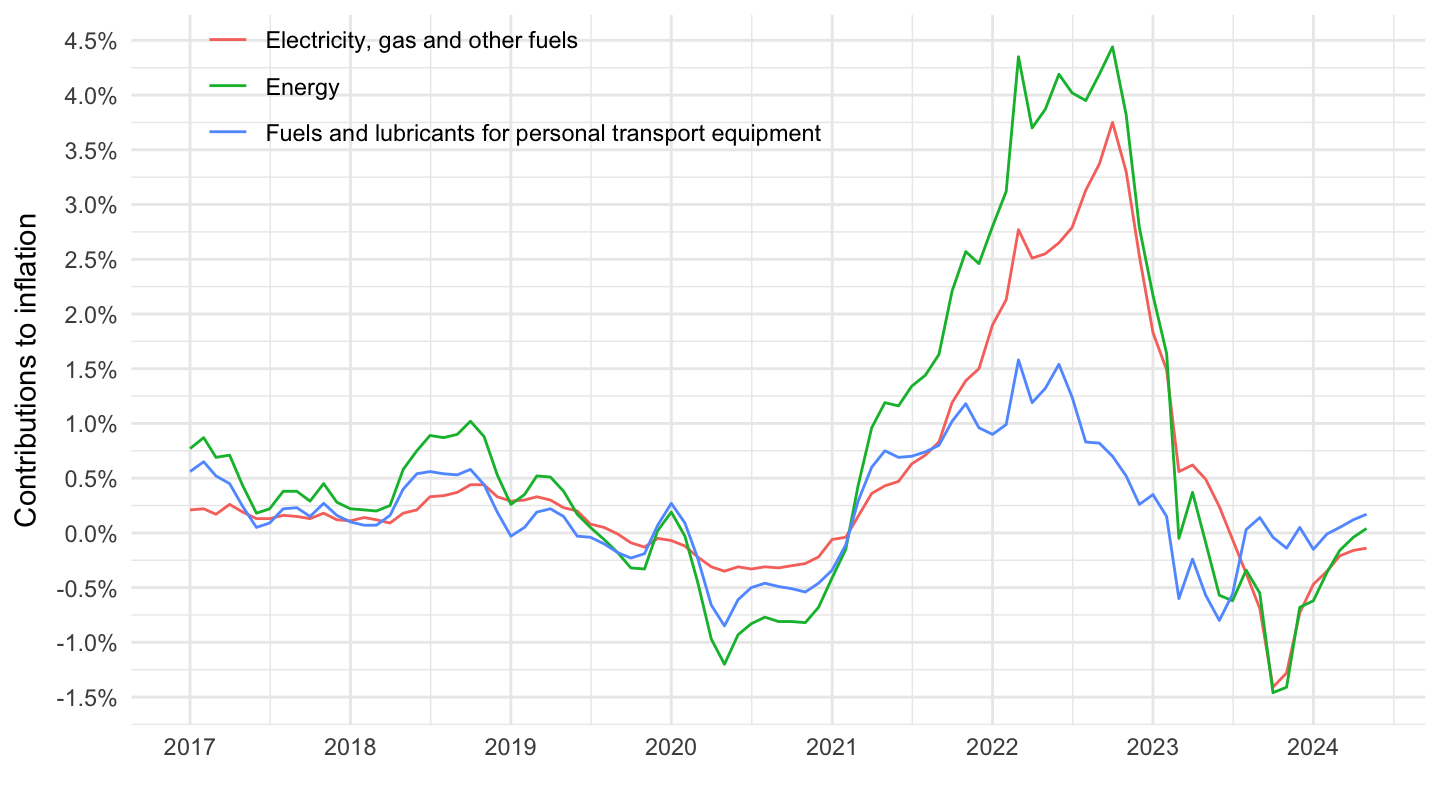
2020-
Code
prc_hicp_ctrb %>%
  filter(coicop %in% c("AP_NRG", "NRG", "CP045", "CP0722")) %>%
  month_to_date %>%

  filter(date >= as.Date("2020-01-01")) %>%
  ggplot + geom_line(aes(x = date, y = values/100, color = Coicop)) +
  theme_minimal() + xlab("") + ylab("Contributions to inflation") +
  scale_x_date(breaks = seq.Date(from = as.Date("2019-10-01"), to = as.Date("2100-10-01"), by = "6 months"),
               labels = date_format("%Y %b")) +
  scale_y_continuous(breaks = 0.01*seq(-10, 30, 0.5),
                     labels = percent_format(accuracy = .1)) +
  #
  theme(legend.position = c(0.3, 0.9),
        legend.title = element_blank())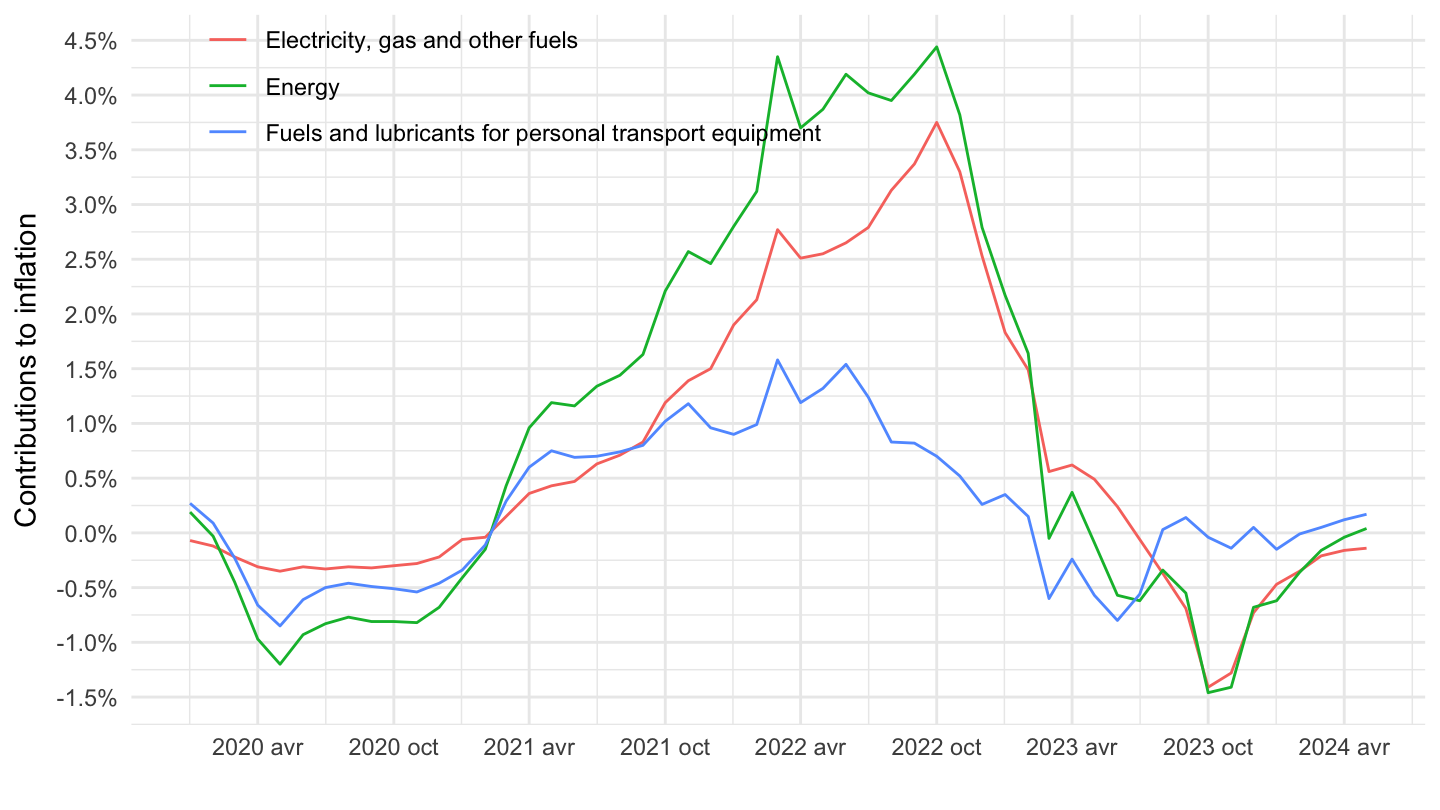
Main
CP01, CP02, CP03
All
Code
prc_hicp_ctrb %>%
  filter(coicop %in% c("CP01", "CP02", "CP03")) %>%
  month_to_date %>%

  ggplot + geom_line(aes(x = date, y = values/100, color = Coicop)) +
  theme_minimal() + xlab("") + ylab("Contributions to inflation") +
  scale_x_date(breaks ="1 year",
               labels = date_format("%Y")) +
  scale_y_continuous(breaks = 0.01*seq(-10, 30, 0.1),
                     labels = percent_format(accuracy = .1)) +

  theme(legend.position = c(0.3, 0.9),
        legend.title = element_blank())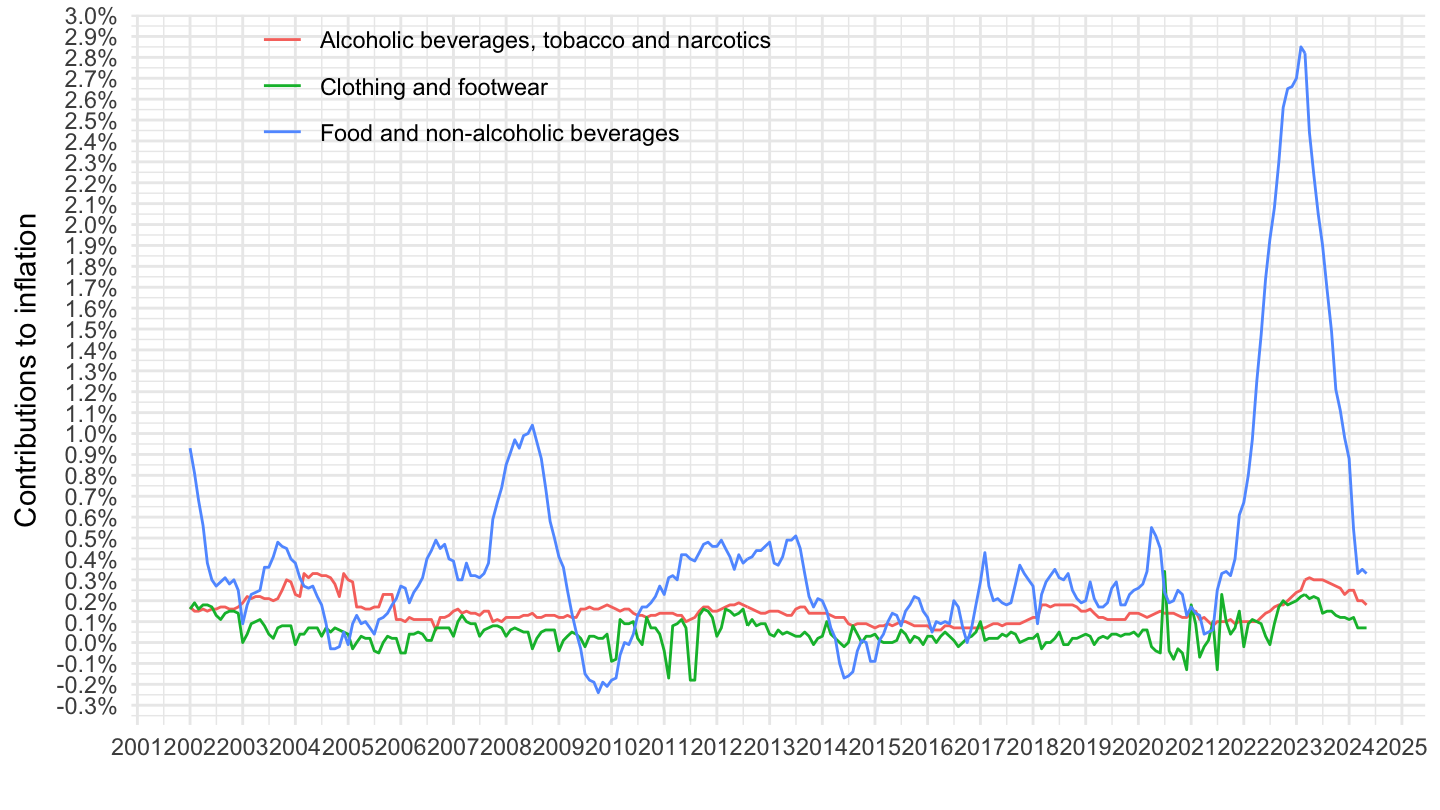
2017-
Code
prc_hicp_ctrb %>%
  filter(coicop %in% c("CP01", "CP02", "CP03")) %>%
  month_to_date %>%

  filter(date >= as.Date("2017-01-01")) %>%
  ggplot + geom_line(aes(x = date, y = values/100, color = Coicop)) +
  theme_minimal() + xlab("") + ylab("Contributions to inflation") +
  scale_x_date(breaks ="1 year",
               labels = date_format("%Y")) +
  scale_y_continuous(breaks = 0.01*seq(-10, 30, 0.1),
                     labels = percent_format(accuracy = .1)) +

  theme(legend.position = c(0.3, 0.9),
        legend.title = element_blank())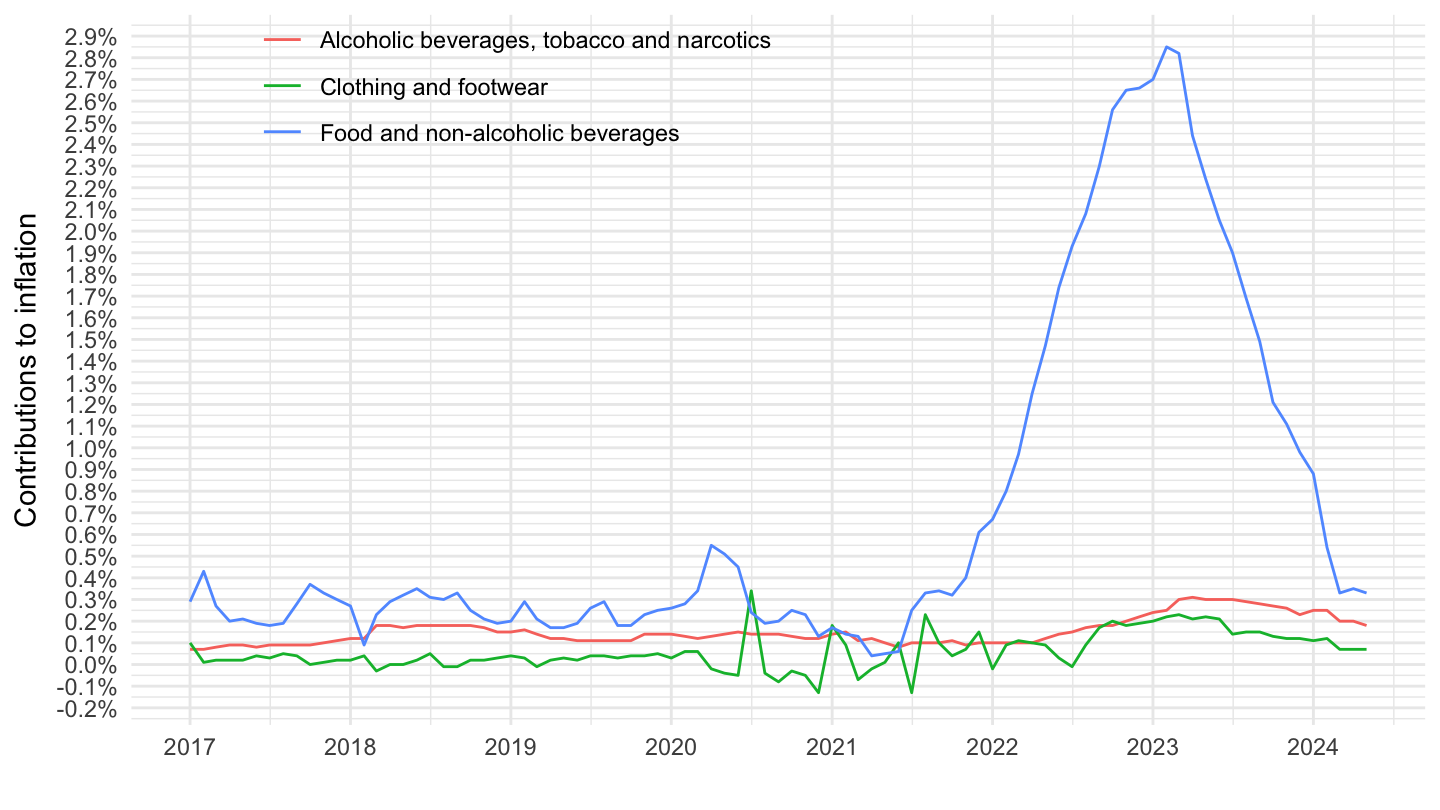
2020-
Code
prc_hicp_ctrb %>%
  filter(coicop %in% c("CP01", "CP02", "CP03")) %>%
  month_to_date %>%

  filter(date >= as.Date("2020-01-01")) %>%
  ggplot + geom_line(aes(x = date, y = values/100, color = Coicop)) +
  theme_minimal() + xlab("") + ylab("Contributions to inflation") +
  scale_x_date(breaks = seq.Date(from = as.Date("2019-10-01"), to = as.Date("2100-10-01"), by = "6 months"),
               labels = date_format("%Y %b")) +
  scale_y_continuous(breaks = 0.01*seq(-10, 30, 0.1),
                     labels = percent_format(accuracy = .1)) +

  theme(legend.position = c(0.3, 0.9),
        legend.title = element_blank())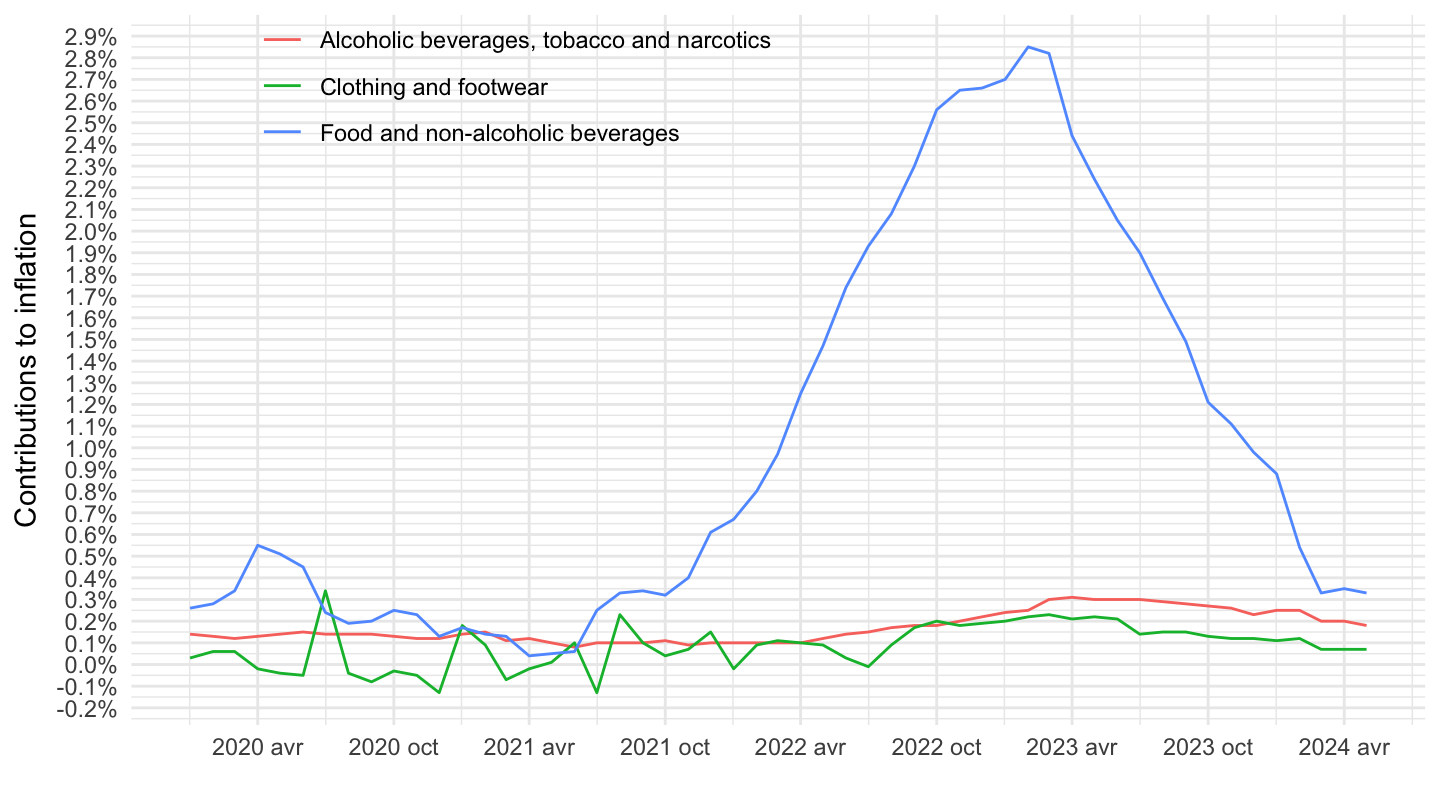
CP04, CP05, CP06
All
Code
prc_hicp_ctrb %>%
  filter(coicop %in% c("CP04", "CP05", "CP06")) %>%
  month_to_date %>%

  ggplot + geom_line(aes(x = date, y = values/100, color = Coicop)) +
  theme_minimal() + xlab("") + ylab("Contributions to inflation") +
  scale_x_date(breaks ="1 year",
               labels = date_format("%Y")) +
  scale_y_continuous(breaks = 0.01*seq(-10, 30, 0.1),
                     labels = percent_format(accuracy = .1)) +

  theme(legend.position = c(0.4, 0.9),
        legend.title = element_blank())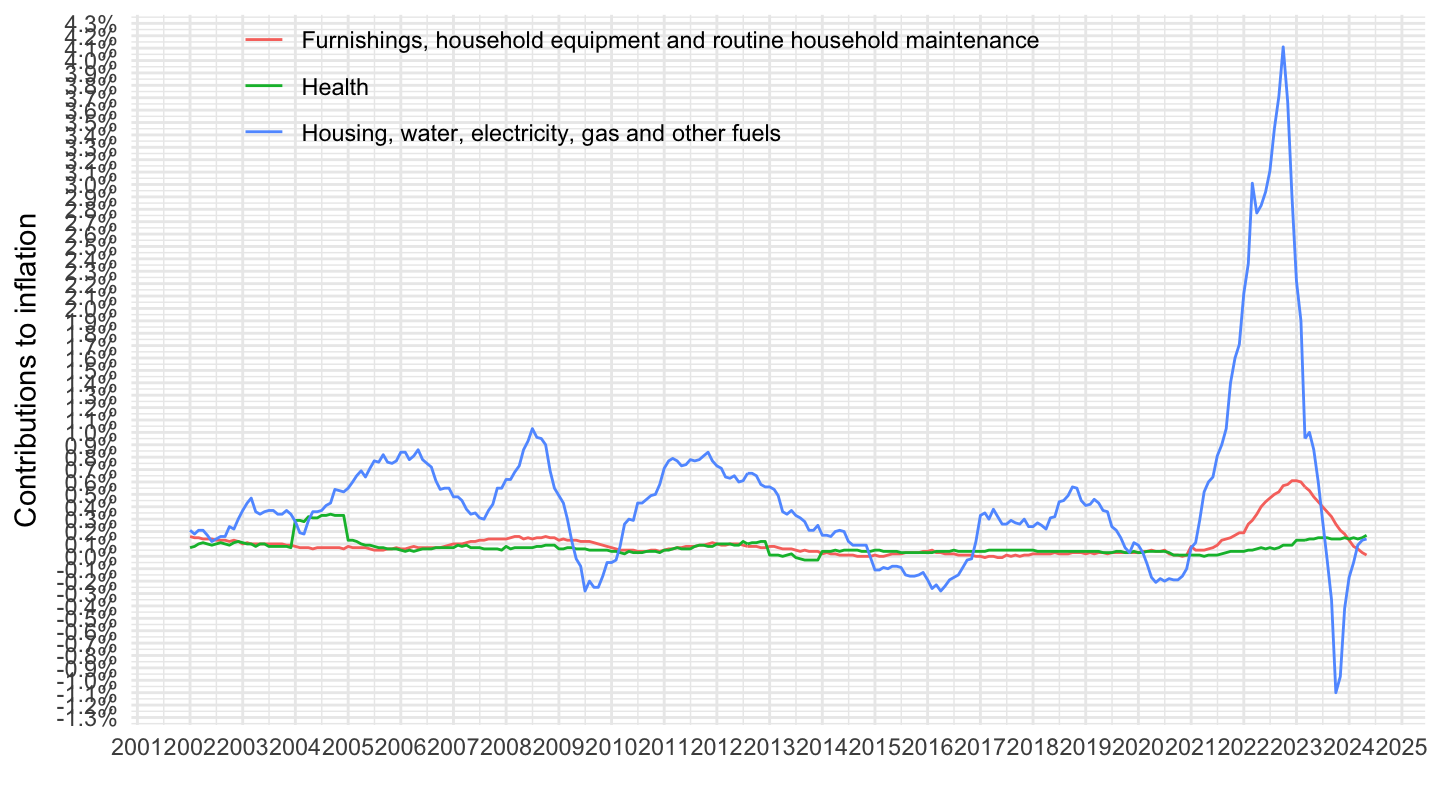
2017-
Code
prc_hicp_ctrb %>%
  filter(coicop %in% c("CP04", "CP05", "CP06")) %>%
  month_to_date %>%

  filter(date >= as.Date("2017-01-01")) %>%
  ggplot + geom_line(aes(x = date, y = values/100, color = Coicop)) +
  theme_minimal() + xlab("") + ylab("Contributions to inflation") +
  scale_x_date(breaks ="1 year",
               labels = date_format("%Y")) +
  scale_y_continuous(breaks = 0.01*seq(-10, 30, 0.1),
                     labels = percent_format(accuracy = .1)) +

  theme(legend.position = c(0.4, 0.9),
        legend.title = element_blank())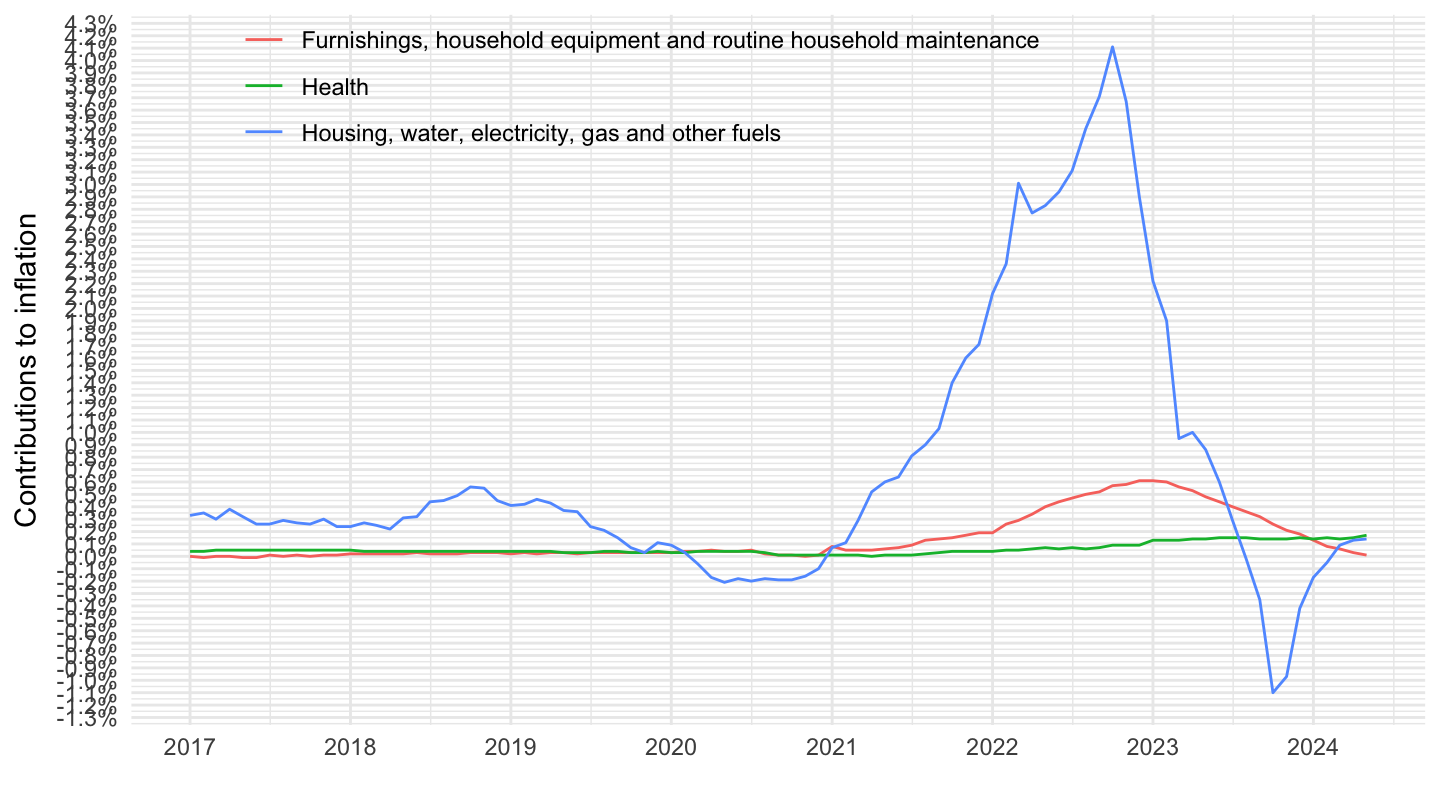
2020-
Code
prc_hicp_ctrb %>%
  filter(coicop %in% c("CP04", "CP05", "CP06")) %>%
  month_to_date %>%

  filter(date >= as.Date("2020-10-01")) %>%
  ggplot + geom_line(aes(x = date, y = values/100, color = Coicop)) +
  theme_minimal() + xlab("") + ylab("Contributions to inflation") +
  scale_x_date(breaks = seq.Date(from = as.Date("2019-10-01"), to = as.Date("2100-10-01"), by = "6 months"),
               labels = date_format("%Y %b")) +
  scale_y_continuous(breaks = 0.01*seq(-10, 30, 0.2),
                     labels = percent_format(accuracy = .1)) +

  theme(legend.position = c(0.3, 0.9),
        legend.title = element_blank())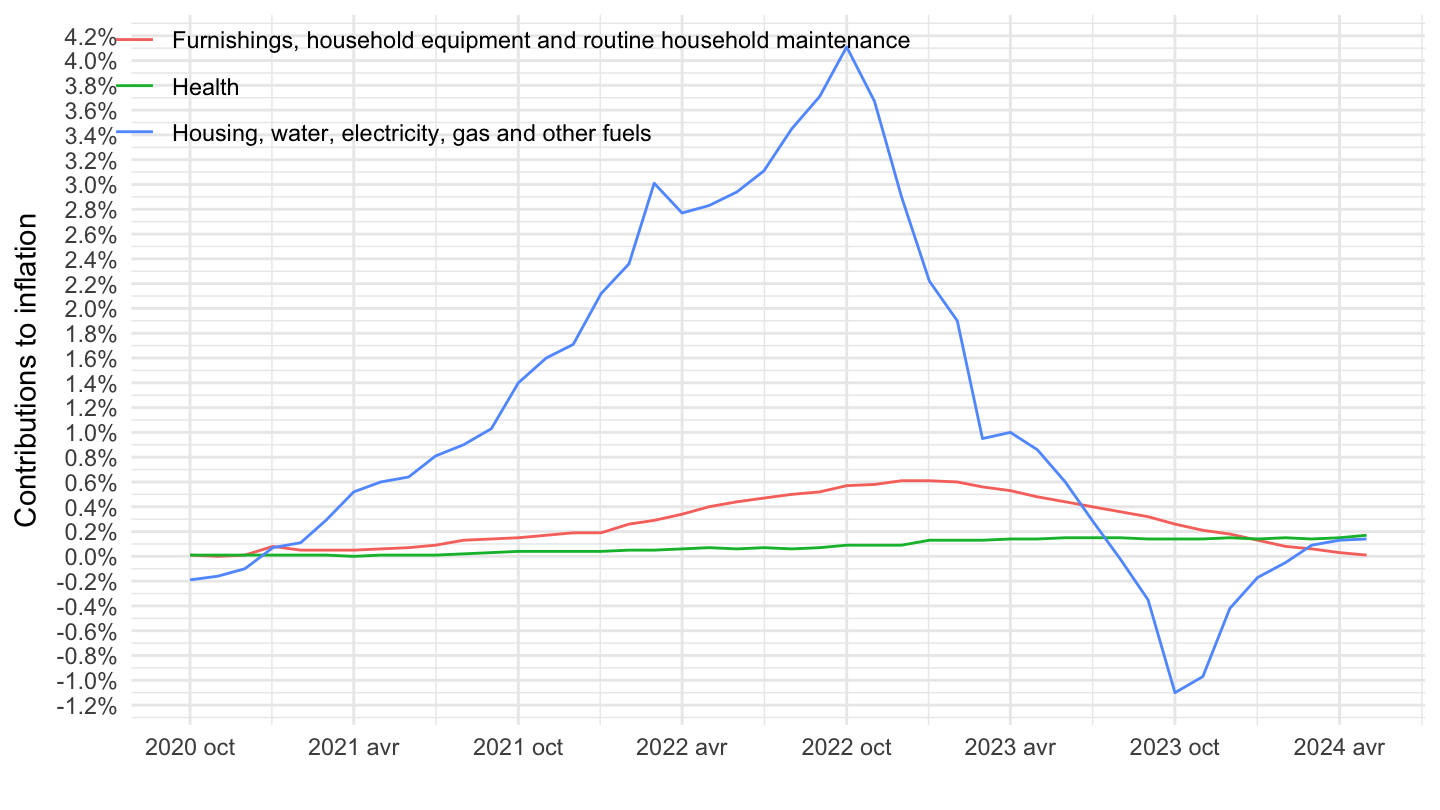
CP07, CP08, CP09
All
Code
prc_hicp_ctrb %>%
  filter(coicop %in% c("CP07", "CP08", "CP09")) %>%
  month_to_date %>%

  ggplot + geom_line(aes(x = date, y = values/100, color = Coicop)) +
  theme_minimal() + xlab("") + ylab("Contributions to inflation") +
  scale_x_date(breaks ="1 year",
               labels = date_format("%Y")) +
  scale_y_continuous(breaks = 0.01*seq(-10, 30, 0.1),
                     labels = percent_format(accuracy = .1)) +

  theme(legend.position = c(0.4, 0.9),
        legend.title = element_blank())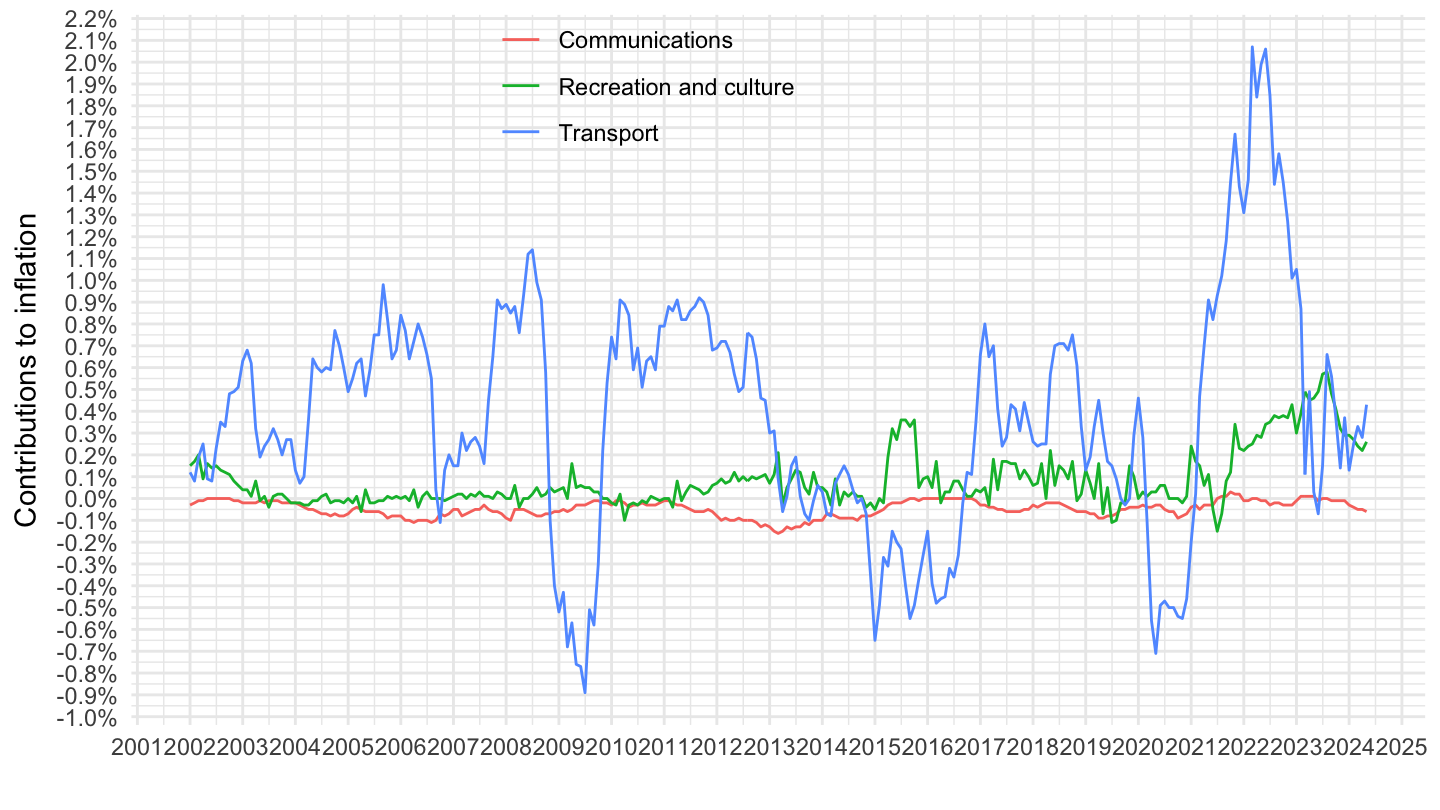
2017-
Code
prc_hicp_ctrb %>%
  filter(coicop %in% c("CP07", "CP08", "CP09")) %>%
  month_to_date %>%

  filter(date >= as.Date("2017-01-01")) %>%
  ggplot + geom_line(aes(x = date, y = values/100, color = Coicop)) +
  theme_minimal() + xlab("") + ylab("Contributions to inflation") +
  scale_x_date(breaks ="1 year",
               labels = date_format("%Y")) +
  scale_y_continuous(breaks = 0.01*seq(-10, 30, 0.1),
                     labels = percent_format(accuracy = .1)) +

  theme(legend.position = c(0.4, 0.9),
        legend.title = element_blank())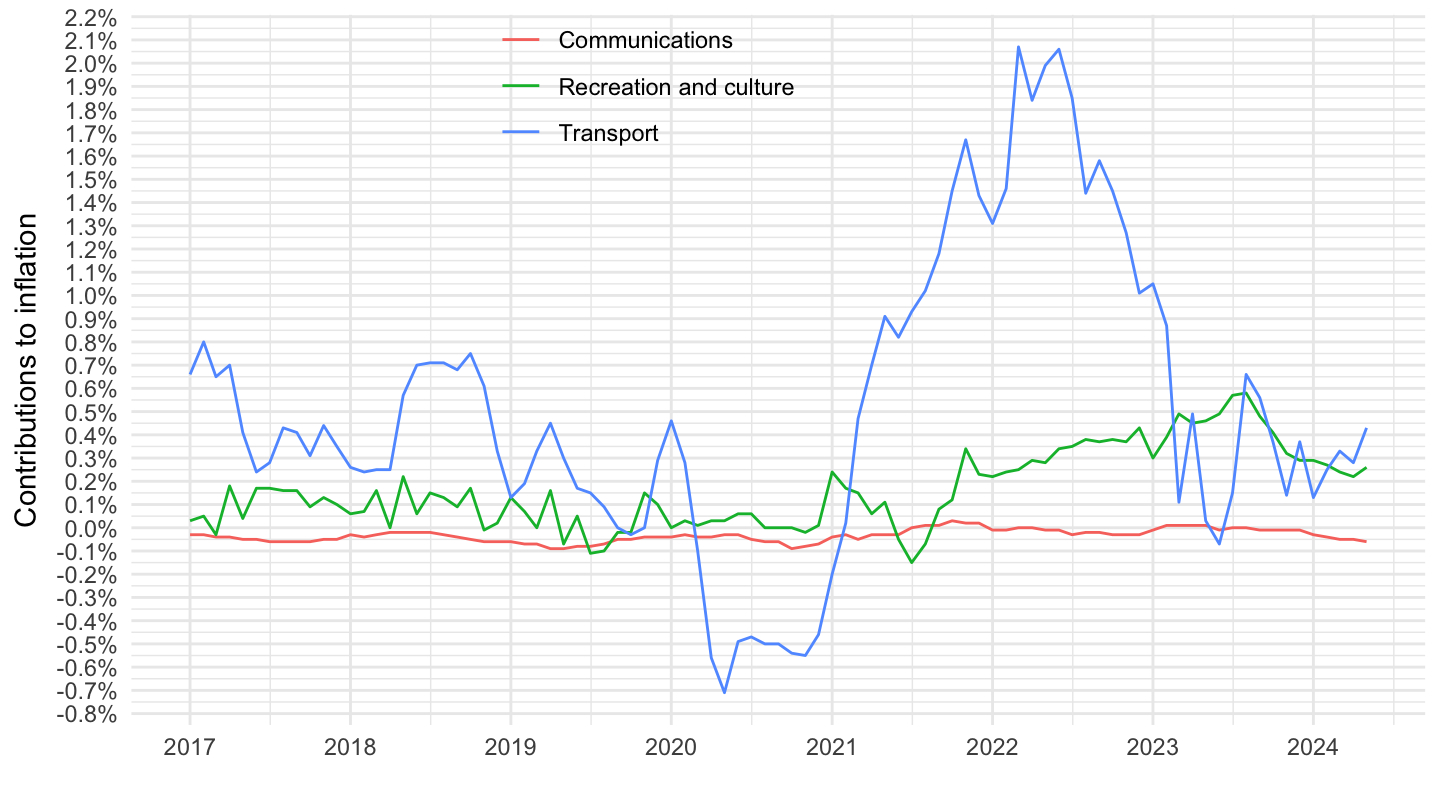
CP10, CP11, CP12
All
Code
prc_hicp_ctrb %>%
  filter(coicop %in% c("CP10", "CP11", "CP12")) %>%
  month_to_date %>%

  ggplot + geom_line(aes(x = date, y = values/100, color = paste(coicop, Coicop))) +
  theme_minimal() + xlab("") + ylab("Contributions to inflation") +
  scale_x_date(breaks ="2 years",
               labels = date_format("%Y")) +
  scale_y_continuous(breaks = 0.01*seq(-10, 30, 0.1),
                     labels = percent_format(accuracy = .1)) +

  theme(legend.position = c(0.4, 0.9),
        legend.title = element_blank())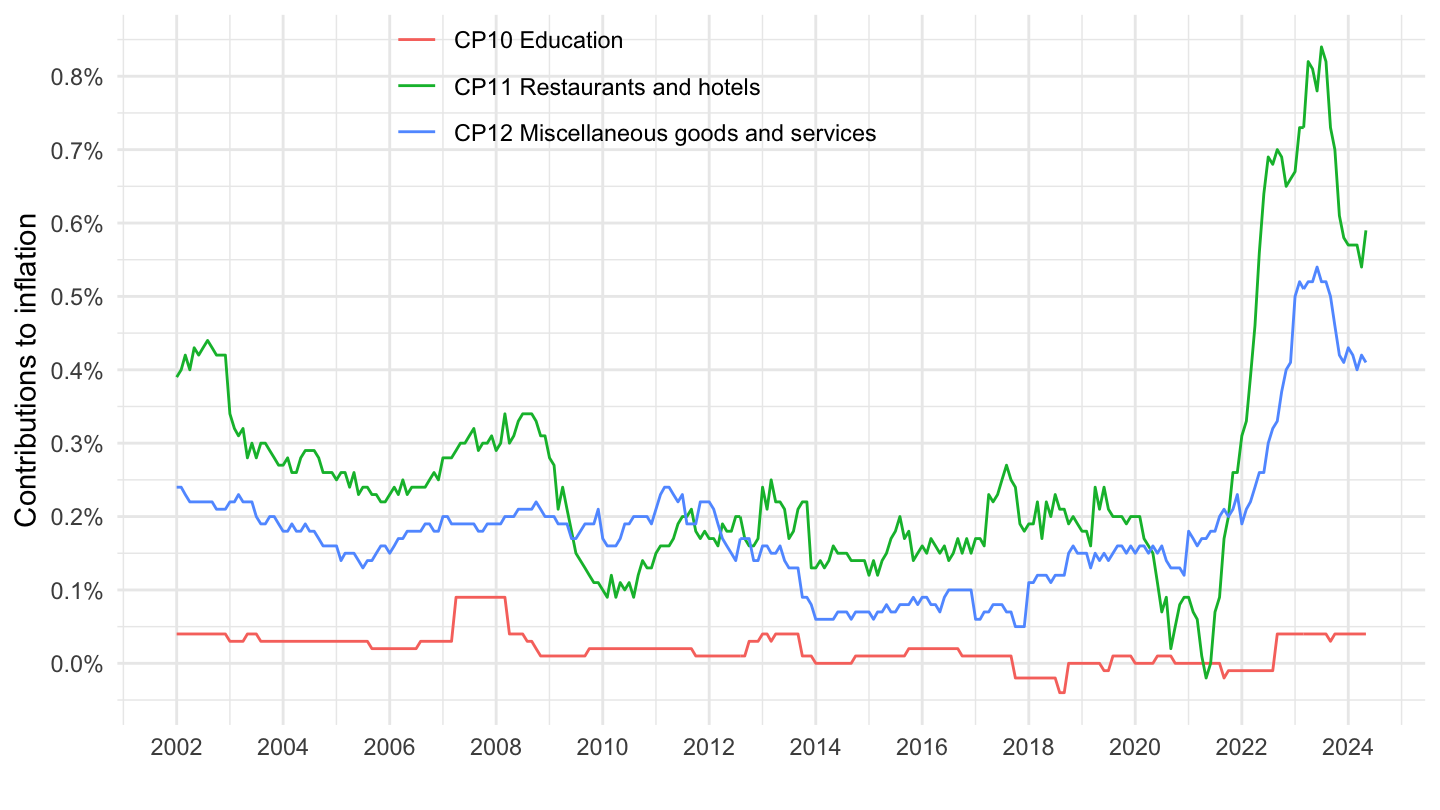
2017-
Code
prc_hicp_ctrb %>%
  filter(coicop %in% c("CP10", "CP11", "CP12")) %>%
  month_to_date %>%

  filter(date >= as.Date("2017-01-01")) %>%
  ggplot + geom_line(aes(x = date, y = values/100, color = Coicop)) +
  theme_minimal() + xlab("") + ylab("Contributions to inflation") +
  scale_x_date(breaks ="1 year",
               labels = date_format("%Y")) +
  scale_y_continuous(breaks = 0.01*seq(-10, 30, 0.1),
                     labels = percent_format(accuracy = .1)) +

  theme(legend.position = c(0.4, 0.9),
        legend.title = element_blank())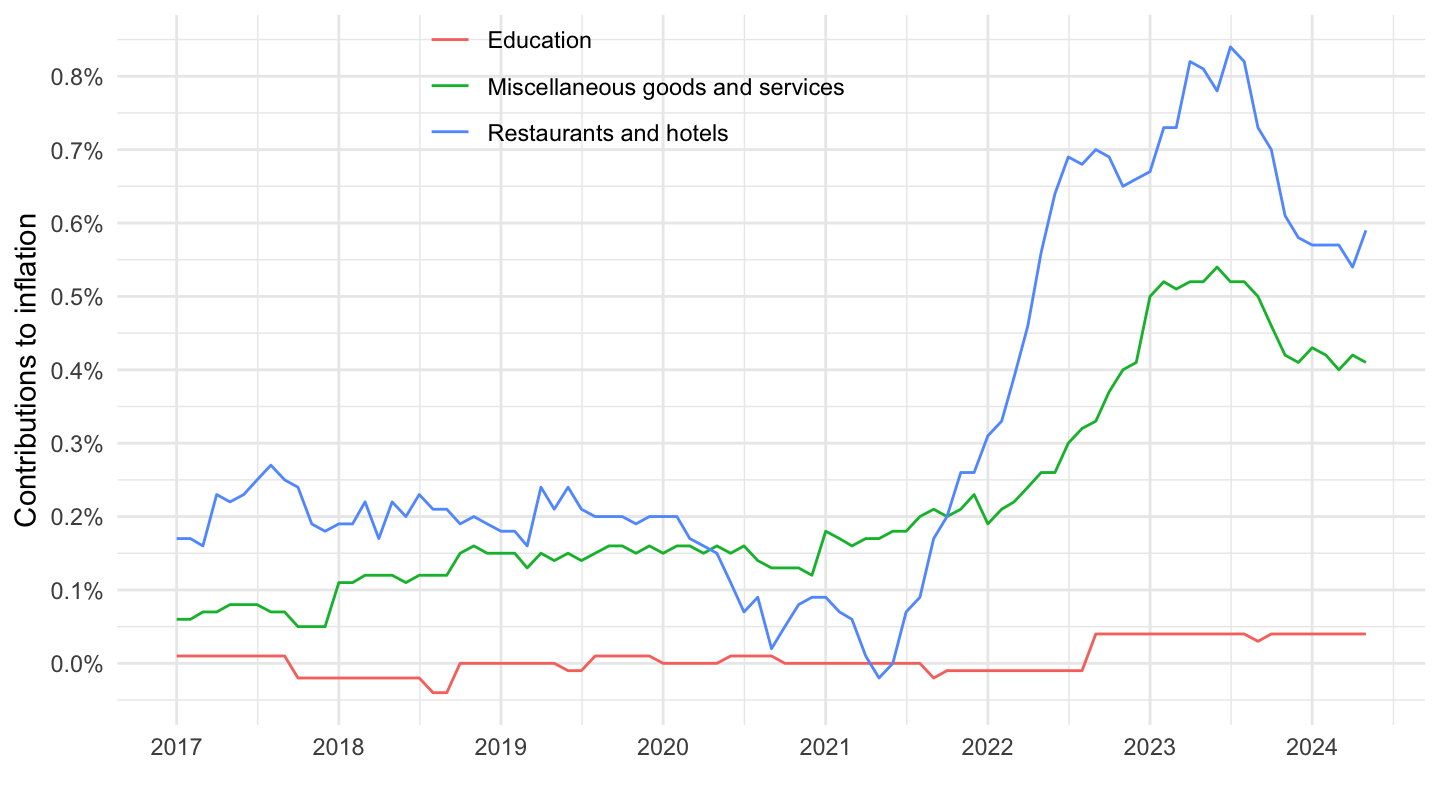
CP121, CP122, CP123, CP124, CP125, CP126, CP127
All
Code
prc_hicp_ctrb %>%
  filter(coicop %in% c("CP121", "CP122", "CP123", "CP124", "CP125", "CP126", "CP127")) %>%
  month_to_date %>%

  ggplot + geom_line(aes(x = date, y = values/100, color = paste(coicop, Coicop))) +
  theme_minimal() + xlab("") + ylab("Contributions to inflation") +
  scale_x_date(breaks ="5 years",
               labels = date_format("%Y")) +
  scale_y_continuous(breaks = 0.01*seq(-10, 30, 0.1),
                     labels = percent_format(accuracy = .1)) +

  theme(legend.position = c(0.4, 0.75),
        legend.title = element_blank())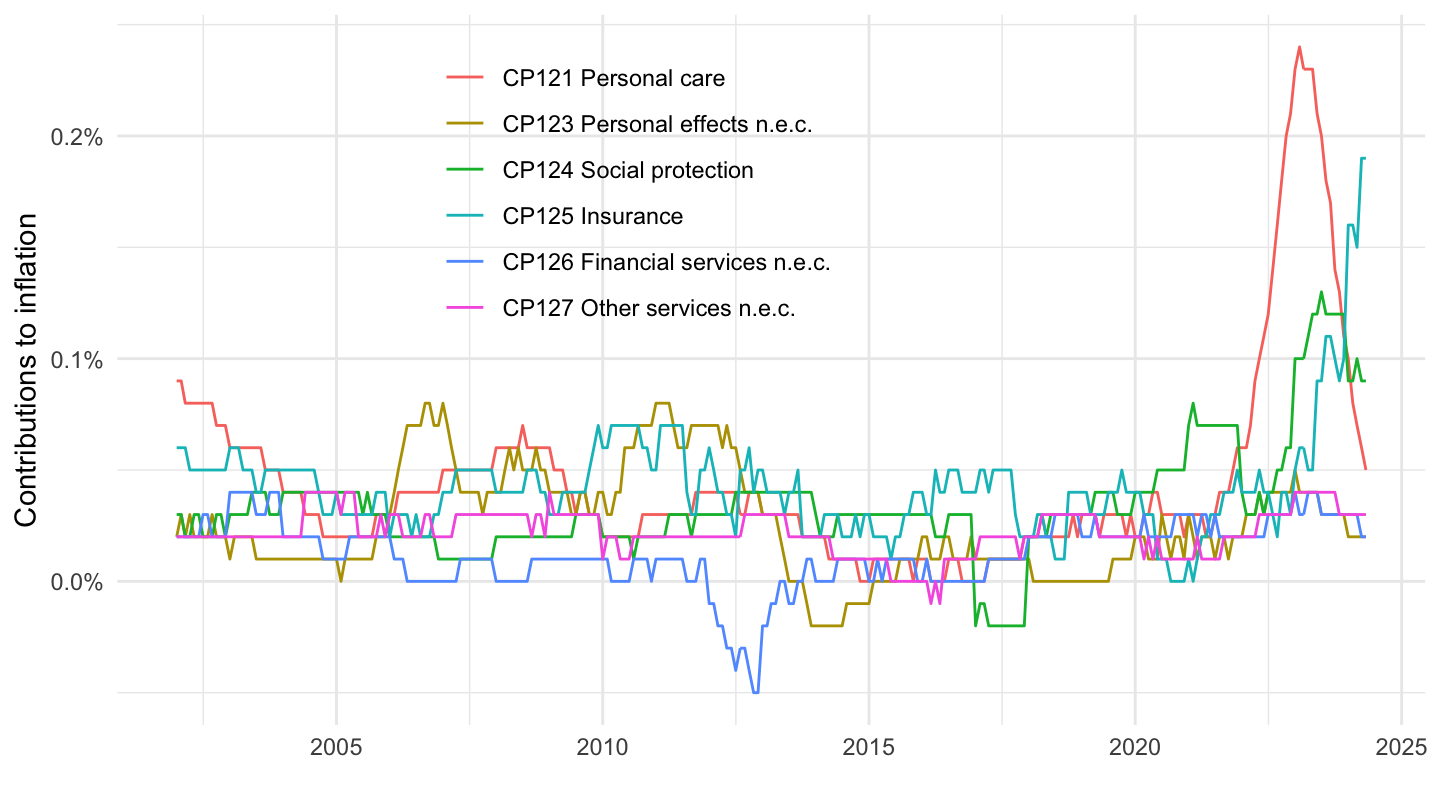
2017-
Code
prc_hicp_ctrb %>%
  filter(coicop %in% c("CP121", "CP122", "CP123", "CP124", "CP125", "CP126")) %>%
  month_to_date %>%

  filter(date >= as.Date("2017-01-01")) %>%
  ggplot + geom_line(aes(x = date, y = values/100, color = Coicop)) +
  theme_minimal() + xlab("") + ylab("Contributions to inflation") +
  scale_x_date(breaks ="1 year",
               labels = date_format("%Y")) +
  scale_y_continuous(breaks = 0.01*seq(-10, 30, 0.05),
                     labels = percent_format(accuracy = .01)) +

  theme(legend.position = c(0.4, 0.9),
        legend.title = element_blank())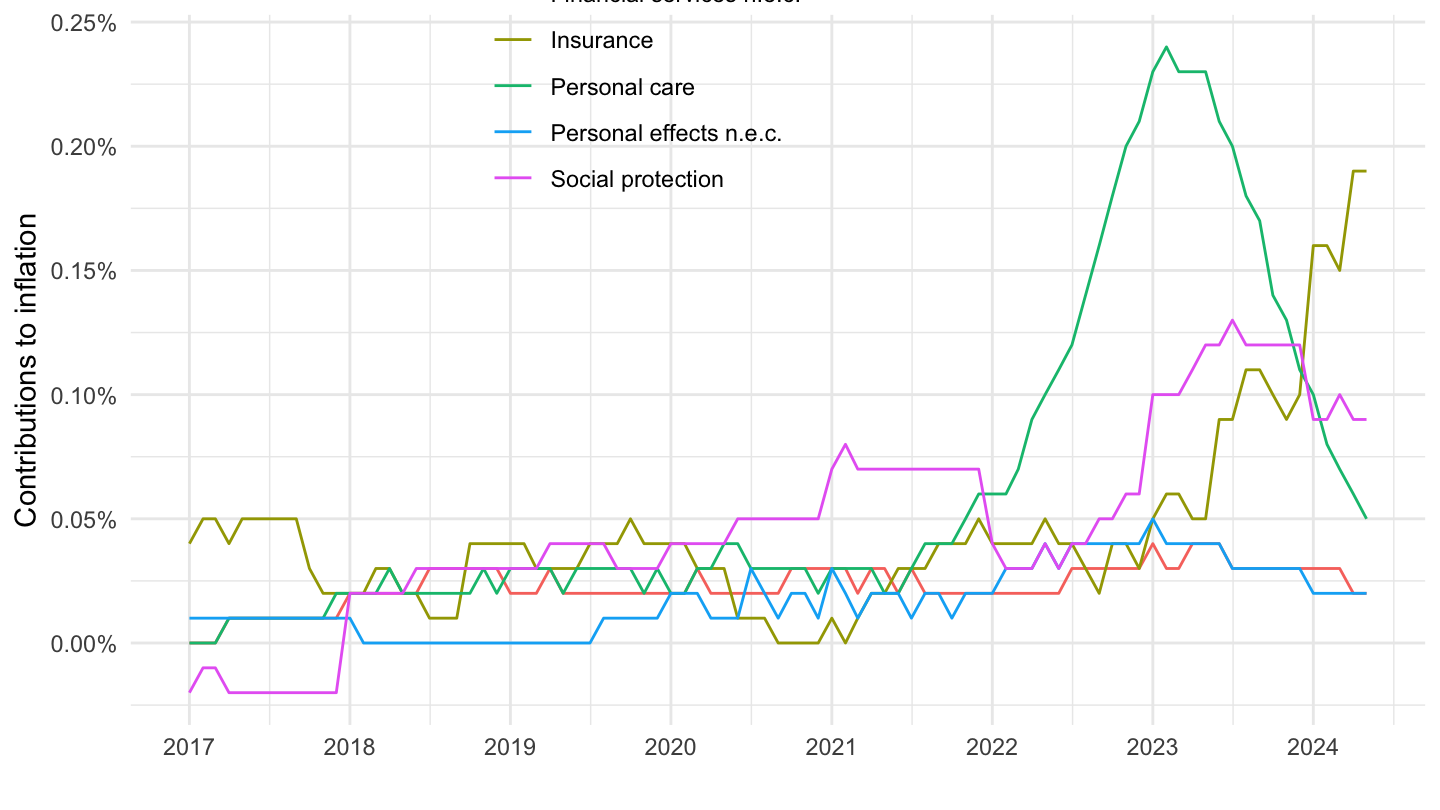
Fuels
CP01, CP04, CP045
All
Code
prc_hicp_ctrb %>%
  filter(coicop %in% c("CP04", "CP045", "CP01")) %>%
  month_to_date %>%

  ggplot + geom_line(aes(x = date, y = values/100, color = Coicop)) +
  theme_minimal() + xlab("") + ylab("Contributions to inflation") +
  scale_x_date(breaks ="1 year",
               labels = date_format("%Y")) +
  scale_y_continuous(breaks = 0.01*seq(-10, 30, 0.1),
                     labels = percent_format(accuracy = .1)) +

  theme(legend.position = c(0.3, 0.9),
        legend.title = element_blank())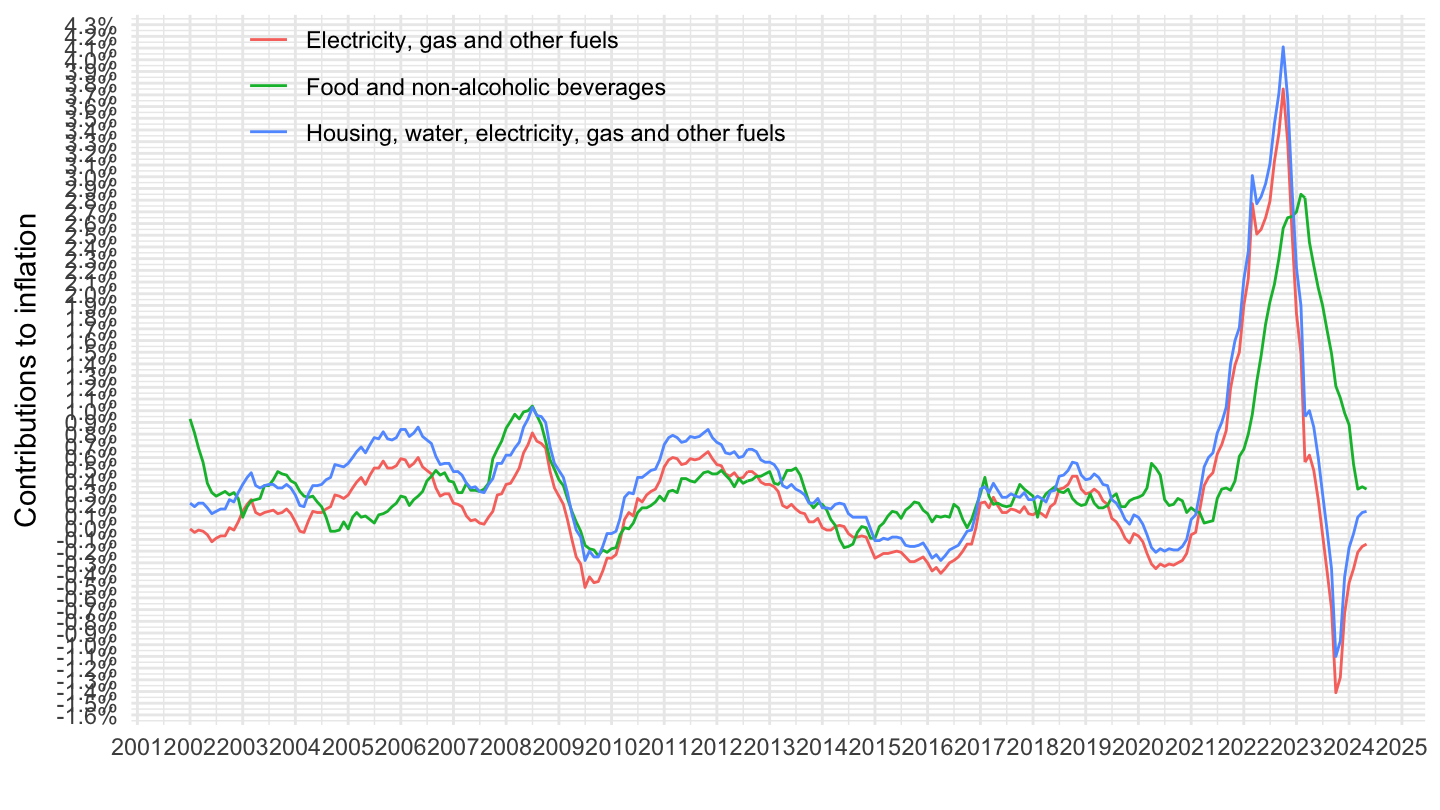
2017-
Code
prc_hicp_ctrb %>%
  filter(coicop %in% c("CP04", "CP045", "CP01")) %>%
  month_to_date %>%
  filter(date >= as.Date("2017-01-01")) %>%

  ggplot + geom_line(aes(x = date, y = values/100, color = Coicop)) +
  theme_minimal() + xlab("") + ylab("Contributions to inflation") +
  scale_x_date(breaks ="1 year",
               labels = date_format("%Y")) +
  scale_y_continuous(breaks = 0.01*seq(-10, 30, 0.1),
                     labels = percent_format(accuracy = .1)) +

  theme(legend.position = c(0.3, 0.9),
        legend.title = element_blank())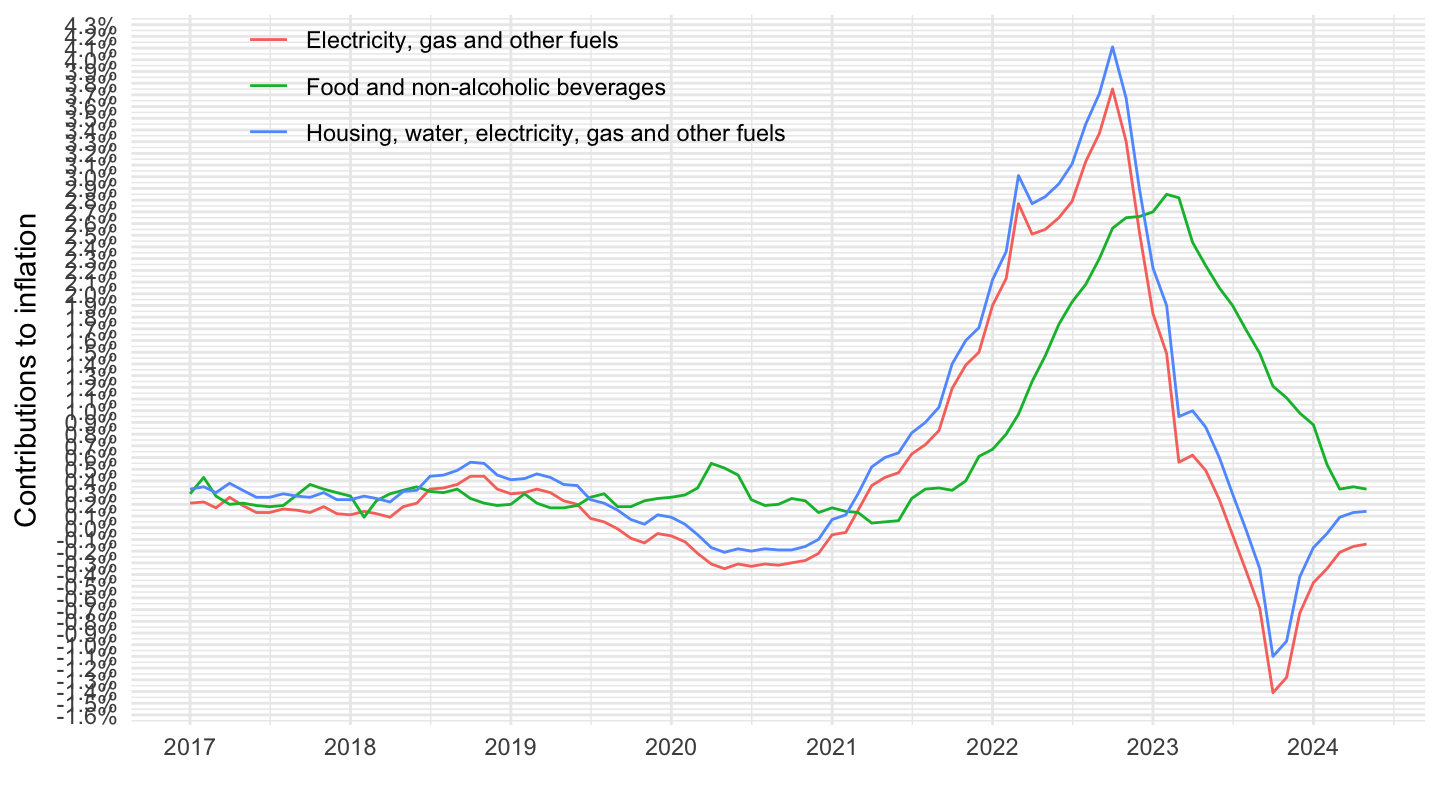
2020-
Code
prc_hicp_ctrb %>%
  filter(coicop %in% c("CP04", "CP045", "CP01")) %>%
  month_to_date %>%

  filter(date >= as.Date("2020-01-01")) %>%
  ggplot + geom_line(aes(x = date, y = values/100, color = Coicop)) +
  theme_minimal() + xlab("") + ylab("Contributions to inflation") +
  scale_x_date(breaks = seq.Date(from = as.Date("2019-10-01"), to = as.Date("2100-10-01"), by = "6 months"),
               labels = date_format("%Y %b")) +
  scale_y_continuous(breaks = 0.01*seq(-10, 30, 0.5),
                     labels = percent_format(accuracy = .1)) +

  theme(legend.position = c(0.3, 0.9),
        legend.title = element_blank())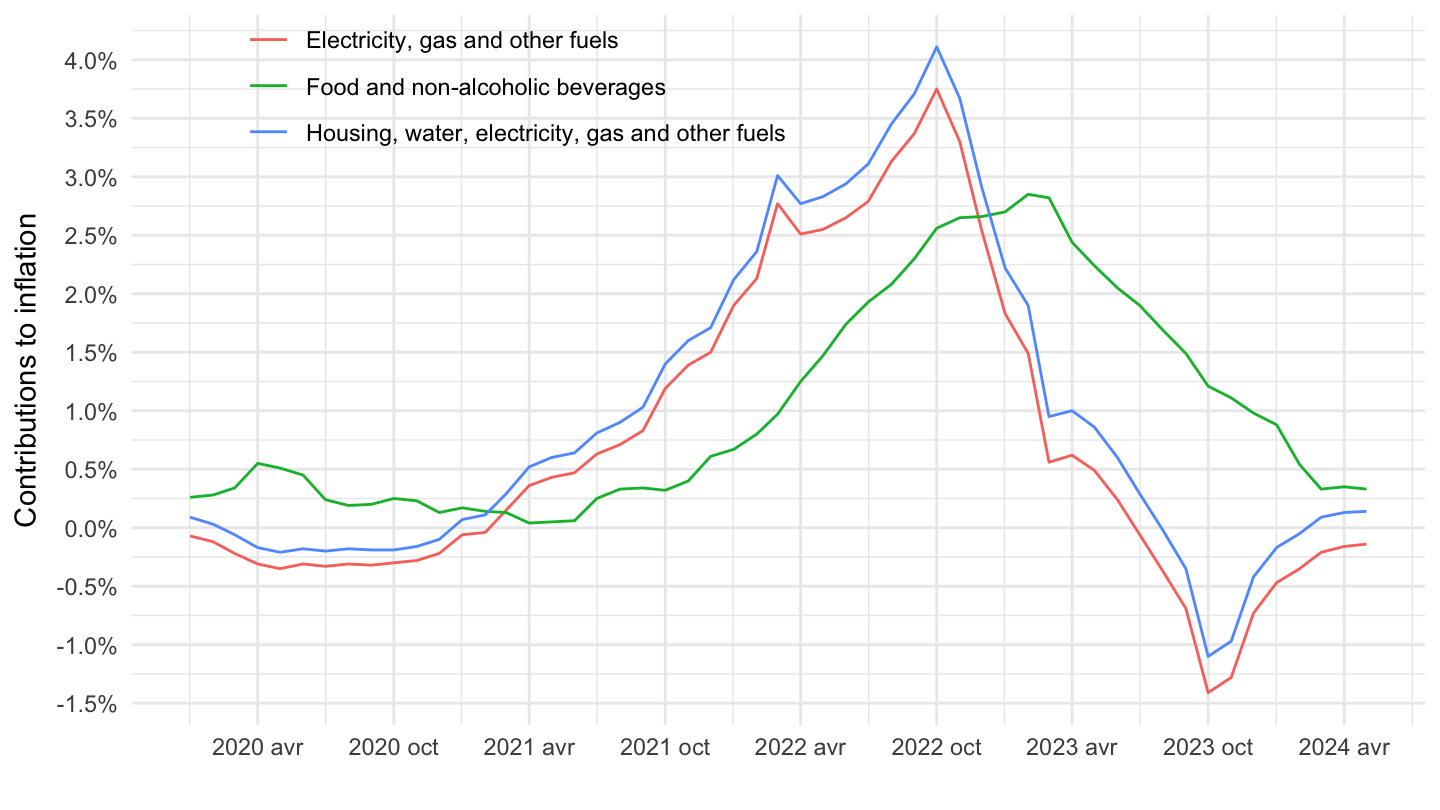
CP01, CP04, CP041
All
Code
prc_hicp_ctrb %>%
  filter(coicop %in% c("CP04", "CP041", "CP01")) %>%
  month_to_date %>%

  ggplot + geom_line(aes(x = date, y = values/100, color = Coicop)) +
  theme_minimal() + xlab("") + ylab("Contributions to inflation") +
  scale_x_date(breaks ="1 year",
               labels = date_format("%Y")) +
  scale_y_continuous(breaks = 0.01*seq(-10, 30, 0.1),
                     labels = percent_format(accuracy = .1)) +

  theme(legend.position = c(0.3, 0.9),
        legend.title = element_blank())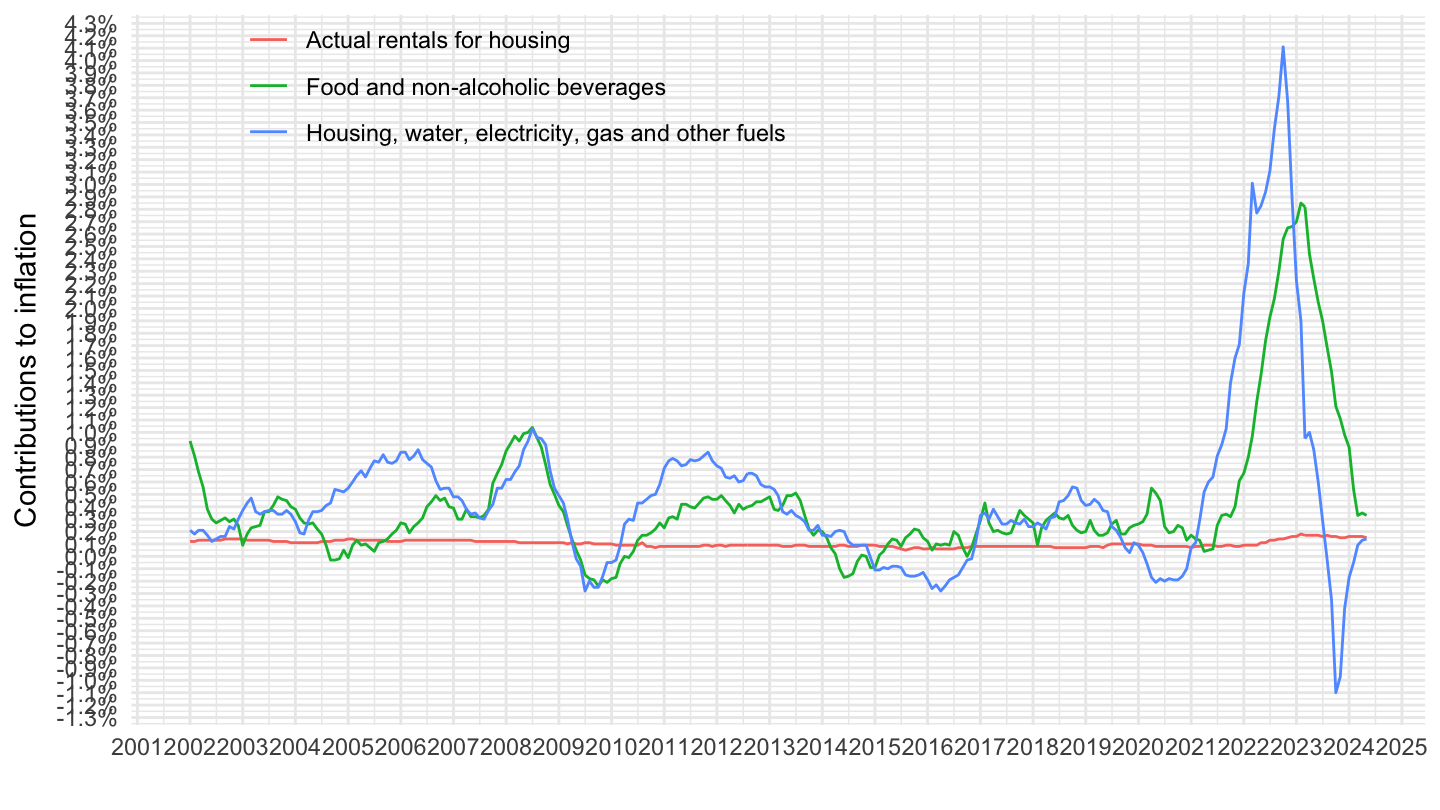
2017-
Code
prc_hicp_ctrb %>%
  filter(coicop %in% c("CP04", "CP041", "CP01")) %>%
  month_to_date %>%
  filter(date >= as.Date("2017-01-01")) %>%

  ggplot + geom_line(aes(x = date, y = values/100, color = Coicop)) +
  theme_minimal() + xlab("") + ylab("Contributions to inflation") +
  scale_x_date(breaks ="1 year",
               labels = date_format("%Y")) +
  scale_y_continuous(breaks = 0.01*seq(-10, 30, 0.1),
                     labels = percent_format(accuracy = .1)) +

  theme(legend.position = c(0.3, 0.9),
        legend.title = element_blank())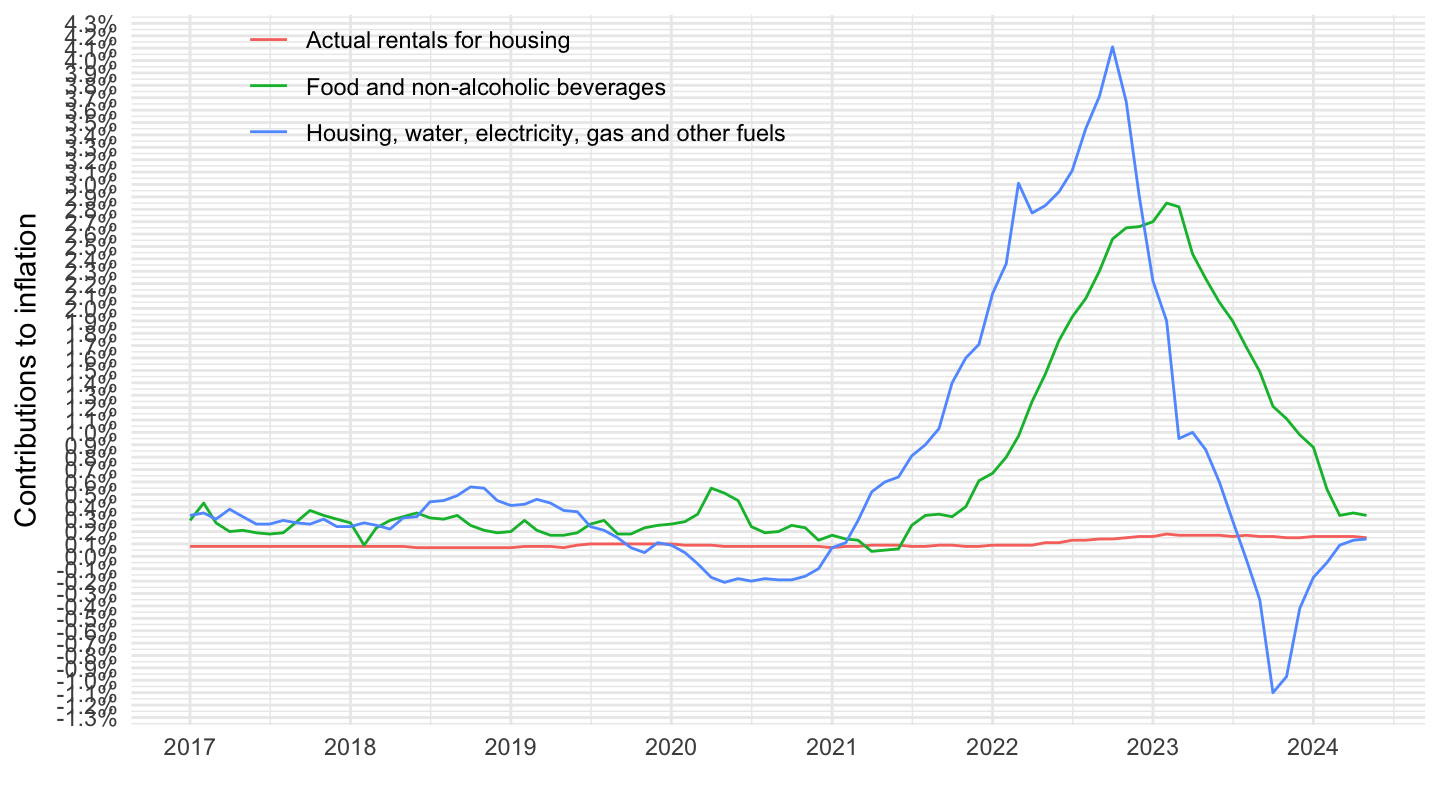
CP04, CP045
All
Code
prc_hicp_ctrb %>%
  filter(coicop %in% c("CP04", "CP045")) %>%
  month_to_date %>%

  ggplot + geom_line(aes(x = date, y = values/100, color = Coicop)) +
  theme_minimal() + xlab("") + ylab("Contributions to inflation") +
  scale_x_date(breaks ="1 year",
               labels = date_format("%Y")) +
  scale_y_continuous(breaks = 0.01*seq(-10, 30, 0.1),
                     labels = percent_format(accuracy = .1)) +
  scale_color_manual(values = viridis(3)[1:2]) +
  theme(legend.position = c(0.3, 0.9),
        legend.title = element_blank())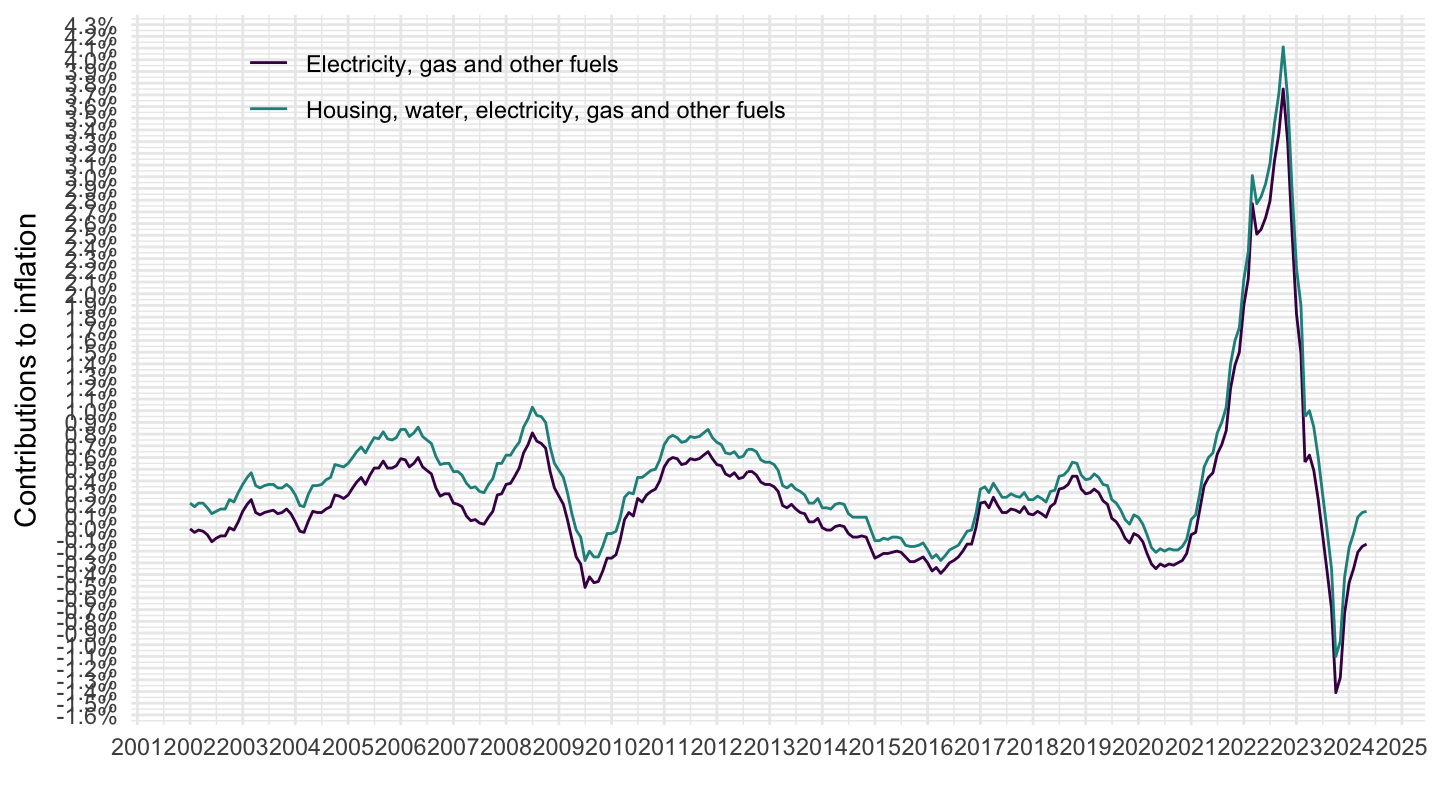
2017-
Code
prc_hicp_ctrb %>%
  filter(coicop %in% c("CP04", "CP045")) %>%
  month_to_date %>%
  filter(date >= as.Date("2017-01-01")) %>%

  ggplot + geom_line(aes(x = date, y = values/100, color = Coicop)) +
  theme_minimal() + xlab("") + ylab("Contributions to inflation") +
  scale_x_date(breaks ="1 year",
               labels = date_format("%Y")) +
  scale_y_continuous(breaks = 0.01*seq(-10, 30, 0.1),
                     labels = percent_format(accuracy = .1)) +
  scale_color_manual(values = viridis(3)[1:2]) +
  theme(legend.position = c(0.3, 0.9),
        legend.title = element_blank())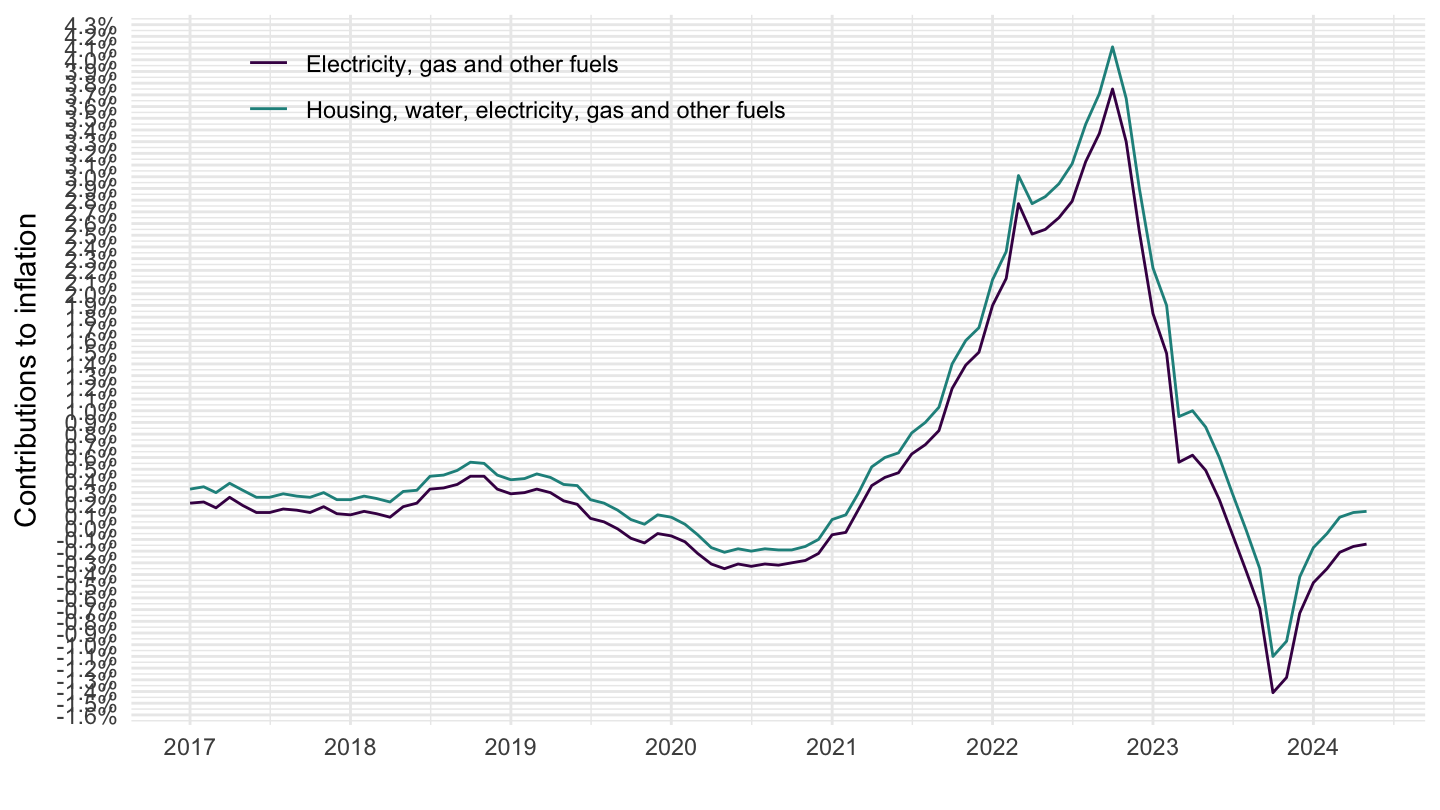
CP0451, CP0452, CP0453
All
Code
prc_hicp_ctrb %>%
  filter(coicop %in% c("CP0451", "CP0452", "CP0453")) %>%
  month_to_date %>%

  ggplot + geom_line(aes(x = date, y = values/100, color = Coicop)) +
  theme_minimal() + xlab("") + ylab("Contributions to inflation") +
  scale_x_date(breaks ="1 year",
               labels = date_format("%Y")) +
  scale_y_continuous(breaks = 0.01*seq(-10, 30, 0.1),
                     labels = percent_format(accuracy = .1)) +
  theme(legend.position = c(0.2, 0.9),
        legend.title = element_blank())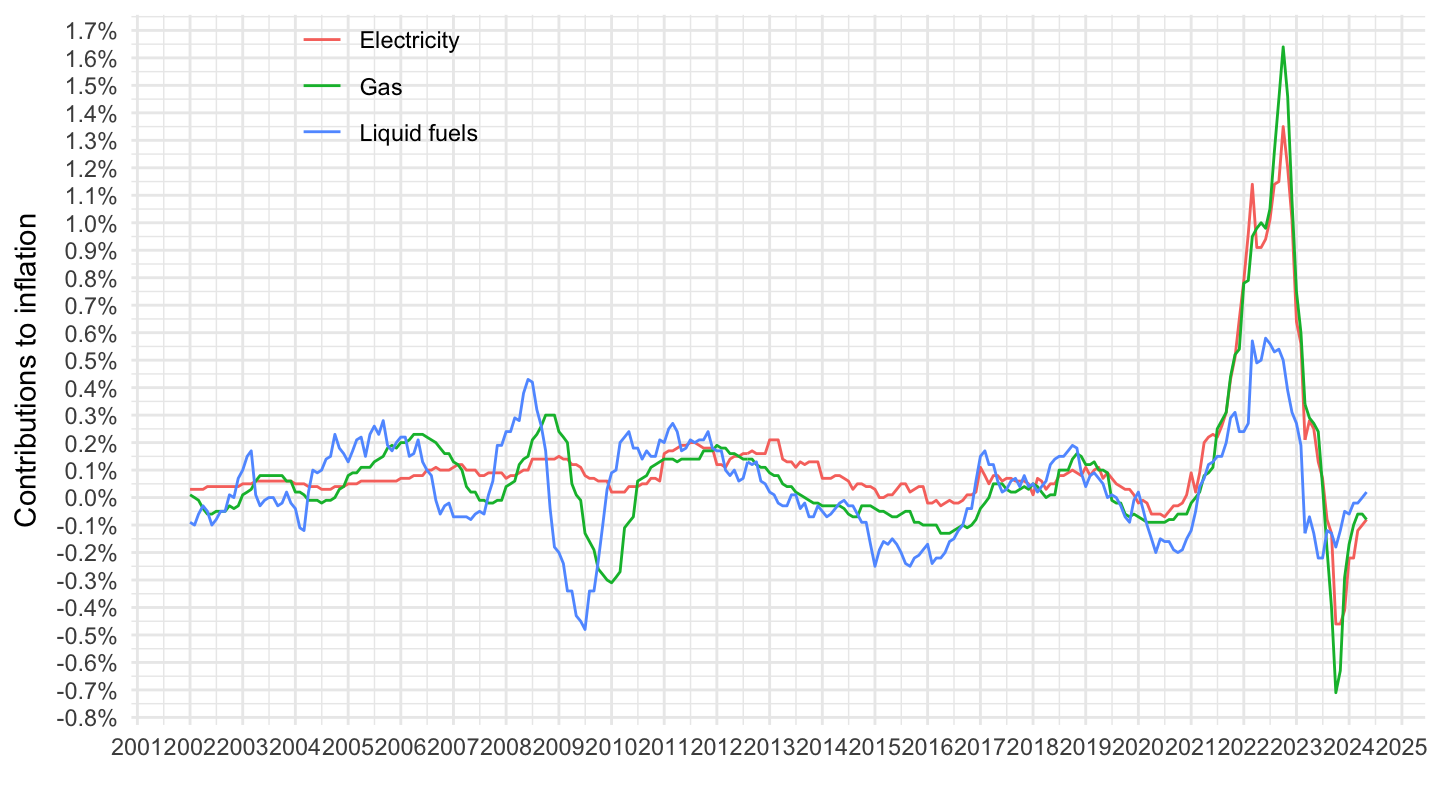
2017-
Code
prc_hicp_ctrb %>%
  filter(coicop %in% c("CP0451", "CP0452", "CP0453")) %>%
  month_to_date %>%

  filter(date >= as.Date("2017-01-01")) %>%
  ggplot + geom_line(aes(x = date, y = values/100, color = Coicop)) +
  theme_minimal() + xlab("") + ylab("Contributions to inflation") +
  scale_x_date(breaks ="1 year",
               labels = date_format("%Y")) +
  scale_y_continuous(breaks = 0.01*seq(-10, 30, 0.1),
                     labels = percent_format(accuracy = .1)) +
  theme(legend.position = c(0.2, 0.9),
        legend.title = element_blank())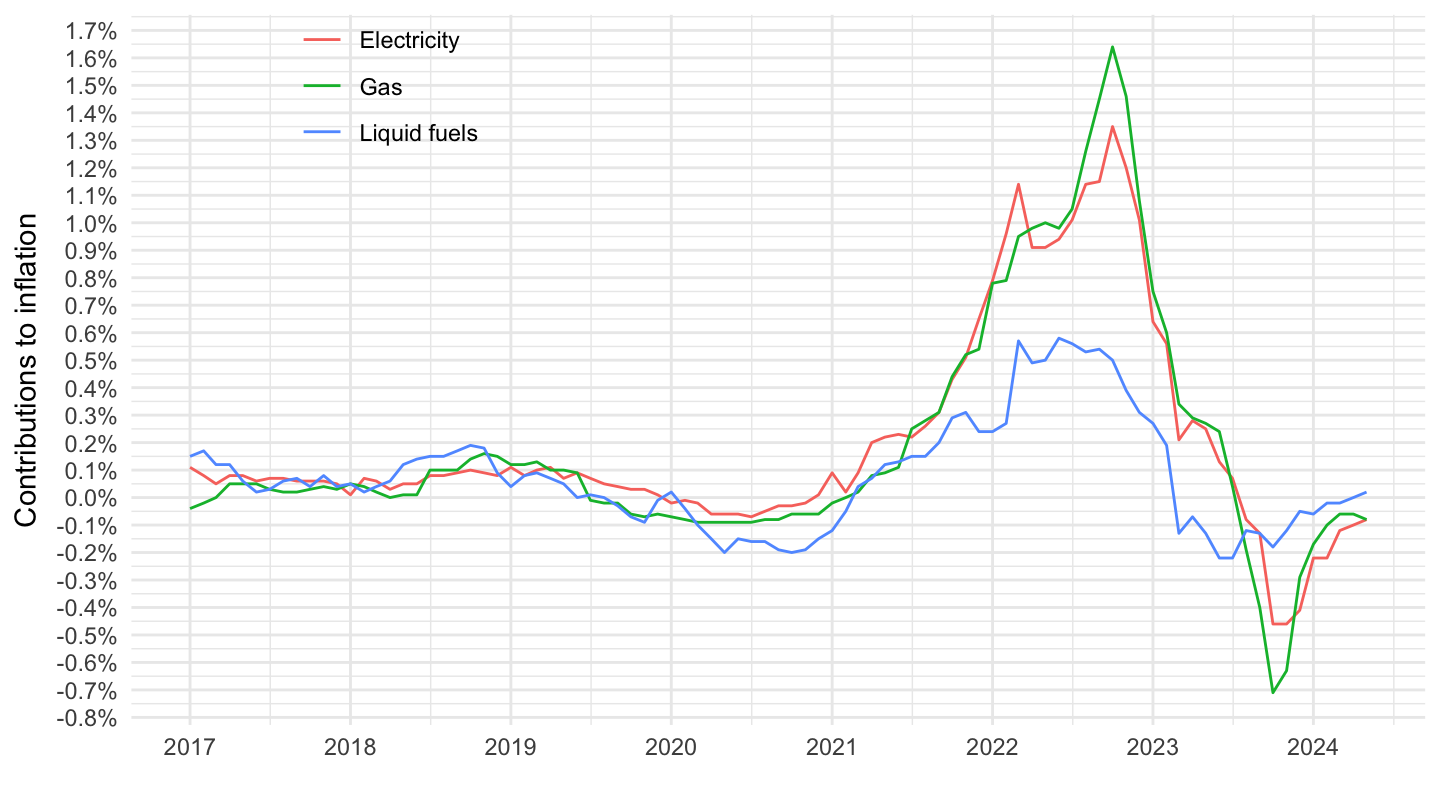
2020-
Code
prc_hicp_ctrb %>%
  filter(coicop %in% c("CP0451", "CP0452", "CP0453")) %>%
  month_to_date %>%

  filter(date >= as.Date("2020-01-01")) %>%
  ggplot + geom_line(aes(x = date, y = values/100, color = Coicop)) +
  theme_minimal() + xlab("") + ylab("Contributions to inflation") +
  scale_x_date(breaks ="1 year",
               labels = date_format("%Y")) +
  scale_y_continuous(breaks = 0.01*seq(-10, 30, 0.1),
                     labels = percent_format(accuracy = .1)) +
  theme(legend.position = c(0.2, 0.9),
        legend.title = element_blank())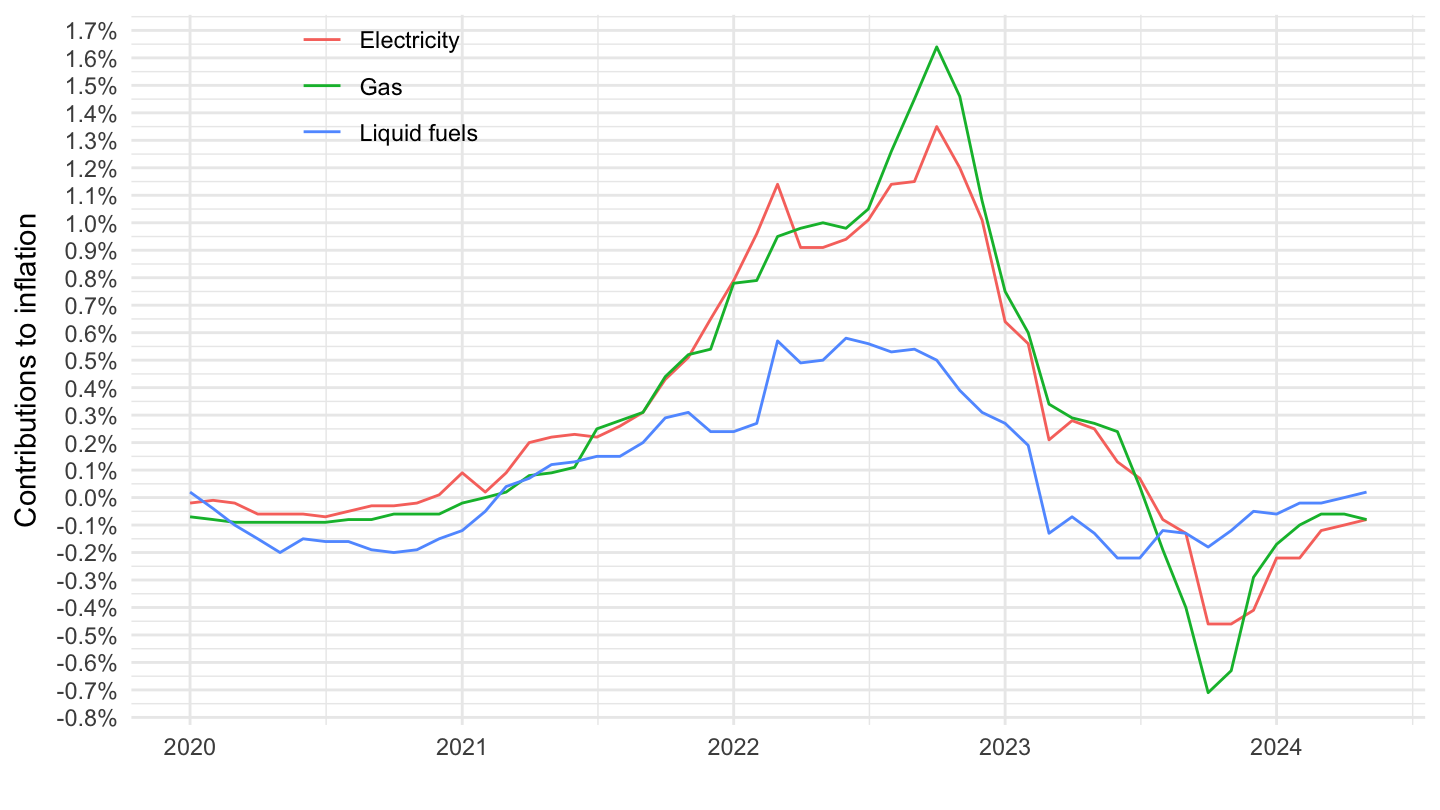
CP0451, CP0452
All
Code
prc_hicp_ctrb %>%
  filter(coicop %in% c("CP0451", "CP0452")) %>%
  month_to_date %>%

  ggplot + geom_line(aes(x = date, y = values/100, color = Coicop)) +
  theme_minimal() + xlab("") + ylab("Contributions to inflation") +
  scale_x_date(breaks ="1 year",
               labels = date_format("%Y")) +
  scale_y_continuous(breaks = 0.01*seq(-10, 30, 0.1),
                     labels = percent_format(accuracy = .1)) +
  theme(legend.position = c(0.2, 0.9),
        legend.title = element_blank())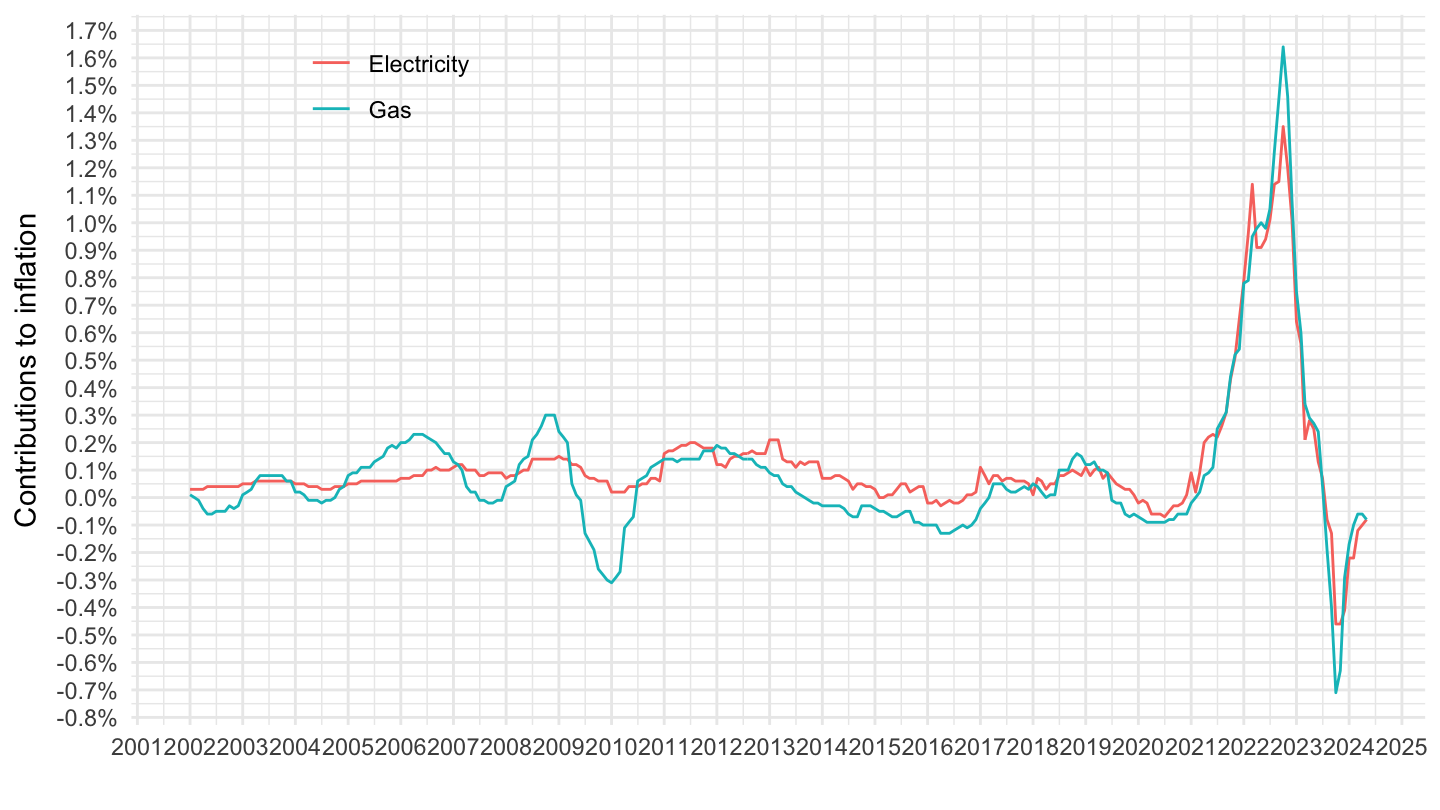
2017-
Code
prc_hicp_ctrb %>%
  filter(coicop %in% c("CP0451", "CP0452")) %>%
  month_to_date %>%

  filter(date >= as.Date("2017-01-01")) %>%
  ggplot + geom_line(aes(x = date, y = values/100, color = Coicop)) +
  theme_minimal() + xlab("") + ylab("Contributions to inflation") +
  scale_x_date(breaks ="1 year",
               labels = date_format("%Y")) +
  scale_y_continuous(breaks = 0.01*seq(-10, 30, 0.1),
                     labels = percent_format(accuracy = .1)) +
  theme(legend.position = c(0.2, 0.9),
        legend.title = element_blank())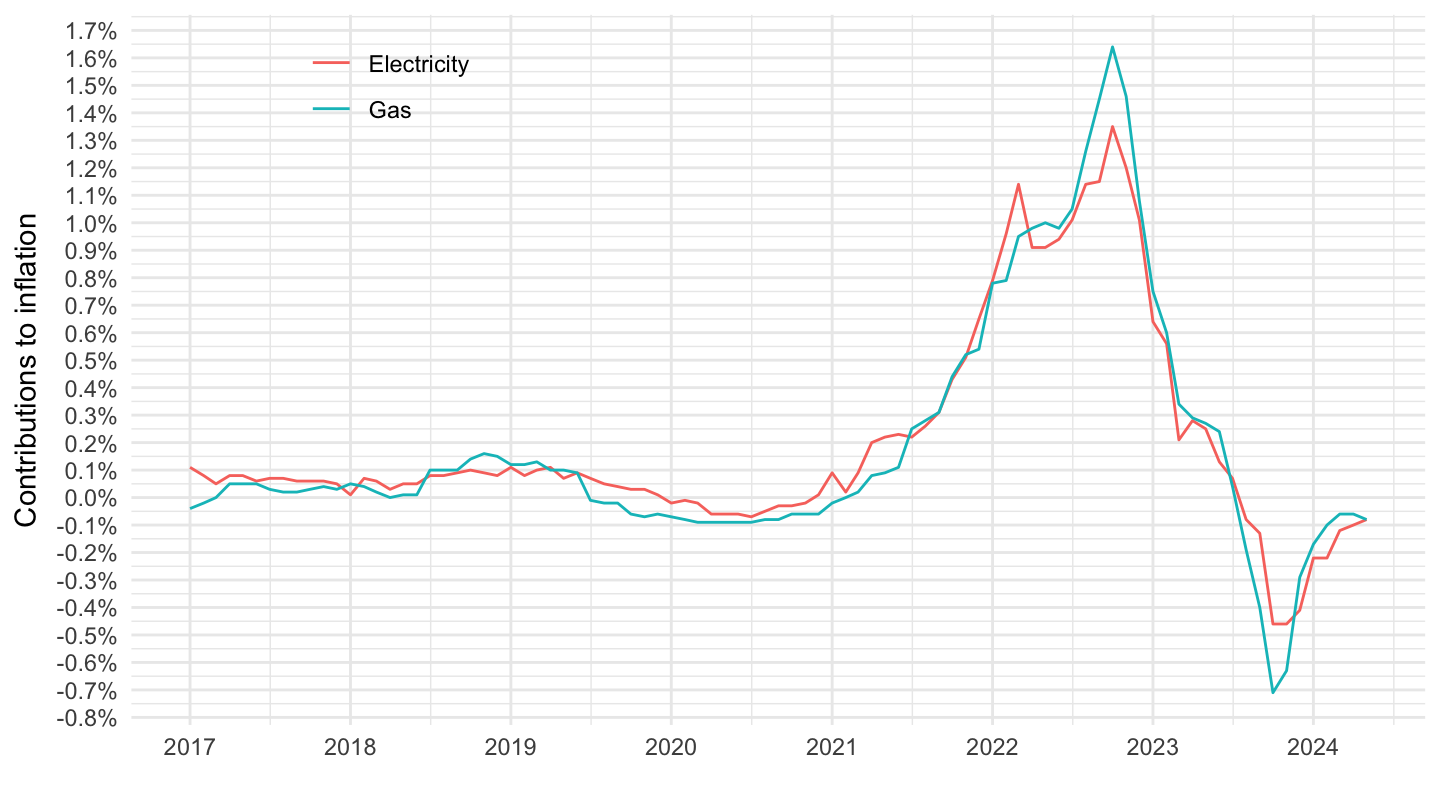
2020-
Code
prc_hicp_ctrb %>%
  filter(coicop %in% c("CP0451", "CP0452")) %>%
  month_to_date %>%

  filter(date >= as.Date("2020-01-01")) %>%
  ggplot + geom_line(aes(x = date, y = values/100, color = Coicop)) +
  theme_minimal() + xlab("") + ylab("Contributions to inflation") +
  scale_x_date(breaks ="1 year",
               labels = date_format("%Y")) +
  scale_y_continuous(breaks = 0.01*seq(-10, 30, 0.1),
                     labels = percent_format(accuracy = .1)) +
  theme(legend.position = c(0.2, 0.9),
        legend.title = element_blank())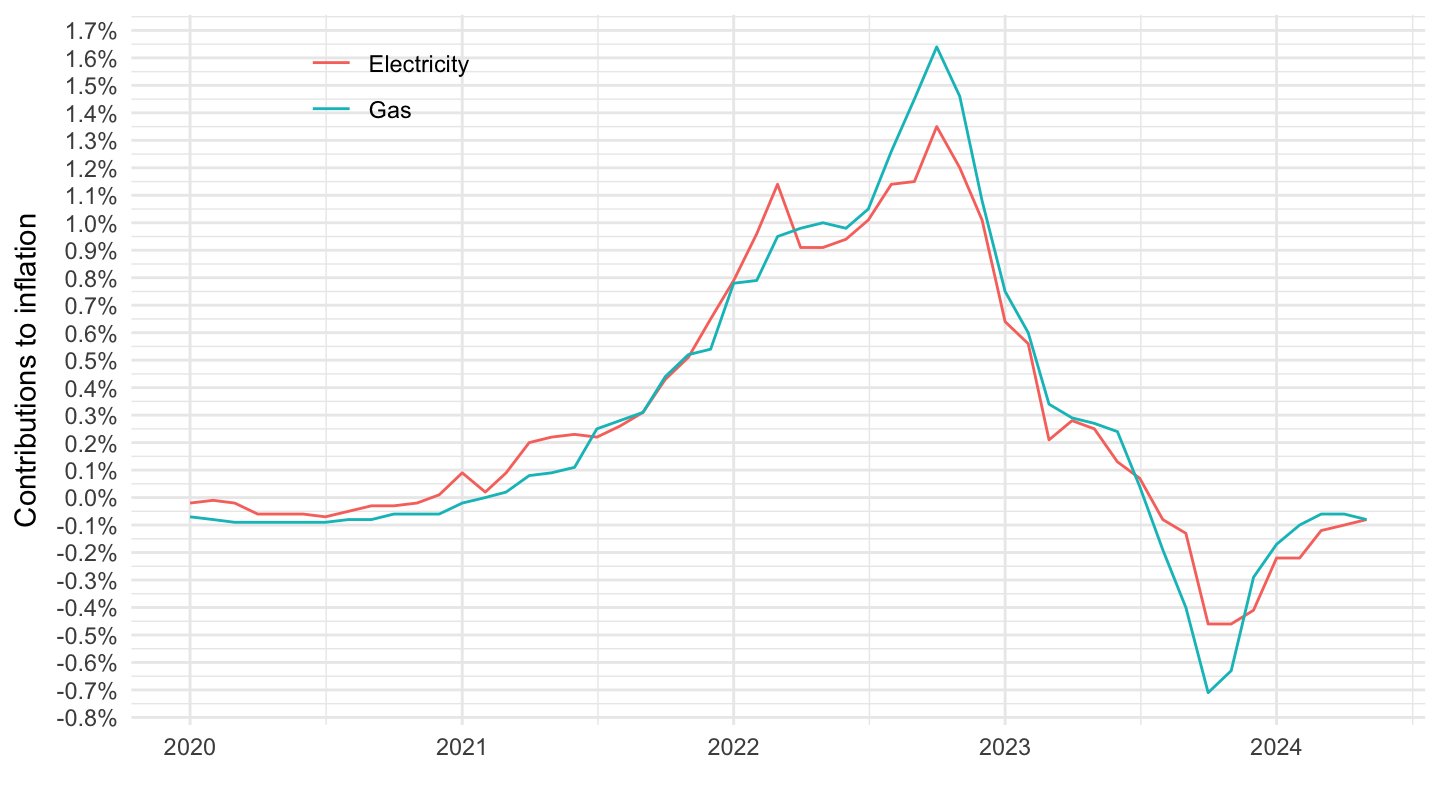
CP0454, CP0455
All
Code
prc_hicp_ctrb %>%
  filter(coicop %in% c("CP0454", "CP0455")) %>%
  month_to_date %>%

  ggplot + geom_line(aes(x = date, y = values/100, color = Coicop)) +
  theme_minimal() + xlab("") + ylab("Contributions to inflation") +
  scale_x_date(breaks ="1 year",
               labels = date_format("%Y")) +
  scale_y_continuous(breaks = 0.01*seq(-10, 30, 0.01),
                     labels = percent_format(accuracy = .01)) +
  scale_color_manual(values = viridis(3)[1:2]) +
  theme(legend.position = c(0.7, 0.9),
        legend.title = element_blank())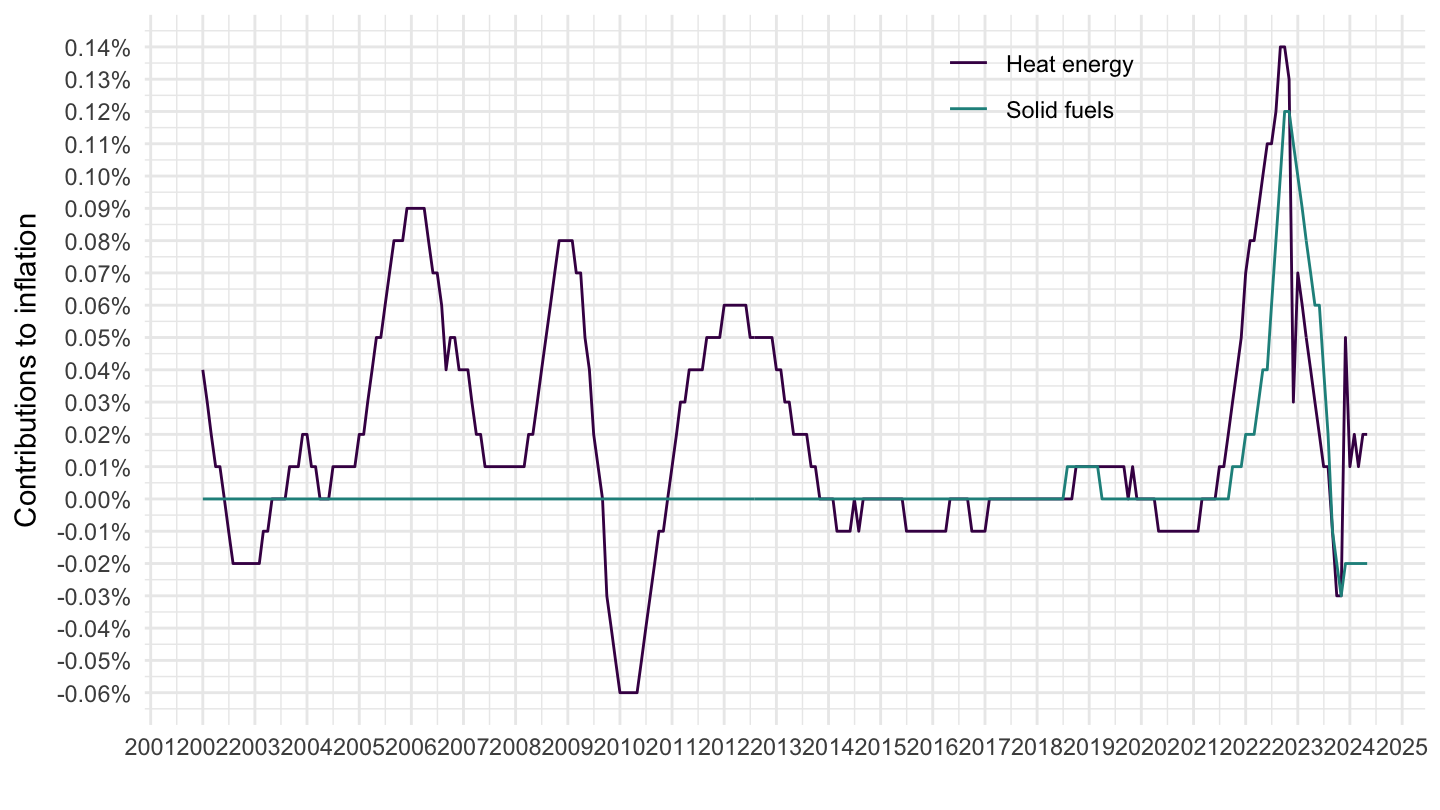
2017-
Code
prc_hicp_ctrb %>%
  filter(coicop %in% c("CP0454", "CP0455")) %>%
  month_to_date %>%

  filter(date >= as.Date("2017-01-01")) %>%
  ggplot + geom_line(aes(x = date, y = values/100, color = Coicop)) +
  theme_minimal() + xlab("") + ylab("Contributions to inflation") +
  scale_x_date(breaks ="1 year",
               labels = date_format("%Y")) +
  scale_y_continuous(breaks = 0.01*seq(-10, 30, 0.01),
                     labels = percent_format(accuracy = .01)) +
  scale_color_manual(values = viridis(3)[1:2]) +
  theme(legend.position = c(0.7, 0.9),
        legend.title = element_blank())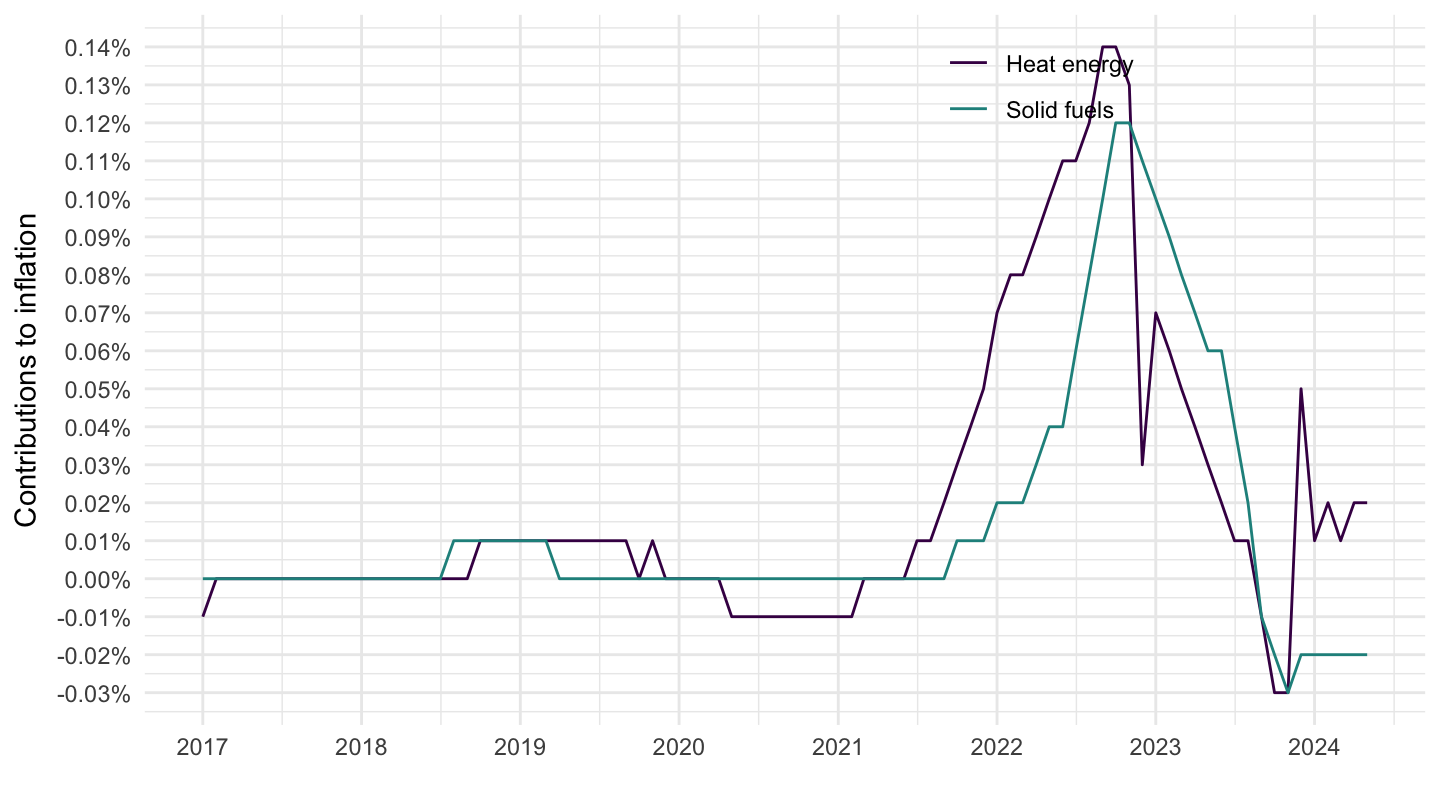
Food
CP011, CP012, CP01
All
Code
prc_hicp_ctrb %>%
  filter(coicop %in% c("CP011", "CP012", "CP01")) %>%
  month_to_date %>%

  ggplot + geom_line(aes(x = date, y = values/100, color = Coicop)) +
  theme_minimal() + xlab("") + ylab("Contributions to inflation") +
  scale_x_date(breaks ="2 years",
               labels = date_format("%Y")) +
  scale_y_continuous(breaks = 0.01*seq(-10, 30, 0.1),
                     labels = percent_format(accuracy = .1)) +
  theme(legend.position = c(0.2, 0.8),
        legend.title = element_blank())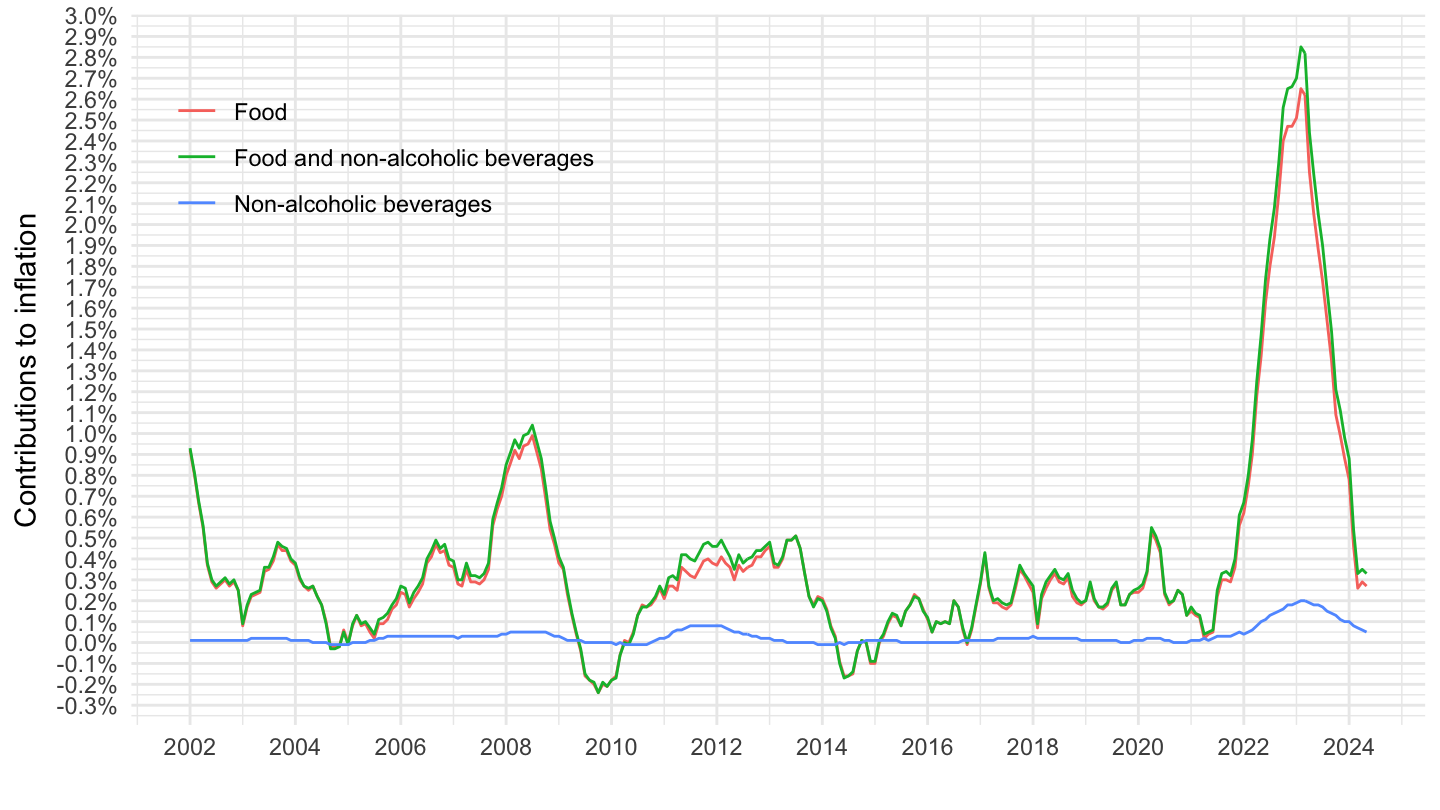
2017-
Code
prc_hicp_ctrb %>%
  filter(coicop %in% c("CP011", "CP012", "CP01")) %>%
  month_to_date %>%
  filter(date >= as.Date("2017-01-01")) %>%

  ggplot + geom_line(aes(x = date, y = values/100, color = Coicop)) +
  theme_minimal() + xlab("") + ylab("Contributions to inflation") +
  scale_x_date(breaks ="1 year",
               labels = date_format("%Y")) +
  scale_y_continuous(breaks = 0.01*seq(-10, 30, 0.1),
                     labels = percent_format(accuracy = .1)) +
  theme(legend.position = c(0.3, 0.9),
        legend.title = element_blank())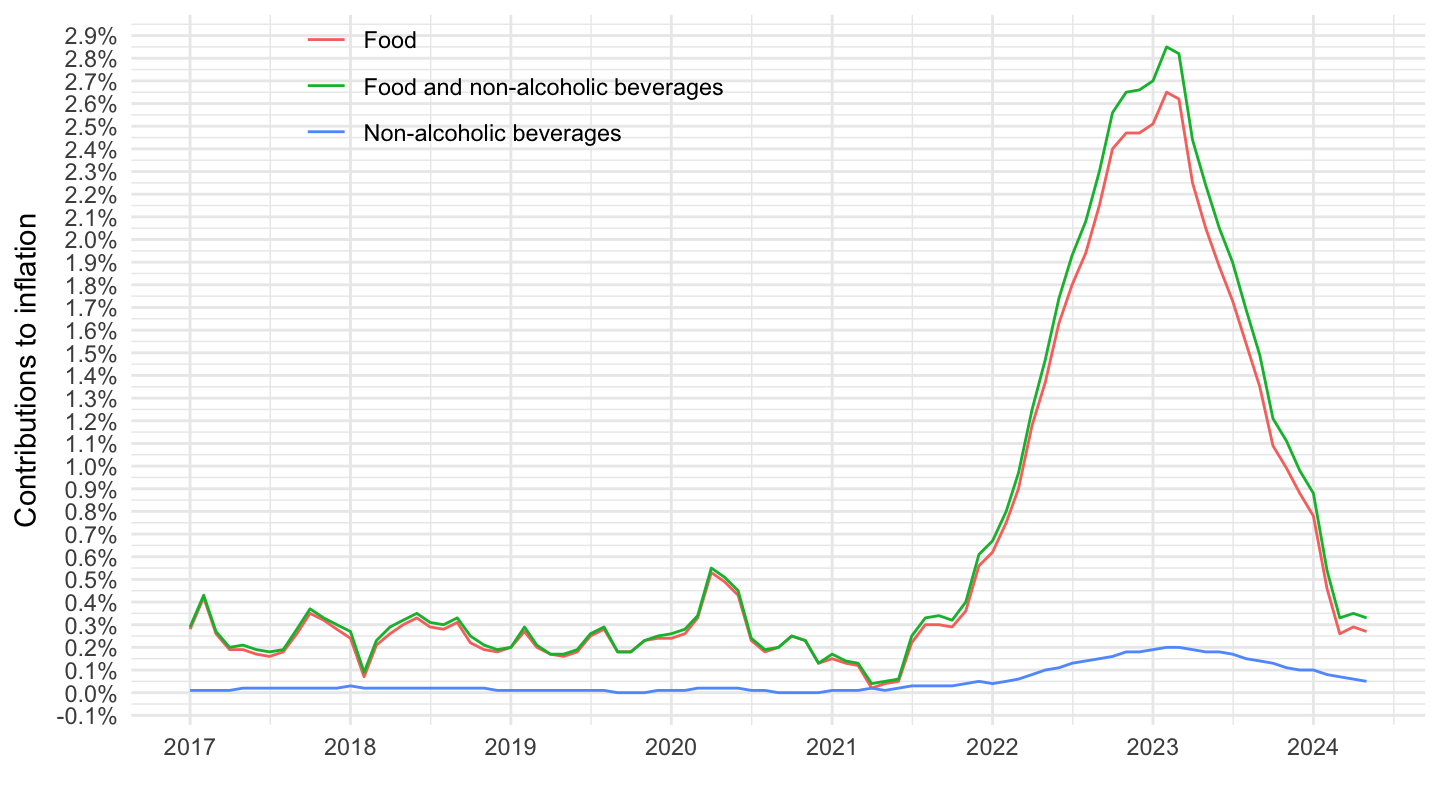
2020-
Code
prc_hicp_ctrb %>%
  filter(coicop %in% c("CP011", "CP012", "CP01")) %>%
  month_to_date %>%

  filter(date >= as.Date("2020-01-01")) %>%
  ggplot + geom_line(aes(x = date, y = values/100, color = Coicop)) +
  theme_minimal() + xlab("") + ylab("Contributions to inflation") +
  scale_x_date(breaks = seq.Date(from = as.Date("2019-10-01"), to = as.Date("2100-10-01"), by = "6 months"),
               labels = date_format("%Y %b")) +
  scale_y_continuous(breaks = 0.01*seq(-10, 30, 0.1),
                     labels = percent_format(accuracy = .1)) +
  theme(legend.position = c(0.3, 0.7),
        legend.title = element_blank())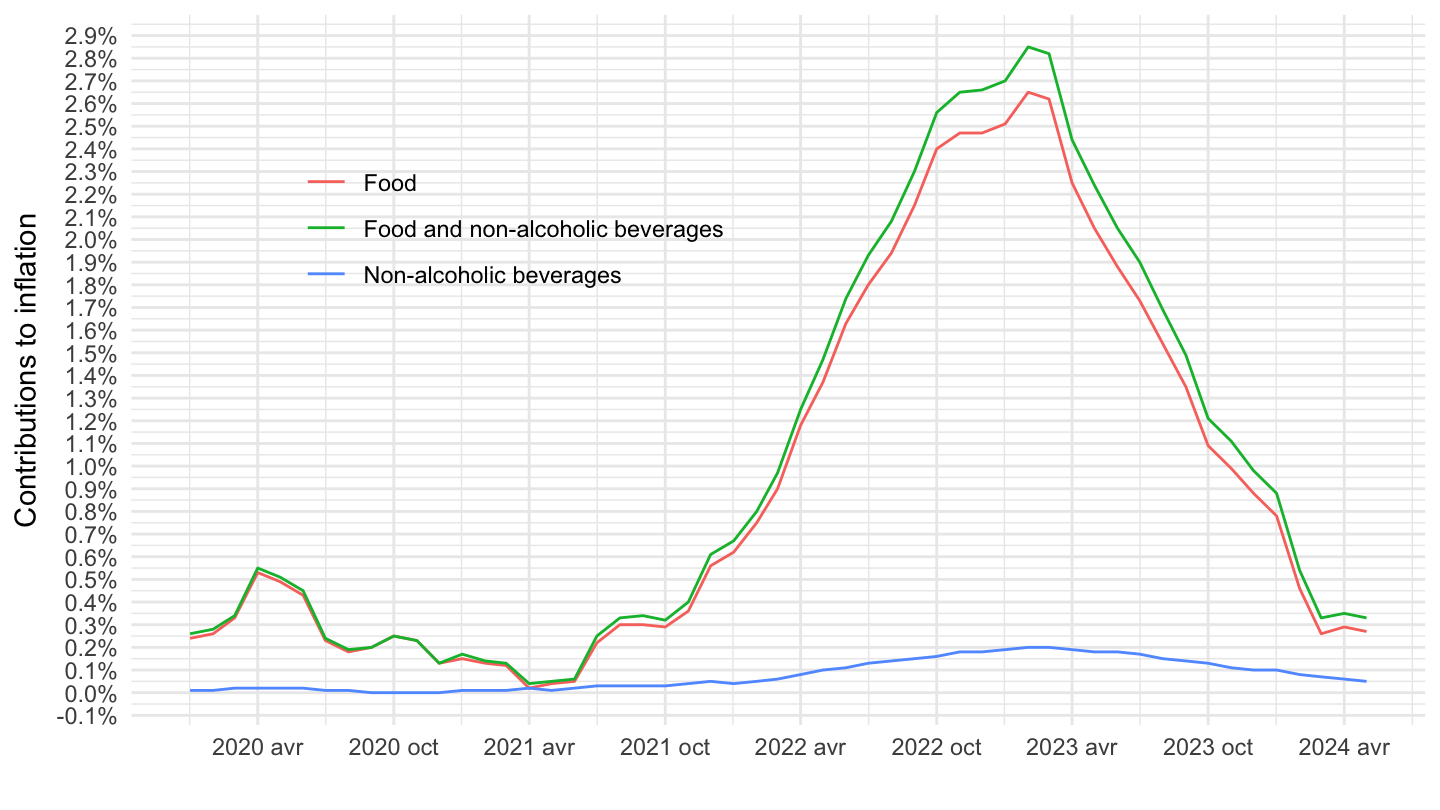
CP0111, CP0112, CP0113, CP0114, CP0115
All
Code
prc_hicp_ctrb %>%
  filter(coicop %in% c("CP0111", "CP0112", "CP0113", "CP0114", "CP0115")) %>%
  month_to_date %>%

  ggplot + geom_line(aes(x = date, y = values/100, color = Coicop)) +
  theme_minimal() + xlab("") + ylab("Contributions to inflation") +
  scale_x_date(breaks ="2 years",
               labels = date_format("%Y")) +
  scale_y_continuous(breaks = 0.01*seq(-10, 30, 0.1),
                     labels = percent_format(accuracy = .1)) +
  theme(legend.position = c(0.2, 0.8),
        legend.title = element_blank())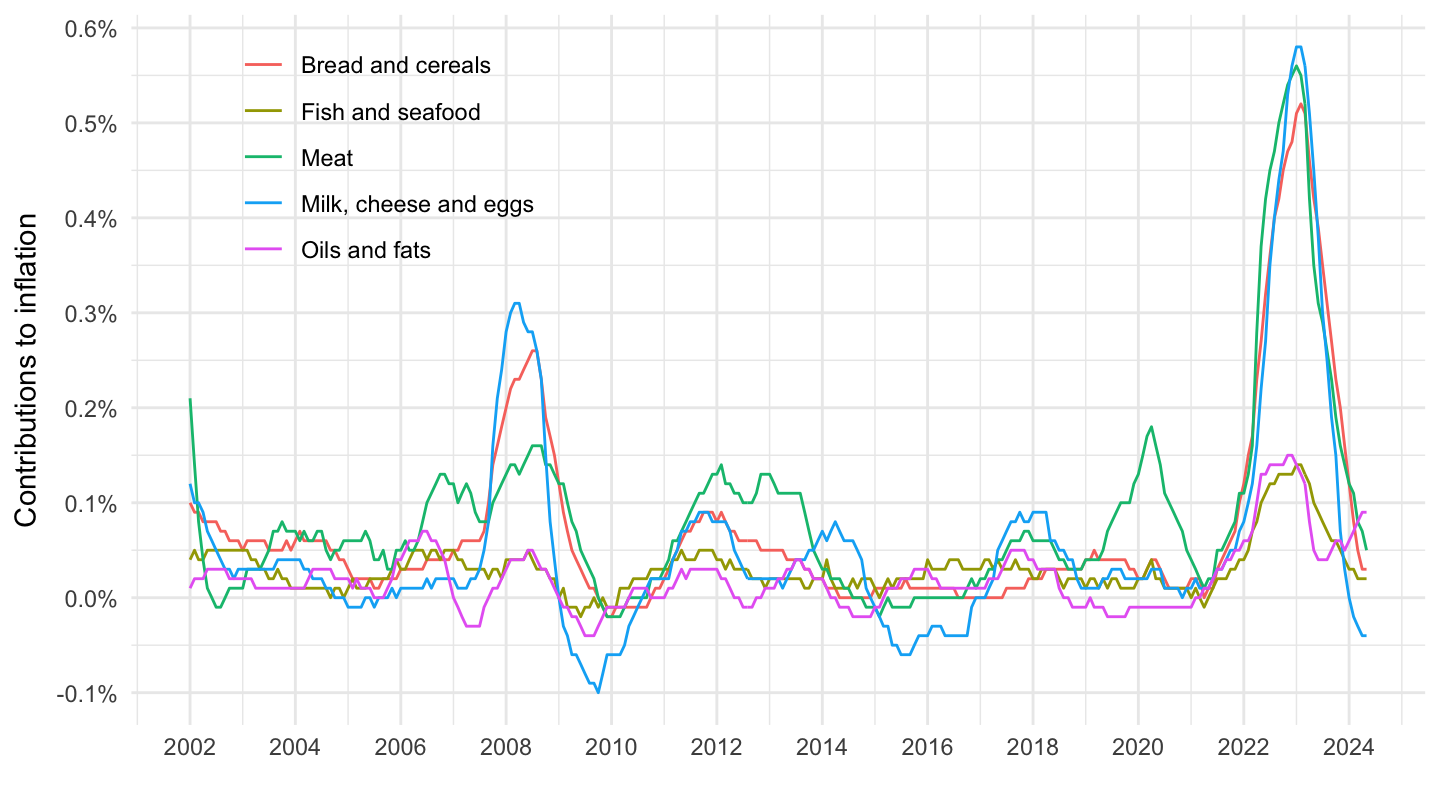
2017-
Code
prc_hicp_ctrb %>%
  filter(coicop %in% c("CP0111", "CP0112", "CP0113", "CP0114", "CP0115")) %>%
  month_to_date %>%
  filter(date >= as.Date("2017-01-01")) %>%

  ggplot + geom_line(aes(x = date, y = values/100, color = Coicop)) +
  theme_minimal() + xlab("") + ylab("Contributions to inflation") +
  scale_x_date(breaks ="1 year",
               labels = date_format("%Y")) +
  scale_y_continuous(breaks = 0.01*seq(-10, 30, 0.1),
                     labels = percent_format(accuracy = .1)) +
  theme(legend.position = c(0.3, 0.9),
        legend.title = element_blank())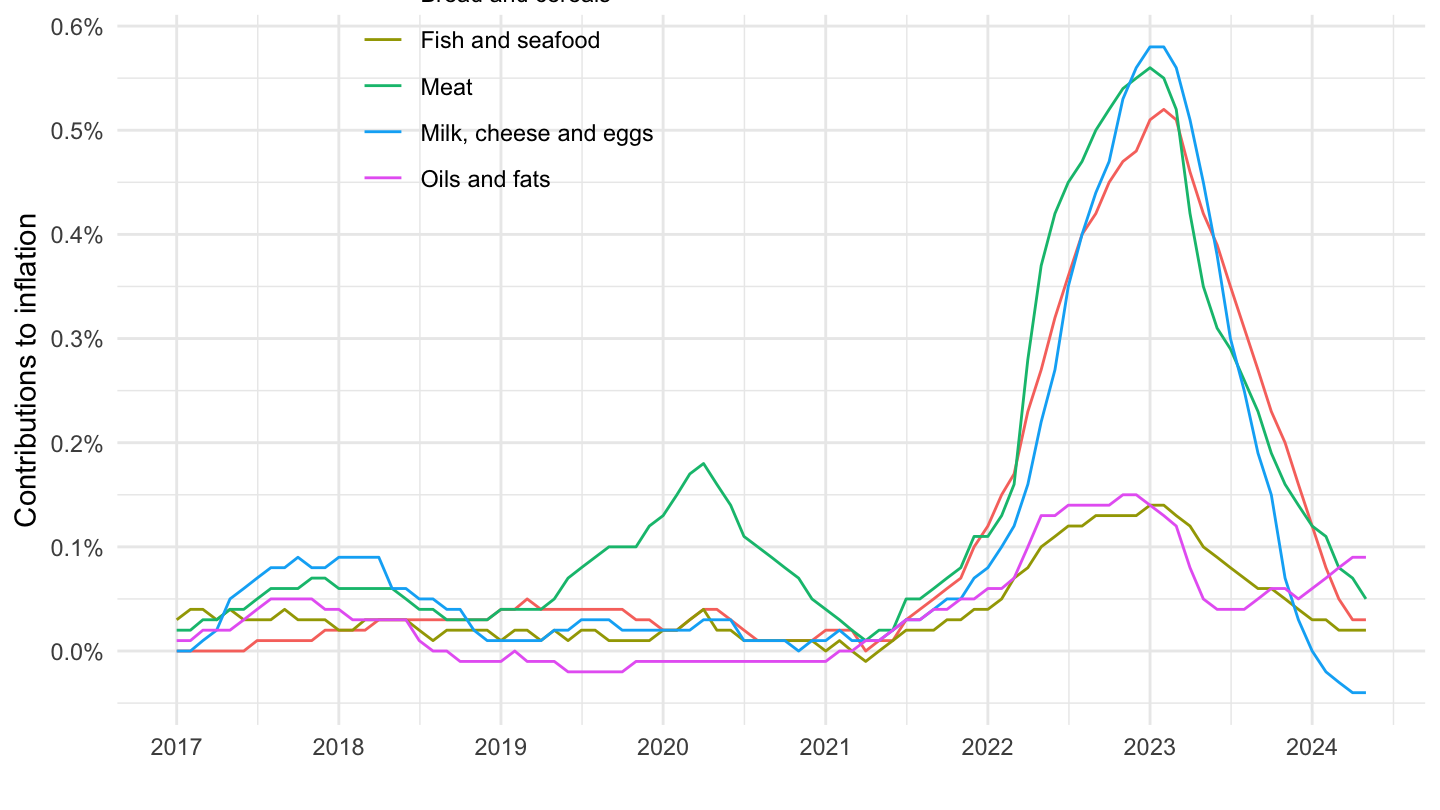
2020-
Code
prc_hicp_ctrb %>%
  filter(coicop %in% c("CP0111", "CP0112", "CP0113", "CP0114", "CP0115")) %>%
  month_to_date %>%

  filter(date >= as.Date("2020-01-01")) %>%
  ggplot + geom_line(aes(x = date, y = values/100, color = Coicop)) +
  theme_minimal() + xlab("") + ylab("Contributions to inflation") +
  scale_x_date(breaks = seq.Date(from = as.Date("2019-10-01"), to = as.Date("2100-10-01"), by = "6 months"),
               labels = date_format("%Y %b")) +
  scale_y_continuous(breaks = 0.01*seq(-10, 30, 0.1),
                     labels = percent_format(accuracy = .1)) +
  theme(legend.position = c(0.3, 0.7),
        legend.title = element_blank())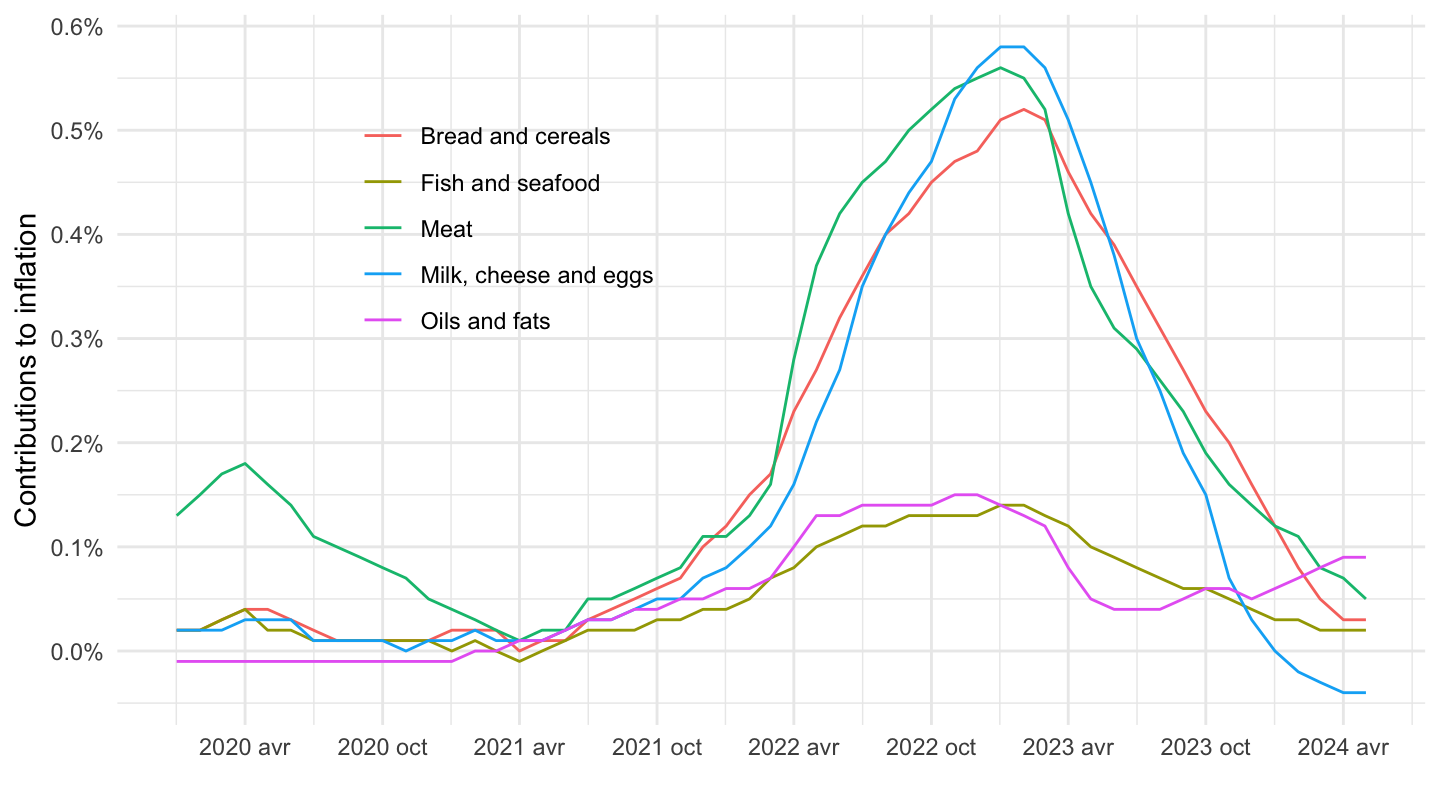
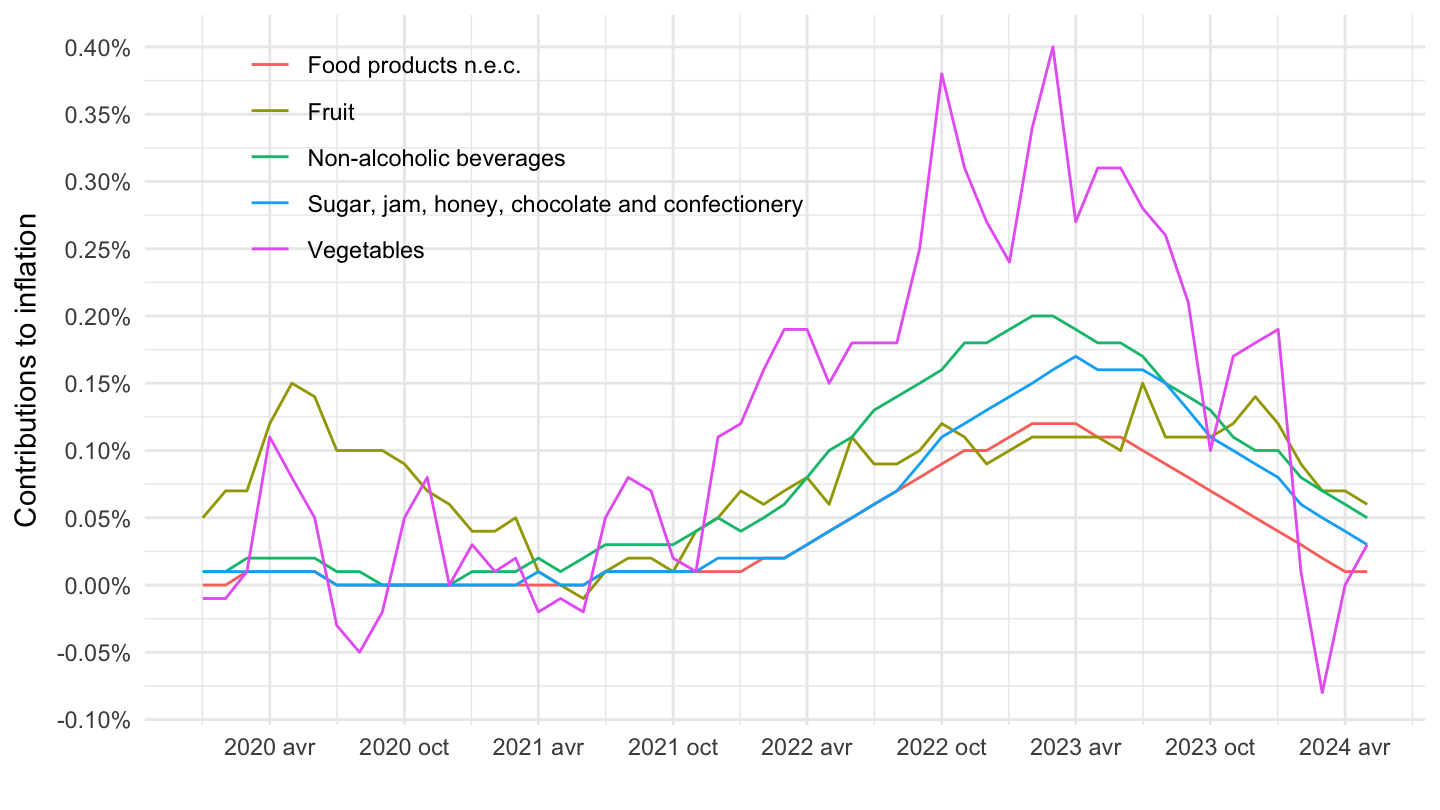
CP0116, CP0117, CP0118, CP0119, CP012
All
Code
prc_hicp_ctrb %>%
  filter(coicop %in% c("CP0116", "CP0117", "CP0118", "CP0119", "CP012")) %>%
  month_to_date %>%

  ggplot + geom_line(aes(x = date, y = values/100, color = Coicop)) +
  theme_minimal() + xlab("") + ylab("Contributions to inflation") +
  scale_x_date(breaks ="2 years",
               labels = date_format("%Y")) +
  scale_y_continuous(breaks = 0.01*seq(-10, 30, 0.1),
                     labels = percent_format(accuracy = .1)) +
  theme(legend.position = c(0.3, 0.8),
        legend.title = element_blank())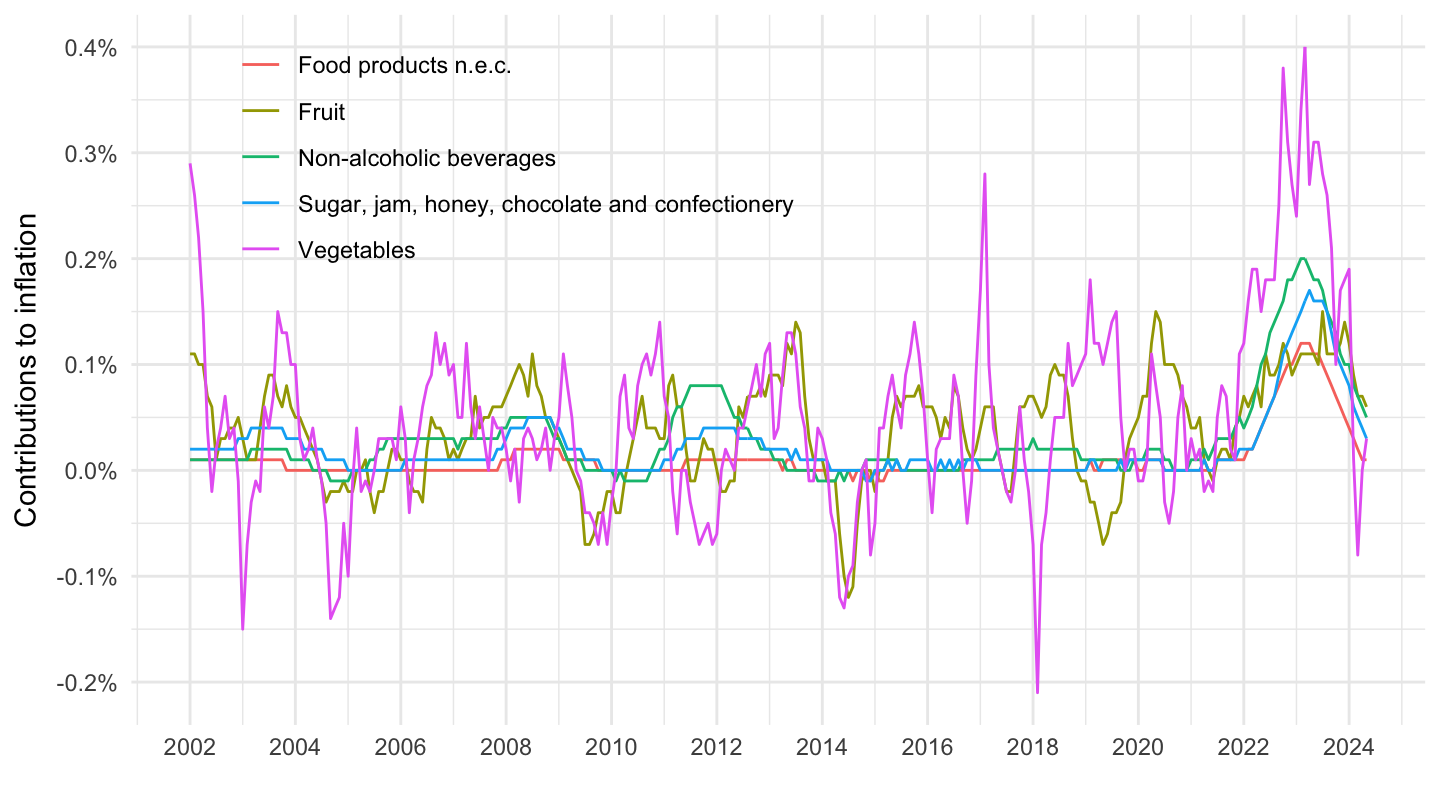
2017-
Code
prc_hicp_ctrb %>%
  filter(coicop %in% c("CP0116", "CP0117", "CP0118", "CP0119", "CP012")) %>%
  month_to_date %>%
  filter(date >= as.Date("2017-01-01")) %>%

  ggplot + geom_line(aes(x = date, y = values/100, color = Coicop)) +
  theme_minimal() + xlab("") + ylab("Contributions to inflation") +
  scale_x_date(breaks ="1 year",
               labels = date_format("%Y")) +
  scale_y_continuous(breaks = 0.01*seq(-10, 30, 0.1),
                     labels = percent_format(accuracy = .1)) +
  theme(legend.position = c(0.3, 0.8),
        legend.title = element_blank())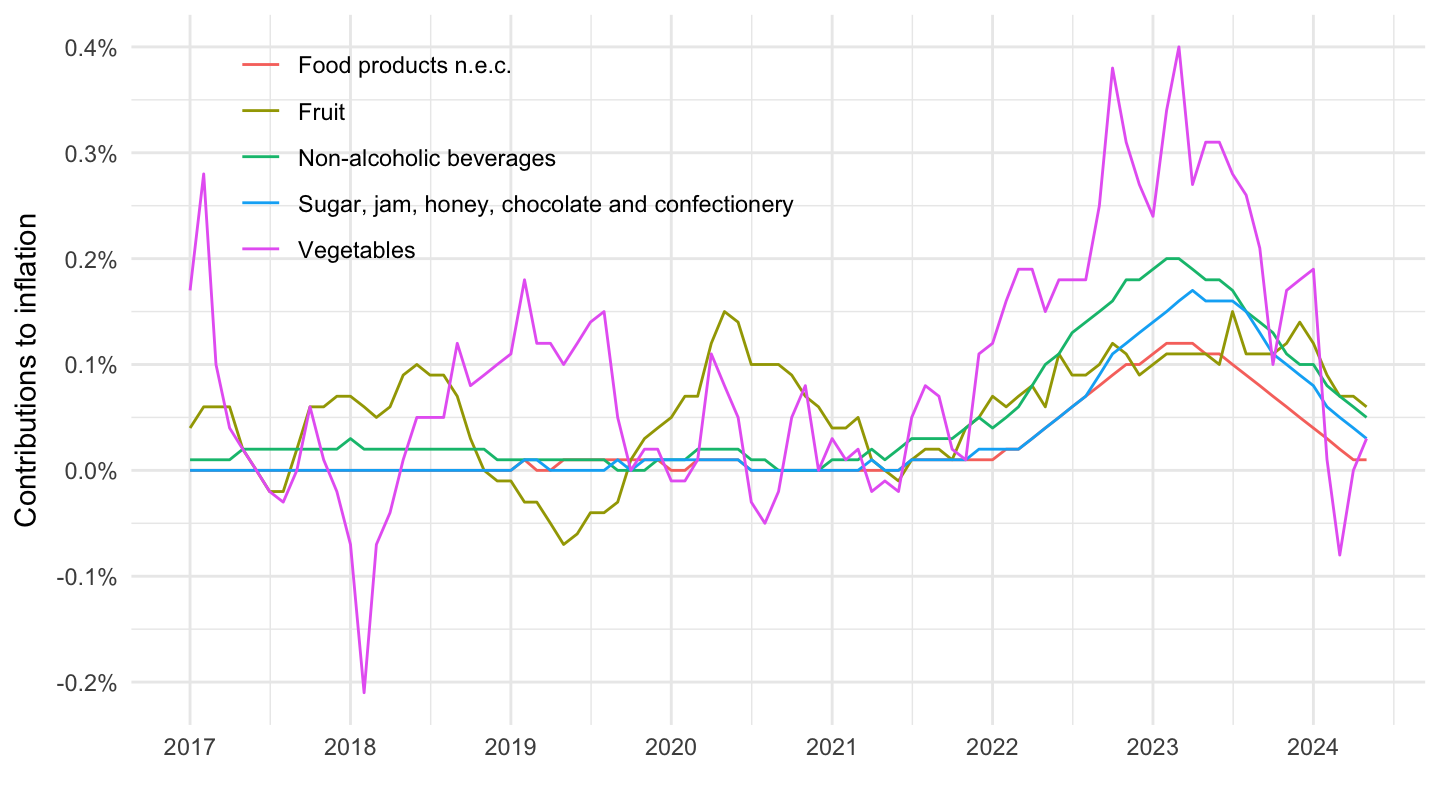
2020-
Code
prc_hicp_ctrb %>%
  filter(coicop %in% c("CP0116", "CP0117", "CP0118", "CP0119", "CP012")) %>%
  month_to_date %>%

  filter(date >= as.Date("2020-01-01")) %>%
  ggplot + geom_line(aes(x = date, y = values/100, color = Coicop)) +
  theme_minimal() + xlab("") + ylab("Contributions to inflation") +
  scale_x_date(breaks = seq.Date(from = as.Date("2019-10-01"), to = as.Date("2100-10-01"), by = "6 months"),
               labels = date_format("%Y %b")) +
  scale_y_continuous(breaks = 0.01*seq(-10, 30, 0.05),
                     labels = percent_format(accuracy = .01)) +
  theme(legend.position = c(0.3, 0.8),
        legend.title = element_blank())