| source | dataset | Title | .html | .rData |
|---|---|---|---|---|
| eurostat | prc_ppp_ind | Purchasing power parities (PPPs), price level indices and real expenditures for ESA 2010 aggregates | 2026-07-21 | 2026-07-21 |
| bis | CPI | Consumer Price Index | 2026-07-21 | 2026-07-21 |
| ecb | CES | Consumer Expectations Survey | 2026-07-21 | 2026-07-19 |
| eurostat | nama_10_co3_p3 | Final consumption expenditure of households by consumption purpose (COICOP 3 digit) | 2026-07-18 | 2026-07-21 |
| eurostat | prc_hicp_cow | HICP - country weights | 2026-07-21 | 2026-07-21 |
| eurostat | prc_hicp_ctrb | Contributions to euro area annual inflation (in percentage points) | 2026-07-21 | 2026-07-21 |
| eurostat | prc_hicp_inw | HICP - item weights | 2026-07-21 | 2026-07-21 |
| eurostat | prc_hicp_manr | HICP (2015 = 100) - monthly data (annual rate of change) | 2026-07-21 | 2026-07-21 |
| eurostat | prc_hicp_midx | HICP (2015 = 100) - monthly data (index) | 2026-07-21 | 2026-07-21 |
| eurostat | prc_hicp_mmor | HICP (2015 = 100) - monthly data (monthly rate of change) | 2026-07-21 | 2026-07-21 |
| eurostat | sts_inpp_m | Producer prices in industry, total - monthly data | 2026-07-21 | 2026-07-21 |
| eurostat | sts_inppd_m | Producer prices in industry, domestic market - monthly data | 2026-07-21 | 2026-07-21 |
| eurostat | sts_inppnd_m | Producer prices in industry, non domestic market - monthly data | 2026-07-21 | 2026-07-21 |
| fred | cpi | Consumer Price Index | 2026-07-22 | 2026-07-22 |
| fred | inflation | Inflation | 2026-07-22 | 2026-07-22 |
| imf | CPI | Consumer Price Index (CPI) 2026 February - CPI_2026_FEB_VINTAGE | 2026-07-21 | 2026-04-13 |
| oecd | MEI_PRICES_PPI | Producer Prices - MEI_PRICES_PPI | 2026-07-21 | 2024-04-15 |
| oecd | PPP2017 | 2017 PPP Benchmark results | 2024-04-16 | 2023-07-25 |
| oecd | PRICES_CPI | Consumer price indices (CPIs) | 2024-04-16 | 2024-04-15 |
| wdi | FP.CPI.TOTL.ZG | Inflation, consumer prices (annual %) | 2026-07-21 | 2026-07-21 |
| wdi | NY.GDP.DEFL.KD.ZG | Inflation, GDP deflator (annual %) | 2026-07-21 | 2026-07-21 |
Purchasing power parities (PPPs), price level indices and real expenditures for ESA 2010 aggregates
Data - Eurostat
Info
Data on inflation
LAST_COMPILE
| LAST_COMPILE |
|---|
| 2026-07-22 |
Last
Code
prc_ppp_ind %>%
  group_by(time) %>%
  summarise(Nobs = n()) %>%
  arrange(desc(time)) %>%
  head(1) %>%
print_table_conditional()| time | Nobs |
|---|---|
| 2024 | 20968 |
What’s PPP ?
PPPs are nothing more than price relatives that show the ratio of the prices in national currencies of the same good or service in different countries. For example, if the price of a litre of Coca Cola is 2.30 euros in France and 2.00 dollars in the United States, then the PPP for Coca Cola between France and the United States is the ratio 2.30 euros to 2.00 dollars or 1.15 euros to the dollar. This means that for every dollar spent on Coca Cola in the United States, 1.15 euros would have to be spent in France to obtain the same quantity and quality – or, in other words, the same volume - of Coca Cola.
Eurostat Website
Actual individual consumption per capita
Code
include_graphics("https://ec.europa.eu/eurostat/documents/4187653/11581511/Map+AIC+per+capita+2020.jpg/fbd93f3e-ebe8-29bc-8cd3-8d790990ca30?t=1624002507913")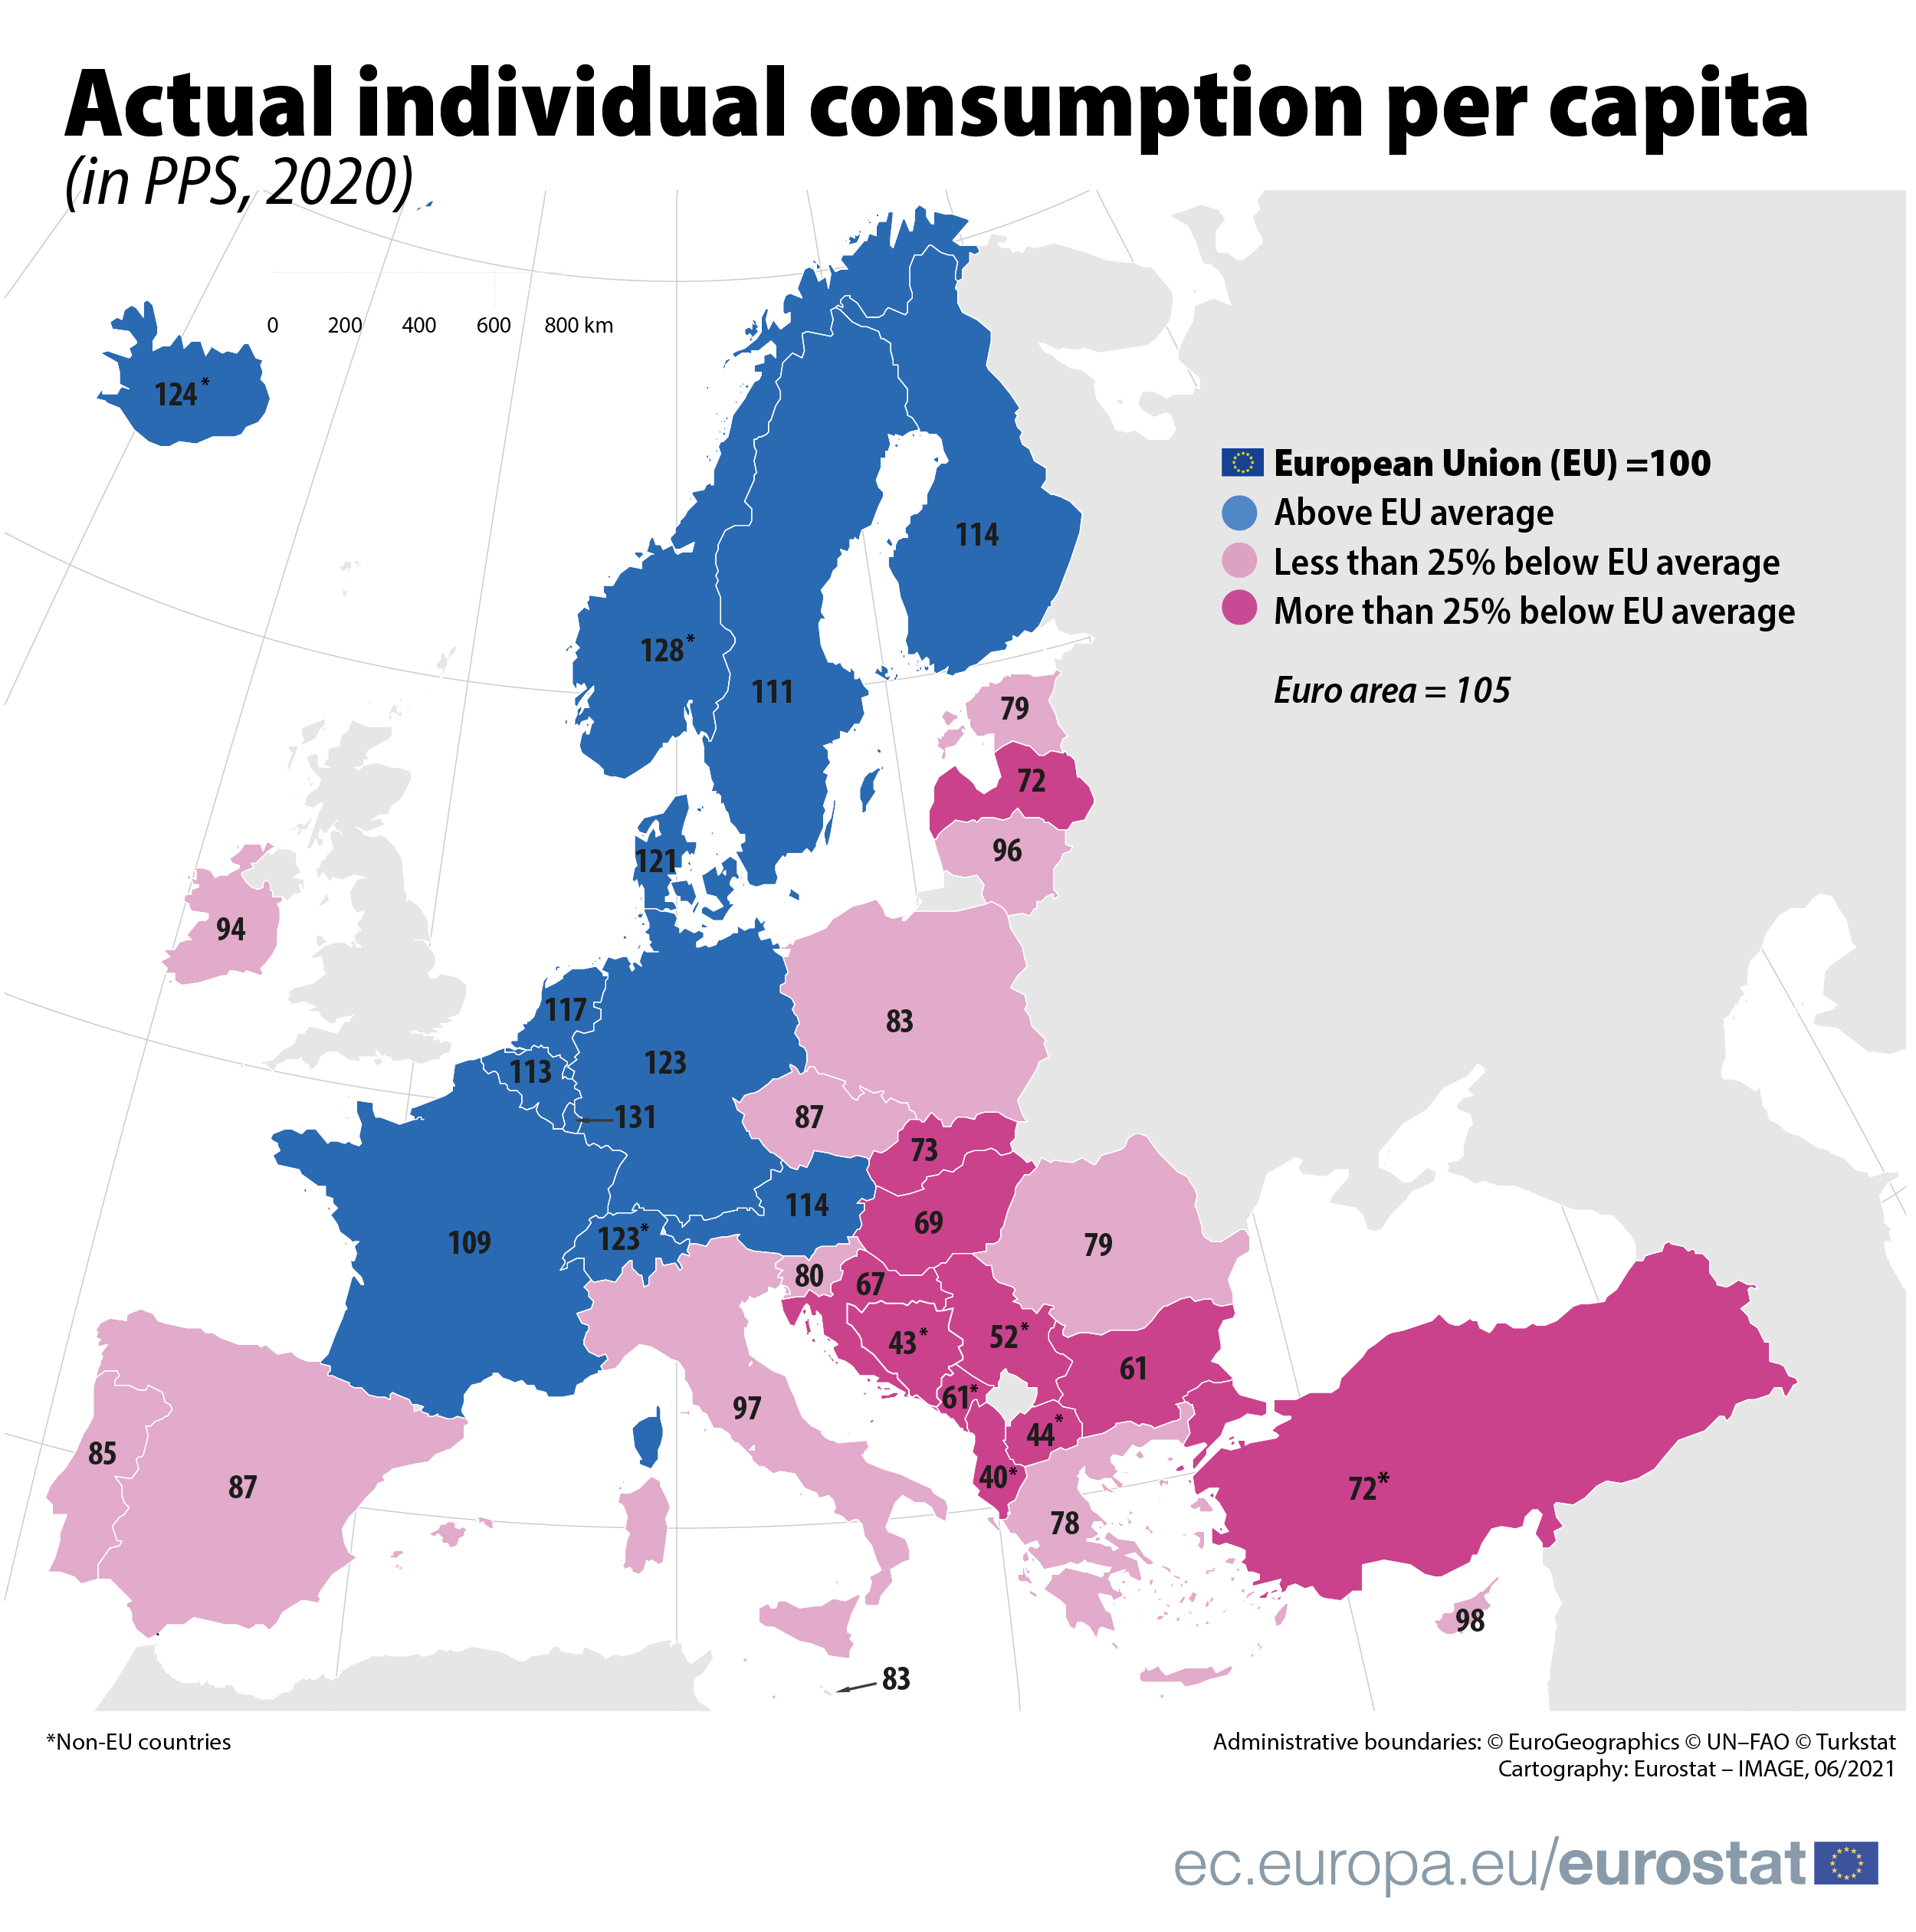
Volume indices of AIC and GDP per capita
Code
include_graphics("https://ec.europa.eu/eurostat/documents/4187653/11581511/AIC+GDP+per+capita+2020.jpg/c1f554b3-807e-d0b7-1337-333e3eef5d17?t=1624002507551")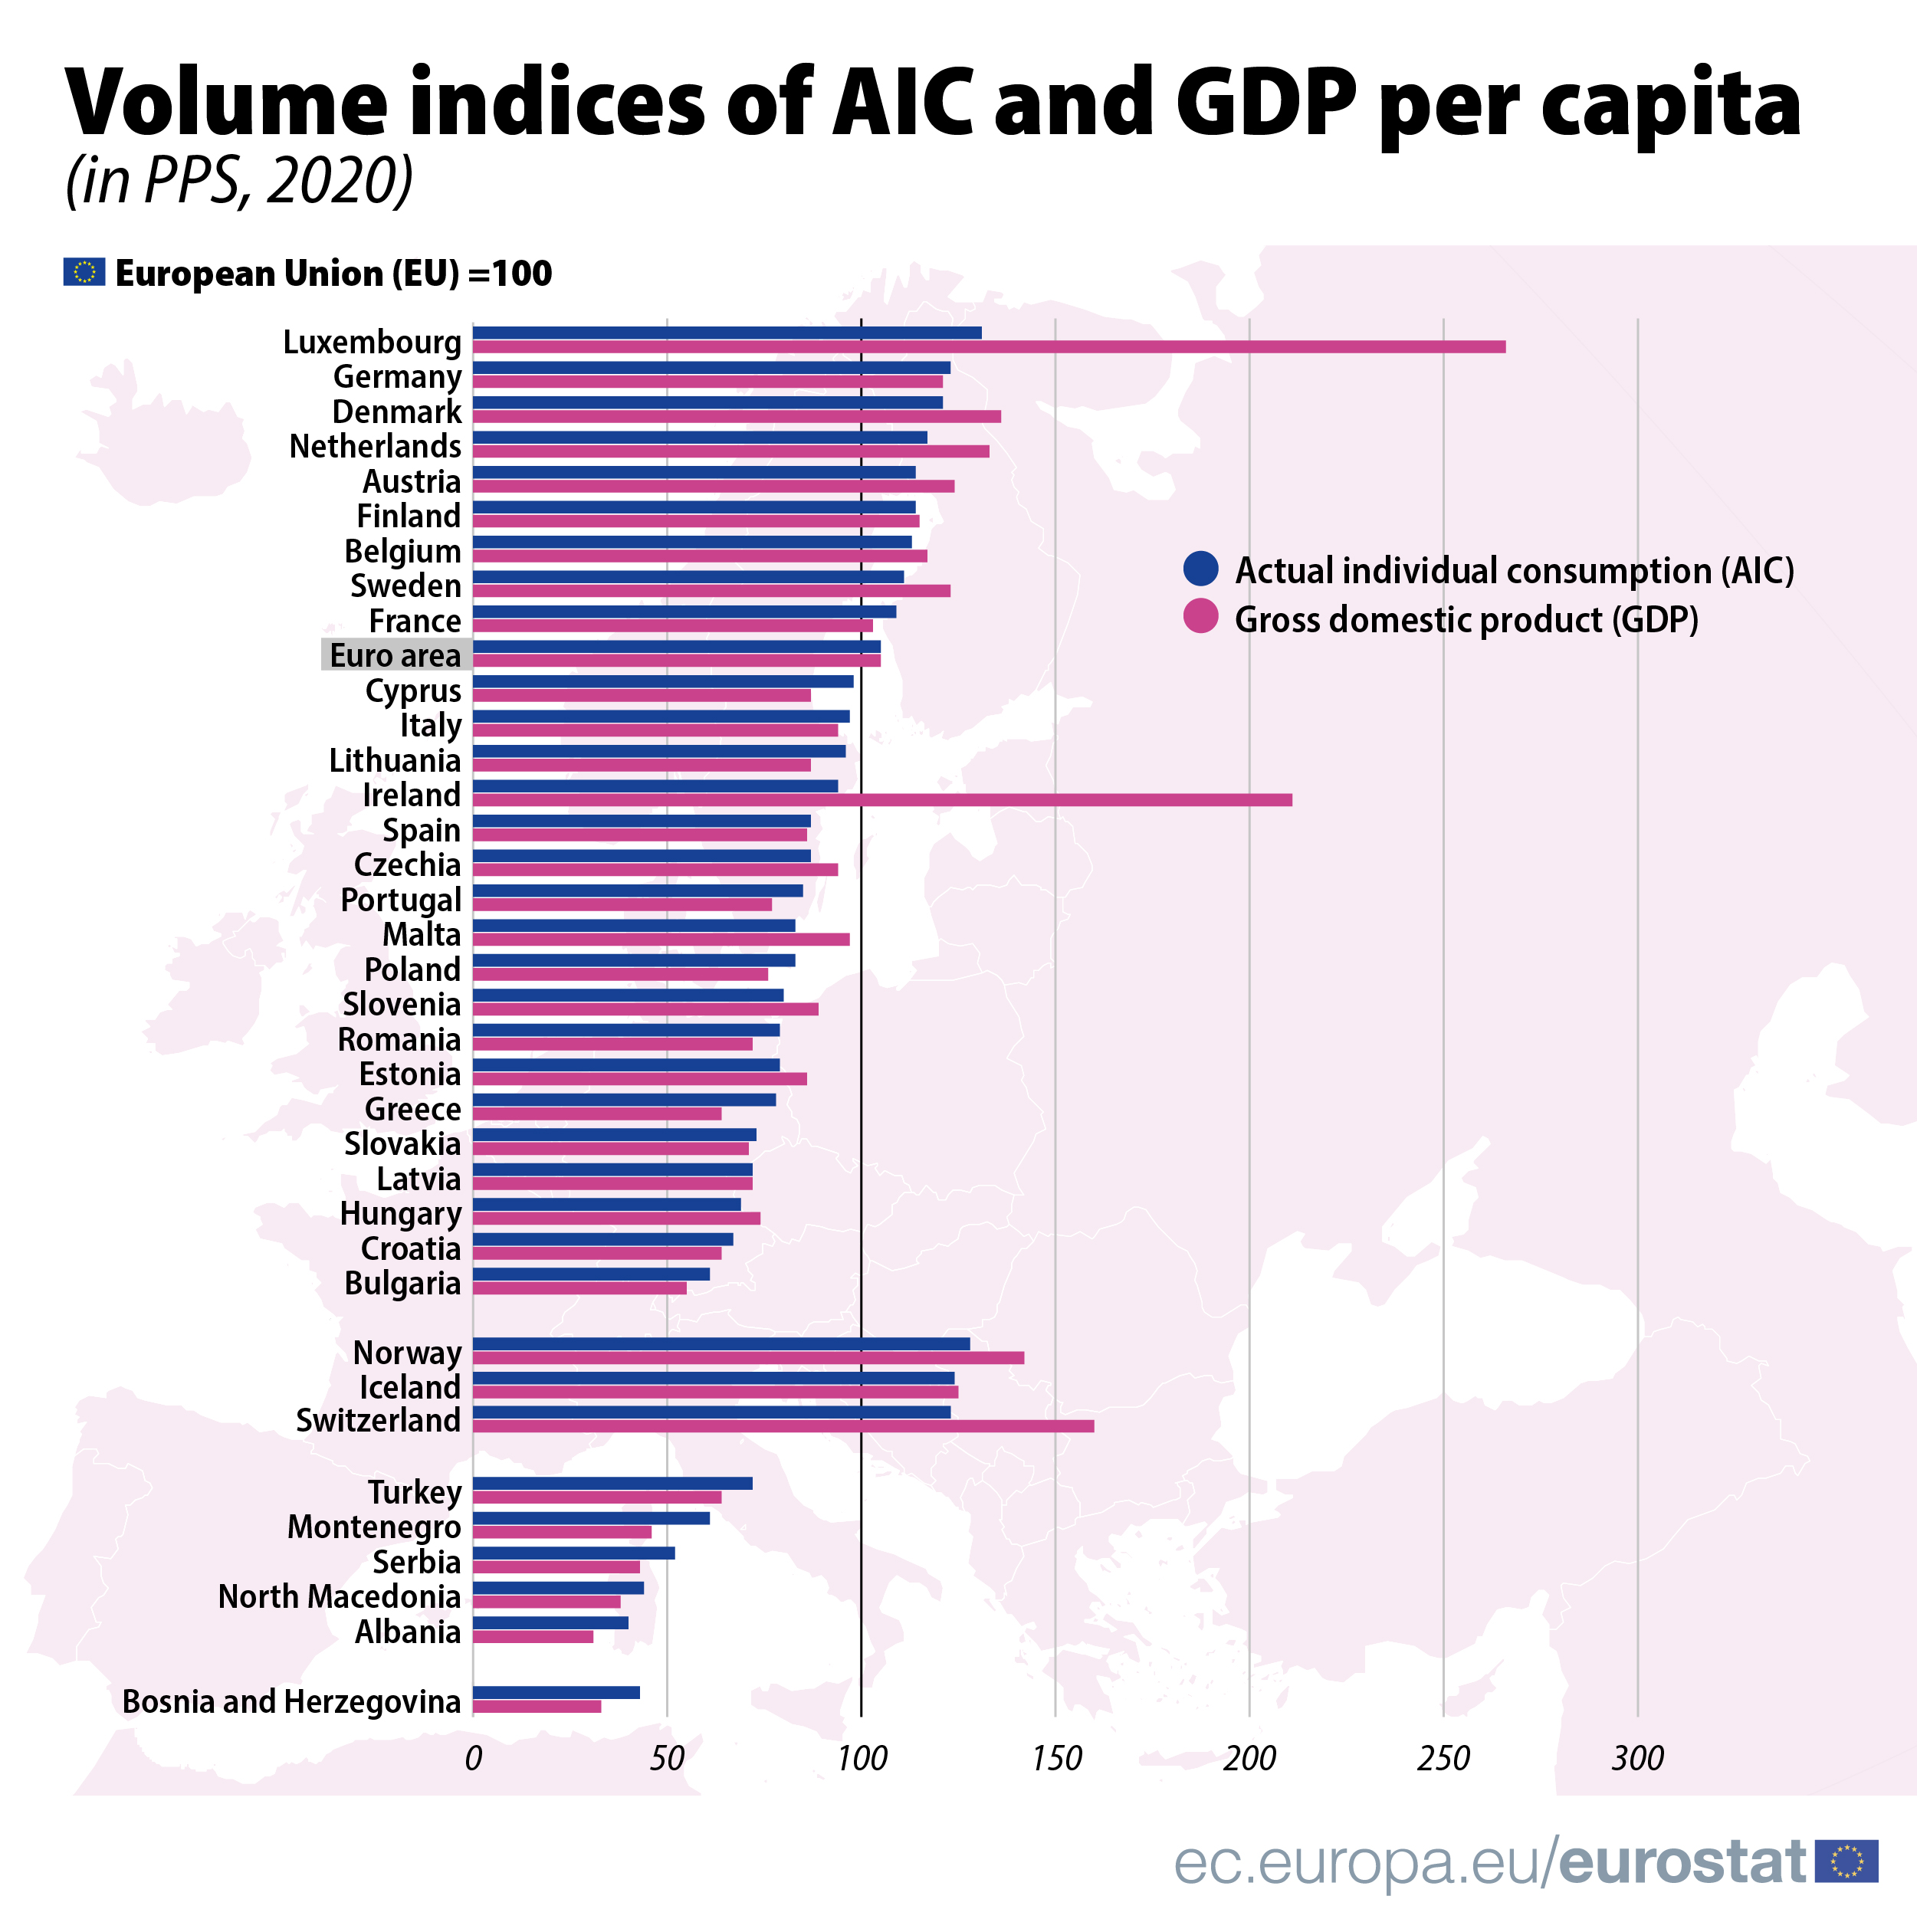
na_item
Code
prc_ppp_ind %>%
  left_join(na_item, by = "na_item") %>%
  group_by(na_item, Na_item) %>%
  summarise(Nobs = n()) %>%
  arrange(-Nobs) %>%
print_table_conditional()| na_item | Na_item | Nobs |
|---|---|---|
| PPP_EU15 | Purchasing power parities (EU15=1) | 72588 |
| PLI_EU15 | Price level indices (EU15=100) | 72471 |
| PPP_EU27_2020 | Purchasing power parities (EU27_2020=1) | 69419 |
| PLI_EU27_2020 | Price level indices (EU27_2020=100) | 69388 |
| PPP_EU27_2007 | Purchasing power parities (EU27_2007=1) | 67716 |
| PLI_EU27_2007 | Price level indices (EU27_2007=100) | 67662 |
| EXP_NAC | Nominal expenditure in national currency | 63899 |
| EXP_EUR_HAB | Nominal expenditure per inhabitant (in euro) | 63895 |
| EXP_EUR | Nominal expenditure (in euro) | 63847 |
| EXP_NAC_PC_GDP | Nominal expenditure as a percentage of GDP (GDP=100) | 63847 |
| PPP_EU28 | Purchasing power parities (EU28=1) | 57844 |
| PLI_EU28 | Price level indices (EU28=100) | 57832 |
| EXP_PPS_EU15_HAB | Real expenditure per capita (in PPS_EU15) | 55259 |
| VI_PPS_EU15_HAB | Volume indices of real expenditure per capita (in PPS_EU15=100) | 55185 |
| EXP_PPS_EU15 | Real expenditure (in PPS_EU15) | 55133 |
| EXP_PPS_EU27_2020 | Real expenditure (in PPS_EU27_2020) | 52879 |
| VI_PPS_EU27_2020_HAB | Volume indices of real expenditure per capita (in PPS_EU27_2020=100) | 52837 |
| EXP_PPS_EU27_2020_HAB | Real expenditure per capita (in PPS_EU27_2020) | 52738 |
| EXP_PPS_EU27_2007_HAB | Real expenditure per capita (in PPS_EU27_2007) | 51648 |
| VI_PPS_EU27_2007_HAB | Volume indices of real expenditure per capita (in PPS_EU27_2007=100) | 51573 |
| EXP_PPS_EU27_2007 | Real expenditure (in PPS_EU27_2007) | 51521 |
| VI_PPS_EU28_HAB | Volume indices of real expenditure per capita (in PPS_EU28=100) | 44165 |
| EXP_PPS_EU28 | Real expenditure (in PPS_EU28) | 44113 |
| EXP_PPS_EU28_HAB | Real expenditure per capita (in PPS_EU28) | 44113 |
ppp_cat
Code
prc_ppp_ind %>%
  left_join(ppp_cat, by = "ppp_cat") %>%
  group_by(ppp_cat, Ppp_cat) %>%
  summarise(Nobs = n()) %>%
  print_table_conditional()
geo
Code
prc_ppp_ind %>%
  left_join(geo, by = "geo") %>%
  group_by(geo, Geo) %>%
  summarise(Nobs = n()) %>%
  arrange(-Nobs) %>%
  mutate(Geo = ifelse(geo == "DE", "Germany", Geo)) %>%
  mutate(Flag = gsub(" ", "-", str_to_lower(Geo)),
         Flag = paste0('<img src="../../bib/flags/vsmall/', Flag, '.png" alt="Flag">')) %>%
  select(Flag, everything()) %>%
  {if (is_html_output()) datatable(., filter = 'top', rownames = F, escape = F) else .}
time
Code
prc_ppp_ind %>%
  group_by(time) %>%
  summarise(Nobs = n()) %>%
print_table_conditional()| time | Nobs |
|---|---|
| 1995 | 12204 |
| 1996 | 12183 |
| 1997 | 12318 |
| 1998 | 12327 |
| 1999 | 31969 |
| 2000 | 32109 |
| 2001 | 32361 |
| 2002 | 32109 |
| 2003 | 58733 |
| 2004 | 58733 |
| 2005 | 63244 |
| 2006 | 63792 |
| 2007 | 63382 |
| 2008 | 63382 |
| 2009 | 63382 |
| 2010 | 63792 |
| 2011 | 63792 |
| 2012 | 63792 |
| 2013 | 64135 |
| 2014 | 64197 |
| 2015 | 64197 |
| 2016 | 64197 |
| 2017 | 64197 |
| 2018 | 64250 |
| 2019 | 64196 |
| 2020 | 64316 |
| 2021 | 21136 |
| 2022 | 21230 |
| 2023 | 20949 |
| 2024 | 20968 |
Germany, France, Italy
GDP - Gross domestic product
Code
prc_ppp_ind %>%
  filter(ppp_cat == "GDP",
         geo %in% c("FR", "DE", "IT"),
         na_item == "PPP_EU27_2020") %>%
  year_to_date %>%
  left_join(geo, by = "geo") %>%
  left_join(colors, by = c("Geo" = "country")) %>%
  ggplot + geom_line(aes(x = date, y = values, color = color)) +
  scale_color_identity() + theme_minimal()  + add_3flags +
  scale_x_date(breaks = as.Date(paste0(seq(1960, 2100, 2), "-01-01")),
               labels = date_format("%Y")) +
  xlab("") + ylab("") +
  scale_y_continuous(breaks = seq(0, 4000, .05))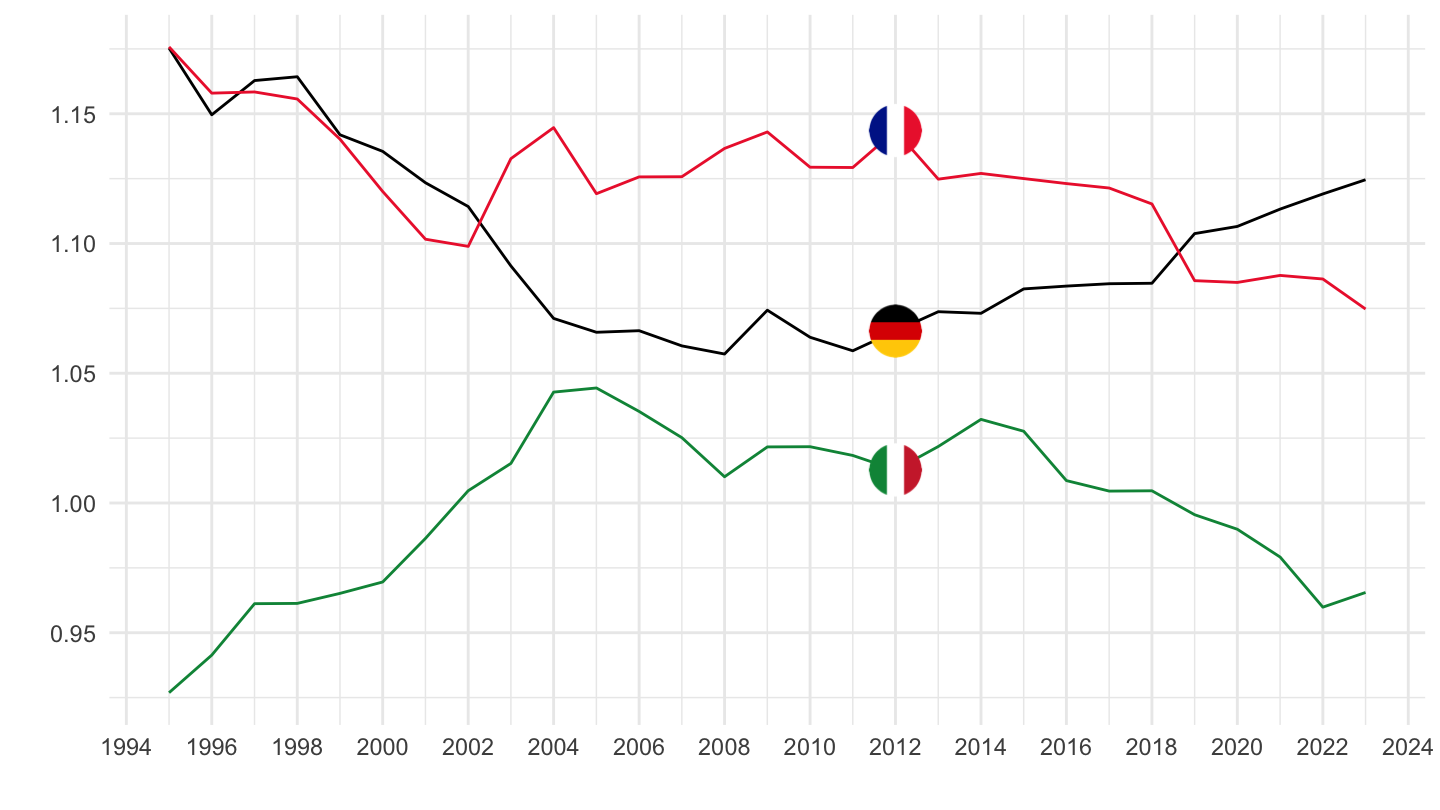
E01 - Final consumption expenditure
Code
prc_ppp_ind %>%
  filter(ppp_cat == "E01",
         geo %in% c("FR", "DE", "IT"),
         na_item == "PPP_EU27_2020") %>%
  year_to_date %>%
  left_join(geo, by = "geo") %>%
  left_join(colors, by = c("Geo" = "country")) %>%
  ggplot + geom_line(aes(x = date, y = values, color = color)) +
  scale_color_identity() + theme_minimal()  + add_3flags +
  scale_x_date(breaks = as.Date(paste0(seq(1960, 2100, 2), "-01-01")),
               labels = date_format("%Y")) +
  xlab("") + ylab("") +
  scale_y_continuous(breaks = seq(0, 4000, .05))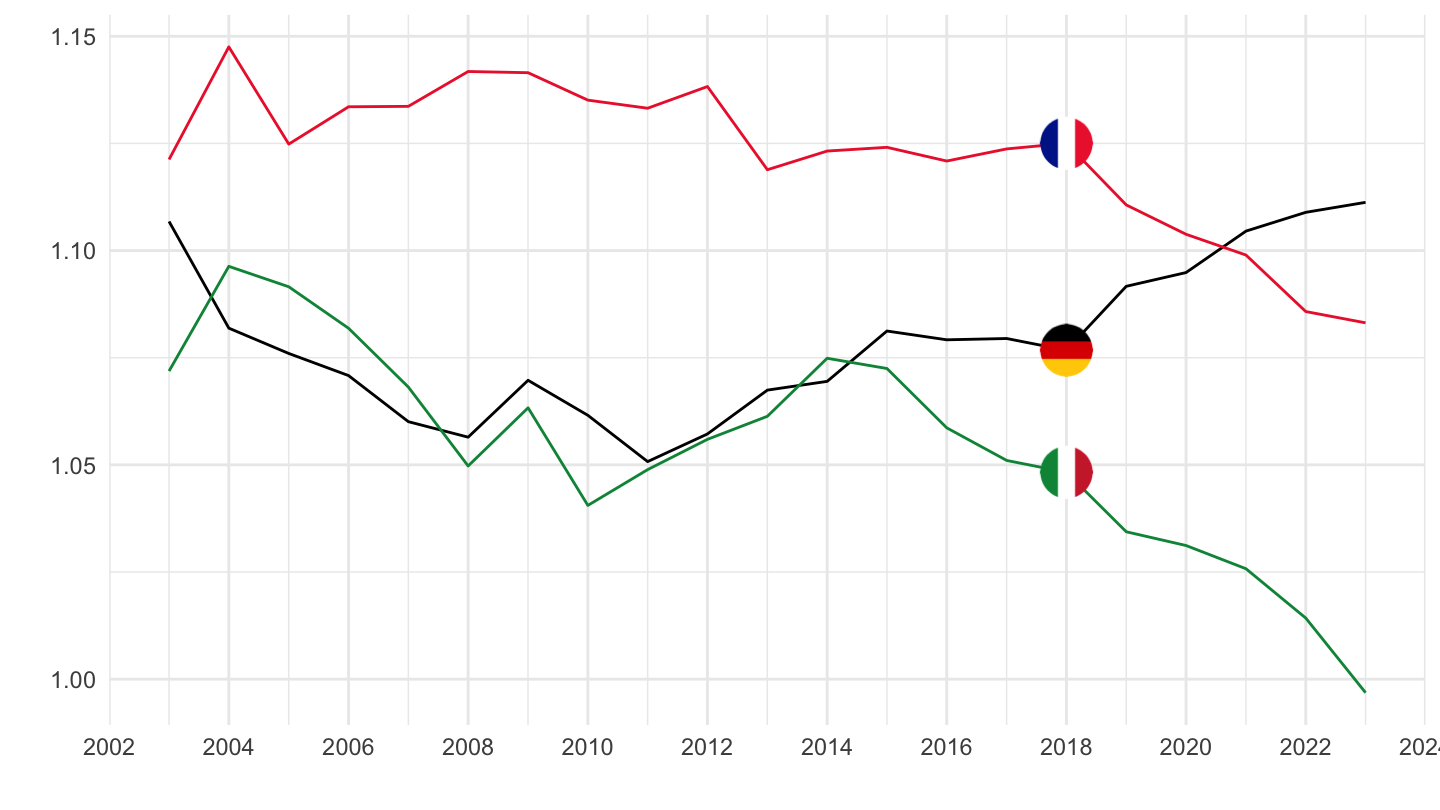
E011 - Household final consumption expenditure
Code
prc_ppp_ind %>%
  filter(ppp_cat == "E011",
         geo %in% c("FR", "DE", "IT"),
         na_item == "PPP_EU27_2020") %>%
  year_to_date %>%
  left_join(geo, by = "geo") %>%
  left_join(colors, by = c("Geo" = "country")) %>%
  ggplot + geom_line(aes(x = date, y = values, color = color)) +
  scale_color_identity() + theme_minimal()  + add_3flags +
  scale_x_date(breaks = as.Date(paste0(seq(1960, 2100, 2), "-01-01")),
               labels = date_format("%Y")) +
  xlab("") + ylab("") +
  scale_y_continuous(breaks = seq(0, 4000, .05))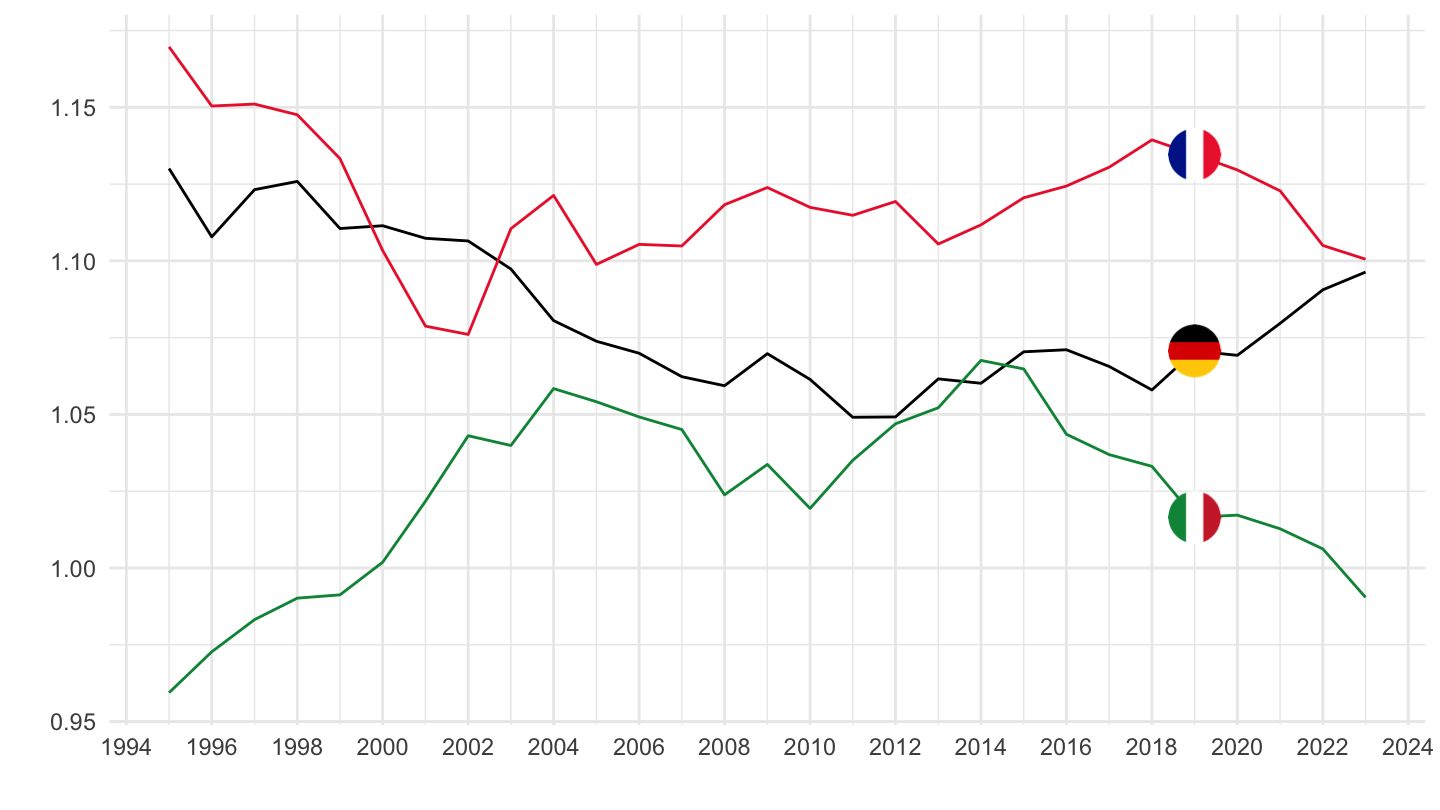
A01 - Actual individual consumption
Code
prc_ppp_ind %>%
  filter(ppp_cat == "A01",
         geo %in% c("FR", "DE", "IT"),
         na_item == "PPP_EU27_2020") %>%
  year_to_date %>%
  left_join(geo, by = "geo") %>%
  left_join(colors, by = c("Geo" = "country")) %>%
  ggplot + geom_line(aes(x = date, y = values, color = color)) +
  scale_color_identity() + theme_minimal()  + add_3flags +
  scale_x_date(breaks = as.Date(paste0(seq(1960, 2100, 2), "-01-01")),
               labels = date_format("%Y")) +
  xlab("") + ylab("") +
  scale_y_continuous(breaks = seq(0, 4000, .05))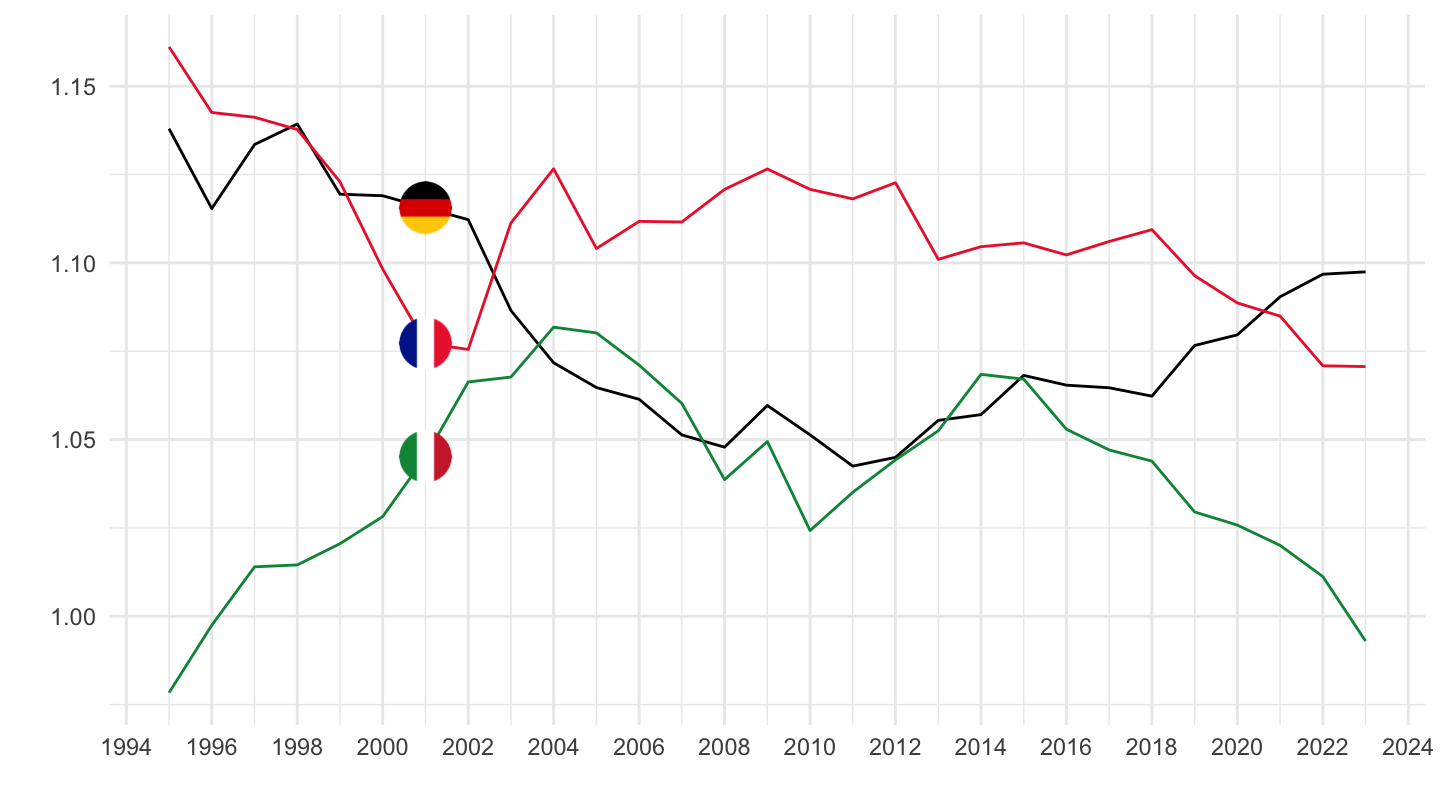
A010405 -
Germany, France, Italy
PPP_EU27_2020
Code
prc_ppp_ind %>%
  filter(ppp_cat == "A010405",
         geo %in% c("FR", "DE", "IT"),
         na_item == "PPP_EU27_2020") %>%
  year_to_date %>%
  left_join(geo, by = "geo") %>%
  left_join(colors, by = c("Geo" = "country")) %>%
  ggplot + geom_line(aes(x = date, y = values, color = color)) +
  scale_color_identity() + theme_minimal()  + add_3flags +
  scale_x_date(breaks = as.Date(paste0(seq(1960, 2100, 2), "-01-01")),
               labels = date_format("%Y")) +
  xlab("") + ylab("") +
  scale_y_continuous(breaks = seq(0, 4000, .05))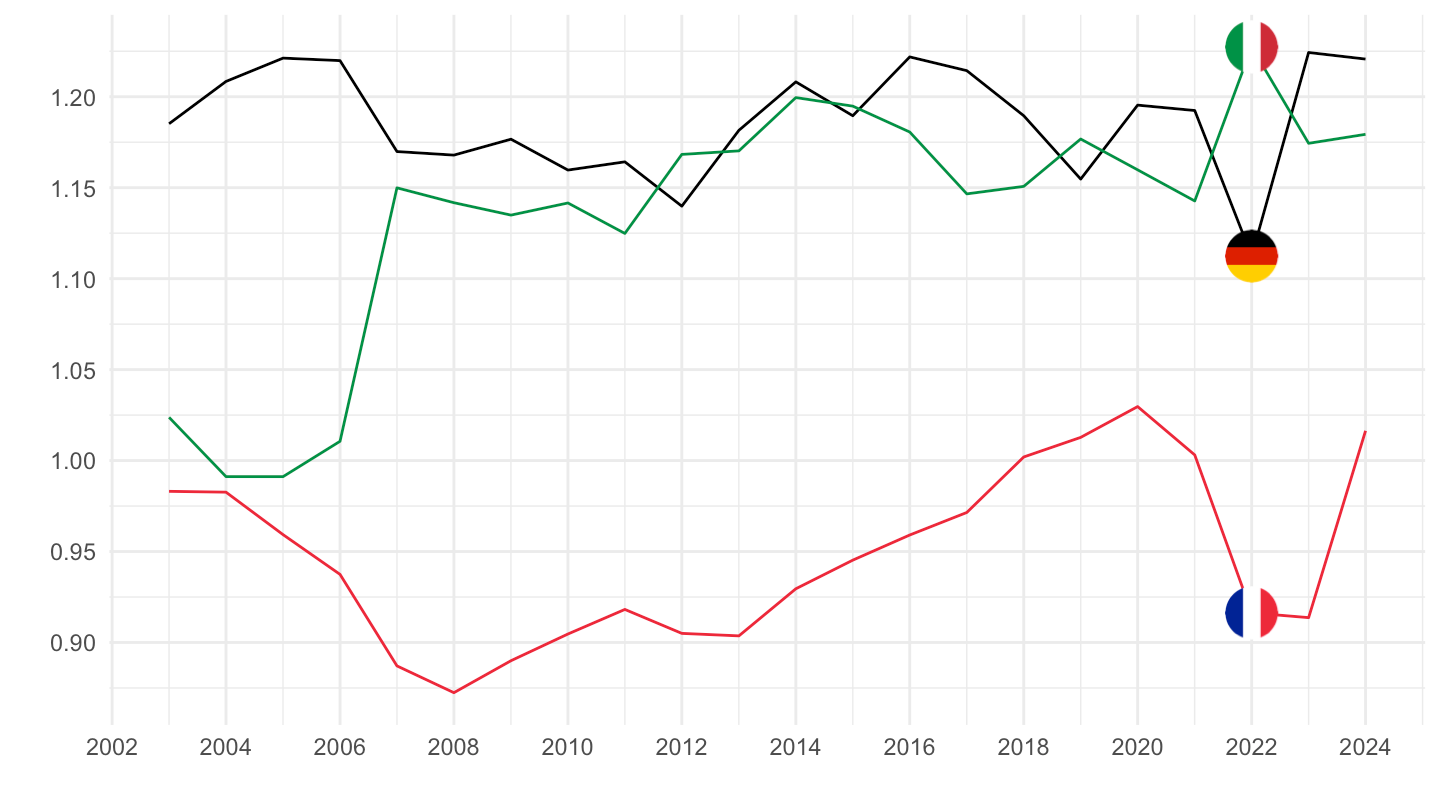
PLI_EU28
Code
prc_ppp_ind %>%
  filter(ppp_cat == "A010405",
         geo %in% c("FR", "DE", "IT"),
         na_item == "PLI_EU28") %>%
  year_to_date %>%
  left_join(geo, by = "geo") %>%
  left_join(colors, by = c("Geo" = "country")) %>%
  ggplot + geom_line(aes(x = date, y = values, color = color)) +
  scale_color_identity() + theme_minimal()  + add_3flags +
  scale_x_date(breaks = as.Date(paste0(seq(1960, 2100, 2), "-01-01")),
               labels = date_format("%Y")) +
  xlab("") + ylab("") +
  scale_y_continuous(breaks = seq(0, 4000, 5))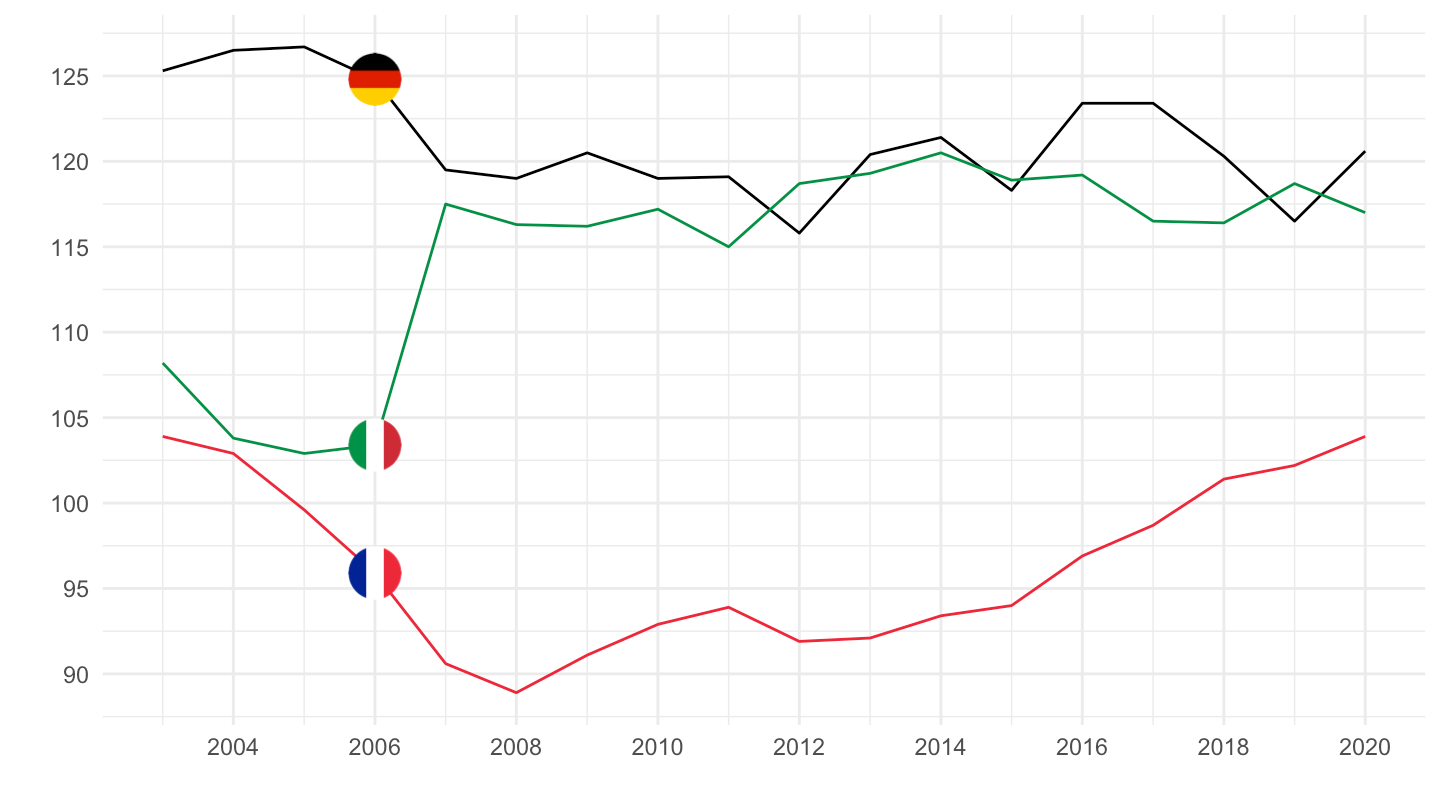
Housing, water, electricity, gas and other fuels - A0104
France
Code
prc_ppp_ind %>%
  filter(ppp_cat == "A0104",
         geo %in% c("FR")) %>%
  left_join(na_item, by = "na_item") %>%
  group_by(na_item, Na_item) %>%
  summarise(Nobs = n(),
            first = first(time),
            last = last(time)) %>%
print_table_conditional()| na_item | Na_item | Nobs | first | last |
|---|---|---|---|---|
| EXP_EUR | Nominal expenditure (in euro) | 30 | 1995 | 2024 |
| EXP_EUR_HAB | Nominal expenditure per inhabitant (in euro) | 30 | 1995 | 2024 |
| EXP_NAC | Nominal expenditure in national currency | 30 | 1995 | 2024 |
| EXP_NAC_PC_GDP | Nominal expenditure as a percentage of GDP (GDP=100) | 30 | 1995 | 2024 |
| EXP_PPS_EU15 | Real expenditure (in PPS_EU15) | 26 | 1995 | 2020 |
| EXP_PPS_EU15_HAB | Real expenditure per capita (in PPS_EU15) | 26 | 1995 | 2020 |
| EXP_PPS_EU27_2007 | Real expenditure (in PPS_EU27_2007) | 22 | 1999 | 2020 |
| EXP_PPS_EU27_2007_HAB | Real expenditure per capita (in PPS_EU27_2007) | 22 | 1999 | 2020 |
| EXP_PPS_EU27_2020 | Real expenditure (in PPS_EU27_2020) | 22 | 2003 | 2024 |
| EXP_PPS_EU27_2020_HAB | Real expenditure per capita (in PPS_EU27_2020) | 22 | 2003 | 2024 |
| EXP_PPS_EU28 | Real expenditure (in PPS_EU28) | 18 | 2003 | 2020 |
| EXP_PPS_EU28_HAB | Real expenditure per capita (in PPS_EU28) | 18 | 2003 | 2020 |
| PLI_EU15 | Price level indices (EU15=100) | 26 | 1995 | 2020 |
| PLI_EU27_2007 | Price level indices (EU27_2007=100) | 22 | 1999 | 2020 |
| PLI_EU27_2020 | Price level indices (EU27_2020=100) | 22 | 2003 | 2024 |
| PLI_EU28 | Price level indices (EU28=100) | 18 | 2003 | 2020 |
| PPP_EU15 | Purchasing power parities (EU15=1) | 26 | 1995 | 2020 |
| PPP_EU27_2007 | Purchasing power parities (EU27_2007=1) | 22 | 1999 | 2020 |
| PPP_EU27_2020 | Purchasing power parities (EU27_2020=1) | 22 | 2003 | 2024 |
| PPP_EU28 | Purchasing power parities (EU28=1) | 18 | 2003 | 2020 |
| VI_PPS_EU15_HAB | Volume indices of real expenditure per capita (in PPS_EU15=100) | 26 | 1995 | 2020 |
| VI_PPS_EU27_2007_HAB | Volume indices of real expenditure per capita (in PPS_EU27_2007=100) | 22 | 1999 | 2020 |
| VI_PPS_EU27_2020_HAB | Volume indices of real expenditure per capita (in PPS_EU27_2020=100) | 22 | 2003 | 2024 |
| VI_PPS_EU28_HAB | Volume indices of real expenditure per capita (in PPS_EU28=100) | 18 | 2003 | 2020 |
2019
Code
prc_ppp_ind %>%
  filter(ppp_cat == "A0104",
         time == "2019",
         geo %in% c("FR", "DE", "IT")) %>%
  select(na_item, geo, values) %>%
  left_join(na_item, by = "na_item") %>%
  spread(geo, values) %>%
print_table_conditional()| na_item | Na_item | DE | FR | IT |
|---|---|---|---|---|
| EXP_EUR | Nominal expenditure (in euro) | 4.23638e+05 | 3.51945e+05 | 2.45174e+05 |
| EXP_EUR_HAB | Nominal expenditure per inhabitant (in euro) | 5.09800e+03 | 5.22200e+03 | 4.10500e+03 |
| EXP_NAC | Nominal expenditure in national currency | 4.23638e+05 | 3.51945e+05 | 2.45174e+05 |
| EXP_NAC_PC_GDP | Nominal expenditure as a percentage of GDP (GDP=100) | 1.20000e+01 | 1.45000e+01 | 1.36000e+01 |
| EXP_PPS_EU15 | Real expenditure (in PPS_EU15) | 4.44869e+05 | 3.51894e+05 | 3.01783e+05 |
| EXP_PPS_EU15_HAB | Real expenditure per capita (in PPS_EU15) | 5.40000e+03 | 5.20000e+03 | 5.10000e+03 |
| EXP_PPS_EU27_2007 | Real expenditure (in PPS_EU27_2007) | 3.98668e+05 | 3.15349e+05 | 2.70442e+05 |
| EXP_PPS_EU27_2007_HAB | Real expenditure per capita (in PPS_EU27_2007) | 4.80000e+03 | 4.70000e+03 | 4.50000e+03 |
| EXP_PPS_EU27_2020 | Real expenditure (in PPS_EU27_2020) | 3.66991e+05 | 2.90292e+05 | 2.48953e+05 |
| EXP_PPS_EU27_2020_HAB | Real expenditure per capita (in PPS_EU27_2020) | 4.40000e+03 | 4.30000e+03 | 4.20000e+03 |
| EXP_PPS_EU28 | Real expenditure (in PPS_EU28) | 3.96960e+05 | 3.13998e+05 | 2.69284e+05 |
| EXP_PPS_EU28_HAB | Real expenditure per capita (in PPS_EU28) | 4.80000e+03 | 4.70000e+03 | 4.50000e+03 |
| PLI_EU15 | Price level indices (EU15=100) | 9.52000e+01 | 1.00000e+02 | 8.12000e+01 |
| PLI_EU27_2007 | Price level indices (EU27_2007=100) | 1.06300e+02 | 1.11600e+02 | 9.07000e+01 |
| PLI_EU27_2020 | Price level indices (EU27_2020=100) | 1.15400e+02 | 1.21200e+02 | 9.85000e+01 |
| PLI_EU28 | Price level indices (EU28=100) | 1.06700e+02 | 1.12100e+02 | 9.10000e+01 |
| PPP_EU15 | Purchasing power parities (EU15=1) | 9.52275e-01 | 1.00014e+00 | 8.12416e-01 |
| PPP_EU27_2007 | Purchasing power parities (EU27_2007=1) | 1.06263e+00 | 1.11605e+00 | 9.06566e-01 |
| PPP_EU27_2020 | Purchasing power parities (EU27_2020=1) | 1.15436e+00 | 1.21238e+00 | 9.84818e-01 |
| PPP_EU28 | Purchasing power parities (EU28=1) | 1.06720e+00 | 1.12085e+00 | 9.10466e-01 |
| VI_PPS_EU15_HAB | Volume indices of real expenditure per capita (in PPS_EU15=100) | 1.10000e+02 | 1.07000e+02 | 1.04000e+02 |
| VI_PPS_EU27_2007_HAB | Volume indices of real expenditure per capita (in PPS_EU27_2007=100) | 1.13000e+02 | 1.10000e+02 | 1.07000e+02 |
| VI_PPS_EU27_2020_HAB | Volume indices of real expenditure per capita (in PPS_EU27_2020=100) | 1.12000e+02 | 1.09000e+02 | 1.05000e+02 |
| VI_PPS_EU28_HAB | Volume indices of real expenditure per capita (in PPS_EU28=100) | 1.13000e+02 | 1.10000e+02 | 1.07000e+02 |
Germany, France, Italy
PPP_EU27_2020
Code
prc_ppp_ind %>%
  filter(ppp_cat == "A0104",
         geo %in% c("FR", "DE", "IT"),
         na_item == "PPP_EU27_2020") %>%
  year_to_date %>%
  left_join(geo, by = "geo") %>%
  left_join(colors, by = c("Geo" = "country")) %>%
  ggplot + geom_line(aes(x = date, y = values, color = color)) +
  scale_color_identity() + theme_minimal()  + add_3flags +
  scale_x_date(breaks = as.Date(paste0(seq(1960, 2100, 2), "-01-01")),
               labels = date_format("%Y")) +
  xlab("") + ylab("") +
  scale_y_continuous(breaks = seq(0, 4000, .05))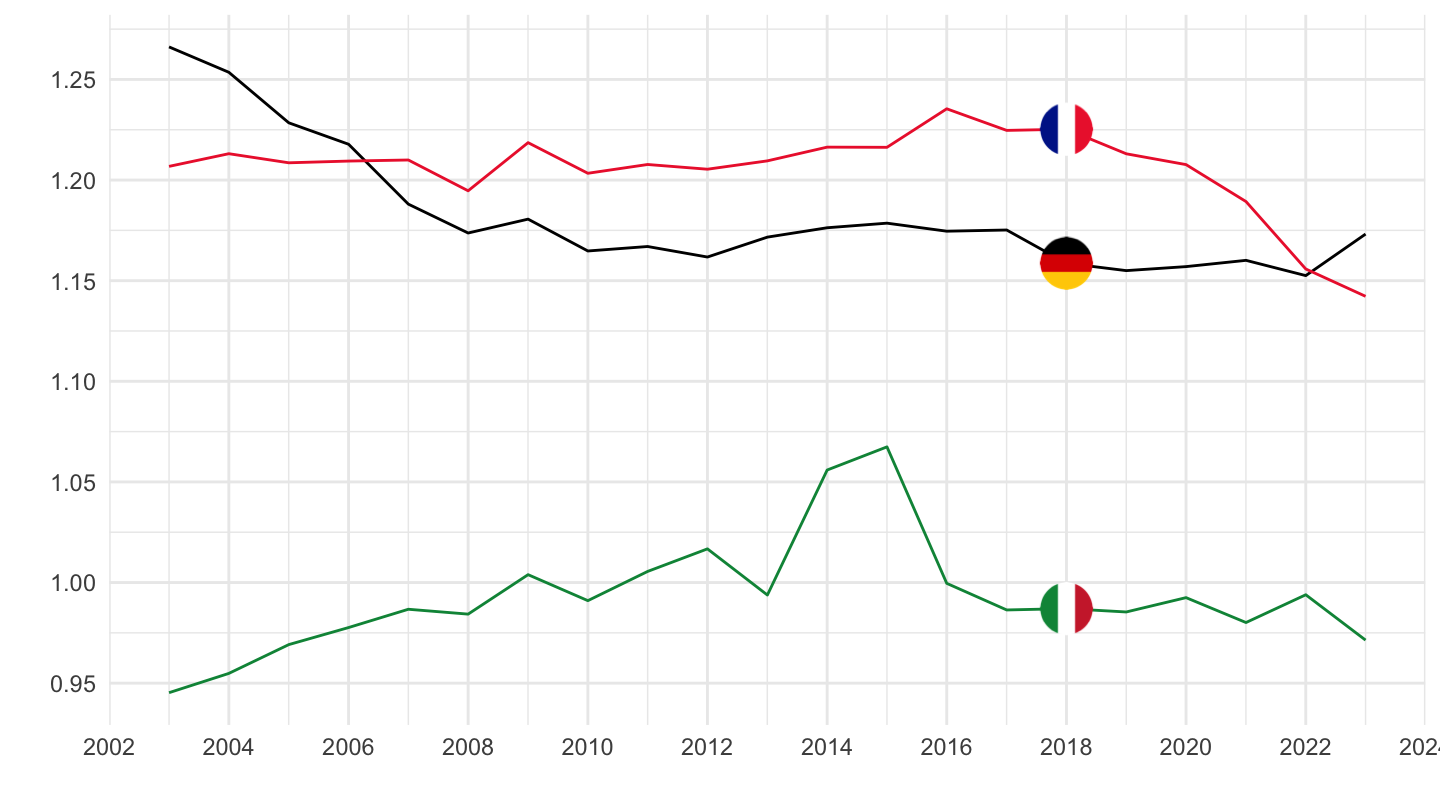
PLI_EU28
Code
prc_ppp_ind %>%
  filter(ppp_cat == "A0104",
         geo %in% c("FR", "DE", "IT"),
         na_item == "PLI_EU28") %>%
  year_to_date %>%
  left_join(geo, by = "geo") %>%
  left_join(colors, by = c("Geo" = "country")) %>%
  ggplot + geom_line(aes(x = date, y = values, color = color)) +
  scale_color_identity() + theme_minimal()  + add_3flags +
  scale_x_date(breaks = as.Date(paste0(seq(1960, 2100, 2), "-01-01")),
               labels = date_format("%Y")) +
  xlab("") + ylab("") +
  scale_y_continuous(breaks = seq(0, 4000, 5))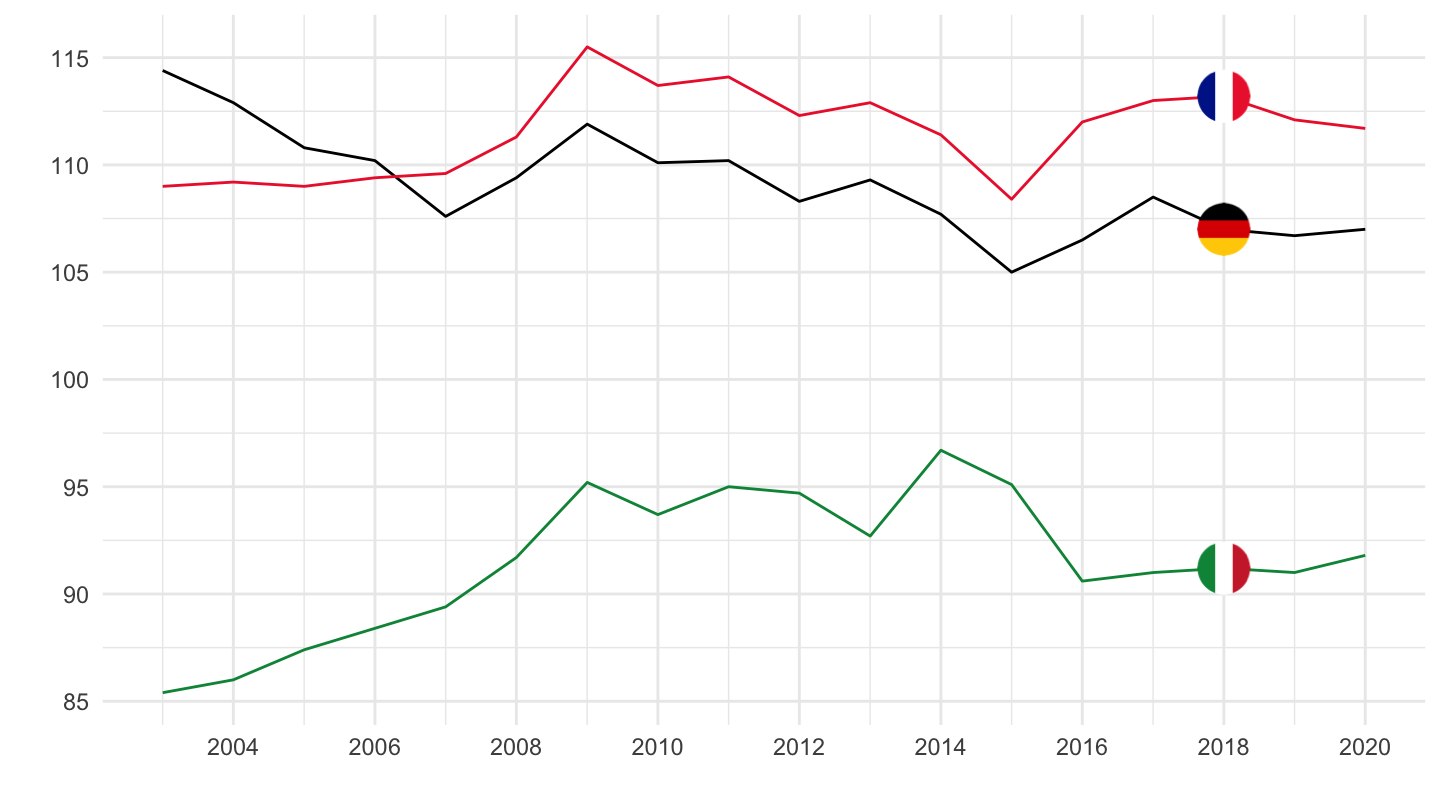
Table
Household final consumption expenditure - E011
Code
prc_ppp_ind %>%
  filter(ppp_cat == "E011",
         time == "2019",
         geo %in% c("FR", "DE", "IT")) %>%
  select(na_item, geo, values) %>%
  left_join(na_item, by = "na_item") %>%
  spread(geo, values) %>%
print_table_conditional()| na_item | Na_item | DE | FR | IT |
|---|---|---|---|---|
| EXP_EUR | Nominal expenditure (in euro) | 1.813709e+06 | 1.262531e+06 | 1.067942e+06 |
| EXP_EUR_HAB | Nominal expenditure per inhabitant (in euro) | 2.182700e+04 | 1.873300e+04 | 1.788000e+04 |
| EXP_NAC | Nominal expenditure in national currency | 1.813709e+06 | 1.262531e+06 | 1.067942e+06 |
| EXP_NAC_PC_GDP | Nominal expenditure as a percentage of GDP (GDP=100) | 5.130000e+01 | 5.190000e+01 | 5.920000e+01 |
| EXP_PPS_EU15 | Real expenditure (in PPS_EU15) | 1.864692e+06 | 1.224870e+06 | 1.156464e+06 |
| EXP_PPS_EU15_HAB | Real expenditure per capita (in PPS_EU15) | 2.240000e+04 | 1.820000e+04 | 1.940000e+04 |
| EXP_PPS_EU27_2007 | Real expenditure (in PPS_EU27_2007) | 1.750377e+06 | 1.149779e+06 | 1.085567e+06 |
| EXP_PPS_EU27_2007_HAB | Real expenditure per capita (in PPS_EU27_2007) | 2.110000e+04 | 1.710000e+04 | 1.820000e+04 |
| EXP_PPS_EU27_2020 | Real expenditure (in PPS_EU27_2020) | 1.694399e+06 | 1.113009e+06 | 1.050850e+06 |
| EXP_PPS_EU27_2020_HAB | Real expenditure per capita (in PPS_EU27_2020) | 2.040000e+04 | 1.650000e+04 | 1.760000e+04 |
| EXP_PPS_EU28 | Real expenditure (in PPS_EU28) | 1.747649e+06 | 1.147987e+06 | 1.083875e+06 |
| EXP_PPS_EU28_HAB | Real expenditure per capita (in PPS_EU28) | 2.100000e+04 | 1.700000e+04 | 1.810000e+04 |
| PLI_EU15 | Price level indices (EU15=100) | 9.730000e+01 | 1.031000e+02 | 9.230000e+01 |
| PLI_EU27_2007 | Price level indices (EU27_2007=100) | 1.036000e+02 | 1.098000e+02 | 9.840000e+01 |
| PLI_EU27_2020 | Price level indices (EU27_2020=100) | 1.070000e+02 | 1.134000e+02 | 1.016000e+02 |
| PLI_EU28 | Price level indices (EU28=100) | 1.038000e+02 | 1.100000e+02 | 9.850000e+01 |
| PPP_EU15 | Purchasing power parities (EU15=1) | 9.726590e-01 | 1.030750e+00 | 9.234540e-01 |
| PPP_EU27_2007 | Purchasing power parities (EU27_2007=1) | 1.036180e+00 | 1.098060e+00 | 9.837640e-01 |
| PPP_EU27_2020 | Purchasing power parities (EU27_2020=1) | 1.070410e+00 | 1.134340e+00 | 1.016260e+00 |
| PPP_EU28 | Purchasing power parities (EU28=1) | 1.037800e+00 | 1.099780e+00 | 9.853000e-01 |
| VI_PPS_EU15_HAB | Volume indices of real expenditure per capita (in PPS_EU15=100) | 1.140000e+02 | 9.200000e+01 | 9.800000e+01 |
| VI_PPS_EU27_2007_HAB | Volume indices of real expenditure per capita (in PPS_EU27_2007=100) | 1.210000e+02 | 9.800000e+01 | 1.040000e+02 |
| VI_PPS_EU27_2020_HAB | Volume indices of real expenditure per capita (in PPS_EU27_2020=100) | 1.240000e+02 | 1.000000e+02 | 1.070000e+02 |
| VI_PPS_EU28_HAB | Volume indices of real expenditure per capita (in PPS_EU28=100) | 1.210000e+02 | 9.800000e+01 | 1.040000e+02 |
Gross domestic product - GDP
Code
prc_ppp_ind %>%
  filter(ppp_cat == "GDP",
         time == "2019",
         geo %in% c("FR", "DE", "IT")) %>%
  select(na_item, geo, values) %>%
  left_join(na_item, by = "na_item") %>%
  spread(geo, values) %>%
print_table_conditional()| na_item | Na_item | DE | FR | IT |
|---|---|---|---|---|
| EXP_EUR | Nominal expenditure (in euro) | 3.534880e+06 | 2.432207e+06 | 1.804067e+06 |
| EXP_EUR_HAB | Nominal expenditure per inhabitant (in euro) | 4.254100e+04 | 3.608800e+04 | 3.020400e+04 |
| EXP_NAC | Nominal expenditure in national currency | 3.534880e+06 | 2.432207e+06 | 1.804067e+06 |
| EXP_NAC_PC_GDP | Nominal expenditure as a percentage of GDP (GDP=100) | 1.000000e+02 | 1.000000e+02 | 1.000000e+02 |
| EXP_PPS_EU15 | Real expenditure (in PPS_EU15) | 3.491826e+06 | 2.442710e+06 | 1.976043e+06 |
| EXP_PPS_EU15_HAB | Real expenditure per capita (in PPS_EU15) | 4.200000e+04 | 3.620000e+04 | 3.310000e+04 |
| EXP_PPS_EU27_2007 | Real expenditure (in PPS_EU27_2007) | 3.282758e+06 | 2.296457e+06 | 1.857731e+06 |
| EXP_PPS_EU27_2007_HAB | Real expenditure per capita (in PPS_EU27_2007) | 3.950000e+04 | 3.410000e+04 | 3.110000e+04 |
| EXP_PPS_EU27_2020 | Real expenditure (in PPS_EU27_2020) | 3.202761e+06 | 2.240495e+06 | 1.812460e+06 |
| EXP_PPS_EU27_2020_HAB | Real expenditure per capita (in PPS_EU27_2020) | 3.850000e+04 | 3.320000e+04 | 3.030000e+04 |
| EXP_PPS_EU28 | Real expenditure (in PPS_EU28) | 3.276610e+06 | 2.292156e+06 | 1.854252e+06 |
| EXP_PPS_EU28_HAB | Real expenditure per capita (in PPS_EU28) | 3.940000e+04 | 3.400000e+04 | 3.100000e+04 |
| PLI_EU15 | Price level indices (EU15=100) | 1.012000e+02 | 9.960000e+01 | 9.130000e+01 |
| PLI_EU27_2007 | Price level indices (EU27_2007=100) | 1.077000e+02 | 1.059000e+02 | 9.710000e+01 |
| PLI_EU27_2020 | Price level indices (EU27_2020=100) | 1.104000e+02 | 1.086000e+02 | 9.950000e+01 |
| PLI_EU28 | Price level indices (EU28=100) | 1.079000e+02 | 1.061000e+02 | 9.730000e+01 |
| PPP_EU15 | Purchasing power parities (EU15=1) | 1.012330e+00 | 9.957000e-01 | 9.129690e-01 |
| PPP_EU27_2007 | Purchasing power parities (EU27_2007=1) | 1.076800e+00 | 1.059110e+00 | 9.711130e-01 |
| PPP_EU27_2020 | Purchasing power parities (EU27_2020=1) | 1.103700e+00 | 1.085570e+00 | 9.953690e-01 |
| PPP_EU28 | Purchasing power parities (EU28=1) | 1.078820e+00 | 1.061100e+00 | 9.729350e-01 |
| VI_PPS_EU15_HAB | Volume indices of real expenditure per capita (in PPS_EU15=100) | 1.140000e+02 | 9.800000e+01 | 9.000000e+01 |
| VI_PPS_EU27_2007_HAB | Volume indices of real expenditure per capita (in PPS_EU27_2007=100) | 1.210000e+02 | 1.040000e+02 | 9.500000e+01 |
| VI_PPS_EU27_2020_HAB | Volume indices of real expenditure per capita (in PPS_EU27_2020=100) | 1.220000e+02 | 1.050000e+02 | 9.600000e+01 |
| VI_PPS_EU28_HAB | Volume indices of real expenditure per capita (in PPS_EU28=100) | 1.210000e+02 | 1.050000e+02 | 9.600000e+01 |
Actual individual consumption - A01
Code
prc_ppp_ind %>%
  filter(ppp_cat == "E011",
         time == "2019",
         geo %in% c("FR", "DE", "IT")) %>%
  select(na_item, geo, values) %>%
  left_join(na_item, by = "na_item") %>%
  spread(geo, values) %>%
print_table_conditional()| na_item | Na_item | DE | FR | IT |
|---|---|---|---|---|
| EXP_EUR | Nominal expenditure (in euro) | 1.813709e+06 | 1.262531e+06 | 1.067942e+06 |
| EXP_EUR_HAB | Nominal expenditure per inhabitant (in euro) | 2.182700e+04 | 1.873300e+04 | 1.788000e+04 |
| EXP_NAC | Nominal expenditure in national currency | 1.813709e+06 | 1.262531e+06 | 1.067942e+06 |
| EXP_NAC_PC_GDP | Nominal expenditure as a percentage of GDP (GDP=100) | 5.130000e+01 | 5.190000e+01 | 5.920000e+01 |
| EXP_PPS_EU15 | Real expenditure (in PPS_EU15) | 1.864692e+06 | 1.224870e+06 | 1.156464e+06 |
| EXP_PPS_EU15_HAB | Real expenditure per capita (in PPS_EU15) | 2.240000e+04 | 1.820000e+04 | 1.940000e+04 |
| EXP_PPS_EU27_2007 | Real expenditure (in PPS_EU27_2007) | 1.750377e+06 | 1.149779e+06 | 1.085567e+06 |
| EXP_PPS_EU27_2007_HAB | Real expenditure per capita (in PPS_EU27_2007) | 2.110000e+04 | 1.710000e+04 | 1.820000e+04 |
| EXP_PPS_EU27_2020 | Real expenditure (in PPS_EU27_2020) | 1.694399e+06 | 1.113009e+06 | 1.050850e+06 |
| EXP_PPS_EU27_2020_HAB | Real expenditure per capita (in PPS_EU27_2020) | 2.040000e+04 | 1.650000e+04 | 1.760000e+04 |
| EXP_PPS_EU28 | Real expenditure (in PPS_EU28) | 1.747649e+06 | 1.147987e+06 | 1.083875e+06 |
| EXP_PPS_EU28_HAB | Real expenditure per capita (in PPS_EU28) | 2.100000e+04 | 1.700000e+04 | 1.810000e+04 |
| PLI_EU15 | Price level indices (EU15=100) | 9.730000e+01 | 1.031000e+02 | 9.230000e+01 |
| PLI_EU27_2007 | Price level indices (EU27_2007=100) | 1.036000e+02 | 1.098000e+02 | 9.840000e+01 |
| PLI_EU27_2020 | Price level indices (EU27_2020=100) | 1.070000e+02 | 1.134000e+02 | 1.016000e+02 |
| PLI_EU28 | Price level indices (EU28=100) | 1.038000e+02 | 1.100000e+02 | 9.850000e+01 |
| PPP_EU15 | Purchasing power parities (EU15=1) | 9.726590e-01 | 1.030750e+00 | 9.234540e-01 |
| PPP_EU27_2007 | Purchasing power parities (EU27_2007=1) | 1.036180e+00 | 1.098060e+00 | 9.837640e-01 |
| PPP_EU27_2020 | Purchasing power parities (EU27_2020=1) | 1.070410e+00 | 1.134340e+00 | 1.016260e+00 |
| PPP_EU28 | Purchasing power parities (EU28=1) | 1.037800e+00 | 1.099780e+00 | 9.853000e-01 |
| VI_PPS_EU15_HAB | Volume indices of real expenditure per capita (in PPS_EU15=100) | 1.140000e+02 | 9.200000e+01 | 9.800000e+01 |
| VI_PPS_EU27_2007_HAB | Volume indices of real expenditure per capita (in PPS_EU27_2007=100) | 1.210000e+02 | 9.800000e+01 | 1.040000e+02 |
| VI_PPS_EU27_2020_HAB | Volume indices of real expenditure per capita (in PPS_EU27_2020=100) | 1.240000e+02 | 1.000000e+02 | 1.070000e+02 |
| VI_PPS_EU28_HAB | Volume indices of real expenditure per capita (in PPS_EU28=100) | 1.210000e+02 | 9.800000e+01 | 1.040000e+02 |
Actual Individual Consumption
Table - 2019 - Countries
Code
prc_ppp_ind %>%
  filter(ppp_cat == "A01",
         na_item == "VI_PPS_EU28_HAB",
         time == "2019") %>%
  left_join(geo, by = "geo") %>%
  select(-ppp_cat, -time, -na_item) %>%
  mutate(Geo = ifelse(geo == "DE", "Germany", Geo)) %>%
  mutate(Flag = gsub(" ", "-", str_to_lower(Geo)),
         Flag = paste0('<img src="../../bib/flags/vsmall/', Flag, '.png" alt="Flag">')) %>%
  select(Flag, everything()) %>%
  {if (is_html_output()) datatable(., filter = 'top', rownames = F, escape = F) else .}
Maps
Text
Code
europe_NUTS0_new <- prc_ppp_ind %>%
  filter(ppp_cat == "A01",
         na_item == "VI_PPS_EU28_HAB",
         time == "2019") %>%
  select(geo, values) %>%
  right_join(europe_NUTS0 %>%
               filter(long >= -10,
                      lat >= 20), by = "geo") %>%
  group_by(geo, values) %>%
  summarise(long = mean(long), lat = mean(lat))

prc_ppp_ind %>%
  filter(ppp_cat == "A01",
         na_item == "VI_PPS_EU28_HAB",
         time == "2019") %>%
  select(geo, values) %>%
  right_join(europe_NUTS0 %>%
               filter(long >= -10,
                      lat >= 20), by = "geo") %>%
  ggplot(aes(x = long, y = lat)) +
  geom_polygon(aes(group = group, fill = values)) + coord_map() +
  scale_fill_viridis_c(na.value = "white",
                       labels = dollar_format(a = 1, p = "", su = ""),
                       breaks = seq(20, 140, 20)) +
  geom_text(aes(label = values), data = europe_NUTS0_new,  size = 3, hjust = 0.5) +
  theme_void() + theme(legend.position = c(0.25, 0.85)) +
  labs(fill = "Actual Individual Consumption")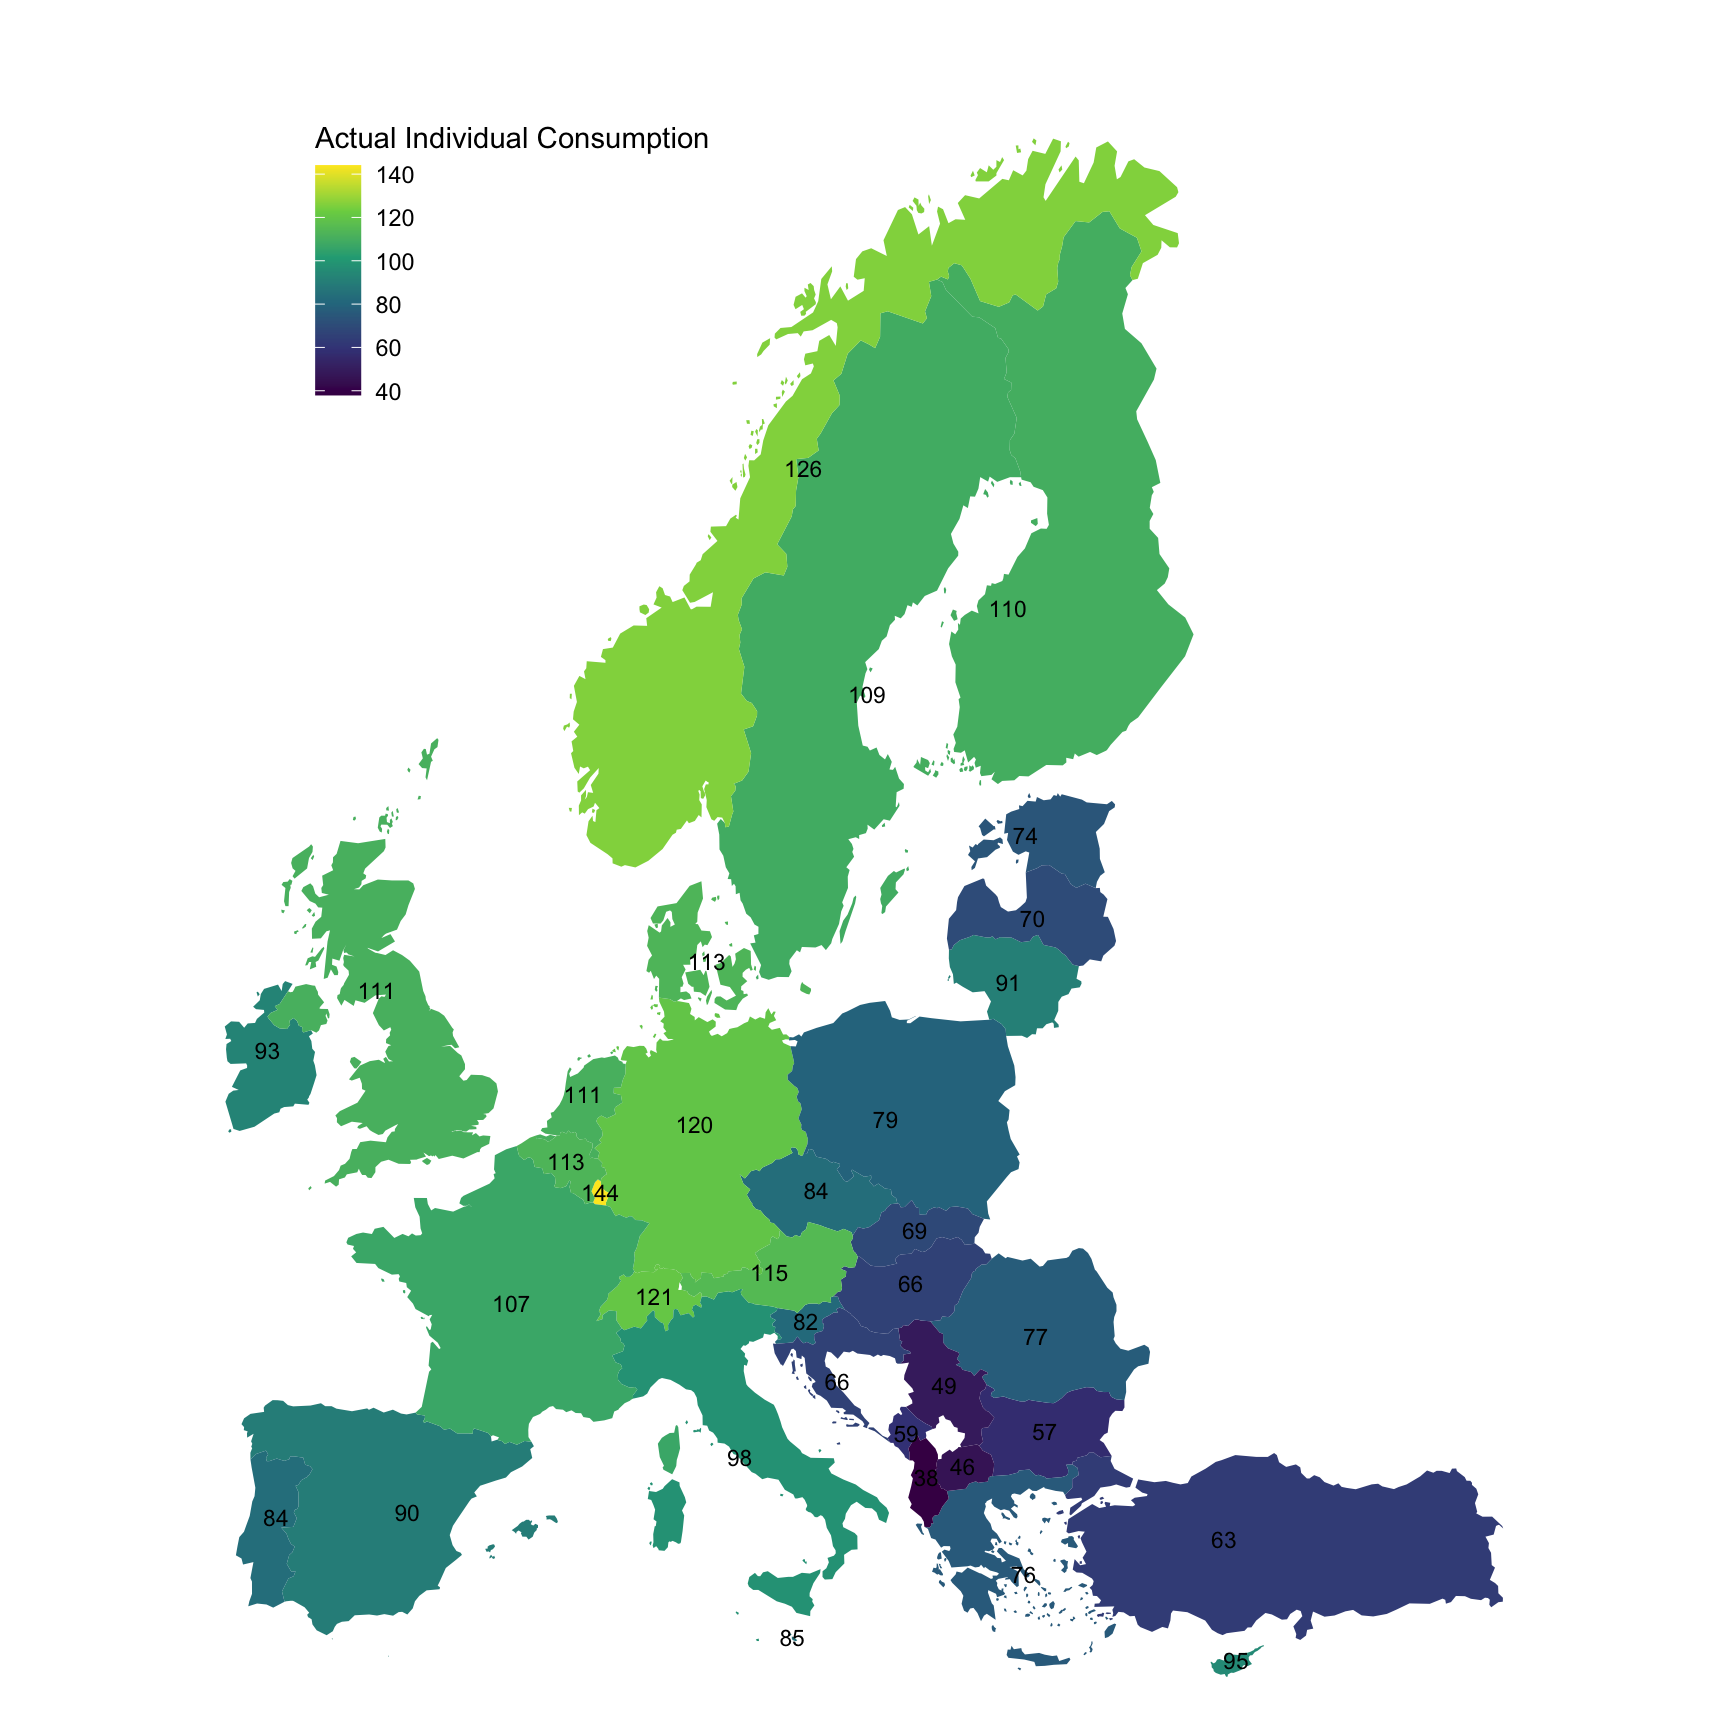
No Text
Code
europe_NUTS0_new <- prc_ppp_ind %>%
  filter(ppp_cat == "A01",
         na_item == "VI_PPS_EU28_HAB",
         time == "2019") %>%
  select(geo, values) %>%
  right_join(europe_NUTS0 %>%
               filter(long >= -10,
                      lat >= 20), by = "geo") %>%
  group_by(geo, values) %>%
  summarise(long = mean(long), lat = mean(lat))

prc_ppp_ind %>%
  filter(ppp_cat == "A01",
         na_item == "VI_PPS_EU28_HAB",
         time == "2019") %>%
  select(geo, values) %>%
  right_join(europe_NUTS0 %>%
               filter(long >= -10,
                      lat >= 20), by = "geo") %>%
  ggplot(aes(x = long, y = lat)) +
  geom_polygon(aes(group = group, fill = values)) + coord_map() +
  scale_fill_viridis_c(na.value = "white",
                       labels = dollar_format(a = 1, p = "", su = ""),
                       breaks = seq(20, 140, 20)) +
  theme_void() + theme(legend.position = c(0.25, 0.85)) +
  labs(fill = "Actual Individual Consumption")
France - 1995, 2005, 2015, 2019
Code
prc_ppp_ind %>%
  filter(ppp_cat == "A01",
         geo == "FR",
         time %in% c("1995", "2005", "2015", "2019")) %>%
  left_join(na_item, by = "na_item") %>%
  select(-ppp_cat, -geo) %>%
  spread(time, values) %>%
print_table_conditional()| freq | na_item | Na_item | 1995 | 2005 | 2015 | 2019 |
|---|---|---|---|---|---|---|
| A | EXP_EUR | Nominal expenditure (in euro) | 8.36517e+05 | 1.216638e+06 | 1.536678e+06 | 1.682473e+06 |
| A | EXP_EUR_HAB | Nominal expenditure per inhabitant (in euro) | 1.40810e+04 | 1.932300e+04 | 2.317300e+04 | 2.496400e+04 |
| A | EXP_NAC | Nominal expenditure in national currency | 8.32116e+05 | 1.216638e+06 | 1.536678e+06 | 1.682473e+06 |
| A | EXP_NAC_PC_GDP | Nominal expenditure as a percentage of GDP (GDP=100) | 6.86000e+01 | 6.900000e+01 | 6.980000e+01 | 6.920000e+01 |
| A | EXP_PPS_EU15 | Real expenditure (in PPS_EU15) | 7.76118e+05 | 1.225393e+06 | 1.590973e+06 | 1.708868e+06 |
| A | EXP_PPS_EU15_HAB | Real expenditure per capita (in PPS_EU15) | 1.31000e+04 | 1.950000e+04 | 2.400000e+04 | 2.540000e+04 |
| A | EXP_PPS_EU27_2007 | Real expenditure (in PPS_EU27_2007) | 7.26182e+05 | 1.157023e+06 | 1.480920e+06 | 1.593008e+06 |
| A | EXP_PPS_EU27_2007_HAB | Real expenditure per capita (in PPS_EU27_2007) | 1.22000e+04 | 1.840000e+04 | 2.230000e+04 | 2.360000e+04 |
| A | EXP_PPS_EU27_2020 | Real expenditure (in PPS_EU27_2020) | 7.16257e+05 | 1.102496e+06 | 1.390155e+06 | 1.534814e+06 |
| A | EXP_PPS_EU27_2020_HAB | Real expenditure per capita (in PPS_EU27_2020) | 1.21000e+04 | 1.750000e+04 | 2.100000e+04 | 2.280000e+04 |
| A | EXP_PPS_EU28 | Real expenditure (in PPS_EU28) | 7.24752e+05 | 1.155054e+06 | 1.477967e+06 | 1.590082e+06 |
| A | EXP_PPS_EU28_HAB | Real expenditure per capita (in PPS_EU28) | 1.22000e+04 | 1.830000e+04 | 2.230000e+04 | 2.360000e+04 |
| A | PLI_EU15 | Price level indices (EU15=100) | 1.07800e+02 | 9.930000e+01 | 9.660000e+01 | 9.850000e+01 |
| A | PLI_EU27_2007 | Price level indices (EU27_2007=100) | 1.15200e+02 | 1.052000e+02 | 1.038000e+02 | 1.056000e+02 |
| A | PLI_EU27_2020 | Price level indices (EU27_2020=100) | 1.16800e+02 | 1.104000e+02 | 1.105000e+02 | 1.096000e+02 |
| A | PLI_EU28 | Price level indices (EU28=100) | 1.15400e+02 | 1.053000e+02 | 1.040000e+02 | 1.058000e+02 |
| A | PPP_EU15 | Purchasing power parities (EU15=1) | 1.07215e+00 | 9.928560e-01 | 9.658730e-01 | 9.845540e-01 |
| A | PPP_EU27_2007 | Purchasing power parities (EU27_2007=1) | 1.14588e+00 | 1.051530e+00 | 1.037650e+00 | 1.056160e+00 |
| A | PPP_EU27_2020 | Purchasing power parities (EU27_2020=1) | 1.16176e+00 | 1.103530e+00 | 1.105400e+00 | 1.096210e+00 |
| A | PPP_EU28 | Purchasing power parities (EU28=1) | 1.14814e+00 | 1.053320e+00 | 1.039720e+00 | 1.058100e+00 |
| A | VI_PPS_EU15_HAB | Volume indices of real expenditure per capita (in PPS_EU15=100) | 1.01000e+02 | 9.900000e+01 | 1.020000e+02 | 1.010000e+02 |
| A | VI_PPS_EU27_2007_HAB | Volume indices of real expenditure per capita (in PPS_EU27_2007=100) | 1.16000e+02 | 1.120000e+02 | 1.100000e+02 | 1.070000e+02 |
| A | VI_PPS_EU27_2020_HAB | Volume indices of real expenditure per capita (in PPS_EU27_2020=100) | 1.20000e+02 | 1.160000e+02 | 1.120000e+02 | 1.090000e+02 |
| A | VI_PPS_EU28_HAB | Volume indices of real expenditure per capita (in PPS_EU28=100) | 1.17000e+02 | 1.120000e+02 | 1.100000e+02 | 1.070000e+02 |
Germany - 1995, 2005, 2015, 2019
Code
prc_ppp_ind %>%
  filter(ppp_cat == "A01",
         geo == "DE",
         time %in% c("1995", "2005", "2015", "2019")) %>%
  left_join(na_item, by = "na_item") %>%
  select(-ppp_cat, -geo) %>%
  spread(time, values) %>%
print_table_conditional()| freq | na_item | Na_item | 1995 | 2005 | 2015 | 2019 |
|---|---|---|---|---|---|---|
| A | EXP_EUR | Nominal expenditure (in euro) | 1.327190e+06 | 1.596749e+06 | 2.030164e+06 | 2.313943e+06 |
| A | EXP_EUR_HAB | Nominal expenditure per inhabitant (in euro) | 1.632300e+04 | 1.963100e+04 | 2.485300e+04 | 2.784800e+04 |
| A | EXP_NAC | Nominal expenditure in national currency | 1.271492e+06 | 1.596749e+06 | 2.030164e+06 | 2.313943e+06 |
| A | EXP_NAC_PC_GDP | Nominal expenditure as a percentage of GDP (GDP=100) | 6.690000e+01 | 6.870000e+01 | 6.580000e+01 | 6.550000e+01 |
| A | EXP_PPS_EU15 | Real expenditure (in PPS_EU15) | 1.210057e+06 | 1.667670e+06 | 2.175706e+06 | 2.393417e+06 |
| A | EXP_PPS_EU15_HAB | Real expenditure per capita (in PPS_EU15) | 1.490000e+04 | 2.050000e+04 | 2.660000e+04 | 2.880000e+04 |
| A | EXP_PPS_EU27_2007 | Real expenditure (in PPS_EU27_2007) | 1.132201e+06 | 1.574623e+06 | 2.025206e+06 | 2.231144e+06 |
| A | EXP_PPS_EU27_2007_HAB | Real expenditure per capita (in PPS_EU27_2007) | 1.390000e+04 | 1.940000e+04 | 2.480000e+04 | 2.690000e+04 |
| A | EXP_PPS_EU27_2020 | Real expenditure (in PPS_EU27_2020) | 1.116726e+06 | 1.500417e+06 | 1.901082e+06 | 2.149639e+06 |
| A | EXP_PPS_EU27_2020_HAB | Real expenditure per capita (in PPS_EU27_2020) | 1.370000e+04 | 1.840000e+04 | 2.330000e+04 | 2.590000e+04 |
| A | EXP_PPS_EU28 | Real expenditure (in PPS_EU28) | 1.129971e+06 | 1.571943e+06 | 2.021167e+06 | 2.227047e+06 |
| A | EXP_PPS_EU28_HAB | Real expenditure per capita (in PPS_EU28) | 1.390000e+04 | 1.930000e+04 | 2.470000e+04 | 2.680000e+04 |
| A | PLI_EU15 | Price level indices (EU15=100) | 1.097000e+02 | 9.570000e+01 | 9.330000e+01 | 9.670000e+01 |
| A | PLI_EU27_2007 | Price level indices (EU27_2007=100) | 1.172000e+02 | 1.014000e+02 | 1.002000e+02 | 1.037000e+02 |
| A | PLI_EU27_2020 | Price level indices (EU27_2020=100) | 1.188000e+02 | 1.064000e+02 | 1.068000e+02 | 1.076000e+02 |
| A | PLI_EU28 | Price level indices (EU28=100) | 1.175000e+02 | 1.016000e+02 | 1.004000e+02 | 1.039000e+02 |
| A | PPP_EU15 | Purchasing power parities (EU15=1) | 1.050770e+00 | 9.574730e-01 | 9.331060e-01 | 9.667950e-01 |
| A | PPP_EU27_2007 | Purchasing power parities (EU27_2007=1) | 1.123030e+00 | 1.014050e+00 | 1.002450e+00 | 1.037110e+00 |
| A | PPP_EU27_2020 | Purchasing power parities (EU27_2020=1) | 1.138590e+00 | 1.064200e+00 | 1.067900e+00 | 1.076430e+00 |
| A | PPP_EU28 | Purchasing power parities (EU28=1) | 1.125240e+00 | 1.015780e+00 | 1.004450e+00 | 1.039020e+00 |
| A | VI_PPS_EU15_HAB | Volume indices of real expenditure per capita (in PPS_EU15=100) | 1.150000e+02 | 1.050000e+02 | 1.130000e+02 | 1.150000e+02 |
| A | VI_PPS_EU27_2007_HAB | Volume indices of real expenditure per capita (in PPS_EU27_2007=100) | 1.330000e+02 | 1.180000e+02 | 1.220000e+02 | 1.220000e+02 |
| A | VI_PPS_EU27_2020_HAB | Volume indices of real expenditure per capita (in PPS_EU27_2020=100) | 1.360000e+02 | 1.230000e+02 | 1.250000e+02 | 1.240000e+02 |
| A | VI_PPS_EU28_HAB | Volume indices of real expenditure per capita (in PPS_EU28=100) | 1.330000e+02 | 1.180000e+02 | 1.220000e+02 | 1.220000e+02 |
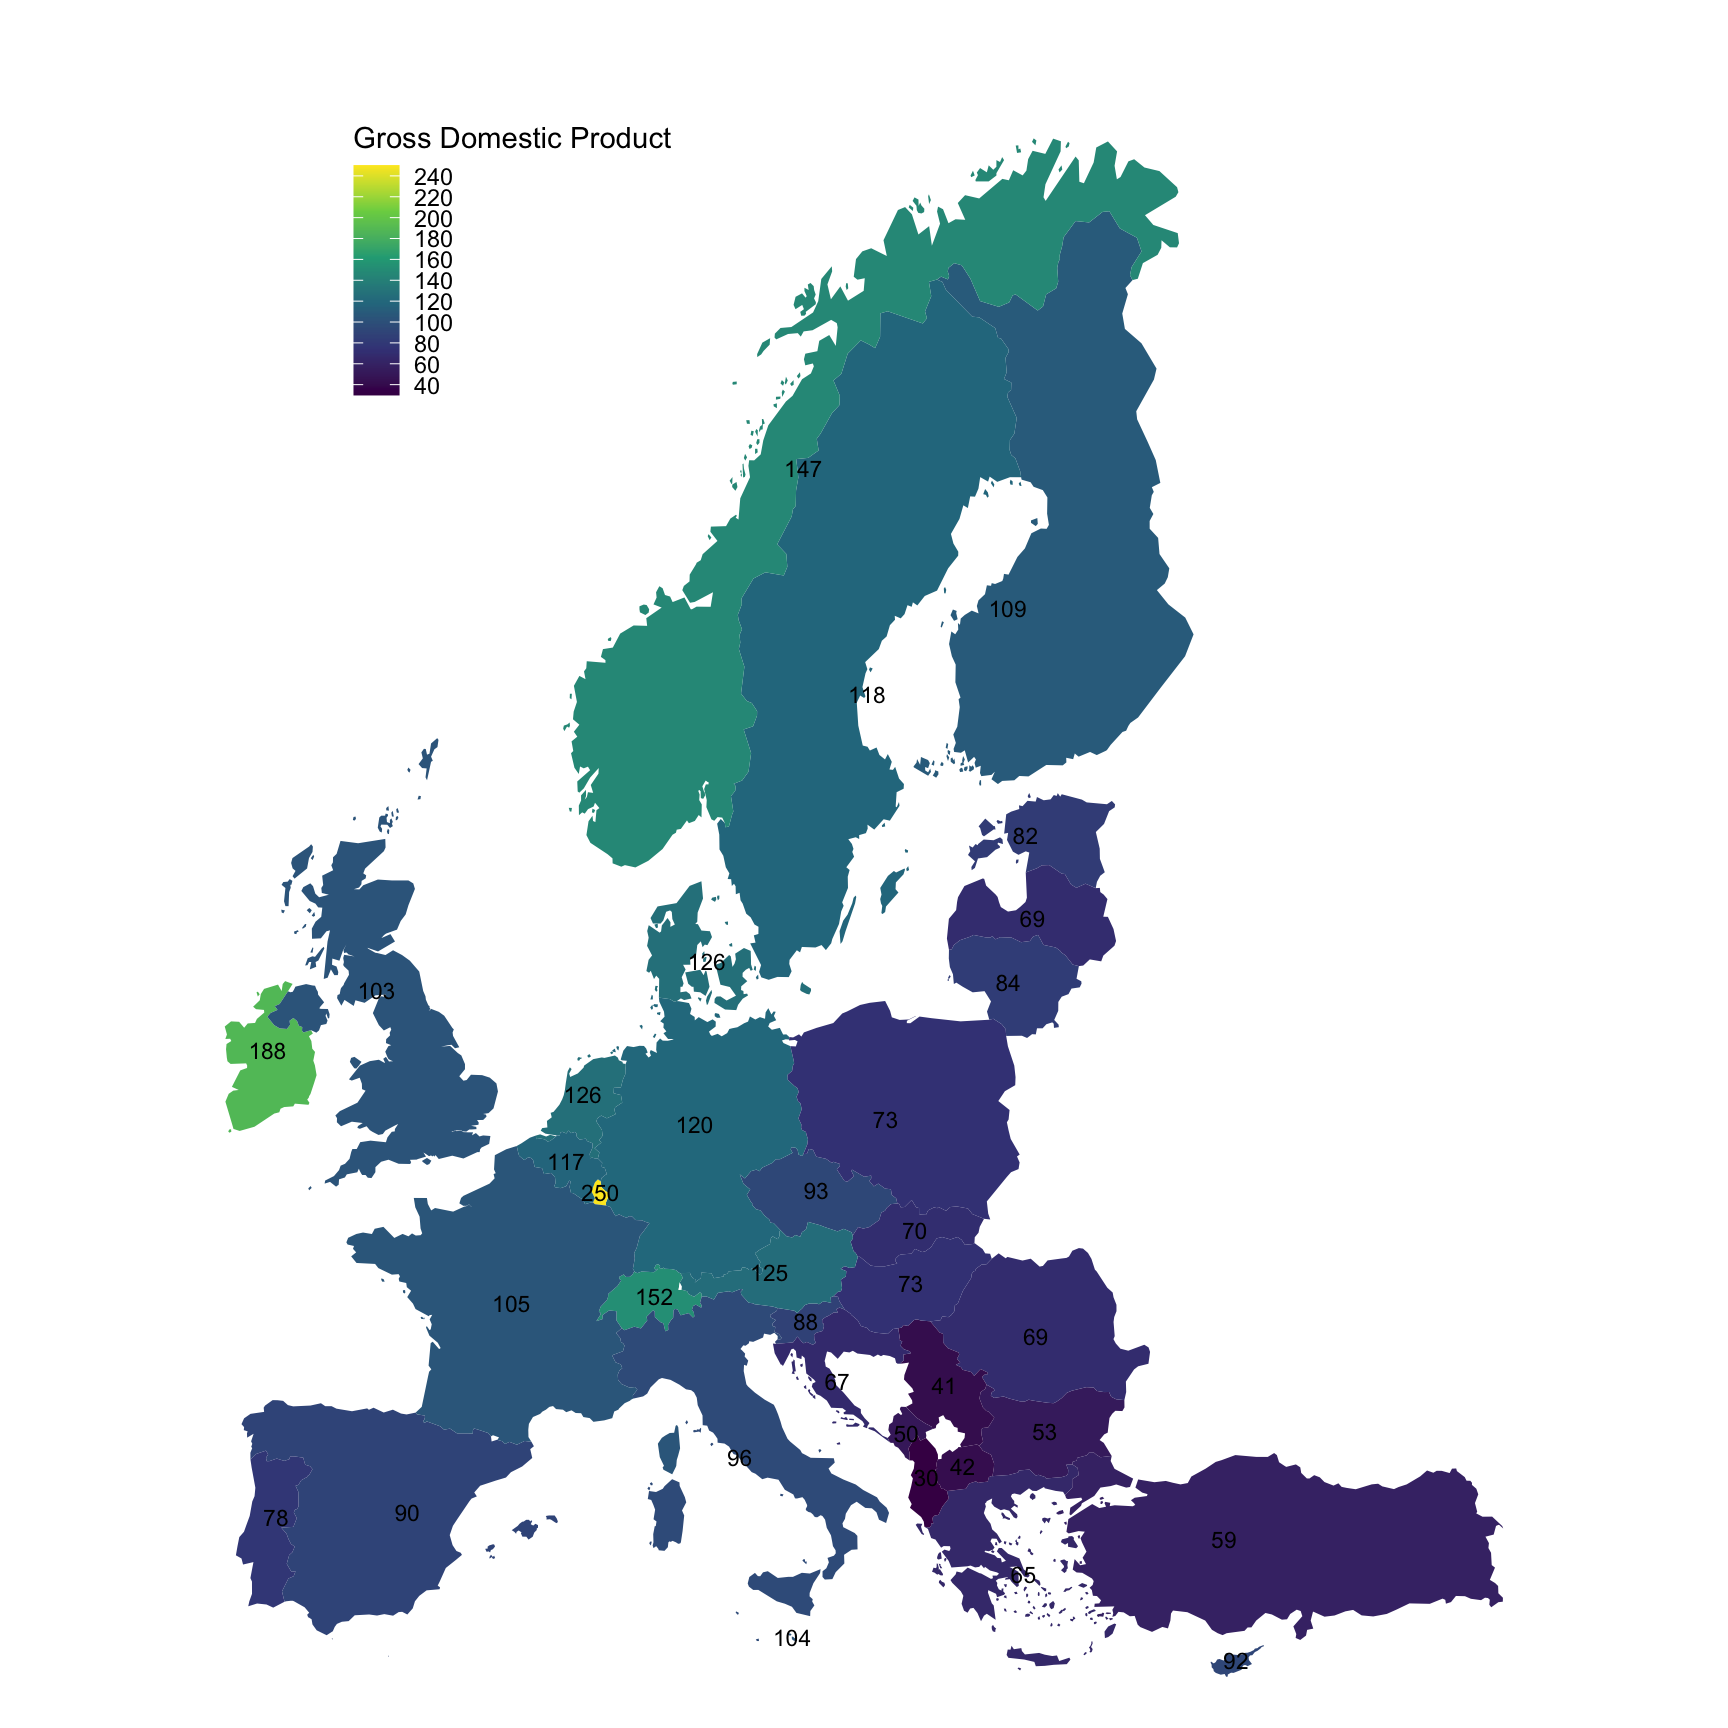
Gross Domestic Product
Table - 2019 - Countries
Code
prc_ppp_ind %>%
  filter(ppp_cat == "GDP",
         na_item == "VI_PPS_EU28_HAB",
         time == "2019") %>%
  left_join(geo, by = "geo") %>%
  select(-ppp_cat, -time, -na_item) %>%
  mutate(Geo = ifelse(geo == "DE", "Germany", Geo)) %>%
  mutate(Flag = gsub(" ", "-", str_to_lower(Geo)),
         Flag = paste0('<img src="../../bib/flags/vsmall/', Flag, '.png" alt="Flag">')) %>%
  select(Flag, everything()) %>%
  {if (is_html_output()) datatable(., filter = 'top', rownames = F, escape = F) else .}
Maps
Code
europe_NUTS0_new <- prc_ppp_ind %>%
  filter(ppp_cat == "GDP",
         na_item == "VI_PPS_EU28_HAB",
         time == "2019") %>%
  select(geo, values) %>%
  right_join(europe_NUTS0 %>%
               filter(long >= -10,
                      lat >= 20), by = "geo") %>%
  group_by(geo, values) %>%
  summarise(long = mean(long), lat = mean(lat))

prc_ppp_ind %>%
  filter(ppp_cat == "GDP",
         na_item == "VI_PPS_EU28_HAB",
         time == "2019") %>%
  select(geo, values) %>%
  right_join(europe_NUTS0 %>%
               filter(long >= -10,
                      lat >= 20), by = "geo") %>%
  ggplot(aes(x = long, y = lat)) +
  geom_polygon(aes(group = group, fill = values)) + coord_map() +
  scale_fill_viridis_c(na.value = "white",
                       labels = dollar_format(a = 1, p = "", su = ""),
                       breaks = seq(20, 260, 20)) +
  geom_text(aes(label = values), data = europe_NUTS0_new,  size = 3, hjust = 0.5) +
  theme_void() + theme(legend.position = c(0.25, 0.85)) +
  labs(fill = "Gross Domestic Product")