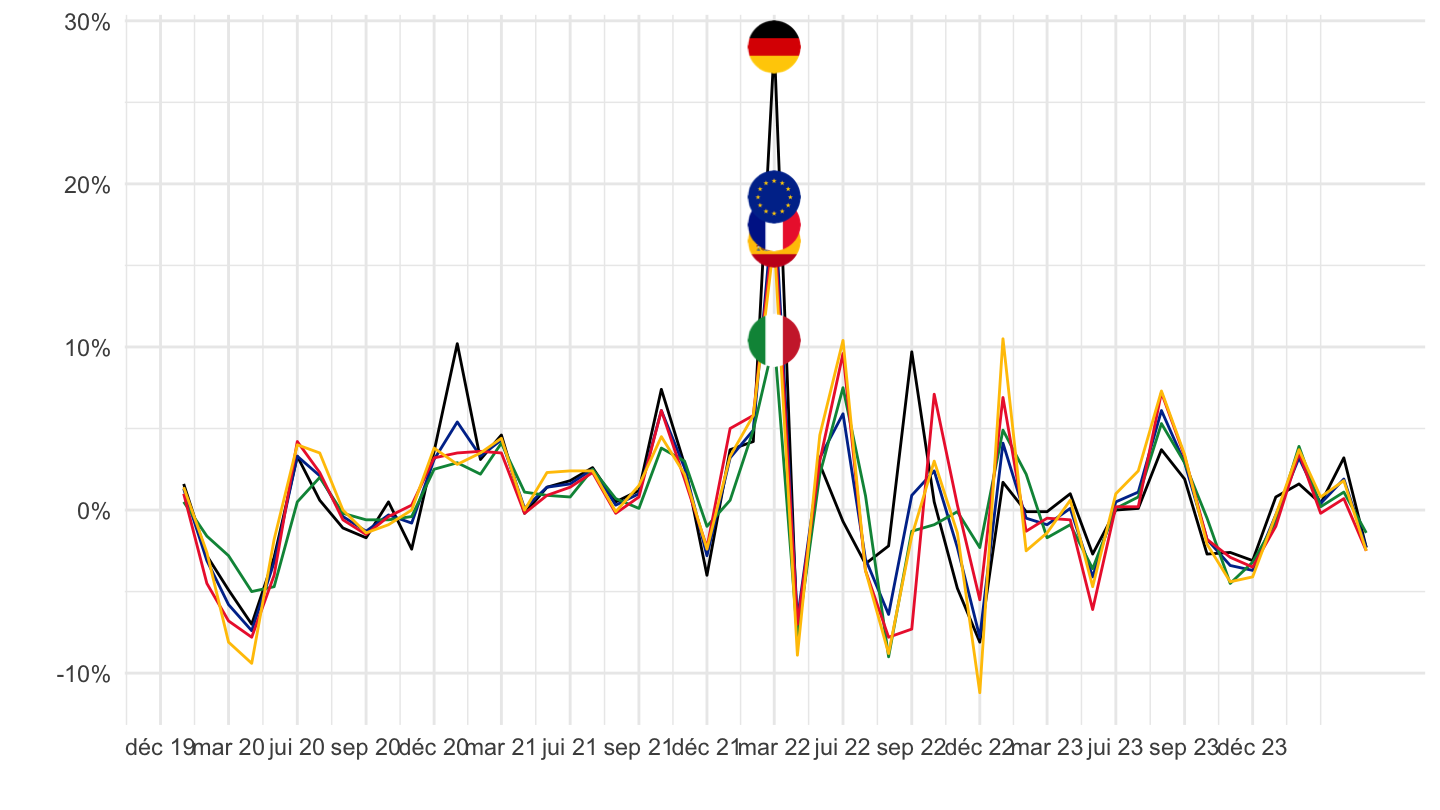
HICP (2015 = 100) - monthly data (monthly rate of change)
Data - Eurostat
Info
Last observation: Monthly: 2025M12 (N = 16,272)
First observation: Monthly: 1996M02 (N = 4,347)
Last data update: 23 jul 2026, 23:07. Last compile: 24 jul 2026, 03:41
Structure
Last
Code
last_time <- prc_hicp_mmor %>%
  group_by(time) %>%
  summarise(Nobs = n()) %>%
  arrange(desc(time)) %>%
  head(1) %>%
  pull(time)

prc_hicp_mmor %>%
  filter(time == last_time) %>%
  select_if(function(col) length(unique(col)) > 1) %>%


  select(geo, Geo, coicop, Coicop, values) %>%
  print_table_conditional()
France, Germany, Italy, Spain, Europe
CP00
All
Code
prc_hicp_mmor %>%
  filter(coicop == "CP00",
         geo %in% c("FR", "DE", "ES", "IT", "EA19")) %>%
  month_to_date %>%

  mutate(Geo = ifelse(geo == "EA19", "Europe", Geo)) %>%
  left_join(colors, by = c("Geo" = "country")) %>%
  mutate(values = values/100) %>%
  ggplot(.) + geom_line(aes(x = date, y = values, color = color)) +
  theme_minimal() + xlab("") + ylab("") +
  scale_x_date(breaks = seq(1960, 2100, 2) %>% paste0("-01-01") %>% as.Date,
               labels = date_format("%Y")) +
  scale_y_continuous(breaks = 0.01*seq(-20, 20, 1),
                     labels = percent_format(a = 1)) +
  scale_color_identity() + add_5flags +
  theme(legend.position = c(0.75, 0.90),
        legend.title = element_blank())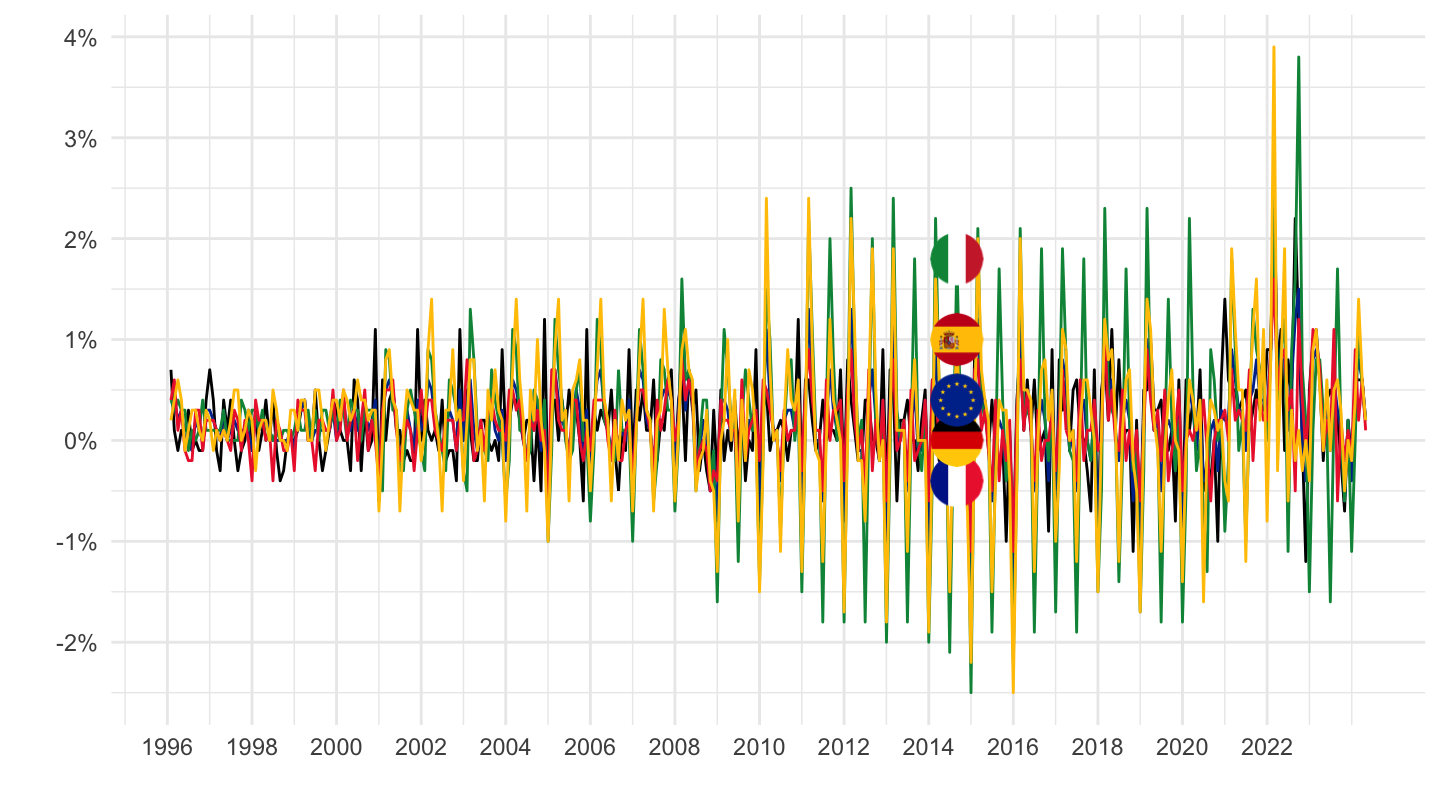
2016-
Code
prc_hicp_mmor %>%
  filter(coicop == "CP00",
         geo %in% c("FR", "DE", "ES", "IT", "EA19")) %>%
  month_to_date %>%
  filter(date >= as.Date("2016-01-01")) %>%

  mutate(Geo = ifelse(geo == "EA19", "Europe", Geo)) %>%
  left_join(colors, by = c("Geo" = "country")) %>%
  mutate(values = values/100) %>%
  ggplot(.) + geom_line(aes(x = date, y = values, color = color)) +
  theme_minimal() + xlab("") + ylab("") +
  scale_x_date(breaks = seq(1960, 2100, 1) %>% paste0("-01-01") %>% as.Date,
               labels = date_format("%Y")) +
  scale_y_continuous(breaks = 0.01*seq(-20, 20, 1),
                     labels = percent_format(a = 1)) +
  scale_color_identity() + add_5flags +
  theme(legend.position = c(0.75, 0.90),
        legend.title = element_blank())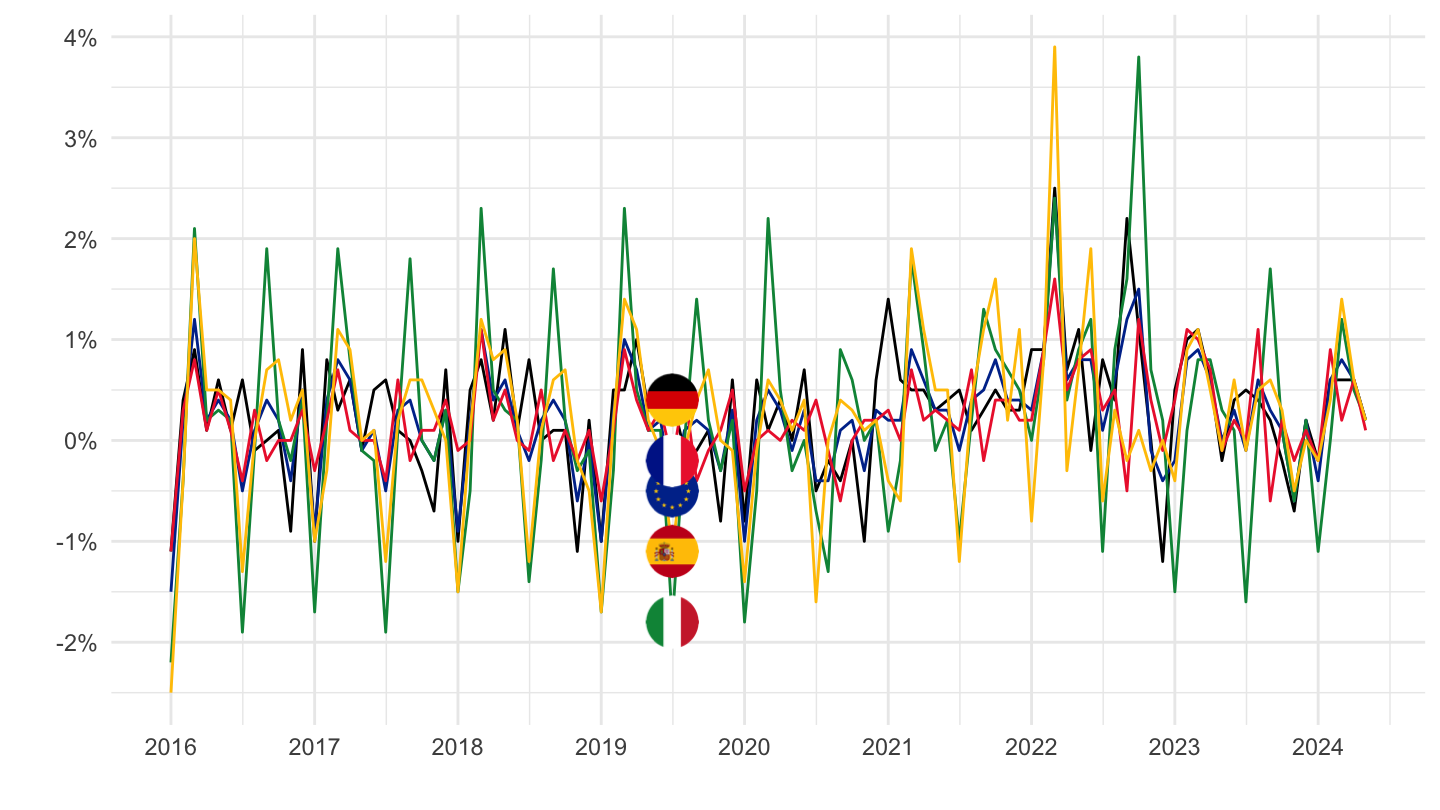
2020-
Code
prc_hicp_mmor %>%
  filter(coicop == "CP00",
         geo %in% c("FR", "DE", "ES", "IT", "EA19")) %>%
  month_to_date %>%
  filter(date >= as.Date("2020-01-01")) %>%

  mutate(Geo = ifelse(geo == "EA19", "Europe", Geo)) %>%
  left_join(colors, by = c("Geo" = "country")) %>%
  mutate(values = values/100) %>%
  ggplot(.) + geom_line(aes(x = date, y = values, color = color)) +
  theme_minimal() + xlab("") + ylab("") +
  scale_x_date(breaks = seq.Date(as.Date("2019-12-01"), as.Date("2100-01-01"), "3 months"),
               labels = date_format("%b %Y")) +
  scale_y_continuous(breaks = 0.01*seq(-20, 20, 1),
                     labels = percent_format(a = 1)) +
  scale_color_identity() + add_5flags +
  theme(legend.position = c(0.75, 0.90),
        legend.title = element_blank())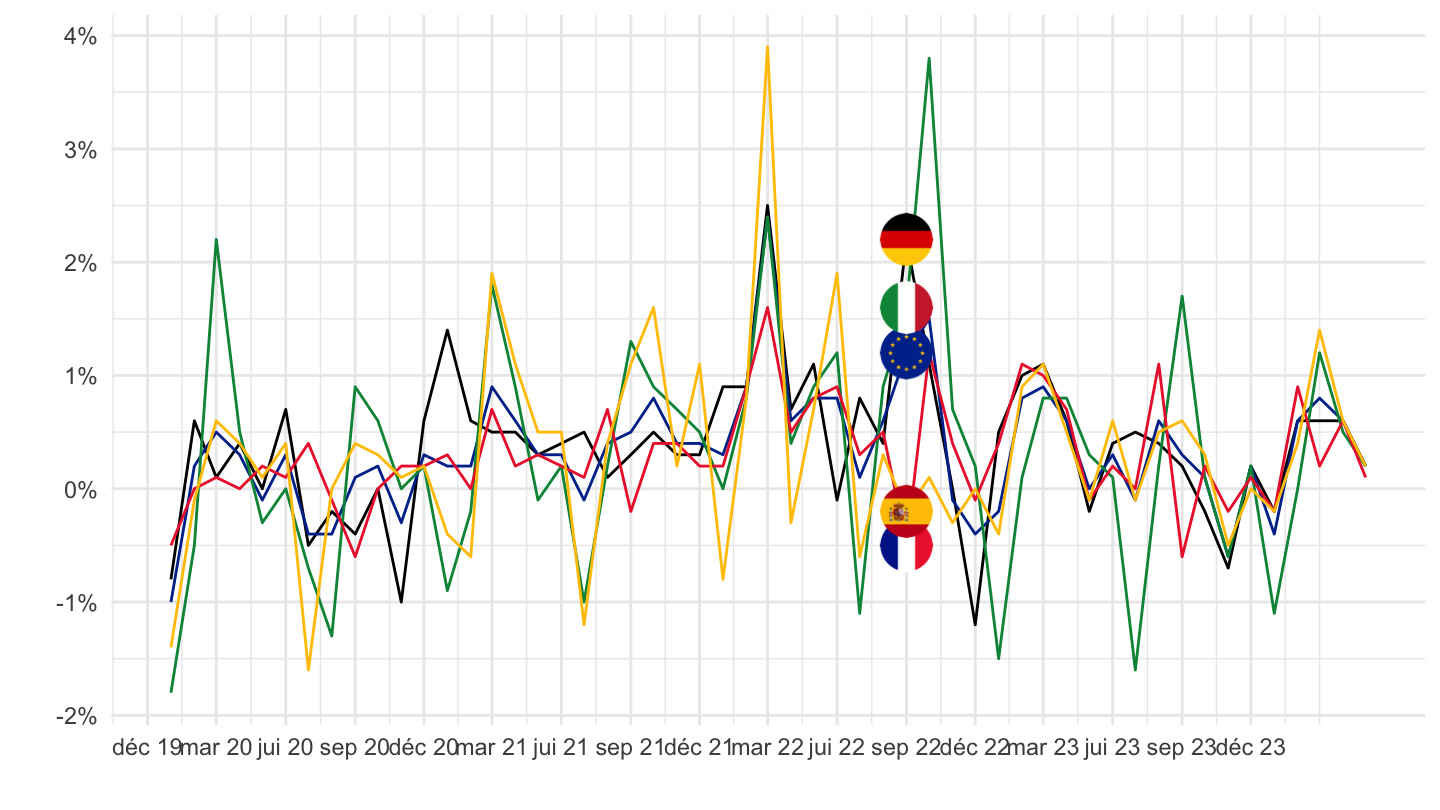
AP_NRG
All
Code
prc_hicp_mmor %>%
  filter(coicop == "AP_NRG",
         geo %in% c("FR", "DE", "ES", "IT", "EA19")) %>%
  month_to_date %>%

  mutate(Geo = ifelse(geo == "EA19", "Europe", Geo)) %>%
  left_join(colors, by = c("Geo" = "country")) %>%
  mutate(values = values/100) %>%
  ggplot(.) + geom_line(aes(x = date, y = values, color = color)) +
  theme_minimal() + xlab("") + ylab("") +
  scale_x_date(breaks = seq(1960, 2100, 2) %>% paste0("-01-01") %>% as.Date,
               labels = date_format("%Y")) +
  scale_y_continuous(breaks = 0.01*seq(-100, 100, 5),
                     labels = percent_format(a = 1)) +
  scale_color_identity() + add_5flags +
  theme(legend.position = c(0.75, 0.90),
        legend.title = element_blank())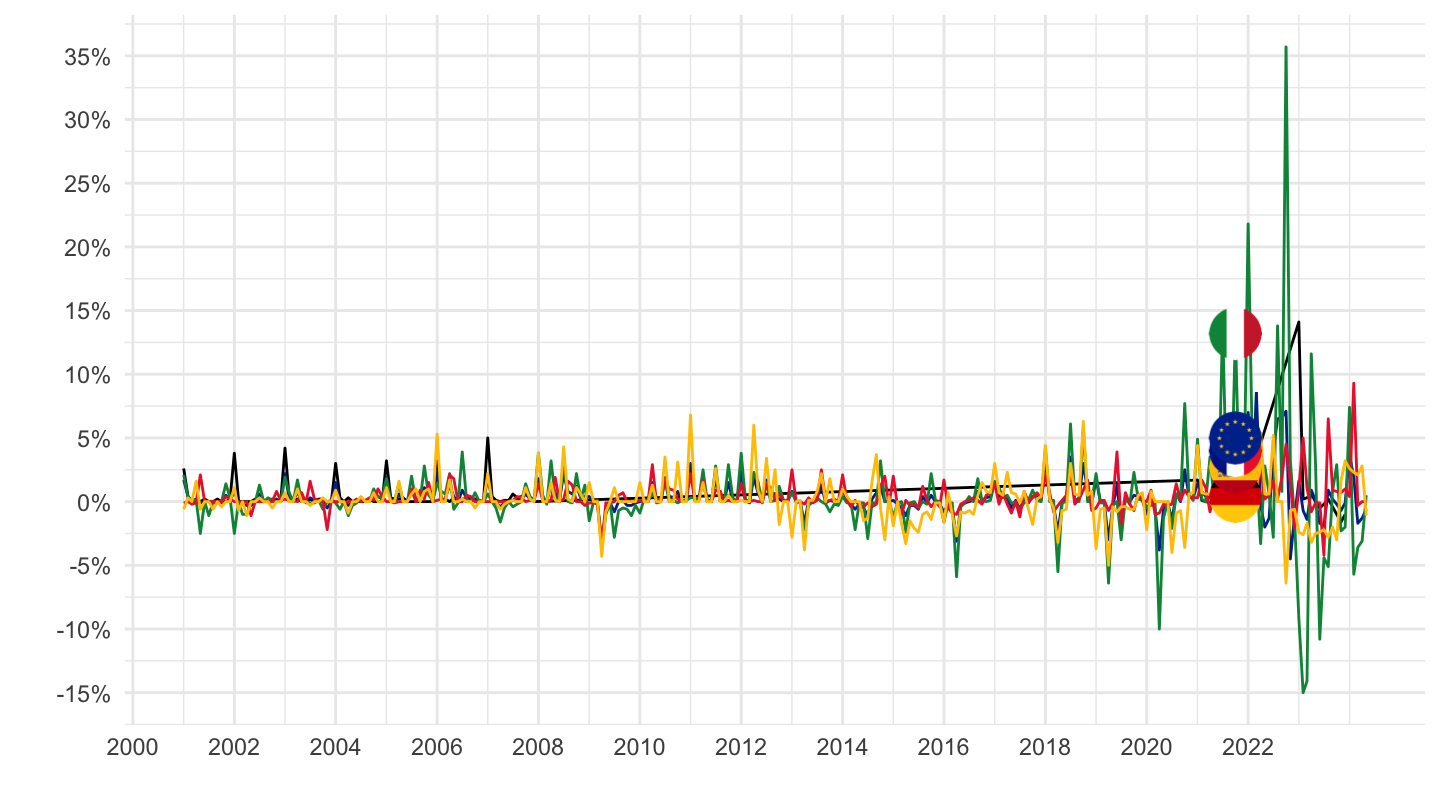
2016-
Code
prc_hicp_mmor %>%
  filter(coicop == "AP_NRG",
         geo %in% c("FR", "ES", "IT", "EA19")) %>%
  # group_by(geo) %>%
  # summarise(Nobs = n()) %>%
  month_to_date %>%
  filter(date >= as.Date("2016-01-01")) %>%

  mutate(Geo = ifelse(geo == "EA19", "Europe", Geo)) %>%
  left_join(colors, by = c("Geo" = "country")) %>%
  mutate(values = values/100) %>%
  ggplot(.) + geom_line(aes(x = date, y = values, color = color)) +
  theme_minimal() + xlab("") + ylab("") +
  scale_x_date(breaks = seq(1960, 2100, 1) %>% paste0("-01-01") %>% as.Date,
               labels = date_format("%Y")) +
  scale_y_continuous(breaks = 0.01*seq(-20, 100, 5),
                     labels = percent_format(a = 1)) +
  scale_color_identity() + add_4flags +
  theme(legend.position = c(0.75, 0.90),
        legend.title = element_blank())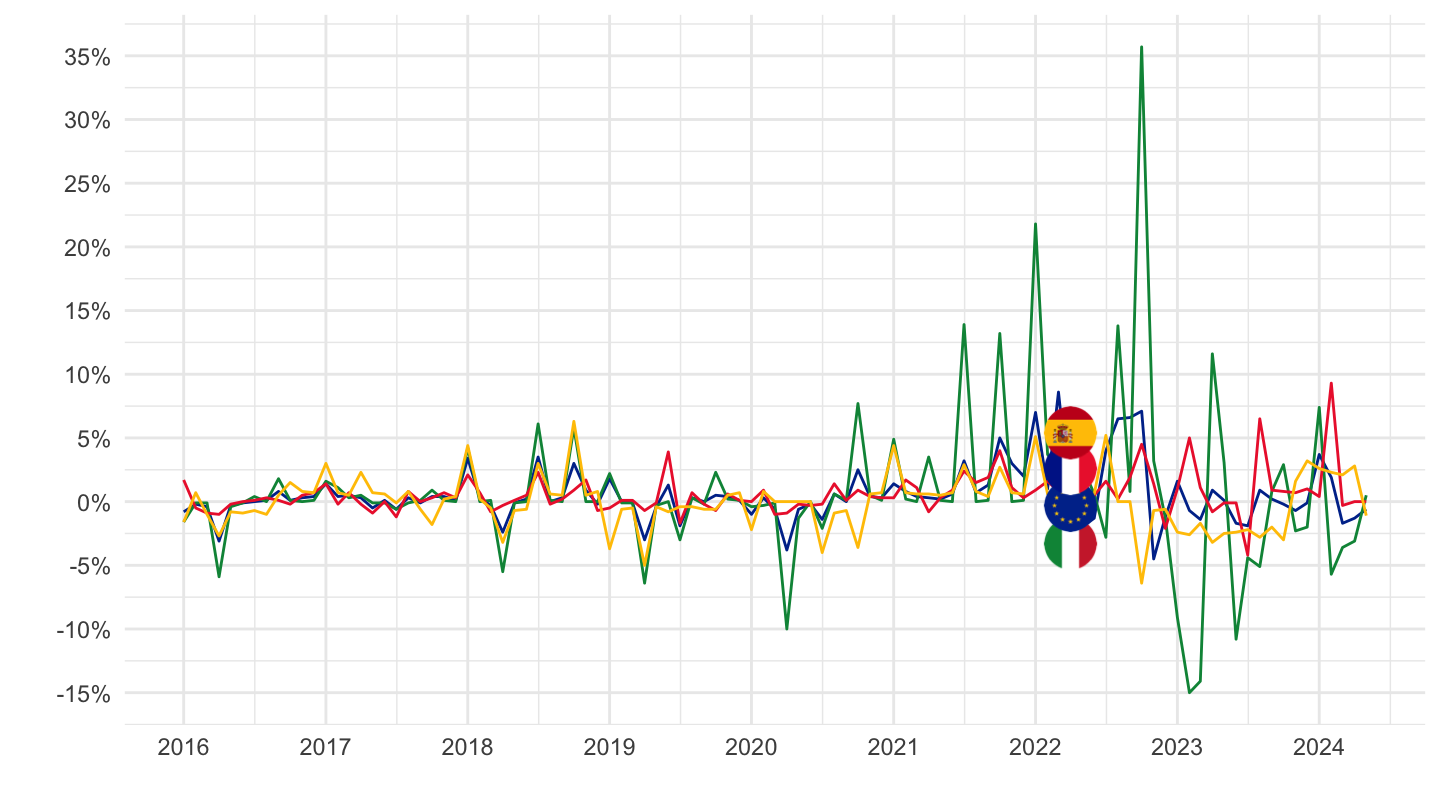
2020-
Code
prc_hicp_mmor %>%
  filter(coicop == "AP_NRG",
         geo %in% c("FR", "ES", "IT", "EA19")) %>%
  month_to_date %>%
  filter(date >= as.Date("2020-01-01")) %>%

  mutate(Geo = ifelse(geo == "EA19", "Europe", Geo)) %>%
  left_join(colors, by = c("Geo" = "country")) %>%
  mutate(values = values/100) %>%
  ggplot(.) + geom_line(aes(x = date, y = values, color = color)) +
  theme_minimal() + xlab("") + ylab("") +
  scale_x_date(breaks = seq.Date(as.Date("2019-12-01"), as.Date("2100-01-01"), "3 months"),
               labels = date_format("%b %Y")) +
  scale_y_continuous(breaks = 0.01*seq(-20, 100, 10),
                     labels = percent_format(a = 1)) +
  scale_color_identity() + add_4flags +
  theme(legend.position = c(0.75, 0.90),
        legend.title = element_blank())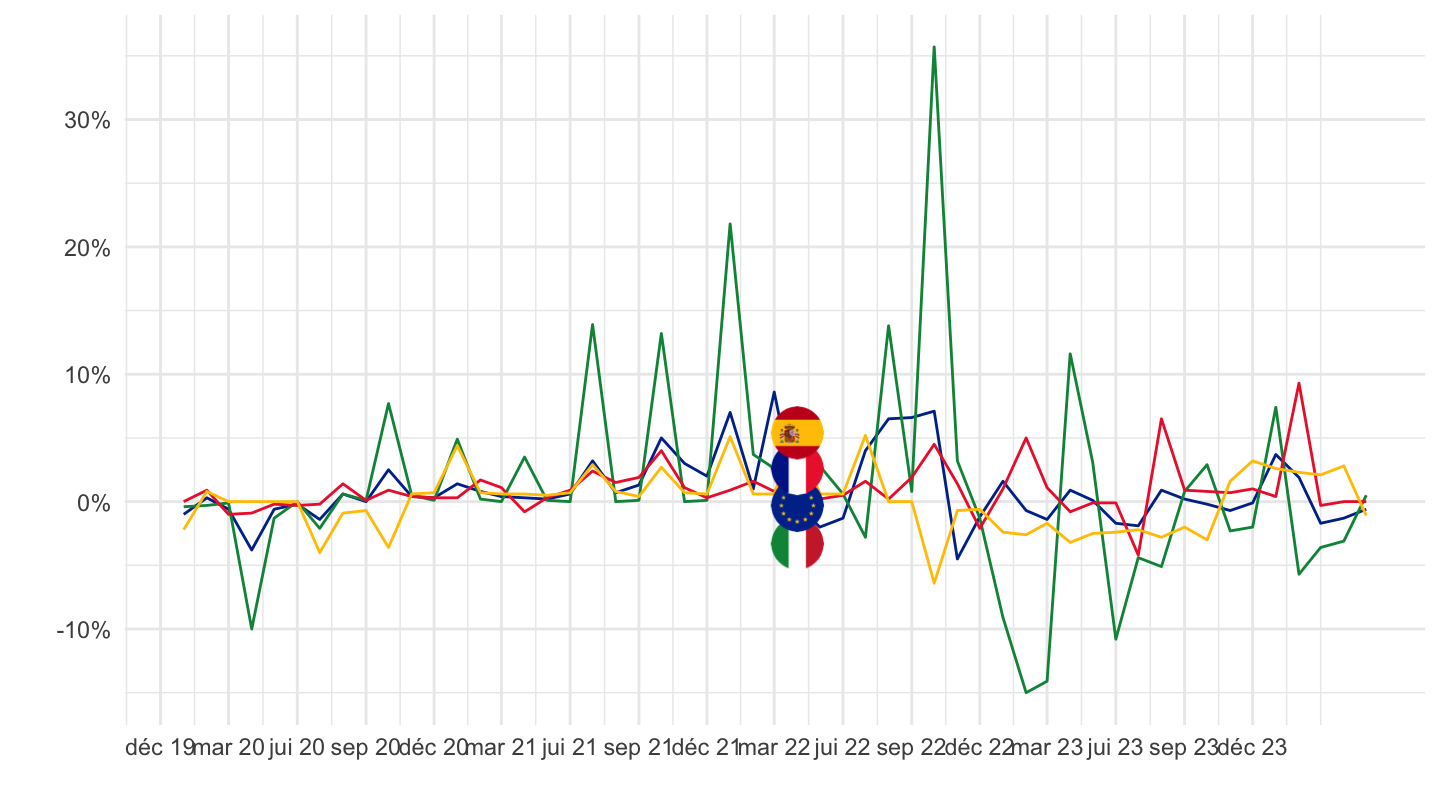
Last year
Code
prc_hicp_mmor %>%
  filter(coicop == "AP_NRG",
         geo %in% c("FR", "DE", "ES", "IT", "EA19")) %>%
  month_to_date %>%
  filter(date >= Sys.Date() -months(14)) %>%

  mutate(Geo = ifelse(geo == "EA19", "Europe", Geo)) %>%
  left_join(colors, by = c("Geo" = "country")) %>%
  mutate(values = values/100) %>%
  ggplot(.) + geom_line(aes(x = date, y = values, color = color)) +
  theme_minimal() + xlab("") + ylab("Administered Prices, Energy") +
  scale_x_date(breaks = seq.Date(as.Date("2019-12-01"), as.Date("2100-01-01"), "1 month"),
               labels = date_format("%b %Y")) +
  scale_y_continuous(breaks = 0.01*seq(-20, 100, 5),
                     labels = percent_format(a = 1)) +
  scale_color_identity() + add_5flags +
  theme(legend.position = c(0.75, 0.90),
        legend.title = element_blank())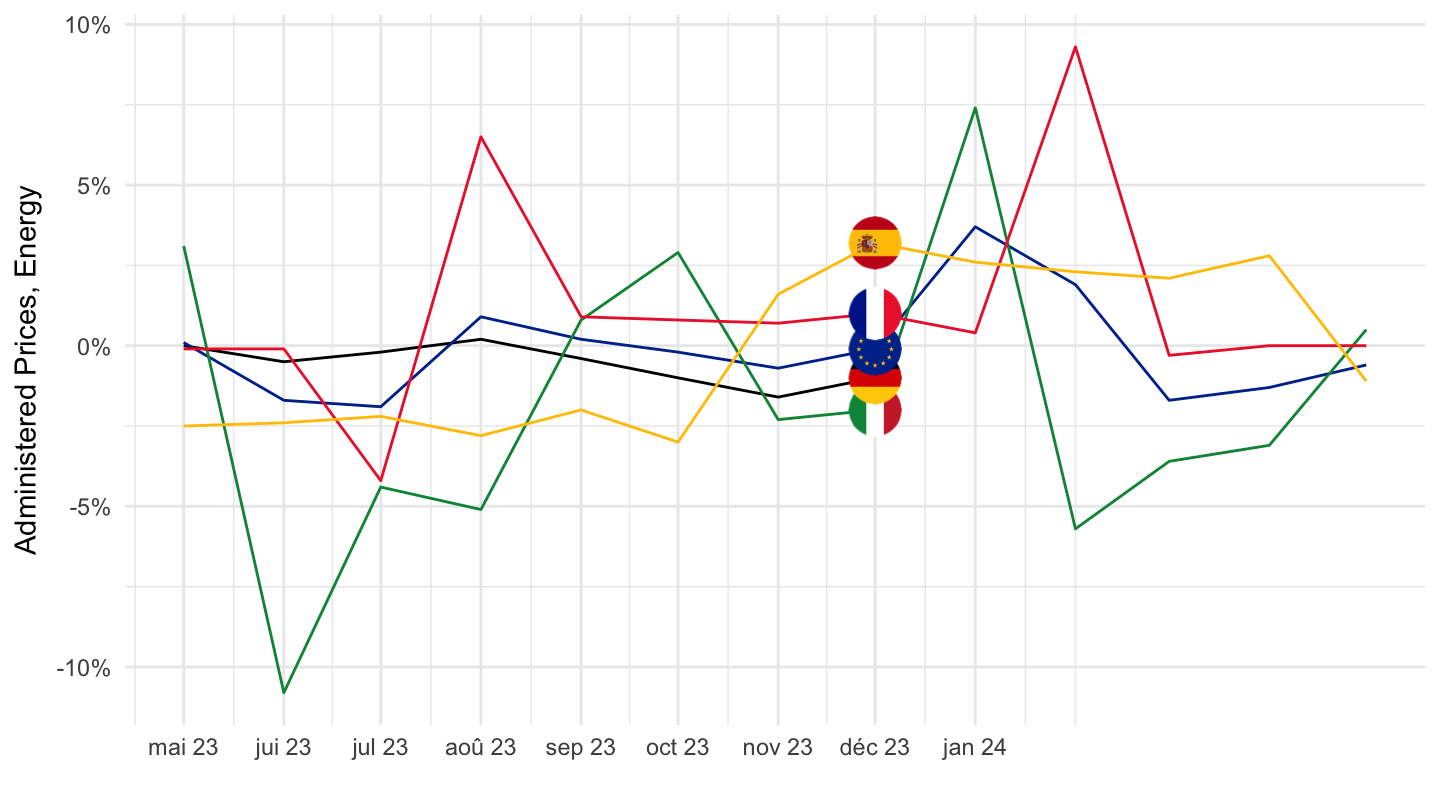
CP04521 - Natural gas and town gas
All
Code
prc_hicp_mmor %>%
  filter(coicop == "CP04521",
         geo %in% c("FR", "DE", "ES", "IT", "EA19")) %>%
  month_to_date %>%

  mutate(Geo = ifelse(geo == "EA19", "Europe", Geo)) %>%
  left_join(colors, by = c("Geo" = "country")) %>%
  mutate(values = values/100) %>%
  ggplot(.) + geom_line(aes(x = date, y = values, color = color)) +
  theme_minimal() + xlab("") + ylab("") +
  scale_x_date(breaks = seq(1960, 2100, 2) %>% paste0("-01-01") %>% as.Date,
               labels = date_format("%Y")) +
  scale_y_continuous(breaks = 0.01*seq(-100, 100, 1),
                     labels = percent_format(a = 1)) +
  scale_color_identity() + add_5flags +
  theme(legend.position = c(0.75, 0.90),
        legend.title = element_blank())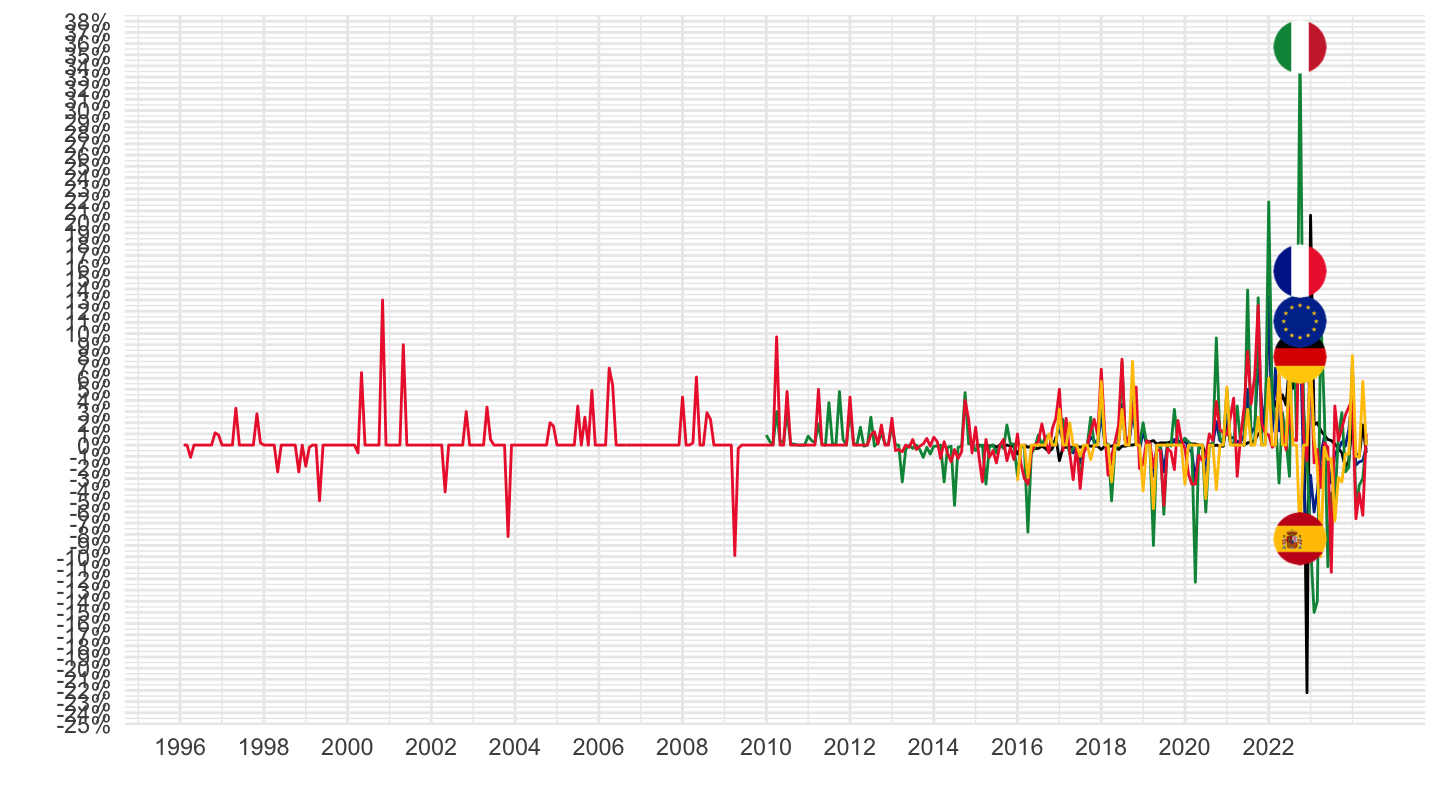
2016-
Code
prc_hicp_mmor %>%
  filter(coicop == "CP04521",
         geo %in% c("FR", "DE", "ES", "IT", "EA19")) %>%
  month_to_date %>%
  filter(date >= as.Date("2016-01-01")) %>%

  mutate(Geo = ifelse(geo == "EA19", "Europe", Geo)) %>%
  left_join(colors, by = c("Geo" = "country")) %>%
  mutate(values = values/100) %>%
  ggplot(.) + geom_line(aes(x = date, y = values, color = color)) +
  theme_minimal() + xlab("") + ylab("") +
  scale_x_date(breaks = seq(1960, 2100, 1) %>% paste0("-01-01") %>% as.Date,
               labels = date_format("%Y")) +
  scale_y_continuous(breaks = 0.01*seq(-20, 100, 5),
                     labels = percent_format(a = 1)) +
  scale_color_identity() + add_5flags +
  theme(legend.position = c(0.75, 0.90),
        legend.title = element_blank())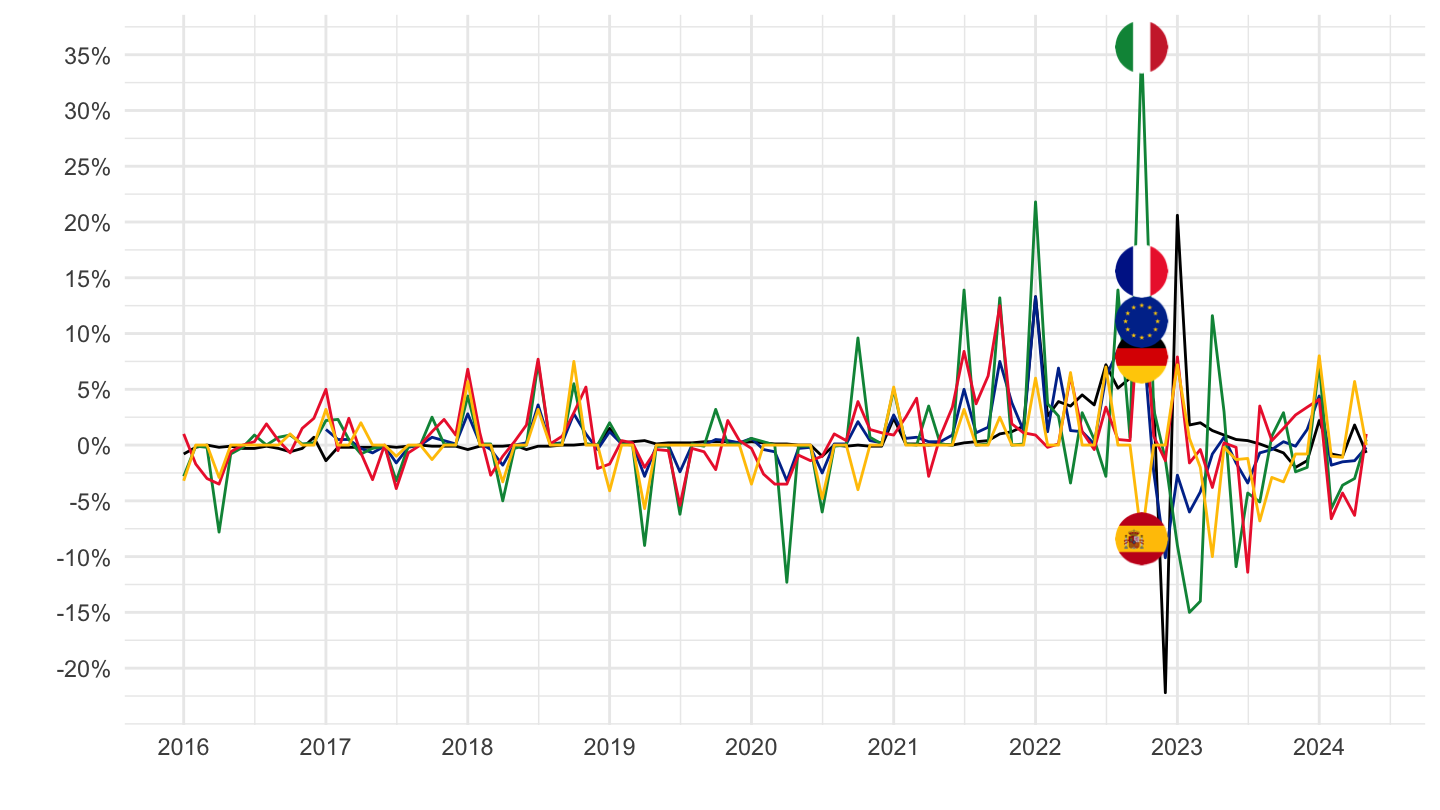
2020-
Code
prc_hicp_mmor %>%
  filter(coicop == "CP04521",
         geo %in% c("FR", "DE", "ES", "IT", "EA19")) %>%
  month_to_date %>%
  filter(date >= as.Date("2020-01-01")) %>%

  mutate(Geo = ifelse(geo == "EA19", "Europe", Geo)) %>%
  left_join(colors, by = c("Geo" = "country")) %>%
  mutate(values = values/100) %>%
  ggplot(.) + geom_line(aes(x = date, y = values, color = color)) +
  theme_minimal() + xlab("") + ylab("Inflation, CP04521 - Natural gas and town gas (%)") +
  scale_x_date(breaks = seq.Date(as.Date("2019-12-01"), as.Date("2100-01-01"), "3 months"),
               labels = date_format("%b %Y")) +
  scale_y_continuous(breaks = 0.01*seq(-20, 100, 5),
                     labels = percent_format(a = 1)) +
  scale_color_identity() + add_4flags +
  theme(legend.position = c(0.75, 0.90),
        legend.title = element_blank()) +
  geom_hline(yintercept = 0, linetype = "dashed")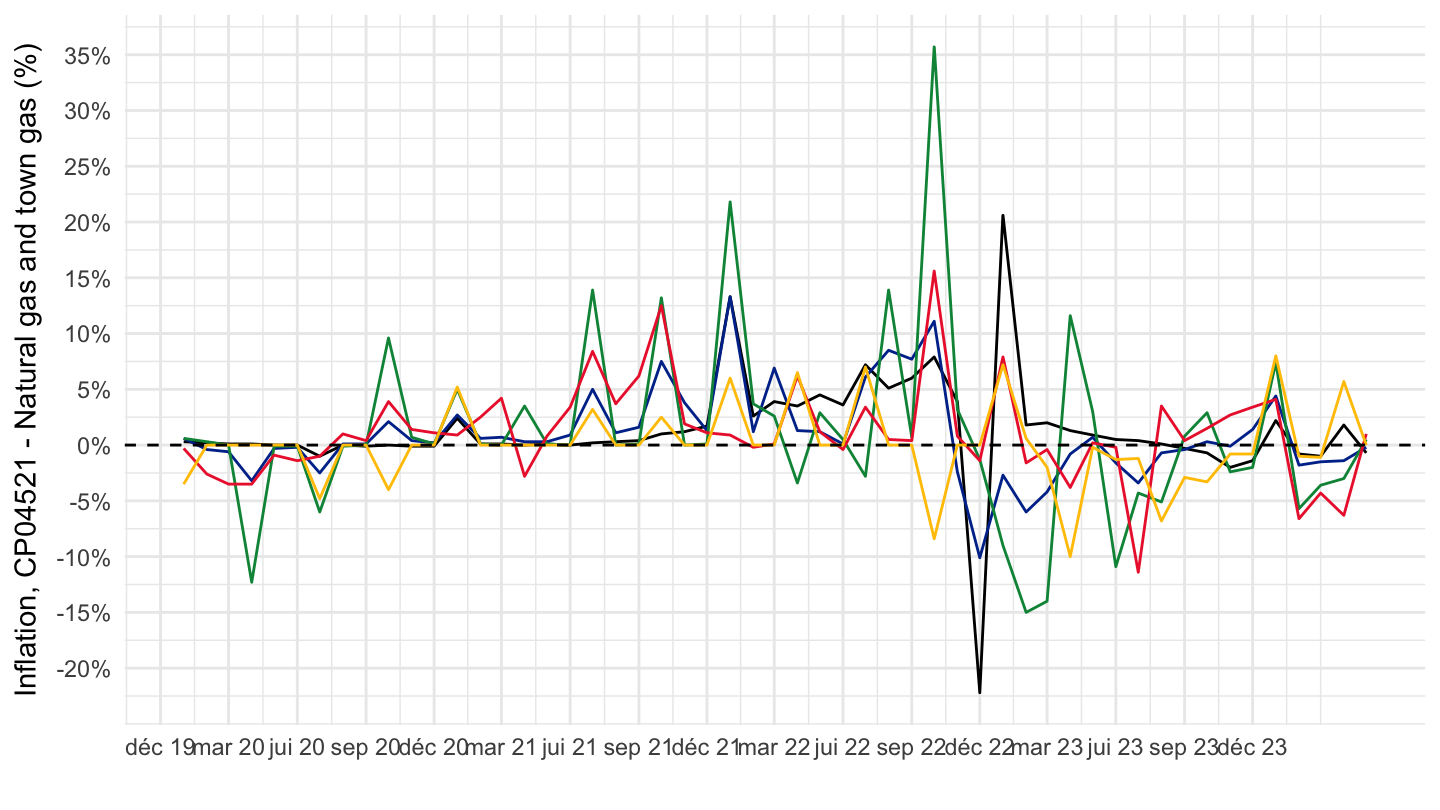
CP011 - Food
All
Code
prc_hicp_mmor %>%
  filter(coicop == "CP011",
         geo %in% c("FR", "DE", "ES", "IT", "EA19")) %>%
  month_to_date %>%

  mutate(Geo = ifelse(geo == "EA19", "Europe", Geo)) %>%
  left_join(colors, by = c("Geo" = "country")) %>%
  mutate(values = values/100) %>%
  ggplot(.) + geom_line(aes(x = date, y = values, color = color)) +
  theme_minimal() + xlab("") + ylab("") +
  scale_x_date(breaks = seq(1960, 2100, 2) %>% paste0("-01-01") %>% as.Date,
               labels = date_format("%Y")) +
  scale_y_continuous(breaks = 0.01*seq(-100, 100, 1),
                     labels = percent_format(a = 1)) +
  scale_color_identity() + add_5flags +
  theme(legend.position = c(0.75, 0.90),
        legend.title = element_blank())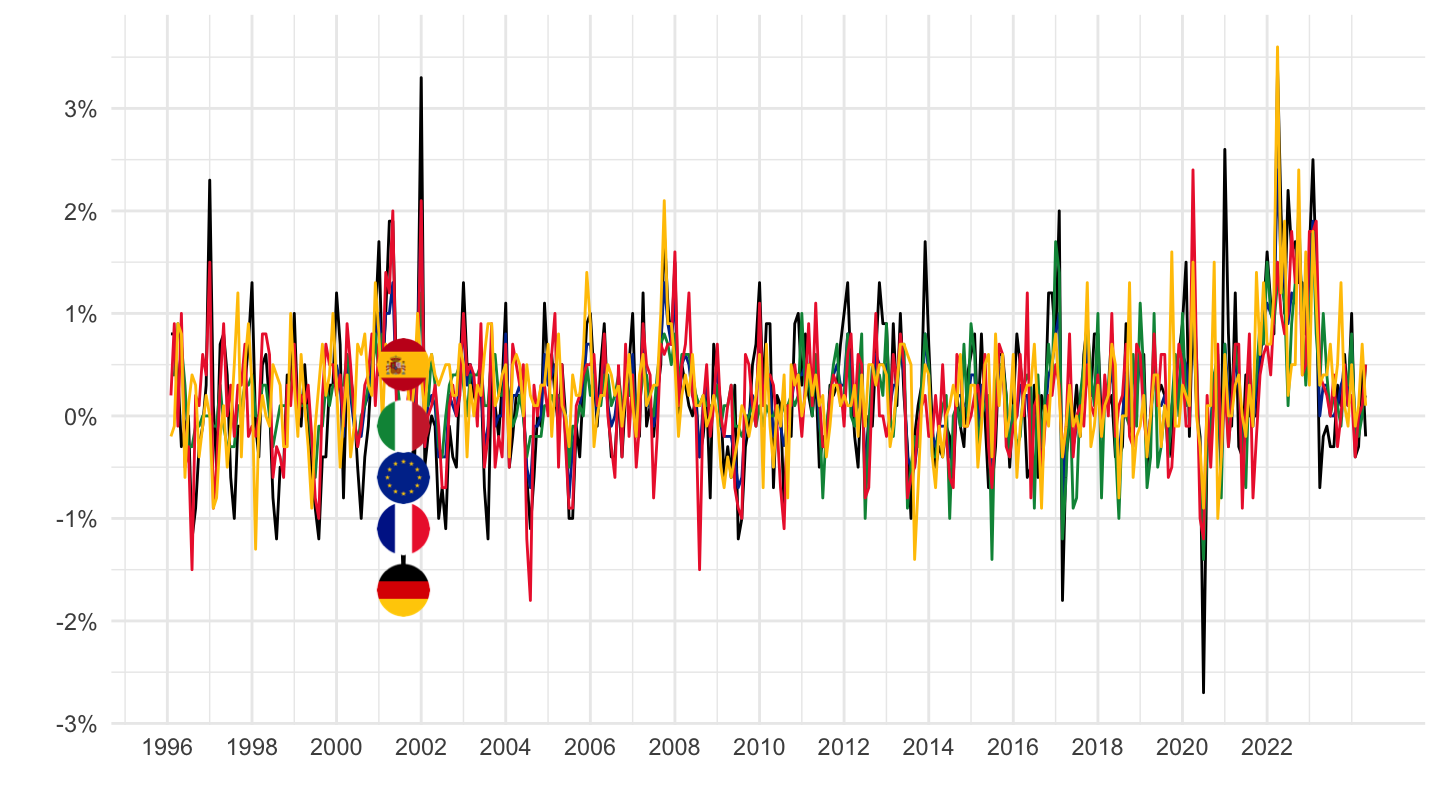
2016-
Code
prc_hicp_mmor %>%
  filter(coicop == "CP011",
         geo %in% c("FR", "DE", "ES", "IT", "EA19")) %>%
  month_to_date %>%
  filter(date >= as.Date("2016-01-01")) %>%

  mutate(Geo = ifelse(geo == "EA19", "Europe", Geo)) %>%
  left_join(colors, by = c("Geo" = "country")) %>%
  mutate(values = values/100) %>%
  ggplot(.) + geom_line(aes(x = date, y = values, color = color)) +
  theme_minimal() + xlab("") + ylab("") +
  scale_x_date(breaks = seq(1960, 2100, 1) %>% paste0("-01-01") %>% as.Date,
               labels = date_format("%Y")) +
  scale_y_continuous(breaks = 0.01*seq(-20, 100, 1),
                     labels = percent_format(a = 1)) +
  scale_color_identity() + add_5flags +
  theme(legend.position = c(0.75, 0.90),
        legend.title = element_blank())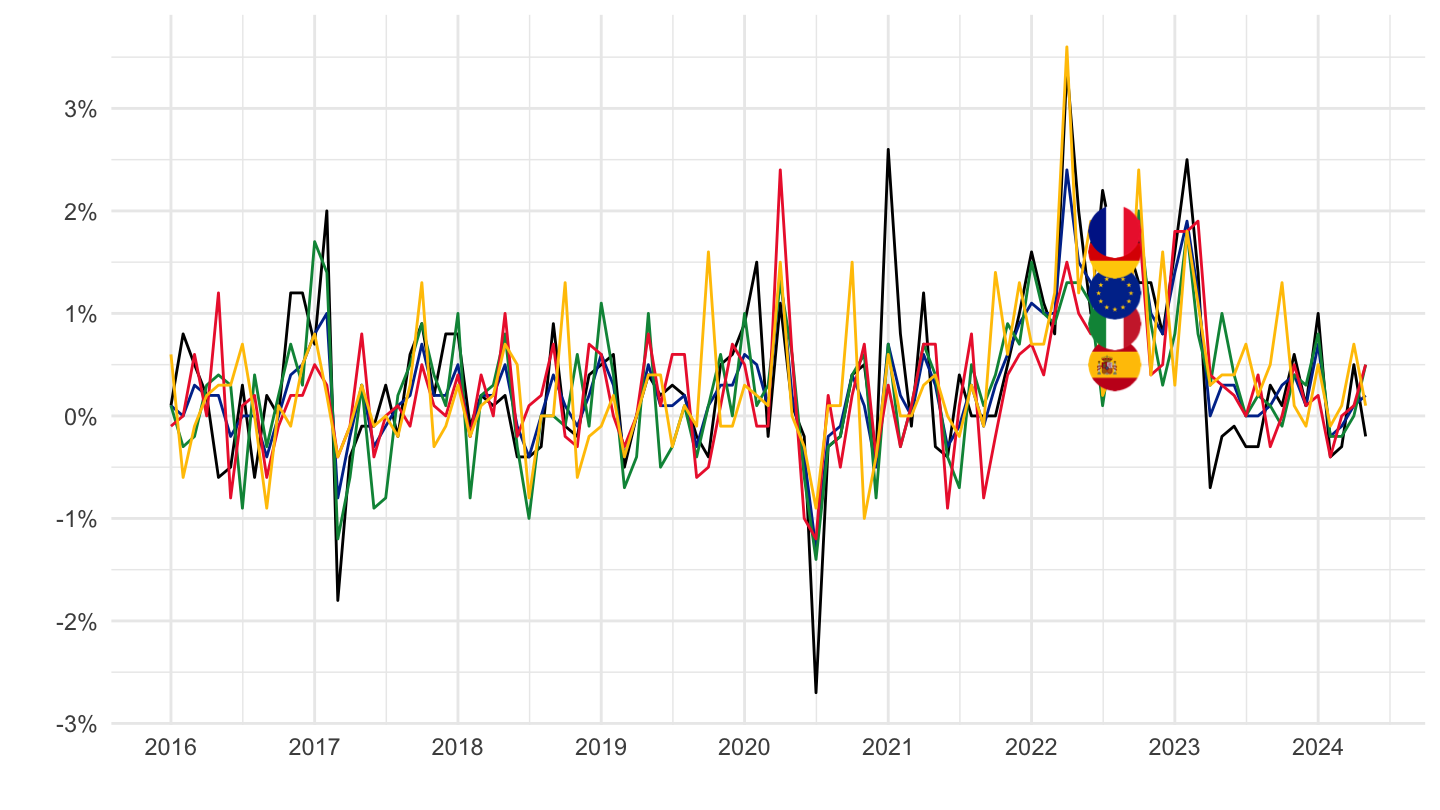
2020-
Code
prc_hicp_mmor %>%
  filter(coicop == "CP011",
         geo %in% c("FR", "DE", "ES", "IT", "EA19")) %>%
  month_to_date %>%
  filter(date >= as.Date("2020-01-01")) %>%

  mutate(Geo = ifelse(geo == "EA19", "Europe", Geo)) %>%
  left_join(colors, by = c("Geo" = "country")) %>%
  mutate(values = values/100) %>%
  ggplot(.) + geom_line(aes(x = date, y = values, color = color)) +
  theme_minimal() + xlab("") + ylab("Inflation, CP011 - Alimentation (%)") +
  scale_x_date(breaks = seq.Date(as.Date("2019-12-01"), as.Date("2100-01-01"), "3 months"),
               labels = date_format("%b %Y")) +
  scale_y_continuous(breaks = 0.01*seq(-20, 100, 1),
                     labels = percent_format(a = 1)) +
  scale_color_identity() + add_5flags +
  theme(legend.position = c(0.75, 0.90),
        legend.title = element_blank()) +
  geom_hline(yintercept = 0, linetype = "dashed")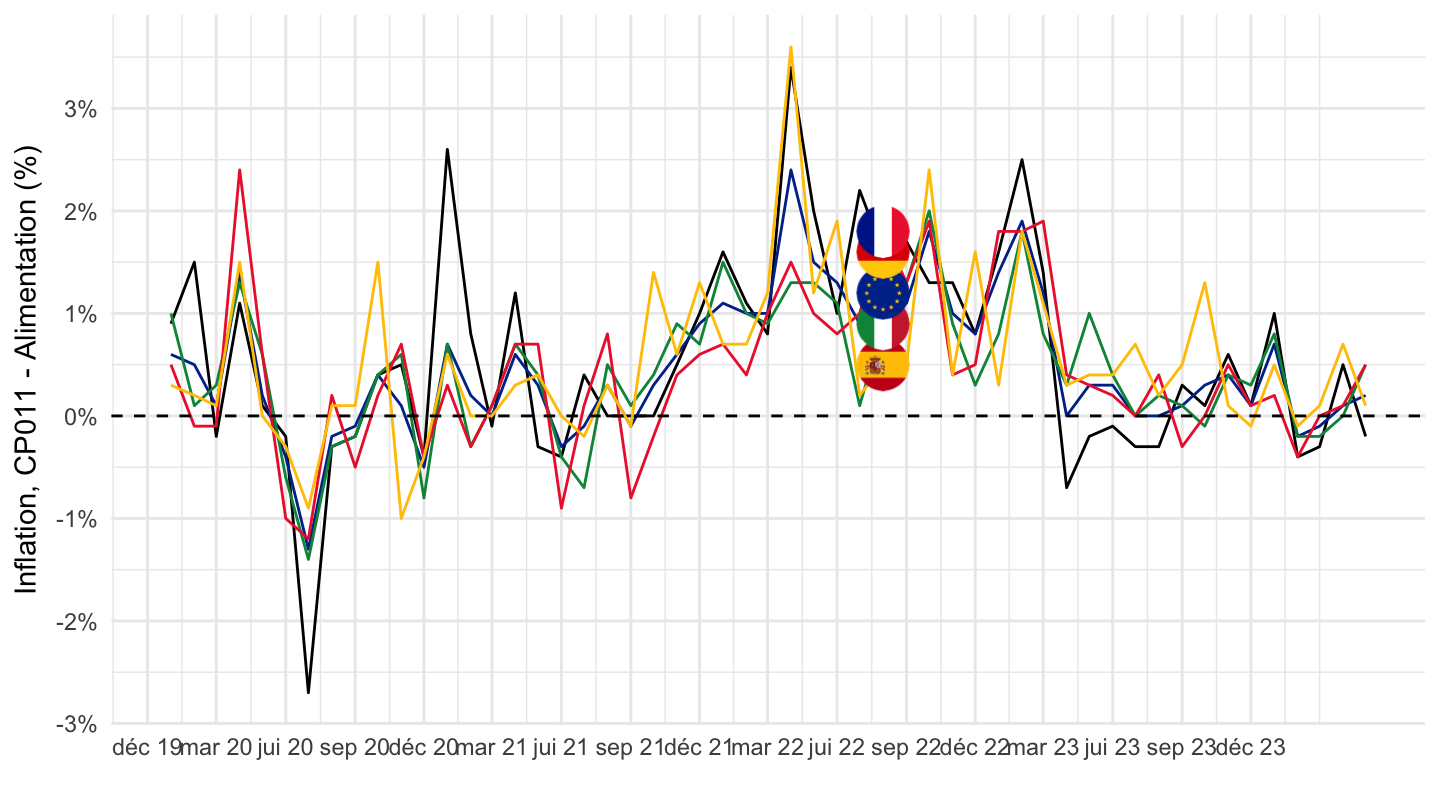
Last year
Code
prc_hicp_mmor %>%
  filter(coicop == "CP011",
         geo %in% c("FR", "DE", "ES", "IT", "EA19")) %>%
  month_to_date %>%
  filter(date >= Sys.Date() -months(14)) %>%

  mutate(Geo = ifelse(geo == "EA19", "Europe", Geo)) %>%
  left_join(colors, by = c("Geo" = "country")) %>%
  mutate(values = values/100) %>%
  ggplot(.) + geom_line(aes(x = date, y = values, color = color)) +
  theme_minimal() + xlab("") + ylab("Inflation, CP011 - Alimentation (%)") +
  scale_x_date(breaks = seq.Date(as.Date("2019-12-01"), as.Date("2100-01-01"), "1 month"),
               labels = date_format("%b %Y")) +
  scale_y_continuous(breaks = 0.01*seq(-20, 100, 1),
                     labels = percent_format(a = 1)) +
  scale_color_identity() + add_5flags +
  theme(legend.position = c(0.75, 0.90),
        legend.title = element_blank())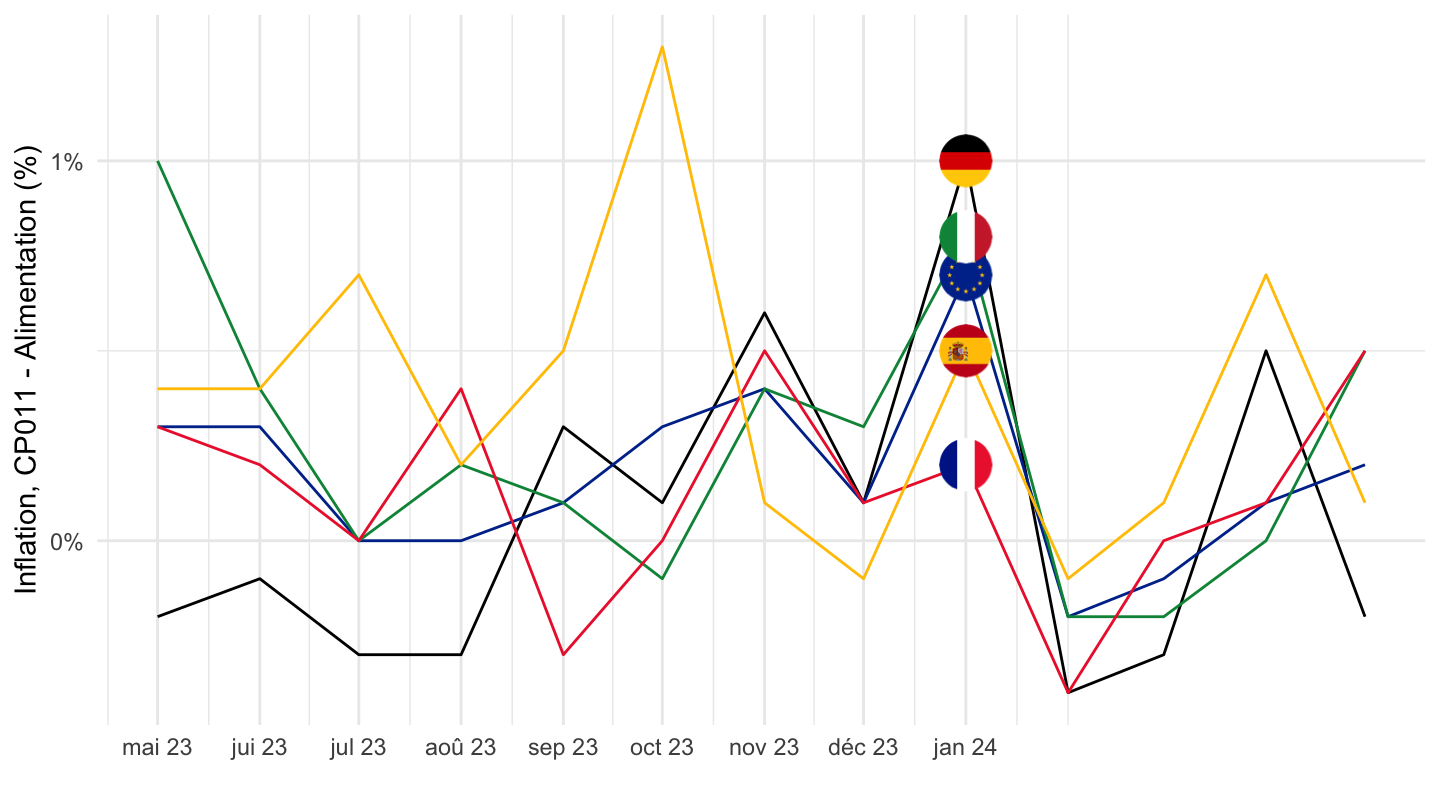
CP0111 - Bread and cereals
All
Code
prc_hicp_mmor %>%
  filter(coicop == "CP0111",
         geo %in% c("FR", "DE", "ES", "IT", "EA19")) %>%
  month_to_date %>%

  mutate(Geo = ifelse(geo == "EA19", "Europe", Geo)) %>%
  left_join(colors, by = c("Geo" = "country")) %>%
  mutate(values = values/100) %>%
  ggplot(.) + geom_line(aes(x = date, y = values, color = color)) +
  theme_minimal() + xlab("") + ylab("") +
  scale_x_date(breaks = seq(1960, 2100, 2) %>% paste0("-01-01") %>% as.Date,
               labels = date_format("%Y")) +
  scale_y_continuous(breaks = 0.01*seq(-100, 100, 1),
                     labels = percent_format(a = 1)) +
  scale_color_identity() + add_5flags +
  theme(legend.position = c(0.75, 0.90),
        legend.title = element_blank())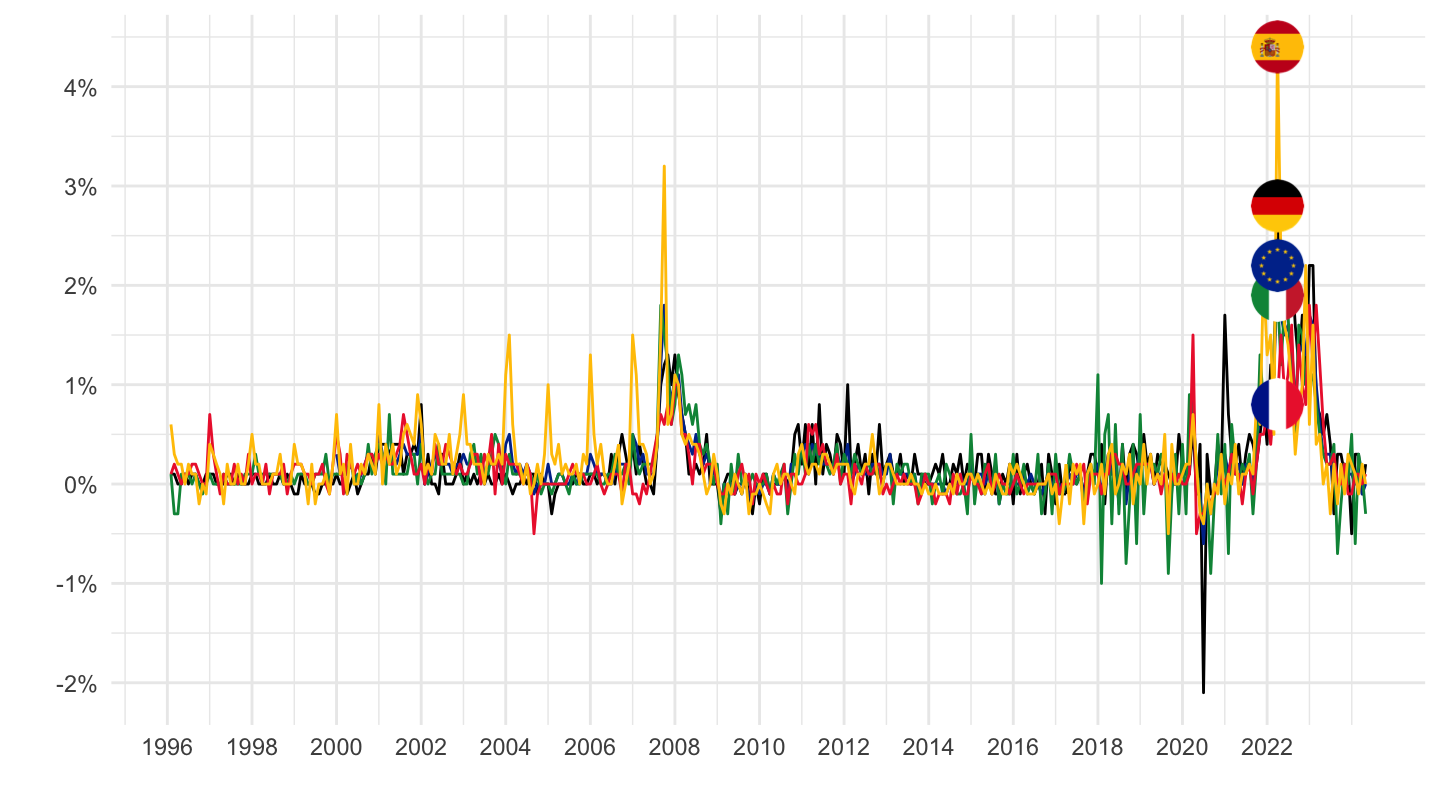
2016-
Code
prc_hicp_mmor %>%
  filter(coicop == "CP0111",
         geo %in% c("FR", "DE", "ES", "IT", "EA19")) %>%
  month_to_date %>%
  filter(date >= as.Date("2016-01-01")) %>%

  mutate(Geo = ifelse(geo == "EA19", "Europe", Geo)) %>%
  left_join(colors, by = c("Geo" = "country")) %>%
  mutate(values = values/100) %>%
  ggplot(.) + geom_line(aes(x = date, y = values, color = color)) +
  theme_minimal() + xlab("") + ylab("") +
  scale_x_date(breaks = seq(1960, 2100, 1) %>% paste0("-01-01") %>% as.Date,
               labels = date_format("%Y")) +
  scale_y_continuous(breaks = 0.01*seq(-20, 100, 1),
                     labels = percent_format(a = 1)) +
  scale_color_identity() + add_5flags +
  theme(legend.position = c(0.75, 0.90),
        legend.title = element_blank())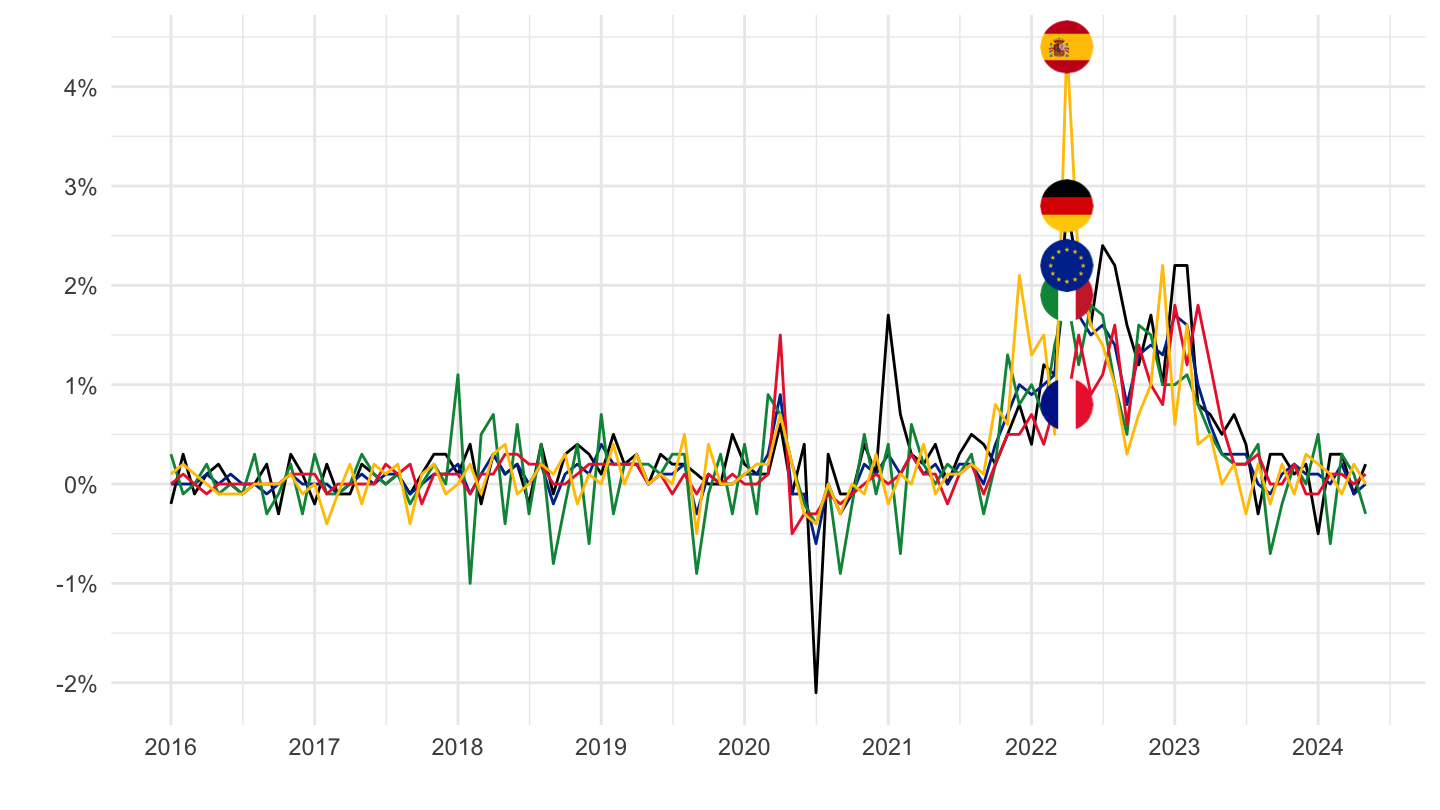
2020-
Code
prc_hicp_mmor %>%
  filter(coicop == "CP0111",
         geo %in% c("FR", "DE", "ES", "IT", "EA19")) %>%
  month_to_date %>%
  filter(date >= as.Date("2020-01-01")) %>%

  mutate(Geo = ifelse(geo == "EA19", "Europe", Geo)) %>%
  left_join(colors, by = c("Geo" = "country")) %>%
  mutate(values = values/100) %>%
  ggplot(.) + geom_line(aes(x = date, y = values, color = color)) +
  theme_minimal() + xlab("") + ylab("") +
  scale_x_date(breaks = seq.Date(as.Date("2019-12-01"), as.Date("2100-01-01"), "3 months"),
               labels = date_format("%b %Y")) +
  scale_y_continuous(breaks = 0.01*seq(-20, 100, 1),
                     labels = percent_format(a = 1)) +
  scale_color_identity() + add_5flags +
  theme(legend.position = c(0.75, 0.90),
        legend.title = element_blank())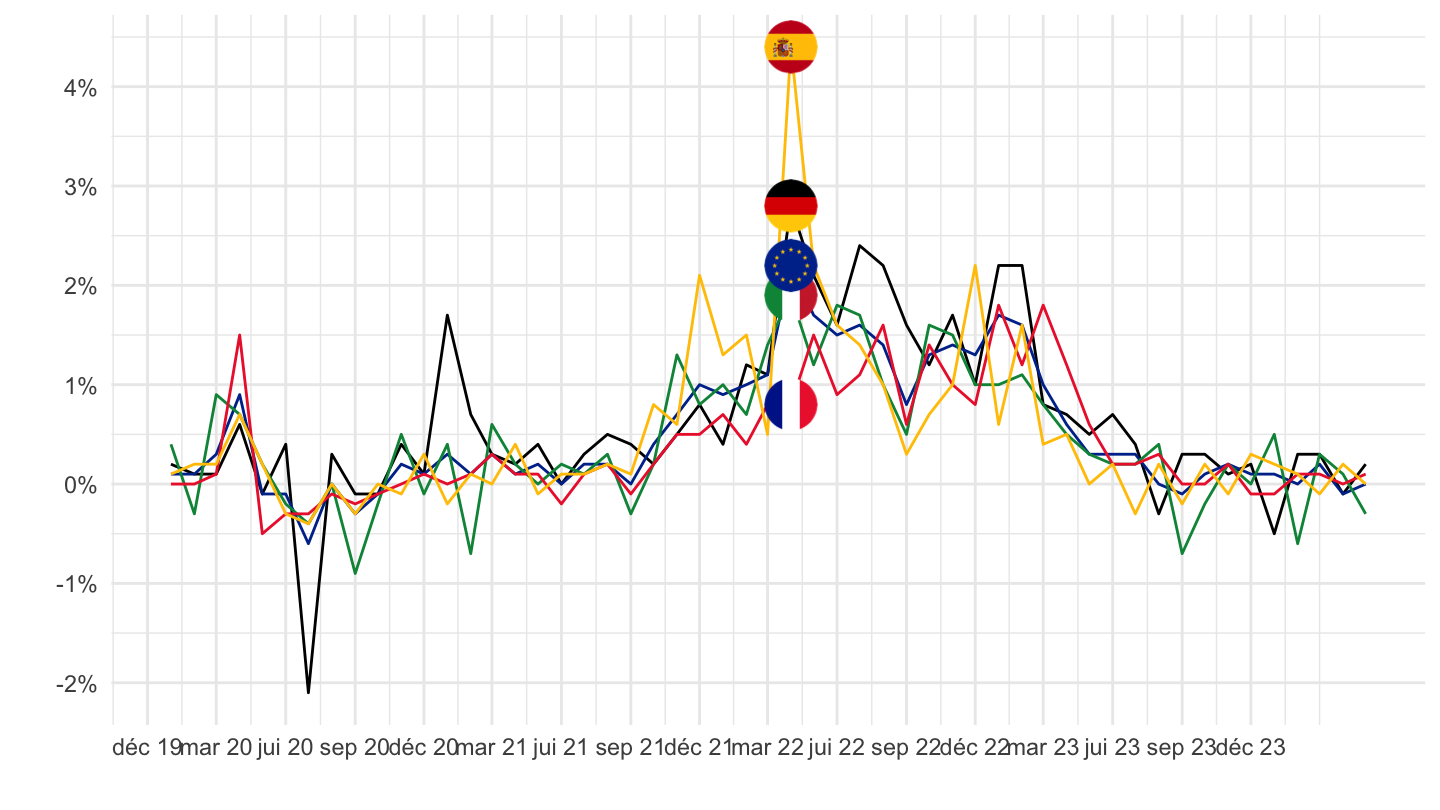
CP0112 - Meat
All
Code
prc_hicp_mmor %>%
  filter(coicop == "CP0112",
         geo %in% c("FR", "DE", "ES", "IT", "EA19")) %>%
  month_to_date %>%

  mutate(Geo = ifelse(geo == "EA19", "Europe", Geo)) %>%
  left_join(colors, by = c("Geo" = "country")) %>%
  mutate(values = values/100) %>%
  ggplot(.) + geom_line(aes(x = date, y = values, color = color)) +
  theme_minimal() + xlab("") + ylab("") +
  scale_x_date(breaks = seq(1960, 2100, 2) %>% paste0("-01-01") %>% as.Date,
               labels = date_format("%Y")) +
  scale_y_continuous(breaks = 0.01*seq(-100, 100, 1),
                     labels = percent_format(a = 1)) +
  scale_color_identity() + add_5flags +
  theme(legend.position = c(0.75, 0.90),
        legend.title = element_blank())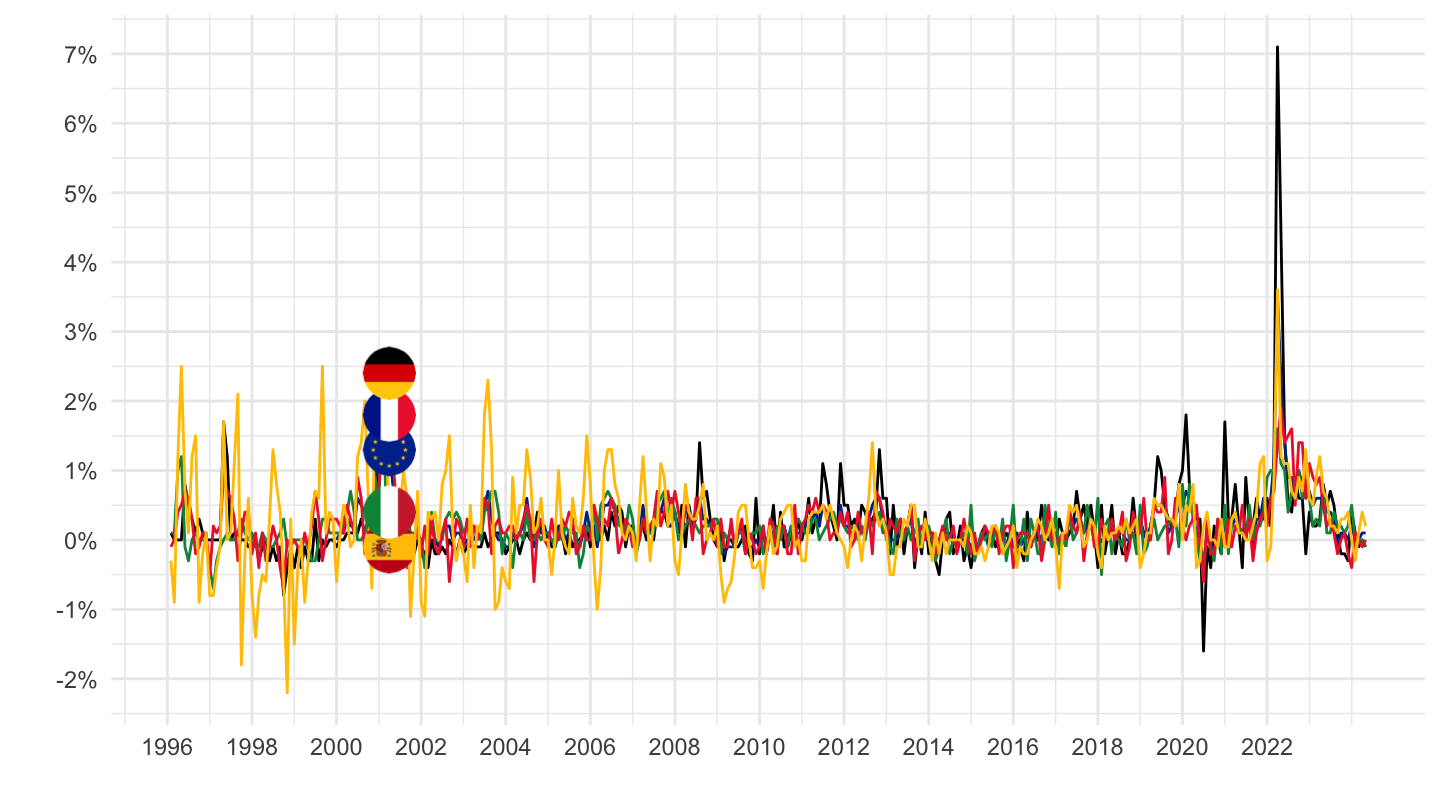
2016-
Code
prc_hicp_mmor %>%
  filter(coicop == "CP0112",
         geo %in% c("FR", "DE", "ES", "IT", "EA19")) %>%
  month_to_date %>%
  filter(date >= as.Date("2016-01-01")) %>%

  mutate(Geo = ifelse(geo == "EA19", "Europe", Geo)) %>%
  left_join(colors, by = c("Geo" = "country")) %>%
  mutate(values = values/100) %>%
  ggplot(.) + geom_line(aes(x = date, y = values, color = color)) +
  theme_minimal() + xlab("") + ylab("") +
  scale_x_date(breaks = seq(1960, 2100, 1) %>% paste0("-01-01") %>% as.Date,
               labels = date_format("%Y")) +
  scale_y_continuous(breaks = 0.01*seq(-20, 100, 1),
                     labels = percent_format(a = 1)) +
  scale_color_identity() + add_5flags +
  theme(legend.position = c(0.75, 0.90),
        legend.title = element_blank())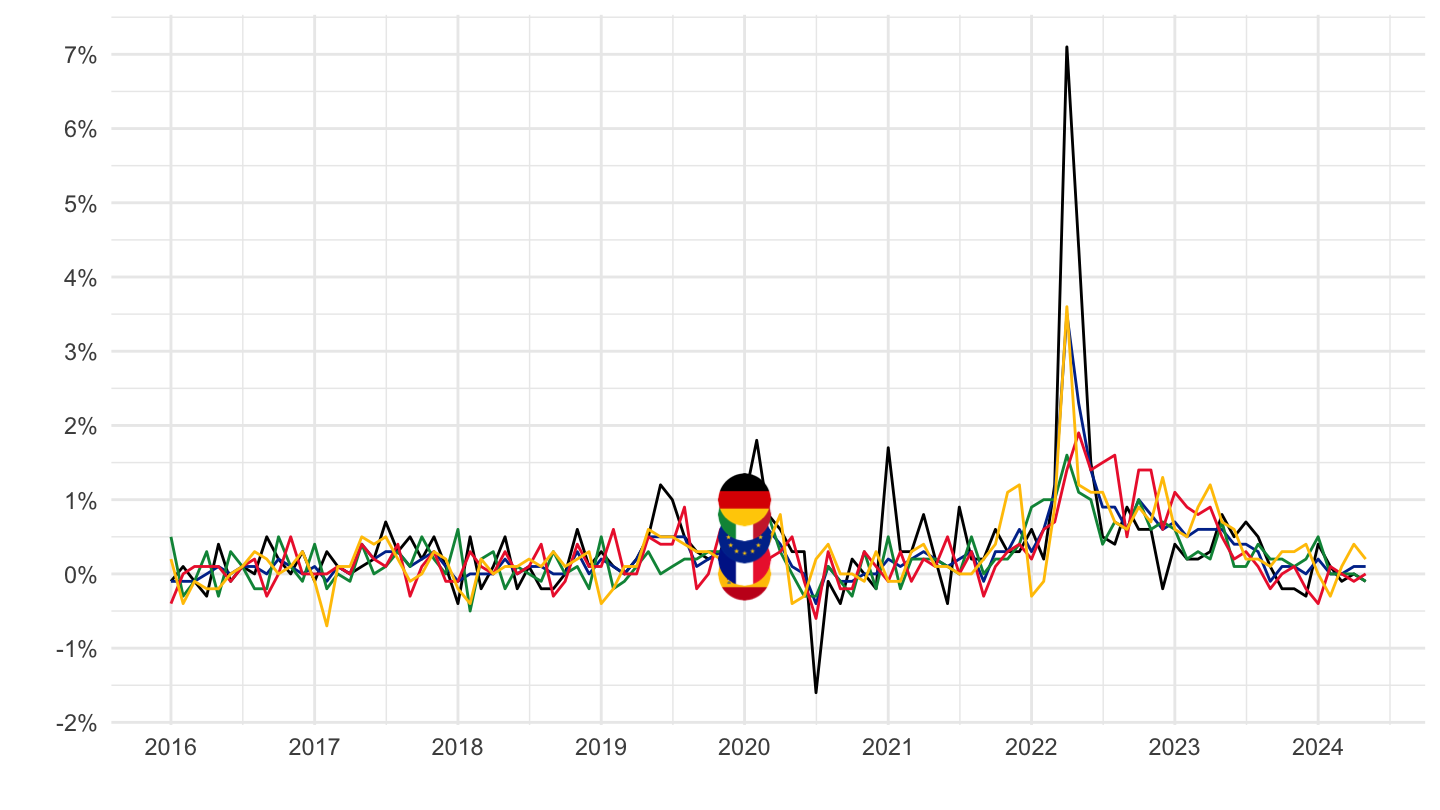
2020-
Code
prc_hicp_mmor %>%
  filter(coicop == "CP0112",
         geo %in% c("FR", "DE", "ES", "IT", "EA19")) %>%
  month_to_date %>%
  filter(date >= as.Date("2020-01-01")) %>%

  mutate(Geo = ifelse(geo == "EA19", "Europe", Geo)) %>%
  left_join(colors, by = c("Geo" = "country")) %>%
  mutate(values = values/100) %>%
  ggplot(.) + geom_line(aes(x = date, y = values, color = color)) +
  theme_minimal() + xlab("") + ylab("") +
  scale_x_date(breaks = seq.Date(as.Date("2019-12-01"), as.Date("2100-01-01"), "3 months"),
               labels = date_format("%b %Y")) +
  scale_y_continuous(breaks = 0.01*seq(-20, 100, 1),
                     labels = percent_format(a = 1)) +
  scale_color_identity() + add_5flags +
  theme(legend.position = c(0.75, 0.90),
        legend.title = element_blank())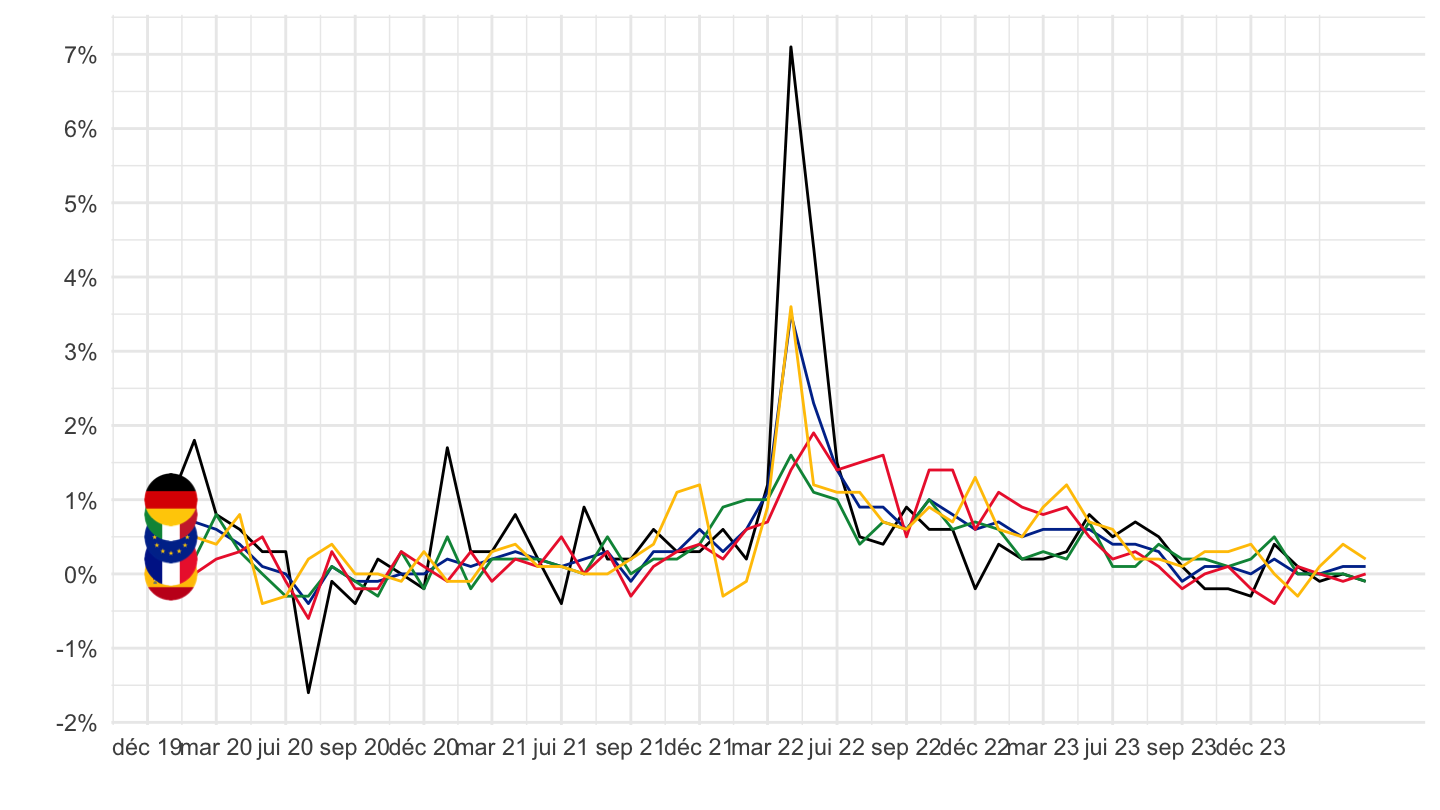
CP0114 - Milk, cheese and eggs
All
Code
prc_hicp_mmor %>%
  filter(coicop == "CP0114",
         geo %in% c("FR", "DE", "ES", "IT", "EA19")) %>%
  month_to_date %>%

  mutate(Geo = ifelse(geo == "EA19", "Europe", Geo)) %>%
  left_join(colors, by = c("Geo" = "country")) %>%
  mutate(values = values/100) %>%
  ggplot(.) + geom_line(aes(x = date, y = values, color = color)) +
  theme_minimal() + xlab("") + ylab("") +
  scale_x_date(breaks = seq(1960, 2100, 2) %>% paste0("-01-01") %>% as.Date,
               labels = date_format("%Y")) +
  scale_y_continuous(breaks = 0.01*seq(-100, 100, 1),
                     labels = percent_format(a = 1)) +
  scale_color_identity() + add_5flags +
  theme(legend.position = c(0.75, 0.90),
        legend.title = element_blank())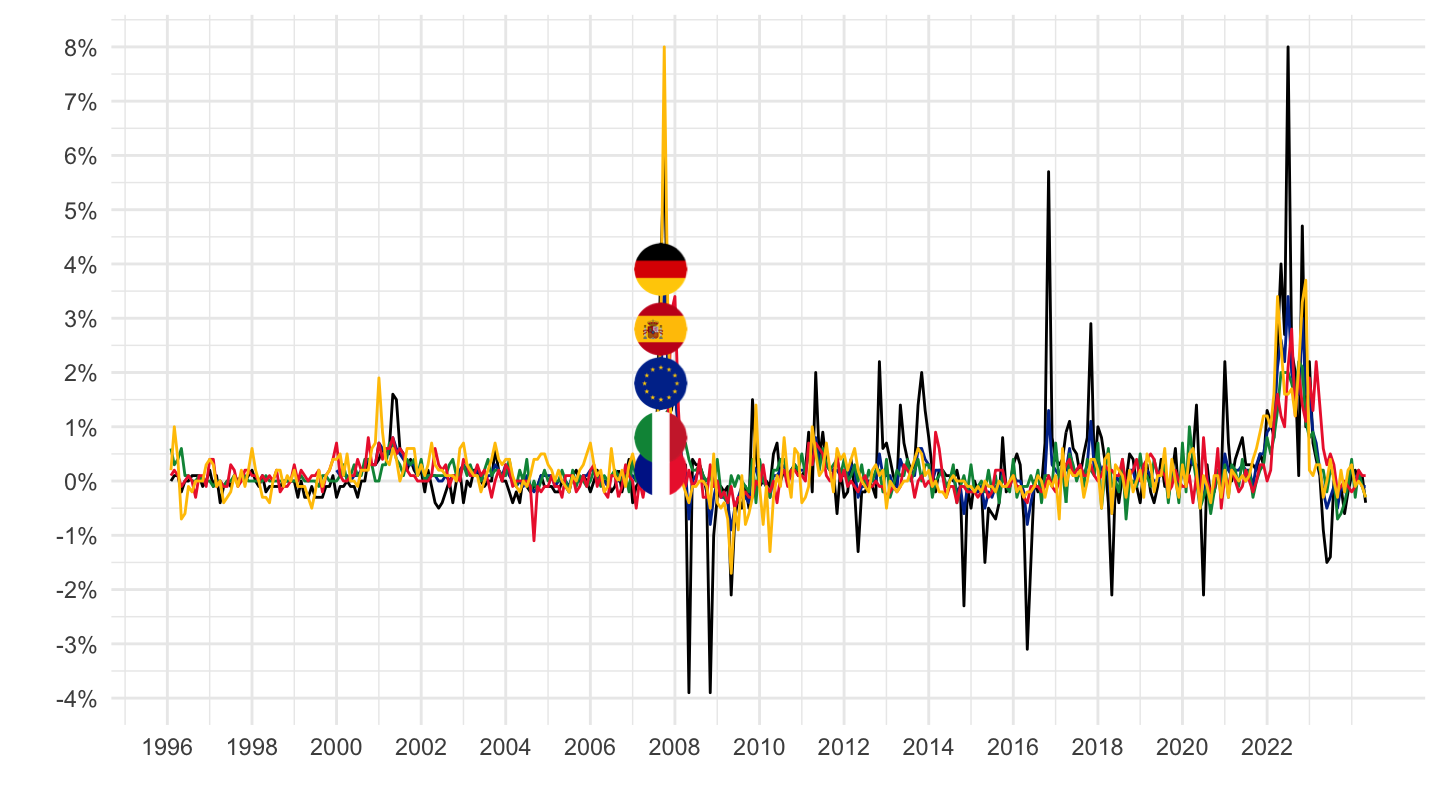
2016-
Code
prc_hicp_mmor %>%
  filter(coicop == "CP0114",
         geo %in% c("FR", "DE", "ES", "IT", "EA19")) %>%
  month_to_date %>%
  filter(date >= as.Date("2016-01-01")) %>%

  mutate(Geo = ifelse(geo == "EA19", "Europe", Geo)) %>%
  left_join(colors, by = c("Geo" = "country")) %>%
  mutate(values = values/100) %>%
  ggplot(.) + geom_line(aes(x = date, y = values, color = color)) +
  theme_minimal() + xlab("") + ylab("") +
  scale_x_date(breaks = seq(1960, 2100, 1) %>% paste0("-01-01") %>% as.Date,
               labels = date_format("%Y")) +
  scale_y_continuous(breaks = 0.01*seq(-20, 100, 1),
                     labels = percent_format(a = 1)) +
  scale_color_identity() + add_5flags +
  theme(legend.position = c(0.75, 0.90),
        legend.title = element_blank())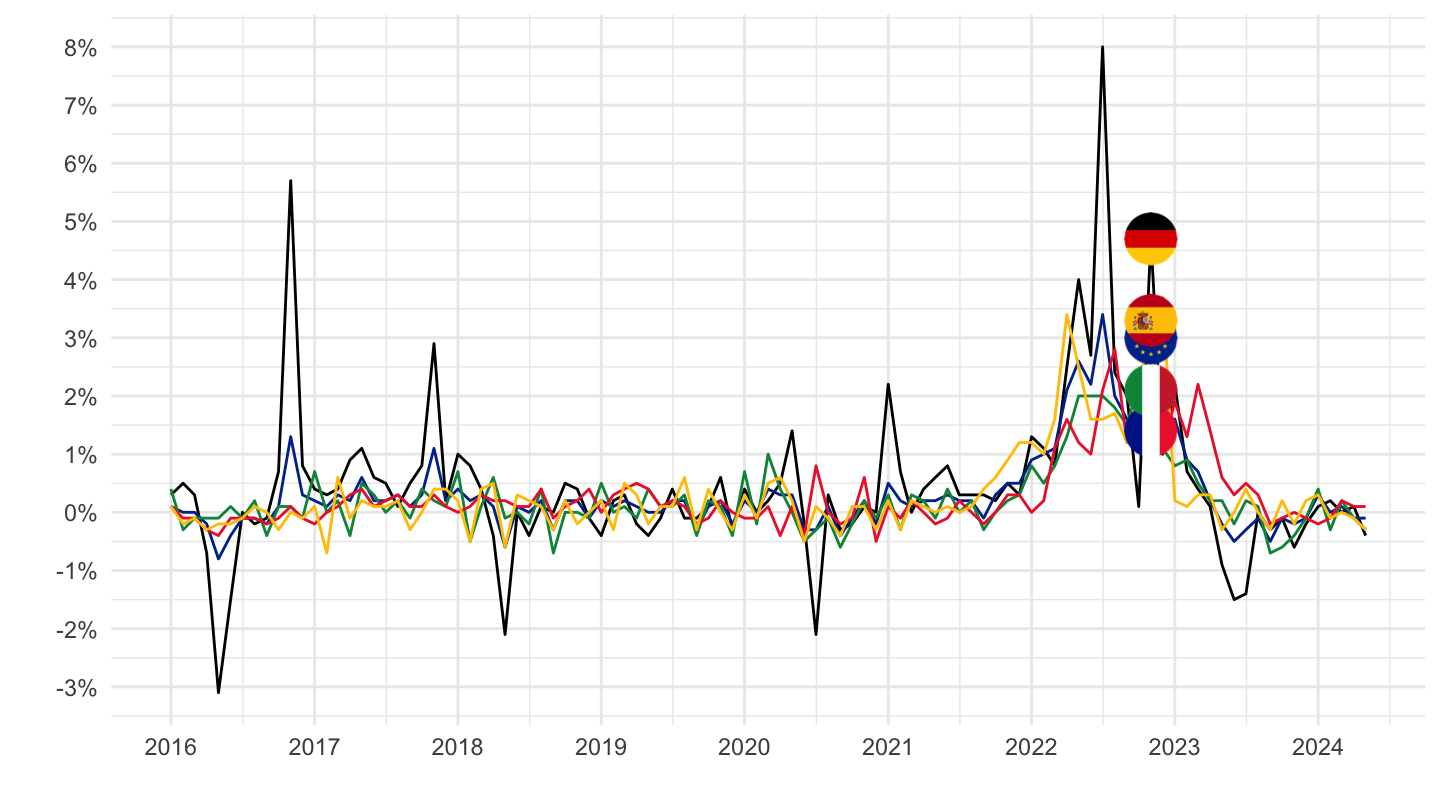
2020-
Code
prc_hicp_mmor %>%
  filter(coicop == "CP0114",
         geo %in% c("FR", "DE", "ES", "IT", "EA19")) %>%
  month_to_date %>%
  filter(date >= as.Date("2020-01-01")) %>%

  mutate(Geo = ifelse(geo == "EA19", "Europe", Geo)) %>%
  left_join(colors, by = c("Geo" = "country")) %>%
  mutate(values = values/100) %>%
  ggplot(.) + geom_line(aes(x = date, y = values, color = color)) +
  theme_minimal() + xlab("") + ylab("") +
  scale_x_date(breaks = seq.Date(as.Date("2019-12-01"), as.Date("2100-01-01"), "3 months"),
               labels = date_format("%b %Y")) +
  scale_y_continuous(breaks = 0.01*seq(-20, 100, 1),
                     labels = percent_format(a = 1)) +
  scale_color_identity() + add_5flags +
  theme(legend.position = c(0.75, 0.90),
        legend.title = element_blank())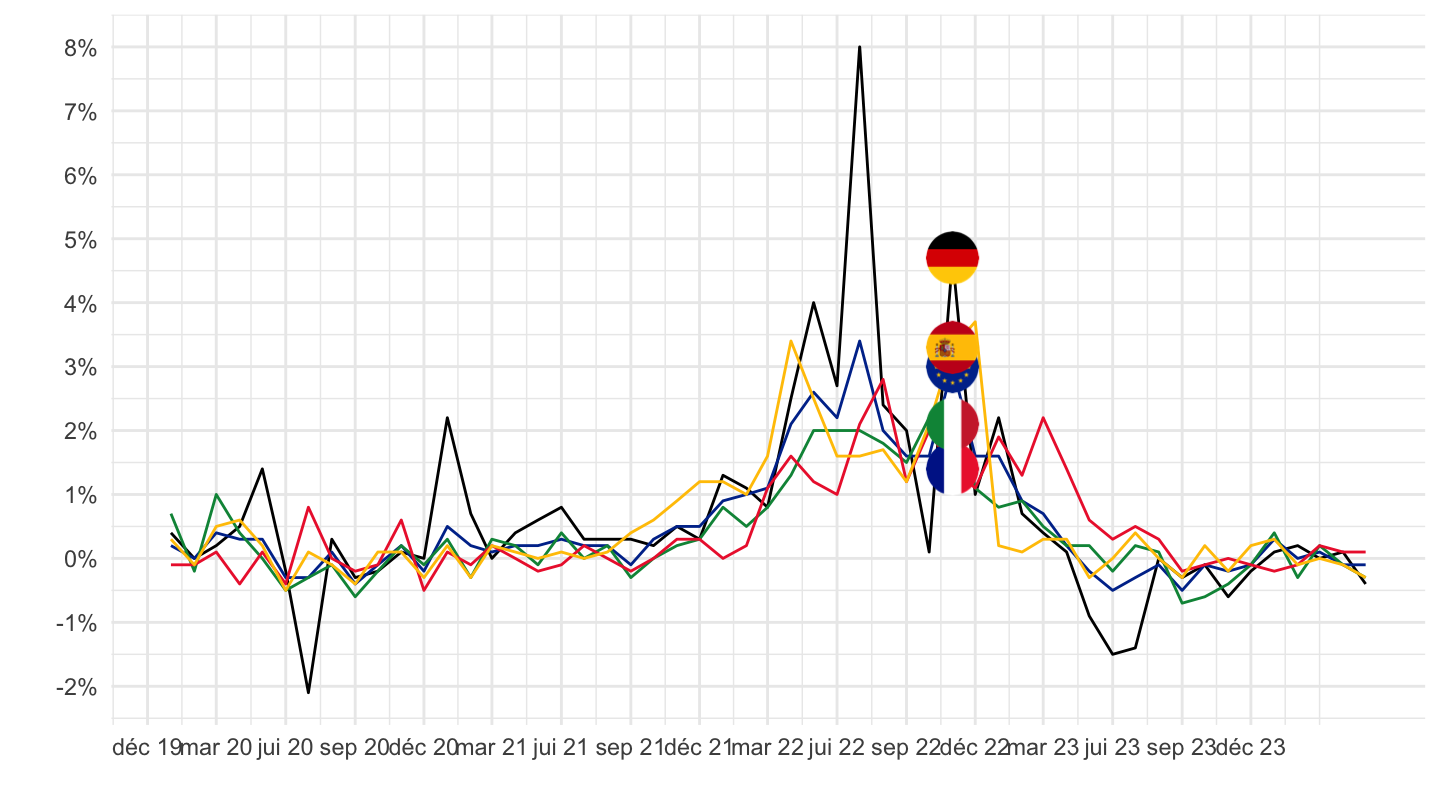
CP0117 - Vegetables
All
Code
prc_hicp_mmor %>%
  filter(coicop == "CP0117",
         geo %in% c("FR", "DE", "ES", "IT", "EA19")) %>%
  month_to_date %>%

  mutate(Geo = ifelse(geo == "EA19", "Europe", Geo)) %>%
  left_join(colors, by = c("Geo" = "country")) %>%
  mutate(values = values/100) %>%
  ggplot(.) + geom_line(aes(x = date, y = values, color = color)) +
  theme_minimal() + xlab("") + ylab("") +
  scale_x_date(breaks = seq(1960, 2100, 2) %>% paste0("-01-01") %>% as.Date,
               labels = date_format("%Y")) +
  scale_y_continuous(breaks = 0.01*seq(-100, 100, 1),
                     labels = percent_format(a = 1)) +
  scale_color_identity() + add_5flags +
  theme(legend.position = c(0.75, 0.90),
        legend.title = element_blank())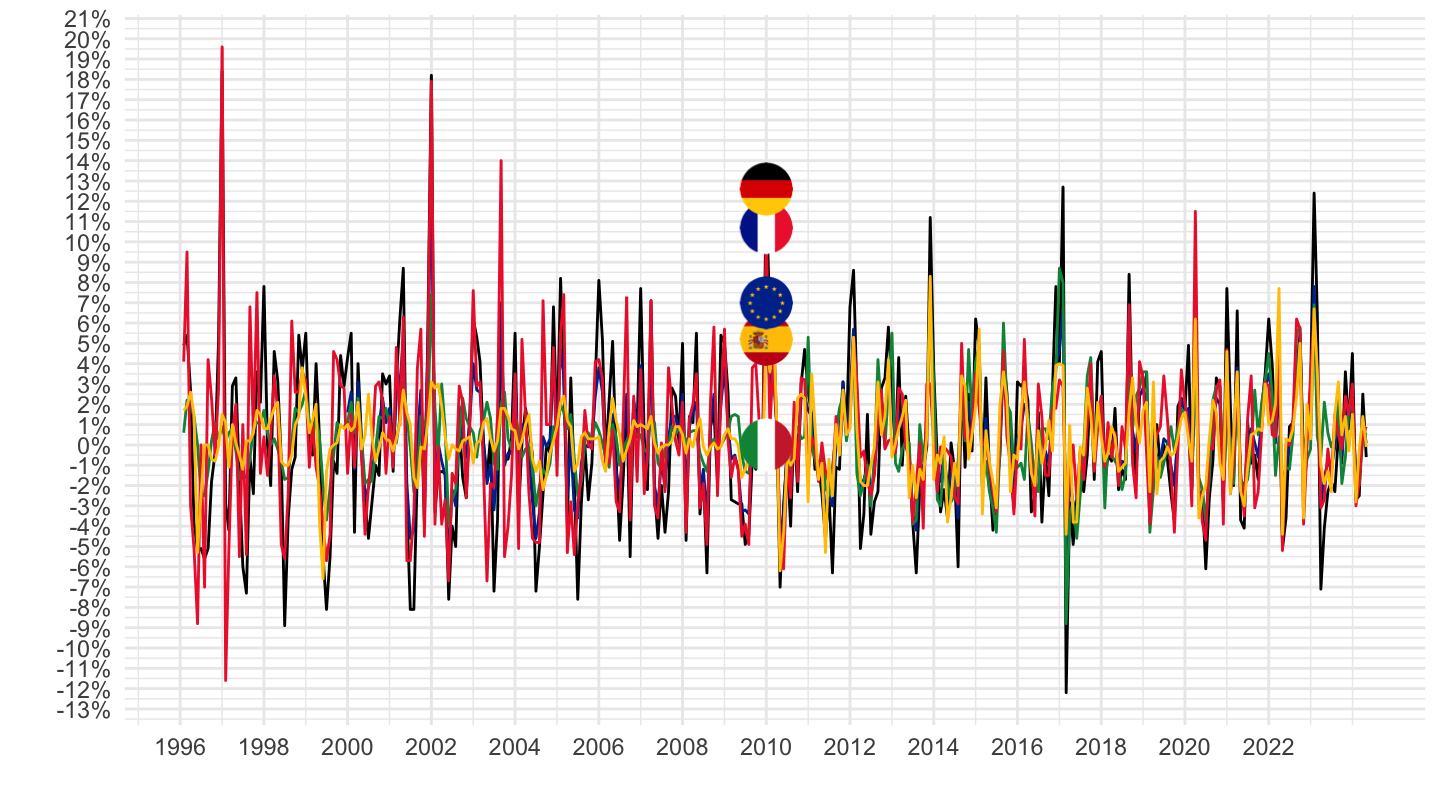
2016-
Code
prc_hicp_mmor %>%
  filter(coicop == "CP0117",
         geo %in% c("FR", "DE", "ES", "IT", "EA19")) %>%
  month_to_date %>%
  filter(date >= as.Date("2016-01-01")) %>%

  mutate(Geo = ifelse(geo == "EA19", "Europe", Geo)) %>%
  left_join(colors, by = c("Geo" = "country")) %>%
  mutate(values = values/100) %>%
  ggplot(.) + geom_line(aes(x = date, y = values, color = color)) +
  theme_minimal() + xlab("") + ylab("") +
  scale_x_date(breaks = seq(1960, 2100, 1) %>% paste0("-01-01") %>% as.Date,
               labels = date_format("%Y")) +
  scale_y_continuous(breaks = 0.01*seq(-20, 100, 1),
                     labels = percent_format(a = 1)) +
  scale_color_identity() + add_5flags +
  theme(legend.position = c(0.75, 0.90),
        legend.title = element_blank())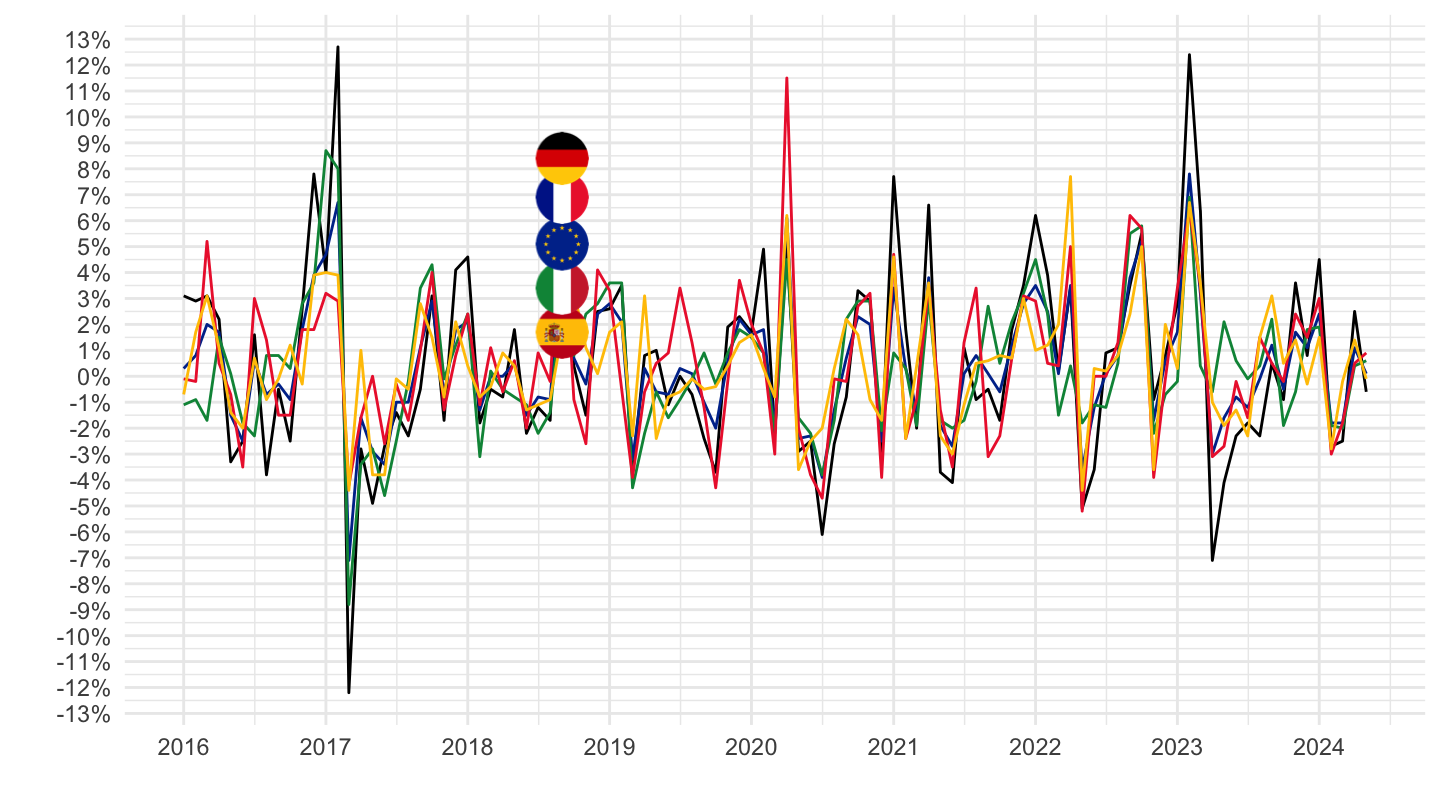
2020-
Code
prc_hicp_mmor %>%
  filter(coicop == "CP0117",
         geo %in% c("FR", "DE", "ES", "IT", "EA19")) %>%
  month_to_date %>%
  filter(date >= as.Date("2020-01-01")) %>%

  mutate(Geo = ifelse(geo == "EA19", "Europe", Geo)) %>%
  left_join(colors, by = c("Geo" = "country")) %>%
  mutate(values = values/100) %>%
  ggplot(.) + geom_line(aes(x = date, y = values, color = color)) +
  theme_minimal() + xlab("") + ylab("") +
  scale_x_date(breaks = seq.Date(as.Date("2019-12-01"), as.Date("2100-01-01"), "3 months"),
               labels = date_format("%b %Y")) +
  scale_y_continuous(breaks = 0.01*seq(-20, 100, 1),
                     labels = percent_format(a = 1)) +
  scale_color_identity() + add_5flags +
  theme(legend.position = c(0.75, 0.90),
        legend.title = element_blank())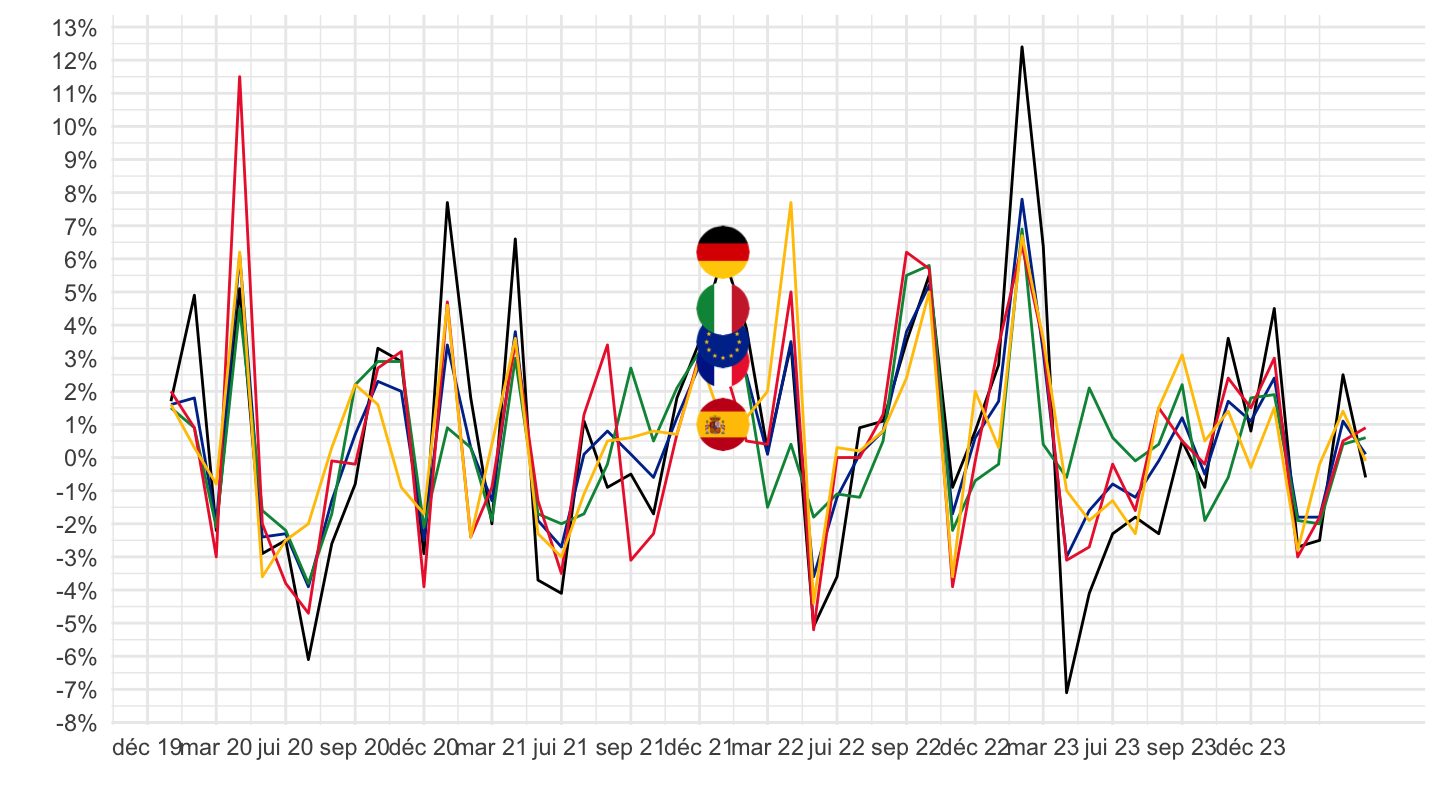
CP07332 - International flights
All
Code
prc_hicp_mmor %>%
  filter(coicop == "CP07332",
         geo %in% c("FR", "DE", "ES", "IT", "EA19")) %>%
  month_to_date %>%

  mutate(Geo = ifelse(geo == "EA19", "Europe", Geo)) %>%
  left_join(colors, by = c("Geo" = "country")) %>%
  mutate(values = values/100) %>%
  ggplot(.) + geom_line(aes(x = date, y = values, color = color)) +
  theme_minimal() + xlab("") + ylab("") +
  scale_x_date(breaks = seq(1960, 2100, 2) %>% paste0("-01-01") %>% as.Date,
               labels = date_format("%Y")) +
  scale_y_continuous(breaks = 0.01*seq(-100, 100, 5),
                     labels = percent_format(a = 1)) +
  scale_color_identity() + add_5flags +
  theme(legend.position = c(0.75, 0.90),
        legend.title = element_blank())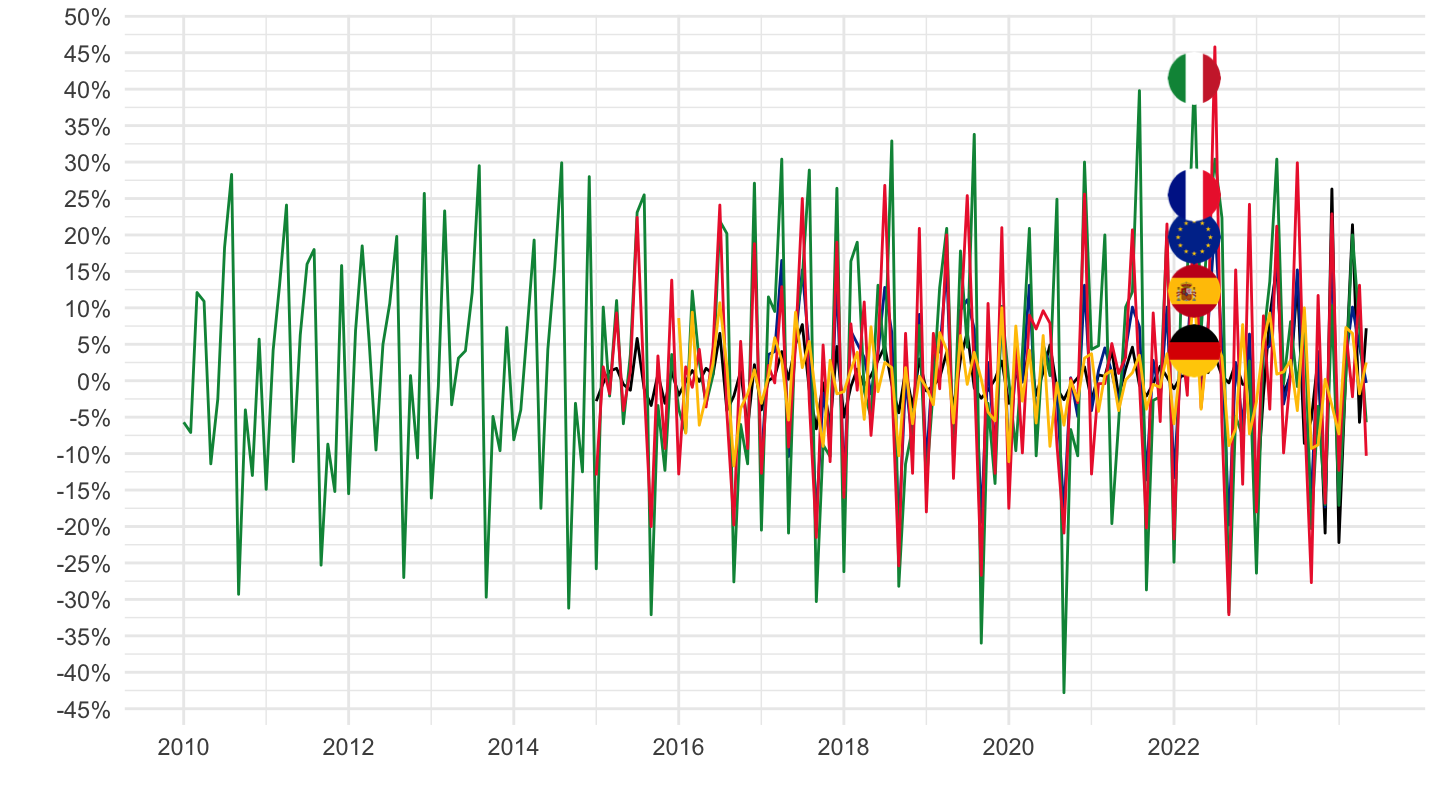
2016-
Code
prc_hicp_mmor %>%
  filter(coicop == "CP07332",
         geo %in% c("FR", "DE", "ES", "IT", "EA19")) %>%
  month_to_date %>%
  filter(date >= as.Date("2016-01-01")) %>%

  mutate(Geo = ifelse(geo == "EA19", "Europe", Geo)) %>%
  left_join(colors, by = c("Geo" = "country")) %>%
  mutate(values = values/100) %>%
  ggplot(.) + geom_line(aes(x = date, y = values, color = color)) +
  theme_minimal() + xlab("") + ylab("") +
  scale_x_date(breaks = seq(1960, 2100, 1) %>% paste0("-01-01") %>% as.Date,
               labels = date_format("%Y")) +
  scale_y_continuous(breaks = 0.01*seq(-20, 100, 5),
                     labels = percent_format(a = 1)) +
  scale_color_identity() + add_5flags +
  theme(legend.position = c(0.75, 0.90),
        legend.title = element_blank())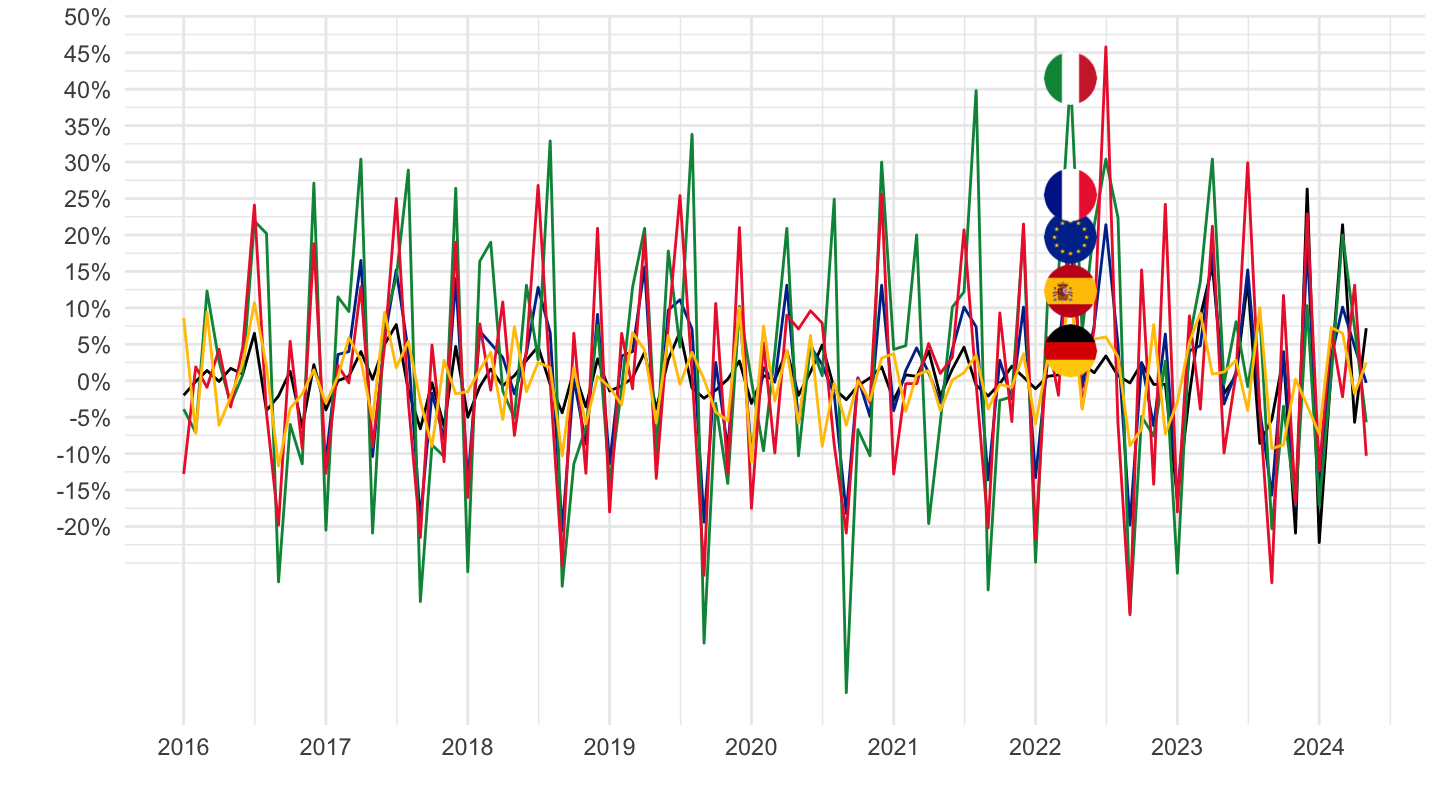
2020-
Code
prc_hicp_mmor %>%
  filter(coicop == "CP07332",
         geo %in% c("FR", "DE", "ES", "IT", "EA19")) %>%
  month_to_date %>%
  filter(date >= as.Date("2020-01-01")) %>%

  mutate(Geo = ifelse(geo == "EA19", "Europe", Geo)) %>%
  left_join(colors, by = c("Geo" = "country")) %>%
  mutate(values = values/100) %>%
  ggplot(.) + geom_line(aes(x = date, y = values, color = color)) +
  theme_minimal() + xlab("") + ylab("") +
  scale_x_date(breaks = seq.Date(as.Date("2019-12-01"), as.Date("2100-01-01"), "3 months"),
               labels = date_format("%b %Y")) +
  scale_y_continuous(breaks = 0.01*seq(-20, 100, 10),
                     labels = percent_format(a = 1)) +
  scale_color_identity() + add_5flags +
  theme(legend.position = c(0.75, 0.90),
        legend.title = element_blank())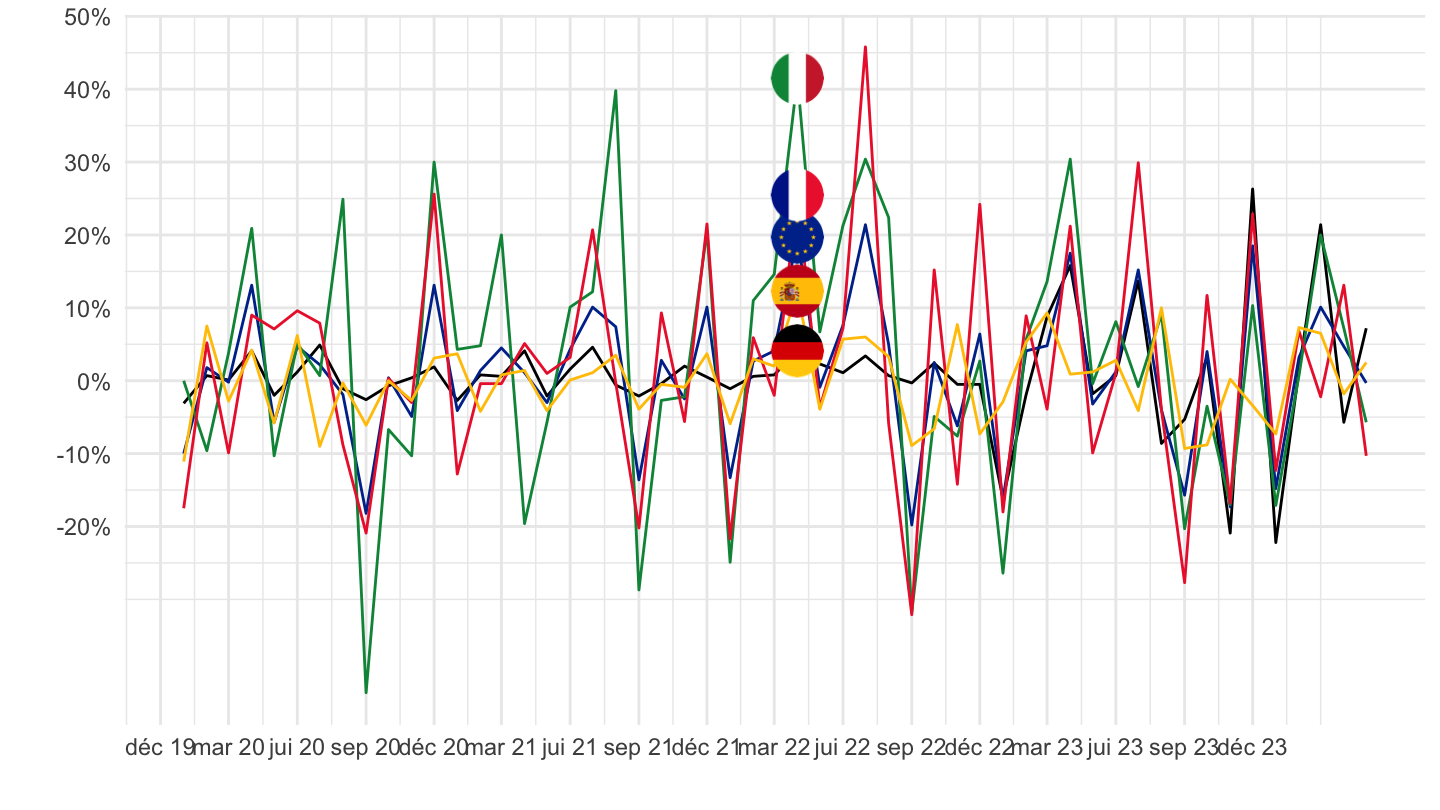
CP0722 - Fuels and lubricants for personal transport equipment
All
Code
prc_hicp_mmor %>%
  filter(coicop == "CP0722",
         geo %in% c("FR", "DE", "ES", "IT", "EA19")) %>%
  month_to_date %>%

  mutate(Geo = ifelse(geo == "EA19", "Europe", Geo)) %>%
  left_join(colors, by = c("Geo" = "country")) %>%
  mutate(values = values/100) %>%
  ggplot(.) + geom_line(aes(x = date, y = values, color = color)) +
  theme_minimal() + xlab("") + ylab("") +
  scale_x_date(breaks = seq(1960, 2100, 2) %>% paste0("-01-01") %>% as.Date,
               labels = date_format("%Y")) +
  scale_y_continuous(breaks = 0.01*seq(-100, 100, 5),
                     labels = percent_format(a = 1)) +
  scale_color_identity() + add_5flags +
  theme(legend.position = c(0.75, 0.90),
        legend.title = element_blank())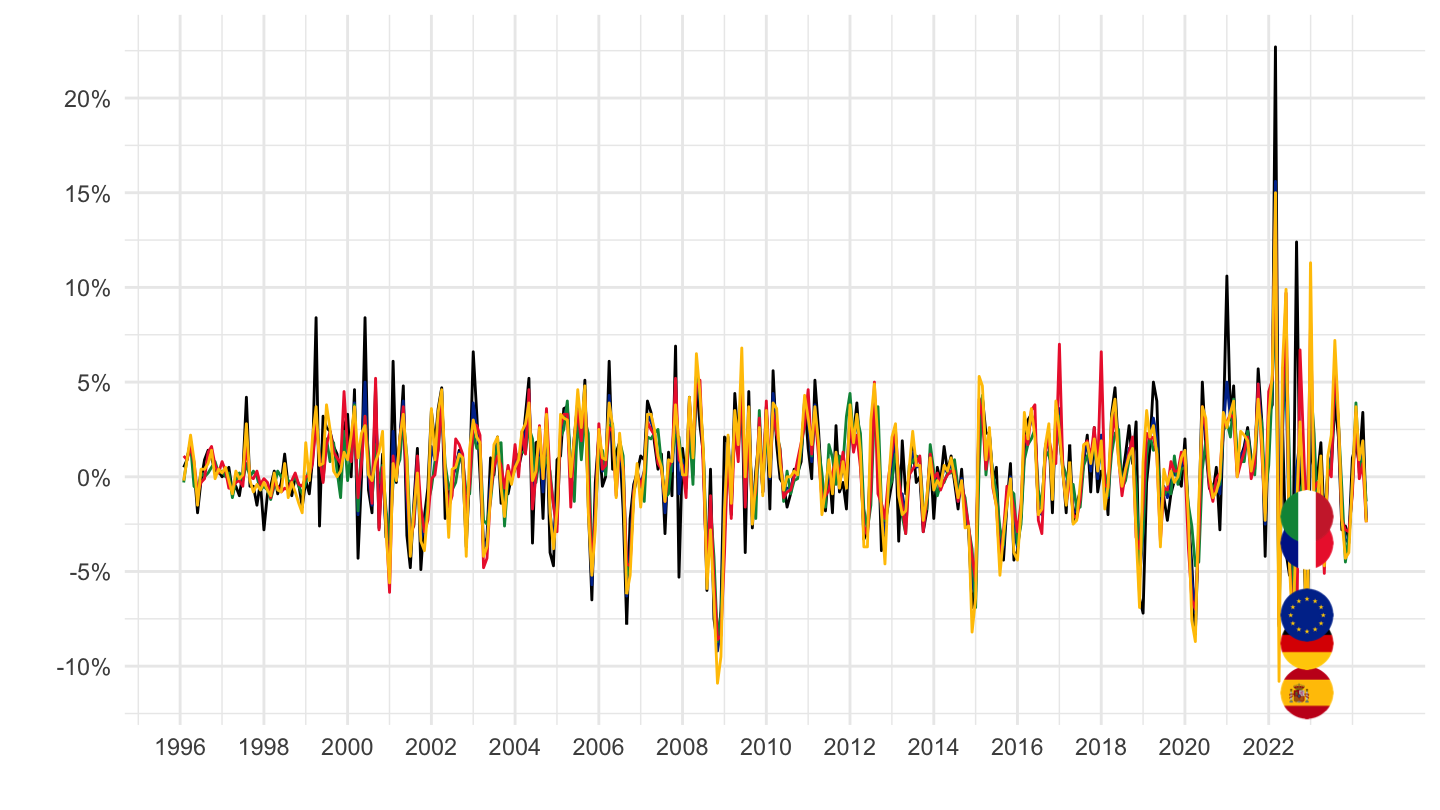
2016-
Code
prc_hicp_mmor %>%
  filter(coicop == "CP0722",
         geo %in% c("FR", "DE", "ES", "IT", "EA19")) %>%
  month_to_date %>%
  filter(date >= as.Date("2016-01-01")) %>%

  mutate(Geo = ifelse(geo == "EA19", "Europe", Geo)) %>%
  left_join(colors, by = c("Geo" = "country")) %>%
  mutate(values = values/100) %>%
  ggplot(.) + geom_line(aes(x = date, y = values, color = color)) +
  theme_minimal() + xlab("") + ylab("") +
  scale_x_date(breaks = seq(1960, 2100, 1) %>% paste0("-01-01") %>% as.Date,
               labels = date_format("%Y")) +
  scale_y_continuous(breaks = 0.01*seq(-20, 100, 10),
                     labels = percent_format(a = 1)) +
  scale_color_identity() + add_5flags +
  theme(legend.position = c(0.75, 0.90),
        legend.title = element_blank())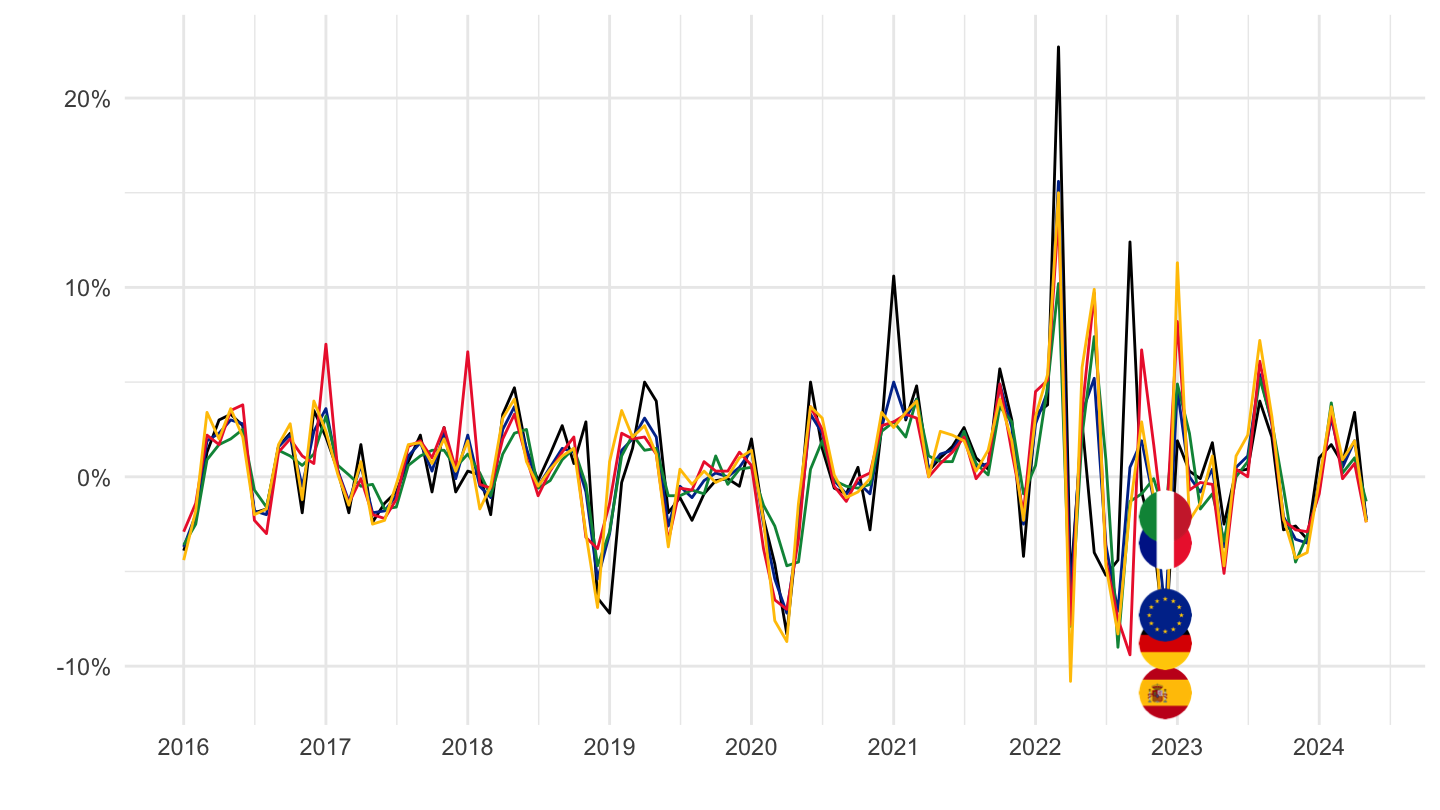
2020-
Code
prc_hicp_mmor %>%
  filter(coicop == "CP0722",
         geo %in% c("FR", "DE", "ES", "IT", "EA19")) %>%
  month_to_date %>%
  filter(date >= as.Date("2020-01-01")) %>%

  mutate(Geo = ifelse(geo == "EA19", "Europe", Geo)) %>%
  left_join(colors, by = c("Geo" = "country")) %>%
  mutate(values = values/100) %>%
  ggplot(.) + geom_line(aes(x = date, y = values, color = color)) +
  theme_minimal() + xlab("") + ylab("") +
  scale_x_date(breaks = seq.Date(as.Date("2019-12-01"), as.Date("2100-01-01"), "3 months"),
               labels = date_format("%b %Y")) +
  scale_y_continuous(breaks = 0.01*seq(-20, 100, 10),
                     labels = percent_format(a = 1)) +
  scale_color_identity() + add_5flags +
  theme(legend.position = c(0.75, 0.90),
        legend.title = element_blank())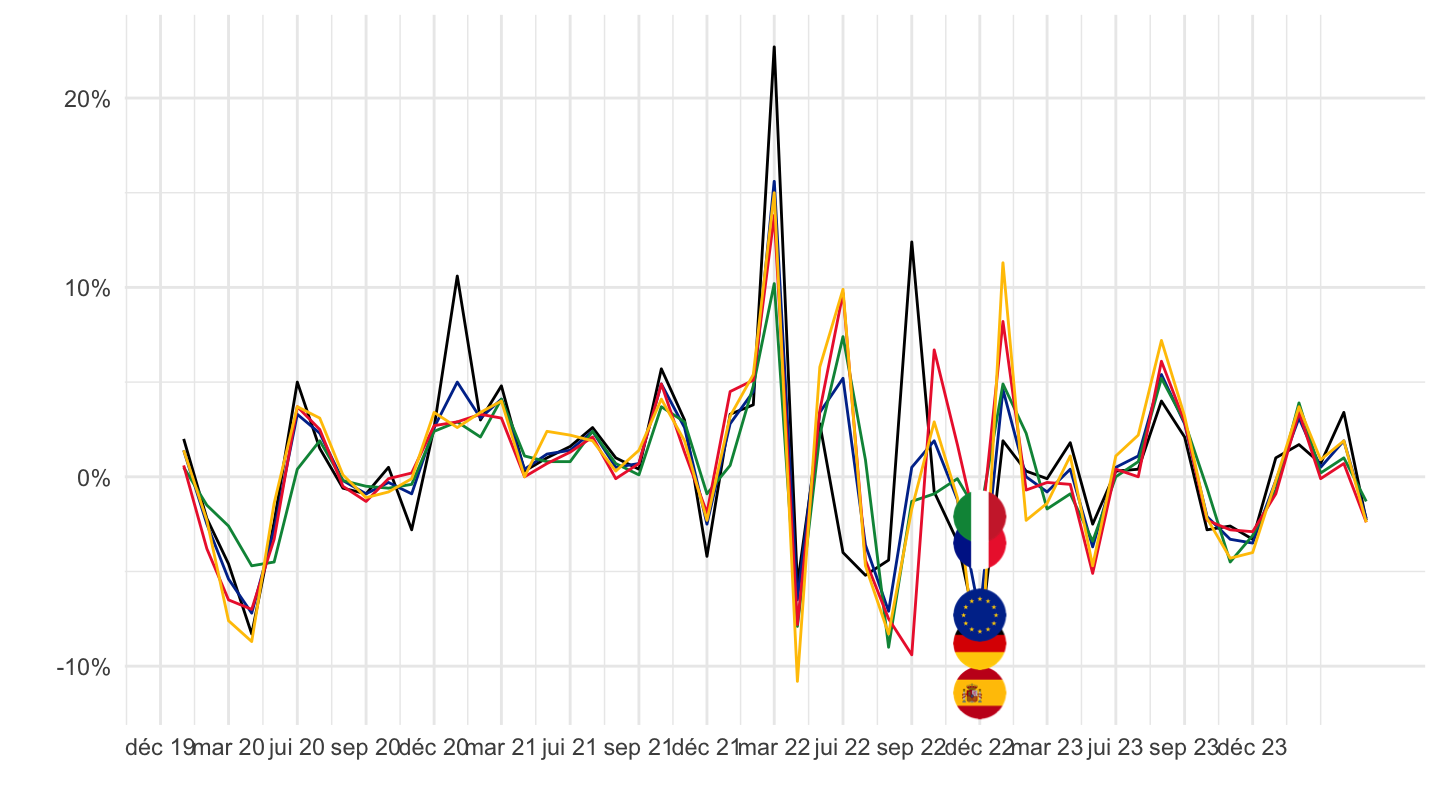
CP072 - Operation of personal transport equipment
All
Code
prc_hicp_mmor %>%
  filter(coicop == "CP072",
         geo %in% c("FR", "DE", "ES", "IT", "EA19")) %>%
  month_to_date %>%

  mutate(Geo = ifelse(geo == "EA19", "Europe", Geo)) %>%
  left_join(colors, by = c("Geo" = "country")) %>%
  mutate(values = values/100) %>%
  ggplot(.) + geom_line(aes(x = date, y = values, color = color)) +
  theme_minimal() + xlab("") + ylab("") +
  scale_x_date(breaks = seq(1960, 2100, 2) %>% paste0("-01-01") %>% as.Date,
               labels = date_format("%Y")) +
  scale_y_continuous(breaks = 0.01*seq(-100, 100, 5),
                     labels = percent_format(a = 1)) +
  scale_color_identity() + add_5flags +
  theme(legend.position = c(0.75, 0.90),
        legend.title = element_blank())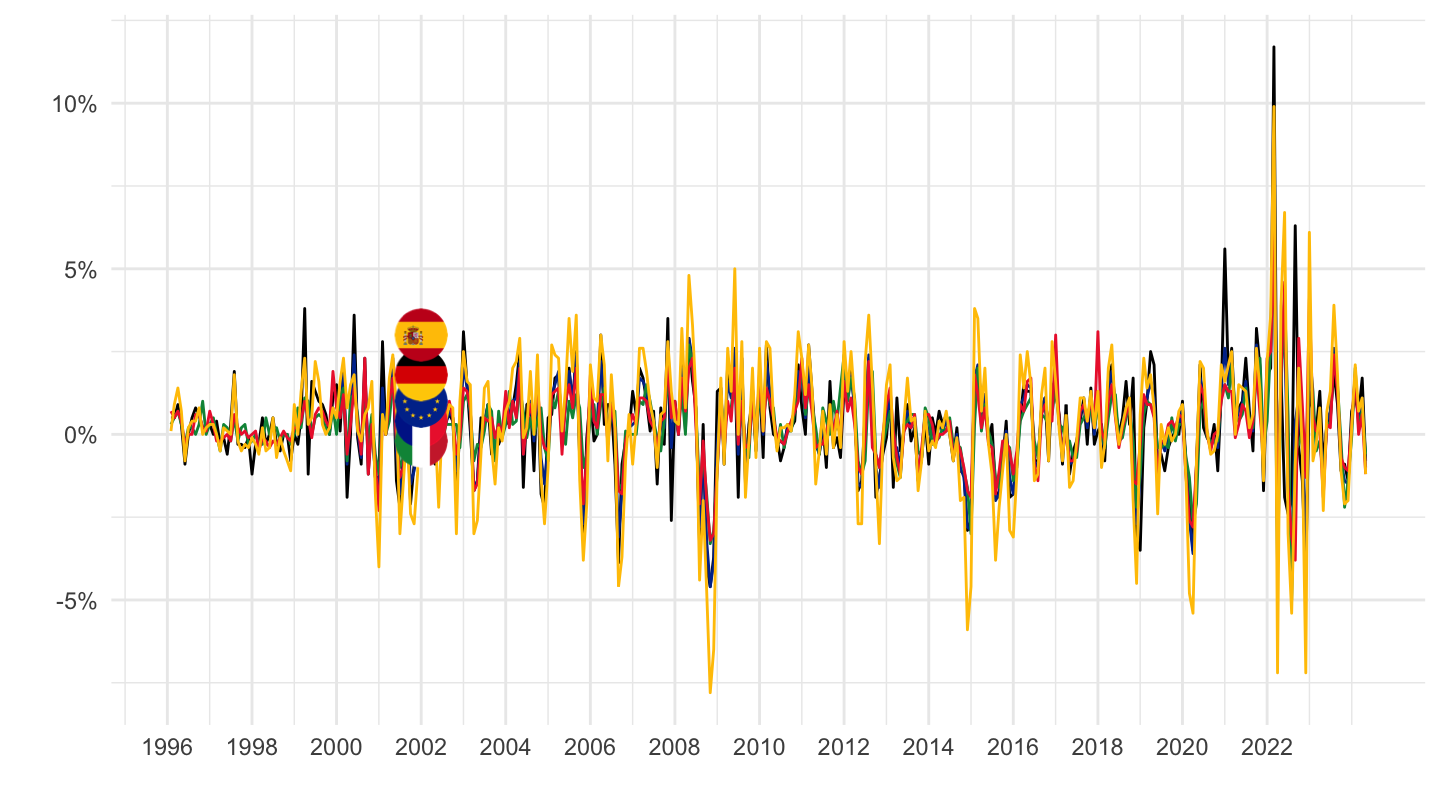
2016-
Code
prc_hicp_mmor %>%
  filter(coicop == "CP072",
         geo %in% c("FR", "DE", "ES", "IT", "EA19")) %>%
  month_to_date %>%
  filter(date >= as.Date("2016-01-01")) %>%

  mutate(Geo = ifelse(geo == "EA19", "Europe", Geo)) %>%
  left_join(colors, by = c("Geo" = "country")) %>%
  mutate(values = values/100) %>%
  ggplot(.) + geom_line(aes(x = date, y = values, color = color)) +
  theme_minimal() + xlab("") + ylab("") +
  scale_x_date(breaks = seq(1960, 2100, 1) %>% paste0("-01-01") %>% as.Date,
               labels = date_format("%Y")) +
  scale_y_continuous(breaks = 0.01*seq(-20, 100, 10),
                     labels = percent_format(a = 1)) +
  scale_color_identity() + add_5flags +
  theme(legend.position = c(0.75, 0.90),
        legend.title = element_blank())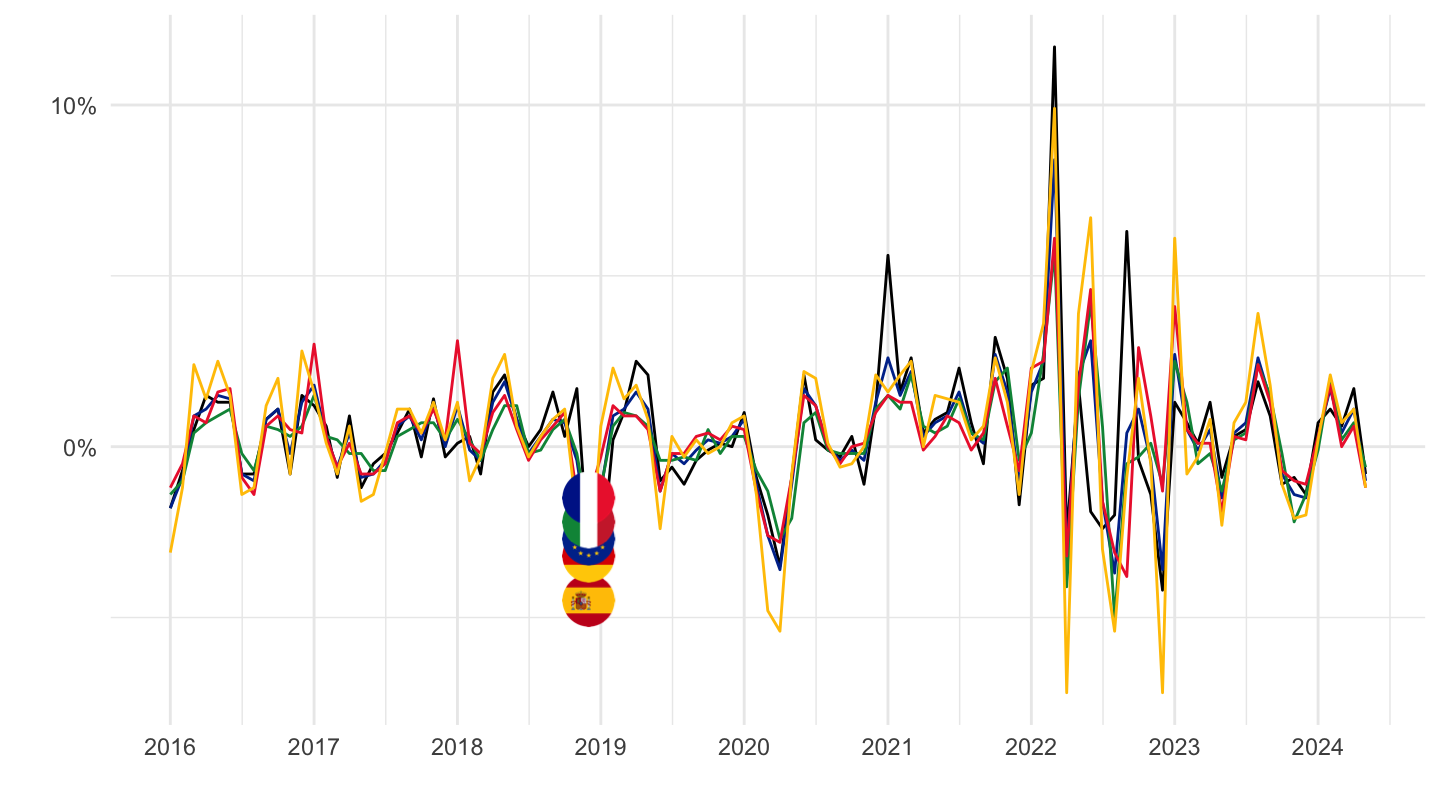
2020-
Code
prc_hicp_mmor %>%
  filter(coicop == "CP072",
         geo %in% c("FR", "DE", "ES", "IT", "EA19")) %>%
  month_to_date %>%
  filter(date >= as.Date("2020-01-01")) %>%

  mutate(Geo = ifelse(geo == "EA19", "Europe", Geo)) %>%
  left_join(colors, by = c("Geo" = "country")) %>%
  mutate(values = values/100) %>%
  ggplot(.) + geom_line(aes(x = date, y = values, color = color)) +
  theme_minimal() + xlab("") + ylab("") +
  scale_x_date(breaks = seq.Date(as.Date("2019-12-01"), as.Date("2100-01-01"), "3 months"),
               labels = date_format("%b %Y")) +
  scale_y_continuous(breaks = 0.01*seq(-20, 100, 5),
                     labels = percent_format(a = 1)) +
  scale_color_identity() + add_5flags +
  theme(legend.position = c(0.75, 0.90),
        legend.title = element_blank())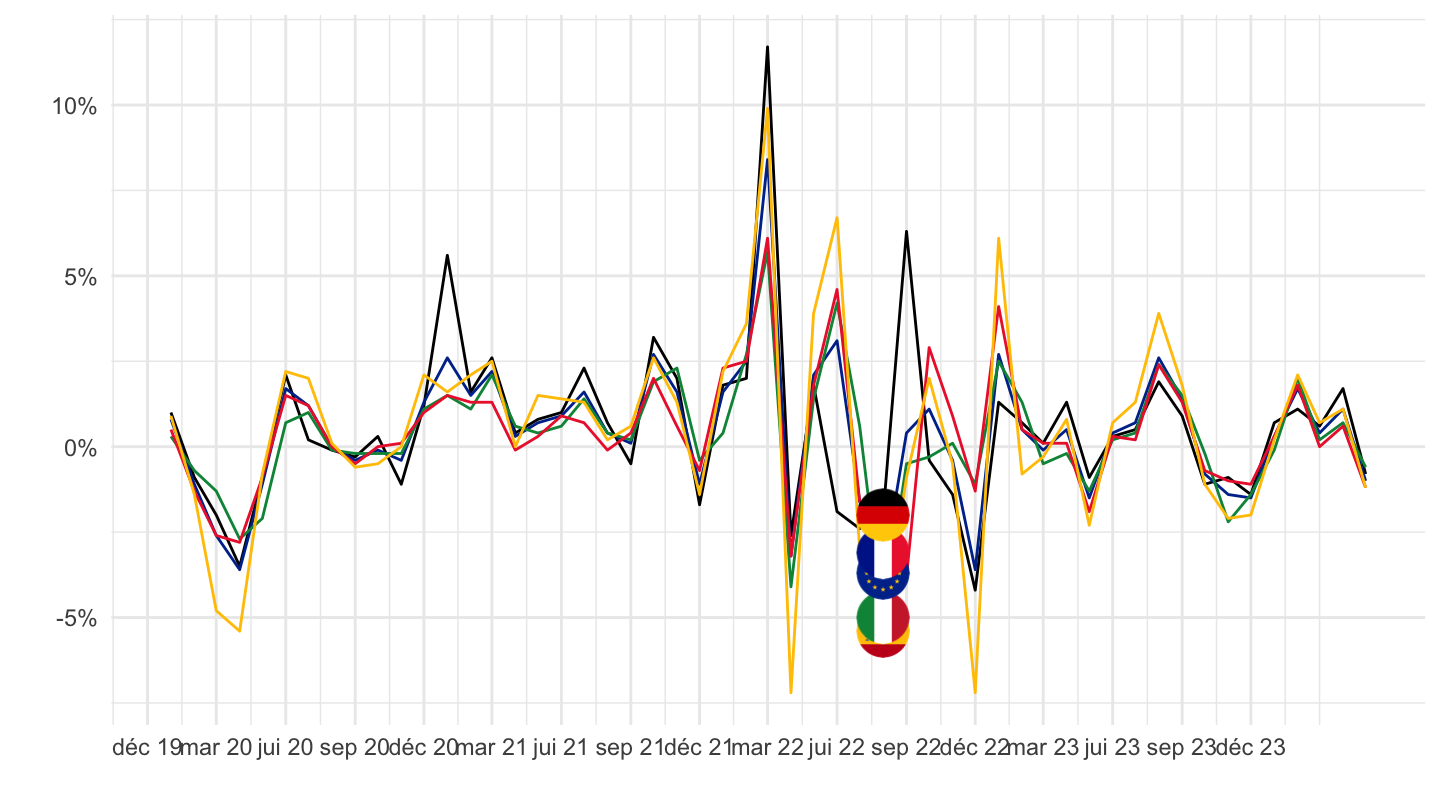
CP0451 - Electricity
All
Code
prc_hicp_mmor %>%
  filter(coicop == "CP0451",
         geo %in% c("FR", "DE", "ES", "IT", "EA19")) %>%
  month_to_date %>%

  mutate(Geo = ifelse(geo == "EA19", "Europe", Geo)) %>%
  left_join(colors, by = c("Geo" = "country")) %>%
  mutate(values = values/100) %>%
  ggplot(.) + geom_line(aes(x = date, y = values, color = color)) +
  theme_minimal() + xlab("") + ylab("") +
  scale_x_date(breaks = seq(1960, 2100, 2) %>% paste0("-01-01") %>% as.Date,
               labels = date_format("%Y")) +
  scale_y_continuous(breaks = 0.01*seq(-100, 100, 5),
                     labels = percent_format(a = 1)) +
  scale_color_identity() + add_5flags +
  theme(legend.position = c(0.75, 0.90),
        legend.title = element_blank())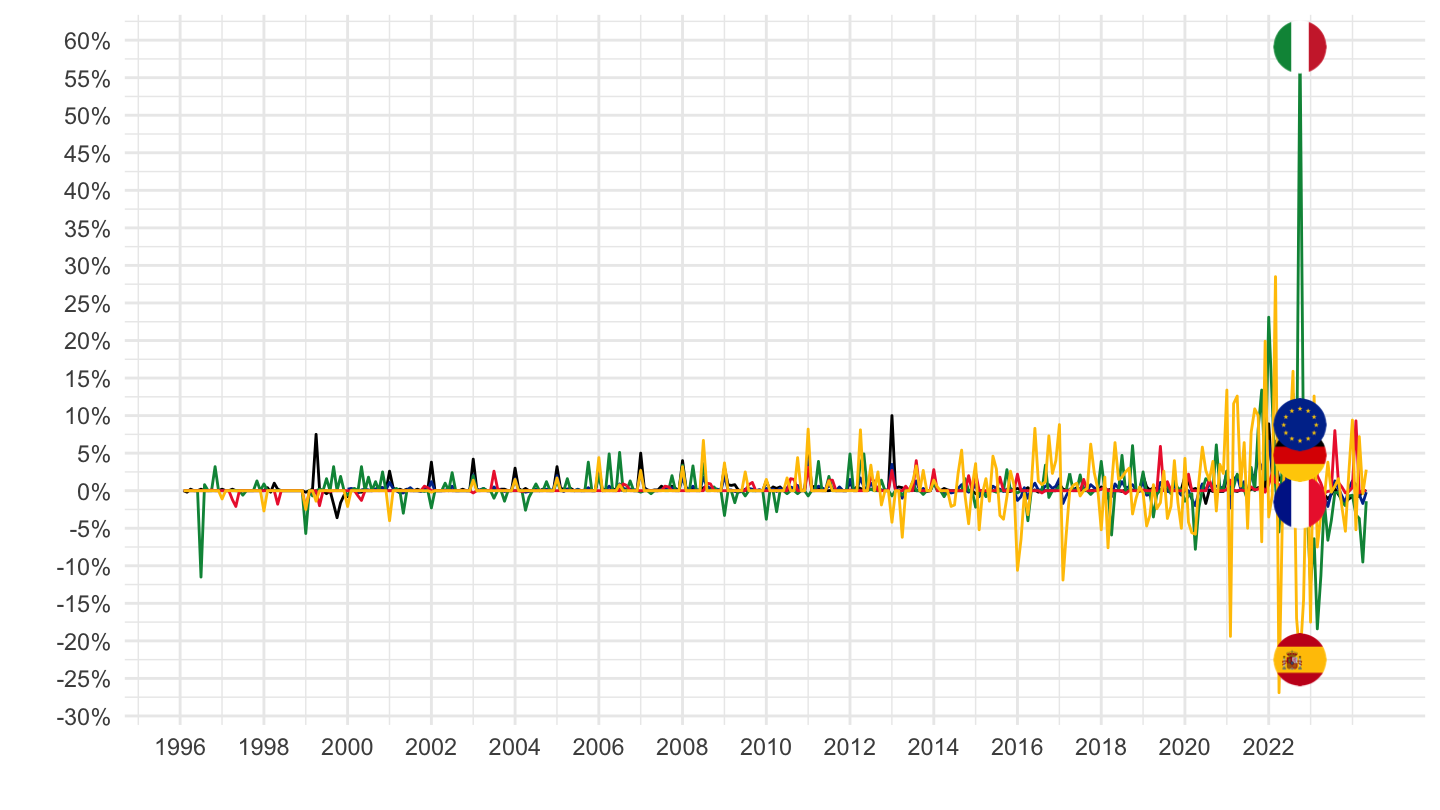
2016-
Code
prc_hicp_mmor %>%
  filter(coicop == "CP0451",
         geo %in% c("FR", "DE", "ES", "IT", "EA19")) %>%
  month_to_date %>%
  filter(date >= as.Date("2016-01-01")) %>%

  mutate(Geo = ifelse(geo == "EA19", "Europe", Geo)) %>%
  left_join(colors, by = c("Geo" = "country")) %>%
  mutate(values = values/100) %>%
  ggplot(.) + geom_line(aes(x = date, y = values, color = color)) +
  theme_minimal() + xlab("") + ylab("") +
  scale_x_date(breaks = seq(1960, 2100, 1) %>% paste0("-01-01") %>% as.Date,
               labels = date_format("%Y")) +
  scale_y_continuous(breaks = 0.01*seq(-20, 100, 5),
                     labels = percent_format(a = 1)) +
  scale_color_identity() + add_5flags +
  theme(legend.position = c(0.75, 0.90),
        legend.title = element_blank())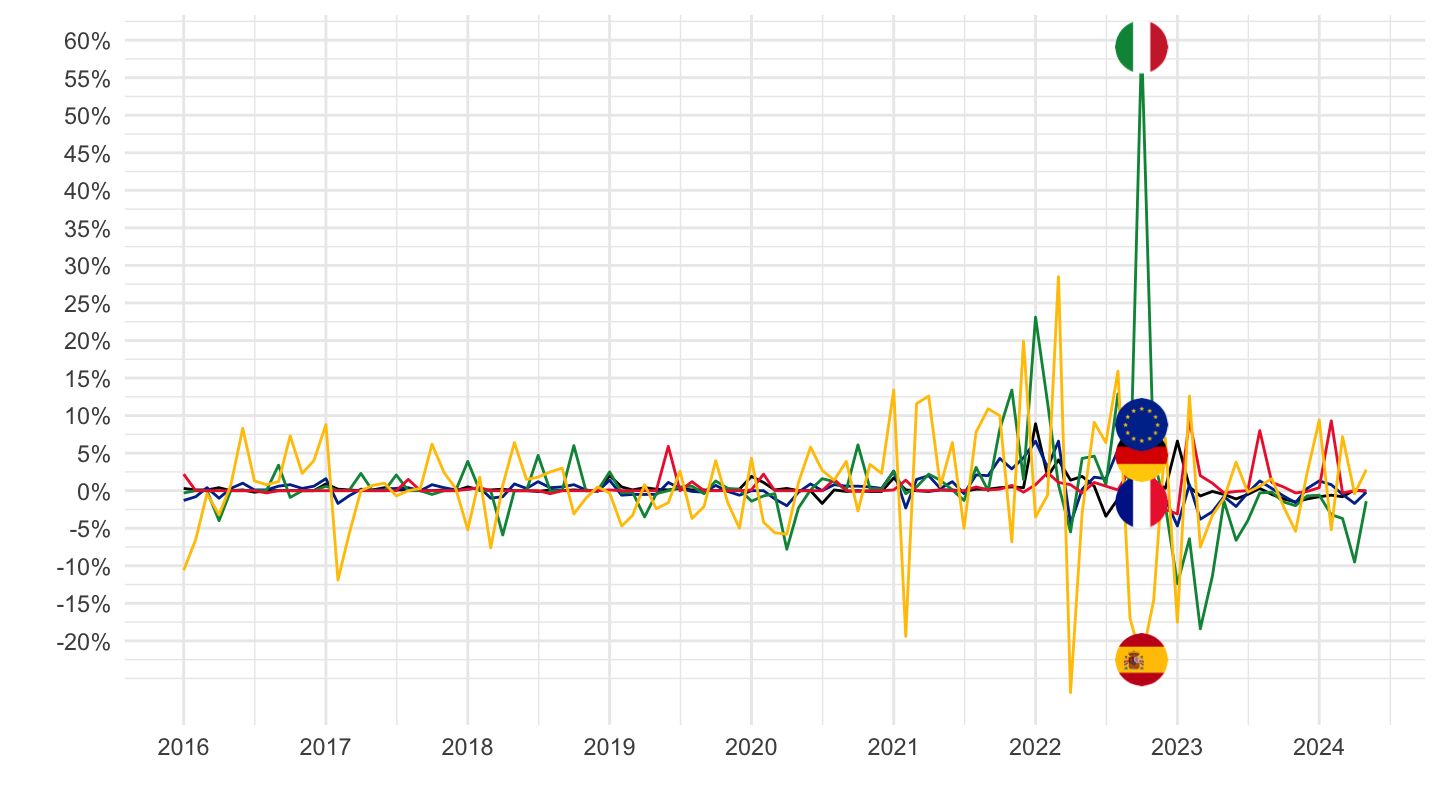
2020-
Code
prc_hicp_mmor %>%
  filter(coicop == "CP0451",
         geo %in% c("FR", "DE", "ES", "IT", "EA19")) %>%
  month_to_date %>%
  filter(date >= as.Date("2020-01-01")) %>%

  mutate(Geo = ifelse(geo == "EA19", "Europe", Geo)) %>%
  left_join(colors, by = c("Geo" = "country")) %>%
  mutate(values = values/100) %>%
  ggplot(.) + geom_line(aes(x = date, y = values, color = color)) +
  theme_minimal() + xlab("") + ylab("") +
  scale_x_date(breaks = seq.Date(as.Date("2019-12-01"), as.Date("2100-01-01"), "3 months"),
               labels = date_format("%b %Y")) +
  scale_y_continuous(breaks = 0.01*seq(-20, 100, 10),
                     labels = percent_format(a = 1)) +
  scale_color_identity() + add_5flags +
  theme(legend.position = c(0.75, 0.90),
        legend.title = element_blank())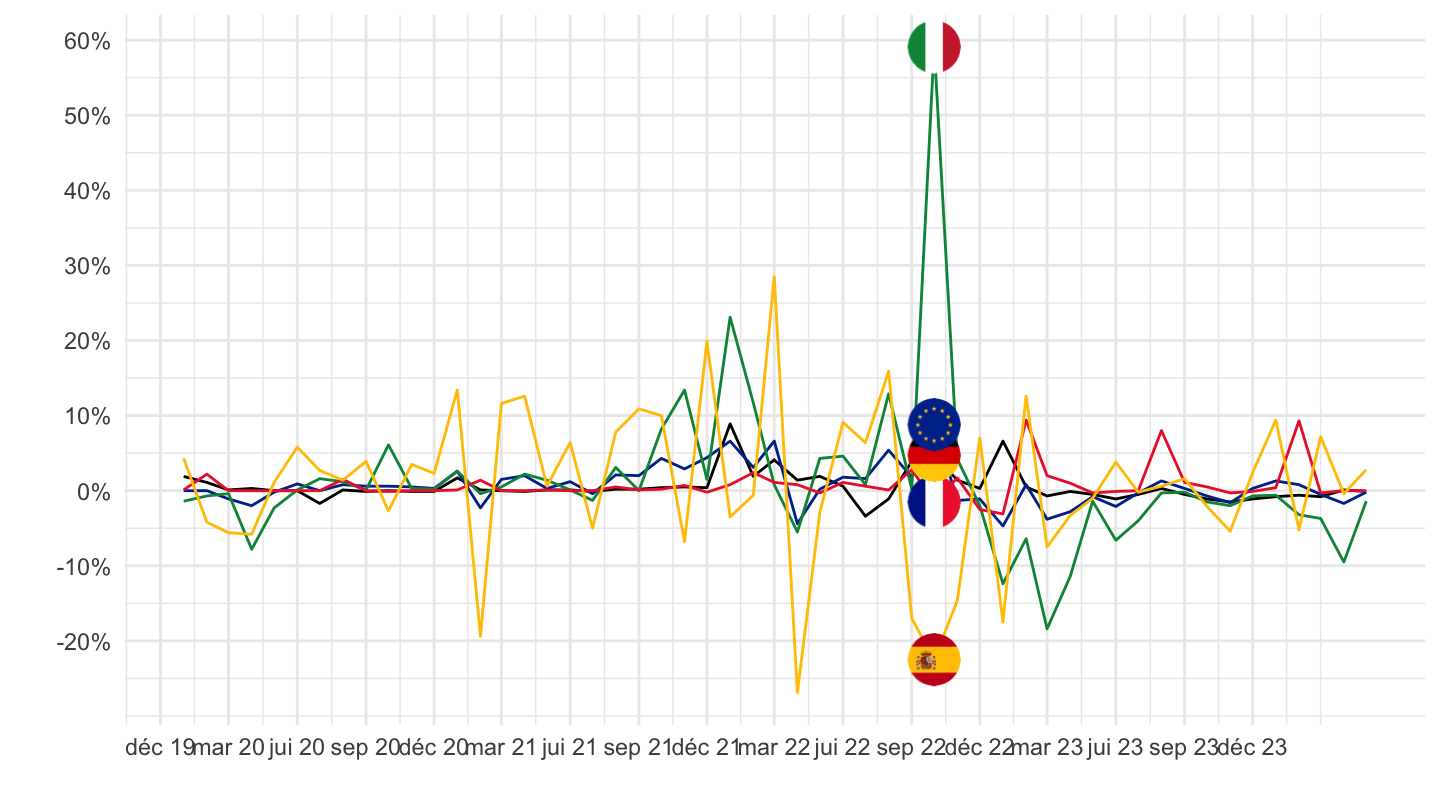
CP0452 - Gas
All
Code
prc_hicp_mmor %>%
  filter(coicop == "CP0452",
         geo %in% c("FR", "DE", "ES", "IT", "EA19")) %>%
  month_to_date %>%

  mutate(Geo = ifelse(geo == "EA19", "Europe", Geo)) %>%
  left_join(colors, by = c("Geo" = "country")) %>%
  mutate(values = values/100) %>%
  ggplot(.) + geom_line(aes(x = date, y = values, color = color)) +
  theme_minimal() + xlab("") + ylab("") +
  scale_x_date(breaks = seq(1960, 2100, 2) %>% paste0("-01-01") %>% as.Date,
               labels = date_format("%Y")) +
  scale_y_continuous(breaks = 0.01*seq(-100, 100, 5),
                     labels = percent_format(a = 1)) +
  scale_color_identity() + add_5flags +
  theme(legend.position = c(0.75, 0.90),
        legend.title = element_blank())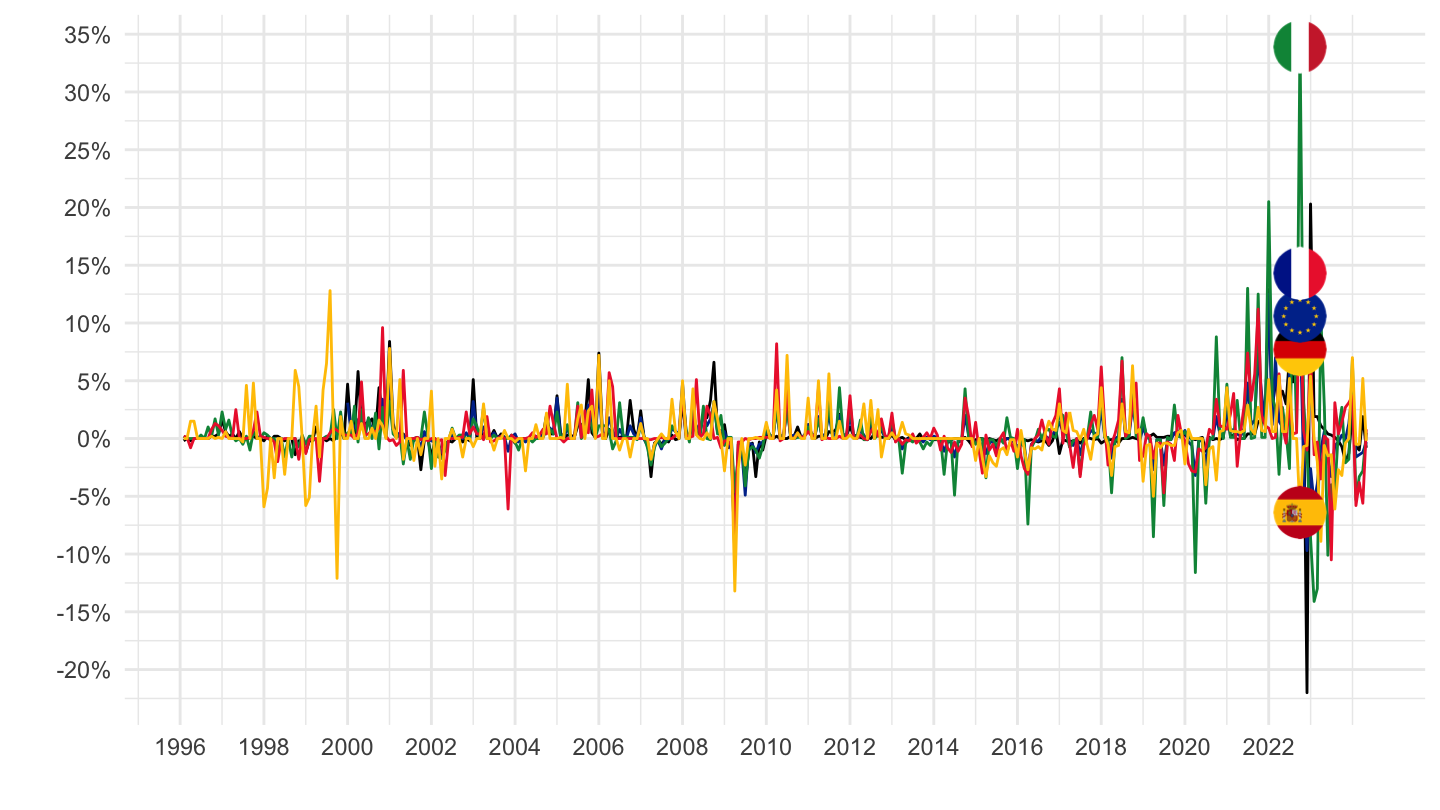
2016-
Code
prc_hicp_mmor %>%
  filter(coicop == "CP0452",
         geo %in% c("FR", "DE", "ES", "IT", "EA19")) %>%
  month_to_date %>%
  filter(date >= as.Date("2016-01-01")) %>%

  mutate(Geo = ifelse(geo == "EA19", "Europe", Geo)) %>%
  left_join(colors, by = c("Geo" = "country")) %>%
  mutate(values = values/100) %>%
  ggplot(.) + geom_line(aes(x = date, y = values, color = color)) +
  theme_minimal() + xlab("") + ylab("") +
  scale_x_date(breaks = seq(1960, 2100, 1) %>% paste0("-01-01") %>% as.Date,
               labels = date_format("%Y")) +
  scale_y_continuous(breaks = 0.01*seq(-20, 100, 5),
                     labels = percent_format(a = 1)) +
  scale_color_identity() + add_5flags +
  theme(legend.position = c(0.75, 0.90),
        legend.title = element_blank())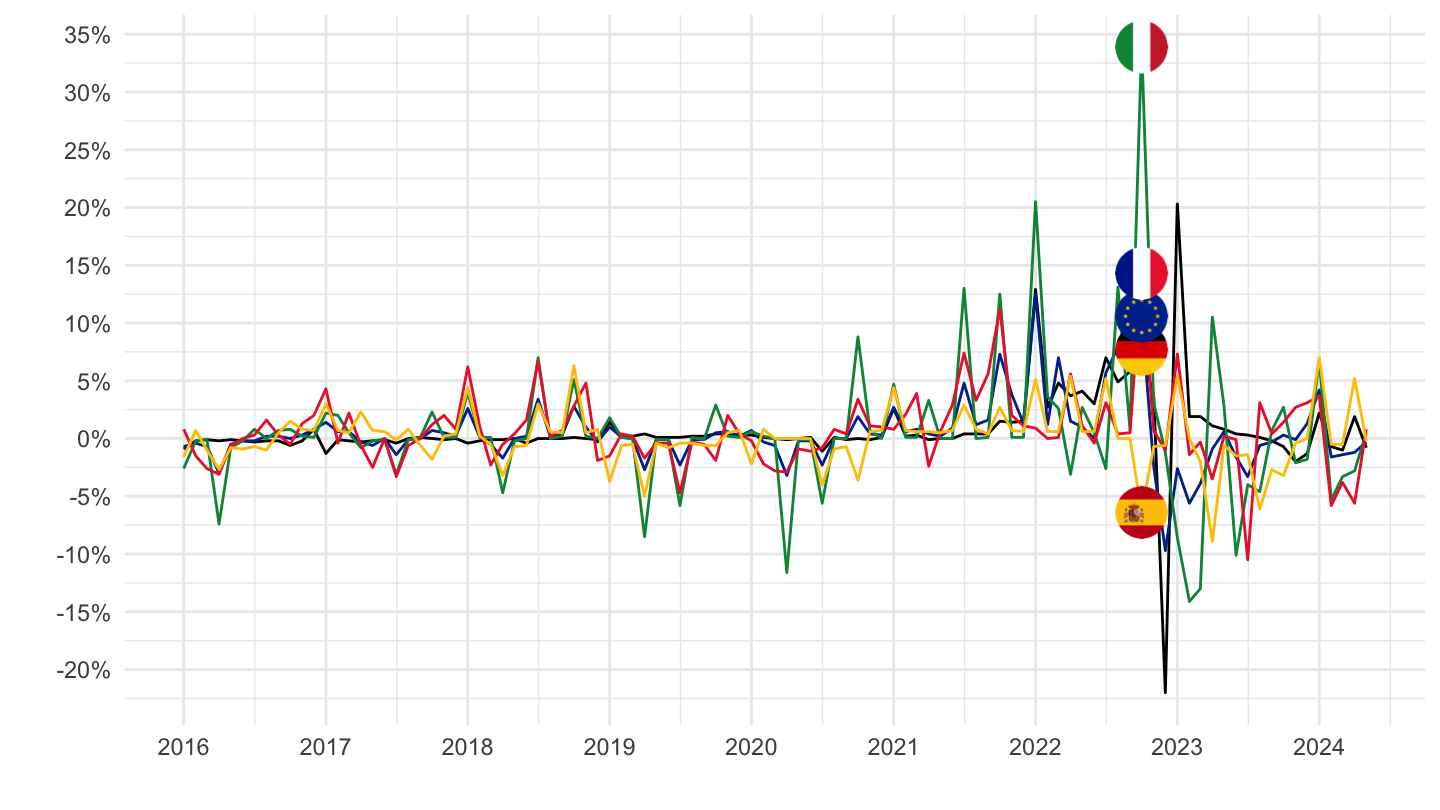
2020-
Code
prc_hicp_mmor %>%
  filter(coicop == "CP0452",
         geo %in% c("FR", "DE", "ES", "IT", "EA19")) %>%
  month_to_date %>%
  filter(date >= as.Date("2020-01-01")) %>%

  mutate(Geo = ifelse(geo == "EA19", "Europe", Geo)) %>%
  left_join(colors, by = c("Geo" = "country")) %>%
  mutate(values = values/100) %>%
  ggplot(.) + geom_line(aes(x = date, y = values, color = color)) +
  theme_minimal() + xlab("") + ylab("") +
  scale_x_date(breaks = seq.Date(as.Date("2019-12-01"), as.Date("2100-01-01"), "3 months"),
               labels = date_format("%b %Y")) +
  scale_y_continuous(breaks = 0.01*seq(-20, 100, 10),
                     labels = percent_format(a = 1)) +
  scale_color_identity() + add_5flags +
  theme(legend.position = c(0.75, 0.90),
        legend.title = element_blank())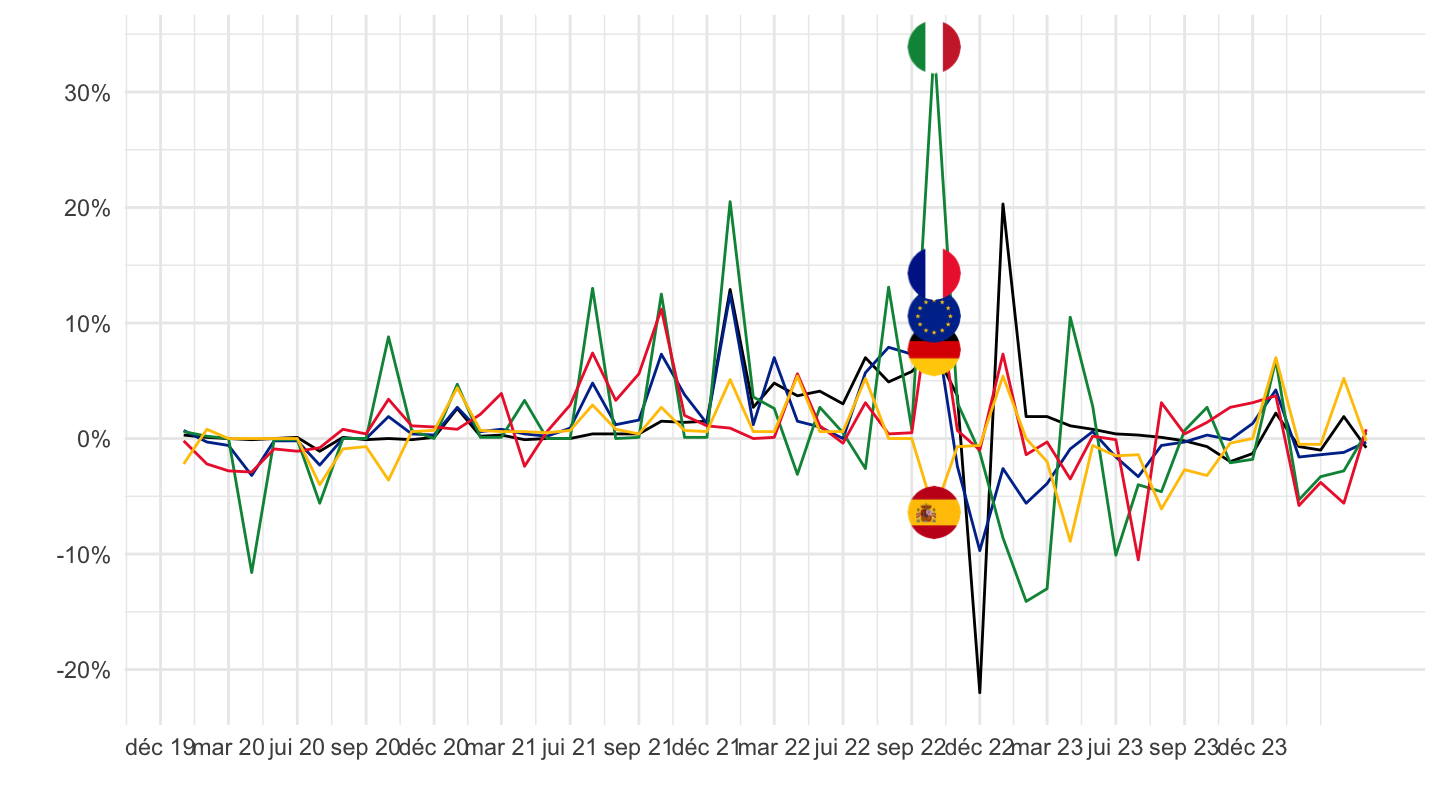
CP0453 - Liquid fuels
All
Code
prc_hicp_mmor %>%
  filter(coicop == "CP0453",
         geo %in% c("FR", "DE", "ES", "IT", "EA19")) %>%
  month_to_date %>%

  mutate(Geo = ifelse(geo == "EA19", "Europe", Geo)) %>%
  left_join(colors, by = c("Geo" = "country")) %>%
  mutate(values = values/100) %>%
  ggplot(.) + geom_line(aes(x = date, y = values, color = color)) +
  theme_minimal() + xlab("") + ylab("") +
  scale_x_date(breaks = seq(1960, 2100, 2) %>% paste0("-01-01") %>% as.Date,
               labels = date_format("%Y")) +
  scale_y_continuous(breaks = 0.01*seq(-100, 100, 5),
                     labels = percent_format(a = 1)) +
  scale_color_identity() + add_5flags +
  theme(legend.position = c(0.75, 0.90),
        legend.title = element_blank())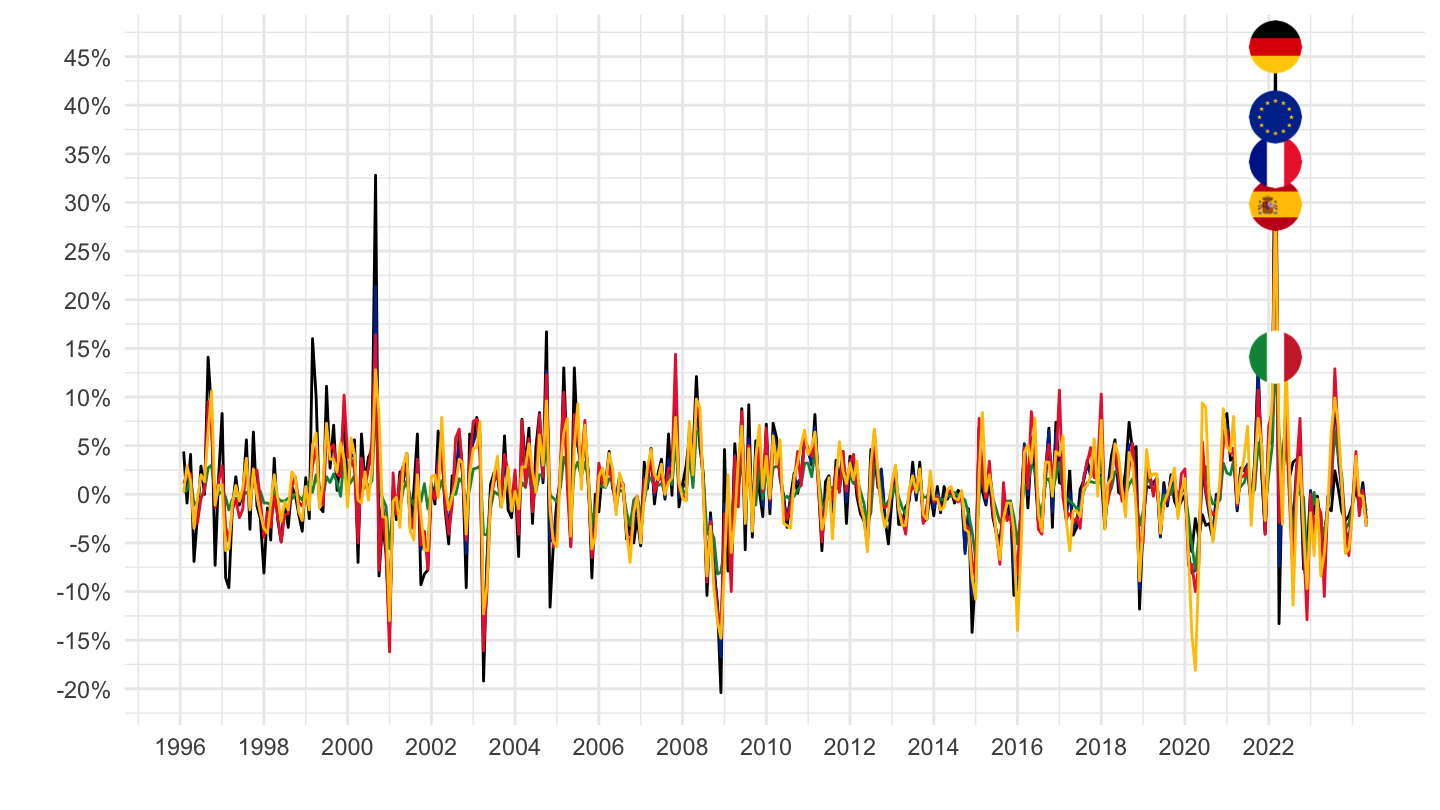
2016-
Code
prc_hicp_mmor %>%
  filter(coicop == "CP0453",
         geo %in% c("FR", "DE", "ES", "IT", "EA19")) %>%
  month_to_date %>%
  filter(date >= as.Date("2016-01-01")) %>%

  mutate(Geo = ifelse(geo == "EA19", "Europe", Geo)) %>%
  left_join(colors, by = c("Geo" = "country")) %>%
  mutate(values = values/100) %>%
  ggplot(.) + geom_line(aes(x = date, y = values, color = color)) +
  theme_minimal() + xlab("") + ylab("") +
  scale_x_date(breaks = seq(1960, 2100, 1) %>% paste0("-01-01") %>% as.Date,
               labels = date_format("%Y")) +
  scale_y_continuous(breaks = 0.01*seq(-20, 100, 5),
                     labels = percent_format(a = 1)) +
  scale_color_identity() + add_5flags +
  theme(legend.position = c(0.75, 0.90),
        legend.title = element_blank())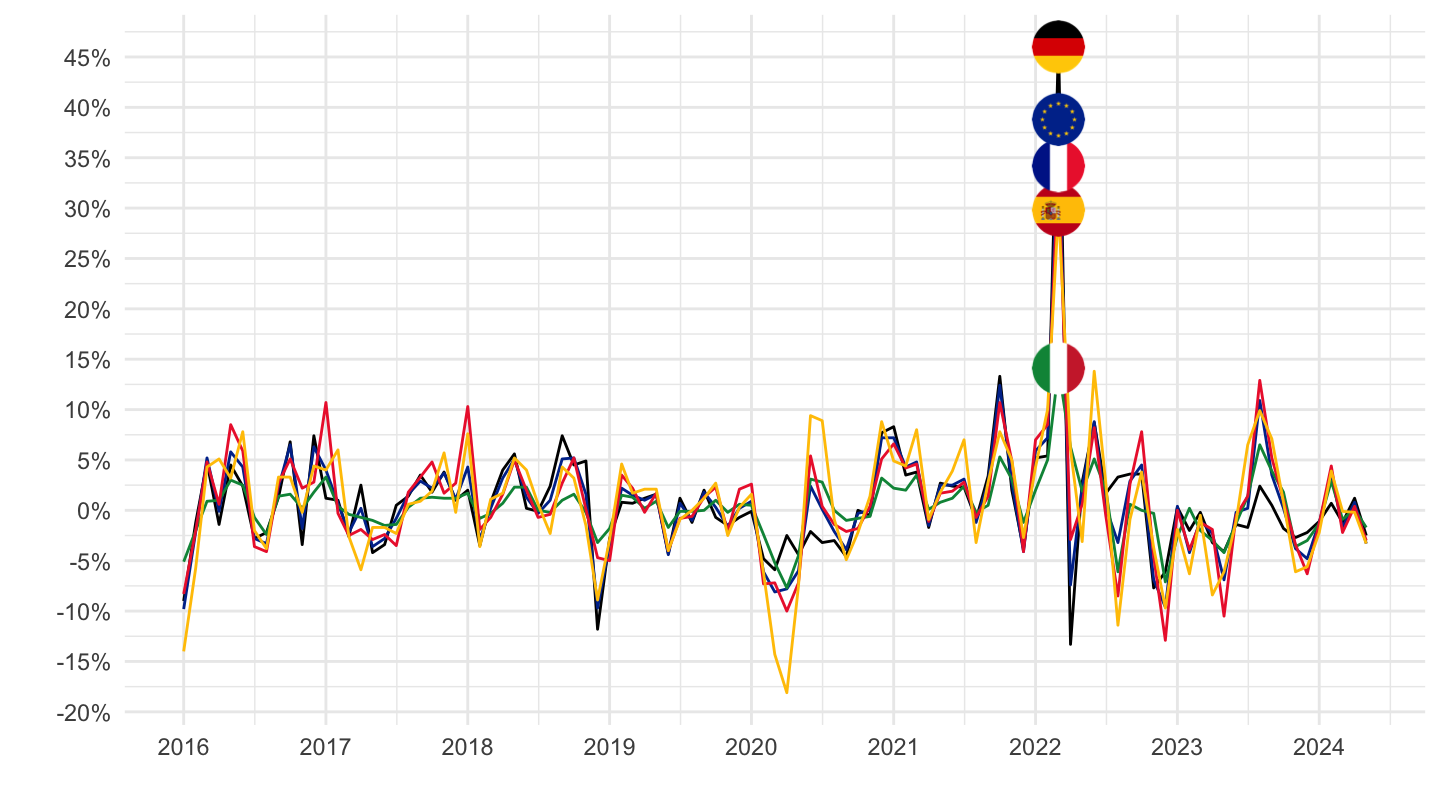
2020-
Code
prc_hicp_mmor %>%
  filter(coicop == "CP0453",
         geo %in% c("FR", "DE", "ES", "IT", "EA19")) %>%
  month_to_date %>%
  filter(date >= as.Date("2020-01-01")) %>%

  mutate(Geo = ifelse(geo == "EA19", "Europe", Geo)) %>%
  left_join(colors, by = c("Geo" = "country")) %>%
  mutate(values = values/100) %>%
  ggplot(.) + geom_line(aes(x = date, y = values, color = color)) +
  theme_minimal() + xlab("") + ylab("") +
  scale_x_date(breaks = seq.Date(as.Date("2019-12-01"), as.Date("2100-01-01"), "3 months"),
               labels = date_format("%b %Y")) +
  scale_y_continuous(breaks = 0.01*seq(-20, 100, 10),
                     labels = percent_format(a = 1)) +
  scale_color_identity() + add_5flags +
  theme(legend.position = c(0.75, 0.90),
        legend.title = element_blank())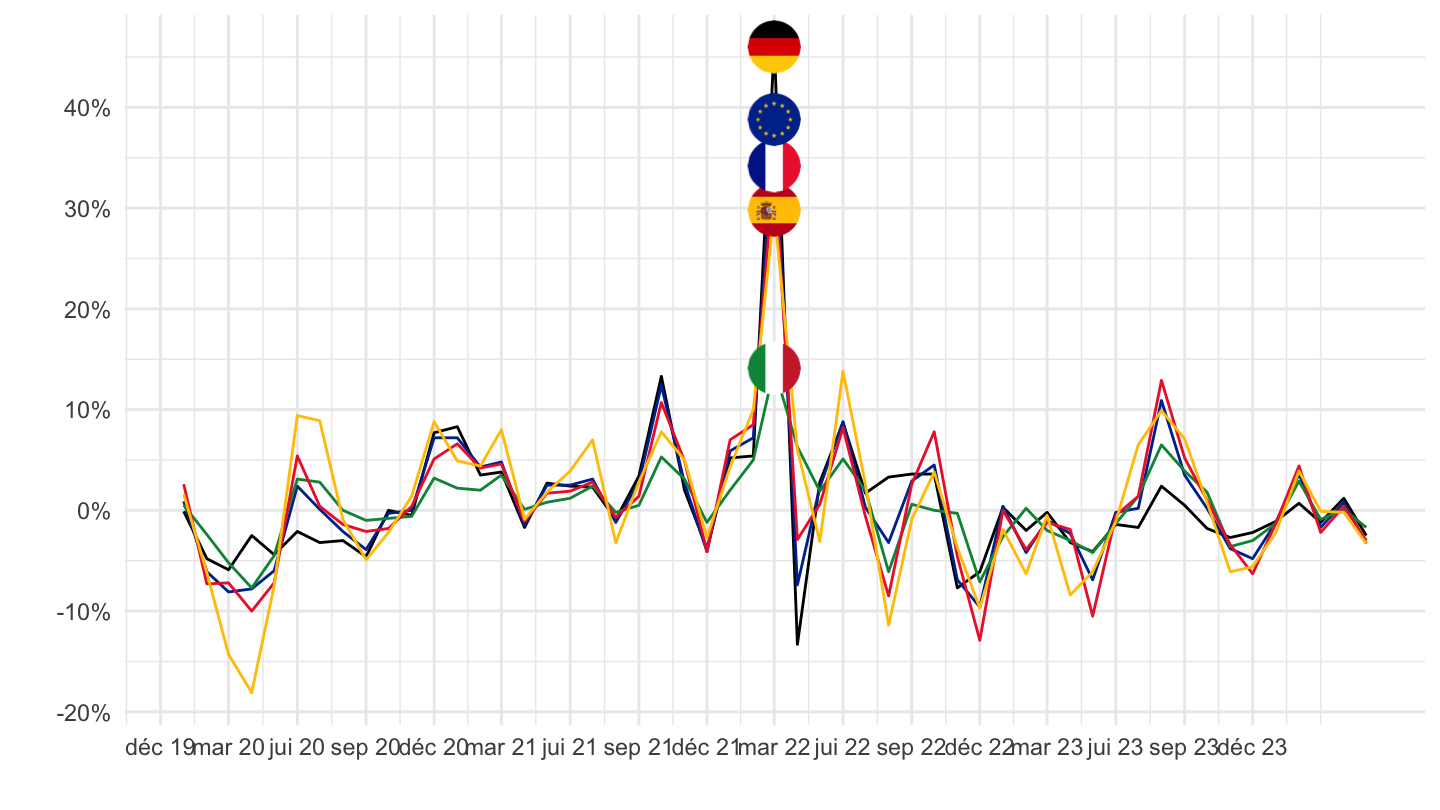
CP0454 - Solid fuels
All
Code
prc_hicp_mmor %>%
  filter(coicop == "CP0454",
         geo %in% c("FR", "DE", "ES", "IT", "EA19")) %>%
  month_to_date %>%

  mutate(Geo = ifelse(geo == "EA19", "Europe", Geo)) %>%
  left_join(colors, by = c("Geo" = "country")) %>%
  mutate(values = values/100) %>%
  ggplot(.) + geom_line(aes(x = date, y = values, color = color)) +
  theme_minimal() + xlab("") + ylab("") +
  scale_x_date(breaks = seq(1960, 2100, 2) %>% paste0("-01-01") %>% as.Date,
               labels = date_format("%Y")) +
  scale_y_continuous(breaks = 0.01*seq(-100, 100, 5),
                     labels = percent_format(a = 1)) +
  scale_color_identity() + add_5flags +
  theme(legend.position = c(0.75, 0.90),
        legend.title = element_blank())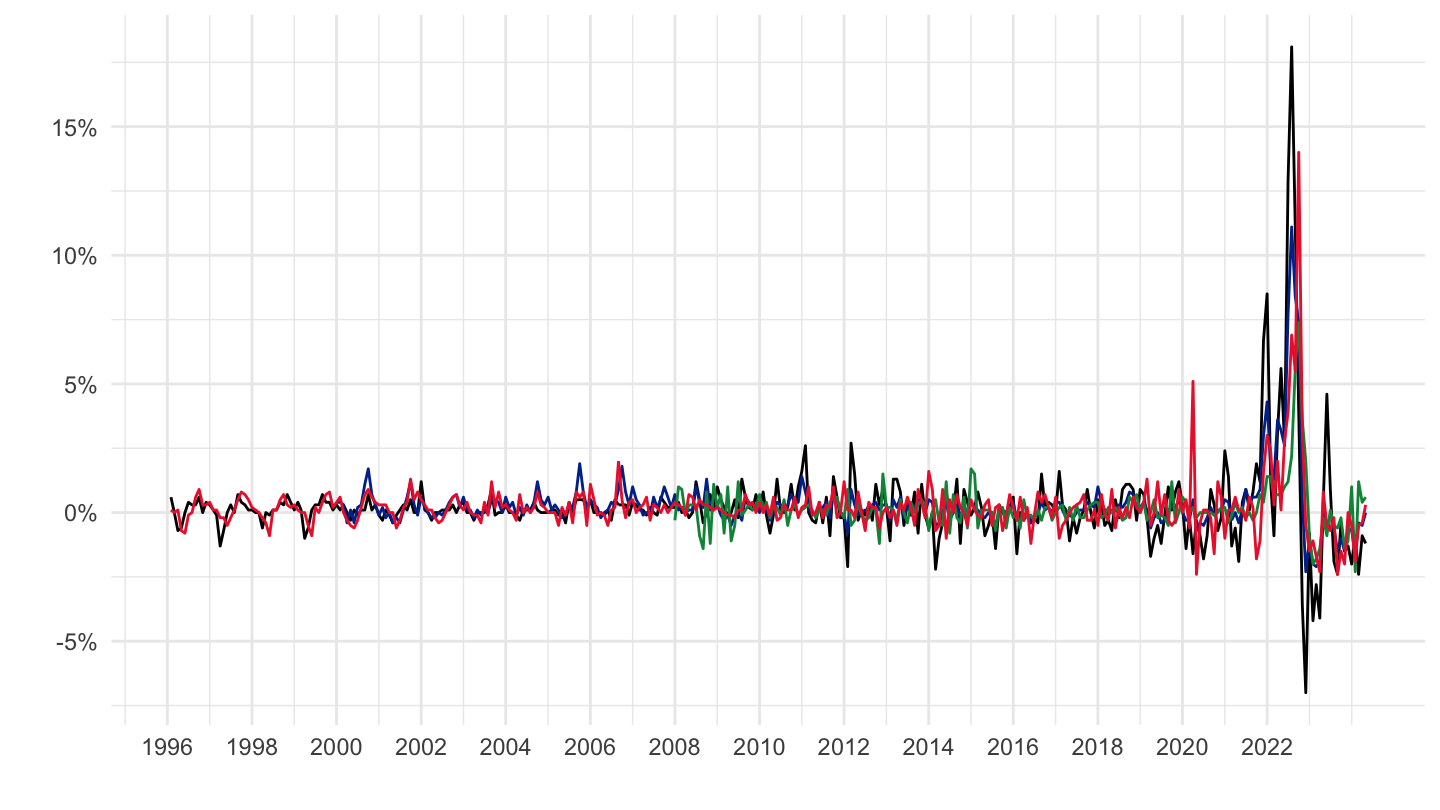
2016-
Code
prc_hicp_mmor %>%
  filter(coicop == "CP0454",
         geo %in% c("FR", "DE", "ES", "IT", "EA19")) %>%
  month_to_date %>%
  filter(date >= as.Date("2016-01-01")) %>%

  mutate(Geo = ifelse(geo == "EA19", "Europe", Geo)) %>%
  left_join(colors, by = c("Geo" = "country")) %>%
  mutate(values = values/100) %>%
  ggplot(.) + geom_line(aes(x = date, y = values, color = color)) +
  theme_minimal() + xlab("") + ylab("") +
  scale_x_date(breaks = seq(1960, 2100, 1) %>% paste0("-01-01") %>% as.Date,
               labels = date_format("%Y")) +
  scale_y_continuous(breaks = 0.01*seq(-20, 100, 5),
                     labels = percent_format(a = 1)) +
  scale_color_identity() + add_5flags +
  theme(legend.position = c(0.75, 0.90),
        legend.title = element_blank())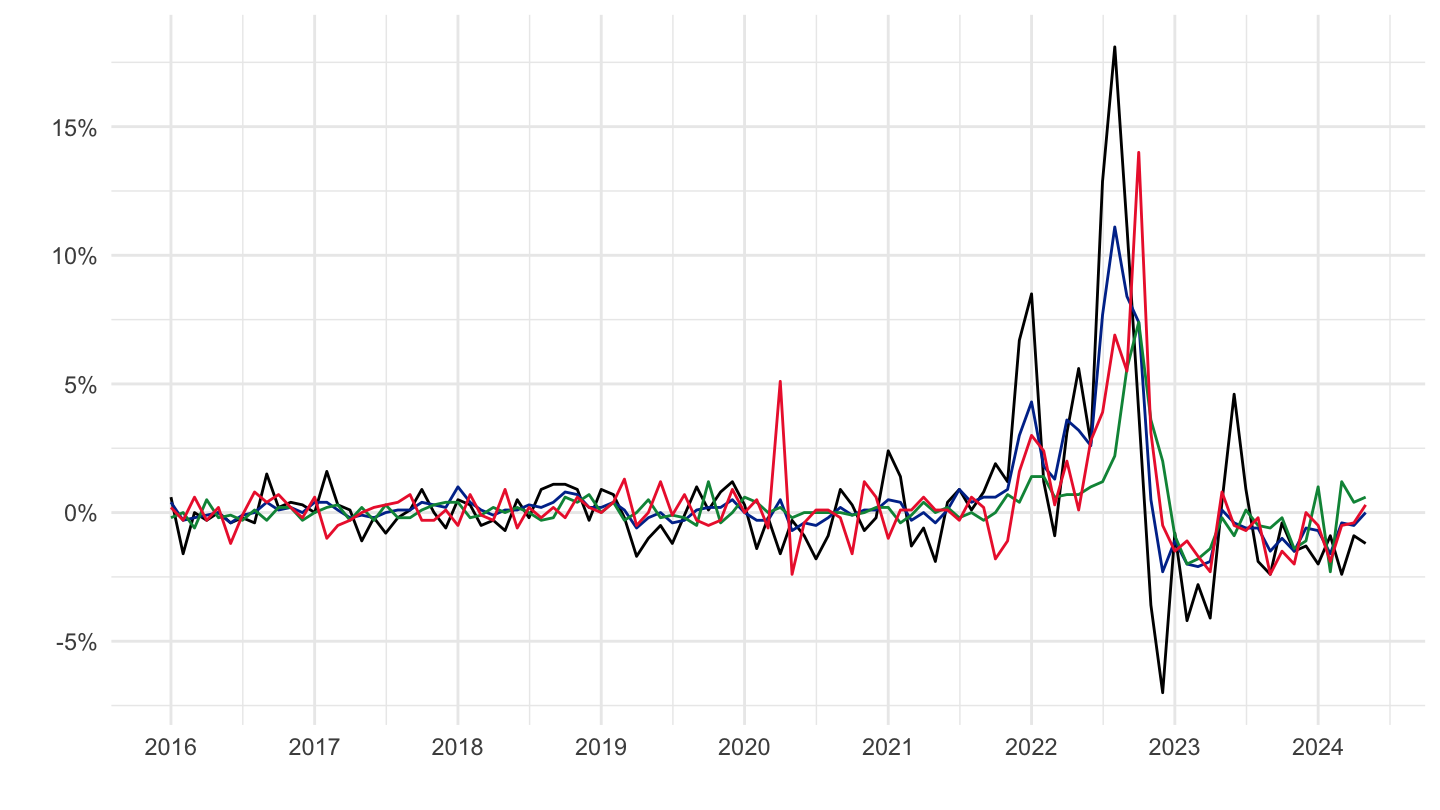
2020-
Code
prc_hicp_mmor %>%
  filter(coicop == "CP0454",
         geo %in% c("FR", "DE", "ES", "IT", "EA19")) %>%
  month_to_date %>%
  filter(date >= as.Date("2020-01-01")) %>%

  mutate(Geo = ifelse(geo == "EA19", "Europe", Geo)) %>%
  left_join(colors, by = c("Geo" = "country")) %>%
  mutate(values = values/100) %>%
  ggplot(.) + geom_line(aes(x = date, y = values, color = color)) +
  theme_minimal() + xlab("") + ylab("") +
  scale_x_date(breaks = seq.Date(as.Date("2019-12-01"), as.Date("2100-01-01"), "3 months"),
               labels = date_format("%b %Y")) +
  scale_y_continuous(breaks = 0.01*seq(-20, 100, 5),
                     labels = percent_format(a = 1)) +
  scale_color_identity() + add_4flags +
  theme(legend.position = c(0.75, 0.90),
        legend.title = element_blank())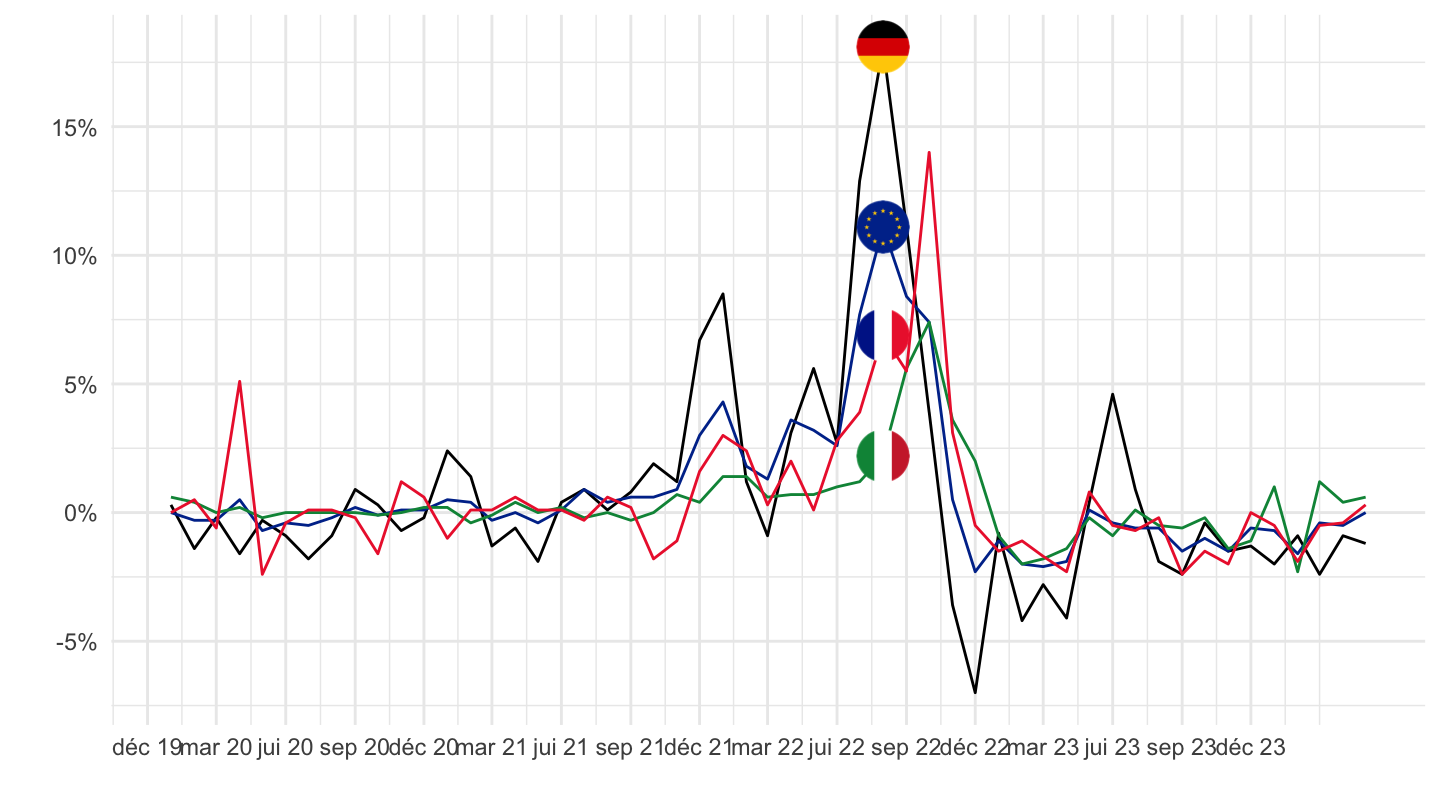
CP045 - Electricity, gas and other fuels
All
Code
prc_hicp_mmor %>%
  filter(coicop == "CP045",
         geo %in% c("FR", "DE", "ES", "IT", "EA19")) %>%
  month_to_date %>%

  mutate(Geo = ifelse(geo == "EA19", "Europe", Geo)) %>%
  left_join(colors, by = c("Geo" = "country")) %>%
  mutate(values = values/100) %>%
  ggplot(.) + geom_line(aes(x = date, y = values, color = color)) +
  theme_minimal() + xlab("") + ylab("") +
  scale_x_date(breaks = seq(1960, 2100, 2) %>% paste0("-01-01") %>% as.Date,
               labels = date_format("%Y")) +
  scale_y_continuous(breaks = 0.01*seq(-100, 100, 5),
                     labels = percent_format(a = 1)) +
  scale_color_identity() + add_5flags +
  theme(legend.position = c(0.75, 0.90),
        legend.title = element_blank())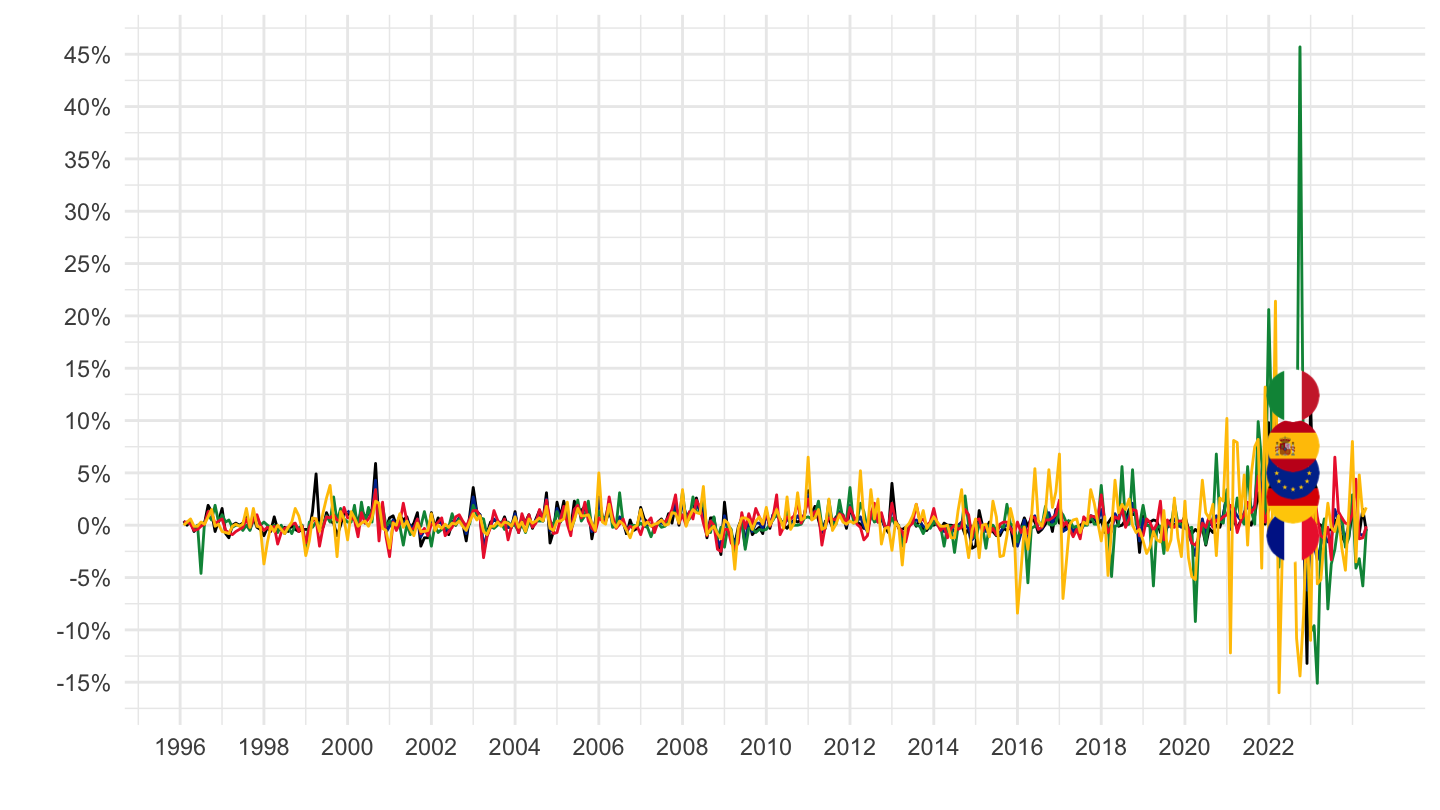
2016-
Code
prc_hicp_mmor %>%
  filter(coicop == "CP045",
         geo %in% c("FR", "DE", "ES", "IT", "EA19")) %>%
  month_to_date %>%
  filter(date >= as.Date("2016-01-01")) %>%

  mutate(Geo = ifelse(geo == "EA19", "Europe", Geo)) %>%
  left_join(colors, by = c("Geo" = "country")) %>%
  mutate(values = values/100) %>%
  ggplot(.) + geom_line(aes(x = date, y = values, color = color)) +
  theme_minimal() + xlab("") + ylab("") +
  scale_x_date(breaks = seq(1960, 2100, 1) %>% paste0("-01-01") %>% as.Date,
               labels = date_format("%Y")) +
  scale_y_continuous(breaks = 0.01*seq(-20, 100, 5),
                     labels = percent_format(a = 1)) +
  scale_color_identity() + add_5flags +
  theme(legend.position = c(0.75, 0.90),
        legend.title = element_blank())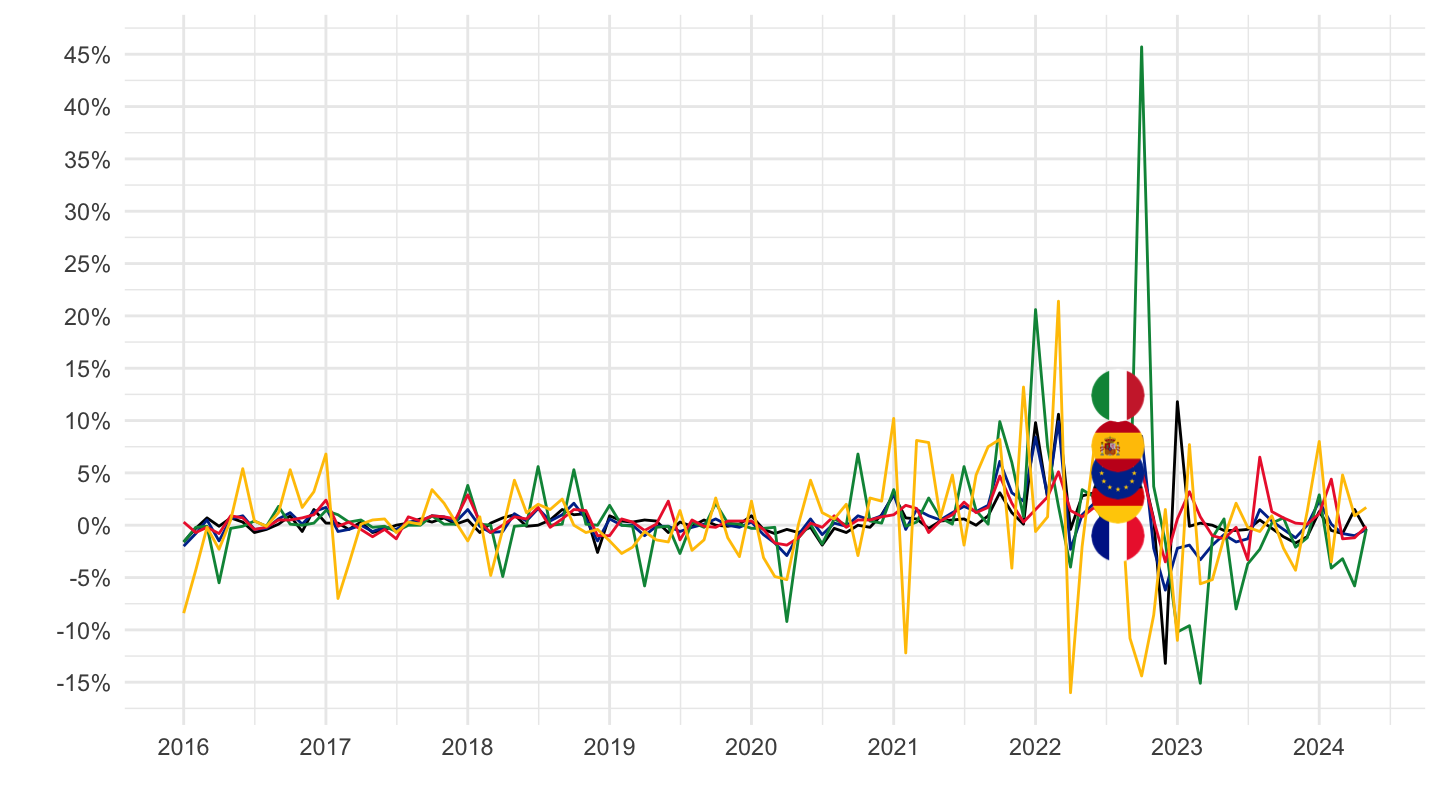
2020-
Code
prc_hicp_mmor %>%
  filter(coicop == "CP045",
         geo %in% c("FR", "DE", "ES", "IT", "EA19")) %>%
  month_to_date %>%
  filter(date >= as.Date("2020-01-01")) %>%

  mutate(Geo = ifelse(geo == "EA19", "Europe", Geo)) %>%
  left_join(colors, by = c("Geo" = "country")) %>%
  mutate(values = values/100) %>%
  ggplot(.) + geom_line(aes(x = date, y = values, color = color)) +
  theme_minimal() + xlab("") + ylab("") +
  scale_x_date(breaks = seq.Date(as.Date("2019-12-01"), as.Date("2100-01-01"), "3 months"),
               labels = date_format("%b %Y")) +
  scale_y_continuous(breaks = 0.01*seq(-20, 100, 10),
                     labels = percent_format(a = 1)) +
  scale_color_identity() + add_5flags +
  theme(legend.position = c(0.75, 0.90),
        legend.title = element_blank())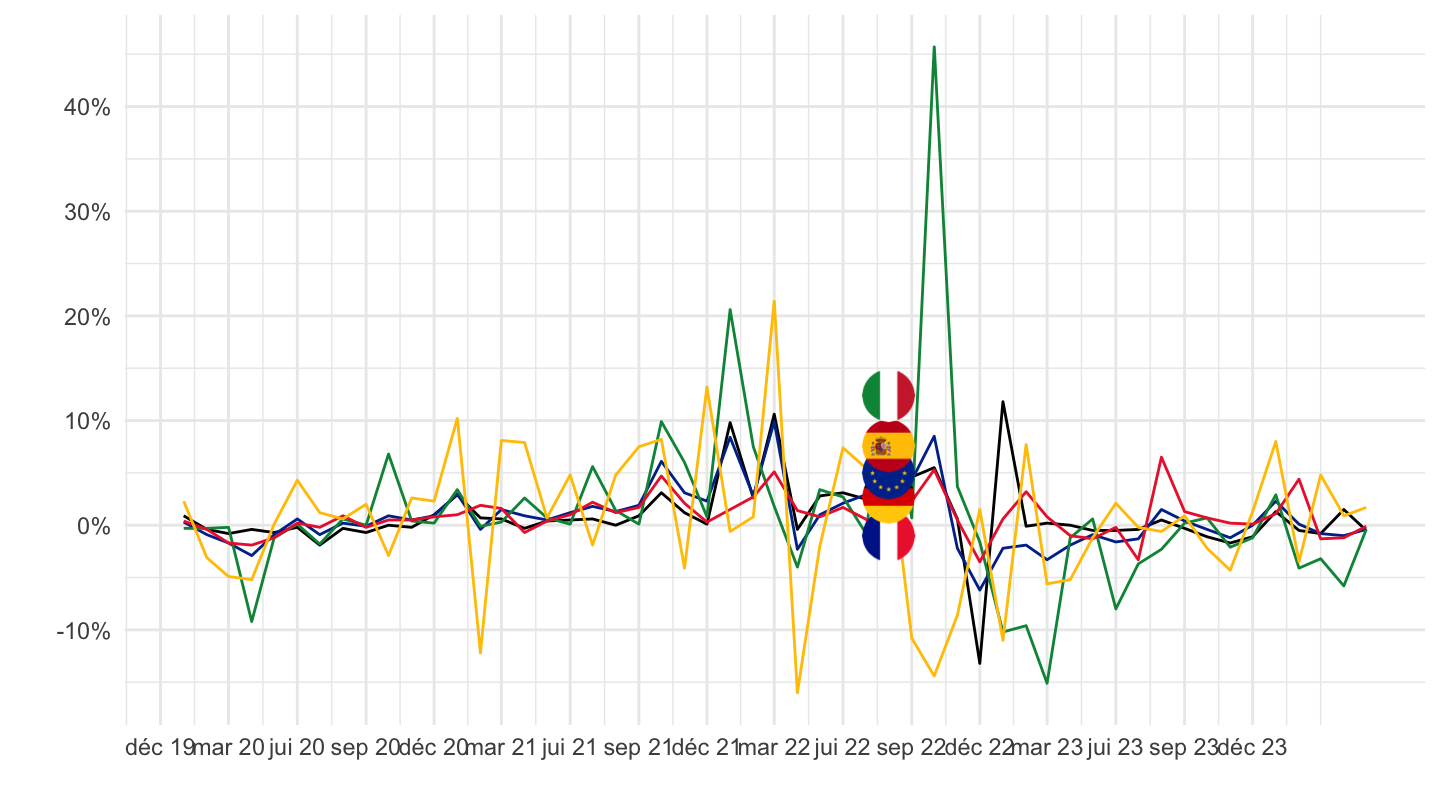
CP0455 - Heat energy
All
Code
prc_hicp_mmor %>%
  filter(coicop == "CP0455",
         geo %in% c("FR", "DE", "ES", "IT", "EA19")) %>%
  month_to_date %>%

  mutate(Geo = ifelse(geo == "EA19", "Europe", Geo)) %>%
  left_join(colors, by = c("Geo" = "country")) %>%
  mutate(values = values/100) %>%
  ggplot(.) + geom_line(aes(x = date, y = values, color = color)) +
  theme_minimal() + xlab("") + ylab("") +
  scale_x_date(breaks = seq(1960, 2100, 2) %>% paste0("-01-01") %>% as.Date,
               labels = date_format("%Y")) +
  scale_y_continuous(breaks = 0.01*seq(-100, 100, 5),
                     labels = percent_format(a = 1)) +
  scale_color_identity() + add_5flags +
  theme(legend.position = c(0.75, 0.90),
        legend.title = element_blank())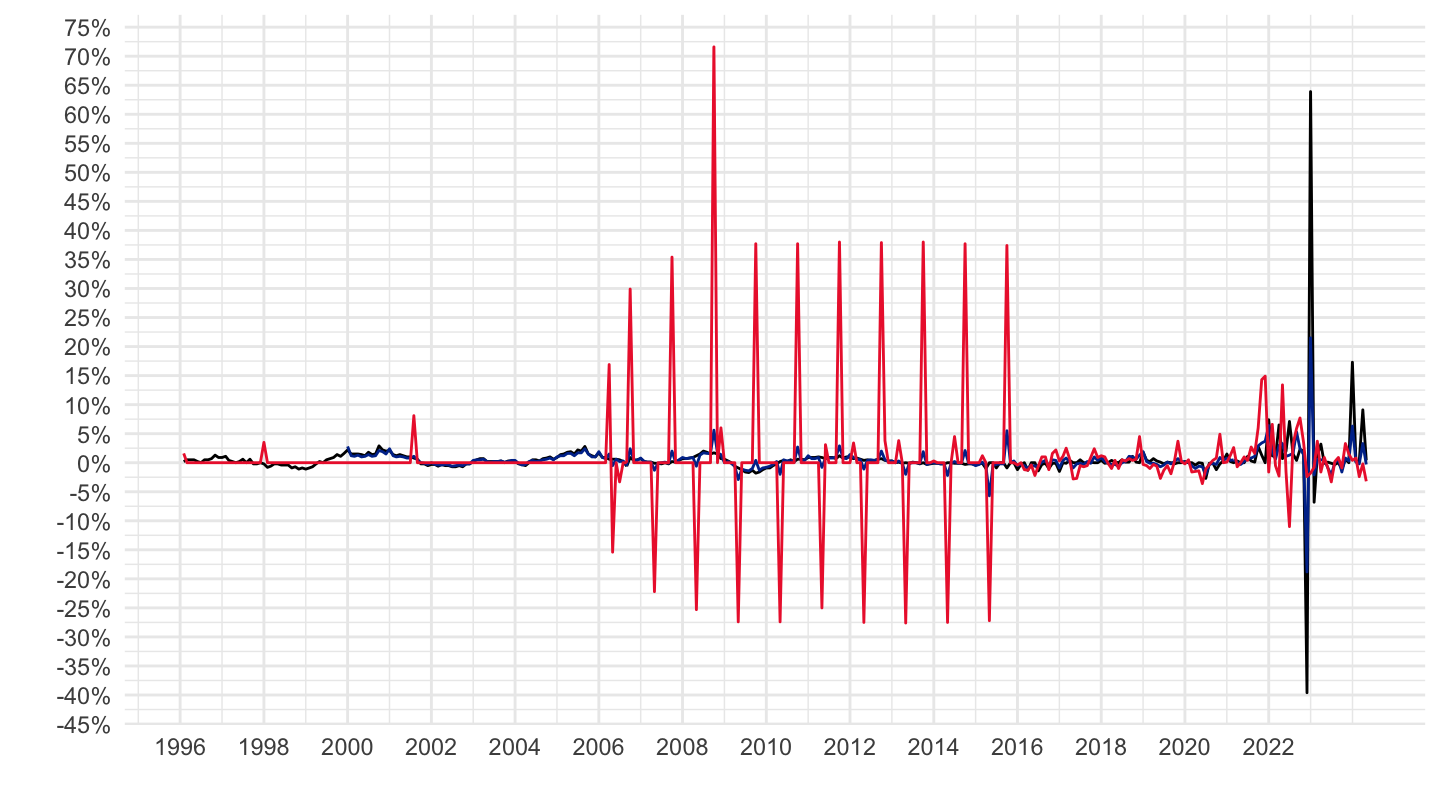
2016-
Code
prc_hicp_mmor %>%
  filter(coicop == "CP0455",
         geo %in% c("FR", "DE", "ES", "IT", "EA19")) %>%
  month_to_date %>%
  filter(date >= as.Date("2016-01-01")) %>%

  mutate(Geo = ifelse(geo == "EA19", "Europe", Geo)) %>%
  left_join(colors, by = c("Geo" = "country")) %>%
  mutate(values = values/100) %>%
  ggplot(.) + geom_line(aes(x = date, y = values, color = color)) +
  theme_minimal() + xlab("") + ylab("") +
  scale_x_date(breaks = seq(1960, 2100, 1) %>% paste0("-01-01") %>% as.Date,
               labels = date_format("%Y")) +
  scale_y_continuous(breaks = 0.01*seq(-20, 100, 5),
                     labels = percent_format(a = 1)) +
  scale_color_identity() + add_5flags +
  theme(legend.position = c(0.75, 0.90),
        legend.title = element_blank())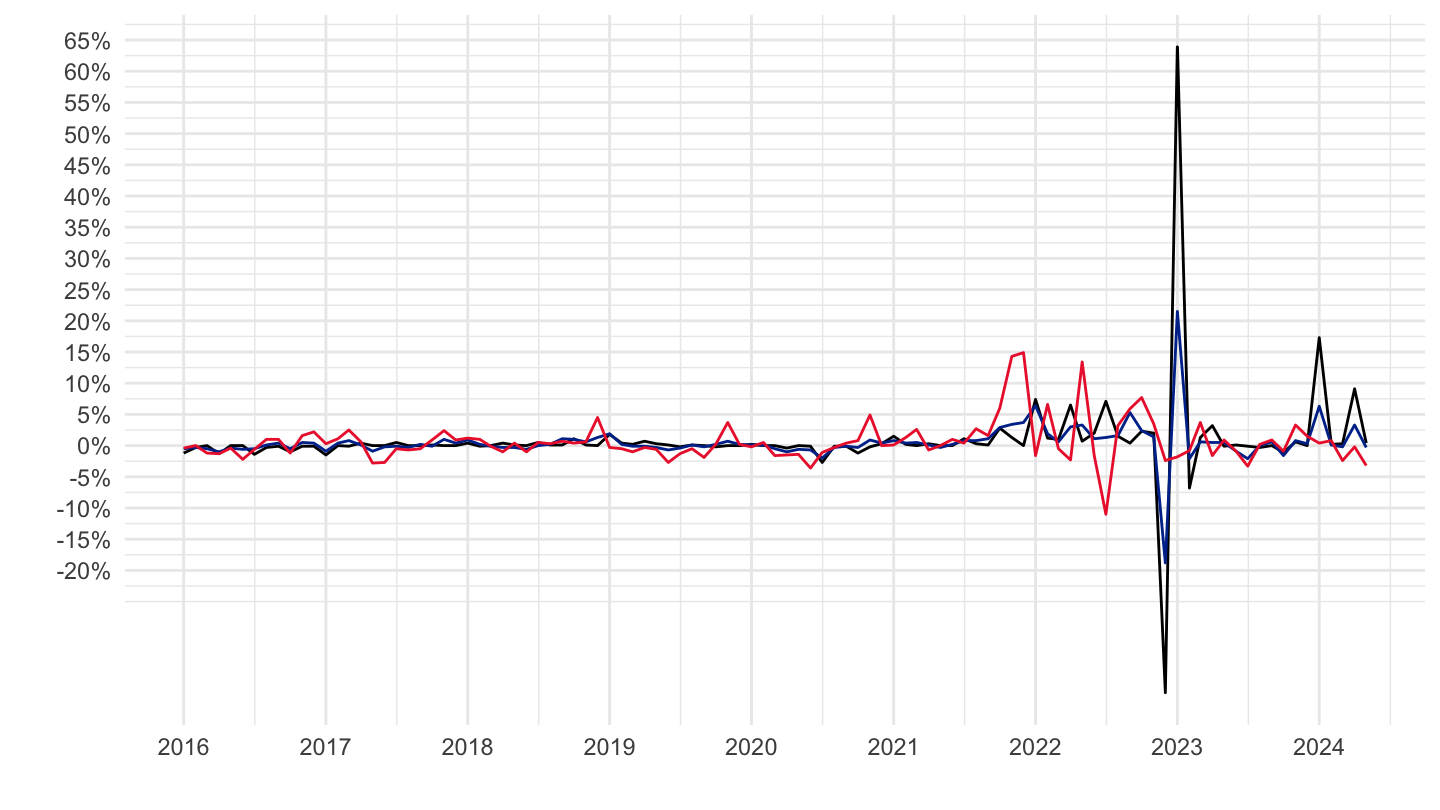
2020-
Code
prc_hicp_mmor %>%
  filter(coicop == "CP0455",
         geo %in% c("FR", "DE", "ES", "IT", "EA19")) %>%
  month_to_date %>%
  filter(date >= as.Date("2020-01-01")) %>%

  mutate(Geo = ifelse(geo == "EA19", "Europe", Geo)) %>%
  left_join(colors, by = c("Geo" = "country")) %>%
  mutate(values = values/100) %>%
  ggplot(.) + geom_line(aes(x = date, y = values, color = color)) +
  theme_minimal() + xlab("") + ylab("") +
  scale_x_date(breaks = seq.Date(as.Date("2019-12-01"), as.Date("2100-01-01"), "3 months"),
               labels = date_format("%b %Y")) +
  scale_y_continuous(breaks = 0.01*seq(-20, 100, 10),
                     labels = percent_format(a = 1)) +
  scale_color_identity() + add_3flags +
  theme(legend.position = c(0.75, 0.90),
        legend.title = element_blank())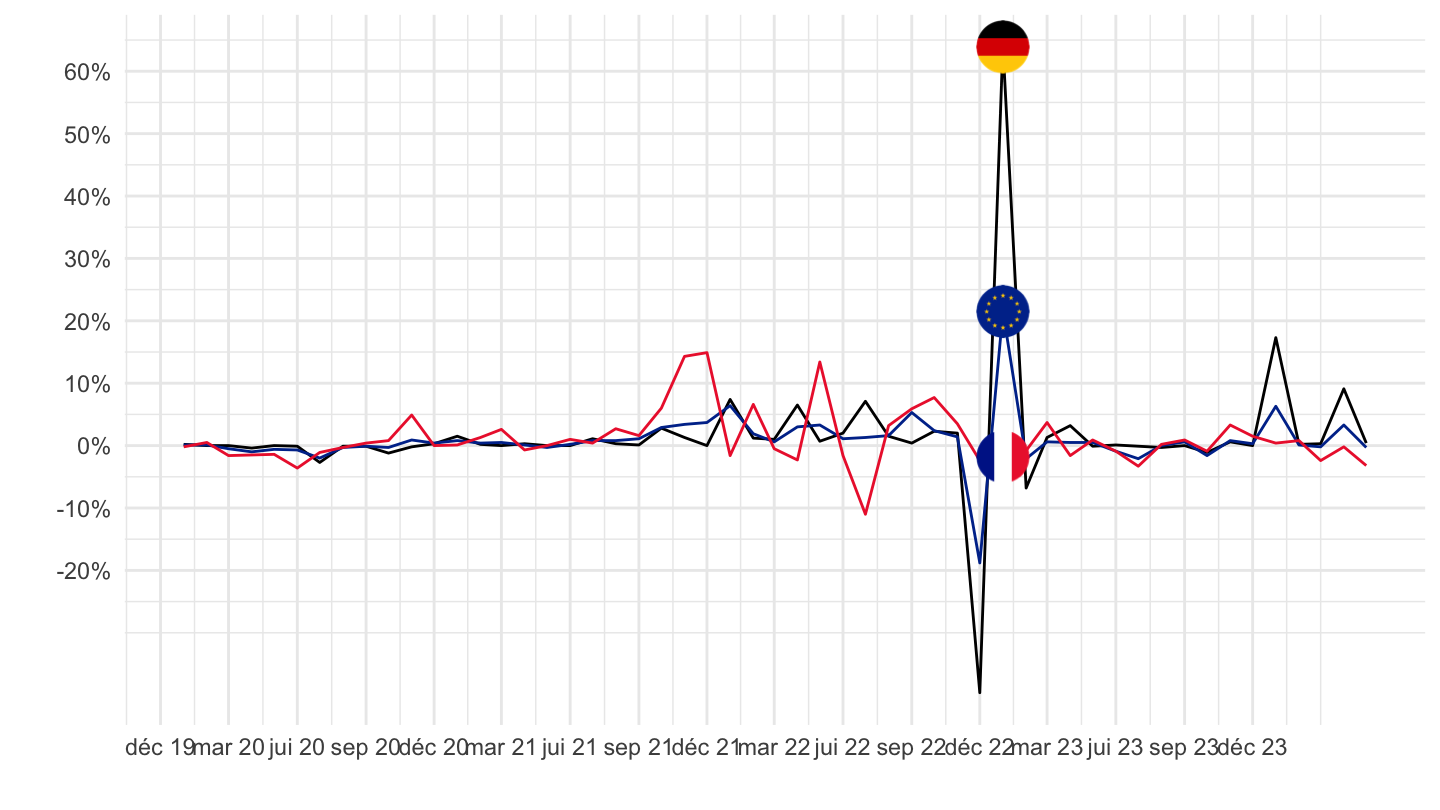
NRG
All
Code
prc_hicp_mmor %>%
  filter(coicop == "NRG",
         geo %in% c("FR", "DE", "ES", "IT", "EA19")) %>%
  month_to_date %>%

  mutate(Geo = ifelse(geo == "EA19", "Europe", Geo)) %>%
  left_join(colors, by = c("Geo" = "country")) %>%
  mutate(values = values/100) %>%
  ggplot(.) + geom_line(aes(x = date, y = values, color = color)) +
  theme_minimal() + xlab("") + ylab("") +
  scale_x_date(breaks = seq(1960, 2100, 2) %>% paste0("-01-01") %>% as.Date,
               labels = date_format("%Y")) +
  scale_y_continuous(breaks = 0.01*seq(-100, 100, 5),
                     labels = percent_format(a = 1)) +
  scale_color_identity() + add_5flags +
  theme(legend.position = c(0.75, 0.90),
        legend.title = element_blank())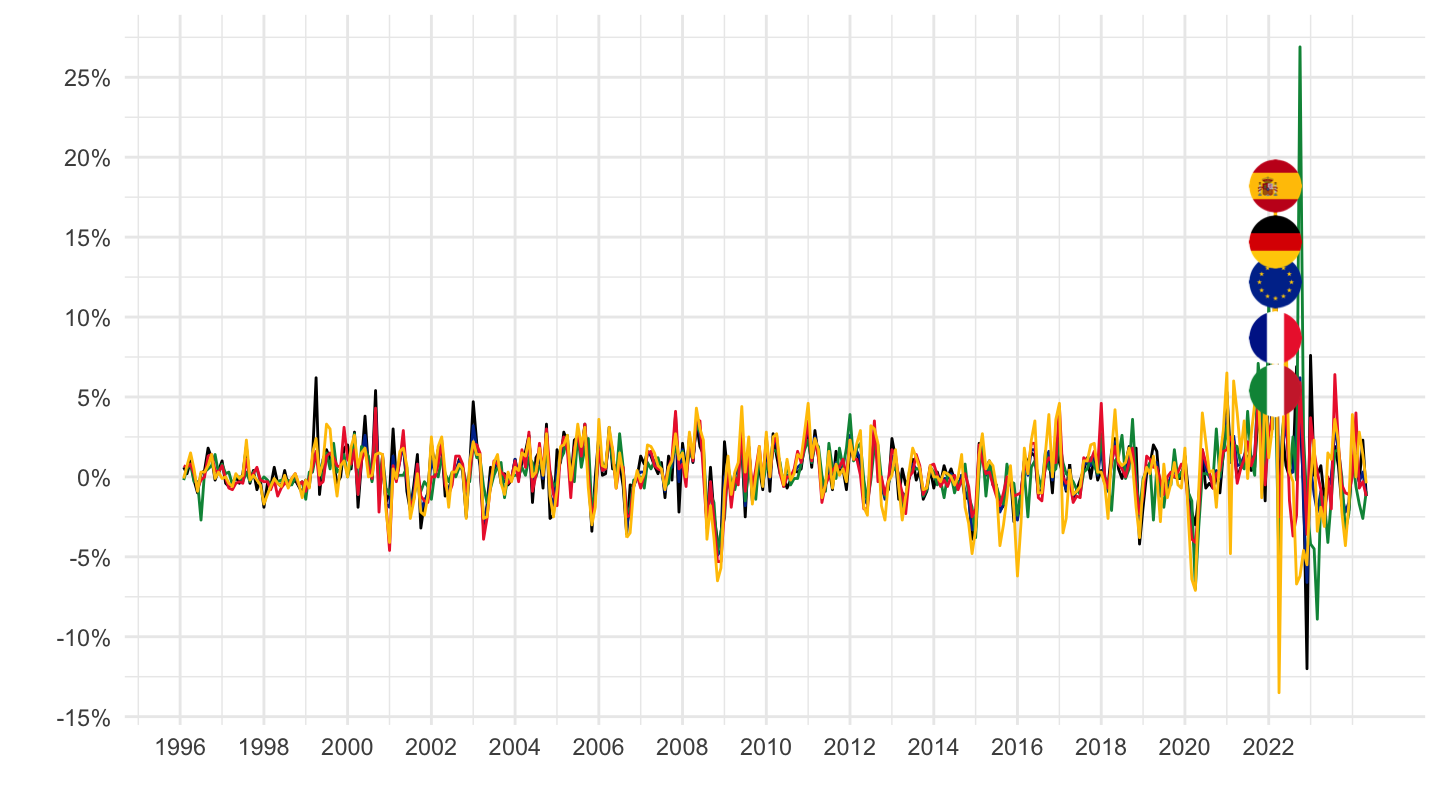
2016-
Code
prc_hicp_mmor %>%
  filter(coicop == "NRG",
         geo %in% c("FR", "DE", "ES", "IT", "EA19")) %>%
  month_to_date %>%
  filter(date >= as.Date("2016-01-01")) %>%

  mutate(Geo = ifelse(geo == "EA19", "Europe", Geo)) %>%
  left_join(colors, by = c("Geo" = "country")) %>%
  mutate(values = values/100) %>%
  ggplot(.) + geom_line(aes(x = date, y = values, color = color)) +
  theme_minimal() + xlab("") + ylab("") +
  scale_x_date(breaks = seq(1960, 2100, 1) %>% paste0("-01-01") %>% as.Date,
               labels = date_format("%Y")) +
  scale_y_continuous(breaks = 0.01*seq(-20, 100, 5),
                     labels = percent_format(a = 1)) +
  scale_color_identity() + add_5flags +
  theme(legend.position = c(0.75, 0.90),
        legend.title = element_blank())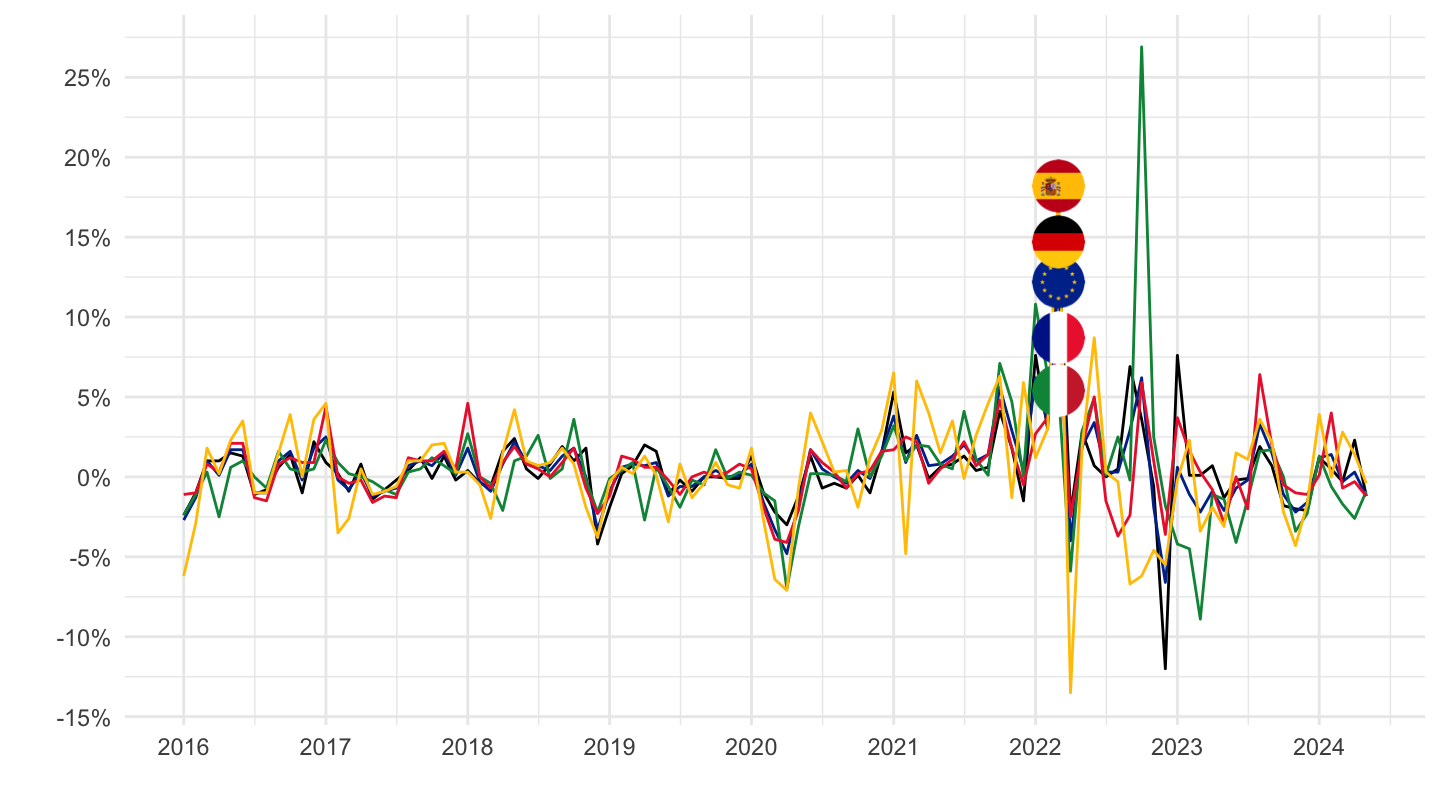
2020-
Code
prc_hicp_mmor %>%
  filter(coicop == "NRG",
         geo %in% c("FR", "DE", "ES", "IT", "EA19")) %>%
  month_to_date %>%
  filter(date >= as.Date("2020-01-01")) %>%

  mutate(Geo = ifelse(geo == "EA19", "Europe", Geo)) %>%
  left_join(colors, by = c("Geo" = "country")) %>%
  mutate(values = values/100) %>%
  ggplot(.) + geom_line(aes(x = date, y = values, color = color)) +
  theme_minimal() + xlab("") + ylab("") +
  scale_x_date(breaks = seq.Date(as.Date("2019-12-01"), as.Date("2100-01-01"), "3 months"),
               labels = date_format("%b %Y")) +
  scale_y_continuous(breaks = 0.01*seq(-20, 100, 10),
                     labels = percent_format(a = 1)) +
  scale_color_identity() + add_5flags +
  theme(legend.position = c(0.75, 0.90),
        legend.title = element_blank())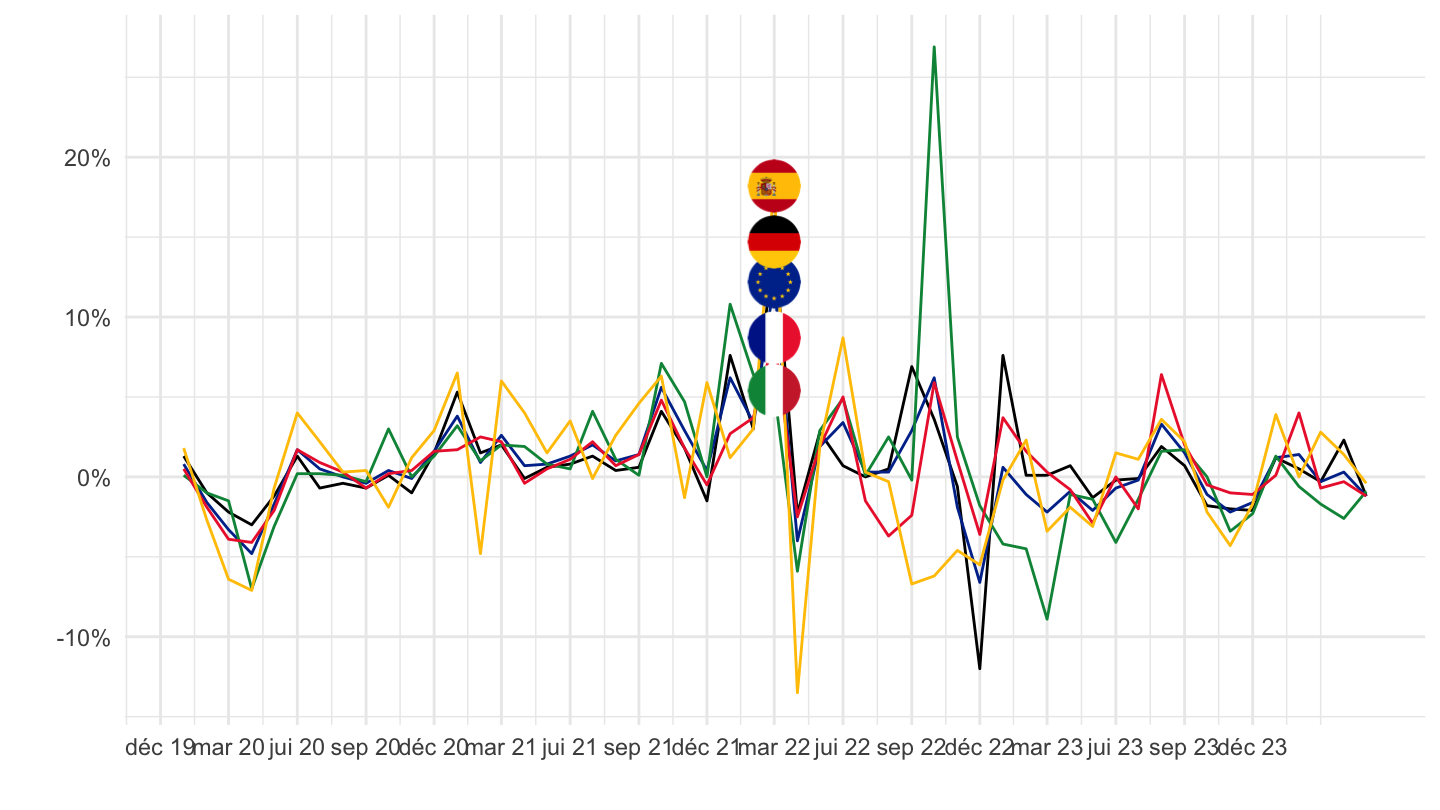
SERV_TRA
All
Code
prc_hicp_mmor %>%
  filter(coicop == "SERV_TRA",
         geo %in% c("FR", "DE", "ES", "IT", "EA19")) %>%
  month_to_date %>%

  mutate(Geo = ifelse(geo == "EA19", "Europe", Geo)) %>%
  left_join(colors, by = c("Geo" = "country")) %>%
  mutate(values = values/100) %>%
  ggplot(.) + geom_line(aes(x = date, y = values, color = color)) +
  theme_minimal() + xlab("") + ylab("") +
  scale_x_date(breaks = seq(1960, 2100, 2) %>% paste0("-01-01") %>% as.Date,
               labels = date_format("%Y")) +
  scale_y_continuous(breaks = 0.01*seq(-100, 100, 5),
                     labels = percent_format(a = 1)) +
  scale_color_identity() + add_5flags +
  theme(legend.position = c(0.75, 0.90),
        legend.title = element_blank())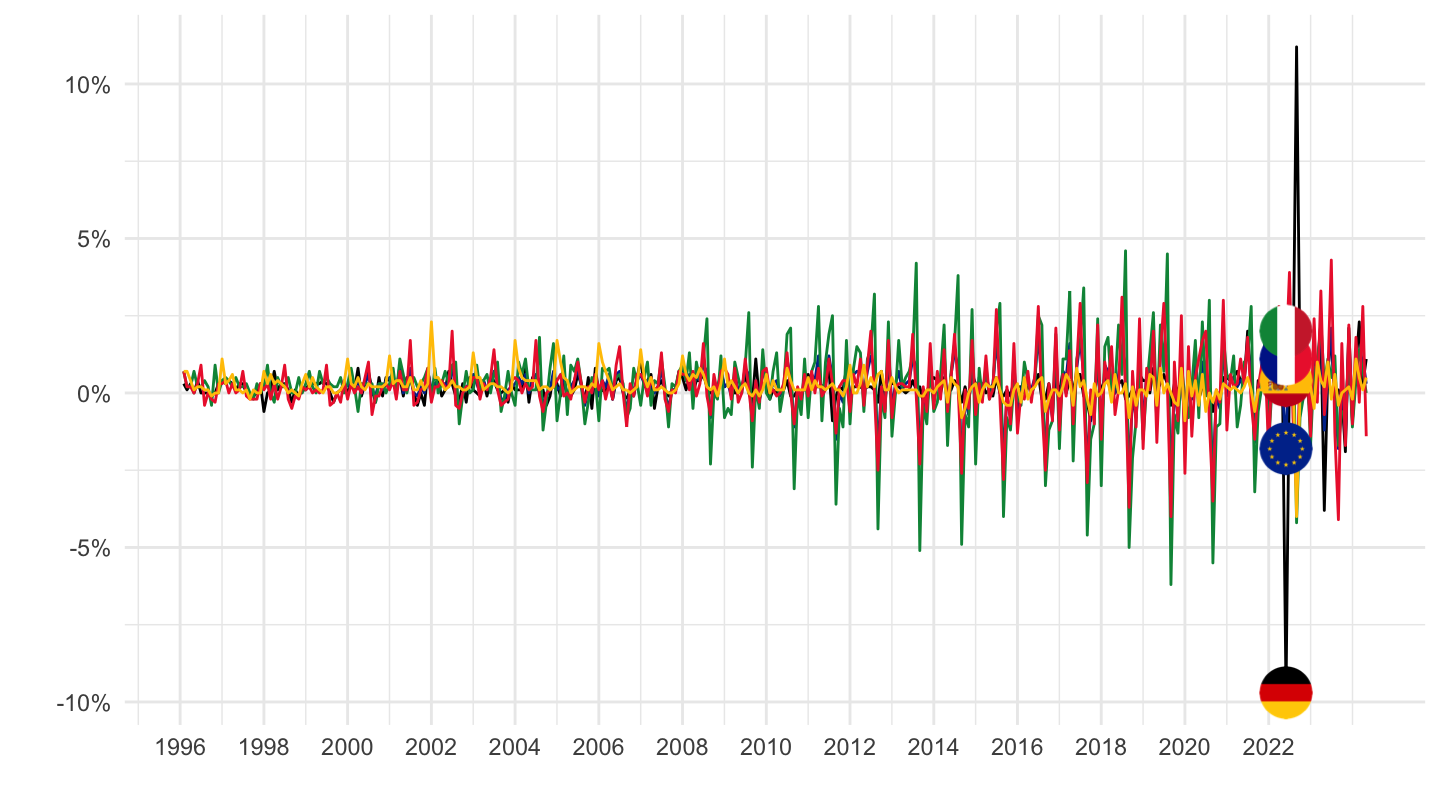
2016-
Code
prc_hicp_mmor %>%
  filter(coicop == "SERV_TRA",
         geo %in% c("FR", "DE", "ES", "IT", "EA19")) %>%
  month_to_date %>%
  filter(date >= as.Date("2016-01-01")) %>%

  mutate(Geo = ifelse(geo == "EA19", "Europe", Geo)) %>%
  left_join(colors, by = c("Geo" = "country")) %>%
  mutate(values = values/100) %>%
  ggplot(.) + geom_line(aes(x = date, y = values, color = color)) +
  theme_minimal() + xlab("") + ylab("") +
  scale_x_date(breaks = seq(1960, 2100, 1) %>% paste0("-01-01") %>% as.Date,
               labels = date_format("%Y")) +
  scale_y_continuous(breaks = 0.01*seq(-20, 100, 5),
                     labels = percent_format(a = 1)) +
  scale_color_identity() + add_5flags +
  theme(legend.position = c(0.75, 0.90),
        legend.title = element_blank())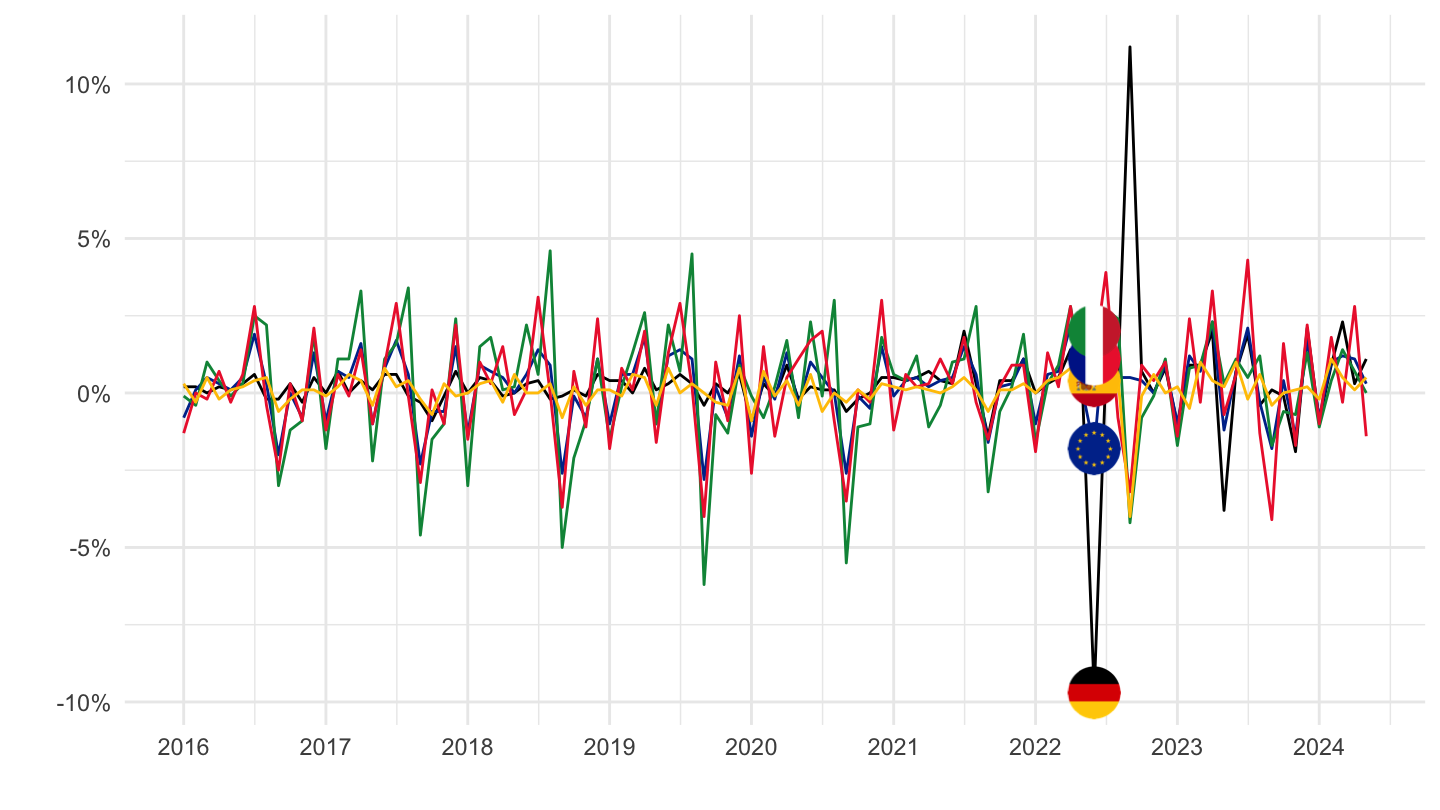
2020-
Code
prc_hicp_mmor %>%
  filter(coicop == "SERV_TRA",
         geo %in% c("FR", "DE", "ES", "IT", "EA19")) %>%
  month_to_date %>%
  filter(date >= as.Date("2020-01-01")) %>%

  mutate(Geo = ifelse(geo == "EA19", "Europe", Geo)) %>%
  left_join(colors, by = c("Geo" = "country")) %>%
  mutate(values = values/100) %>%
  ggplot(.) + geom_line(aes(x = date, y = values, color = color)) +
  theme_minimal() + xlab("") + ylab("") +
  scale_x_date(breaks = seq.Date(as.Date("2019-12-01"), as.Date("2100-01-01"), "3 months"),
               labels = date_format("%b %Y")) +
  scale_y_continuous(breaks = 0.01*seq(-20, 100, 1),
                     labels = percent_format(a = 1)) +
  scale_color_identity() + add_5flags +
  theme(legend.position = c(0.75, 0.90),
        legend.title = element_blank())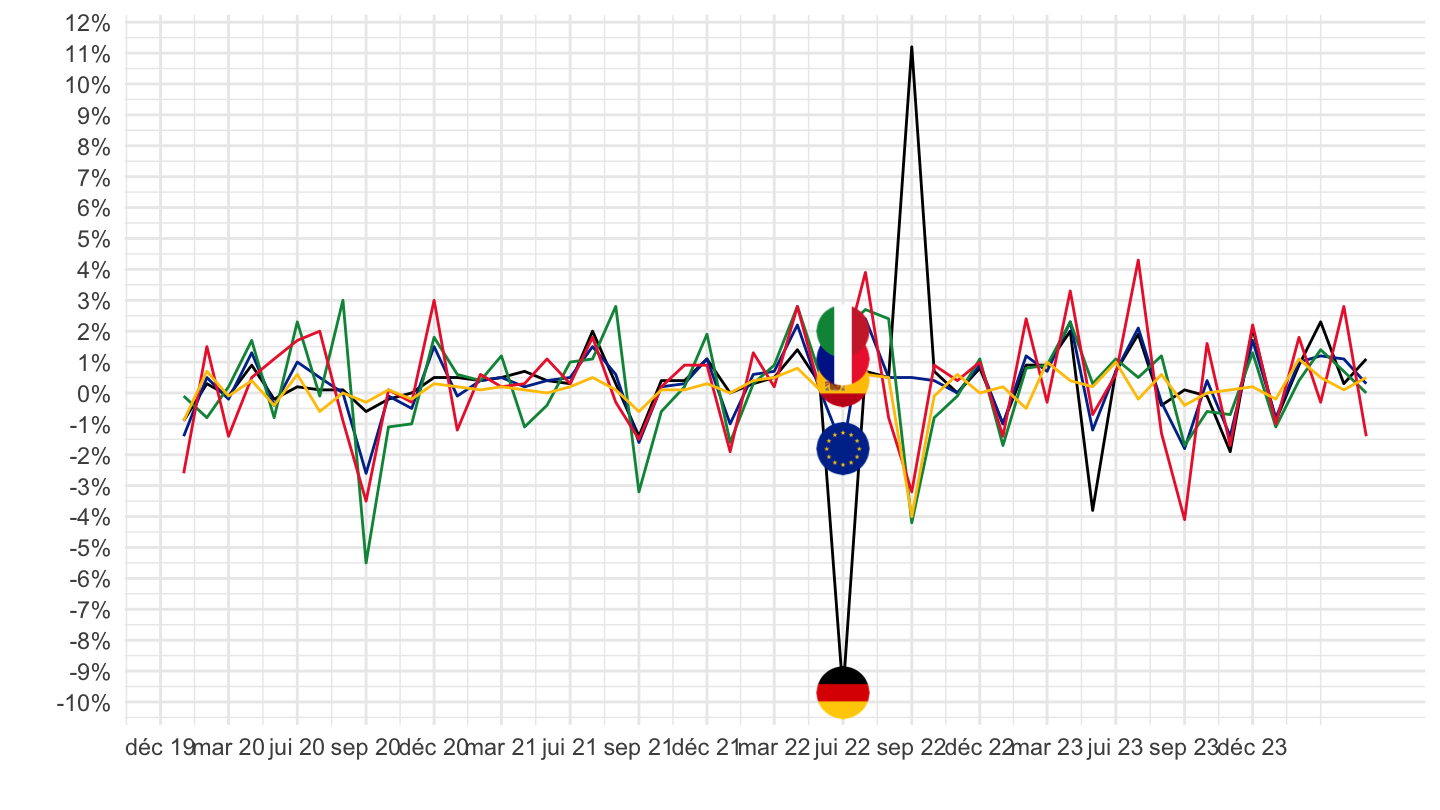
FUEL
All
Code
prc_hicp_mmor %>%
  filter(coicop == "FUEL",
         geo %in% c("FR", "DE", "ES", "IT", "EA19")) %>%
  month_to_date %>%

  mutate(Geo = ifelse(geo == "EA19", "Europe", Geo)) %>%
  left_join(colors, by = c("Geo" = "country")) %>%
  mutate(values = values/100) %>%
  ggplot(.) + geom_line(aes(x = date, y = values, color = color)) +
  theme_minimal() + xlab("") + ylab("") +
  scale_x_date(breaks = seq(1960, 2100, 2) %>% paste0("-01-01") %>% as.Date,
               labels = date_format("%Y")) +
  scale_y_continuous(breaks = 0.01*seq(-100, 100, 5),
                     labels = percent_format(a = 1)) +
  scale_color_identity() + add_5flags +
  theme(legend.position = c(0.75, 0.90),
        legend.title = element_blank())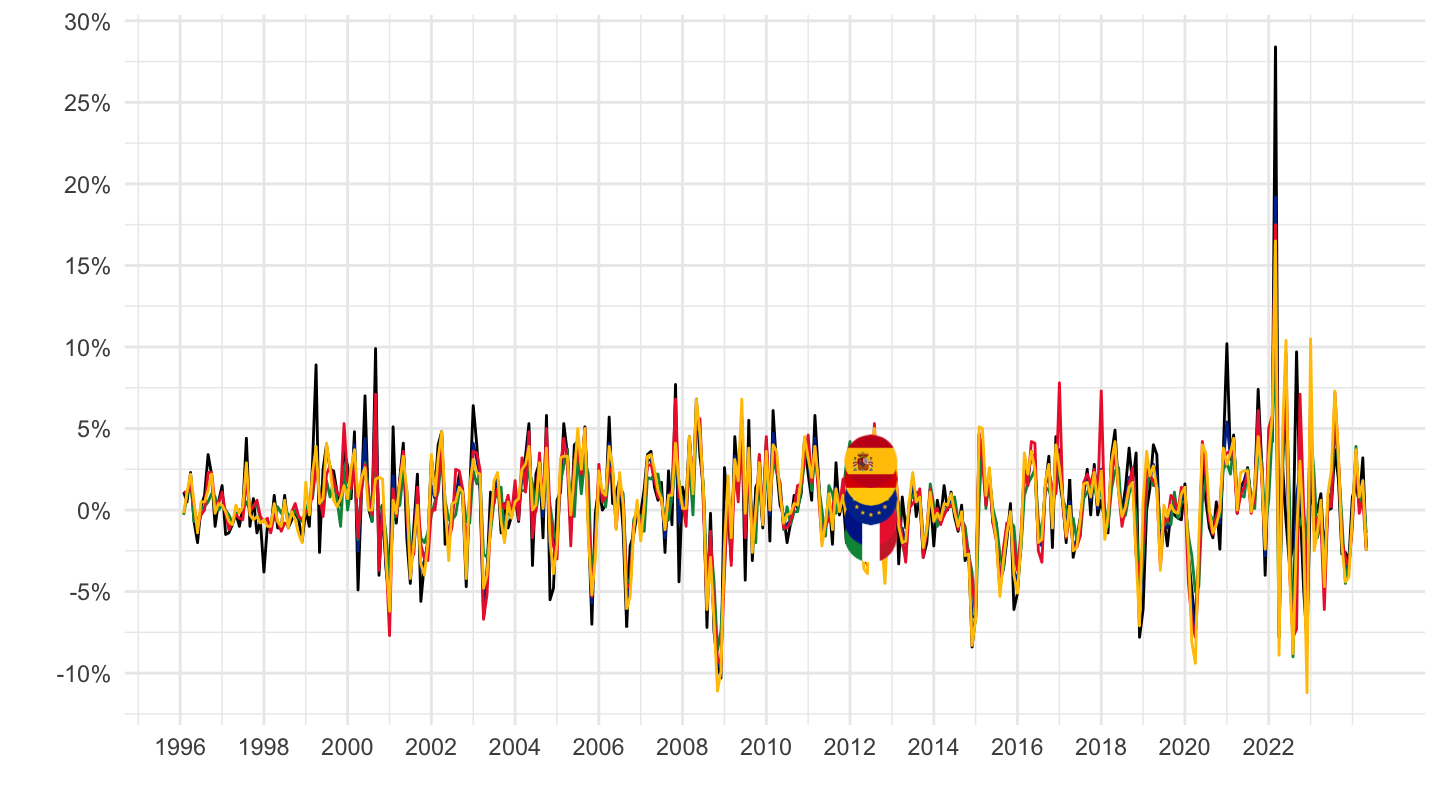
2016-
Code
prc_hicp_mmor %>%
  filter(coicop == "FUEL",
         geo %in% c("FR", "DE", "ES", "IT", "EA19")) %>%
  month_to_date %>%
  filter(date >= as.Date("2016-01-01")) %>%

  mutate(Geo = ifelse(geo == "EA19", "Europe", Geo)) %>%
  left_join(colors, by = c("Geo" = "country")) %>%
  mutate(values = values/100) %>%
  ggplot(.) + geom_line(aes(x = date, y = values, color = color)) +
  theme_minimal() + xlab("") + ylab("") +
  scale_x_date(breaks = seq(1960, 2100, 1) %>% paste0("-01-01") %>% as.Date,
               labels = date_format("%Y")) +
  scale_y_continuous(breaks = 0.01*seq(-20, 100, 5),
                     labels = percent_format(a = 1)) +
  scale_color_identity() + add_5flags +
  theme(legend.position = c(0.75, 0.90),
        legend.title = element_blank())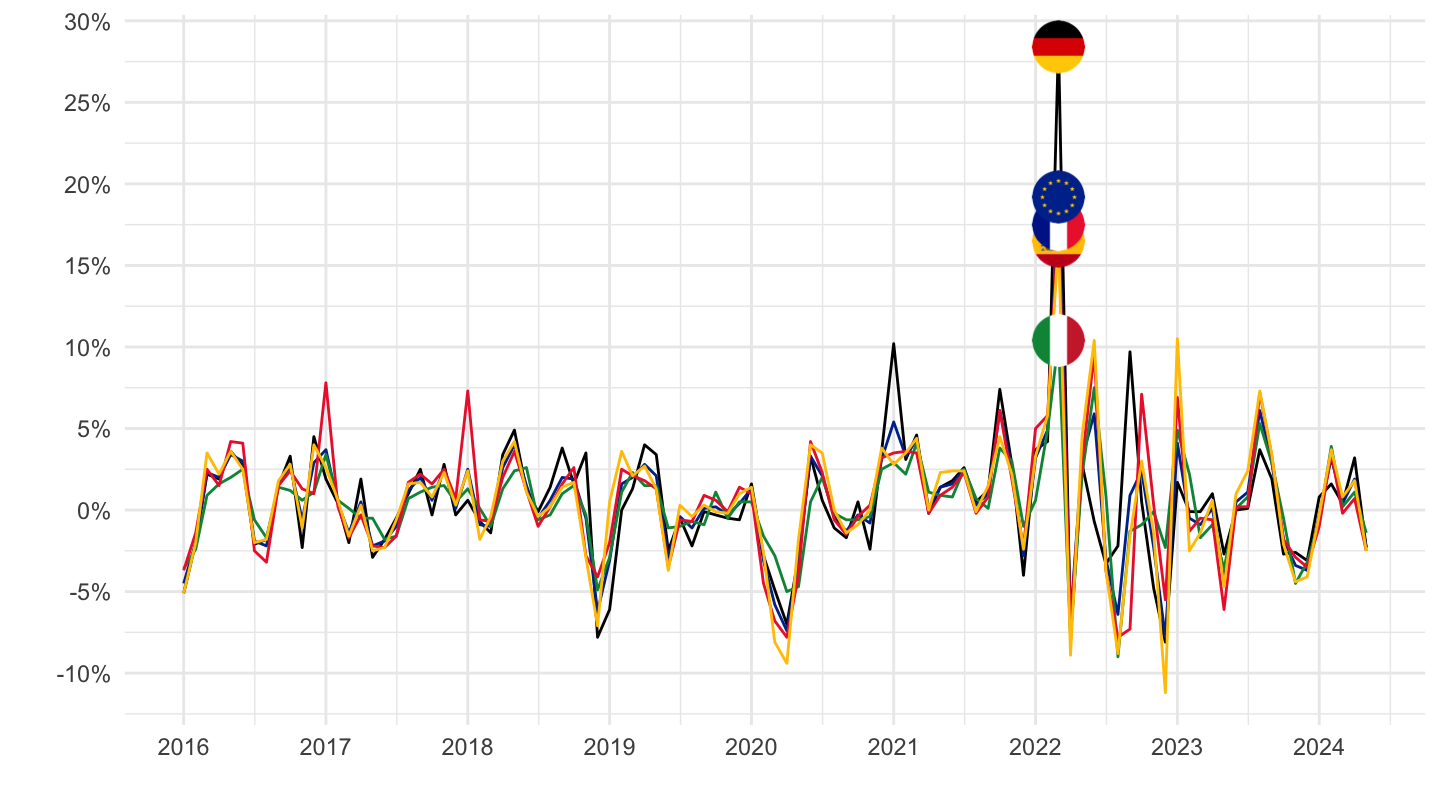
2020-
Code
prc_hicp_mmor %>%
  filter(coicop == "FUEL",
         geo %in% c("FR", "DE", "ES", "IT", "EA19")) %>%
  month_to_date %>%
  filter(date >= as.Date("2020-01-01")) %>%

  mutate(Geo = ifelse(geo == "EA19", "Europe", Geo)) %>%
  left_join(colors, by = c("Geo" = "country")) %>%
  mutate(values = values/100) %>%
  ggplot(.) + geom_line(aes(x = date, y = values, color = color)) +
  theme_minimal() + xlab("") + ylab("") +
  scale_x_date(breaks = seq.Date(as.Date("2019-12-01"), as.Date("2100-01-01"), "3 months"),
               labels = date_format("%b %Y")) +
  scale_y_continuous(breaks = 0.01*seq(-20, 100, 10),
                     labels = percent_format(a = 1)) +
  scale_color_identity() + add_5flags +
  theme(legend.position = c(0.75, 0.90),
        legend.title = element_blank())