HICP (2015 = 100) - monthly data (index)
Data - Eurostat
Info
Last observation: Monthly: 2025M12 (N = 27,318)
First observation: Monthly: 1996M01 (N = 13,026)
Last data update: 23 jul 2026, 22:47. Last compile: 24 jul 2026, 03:31
Structure
Core inflation
Code
prc_hicp_midx %>%
  filter(coicop %in% c("TOT_X_NRG_FOOD", "CP00"),
         geo %in% c("EA20"),
         unit == "I15") %>%
  month_to_date %>%
  ggplot + geom_line(aes(x = date, y = values, color = coicop))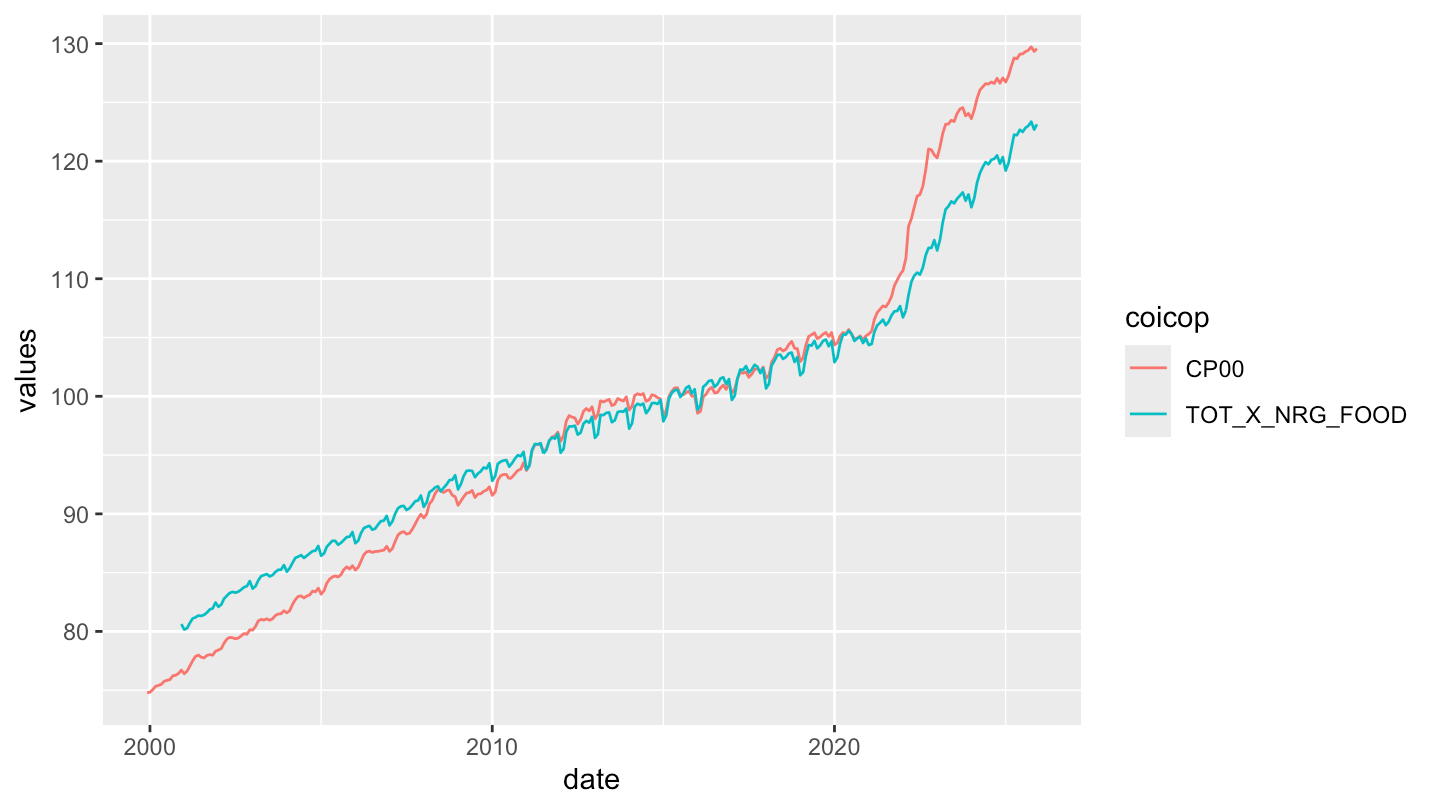
All - Weighted
Headline, Core
All
1 year
Code
prc_hicp_midx %>%
  filter(coicop %in% c("TOT_X_NRG_FOOD", "CP00"),
         geo %in% c("AT", "BE", "CY", "DE", "EE", "EL", "ES", "FI", "FR", "IE",
                    "IT", "LT", "LU", "LV", "MT", "NL", "PT", "SI", "SK", "HR"),
         unit == "I15") %>%
  mutate(year = substr(time, 1, 4)) %>%

  #filter(!(Geo %in% intersect(eurozone_countries, CEEC_countries))) %>%
  left_join(prc_hicp_cow %>%
              filter(statinfo == "COWEA19", geo != "EA19") %>%
              transmute(geo, year = time, country_weights = values, uniform_weights = 1),
            by = c("geo", "year")) %>%
  month_to_date %>%
  group_by(Geo, coicop) %>%
  arrange(date) %>%
  mutate(values = values/lag(values, 12)-1) %>%
  ungroup %>%
  group_by(coicop, Coicop, date) %>%
  summarise(values = sqrt(Hmisc::wtd.var(values, country_weights))) %>%

  filter(date >= as.Date("1997-01-01")) %>%
  ggplot(.) + geom_line(aes(x = date, y = values, color = Coicop, linetype = Coicop)) +
  theme_minimal() + xlab("") + ylab("Standard Deviation of Inflation, Weighted, EA-20 (%)") +
  scale_x_date(breaks = seq(1960, 2100, 2) %>% paste0("-01-01") %>% as.Date,
               labels = date_format("%Y")) +
  scale_color_manual(values = c("#1E1C1C", "#A81630")) +
  scale_y_continuous(breaks = 0.01*seq(-20, 20, .5),
                     labels = percent_format(a = .1)) +
  theme(legend.position = c(0.55, 0.90),
        legend.title = element_blank())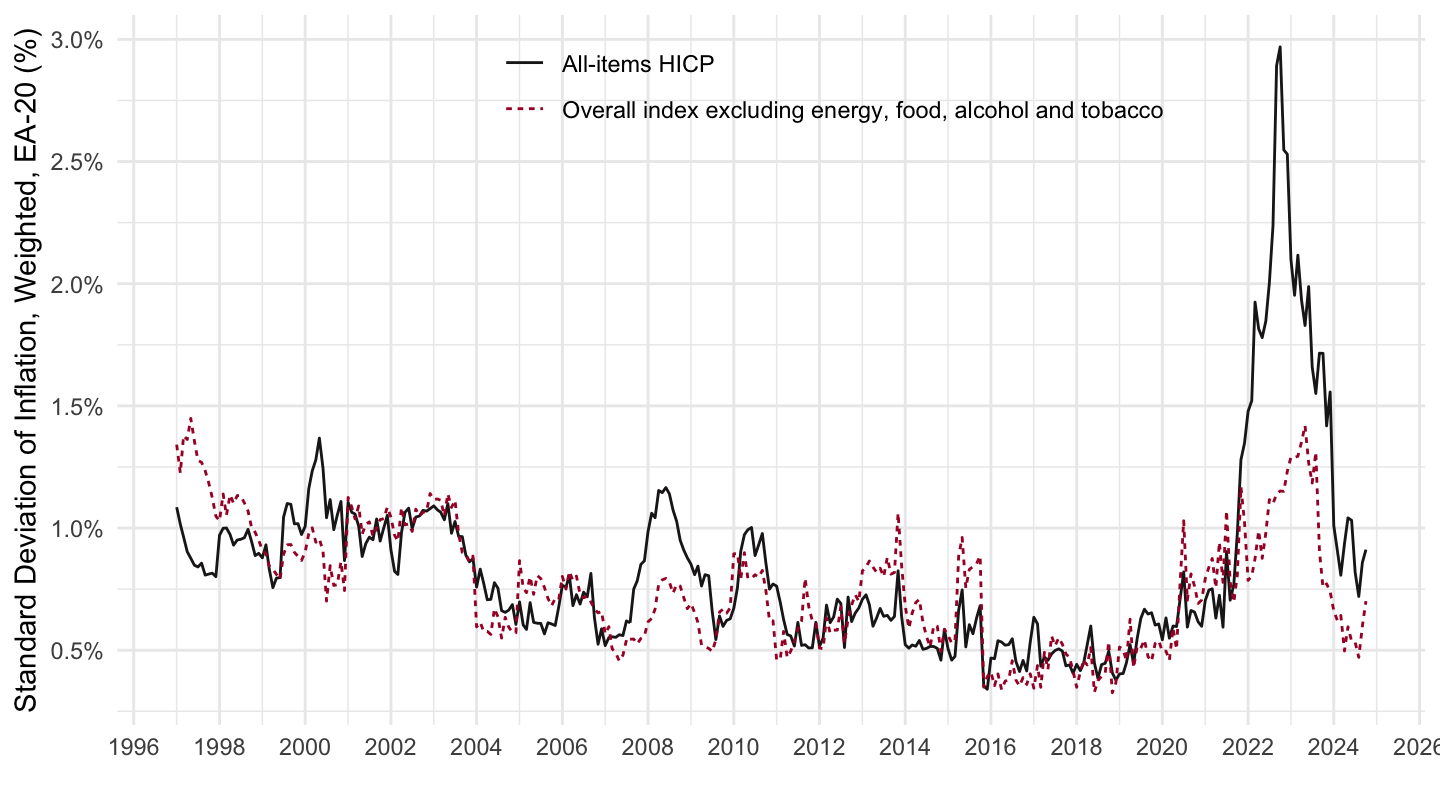
1 and 2 years
Code
prc_hicp_midx %>%
  filter(coicop %in% c("TOT_X_NRG_FOOD", "CP00"),
         geo %in% c("AT", "BE", "CY", "DE", "EE", "EL", "ES", "FI", "FR", "IE",
                    "IT", "LT", "LU", "LV", "MT", "NL", "PT", "SI", "SK", "HR"),
         unit == "I15") %>%
  mutate(year = substr(time, 1, 4)) %>%

  #filter(!(Geo %in% intersect(eurozone_countries, CEEC_countries))) %>%
  left_join(prc_hicp_cow %>%
              filter(statinfo == "COWEA20", geo != "EA20") %>%
              transmute(geo, year = time, country_weights = values, uniform_weights = 1),
            by = c("geo", "year")) %>%
  month_to_date %>%
  group_by(Geo, coicop) %>%
  arrange(date) %>%
  mutate(`2-year inflation` = (values/lag(values, 24))^(1/2)-1,
         `1-year inflation` = values/lag(values, 12)-1) %>%
  ungroup %>%
  gather(variable, values, `2-year inflation`, `1-year inflation`) %>%
  filter(!is.na(values)) %>%
  group_by(coicop, date, variable) %>%
  summarise(values = sqrt(Hmisc::wtd.var(values, country_weights))) %>%
  mutate(Coicop = ifelse(coicop == "CP00", "Headline inflation", "Core inflation")) %>%
  filter(date >= as.Date("2000-01-01")) %>%
  ggplot(.) + geom_line(aes(x = date, y = values, color = Coicop, linetype = Coicop)) +
  theme_minimal() + xlab("") + ylab("Standard Deviation of Annual Inflation\nWeighted, EA-20 (%)") +
  scale_x_date(breaks = seq(1960, 2100, 2) %>% paste0("-01-01") %>% as.Date,
               labels = date_format("%Y")) +
  scale_color_manual(values = c("#1E1C1C", "#A81630")) +
  scale_y_continuous(breaks = 0.01*seq(-20, 20, .5),
                     labels = percent_format(a = .1)) +
  theme(legend.position = "top",
        legend.title = element_blank(),
        axis.text.x = element_text(angle = 45, vjust = 1, hjust = 1)) +
  facet_wrap(~ variable)
1 and 3 years
Code
prc_hicp_midx %>%
  filter(coicop %in% c("TOT_X_NRG_FOOD", "CP00"),
         geo %in% c("AT", "BE", "CY", "DE", "EE", "EL", "ES", "FI", "FR", "IE",
                    "IT", "LT", "LU", "LV", "MT", "NL", "PT", "SI", "SK", "HR"),
         unit == "I15") %>%
  mutate(year = substr(time, 1, 4)) %>%

  #filter(!(Geo %in% intersect(eurozone_countries, CEEC_countries))) %>%
  left_join(prc_hicp_cow %>%
              filter(statinfo == "COWEA20", geo != "EA20") %>%
              transmute(geo, year = time, country_weights = values, uniform_weights = 1),
            by = c("geo", "year")) %>%
  month_to_date %>%
  group_by(Geo, coicop) %>%
  arrange(date) %>%
  mutate(`3-year inflation` = (values/lag(values, 36))^(1/3)-1,
         `1-year inflation` = values/lag(values, 12)-1) %>%
  ungroup %>%
  gather(variable, values, `3-year inflation`, `1-year inflation`) %>%
  filter(!is.na(values)) %>%
  group_by(coicop, date, variable) %>%
  summarise(values = sqrt(Hmisc::wtd.var(values, country_weights))) %>%
  mutate(Coicop = ifelse(coicop == "CP00", "Headline inflation", "Core inflation")) %>%
  filter(date >= as.Date("2000-01-01")) %>%
  ggplot(.) + geom_line(aes(x = date, y = values, color = Coicop, linetype = Coicop)) +
  theme_minimal() + xlab("") + ylab("Standard Deviation of Annual Inflation\nWeighted, EA-20 (%)") +
  scale_x_date(breaks = seq(1960, 2100, 2) %>% paste0("-01-01") %>% as.Date,
               labels = date_format("%Y")) +
  scale_color_manual(values = c("#1E1C1C", "#A81630")) +
  scale_y_continuous(breaks = 0.01*seq(-20, 20, .5),
                     labels = percent_format(a = .1)) +
  theme(legend.position = "top",
        legend.title = element_blank(),
        axis.text.x = element_text(angle = 45, vjust = 1, hjust = 1)) +
  facet_wrap(~ variable)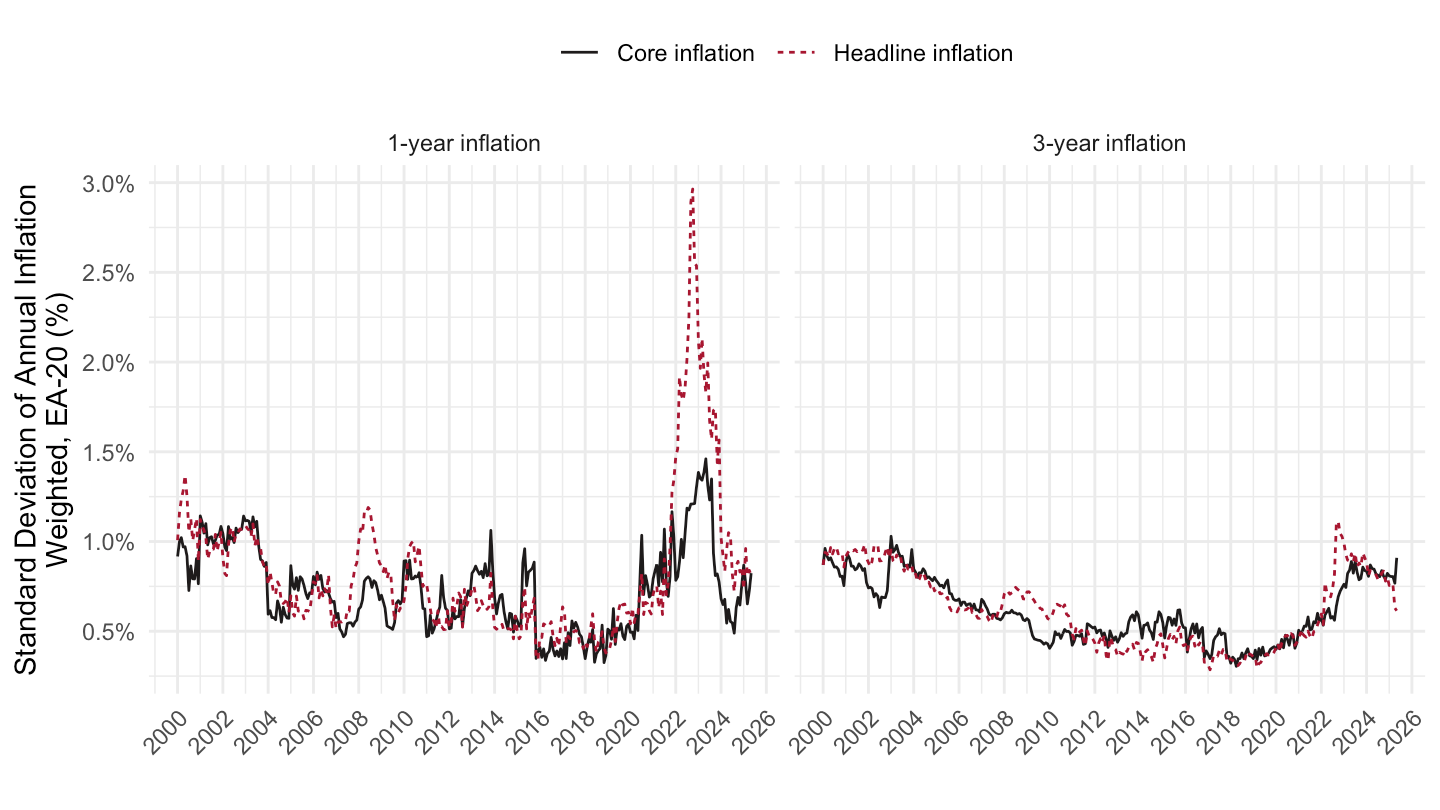
Services inflation 1 and 2 years
Code
prc_hicp_midx %>%
  filter(coicop %in% c("SERV", "GD"),
         geo %in% c("AT", "BE", "CY", "DE", "EE", "EL", "ES", "FI", "FR", "IE",
                    "IT", "LT", "LU", "LV", "MT", "NL", "PT", "SI", "SK", "HR"),
         unit == "I15") %>%
  mutate(year = substr(time, 1, 4)) %>%

  #filter(!(Geo %in% intersect(eurozone_countries, CEEC_countries))) %>%
  left_join(prc_hicp_cow %>%
              filter(statinfo == "COWEA20", geo != "EA20") %>%
              transmute(geo, year = time, country_weights = values, uniform_weights = 1),
            by = c("geo", "year")) %>%
  month_to_date %>%
  group_by(Geo, coicop) %>%
  arrange(date) %>%
  mutate(`2-year inflation` = (values/lag(values, 24))^(1/2)-1,
         `1-year inflation` = values/lag(values, 12)-1) %>%
  ungroup %>%
  gather(variable, values, `2-year inflation`, `1-year inflation`) %>%
  filter(!is.na(values)) %>%
  group_by(coicop, date, variable) %>%
  summarise(values = sqrt(Hmisc::wtd.var(values, country_weights))) %>%
  mutate(Coicop = ifelse(coicop == "SERV", "Services inflation", "Goods inflation")) %>%
  filter(date >= as.Date("2000-01-01")) %>%
  ggplot(.) + geom_line(aes(x = date, y = values, color = Coicop, linetype = Coicop)) +
  theme_minimal() + xlab("") + ylab("Standard Deviation of Annual Inflation\nWeighted, EA-20 (%)") +
  scale_x_date(breaks = seq(1960, 2100, 2) %>% paste0("-01-01") %>% as.Date,
               labels = date_format("%Y")) +
  scale_color_manual(values = c("#1E1C1C", "#A81630")) +
  scale_y_continuous(breaks = 0.01*seq(-20, 20, .5),
                     labels = percent_format(a = .1)) +
  theme(legend.position = "top",
        legend.title = element_blank(),
        axis.text.x = element_text(angle = 45, vjust = 1, hjust = 1)) +
  facet_wrap(~ variable)
2 years
Code
prc_hicp_midx %>%
  filter(coicop %in% c("TOT_X_NRG_FOOD", "CP00"),
         geo %in% c("AT", "BE", "CY", "DE", "EE", "EL", "ES", "FI", "FR", "IE",
                    "IT", "LT", "LU", "LV", "MT", "NL", "PT", "SI", "SK", "HR"),
         unit == "I15") %>%
  mutate(year = substr(time, 1, 4)) %>%

  #filter(!(Geo %in% intersect(eurozone_countries, CEEC_countries))) %>%
  left_join(prc_hicp_cow %>%
              filter(statinfo == "COWEA19", geo != "EA19") %>%
              transmute(geo, year = time, country_weights = values, uniform_weights = 1),
            by = c("geo", "year")) %>%
  month_to_date %>%
  group_by(Geo, coicop) %>%
  arrange(date) %>%
  mutate(values = values/lag(values, 24)-1) %>%
  ungroup %>%
  group_by(coicop, Coicop, date) %>%
  summarise(values = sqrt(Hmisc::wtd.var(values, country_weights))) %>%

  filter(date >= as.Date("1998-01-01")) %>%
  ggplot(.) + geom_line(aes(x = date, y = values, color = Coicop, linetype = Coicop)) +
  theme_minimal() + xlab("") + ylab("Standard Deviation of Inflation, Weighted, EA-20 (%)") +
  scale_x_date(breaks = seq(1960, 2100, 2) %>% paste0("-01-01") %>% as.Date,
               labels = date_format("%Y")) +
  scale_color_manual(values = c("#1E1C1C", "#A81630")) +
  scale_y_continuous(breaks = 0.01*seq(-20, 20, .5),
                     labels = percent_format(a = .1)) +
  theme(legend.position = c(0.55, 0.90),
        legend.title = element_blank())
2017-
1 Year
Code
prc_hicp_midx %>%
  filter(coicop %in% c("TOT_X_NRG_FOOD", "CP00"),
         geo %in% c("AT", "BE", "CY", "DE", "EE", "EL", "ES", "FI", "FR", "IE",
                    "IT", "LT", "LU", "LV", "MT", "NL", "PT", "SI", "SK", "HR"),
         unit == "I15") %>%
  mutate(year = substr(time, 1, 4)) %>%

  #filter(!(Geo %in% intersect(eurozone_countries, CEEC_countries))) %>%
  left_join(prc_hicp_cow %>%
              filter(statinfo == "COWEA19", geo != "EA19") %>%
              transmute(geo, year = time, country_weights = values, uniform_weights = 1),
            by = c("geo", "year")) %>%
  month_to_date %>%
  group_by(Geo, coicop) %>%
  arrange(date) %>%
  mutate(values = values/lag(values, 12)-1) %>%
  ungroup %>%
  group_by(coicop, Coicop, date) %>%
  summarise(values = sqrt(Hmisc::wtd.var(values, country_weights))) %>%

  filter(date >= as.Date("2017-01-01")) %>%
  ggplot(.) + geom_line(aes(x = date, y = values, color = Coicop, linetype = Coicop)) +
  theme_minimal() + xlab("") + ylab("Standard Deviation of Inflation, Weighted, EA-20 (%)") +
  scale_x_date(breaks = seq(1960, 2100, 1) %>% paste0("-01-01") %>% as.Date,
               labels = date_format("%Y")) +
  scale_color_manual(values = c("#1E1C1C", "#A81630")) +
  scale_y_continuous(breaks = 0.01*seq(-20, 20, .5),
                     labels = percent_format(a = .1)) +
  theme(legend.position = c(0.55, 0.90),
        legend.title = element_blank())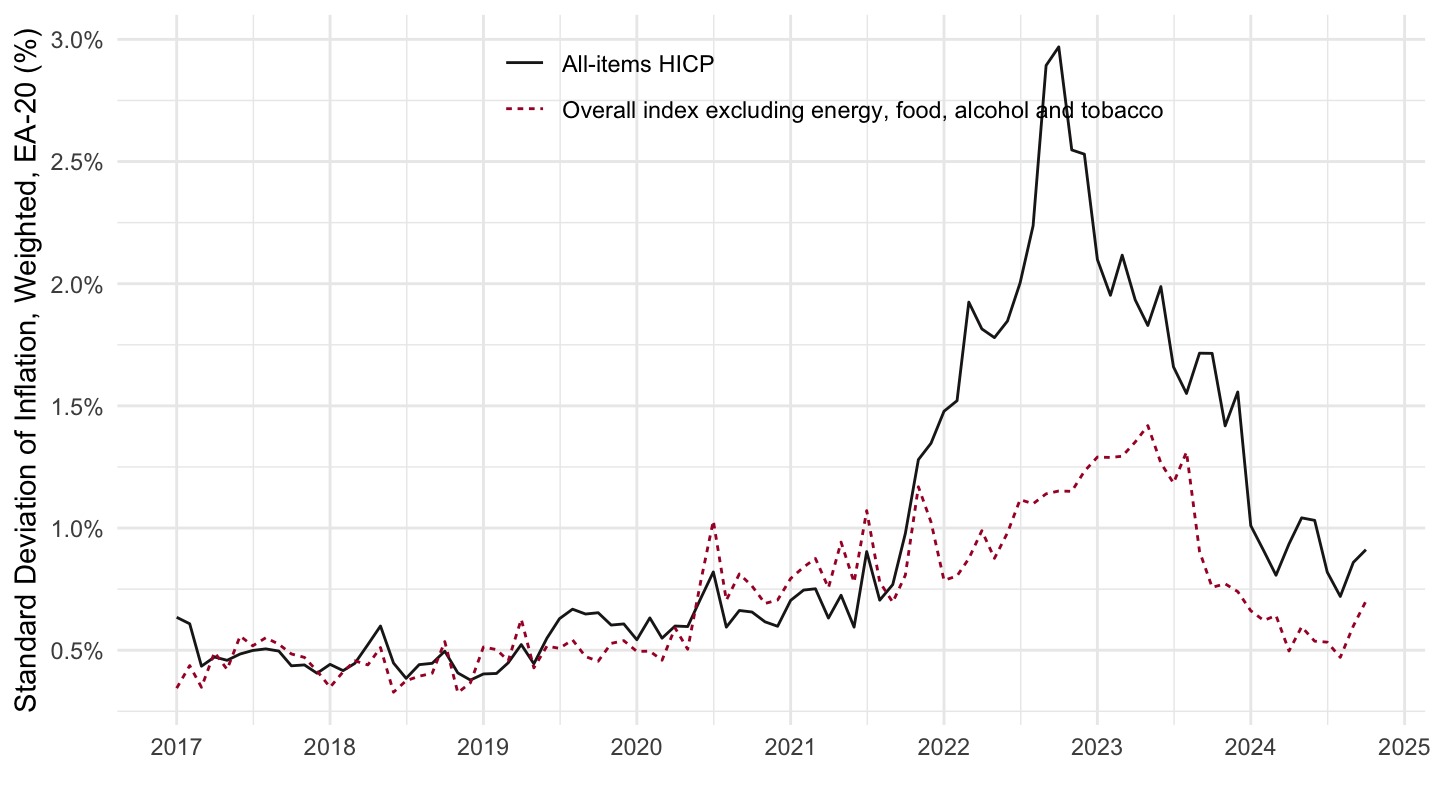
2 Years
Code
prc_hicp_midx %>%
  filter(coicop %in% c("TOT_X_NRG_FOOD", "CP00"),
         geo %in% c("AT", "BE", "CY", "DE", "EE", "EL", "ES", "FI", "FR", "IE",
                    "IT", "LT", "LU", "LV", "MT", "NL", "PT", "SI", "SK", "HR"),
         unit == "I15") %>%
  mutate(year = substr(time, 1, 4)) %>%

  #filter(!(Geo %in% intersect(eurozone_countries, CEEC_countries))) %>%
  left_join(prc_hicp_cow %>%
              filter(statinfo == "COWEA19", geo != "EA19") %>%
              transmute(geo, year = time, country_weights = values, uniform_weights = 1),
            by = c("geo", "year")) %>%
  month_to_date %>%
  group_by(Geo, coicop) %>%
  arrange(date) %>%
  mutate(values = values/lag(values, 24)-1) %>%
  ungroup %>%
  group_by(coicop, Coicop, date) %>%
  summarise(values = sqrt(Hmisc::wtd.var(values, country_weights))) %>%

  filter(date >= as.Date("2017-01-01")) %>%
  ggplot(.) + geom_line(aes(x = date, y = values, color = Coicop, linetype = Coicop)) +
  theme_minimal() + xlab("") + ylab("Standard Deviation of Inflation, Weighted, EA-20 (%)") +
  scale_x_date(breaks = seq(1960, 2100, 1) %>% paste0("-01-01") %>% as.Date,
               labels = date_format("%Y")) +
  scale_color_manual(values = c("#1E1C1C", "#A81630")) +
  scale_y_continuous(breaks = 0.01*seq(-20, 20, .5),
                     labels = percent_format(a = .1)) +
  theme(legend.position = c(0.55, 0.90),
        legend.title = element_blank())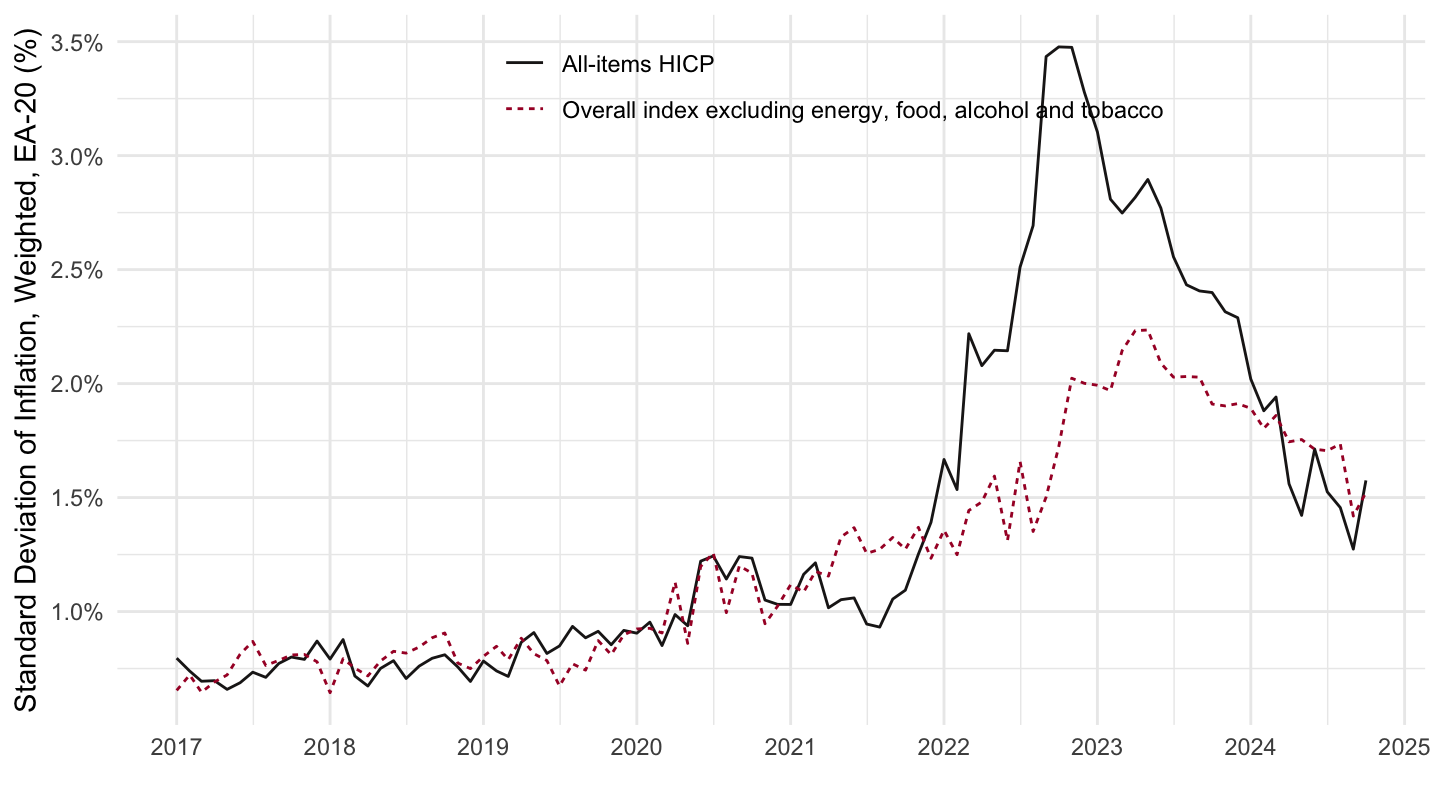
Europe vs. US
All
Code
prc_hicp_midx %>%
  filter(coicop == "CP00",
         geo %in% c("US", "EA"),
         unit == "I15") %>%
  group_by(time, coicop) %>%
  ungroup %>%
  month_to_date %>%
  filter(date >= as.Date("2020-01-01")) %>%
  group_by(coicop, geo) %>%
  arrange(date) %>%
  mutate(values = 100*values/values[1]) %>%
  ungroup %>%
  mutate(Geo = ifelse(geo == "EA", "Euro area HICP", "US Proxy-HICP")) %>%
  ggplot(.) + geom_line(aes(x = date, y = values, color = Geo)) +
  theme_minimal() + xlab("") + ylab("Price Index (100 = January 2020)") +
  scale_x_date(breaks = seq.Date(as.Date("2019-09-01"), as.Date("2100-09-01"), "6 months"),
               labels = date_format("%b %Y")) +
  scale_y_continuous(breaks = seq(100, 200, 10)) +
  scale_color_manual(values = c("#003399", "#B22234")) +
  theme(legend.position = "top",
        legend.title = element_blank(),
        axis.text.x = element_text(angle = 45, vjust = 1, hjust = 1))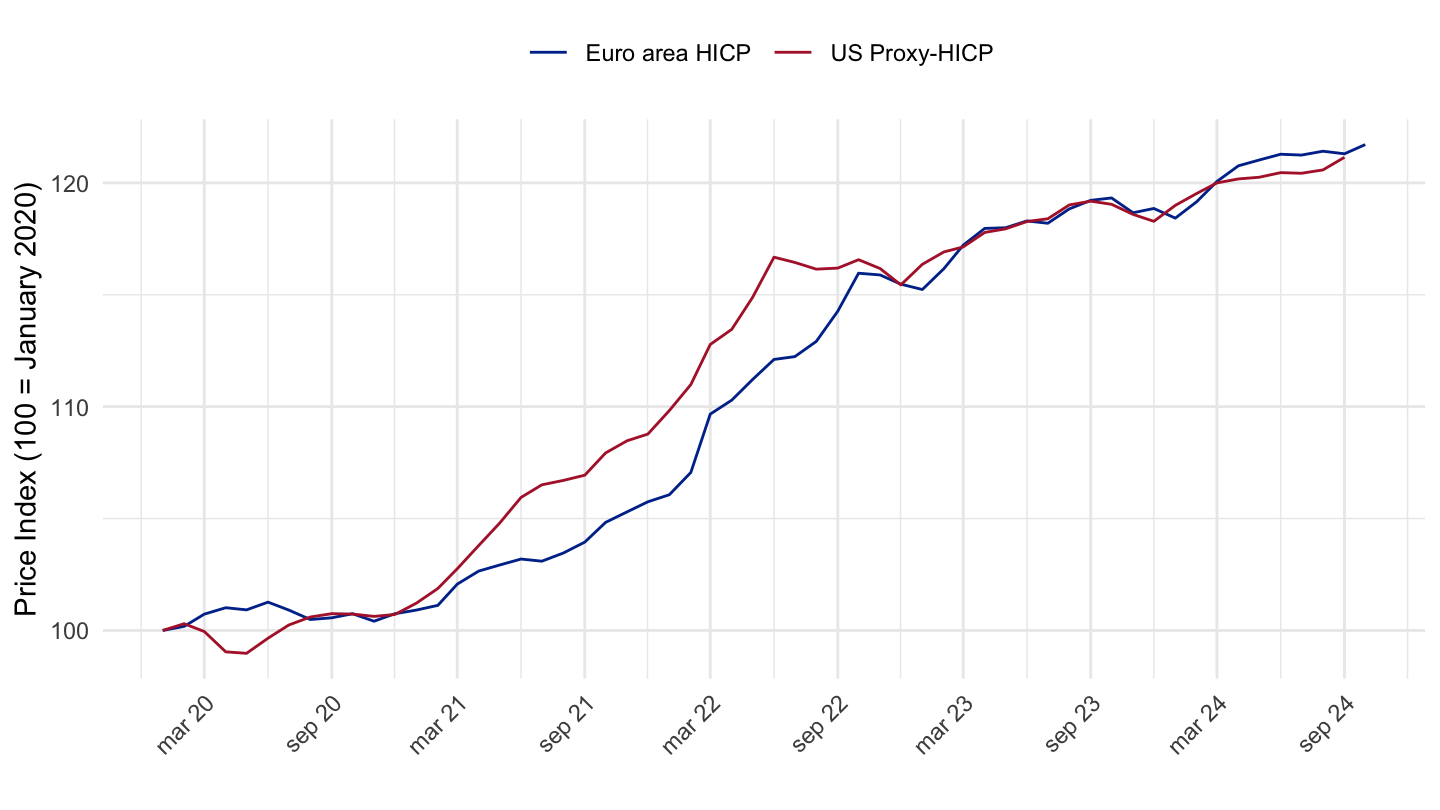
2020-
All
Code
coicop_short <- tribble(
  ~ coicop, ~ Coicop,
  "CP01", "Food",
  "CP02", "Alcohol, Tobacco",
  "CP03", "Clothing",
  "CP04", "Housing, heating",
  "CP05", "Furnishings",
  "CP06", "Health",
  "CP07", "Transport",
  "CP08", "Communications",
  "CP09", "Recreation",
  "CP10", "Education",
  "CP11", "Restaurants, Hotels",
  "CP12", "Miscellaneous G&S")
prc_hicp_midx %>%
  filter(coicop != "CP00",
         geo %in% c("US", "EA20"),
         unit == "I15") %>%
  group_by(time, coicop) %>%
  filter(n() == 2) %>%
  ungroup %>%
  month_to_date %>%
  filter(date >= as.Date("2020-01-01")) %>%
  group_by(coicop, geo) %>%
  arrange(date) %>%
  mutate(values = 100*values/values[1]) %>%
  ungroup %>%
  select(-Coicop) %>%
  mutate(Geo = ifelse(geo == "EA20", "Euro area HICP", "US Proxy-HICP")) %>%
  left_join(coicop_short, by = "coicop") %>%
  ggplot(.) + geom_line(aes(x = date, y = values, color = Geo)) +
  theme_minimal() + xlab("") + ylab("Price Index (100 = January 2020)") +
  scale_x_date(breaks = seq.Date(as.Date("2019-09-01"), as.Date("2100-09-01"), "6 months"),
               labels = date_format("%b %Y")) +
  scale_y_continuous(breaks = seq(100, 200, 10)) +
  scale_color_manual(values = c("#003399", "#B22234")) +
  theme(legend.position = "top",
        legend.title = element_blank(),
        axis.text.x = element_text(angle = 45, vjust = 1, hjust = 1)) +
  geom_vline(xintercept = as.Date("2023-09-01"), linetype = "dotted") +
  facet_wrap(~paste(coicop, Coicop, sep = " - ")) +
  geom_text_repel(data = . %>% filter(date %in% c(as.Date("2023-09-01"))),
                  aes(x = date, y = values, label = round(values, 1), color = Geo),
                  fontface ="plain", size = 3)
Inflation
Biggest inflation - Individual Countries
Code
prc_hicp_midx %>%
  filter(time %in% c("2021M12", "2022M03"),
         unit == "I15") %>%
  spread(time, values) %>%


  transmute(Geo, geo, coicop, Coicop, inflation_g_c = 100*(`2022M03`/`2021M12`-1)) %>%
  arrange(-inflation_g_c) %>%
  group_by(coicop, Coicop) %>%
  summarise(Geo = Geo[1],
            inflation_g_c = inflation_g_c[1]) %>%
  arrange(-inflation_g_c) %>%
  print_table_conditional()
Biggest inflation - EU
Code
prc_hicp_midx %>%
  filter(time %in% c("2021M12", "2022M03"),
         unit == "I15",
         geo == "EA19") %>%
  spread(time, values) %>%

  transmute(coicop, Coicop, inflation_c = round(100*(`2022M03`/`2021M12`-1), 2)) %>%
  arrange(-inflation_c) %>%
  print_table_conditional()
Quality adjustments ?
CP022 - Tobacco
Nominal
Code
prc_hicp_midx %>%
  filter(unit == "I15",
         coicop %in% c("CP022"),
         time %in% c("1996M01", "2000M01", "2010M01", "2022M12")) %>%

  select(geo, Geo, coicop, time, values) %>%
  spread(time, values) %>%
  mutate(`1996-2021` = round(100*((`2022M12` / `1996M01`)^(1/(2022-1996))-1), 2)) %>%
  arrange(-`1996-2021`) %>%
  mutate(Flag = gsub(" ", "-", str_to_lower(gsub(" ", "-", Geo))),
         Flag = paste0('<img src="../../icon/flag/vsmall/', Flag, '.png" alt="Flag">')) %>%
  select(Flag, everything()) %>%
  {if (is_html_output()) datatable(., filter = 'top', rownames = F, escape = F) else .}
Real
Code
prc_hicp_midx %>%
  filter(unit == "I15",
         coicop %in% c("CP022", "CP00"),
         time %in% c("1996M01", last_time_full)) %>%
  spread(coicop, values) %>%
  mutate(values = CP022/CP00) %>%
  group_by(geo, Geo) %>%
  summarise(`Growth_CP022_CP00` = values[2]/values[1]) %>%

  mutate(Flag = gsub(" ", "-", str_to_lower(gsub(" ", "-", Geo))),
         Flag = paste0('<img src="../../icon/flag/vsmall/', Flag, '.png" alt="Flag">')) %>%
  select(Flag, everything()) %>%
  arrange(-Growth_CP022_CP00) %>%
  {if (is_html_output()) datatable(., filter = 'top', rownames = F, escape = F) else .}
08.2 - Telephone and telefax equipment
Code
prc_hicp_midx %>%
  filter(unit == "I15",
         coicop %in% c("CP0820"),
         time %in% c("1996M01", "2000M01", "2010M01", "2021M01")) %>%

  select(geo, Geo, coicop, time, values) %>%
  spread(time, values) %>%
  mutate(`1996-2021` = round(100*((`2021M01` / `1996M01`)^(1/(2021-1996))-1), 2)) %>%
  arrange(`1996-2021`) %>%
  mutate(Flag = gsub(" ", "-", str_to_lower(gsub(" ", "-", Geo))),
         Flag = paste0('<img src="../../icon/flag/vsmall/', Flag, '.png" alt="Flag">')) %>%
  select(Flag, everything()) %>%
  {if (is_html_output()) datatable(., filter = 'top', rownames = F, escape = F) else .}
09.1.3 - Information processing equipment
Code
prc_hicp_midx %>%
  filter(unit == "I15",
         coicop %in% c("CP0913"),
         time %in% c("1996M01", "2000M01", "2010M01", "2021M01")) %>%

  select(geo, Geo, coicop, time, values) %>%
  spread(time, values) %>%
  mutate(`1996-2021` = round(100*((`2021M01` / `1996M01`)^(1/(2021-1996))-1), 2)) %>%
  arrange(`1996-2021`) %>%
  mutate(Flag = gsub(" ", "-", str_to_lower(gsub(" ", "-", Geo))),
         Flag = paste0('<img src="../../icon/flag/vsmall/', Flag, '.png" alt="Flag">')) %>%
  select(Flag, everything()) %>%
  {if (is_html_output()) datatable(., filter = 'top', rownames = F, escape = F) else .}
CP126 - Financial Services
Code
prc_hicp_midx %>%
  filter(unit == "I15",
         coicop %in% c("CP126"),
         time %in% c("1996M01", "2000M01", "2010M01", "2021M01")) %>%

  select(geo, Geo, coicop, time, values) %>%
  spread(time, values) %>%
  mutate(`1996-2021` = round(100*((`2021M01` / `1996M01`)^(1/(2021-1996))-1), 2)) %>%
  arrange(`1996-2021`) %>%
  mutate(Flag = gsub(" ", "-", str_to_lower(gsub(" ", "-", Geo))),
         Flag = paste0('<img src="../../icon/flag/vsmall/', Flag, '.png" alt="Flag">')) %>%
  select(Flag, everything()) %>%
  {if (is_html_output()) datatable(., filter = 'top', rownames = F, escape = F) else .}
CP053 - Household Appliances
Code
prc_hicp_midx %>%
  filter(unit == "I15",
         coicop %in% c("CP053"),
         time %in% c("1996M01", "2000M01", "2010M01", "2021M01")) %>%

  select(geo, Geo, coicop, time, values) %>%
  spread(time, values) %>%
  mutate(`1996-2021` = round(100*((`2021M01` / `1996M01`)^(1/(2021-1996))-1), 2)) %>%
  arrange(`1996-2021`) %>%
  mutate(Flag = gsub(" ", "-", str_to_lower(gsub(" ", "-", Geo))),
         Flag = paste0('<img src="../../icon/flag/vsmall/', Flag, '.png" alt="Flag">')) %>%
  select(Flag, everything()) %>%
  {if (is_html_output()) datatable(., filter = 'top', rownames = F, escape = F) else .}
CP082_083 - Telephone and telefax equipment and services
Code
prc_hicp_midx %>%
  filter(unit == "I15",
         coicop %in% c("CP082_083"),
         time %in% c("1996M01", "2000M01", "2010M01", "2021M01")) %>%

  select(geo, Geo, coicop, time, values) %>%
  spread(time, values) %>%
  mutate(`1996-2021` = round(100*((`2021M01` / `1996M01`)^(1/(2021-1996))-1), 2)) %>%
  arrange(`1996-2021`) %>%
  mutate(Flag = gsub(" ", "-", str_to_lower(gsub(" ", "-", Geo))),
         Flag = paste0('<img src="../../icon/flag/vsmall/', Flag, '.png" alt="Flag">')) %>%
  select(Flag, everything()) %>%
  {if (is_html_output()) datatable(., filter = 'top', rownames = F, escape = F) else .}
CP091 - Audio-visual, photographic and information processing equipment
Poids: 09.1
Code
prc_hicp_midx %>%
  filter(unit == "I15",
         coicop %in% c("CP091"),
         time %in% c("1996M01", "2000M01", "2010M01", "2021M01")) %>%

  select(geo, Geo, coicop, time, values) %>%
  spread(time, values) %>%
  mutate(`1996-2021` = round(100*((`2021M01` / `1996M01`)^(1/(2021-1996))-1), 2)) %>%
  arrange(`1996-2021`) %>%
  mutate(Flag = gsub(" ", "-", str_to_lower(gsub(" ", "-", Geo))),
         Flag = paste0('<img src="../../icon/flag/vsmall/', Flag, '.png" alt="Flag">')) %>%
  select(Flag, everything()) %>%
  {if (is_html_output()) datatable(., filter = 'top', rownames = F, escape = F) else .}
CP09131 - Personal computers
Code
prc_hicp_midx %>%
  filter(unit == "I15",
         coicop %in% c("CP09131"),
         time %in% c("1996M01", "2000M01", "2010M01", "2021M01")) %>%

  select(geo, Geo, coicop, time, values) %>%
  spread(time, values) %>%
  mutate(`1996-2021` = round(100*((`2021M01` / `1996M01`)^(1/(2021-1996))-1), 2)) %>%
  arrange(`1996-2021`) %>%
  mutate(Flag = gsub(" ", "-", str_to_lower(gsub(" ", "-", Geo))),
         Flag = paste0('<img src="../../icon/flag/vsmall/', Flag, '.png" alt="Flag">')) %>%
  select(Flag, everything()) %>%
  {if (is_html_output()) datatable(., filter = 'top', rownames = F, escape = F) else .}
CP08 - Communication
Code
prc_hicp_midx %>%
  filter(unit == "I15",
         coicop %in% c("CP08"),
         time %in% c("1996M01", "2000M01", "2010M01", "2021M01")) %>%

  select(geo, Geo, coicop, time, values) %>%
  spread(time, values) %>%
  mutate(`1996-2021` = round(100*((`2021M01` / `1996M01`)^(1/(2021-1996))-1), 2)) %>%
  arrange(`1996-2021`) %>%
  mutate(Flag = gsub(" ", "-", str_to_lower(gsub(" ", "-", Geo))),
         Flag = paste0('<img src="../../icon/flag/vsmall/', Flag, '.png" alt="Flag">')) %>%
  select(Flag, everything()) %>%
  {if (is_html_output()) datatable(., filter = 'top', rownames = F, escape = F) else .}
France, Italy, Germany, Europe, Spain
CP11 - Restaurants
2017-
Code
prc_hicp_midx %>%
  filter(unit == "I15",
         coicop %in% c("CP11"),
         geo %in% c("DE", "FR", "IT", "EA20", "ES")) %>%
  select(geo, Geo, coicop, time, values) %>%
  month_to_date %>%
  filter(date >= as.Date("2017-01-01")) %>%
  arrange(date) %>%
  group_by(Geo) %>%
  mutate(values = 100*values/values[date == as.Date("2017-01-01")]) %>%
  add_colors %>%
  ggplot(.) + geom_line(aes(x = date, y = values, color = color)) +
  theme_minimal() + xlab("") + ylab("CP11 - Restaurants") +
  scale_x_date(breaks = seq(1960, 2100, 1) %>% paste0("-01-01") %>% as.Date,
               labels = date_format("%Y")) +
  scale_y_log10(breaks = seq(0, 200, 5)) +
  scale_color_identity() + add_flags +
  theme(legend.position = "none")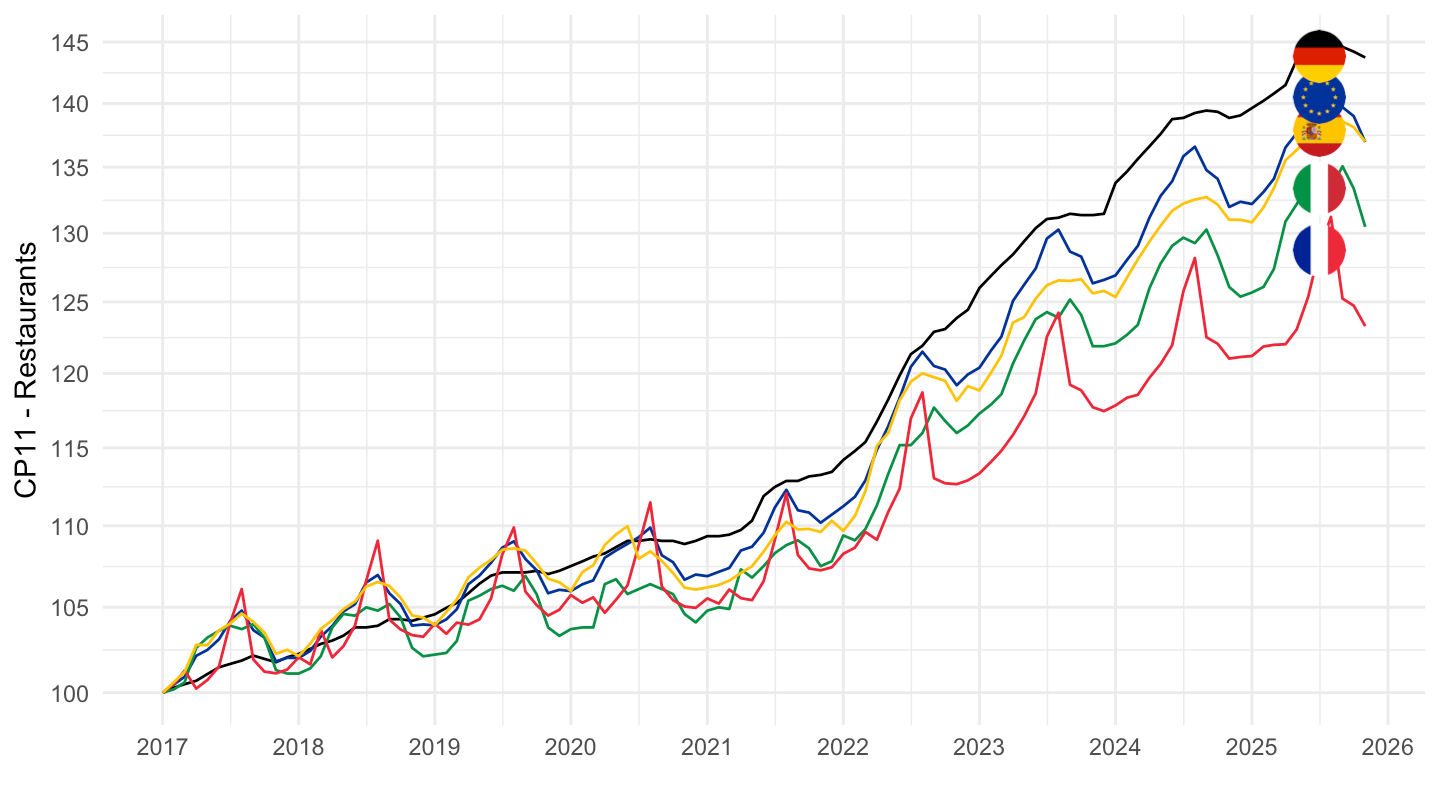
CP111 - Services de restauration et de débits de boissons
2017-
Code
prc_hicp_midx %>%
  filter(unit == "I15",
         coicop %in% c("CP111"),
         geo %in% c("DE", "FR", "IT", "EA20", "ES")) %>%


  select(geo, Geo, coicop, time, values) %>%
  month_to_date %>%
  filter(date >= as.Date("2017-01-01")) %>%
  arrange(date) %>%
  group_by(Geo) %>%
  mutate(values = 100*values/values[date == as.Date("2017-01-01")]) %>%
  add_colors %>%
  ggplot(.) + geom_line(aes(x = date, y = values, color = color)) +
  theme_minimal() + xlab("") + ylab("CP111 - Restaurants") +
  scale_x_date(breaks = seq(1960, 2100, 1) %>% paste0("-01-01") %>% as.Date,
               labels = date_format("%Y")) +
  scale_y_log10(breaks = seq(0, 200, 5)) +
  scale_color_identity() + add_flags +
  theme(legend.position = "none")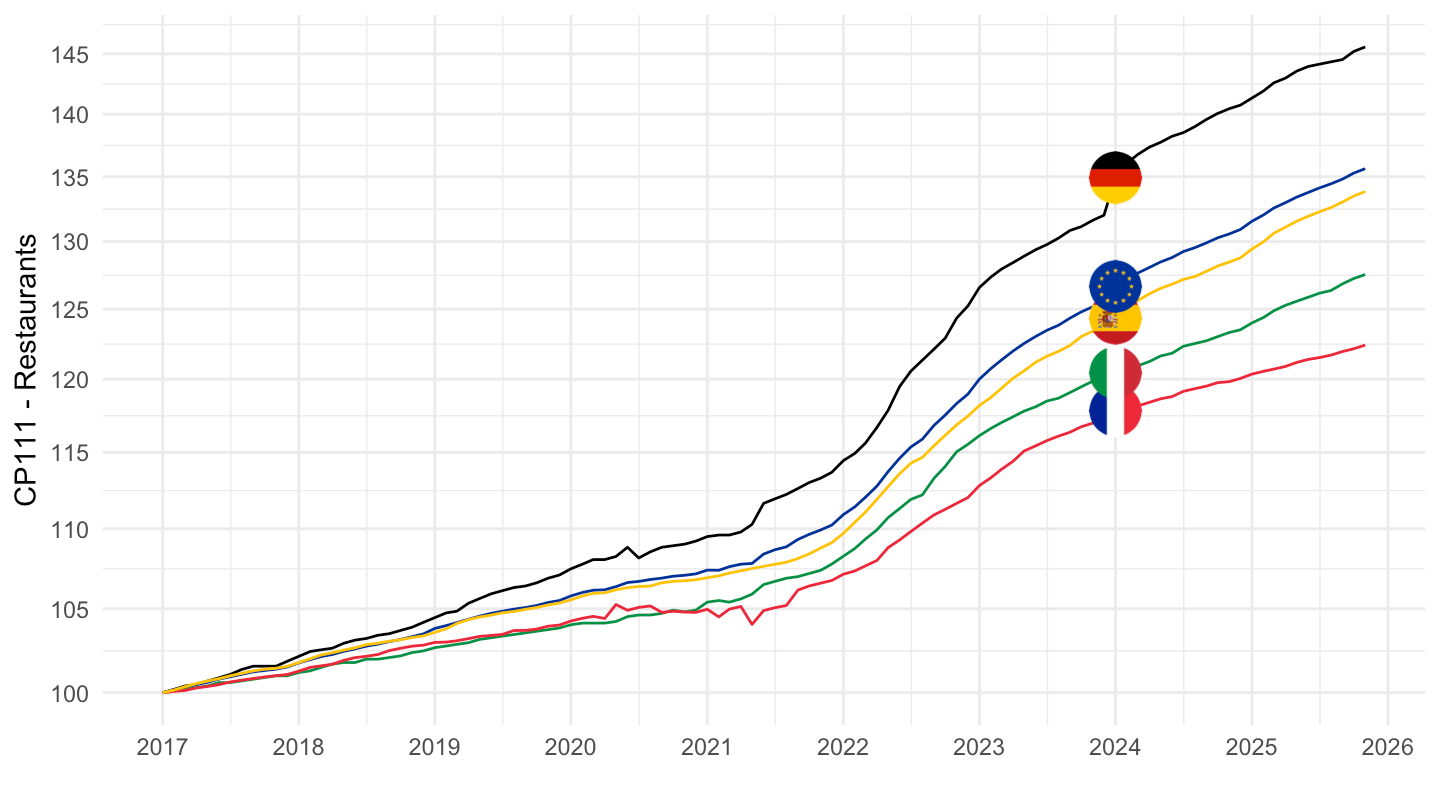
CP1111 - Restaurants, cafés et similaires (S)
2017-
Code
prc_hicp_midx %>%
  filter(unit == "I15",
         coicop %in% c("CP1111"),
         geo %in% c("DE", "FR", "IT", "EA20", "ES")) %>%


  select(geo, Geo, coicop, time, values) %>%
  month_to_date %>%
  filter(date >= as.Date("2017-01-01")) %>%
  arrange(date) %>%
  group_by(Geo) %>%
  mutate(values = 100*values/values[date == as.Date("2017-01-01")]) %>%
  add_colors %>%
  ggplot(.) + geom_line(aes(x = date, y = values, color = color)) +
  theme_minimal() + xlab("") + ylab("CP11 - Restaurants") +
  scale_x_date(breaks = seq(1960, 2100, 1) %>% paste0("-01-01") %>% as.Date,
               labels = date_format("%Y")) +
  scale_y_log10(breaks = seq(0, 200, 5)) +
  scale_color_identity() + add_flags +
  theme(legend.position = "none")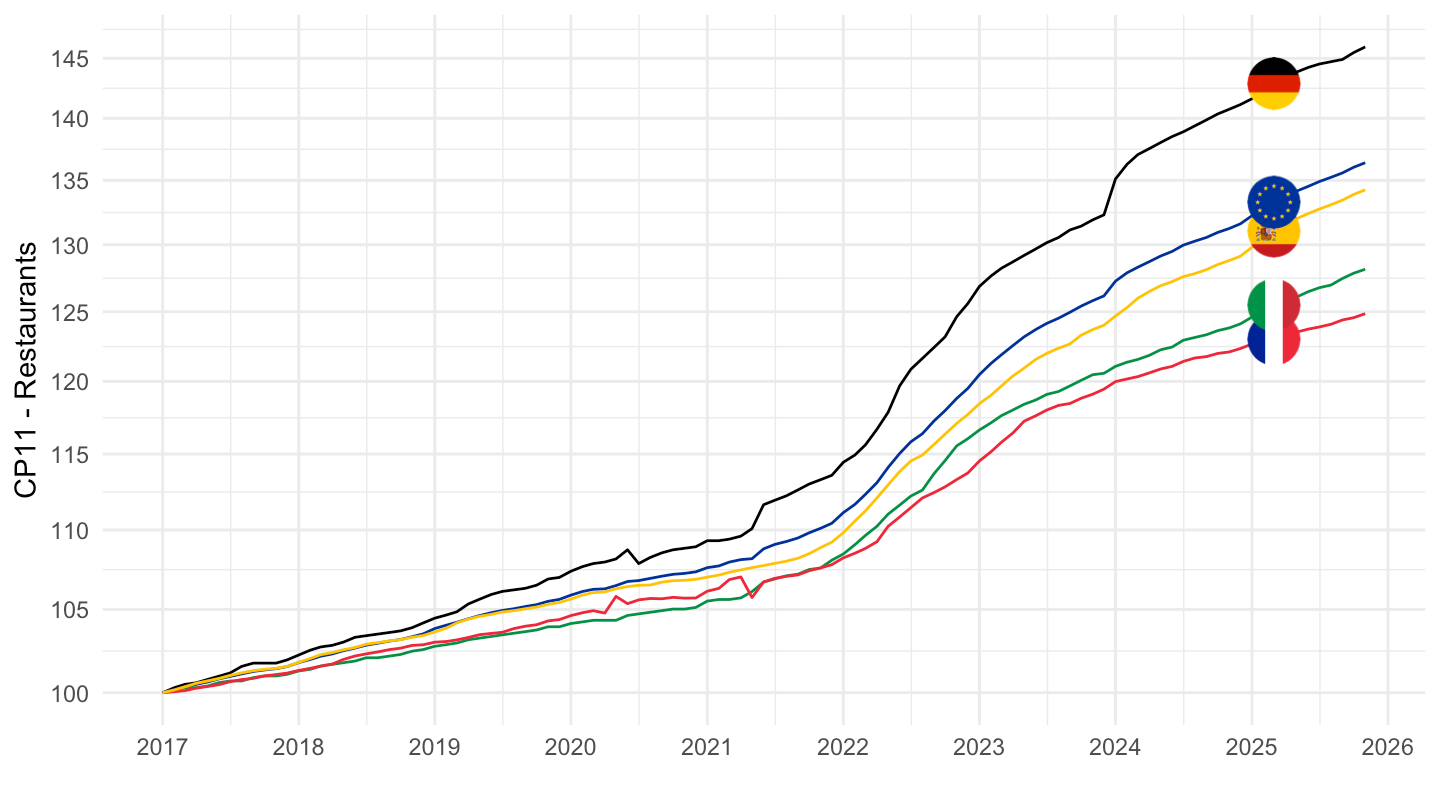
France, Italy, Germany, Netherlands, Spain
CP0711 - Purchase of Motor cars
1996-
Code
prc_hicp_midx %>%
  filter(unit == "I15",
         coicop %in% c("CP0711"),
         geo %in% c("DE", "FR", "IT", "NL", "ES")) %>%

  select(geo, Geo, coicop, time, values) %>%
  month_to_date %>%
  filter(date >= as.Date("1996-01-01")) %>%
  arrange(date) %>%
  group_by(Geo) %>%
  mutate(values = 100*values/values[date == as.Date("1996-01-01")]) %>%
  add_colors %>%
  ggplot(.) + geom_line(aes(x = date, y = values, color = color)) +
  theme_minimal() + xlab("") + ylab("CP0711 - Purchase of motor cars") +
  scale_x_date(breaks = seq(1960, 2100, 2) %>% paste0("-01-01") %>% as.Date,
               labels = date_format("%Y")) +
  scale_y_log10(breaks = seq(0, 500, 5)) +
  scale_color_identity() + add_flags +
  theme(legend.position = "none")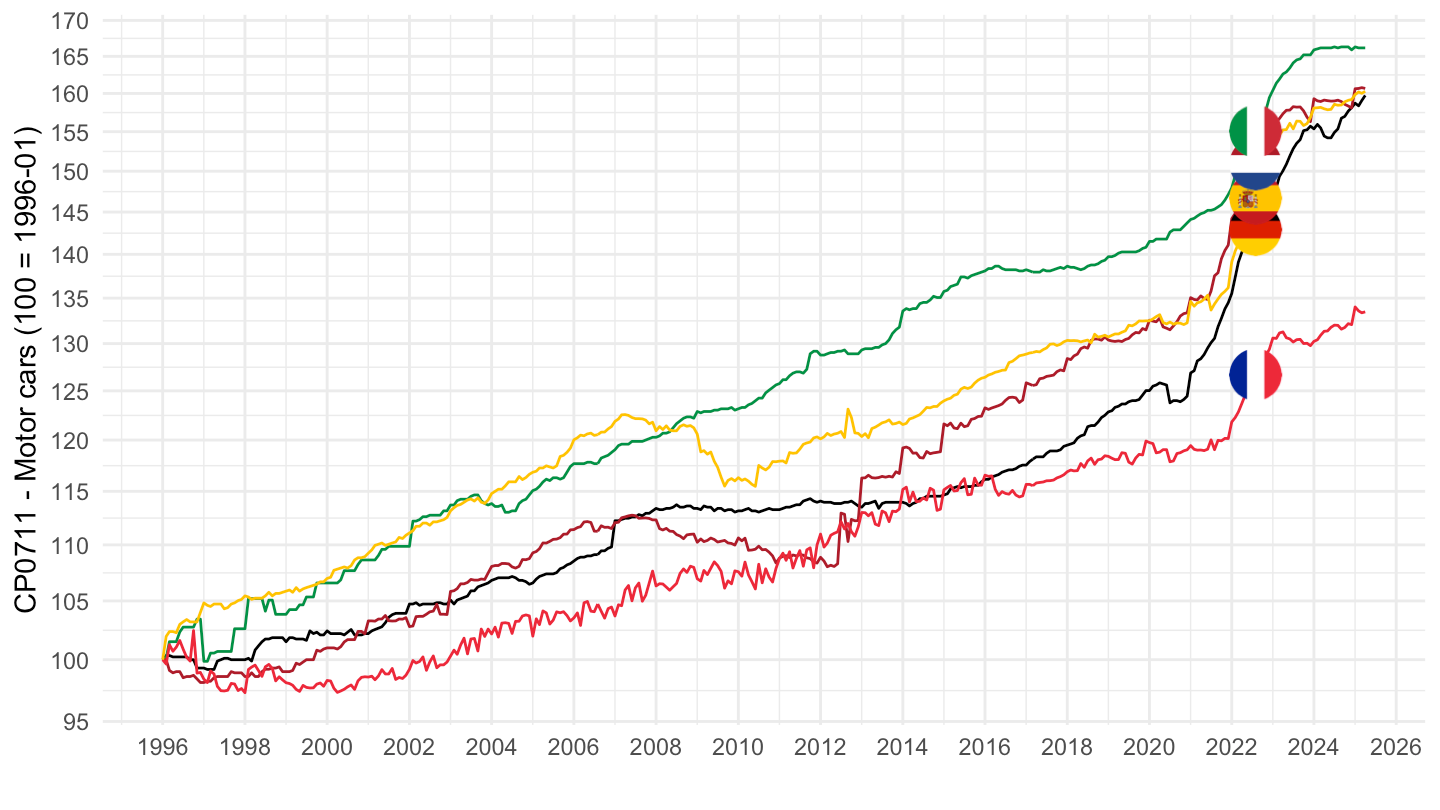
2015-
Code
prc_hicp_midx %>%
  filter(unit == "I15",
         coicop %in% c("CP0711"),
         geo %in% c("DE", "FR", "IT", "NL", "ES")) %>%

  select(geo, Geo, coicop, time, values) %>%
  month_to_date %>%
  filter(date >= as.Date("2016-01-01")) %>%
  arrange(date) %>%
  group_by(Geo) %>%
  mutate(values = 100*values/values[date == as.Date("2016-01-01")]) %>%
  add_colors %>%
  ggplot(.) + geom_line(aes(x = date, y = values, color = color)) +
  theme_minimal() + xlab("") + ylab("") +
  scale_x_date(breaks = seq(1960, 2100, 1) %>% paste0("-01-01") %>% as.Date,
               labels = date_format("%Y")) +
  scale_y_log10(breaks = seq(0, 200, 5)) +
  scale_color_identity() + add_flags +
  theme(legend.position = "none")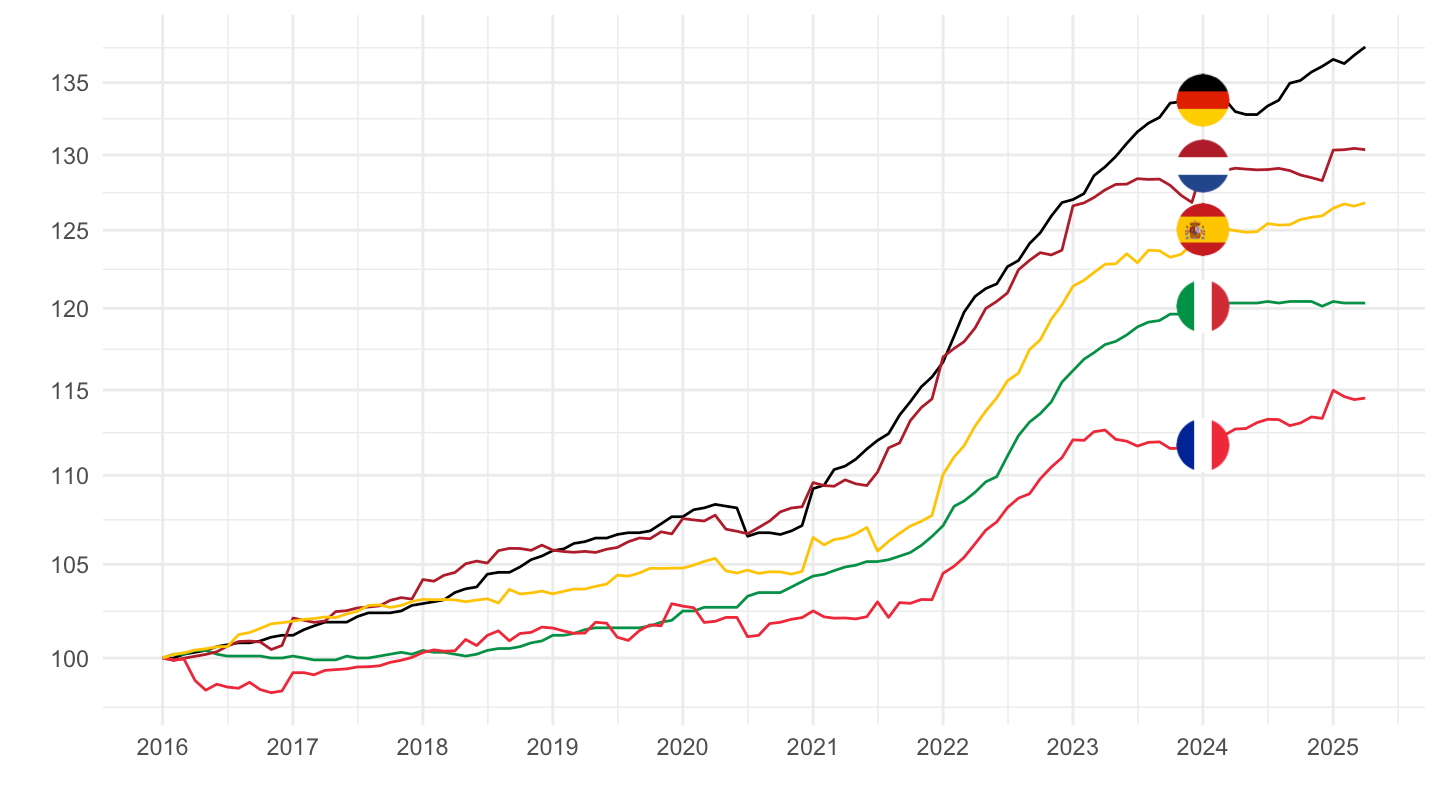
2017-
Code
prc_hicp_midx %>%
  filter(unit == "I15",
         coicop %in% c("CP0711"),
         geo %in% c("DE", "FR", "IT", "EA20", "ES")) %>%

  select(geo, Geo, coicop, time, values) %>%
  month_to_date %>%
  filter(date >= as.Date("2017-01-01")) %>%
  arrange(date) %>%
  group_by(Geo) %>%
  mutate(values = 100*values/values[date == as.Date("2017-01-01")]) %>%
  add_colors %>%
  ggplot(.) + geom_line(aes(x = date, y = values, color = color)) +
  theme_minimal() + xlab("") + ylab("CP0711 - Motor cars") +
  scale_x_date(breaks = seq(1960, 2100, 1) %>% paste0("-01-01") %>% as.Date,
               labels = date_format("%Y")) +
  scale_y_log10(breaks = seq(0, 500, 5)) +
  scale_color_identity() + add_flags +
  theme(legend.position = "none")
2020-
Code
prc_hicp_midx %>%
  filter(unit == "I15",
         coicop %in% c("CP0711"),
         geo %in% c("DE", "FR", "IT", "NL", "ES")) %>%

  select(geo, Geo, coicop, time, values) %>%
  month_to_date %>%
  filter(date >= as.Date("2020-01-01")) %>%
  arrange(date) %>%
  group_by(Geo) %>%
  mutate(values = 100*values/values[date == as.Date("2020-01-01")]) %>%
  add_colors %>%
  ggplot(.) + geom_line(aes(x = date, y = values, color = color)) +
  theme_minimal() + xlab("") + ylab("") +
  scale_x_date(breaks = seq(1960, 2100, 1) %>% paste0("-01-01") %>% as.Date,
               labels = date_format("%Y")) +
  scale_y_log10(breaks = seq(0, 500, 2)) +
  scale_color_identity() + add_flags +
  theme(legend.position = "none")
CP071 - Purchase of vehicles
1996-
Code
prc_hicp_midx %>%
  filter(unit == "I15",
         coicop %in% c("CP071"),
         geo %in% c("DE", "FR", "IT", "NL", "ES")) %>%

  select(geo, Geo, coicop, time, values) %>%
  month_to_date %>%
  filter(date >= as.Date("1996-01-01")) %>%
  arrange(date) %>%
  group_by(Geo) %>%
  mutate(values = 100*values/values[date == as.Date("1996-01-01")]) %>%
  add_colors %>%
  ggplot(.) + geom_line(aes(x = date, y = values, color = color)) +
  theme_minimal() + xlab("") + ylab("CP071 - Purchase of vehicles") +
  scale_x_date(breaks = seq(1960, 2100, 2) %>% paste0("-01-01") %>% as.Date,
               labels = date_format("%Y")) +
  scale_y_log10(breaks = seq(0, 500, 5)) +
  scale_color_identity() + add_flags +
  theme(legend.position = "none")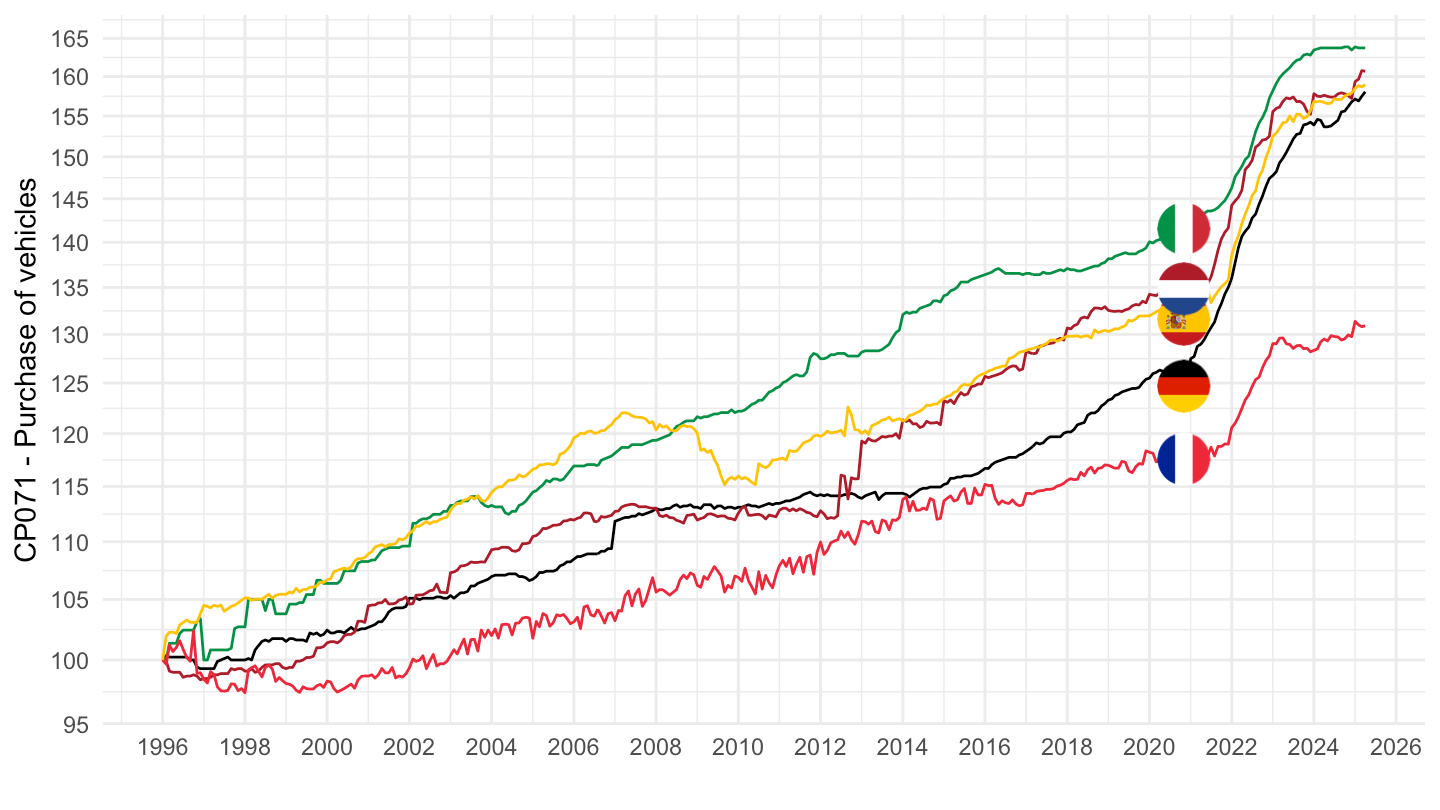
2015-
Code
prc_hicp_midx %>%
  filter(unit == "I15",
         coicop %in% c("CP071"),
         geo %in% c("DE", "FR", "IT", "NL", "ES")) %>%

  select(geo, Geo, coicop, time, values) %>%
  month_to_date %>%
  filter(date >= as.Date("2016-01-01")) %>%
  arrange(date) %>%
  group_by(Geo) %>%
  mutate(values = 100*values/values[date == as.Date("2016-01-01")]) %>%
  add_colors %>%
  ggplot(.) + geom_line(aes(x = date, y = values, color = color)) +
  theme_minimal() + xlab("") + ylab("") +
  scale_x_date(breaks = seq(1960, 2100, 1) %>% paste0("-01-01") %>% as.Date,
               labels = date_format("%Y")) +
  scale_y_log10(breaks = seq(0, 200, 5)) +
  scale_color_identity() + add_flags +
  theme(legend.position = "none")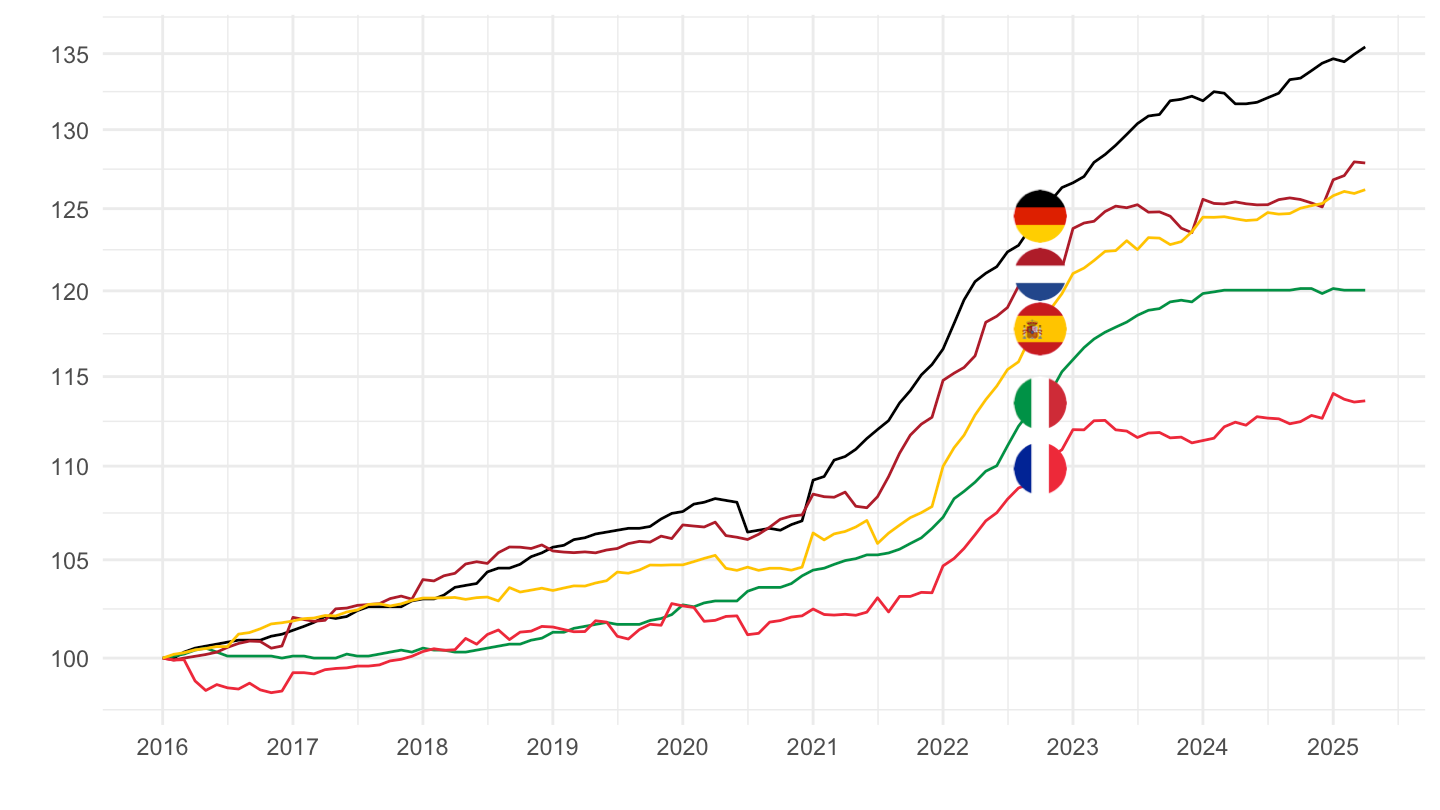
2017-
Code
prc_hicp_midx %>%
  filter(unit == "I15",
         coicop %in% c("CP071"),
         geo %in% c("DE", "FR", "IT", "EA20", "ES")) %>%


  select(geo, Geo, coicop, time, values) %>%
  month_to_date %>%
  filter(date >= as.Date("2017-01-01")) %>%
  arrange(date) %>%
  group_by(Geo) %>%
  mutate(values = 100*values/values[date == as.Date("2017-01-01")]) %>%
  add_colors %>%
  ggplot(.) + geom_line(aes(x = date, y = values, color = color)) +
  theme_minimal() + xlab("") + ylab("") +
  scale_x_date(breaks = seq(1960, 2100, 1) %>% paste0("-01-01") %>% as.Date,
               labels = date_format("%Y")) +
  scale_y_log10(breaks = seq(0, 200, 5)) +
  scale_color_identity() + add_flags +
  theme(legend.position = "none")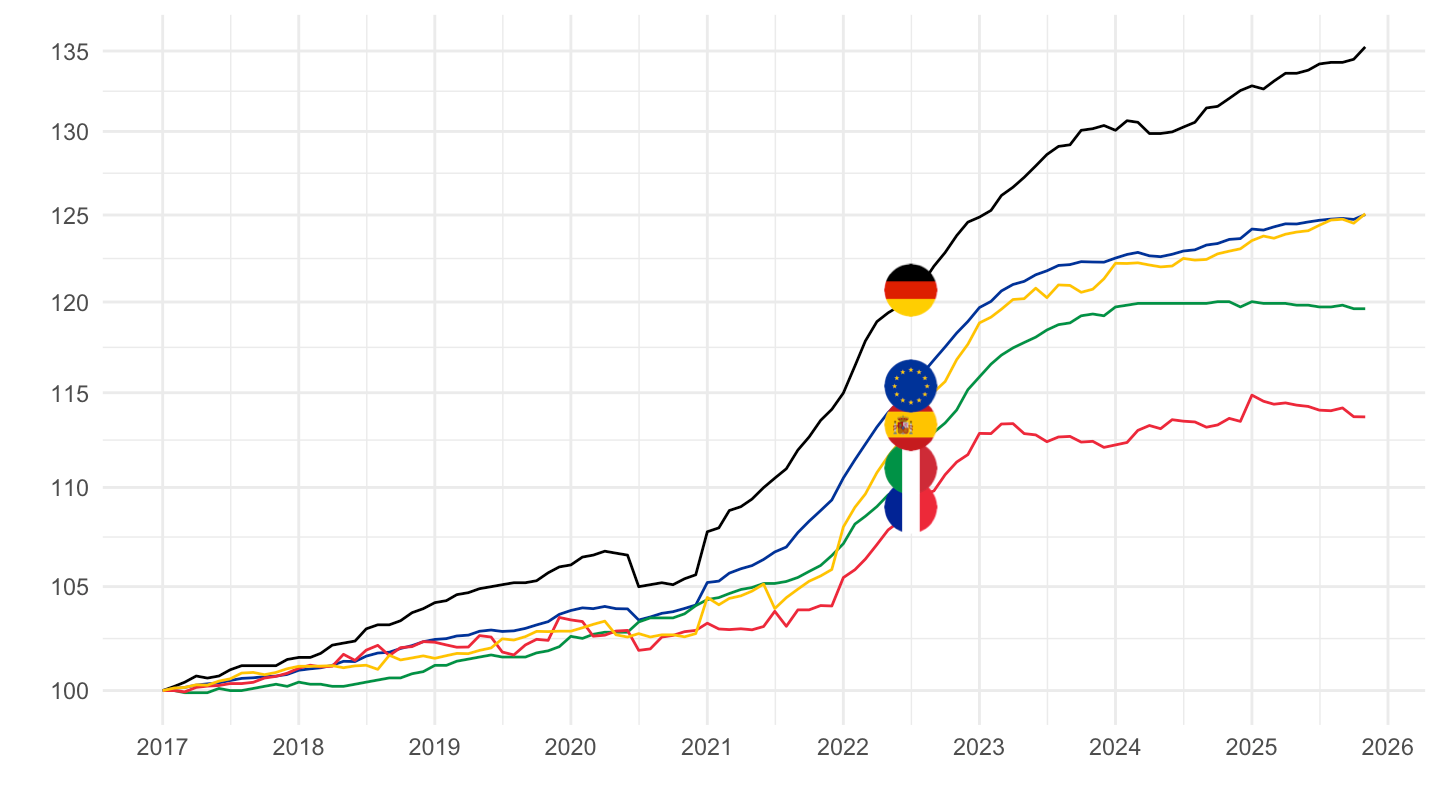
2020-
Code
prc_hicp_midx %>%
  filter(unit == "I15",
         coicop %in% c("CP071"),
         geo %in% c("DE", "FR", "IT", "NL", "ES")) %>%

  select(geo, Geo, coicop, time, values) %>%
  month_to_date %>%
  filter(date >= as.Date("2020-01-01")) %>%
  arrange(date) %>%
  group_by(Geo) %>%
  mutate(values = 100*values/values[date == as.Date("2020-01-01")]) %>%
  add_colors %>%
  ggplot(.) + geom_line(aes(x = date, y = values, color = color)) +
  theme_minimal() + xlab("") + ylab("") +
  scale_x_date(breaks = seq(1960, 2100, 1) %>% paste0("-01-01") %>% as.Date,
               labels = date_format("%Y")) +
  scale_y_log10(breaks = seq(0, 500, 2)) +
  scale_color_identity() + add_flags +
  theme(legend.position = "none")
CP031 -
1996-
Code
prc_hicp_midx %>%
  filter(unit == "I15",
         coicop %in% c("CP031"),
         geo %in% c("DE", "FR", "IT", "NL", "ES")) %>%

  select(geo, Geo, coicop, time, values) %>%
  month_to_date %>%
  filter(date >= as.Date("1996-01-01")) %>%
  arrange(date) %>%
  group_by(Geo) %>%
  mutate(values = 100*values/values[1]) %>%
  add_colors %>%
  ggplot(.) + geom_line(aes(x = date, y = values, color = color)) +
  theme_minimal() + xlab("") + ylab("") +
  scale_x_date(breaks = seq(1960, 2100, 2) %>% paste0("-01-01") %>% as.Date,
               labels = date_format("%Y")) +
  scale_y_log10(breaks = seq(0, 500, 5)) +
  scale_color_identity() + add_flags +
  theme(legend.position = "none")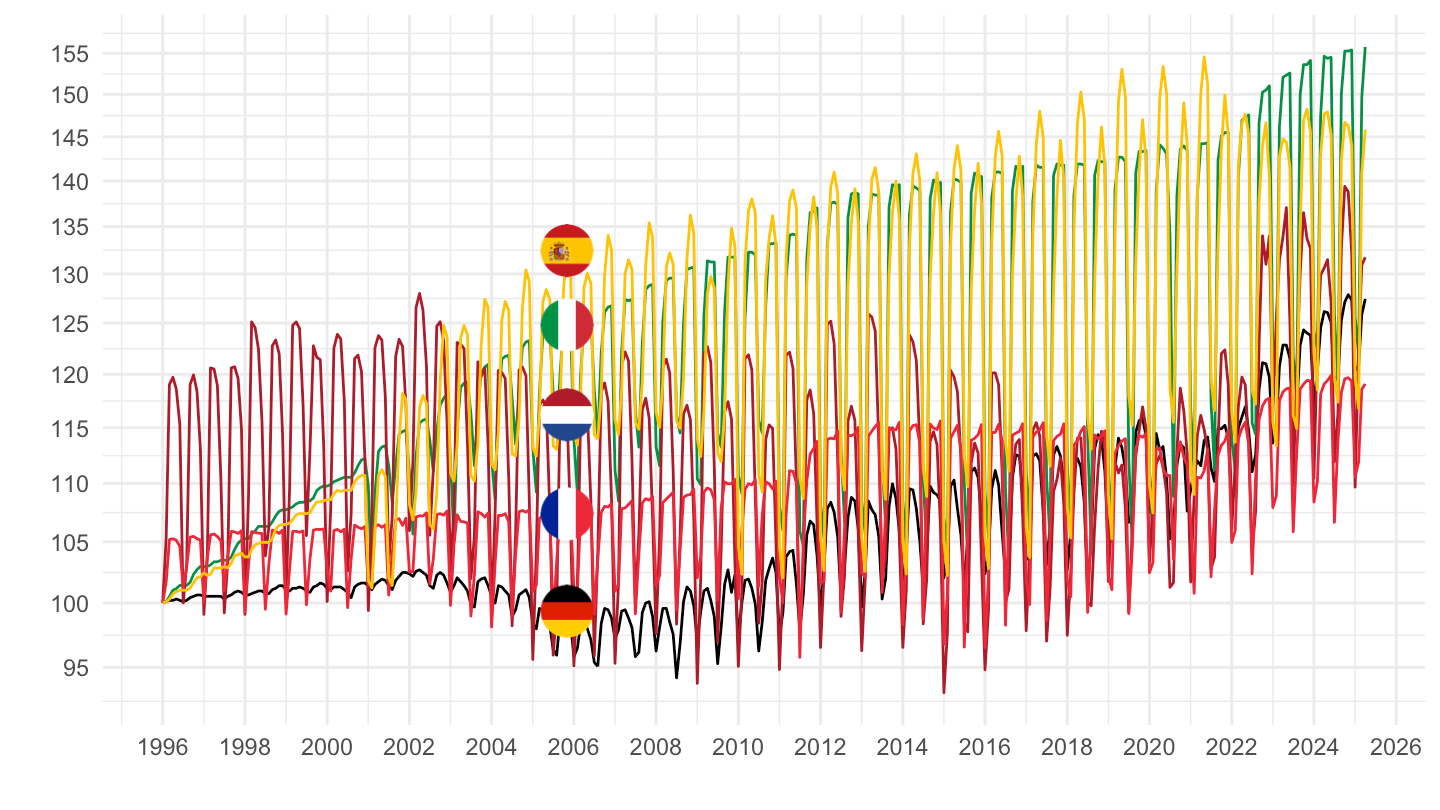
CP124 -
1996-
Code
prc_hicp_midx %>%
  filter(unit == "I15",
         coicop %in% c("CP124"),
         geo %in% c("DE", "FR", "IT", "NL", "ES")) %>%

  select(geo, Geo, coicop, time, values) %>%
  month_to_date %>%
  filter(date >= as.Date("1996-01-01")) %>%
  arrange(date) %>%
  group_by(Geo) %>%
  mutate(values = 100*values/values[1]) %>%
  add_colors %>%
  ggplot(.) + geom_line(aes(x = date, y = values, color = color)) +
  theme_minimal() + xlab("") + ylab("") +
  scale_x_date(breaks = seq(1960, 2100, 2) %>% paste0("-01-01") %>% as.Date,
               labels = date_format("%Y")) +
  scale_y_log10(breaks = seq(0, 500, 5)) +
  scale_color_identity() + add_flags +
  theme(legend.position = "none")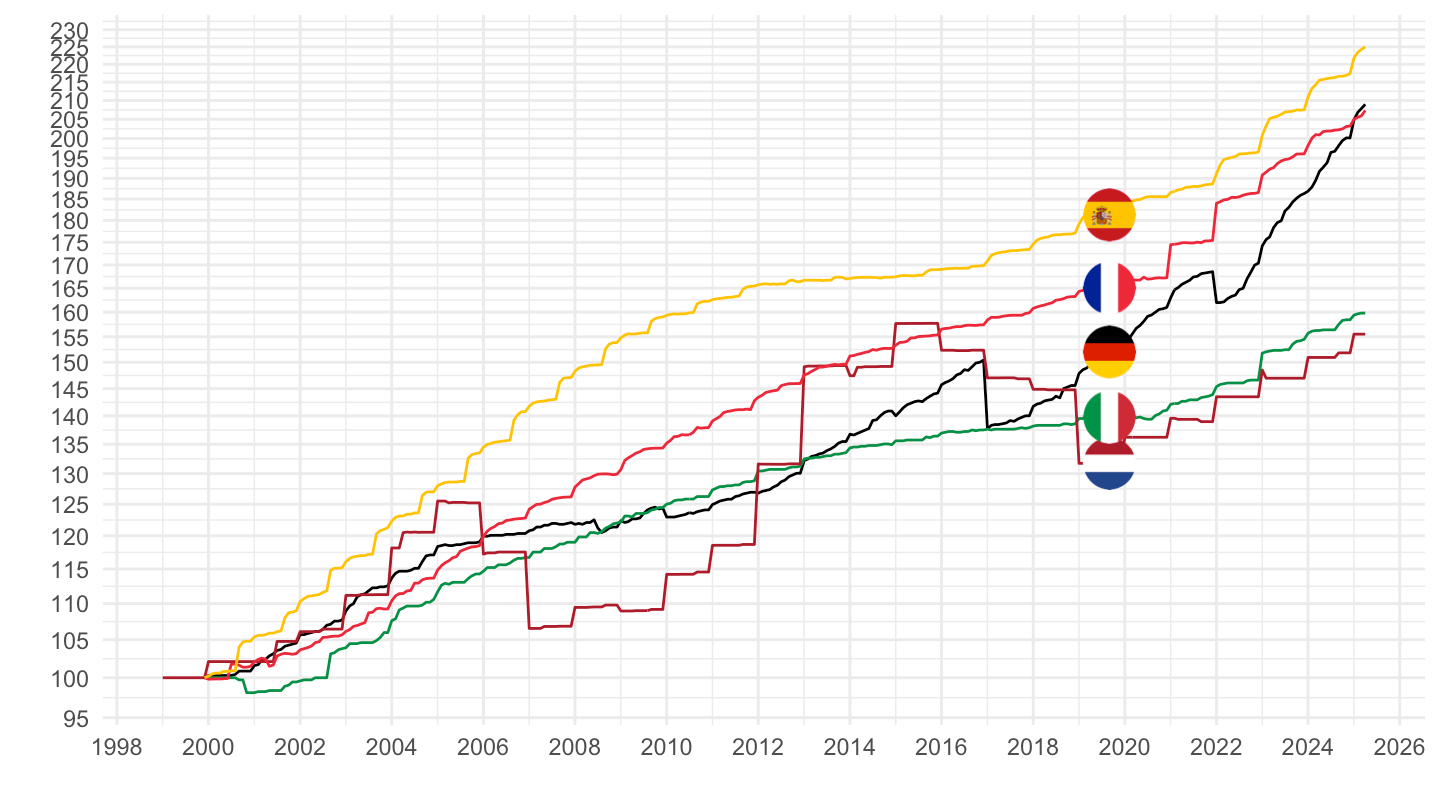
CP12402 - Retirement homes
1996-
Code
prc_hicp_midx %>%
  filter(unit == "I15",
         coicop %in% c("CP12402"),
         geo %in% c("DE", "FR", "IT", "NL", "ES")) %>%

  select(geo, Geo, coicop, time, values) %>%
  month_to_date %>%
  filter(date >= as.Date("1996-01-01")) %>%
  arrange(date) %>%
  group_by(Geo) %>%
  mutate(values = 100*values/values[1]) %>%
  add_colors %>%
  ggplot(.) + geom_line(aes(x = date, y = values, color = color)) +
  theme_minimal() + xlab("") + ylab("") +
  scale_x_date(breaks = seq(1960, 2100, 2) %>% paste0("-01-01") %>% as.Date,
               labels = date_format("%Y")) +
  scale_y_log10(breaks = seq(0, 500, 5)) +
  scale_color_identity() + add_flags +
  theme(legend.position = "none")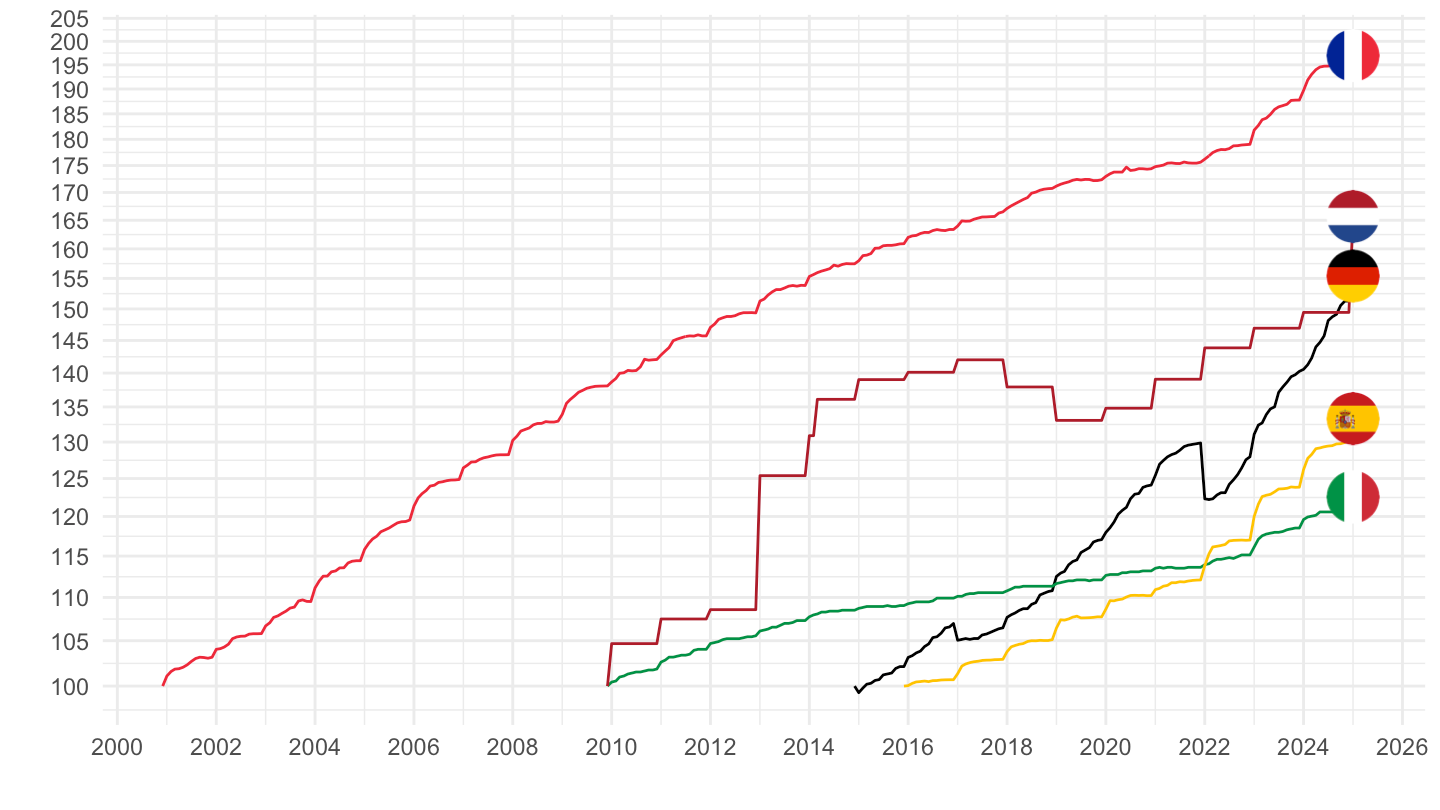
2017-
Code
prc_hicp_midx %>%
  filter(unit == "I15",
         coicop %in% c("CP12402"),
         geo %in% c("DE", "FR", "IT", "NL", "ES")) %>%

  select(geo, Geo, coicop, time, values) %>%
  month_to_date %>%
  filter(date >= as.Date("2017-01-01")) %>%
  arrange(date) %>%
  group_by(Geo) %>%
  mutate(values = 100*values/values[1]) %>%
  add_colors %>%
  ggplot(.) + geom_line(aes(x = date, y = values, color = color)) +
  theme_minimal() + xlab("") + ylab("") +
  scale_x_date(breaks = seq(1960, 2100, 1) %>% paste0("-01-01") %>% as.Date,
               labels = date_format("%Y")) +
  scale_y_log10(breaks = seq(0, 500, 5)) +
  scale_color_identity() + add_flags +
  theme(legend.position = "none")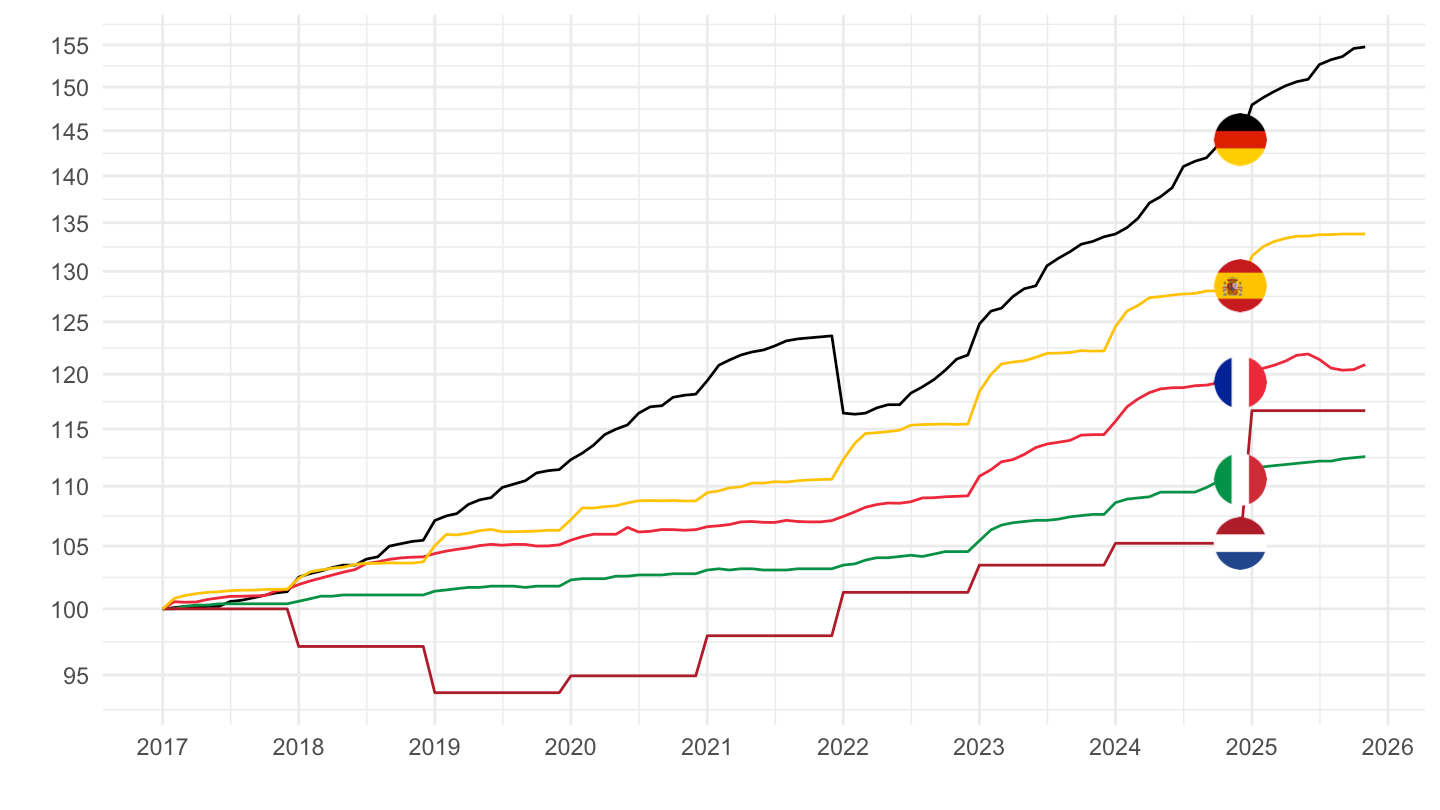
CP0721 - Pièces et accessoires
2017-
Code
prc_hicp_midx %>%
  filter(unit == "I15",
         coicop %in% c("CP0733"),
         geo %in% c("DE", "FR", "IT", "EA20", "ES")) %>%

  select(geo, Geo, coicop, time, values) %>%
  month_to_date %>%
  filter(date >= as.Date("2017-01-01")) %>%
  arrange(date) %>%
  group_by(Geo) %>%
  mutate(values = 100*values/values[1]) %>%
  add_colors %>%
  ggplot(.) + geom_line(aes(x = date, y = values, color = color)) +
  theme_minimal() + xlab("") + ylab("") +
  scale_x_date(breaks = seq(1960, 2100, 1) %>% paste0("-01-01") %>% as.Date,
               labels = date_format("%Y")) +
  scale_y_log10(breaks = seq(0, 200, 5)) +
  scale_color_identity() + add_flags +
  theme(legend.position = "none")
CP0711 - New Autos
1996-
Code
prc_hicp_midx %>%
  filter(unit == "I15",
         coicop %in% c("CP0711"),
         geo %in% c("DE", "FR", "IT", "NL", "ES")) %>%

  select(geo, Geo, coicop, time, values) %>%
  month_to_date %>%
  filter(date >= as.Date("1996-01-01")) %>%
  arrange(date) %>%
  group_by(Geo) %>%
  mutate(values = 100*values/values[date == as.Date("1996-01-01")]) %>%
  add_colors %>%
  ggplot(.) + geom_line(aes(x = date, y = values, color = color)) +
  theme_minimal() + xlab("") + ylab("CP0711 - Motor cars (100 = 1996-01)") +
  scale_x_date(breaks = seq(1960, 2100, 2) %>% paste0("-01-01") %>% as.Date,
               labels = date_format("%Y")) +
  scale_y_log10(breaks = seq(0, 500, 5)) +
  scale_color_identity() + add_flags +
  theme(legend.position = "none")
2015-
Code
prc_hicp_midx %>%
  filter(unit == "I15",
         coicop %in% c("CP0711"),
         geo %in% c("DE", "FR", "IT", "NL", "ES")) %>%

  select(geo, Geo, coicop, time, values) %>%
  month_to_date %>%
  filter(date >= as.Date("2016-01-01")) %>%
  arrange(date) %>%
  group_by(Geo) %>%
  mutate(values = 100*values/values[date == as.Date("2016-01-01")]) %>%
  add_colors %>%
  ggplot(.) + geom_line(aes(x = date, y = values, color = color)) +
  theme_minimal() + xlab("") + ylab("") +
  scale_x_date(breaks = seq(1960, 2100, 1) %>% paste0("-01-01") %>% as.Date,
               labels = date_format("%Y")) +
  scale_y_log10(breaks = seq(0, 200, 5)) +
  scale_color_identity() + add_flags +
  theme(legend.position = "none")
2017-
Code
prc_hicp_midx %>%
  filter(unit == "I15",
         coicop %in% c("CP0711"),
         geo %in% c("DE", "FR", "IT", "NL", "ES")) %>%

  select(geo, Geo, coicop, time, values) %>%
  month_to_date %>%
  filter(date >= as.Date("2017-01-01")) %>%
  arrange(date) %>%
  group_by(Geo) %>%
  mutate(values = 100*values/values[date == as.Date("2017-01-01")]) %>%
  add_colors %>%
  ggplot(.) + geom_line(aes(x = date, y = values, color = color)) +
  theme_minimal() + xlab("") + ylab("") +
  scale_x_date(breaks = seq(1960, 2100, 1) %>% paste0("-01-01") %>% as.Date,
               labels = date_format("%Y")) +
  scale_y_log10(breaks = seq(0, 200, 5)) +
  scale_color_identity() + add_flags +
  theme(legend.position = "none")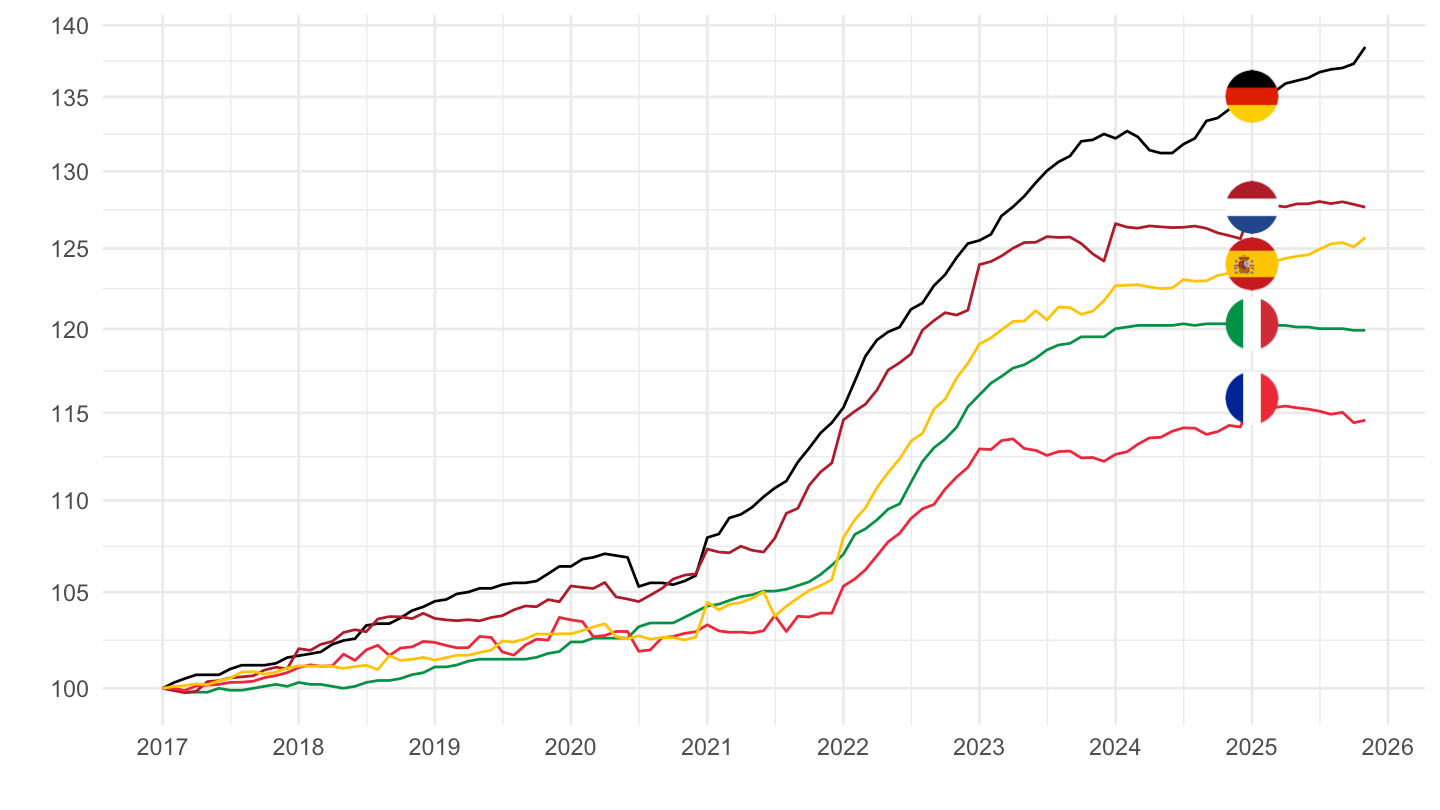
2017-
Code
prc_hicp_midx %>%
  filter(unit == "I15",
         coicop %in% c("CP0711"),
         geo %in% c("DE", "FR", "IT", "EA20", "ES")) %>%

  select(geo, Geo, coicop, time, values) %>%
  month_to_date %>%
  filter(date >= as.Date("2017-01-01")) %>%
  arrange(date) %>%
  group_by(Geo) %>%
  mutate(values = 100*values/values[date == as.Date("2017-01-01")]) %>%
  add_colors %>%
  ggplot(.) + geom_line(aes(x = date, y = values, color = color)) +
  theme_minimal() + xlab("") + ylab("") +
  scale_x_date(breaks = seq(1960, 2100, 1) %>% paste0("-01-01") %>% as.Date,
               labels = date_format("%Y")) +
  scale_y_log10(breaks = seq(0, 200, 5)) +
  scale_color_identity() + add_flags +
  theme(legend.position = "none")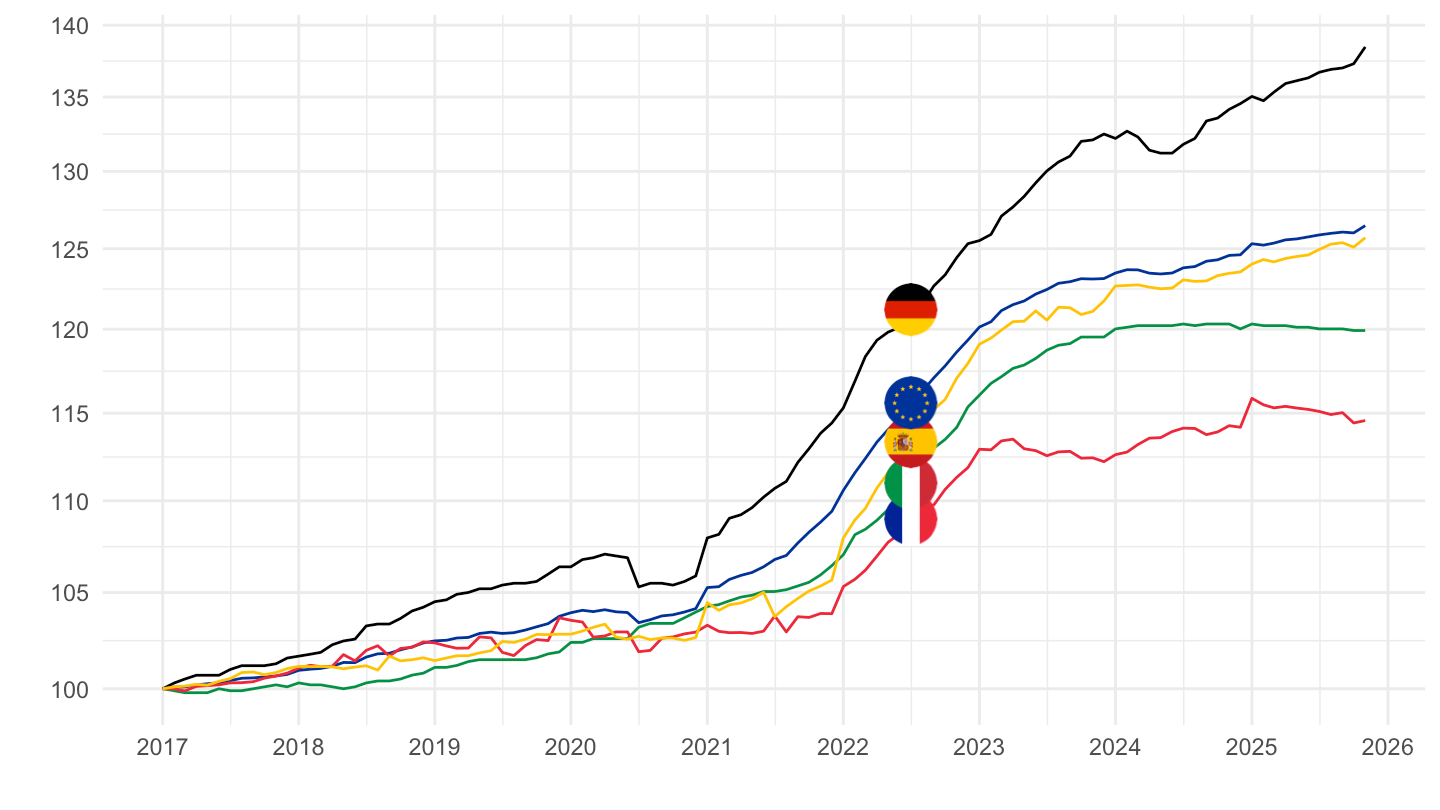
2017-
Code
prc_hicp_midx %>%
  filter(unit == "I15",
         coicop %in% c("CP07111"),
         geo %in% c("DE", "FR", "IT", "EA20", "ES")) %>%

  select(geo, Geo, coicop, time, values) %>%
  month_to_date %>%
  filter(date >= as.Date("2017-01-01")) %>%
  arrange(date) %>%
  group_by(Geo) %>%
  mutate(values = 100*values/values[date == as.Date("2017-01-01")]) %>%
  add_colors %>%
  ggplot(.) + geom_line(aes(x = date, y = values, color = color)) +
  theme_minimal() + xlab("") + ylab("") +
  scale_x_date(breaks = seq(1960, 2100, 1) %>% paste0("-01-01") %>% as.Date,
               labels = date_format("%Y")) +
  scale_y_log10(breaks = seq(0, 200, 5)) +
  scale_color_identity() + add_flags +
  theme(legend.position = "none")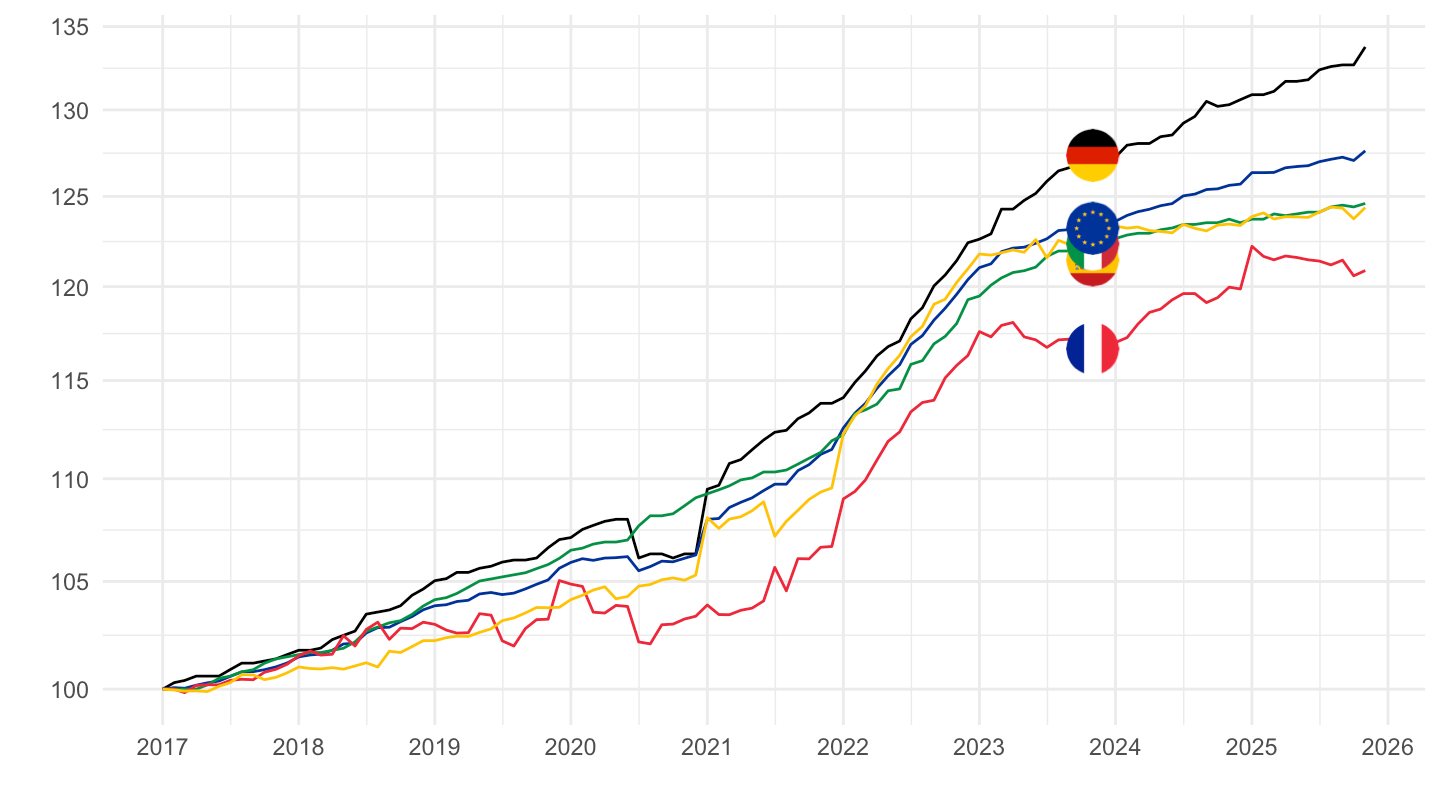
2017-
Code
prc_hicp_midx %>%
  filter(unit == "I15",
         coicop %in% c("CP07112"),
         geo %in% c("DE", "FR", "IT", "EA20", "ES")) %>%

  select(geo, Geo, coicop, time, values) %>%
  month_to_date %>%
  filter(date >= as.Date("2017-01-01")) %>%
  arrange(date) %>%
  group_by(Geo) %>%
  mutate(values = 100*values/values[date == as.Date("2017-01-01")]) %>%
  add_colors %>%
  ggplot(.) + geom_line(aes(x = date, y = values, color = color)) +
  theme_minimal() + xlab("") + ylab("") +
  scale_x_date(breaks = seq(1960, 2100, 1) %>% paste0("-01-01") %>% as.Date,
               labels = date_format("%Y")) +
  scale_y_log10(breaks = seq(0, 200, 5)) +
  scale_color_identity() + add_flags +
  theme(legend.position = "none")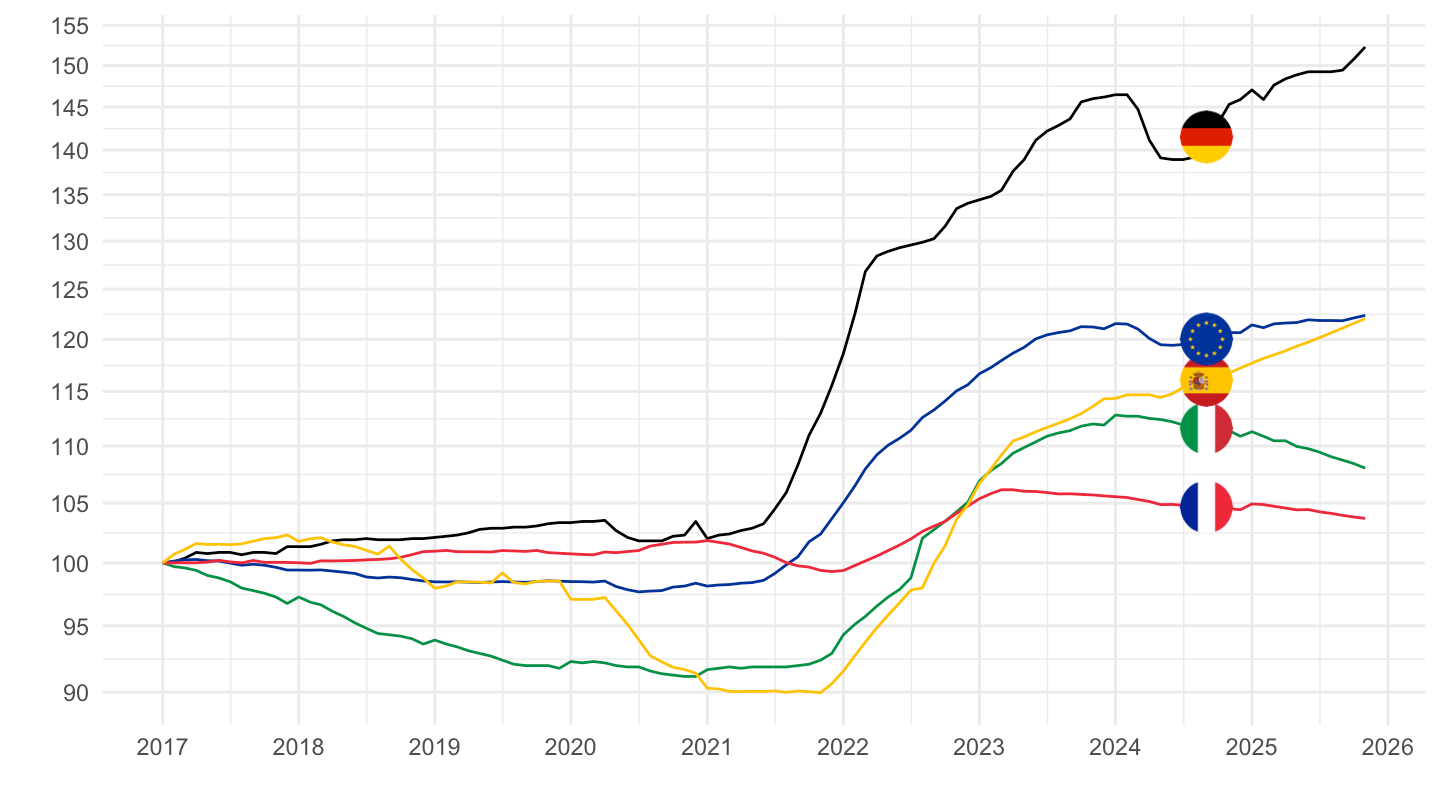
CP0712 - Old Autos
1996-
Code
prc_hicp_midx %>%
  filter(unit == "I15",
         coicop %in% c("CP0712"),
         geo %in% c("DE", "FR", "IT", "NL", "ES")) %>%

  select(geo, Geo, coicop, time, values) %>%
  month_to_date %>%
  filter(date >= as.Date("1996-01-01")) %>%
  arrange(date) %>%
  group_by(Geo) %>%
  mutate(values = 100*values/values[1]) %>%
  add_colors %>%
  ggplot(.) + geom_line(aes(x = date, y = values, color = color)) +
  theme_minimal() + xlab("") + ylab("") +
  scale_x_date(breaks = seq(1960, 2100, 2) %>% paste0("-01-01") %>% as.Date,
               labels = date_format("%Y")) +
  scale_y_log10(breaks = seq(0, 500, 5)) +
  scale_color_identity() + add_flags +
  theme(legend.position = "none")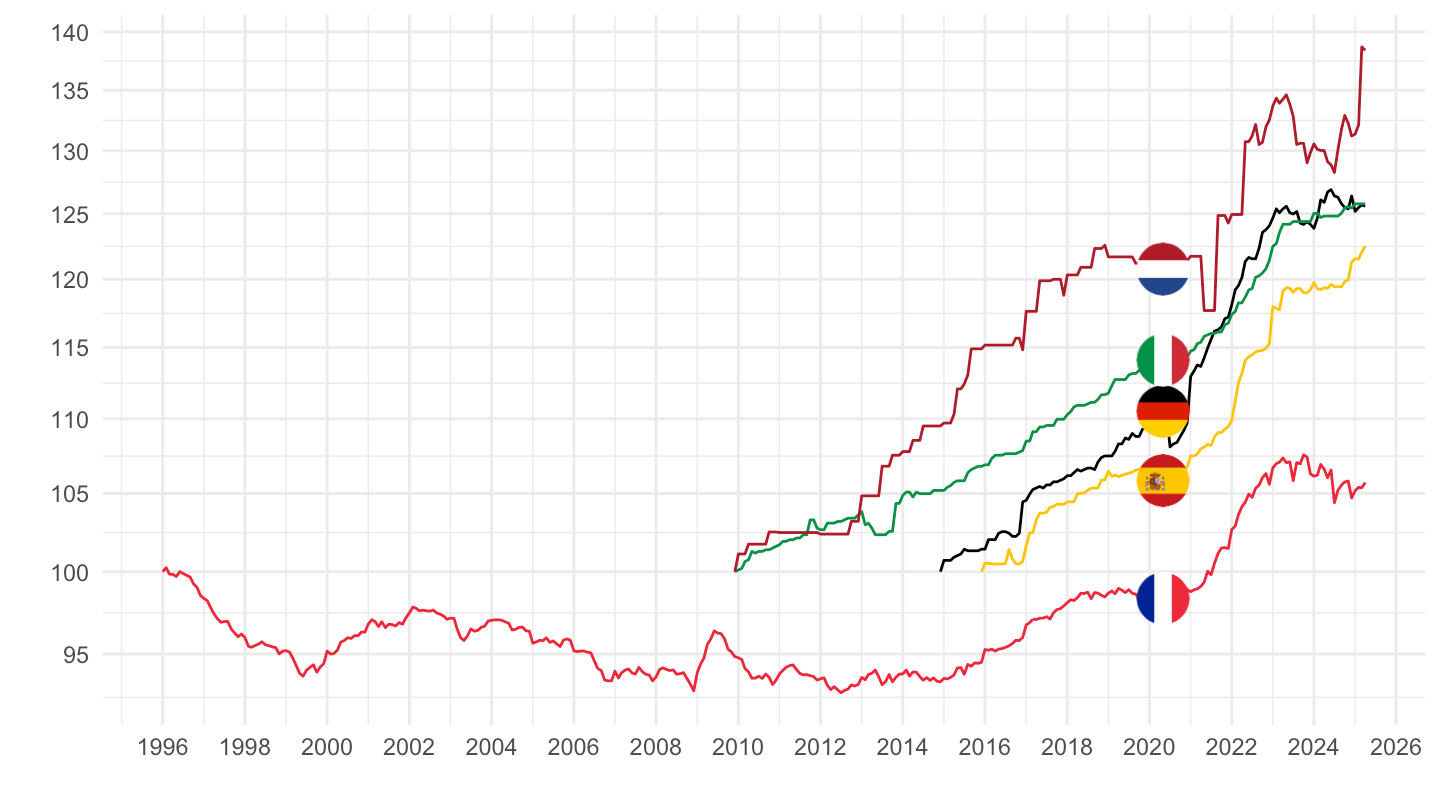
2015-
Code
prc_hicp_midx %>%
  filter(unit == "I15",
         coicop %in% c("CP0712"),
         geo %in% c("DE", "FR", "IT", "NL", "ES")) %>%

  select(geo, Geo, coicop, time, values) %>%
  month_to_date %>%
  filter(date >= as.Date("2016-01-01")) %>%
  arrange(date) %>%
  group_by(Geo) %>%
  mutate(values = 100*values/values[date == as.Date("2016-01-01")]) %>%
  add_colors %>%
  ggplot(.) + geom_line(aes(x = date, y = values, color = color)) +
  theme_minimal() + xlab("") + ylab("") +
  scale_x_date(breaks = seq(1960, 2100, 1) %>% paste0("-01-01") %>% as.Date,
               labels = date_format("%Y")) +
  scale_y_log10(breaks = seq(0, 200, 5)) +
  scale_color_identity() + add_flags +
  theme(legend.position = "none")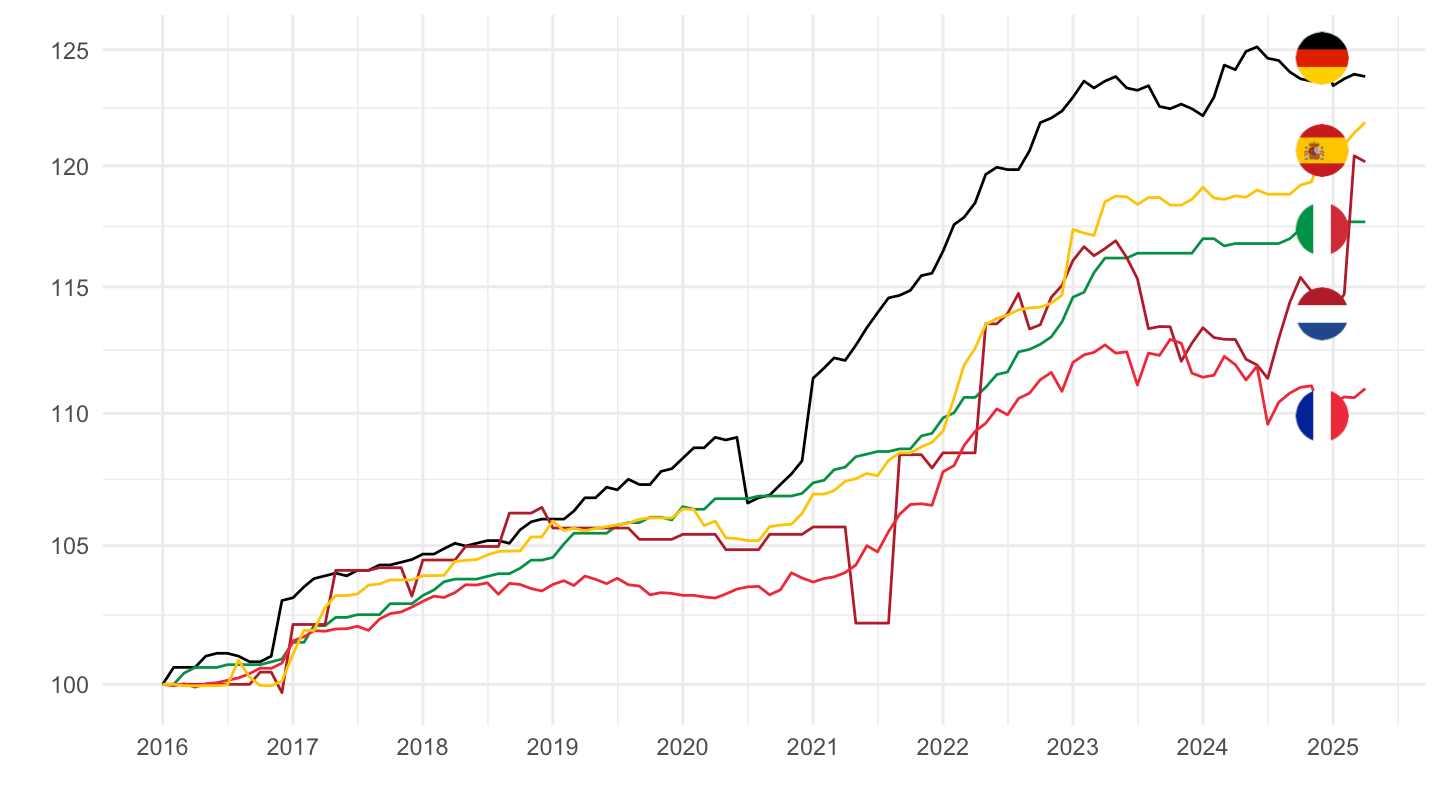
2017-
Code
prc_hicp_midx %>%
  filter(unit == "I15",
         coicop %in% c("CP0712"),
         geo %in% c("DE", "FR", "IT", "NL", "ES")) %>%

  select(geo, Geo, coicop, time, values) %>%
  month_to_date %>%
  filter(date >= as.Date("2017-01-01")) %>%
  arrange(date) %>%
  group_by(Geo) %>%
  mutate(values = 100*values/values[date == as.Date("2017-01-01")]) %>%
  add_colors %>%
  ggplot(.) + geom_line(aes(x = date, y = values, color = color)) +
  theme_minimal() + xlab("") + ylab("") +
  scale_x_date(breaks = seq(1960, 2100, 1) %>% paste0("-01-01") %>% as.Date,
               labels = date_format("%Y")) +
  scale_y_log10(breaks = seq(0, 200, 5)) +
  scale_color_identity() + add_flags +
  theme(legend.position = "none")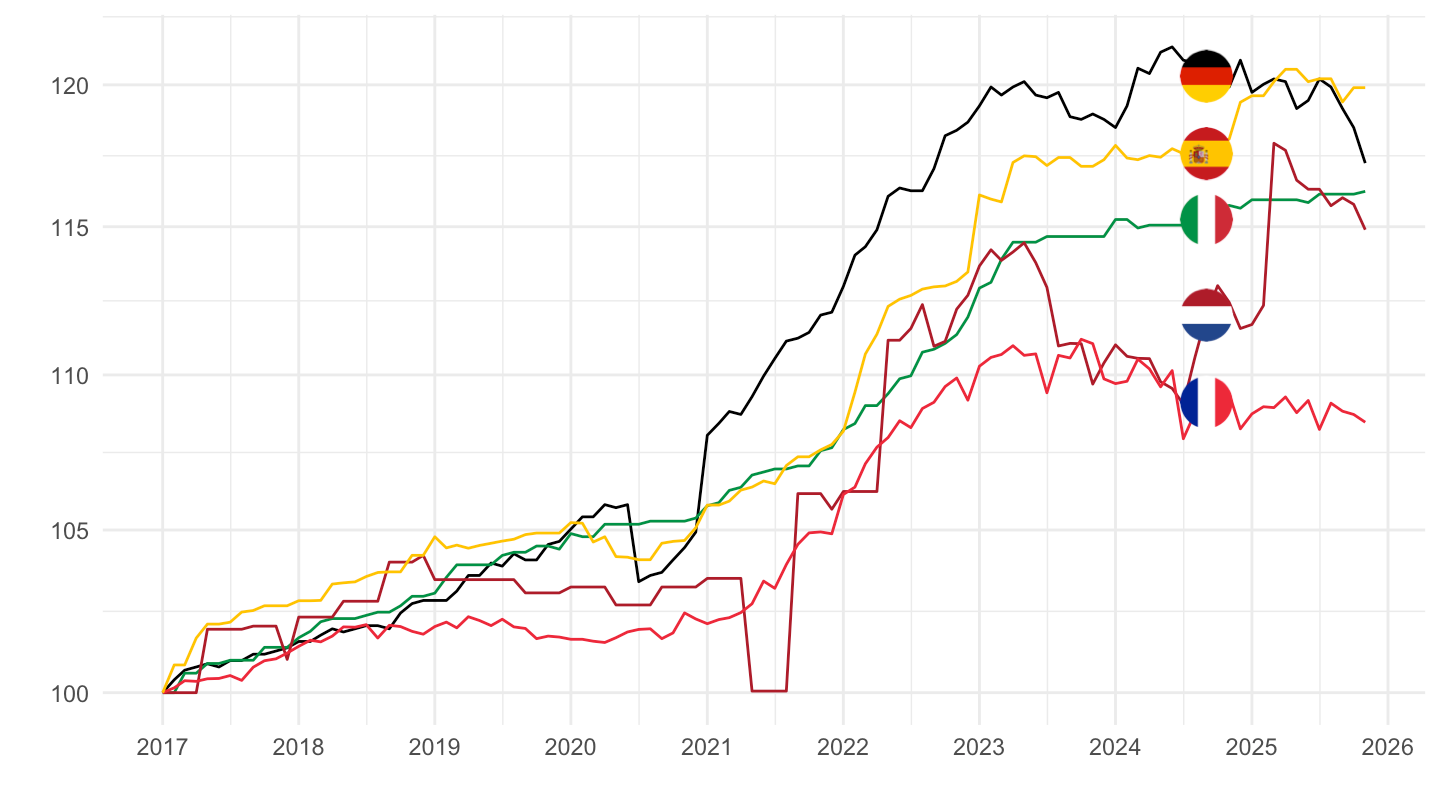
CP041
1996-
Code
prc_hicp_midx %>%
  filter(unit == "I15",
         coicop %in% c("CP041"),
         geo %in% c("DE", "FR", "IT", "NL", "ES")) %>%

  select(geo, Geo, coicop, time, values) %>%
  month_to_date %>%
  filter(date >= as.Date("1996-01-01")) %>%
  arrange(date) %>%
  group_by(Geo) %>%
  mutate(values = 100*values/values[date == as.Date("1996-01-01")]) %>%
  add_colors %>%
  ggplot(.) + geom_line(aes(x = date, y = values, color = color)) +
  theme_minimal() + xlab("") + ylab("") +
  scale_x_date(breaks = seq(1960, 2100, 2) %>% paste0("-01-01") %>% as.Date,
               labels = date_format("%Y")) +
  scale_y_log10(breaks = seq(0, 500, 5)) +
  scale_color_identity() + add_flags +
  theme(legend.position = "none")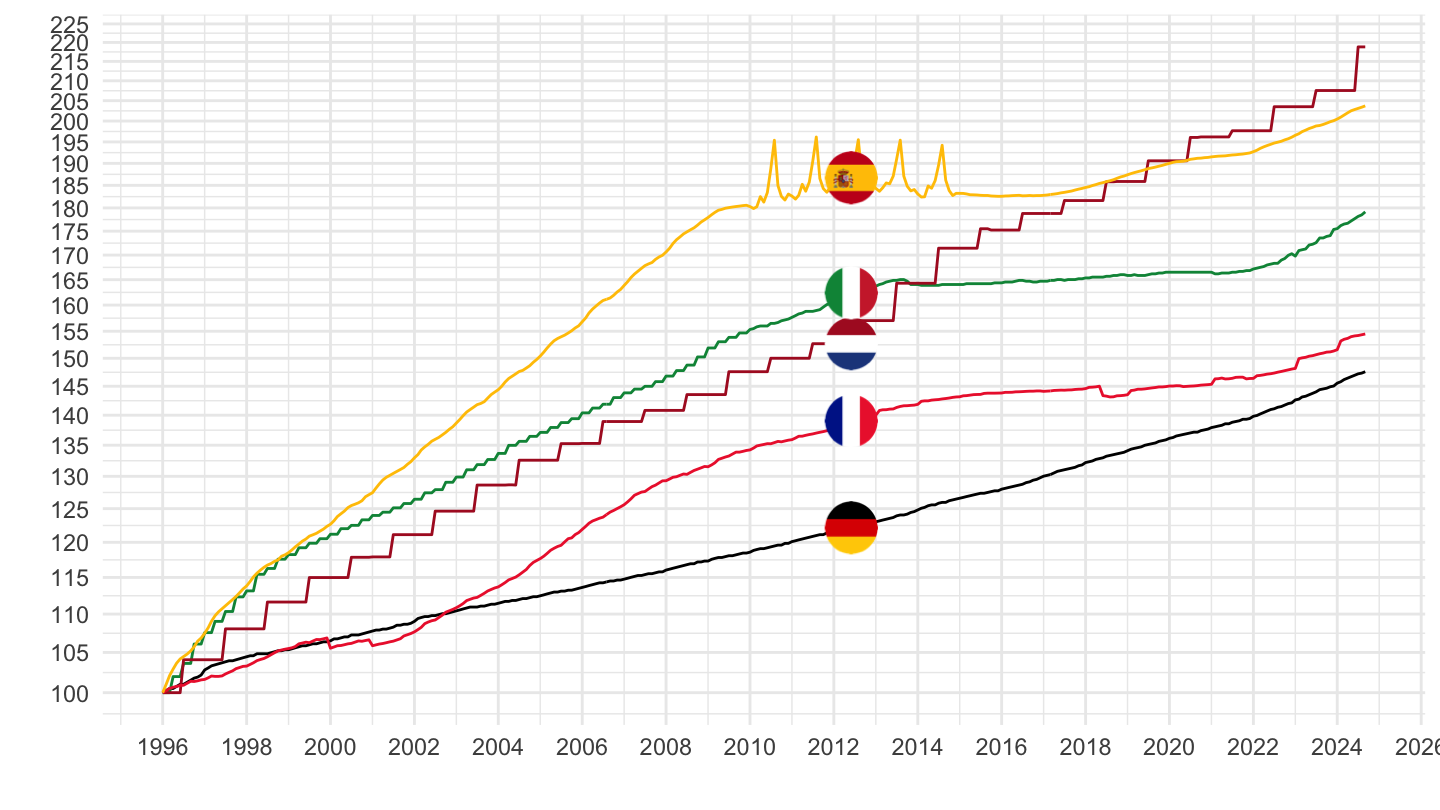
2015-
Code
prc_hicp_midx %>%
  filter(unit == "I15",
         coicop %in% c("CP041"),
         geo %in% c("DE", "FR", "IT", "NL", "ES")) %>%

  select(geo, Geo, coicop, time, values) %>%
  month_to_date %>%
  filter(date >= as.Date("2016-01-01")) %>%
  arrange(date) %>%
  group_by(Geo) %>%
  mutate(values = 100*values/values[date == as.Date("2016-01-01")]) %>%
  add_colors %>%
  ggplot(.) + geom_line(aes(x = date, y = values, color = color)) +
  theme_minimal() + xlab("") + ylab("") +
  scale_x_date(breaks = seq(1960, 2100, 1) %>% paste0("-01-01") %>% as.Date,
               labels = date_format("%Y")) +
  scale_y_log10(breaks = seq(0, 200, 2)) +
  scale_color_identity() + add_flags +
  theme(legend.position = "none")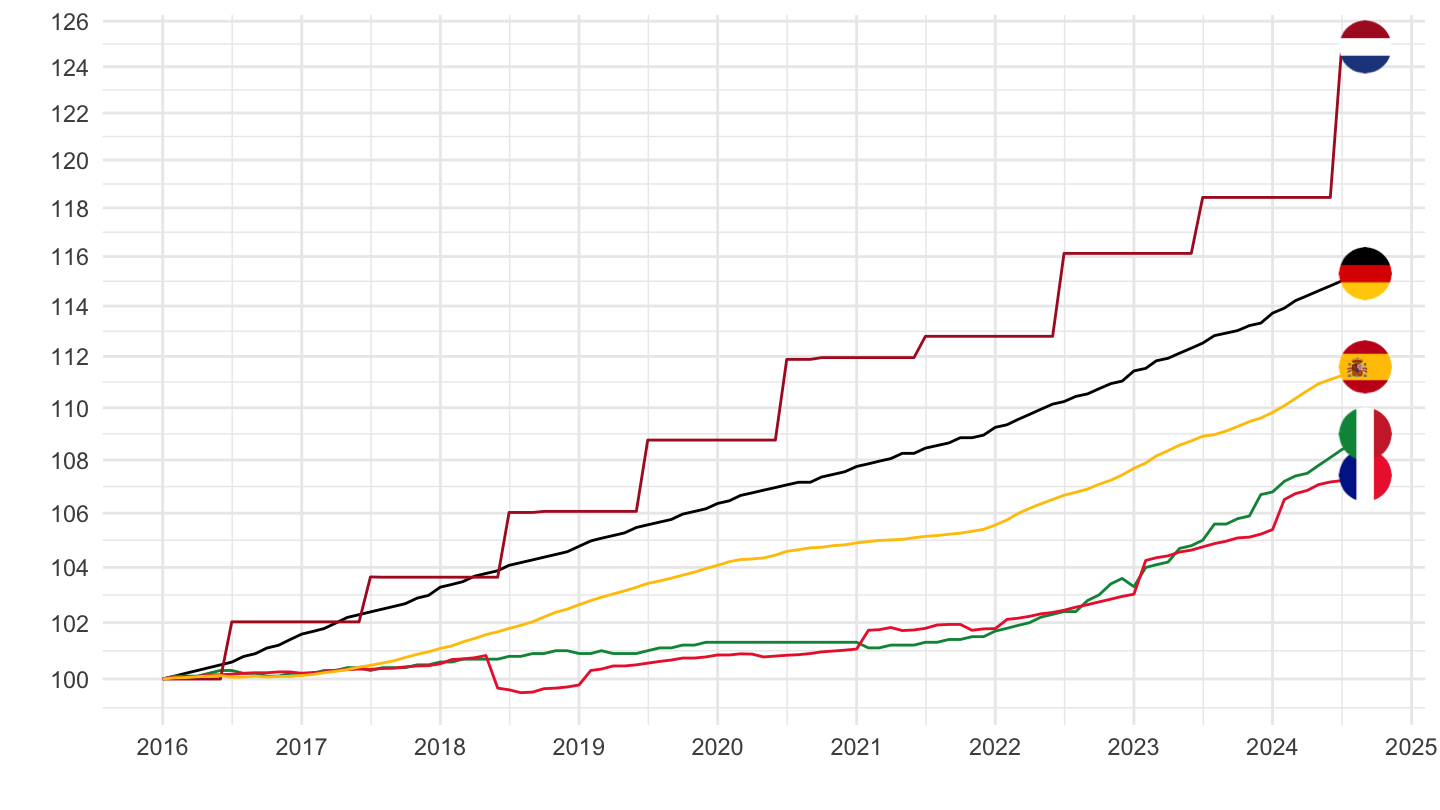
2017-
Code
prc_hicp_midx %>%
  filter(unit == "I15",
         coicop %in% c("CP041"),
         geo %in% c("DE", "FR", "IT", "NL", "ES")) %>%

  select(geo, Geo, coicop, time, values) %>%
  month_to_date %>%
  filter(date >= as.Date("2017-01-01")) %>%
  arrange(date) %>%
  group_by(Geo) %>%
  mutate(values = 100*values/values[date == as.Date("2017-01-01")]) %>%
  add_colors %>%
  ggplot(.) + geom_line(aes(x = date, y = values, color = color)) +
  theme_minimal() + xlab("") + ylab("") +
  scale_x_date(breaks = seq(1960, 2100, 1) %>% paste0("-01-01") %>% as.Date,
               labels = date_format("%Y")) +
  scale_y_log10(breaks = seq(0, 200, 2)) +
  scale_color_identity() + add_flags +
  theme(legend.position = "none")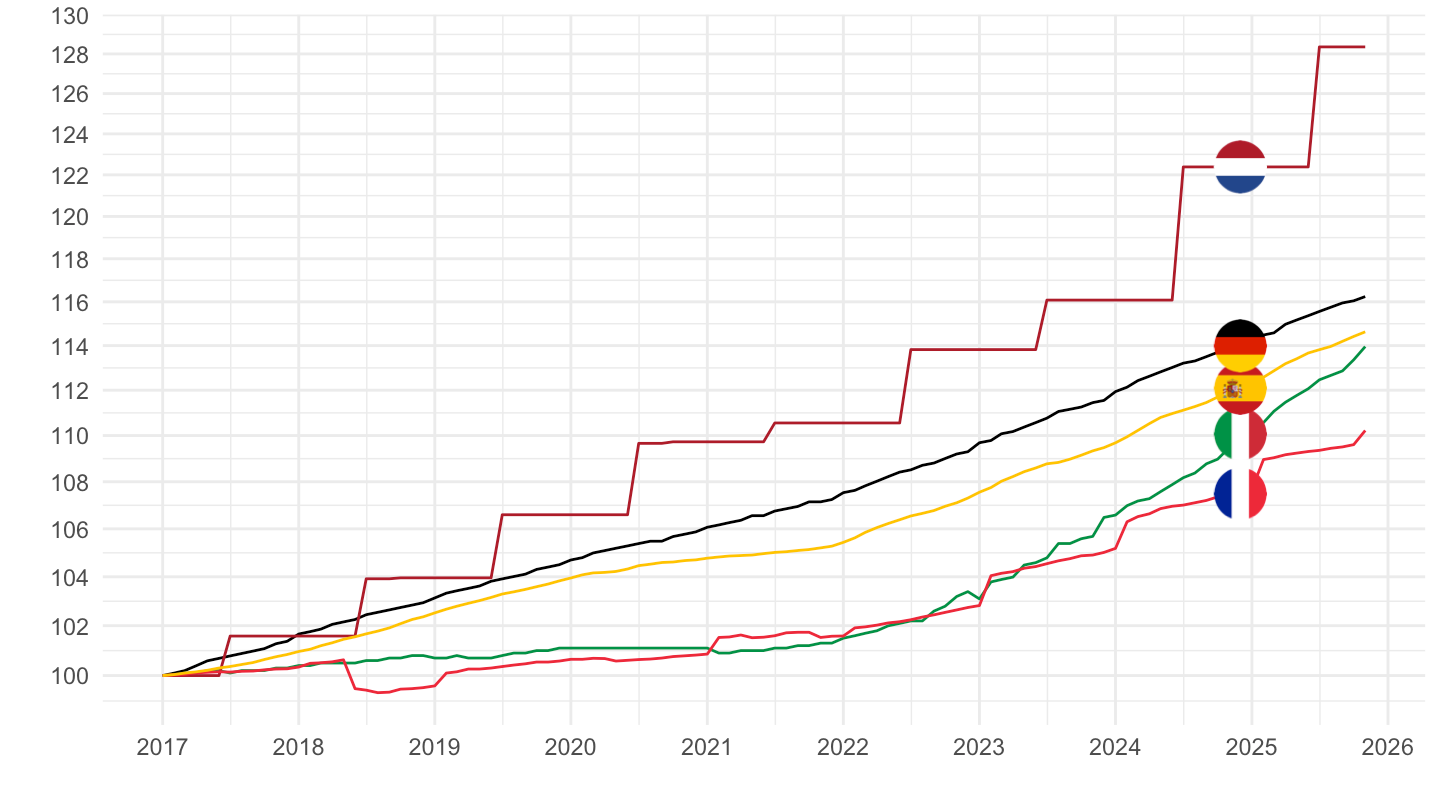
2017-
Code
prc_hicp_midx %>%
  filter(unit == "I15",
         coicop %in% c("CP041"),
         geo %in% c("DE", "FR", "IT", "EA20", "ES")) %>%

  select(geo, Geo, coicop, time, values) %>%
  month_to_date %>%
  filter(date >= as.Date("2017-01-01")) %>%
  arrange(date) %>%
  group_by(Geo) %>%
  mutate(values = 100*values/values[date == as.Date("2017-01-01")]) %>%
  add_colors %>%
  ggplot(.) + geom_line(aes(x = date, y = values, color = color)) +
  theme_minimal() + xlab("") + ylab("CP041 - Actual rentals for housing") +
  scale_x_date(breaks = seq(1960, 2100, 1) %>% paste0("-01-01") %>% as.Date,
               labels = date_format("%Y")) +
  scale_y_log10(breaks = seq(0, 200, 2)) +
  scale_color_identity() + add_flags +
  theme(legend.position = "none")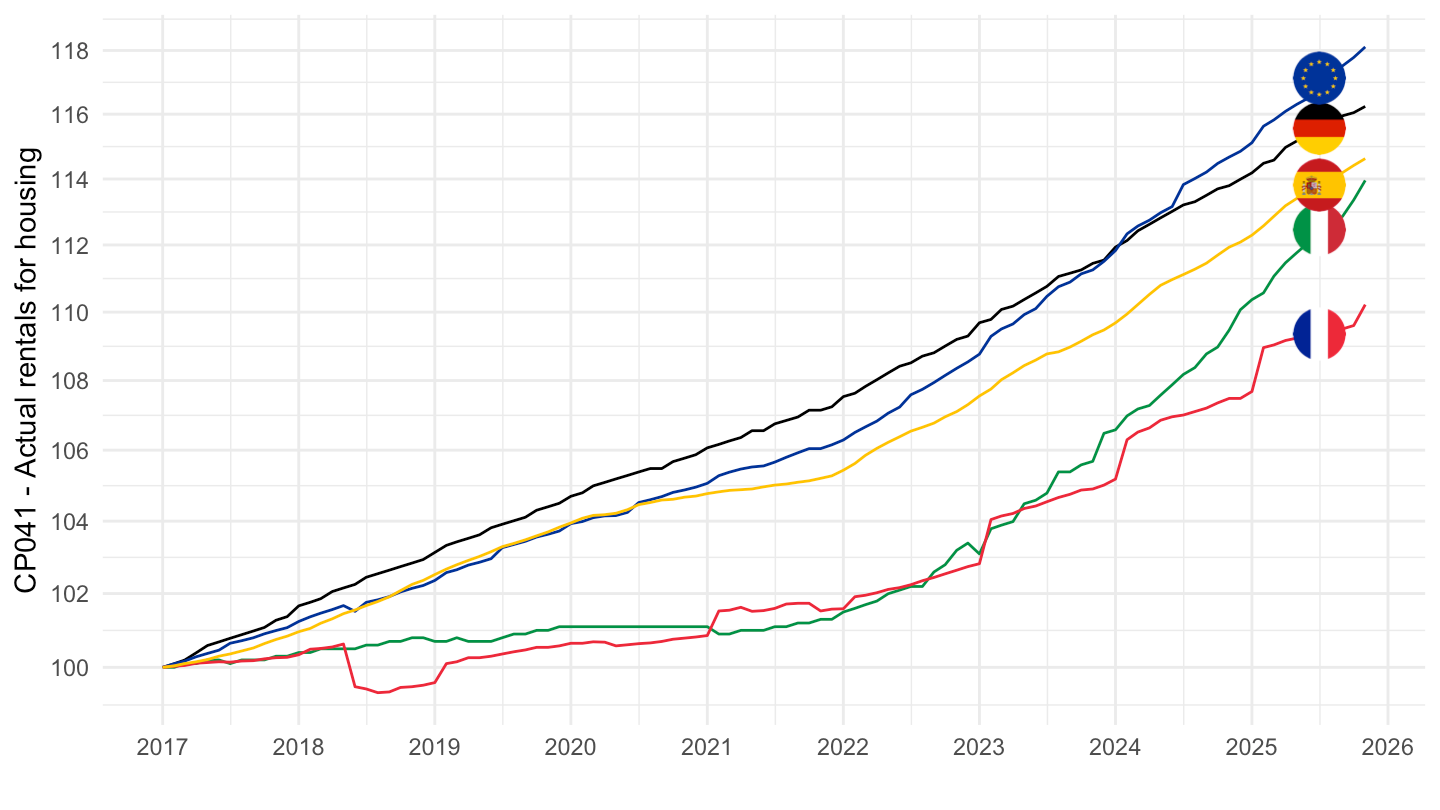
2 years
Code
prc_hicp_midx %>%
  filter(unit == "I15",
         coicop %in% c("CP041"),
         geo %in% c("DE", "FR", "IT", "NL", "ES")) %>%

  select(geo, Geo, coicop, time, values) %>%
  month_to_date %>%
  filter(date >= max(date) - years(2)) %>%
  arrange(date) %>%
  group_by(Geo) %>%
  mutate(values = 100*values/values[date == max(date) - years(2)]) %>%
  add_colors %>%
  ggplot(.) + geom_line(aes(x = date, y = values, color = color)) +
  theme_minimal() + xlab("") + ylab("") +
  scale_x_date(breaks = "1 month",
               labels = date_format("%b %Y")) +
  scale_y_log10(breaks = seq(0, 200, 1)) +
  scale_color_identity() + add_flags +
  theme(legend.position = "none",
        axis.text.x = element_text(angle = 45, vjust = 1, hjust = 1))
CP01 - Food
1996-
Code
prc_hicp_midx %>%
  filter(unit == "I15",
         coicop %in% c("CP01"),
         geo %in% c("DE", "FR", "IT", "NL", "ES")) %>%

  select(geo, Geo, coicop, time, values) %>%
  month_to_date %>%
  filter(date >= as.Date("1996-01-01")) %>%
  arrange(date) %>%
  group_by(Geo) %>%
  mutate(values = 100*values/values[date == as.Date("1996-01-01")]) %>%
  add_colors %>%
  ggplot(.) + geom_line(aes(x = date, y = values, color = color)) +
  theme_minimal() + xlab("") + ylab("") +
  scale_x_date(breaks = seq(1960, 2100, 2) %>% paste0("-01-01") %>% as.Date,
               labels = date_format("%Y")) +
  scale_y_log10(breaks = seq(0, 500, 5)) +
  scale_color_identity() + add_flags +
  theme(legend.position = "none")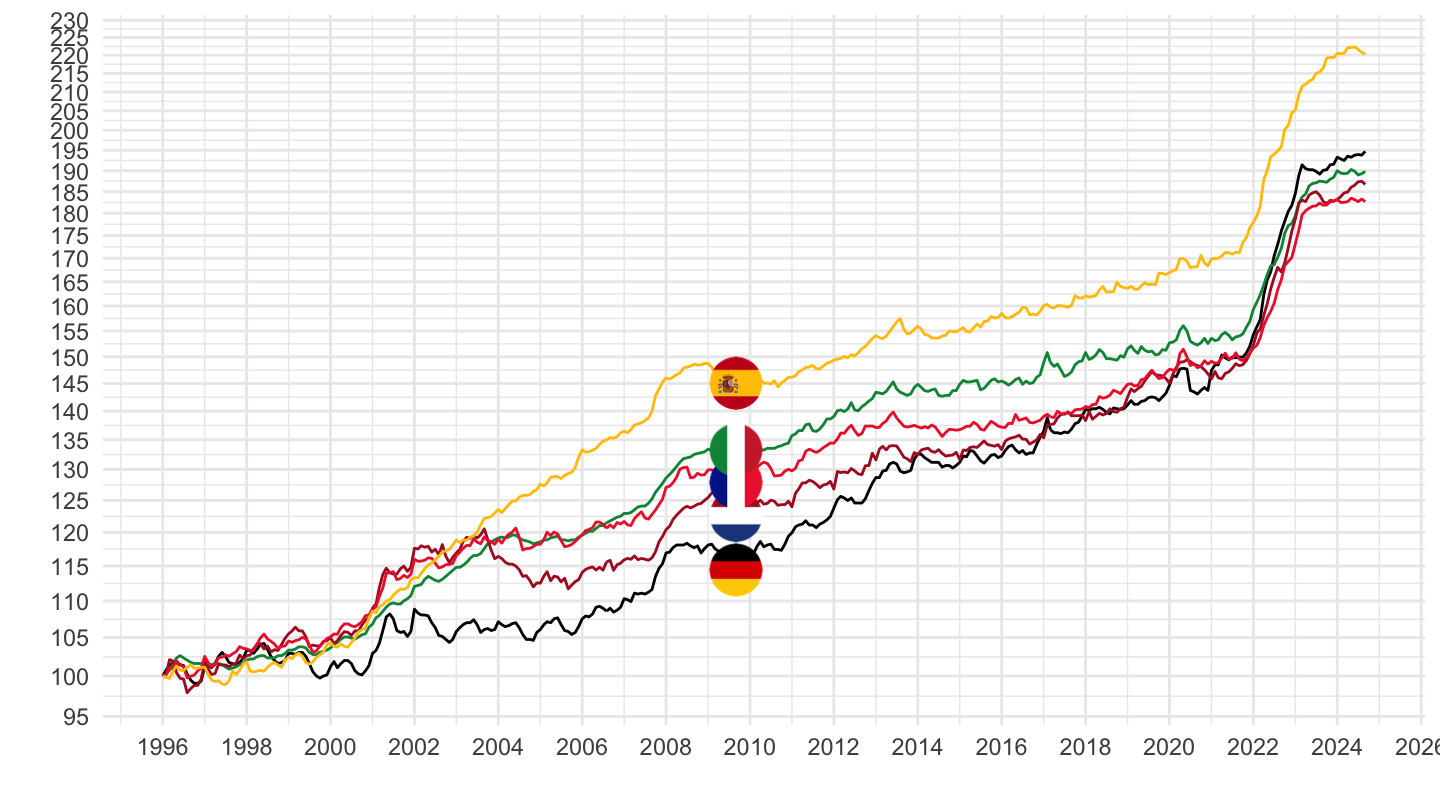
2015-
Code
prc_hicp_midx %>%
  filter(unit == "I15",
         coicop %in% c("CP01"),
         geo %in% c("DE", "FR", "IT", "NL", "ES")) %>%

  select(geo, Geo, coicop, time, values) %>%
  month_to_date %>%
  filter(date >= as.Date("2016-01-01")) %>%
  arrange(date) %>%
  group_by(Geo) %>%
  mutate(values = 100*values/values[date == as.Date("2016-01-01")]) %>%
  add_colors %>%
  ggplot(.) + geom_line(aes(x = date, y = values, color = color)) +
  theme_minimal() + xlab("") + ylab("") +
  scale_x_date(breaks = seq(1960, 2100, 1) %>% paste0("-01-01") %>% as.Date,
               labels = date_format("%Y")) +
  scale_y_log10(breaks = seq(0, 200, 5)) +
  scale_color_identity() + add_flags +
  theme(legend.position = "none")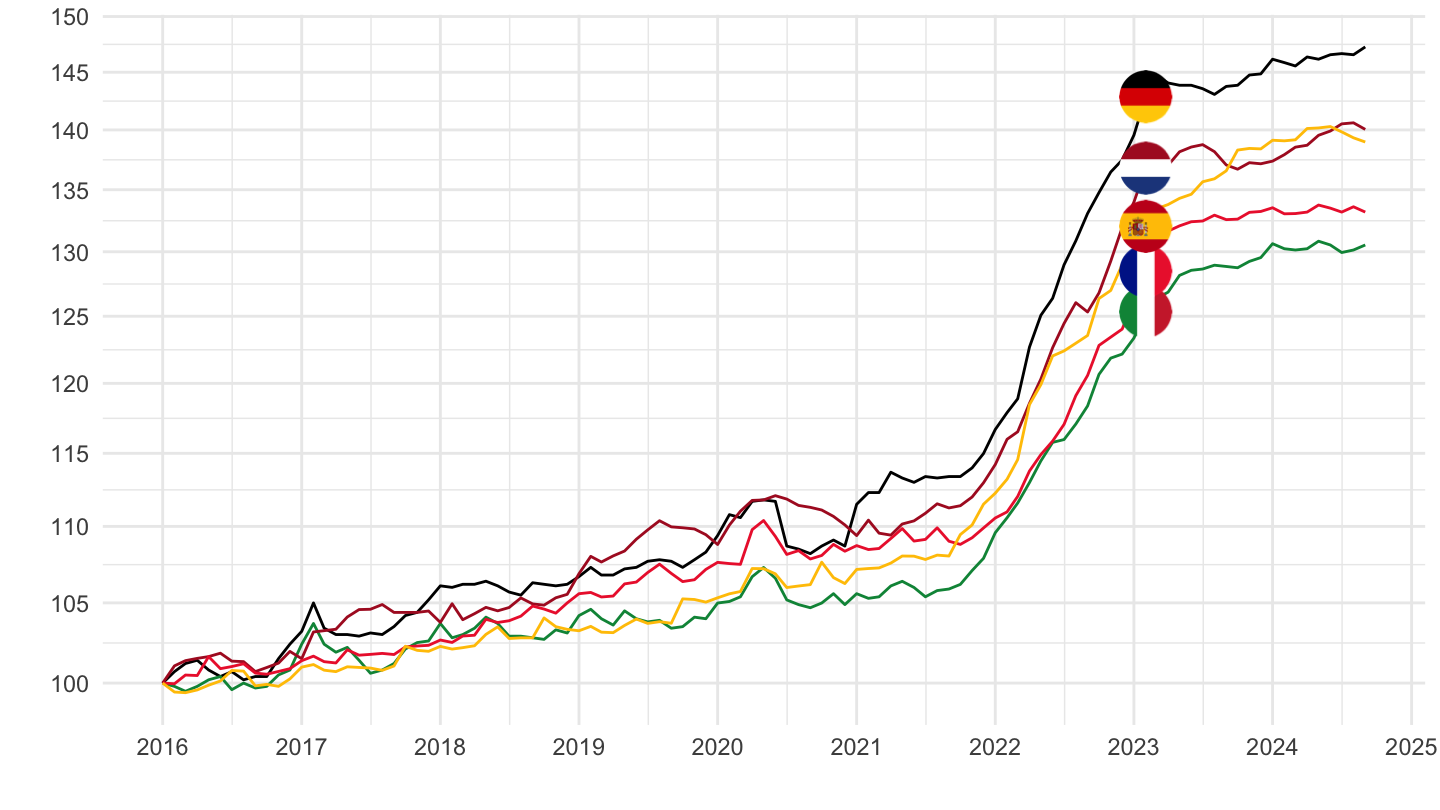
January 2017
Code
prc_hicp_midx %>%
  filter(unit == "I15",
         coicop %in% c("CP01"),
         geo %in% c("DE", "FR", "IT", "EA20", "ES")) %>%

  select(geo, Geo, coicop, time, values) %>%
  month_to_date %>%
  filter(date >= as.Date("2017-01-01")) %>%
  group_by(Geo) %>%
  arrange(date) %>%
  mutate(values = 100*values/values[1]) %>%
  add_colors %>%
  ggplot(.) + geom_line(aes(x = date, y = values, color = color)) +
  theme_minimal() + xlab("") + ylab("CP01 - Food") +
  scale_x_date(breaks = "6 months",
               labels = date_format("%b %Y")) +
  scale_y_log10(breaks = seq(0, 200, 5),
                labels = percent(seq(0, 200, 5)/100-1)) +
  scale_color_identity() + add_flags +
  theme(legend.position = "none",
        axis.text.x = element_text(angle = 45, vjust = 1, hjust = 1))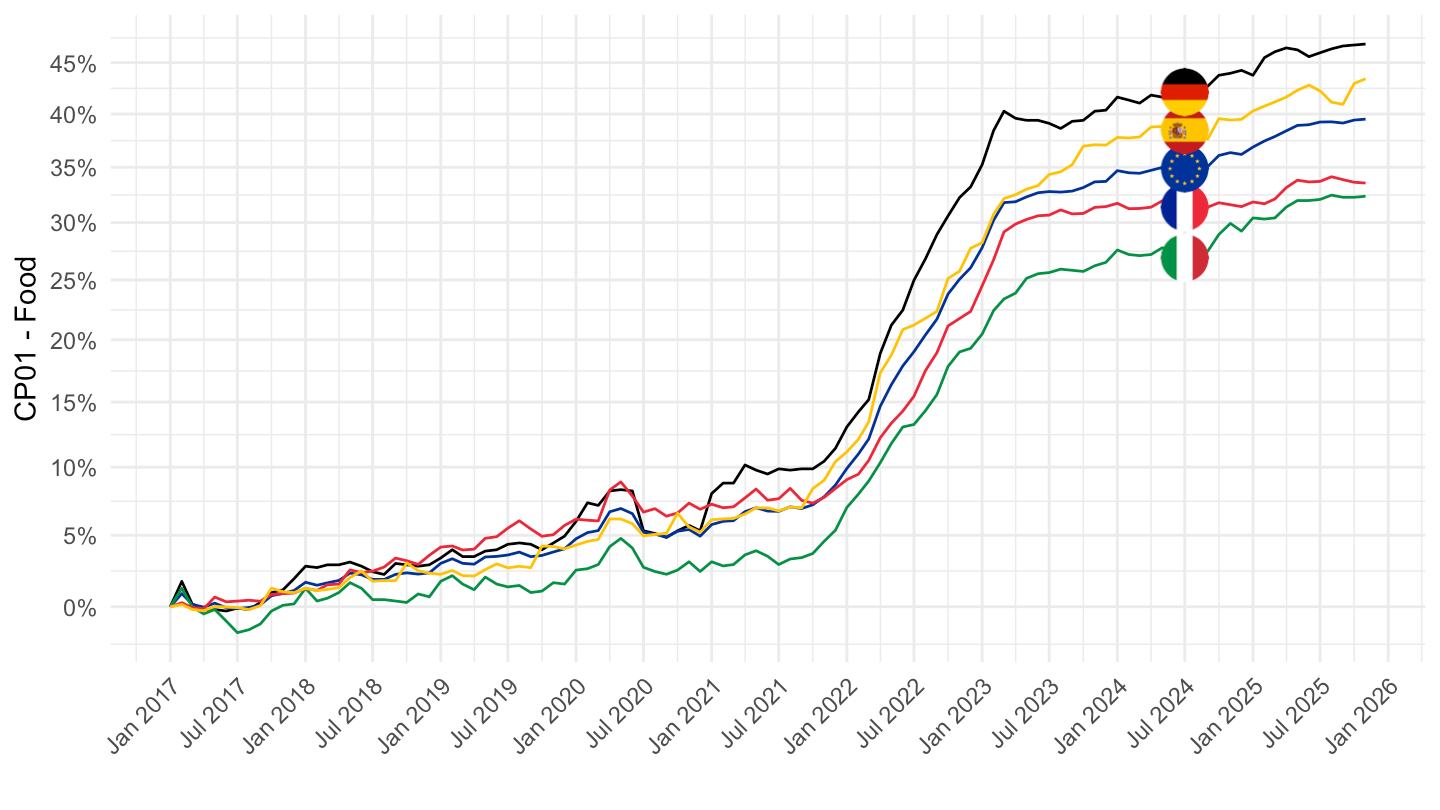
June 2017
Code
prc_hicp_midx %>%
  filter(unit == "I15",
         coicop %in% c("CP01"),
         geo %in% c("DE", "FR", "IT", "EA20", "ES")) %>%

  select(geo, Geo, coicop, time, values) %>%
  month_to_date %>%
  filter(date >= as.Date("2017-06-01")) %>%
  group_by(Geo) %>%
  arrange(date) %>%
  mutate(values = 100*values/values[1]) %>%
  add_colors %>%
  ggplot(.) + geom_line(aes(x = date, y = values, color = color)) +
  theme_minimal() + xlab("") + ylab("CP01 - Food") +
  scale_x_date(breaks = "6 months",
               labels = date_format("%b %Y")) +
  scale_y_log10(breaks = seq(0, 200, 5)) +
  scale_color_identity() + add_flags +
  theme(legend.position = "none",
        axis.text.x = element_text(angle = 45, vjust = 1, hjust = 1)) +
  geom_label_repel(data = . %>% filter(date == max(date)), aes(x = date, y = values, label = round(values, 1), color = color))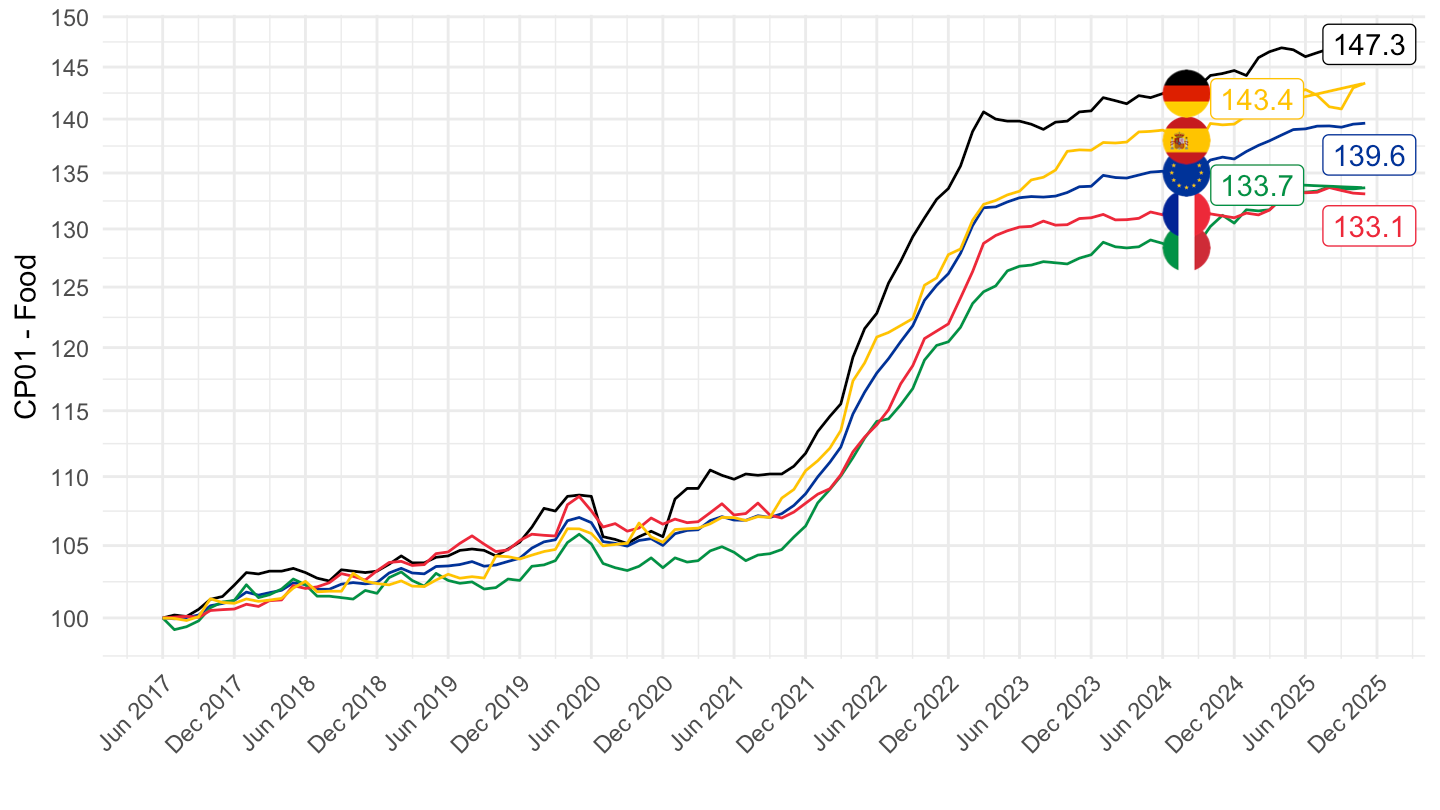
Avril 2017
Code
prc_hicp_midx %>%
  filter(unit == "I15",
         coicop %in% c("CP01"),
         geo %in% c("DE", "FR", "IT", "NL", "ES")) %>%

  select(geo, Geo, coicop, time, values) %>%
  month_to_date %>%
  filter(date >= as.Date("2017-04-01")) %>%
  group_by(Geo) %>%
  arrange(date) %>%
  mutate(values = 100*values/values[1]) %>%
  add_colors %>%
  ggplot(.) + geom_line(aes(x = date, y = values, color = color)) +
  theme_minimal() + xlab("") + ylab("Augmentation vs. Janvier 2017") +
  scale_x_date(breaks = "2 months",
               labels = date_format("%b %Y")) +
  scale_y_log10(breaks = seq(0, 200, 5),
                labels = percent(seq(0, 200, 5)/100-1)) +
  scale_color_identity() + add_flags +
  theme(legend.position = "none",
        axis.text.x = element_text(angle = 45, vjust = 1, hjust = 1))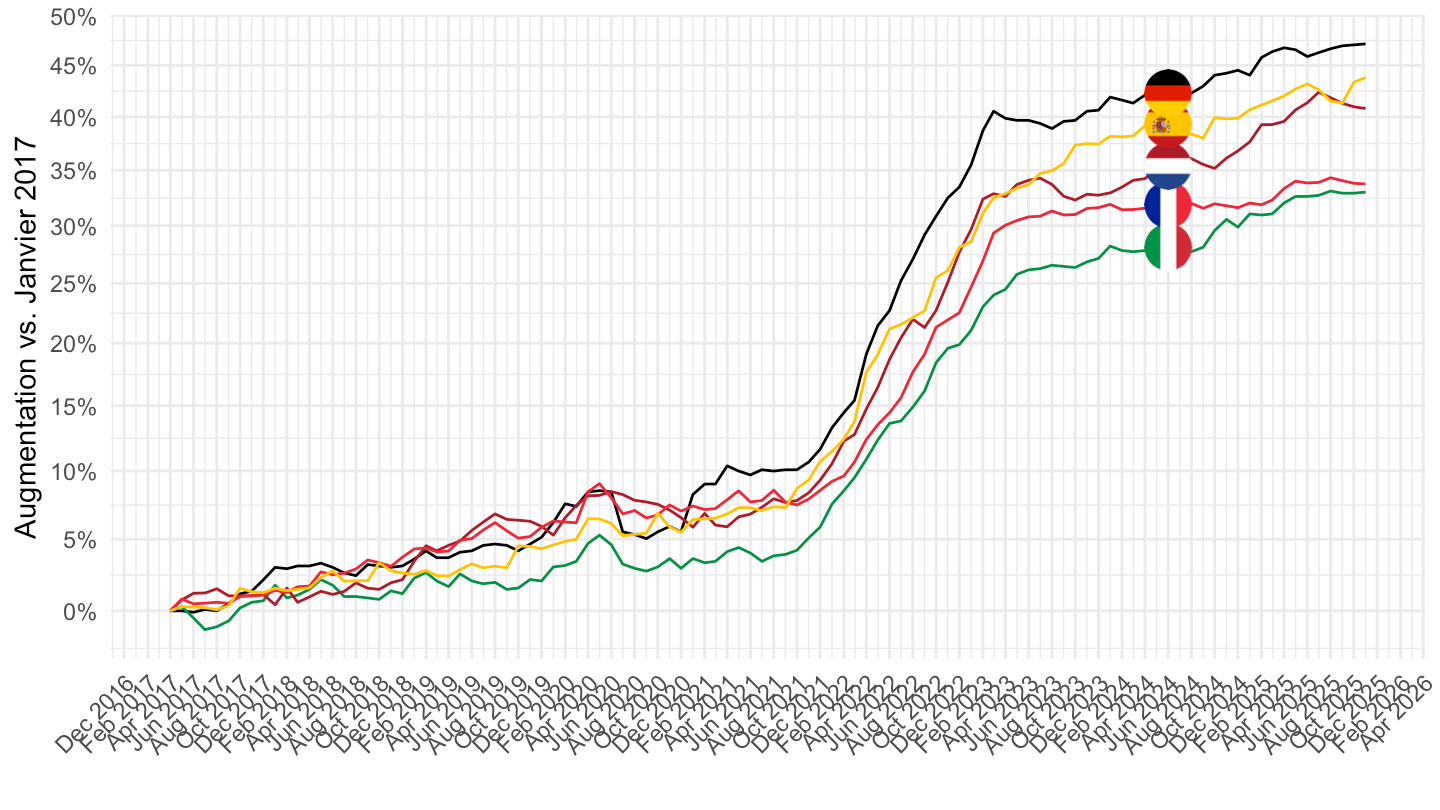
January 2021
Code
prc_hicp_midx %>%
  filter(unit == "I15",
         coicop %in% c("CP01"),
         geo %in% c("DE", "FR", "IT", "NL", "ES")) %>%

  select(geo, Geo, coicop, time, values) %>%
  month_to_date %>%
  filter(date >= as.Date("2021-01-01")) %>%
  group_by(Geo) %>%
  arrange(date) %>%
  mutate(values = 100*values/values[1]) %>%
  add_colors %>%
  ggplot(.) + geom_line(aes(x = date, y = values, color = color)) +
  theme_minimal() + xlab("") + ylab("Augmentation vs. Janvier 2021") +
  scale_x_date(breaks = "2 months",
               labels = date_format("%b %Y")) +
  scale_y_log10(breaks = seq(0, 200, 5),
                labels = percent(seq(0, 200, 5)/100-1)) +
  scale_color_identity() + add_flags +
  theme(legend.position = "none",
        axis.text.x = element_text(angle = 45, vjust = 1, hjust = 1))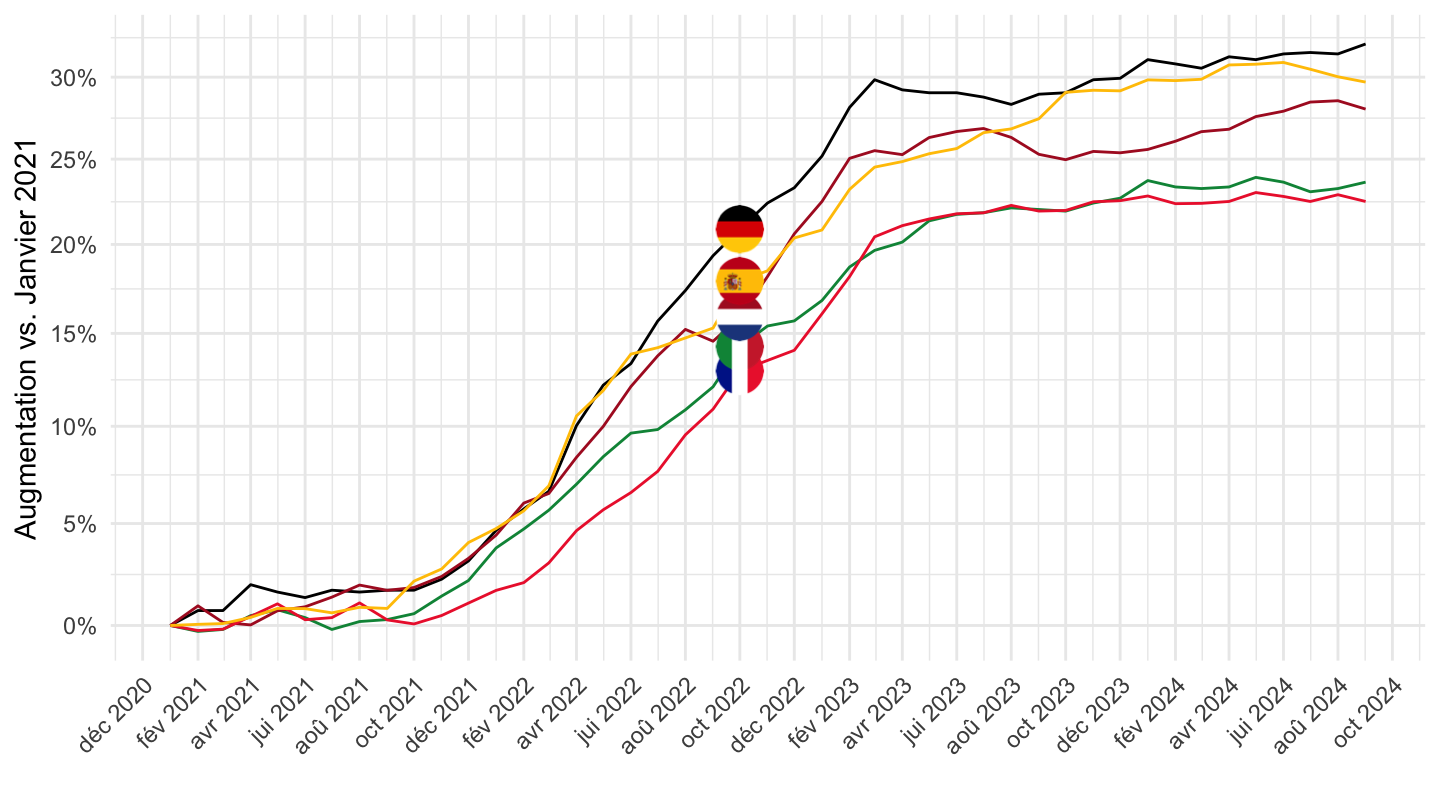
October 2021
Code
prc_hicp_midx %>%
  filter(unit == "I15",
         coicop %in% c("CP01"),
         geo %in% c("DE", "FR", "IT", "NL", "ES")) %>%

  select(geo, Geo, coicop, time, values) %>%
  month_to_date %>%
  filter(date >= as.Date("2021-10-01")) %>%
  group_by(Geo) %>%
  arrange(date) %>%
  mutate(values = 100*values/values[1]) %>%
  add_colors %>%
  ggplot(.) + geom_line(aes(x = date, y = values, color = color)) +
  theme_minimal() + xlab("") + ylab("Augmentation vs. Octobre 2021") +
  scale_x_date(breaks = "2 months",
               labels = date_format("%b %Y")) +
  scale_y_log10(breaks = seq(0, 200, 5),
                labels = percent(seq(0, 200, 5)/100-1)) +
  scale_color_identity() + add_flags +
  theme(legend.position = "none",
        axis.text.x = element_text(angle = 45, vjust = 1, hjust = 1))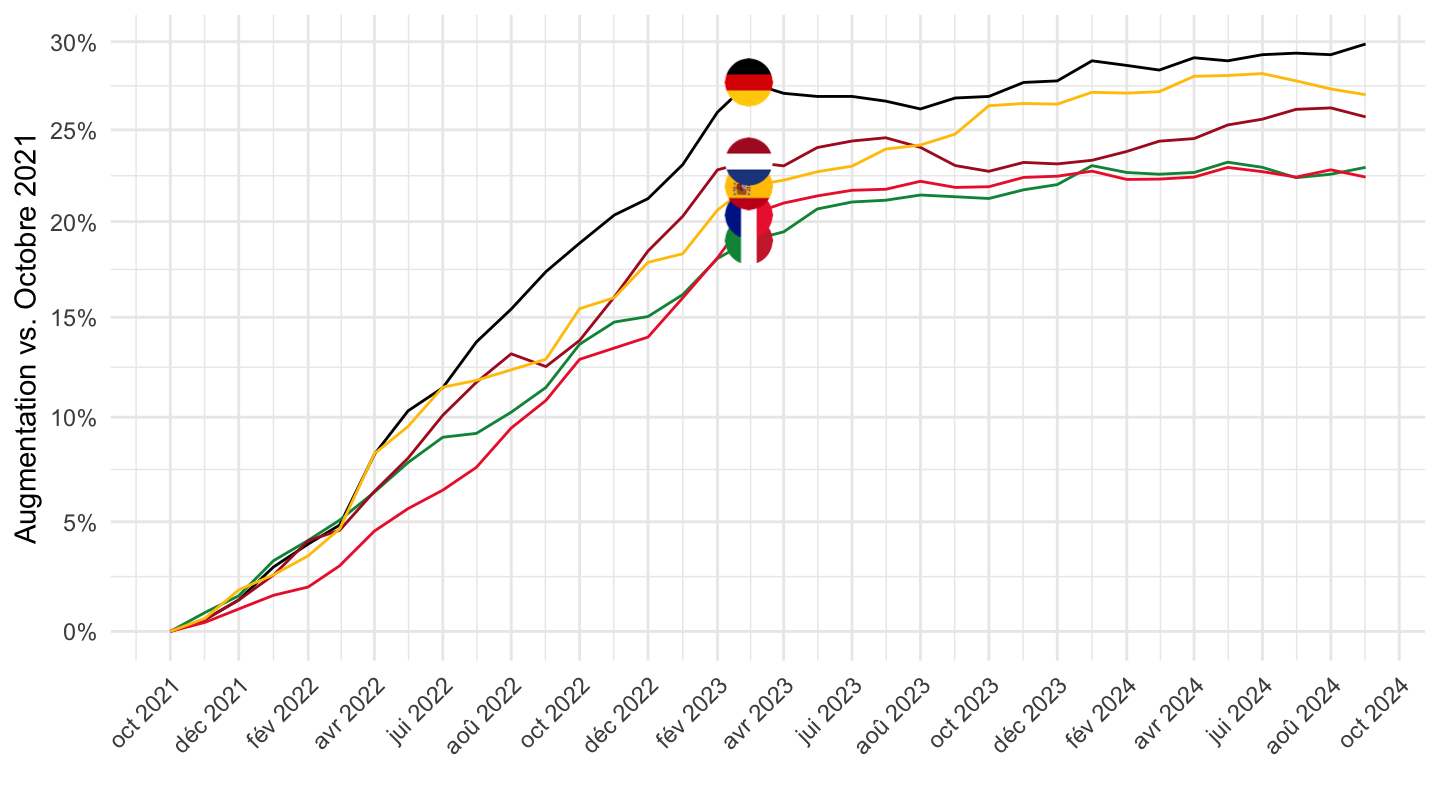
2 years
Code
prc_hicp_midx %>%
  filter(unit == "I15",
         coicop %in% c("CP01"),
         geo %in% c("DE", "FR", "IT", "NL", "ES")) %>%

  select(geo, Geo, coicop, time, values) %>%
  month_to_date %>%
  filter(date >= max(date) - years(2)) %>%
  arrange(date) %>%
  group_by(Geo) %>%
  mutate(values = 100*values/values[date == max(date) - years(2)]) %>%
  add_colors %>%
  ggplot(.) + geom_line(aes(x = date, y = values, color = color)) +
  theme_minimal() + xlab("") + ylab("") +
  scale_x_date(breaks = "1 month",
               labels = date_format("%b %Y")) +
  scale_y_log10(breaks = seq(0, 200, 5)) +
  scale_color_identity() + add_flags +
  theme(legend.position = "none",
        axis.text.x = element_text(angle = 45, vjust = 1, hjust = 1))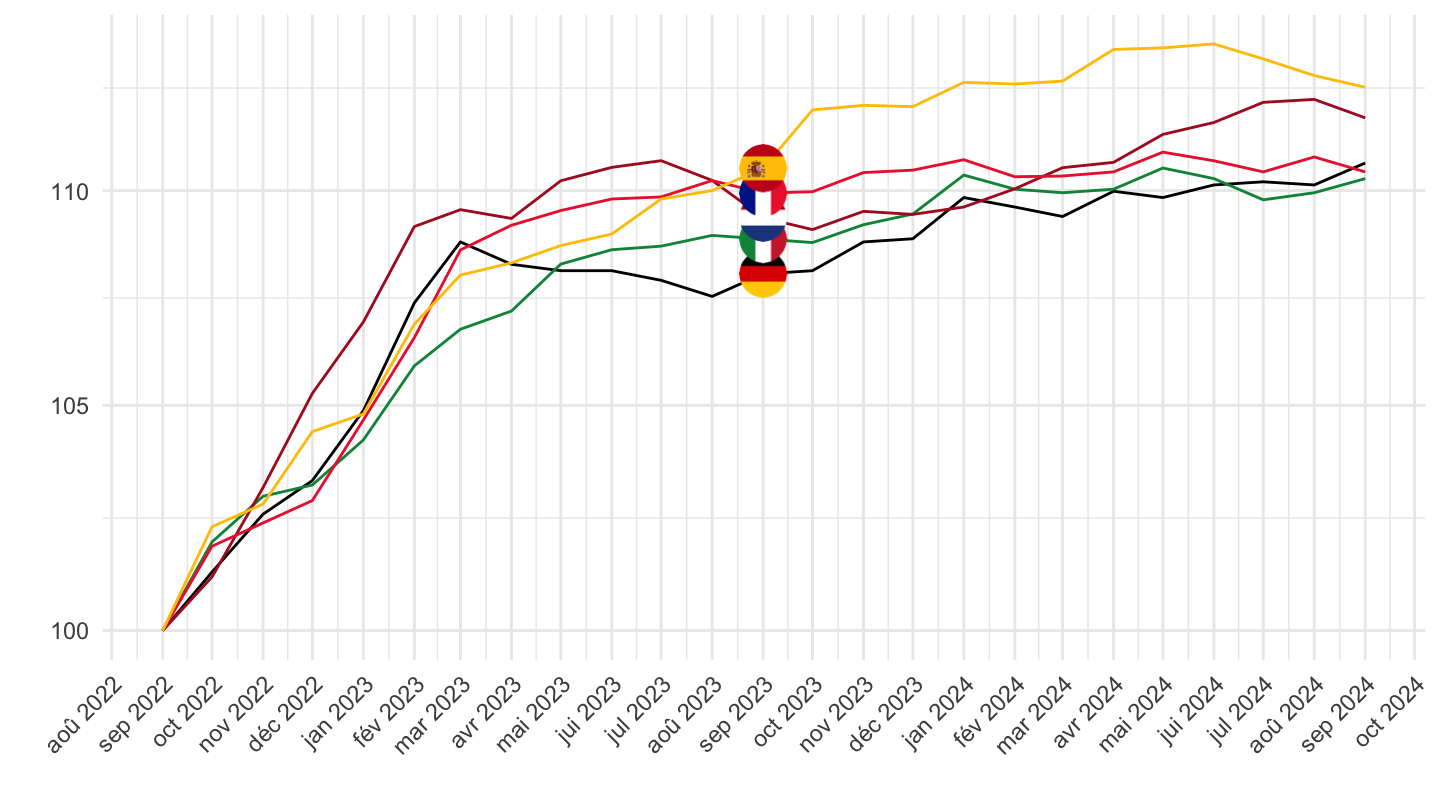
CP00 - All
2017T2-2024T2
Code
prc_hicp_midx %>%
  filter(unit == "I15",
         coicop %in% c("CP00"),
         geo %in% c("DE", "FR", "IT", "NL", "ES")) %>%

  select(geo, Geo, coicop, time, values) %>%
  month_to_date %>%
  filter(date >= as.Date("2017-05-01")) %>%
  group_by(Geo) %>%
  arrange(date) %>%
  mutate(values = 100*values/values[1]) %>%
  add_colors %>%
  ggplot(.) + geom_line(aes(x = date, y = values, color = color)) +
  theme_minimal() + xlab("") + ylab("Augmentation vs. Mai 2017") +
  scale_x_date(breaks = "2 months",
               labels = date_format("%b %Y")) +
  scale_y_log10(breaks = seq(0, 200, 2),
                labels = percent(seq(0, 200, 2)/100-1)) +
  scale_color_identity() + add_flags +
  theme(legend.position = "none",
        axis.text.x = element_text(angle = 45, vjust = 1, hjust = 1))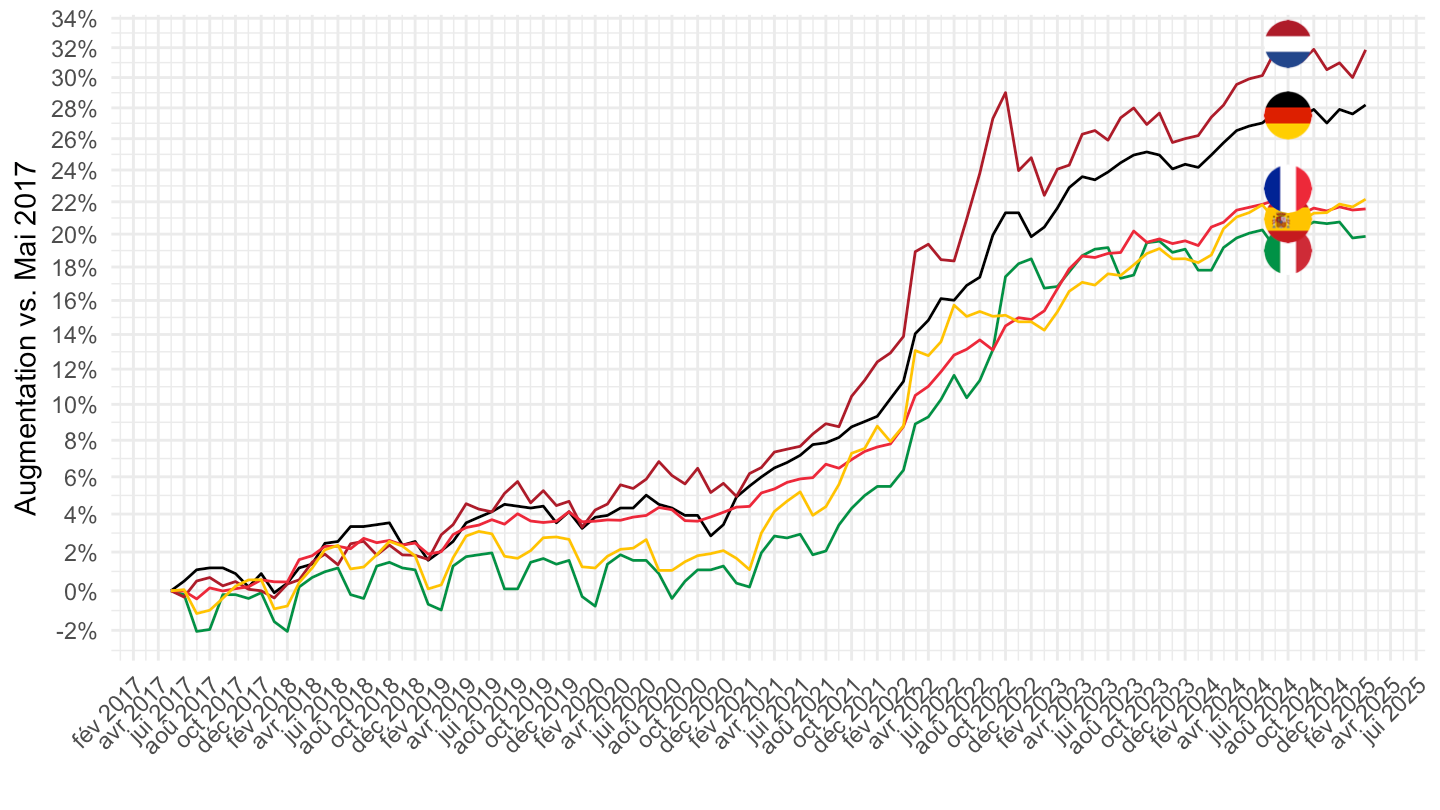
October 2021
Code
prc_hicp_midx %>%
  filter(unit == "I15",
         coicop %in% c("CP00"),
         geo %in% c("DE", "FR", "IT", "NL", "ES")) %>%

  select(geo, Geo, coicop, time, values) %>%
  month_to_date %>%
  filter(date >= as.Date("2021-10-01")) %>%
  group_by(Geo) %>%
  arrange(date) %>%
  mutate(values = 100*values/values[1]) %>%
  add_colors %>%
  ggplot(.) + geom_line(aes(x = date, y = values, color = color)) +
  theme_minimal() + xlab("") + ylab("Augmentation vs. Octobre 2021") +
  scale_x_date(breaks = "2 months",
               labels = date_format("%b %Y")) +
  scale_y_log10(breaks = seq(0, 200, 2),
                labels = percent(seq(0, 200, 2)/100-1)) +
  scale_color_identity() + add_flags +
  theme(legend.position = "none",
        axis.text.x = element_text(angle = 45, vjust = 1, hjust = 1))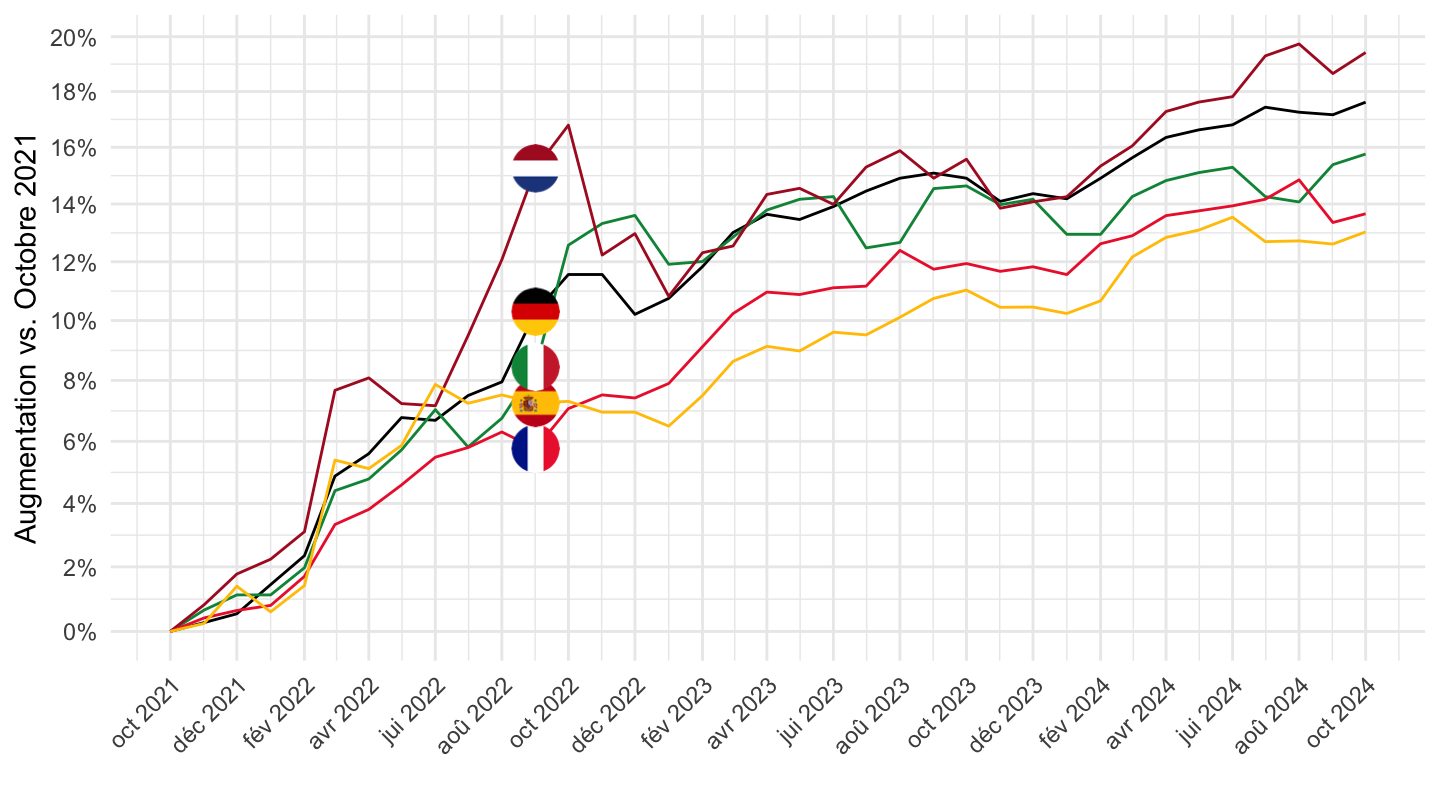
2 years
Code
prc_hicp_midx %>%
  filter(unit == "I15",
         coicop %in% c("CP00"),
         geo %in% c("DE", "FR", "IT", "NL", "ES")) %>%

  select(geo, Geo, coicop, time, values) %>%
  month_to_date %>%
  filter(date >= max(date) - years(2)) %>%
  group_by(Geo) %>%
  arrange(date) %>%
  mutate(values = 100*values/values[1]) %>%
  add_colors %>%
  ggplot(.) + geom_line(aes(x = date, y = values, color = color)) +
  theme_minimal() + xlab("") + ylab("") +
  scale_x_date(breaks = "3 months",
               labels = date_format("%b %Y")) +
  scale_y_log10(breaks = seq(0, 200, 2)) +
  scale_color_identity() + add_flags +
  theme(legend.position = "none")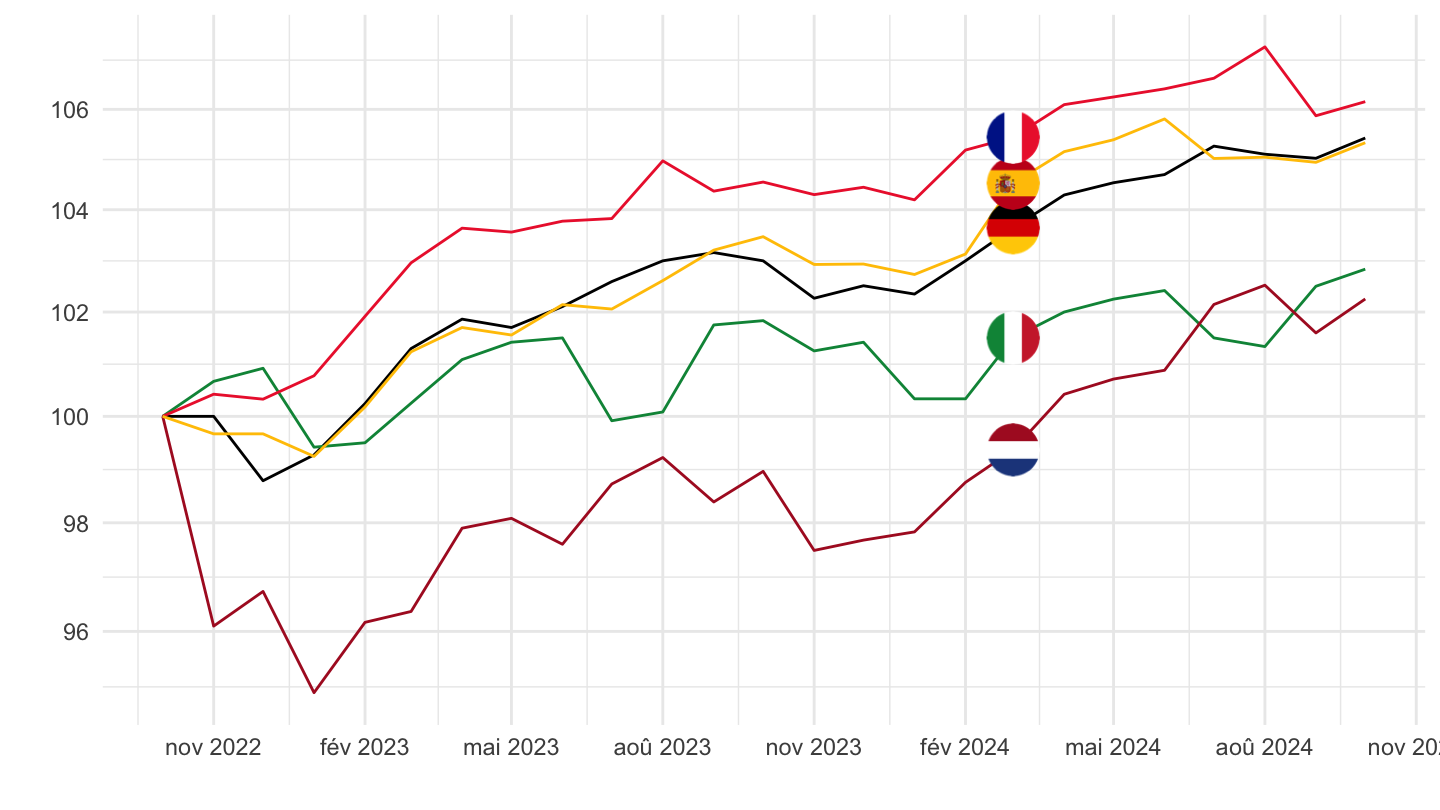
2 years
Code
prc_hicp_midx %>%
  filter(unit == "I15",
         coicop %in% c("CP00"),
         geo %in% c("DE", "FR", "IT", "EA", "UK")) %>%

  mutate(Geo = ifelse(geo == "EA", "Europe", Geo),
         Geo = ifelse(geo == "UK", "United Kingdom", Geo)) %>%
  select(geo, Geo, coicop, time, values) %>%
  month_to_date %>%
  arrange(date) %>%
  filter(date >= as.Date("2019-12-01"),
         date <= as.Date("2023-11-01")) %>%
  group_by(Geo) %>%
  arrange(date) %>%
  mutate(values = 100*values/values[1]) %>%
  add_colors %>%
  ggplot(.) + geom_line(aes(x = date, y = values, color = color)) +
  theme_minimal() + xlab("") + ylab("") +
  scale_x_date(breaks = "3 months",
               labels = date_format("%b %Y")) +
  scale_y_log10(breaks = seq(0, 200, 2)) +
  scale_color_identity() +
  theme(legend.position = "none")
CP07332 - International flights
1996-
Code
prc_hicp_midx %>%
  filter(unit == "I15",
         coicop %in% c("CP07332"),
         geo %in% c("FR")) %>%

  select(geo, Geo, coicop, time, values) %>%
  month_to_date %>%
  arrange(date) %>%
  group_by(Geo) %>%
  mutate(values = 100*values/values[1]) %>%
  add_colors %>%
  ggplot(.) + geom_line(aes(x = date, y = values)) +
  theme_minimal() + xlab("") + ylab("") +
  scale_x_date(breaks = seq(1960, 2100, 2) %>% paste0("-01-01") %>% as.Date,
               labels = date_format("%Y")) +
  scale_y_log10(breaks = seq(0, 1000, 5)) +
  scale_color_identity() + add_flags +
  theme(legend.position = "none")
2015-
Code
prc_hicp_midx %>%
  filter(unit == "I15",
         coicop %in% c("CP07332"),
         geo %in% c("DE", "FR", "IT", "NL", "ES")) %>%

  select(geo, Geo, coicop, time, values) %>%
  month_to_date %>%
  filter(date >= as.Date("2016-01-01")) %>%
  arrange(date) %>%
  group_by(Geo) %>%
  mutate(values = 100*values/values[date == as.Date("2016-01-01")]) %>%
  add_colors %>%
  ggplot(.) + geom_line(aes(x = date, y = values, color = color)) +
  theme_minimal() + xlab("") + ylab("") +
  scale_x_date(breaks = seq(1960, 2100, 2) %>% paste0("-01-01") %>% as.Date,
               labels = date_format("%Y")) +
  scale_y_log10(breaks = seq(0, 200, 5)) +
  scale_color_identity() + add_flags +
  theme(legend.position = "none")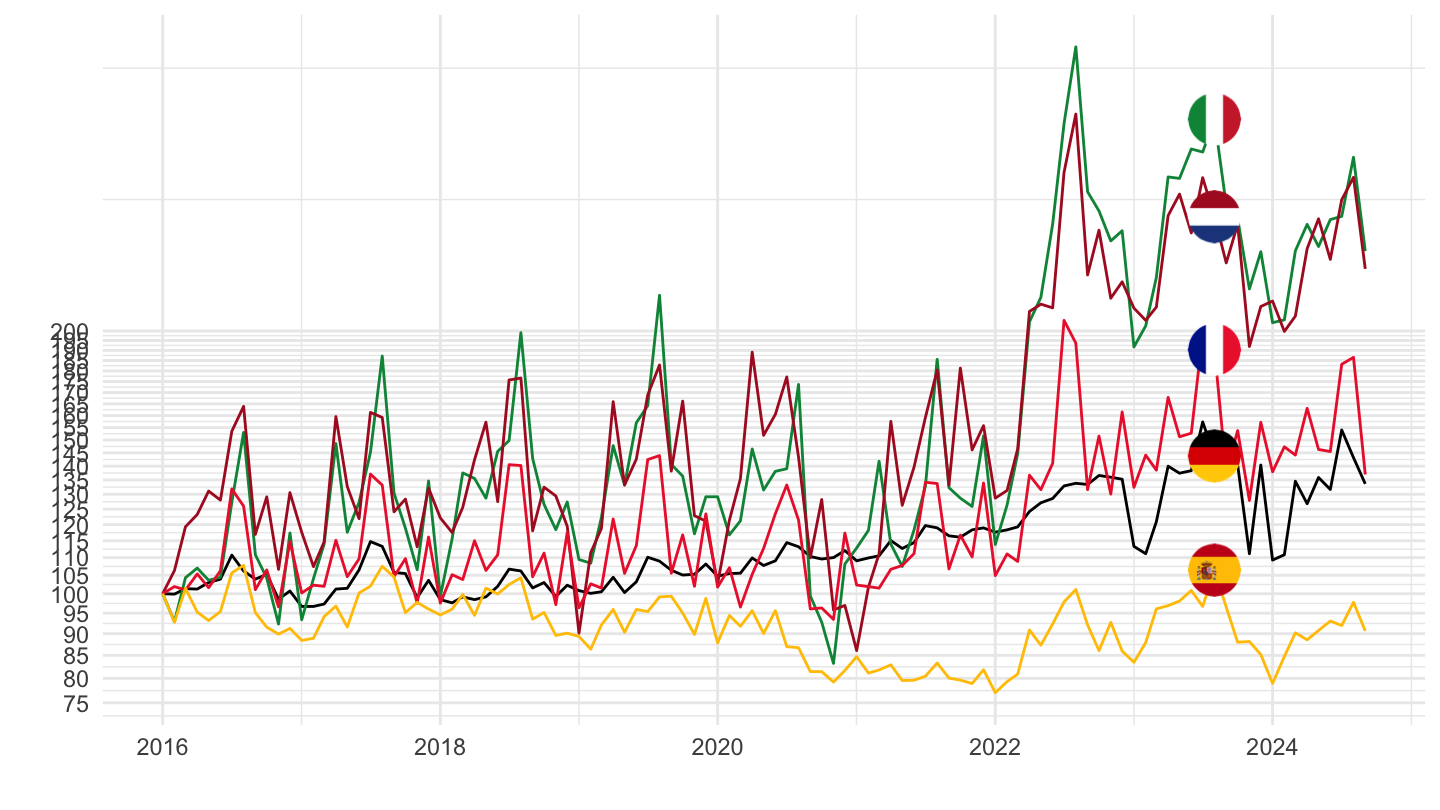
2017-
Code
prc_hicp_midx %>%
  filter(unit == "I15",
         coicop %in% c("CP07332"),
         geo %in% c("DE", "FR", "IT", "NL", "ES")) %>%

  select(geo, Geo, coicop, time, values) %>%
  month_to_date %>%
  filter(date >= as.Date("2016-01-01")) %>%
  arrange(date) %>%
  group_by(Geo) %>%
  mutate(values = 100*values/values[date == as.Date("2016-01-01")]) %>%
  add_colors %>%
  ggplot(.) + geom_line(aes(x = date, y = values, color = color)) +
  theme_minimal() + xlab("") + ylab("") +
  scale_x_date(breaks = seq(1960, 2100, 2) %>% paste0("-01-01") %>% as.Date,
               labels = date_format("%Y")) +
  scale_y_log10(breaks = seq(0, 200, 5)) +
  scale_color_identity() + add_flags +
  theme(legend.position = "none")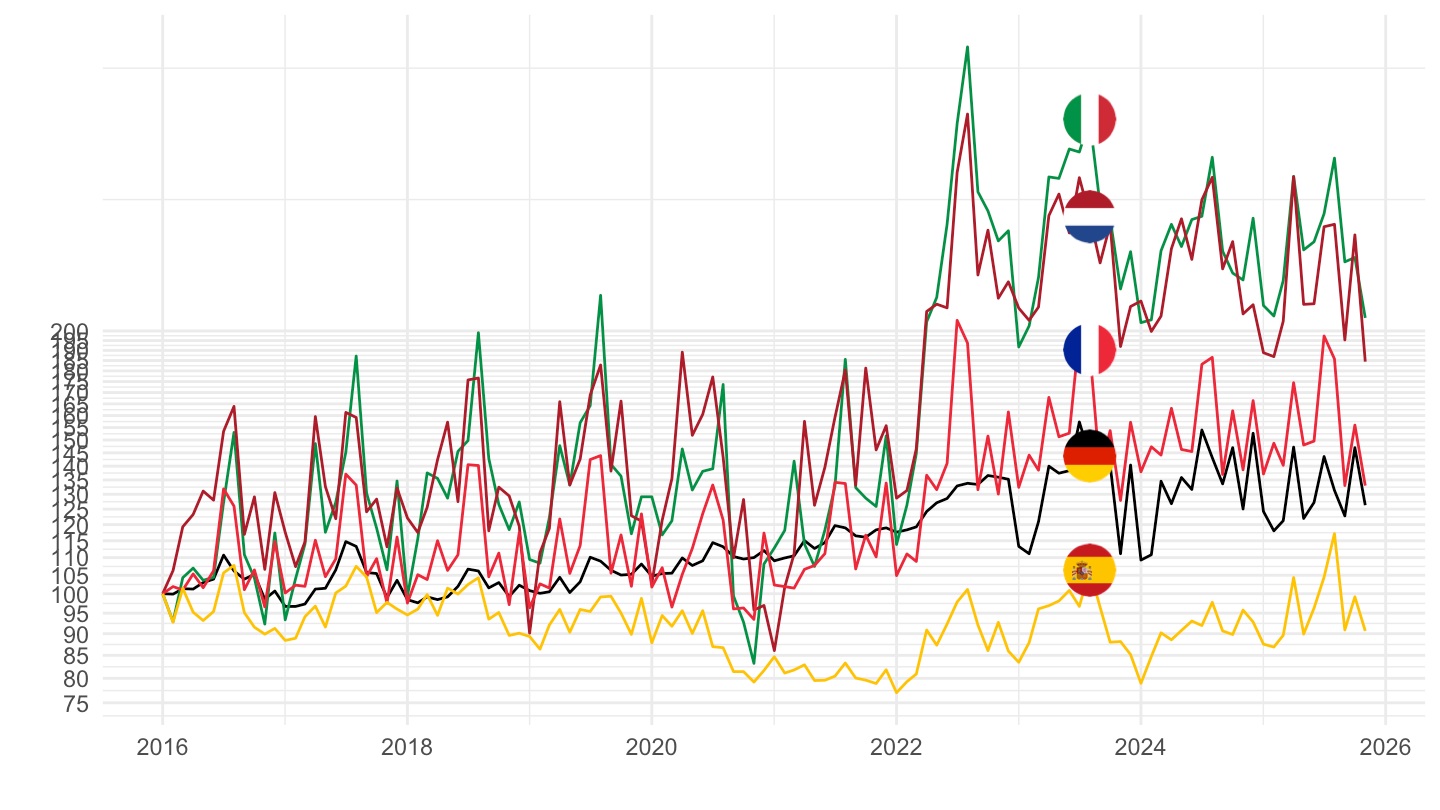
CP022 - Tobacco
All
Code
prc_hicp_midx %>%
  filter(unit == "I15",
         coicop %in% c("CP022"),
         geo %in% c("DE", "FR", "IT", "ES")) %>%

  mutate(Geo = ifelse(geo == "EU", "Europe", Geo)) %>%
  select(geo, Geo, coicop, time, values) %>%
  month_to_date %>%
  group_by(Geo) %>%
  mutate(values = 100*values/values[date == as.Date("1996-01-01")]) %>%
  add_colors %>%
  ggplot(.) + geom_line(aes(x = date, y = values, color = color)) +
  theme_minimal() + xlab("") + ylab("") +
  scale_x_date(breaks = seq(1960, 2100, 2) %>% paste0("-01-01") %>% as.Date,
               labels = date_format("%Y")) +
  scale_y_log10(breaks = seq(0, 10000, 50)) +
  scale_color_identity() + add_flags +
  theme(legend.position = "none")
2017-
Code
prc_hicp_midx %>%
  filter(unit == "I15",
         coicop %in% c("CP022"),
         geo %in% c("DE", "FR", "IT", "NL", "ES")) %>%

  select(geo, Geo, coicop, time, values) %>%
  month_to_date %>%
  filter(date >= as.Date("2017-01-01")) %>%
  group_by(Geo) %>%
  mutate(values = 100*values/values[date == as.Date("2017-01-01")]) %>%
  add_colors %>%
  ggplot(.) + geom_line(aes(x = date, y = values, color = color)) +
  theme_minimal() + xlab("") + ylab("") +
  scale_x_date(breaks = seq(1960, 2100, 1) %>% paste0("-01-01") %>% as.Date,
               labels = date_format("%Y")) +
  scale_y_log10(breaks = seq(0, 10000, 50)) +
  scale_color_identity() + add_flags +
  theme(legend.position = "none")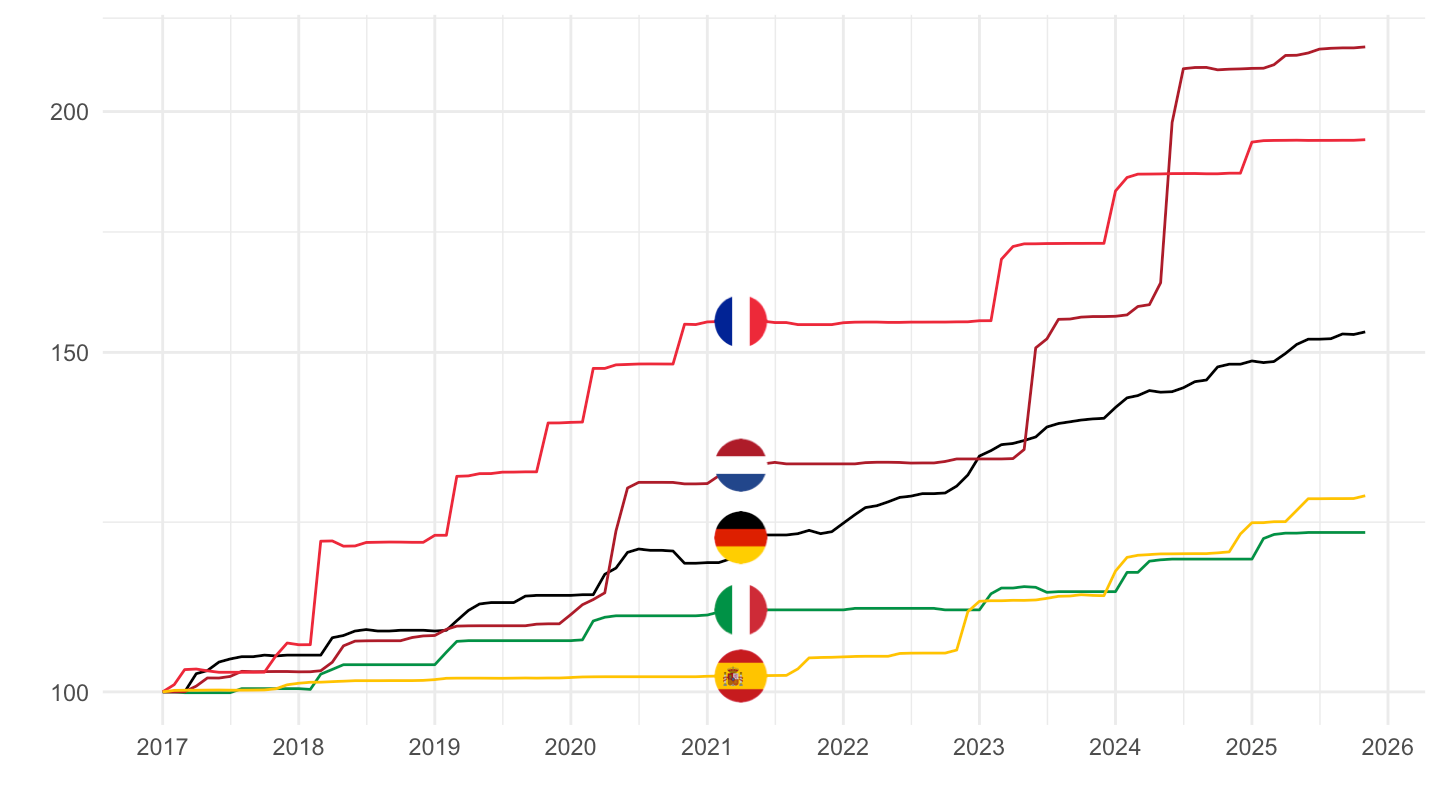
CP03 - Clothing and footwear
All
Code
prc_hicp_midx %>%
  filter(unit == "I15",
         coicop %in% c("CP03"),
         geo %in% c("DE", "FR", "IT", "NL", "ES")) %>%

  select(geo, Geo, coicop, time, values) %>%
  month_to_date %>%
  group_by(Geo) %>%
  mutate(values = 100*values/values[date == as.Date("1996-01-01")]) %>%
  add_colors %>%
  ggplot(.) + geom_line(aes(x = date, y = values, color = color)) +
  theme_minimal() + xlab("") + ylab("") +
  scale_x_date(breaks = seq(1960, 2100, 2) %>% paste0("-01-01") %>% as.Date,
               labels = date_format("%Y")) +
  scale_y_log10(breaks = seq(0, 200, 5)) +
  scale_color_identity() + add_flags +
  theme(legend.position = "none")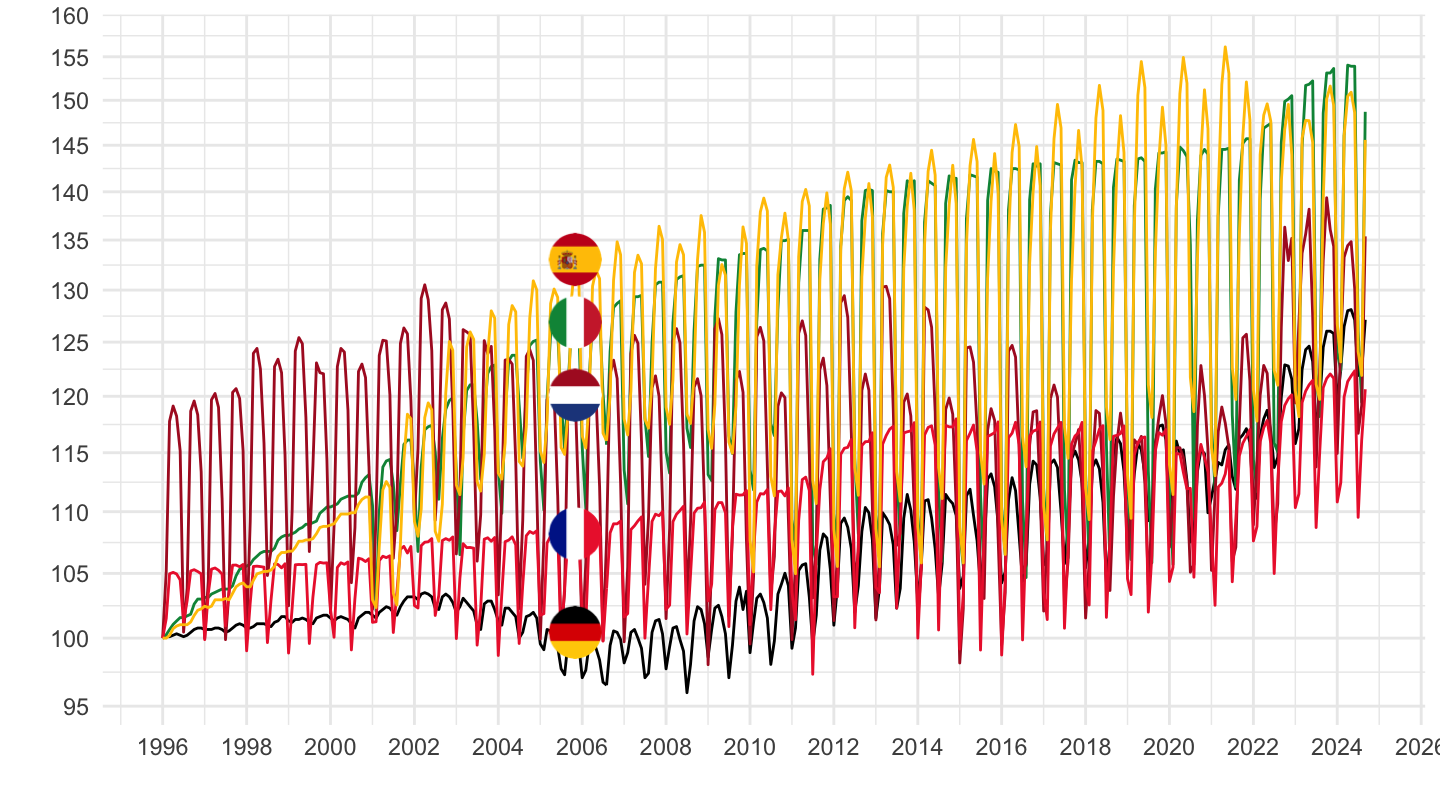
2017-
Code
prc_hicp_midx %>%
  filter(unit == "I15",
         coicop %in% c("CP03"),
         geo %in% c("DE", "FR", "IT", "NL", "ES")) %>%

  select(geo, Geo, coicop, time, values) %>%
  month_to_date %>%
  group_by(Geo) %>%
  filter(date >= as.Date("2017-01-01")) %>%
  mutate(values = 100*values/values[date == as.Date("2017-01-01")]) %>%
  add_colors %>%
  ggplot(.) + geom_line(aes(x = date, y = values, color = color)) +
  theme_minimal() + xlab("") + ylab("") +
  scale_x_date(breaks = seq(1960, 2100, 1) %>% paste0("-01-01") %>% as.Date,
               labels = date_format("%Y")) +
  scale_y_log10(breaks = seq(0, 200, 5)) +
  scale_color_identity() + add_flags +
  theme(legend.position = "none")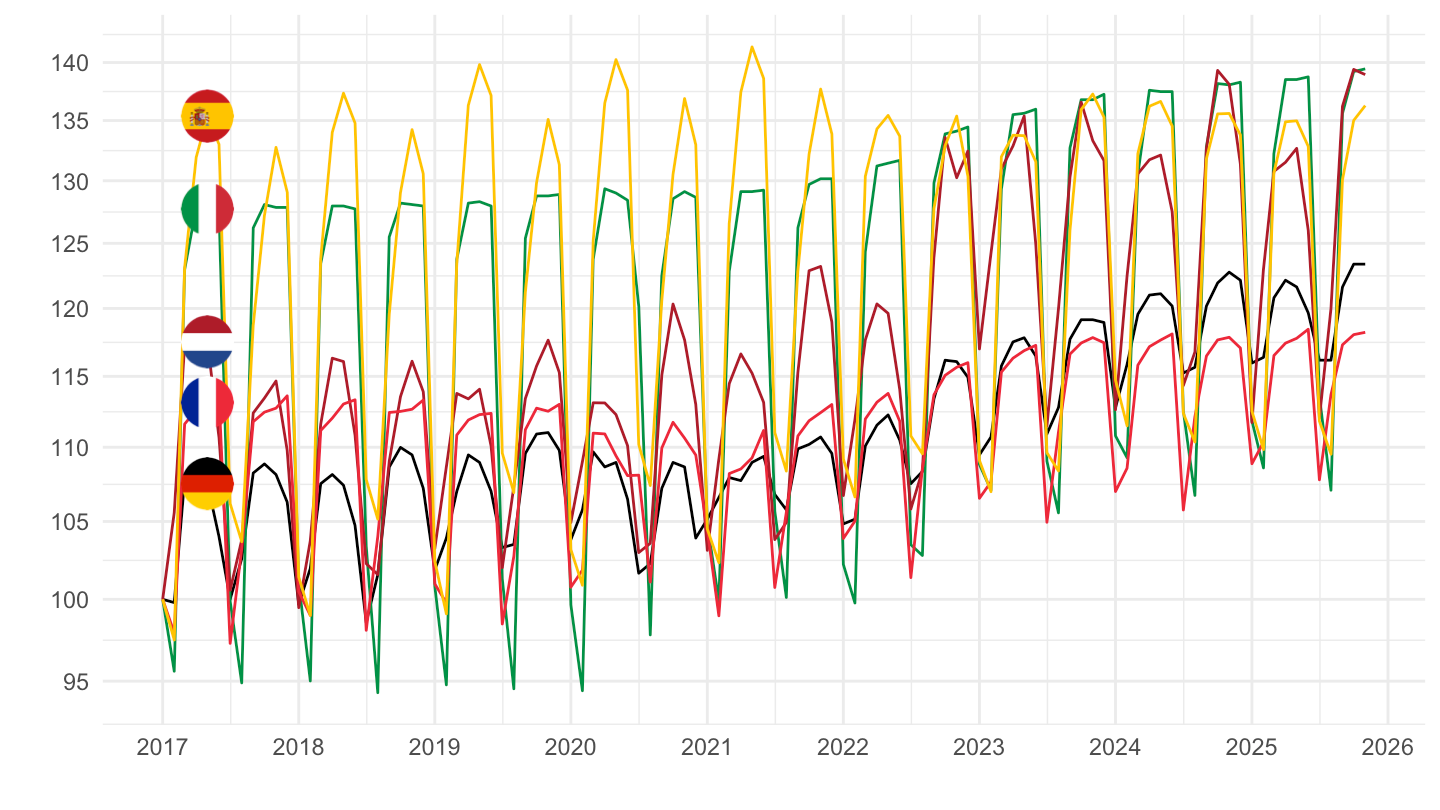
Non energy industrial goods
1996-
Code
prc_hicp_midx %>%
  filter(unit == "I15",
         coicop %in% c("IGD_NNRG"),
         geo %in% c("DE", "FR", "IT", "NL", "ES")) %>%

  select(geo, Geo, coicop, time, values) %>%
  month_to_date %>%
  group_by(Geo) %>%
  arrange(date) %>%
  mutate(values = 100*values/values[1]) %>%
  add_colors %>%
  ggplot(.) + geom_line(aes(x = date, y = values, color = color)) +
  theme_minimal() + xlab("") + ylab("") +
  scale_x_date(breaks = seq(1960, 2100, 2) %>% paste0("-01-01") %>% as.Date,
               labels = date_format("%Y")) +
  scale_y_log10(breaks = seq(0, 200, 5)) +
  scale_color_identity() + add_flags +
  theme(legend.position = "none")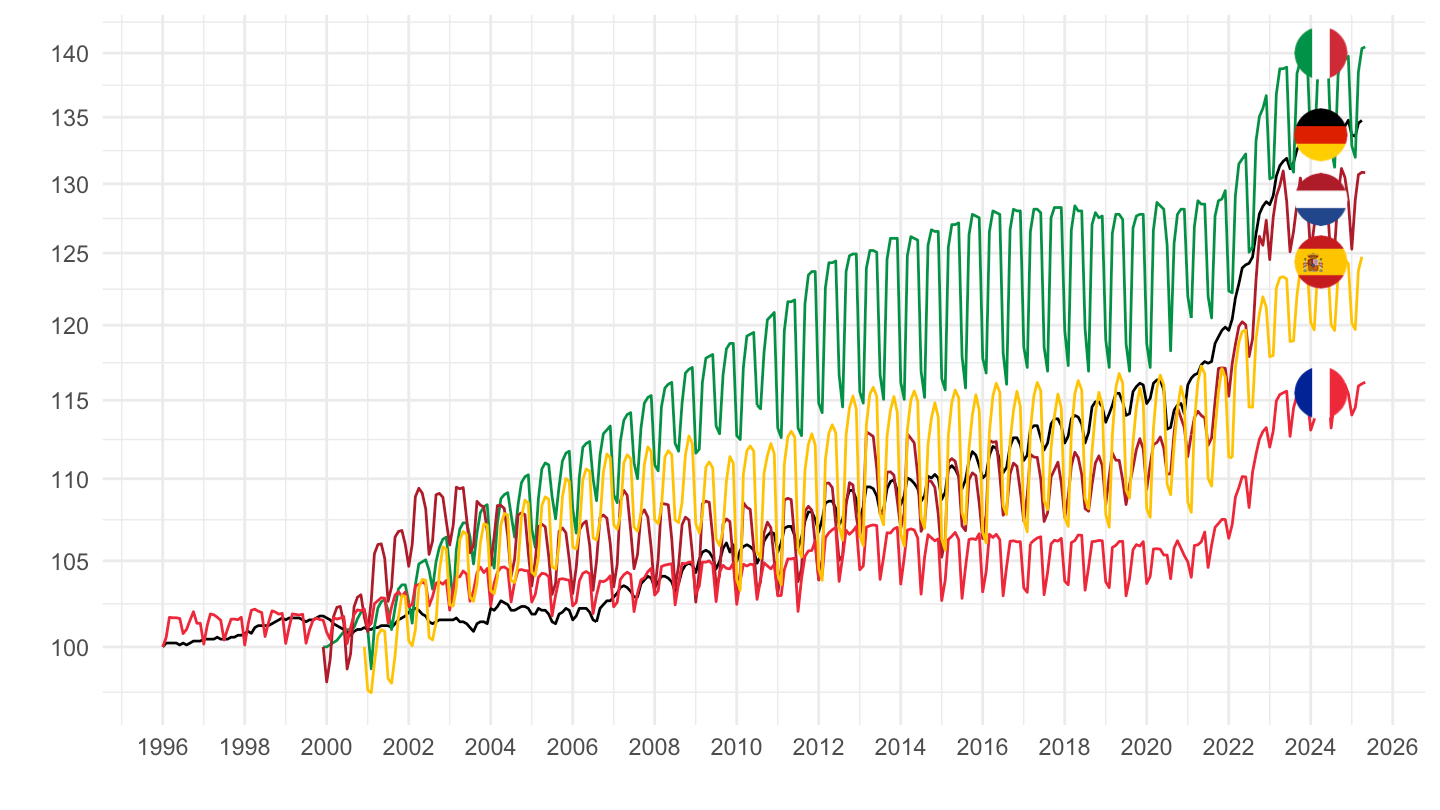
2000-
Code
prc_hicp_midx %>%
  filter(unit == "I15",
         coicop %in% c("IGD_NNRG"),
         geo %in% c("DE", "FR", "IT", "NL", "ES")) %>%

  select(geo, Geo, coicop, time, values) %>%
  month_to_date %>%
  group_by(Geo) %>%
  arrange(date) %>%
  filter(date >= as.Date("2000-01-01")) %>%
  mutate(values = 100*values/values[1]) %>%
  add_colors %>%
  ggplot(.) + geom_line(aes(x = date, y = values, color = color)) +
  theme_minimal() + xlab("") + ylab("IGD_NNRG - Non-energy industrial goods") +
  scale_x_date(breaks = seq(1960, 2100, 2) %>% paste0("-01-01") %>% as.Date,
               labels = date_format("%Y")) +
  scale_y_log10(breaks = seq(0, 200, 5)) +
  scale_color_identity() + add_flags +
  theme(legend.position = "none")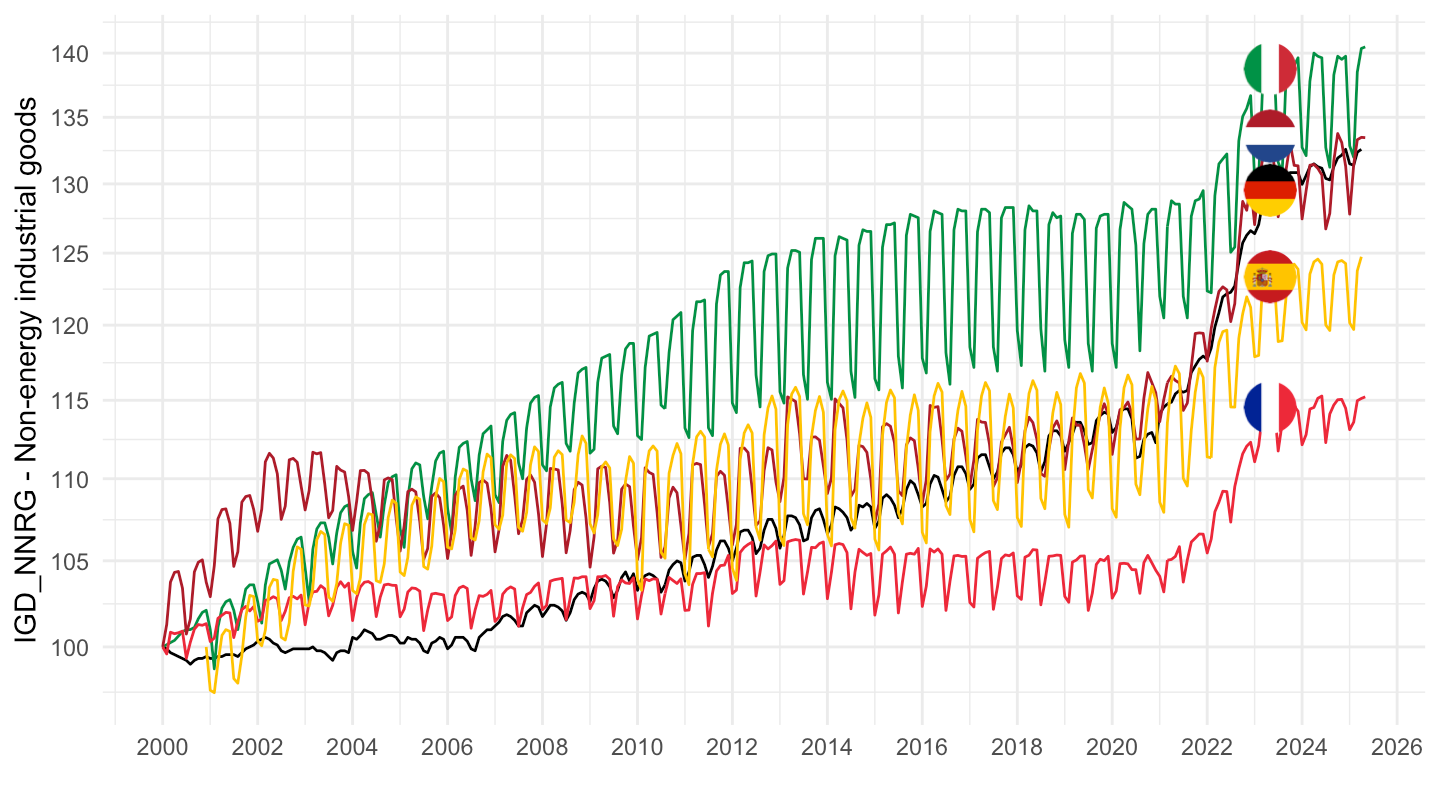
2017-
Code
prc_hicp_midx %>%
  filter(unit == "I15",
         coicop %in% c("IGD_NNRG"),
         geo %in% c("DE", "FR", "IT", "NL", "ES")) %>%

  select(geo, Geo, coicop, time, values) %>%
  month_to_date %>%
  group_by(Geo) %>%
  arrange(date) %>%
  filter(date >= as.Date("2000-01-01")) %>%
  mutate(values = 100*values/values[1]) %>%
  add_colors %>%
  ggplot(.) + geom_line(aes(x = date, y = values, color = color)) +
  theme_minimal() + xlab("") + ylab("IGD_NNRG - Non-energy industrial goods") +
  scale_x_date(breaks = seq(1960, 2100, 2) %>% paste0("-01-01") %>% as.Date,
               labels = date_format("%Y")) +
  scale_y_log10(breaks = seq(0, 200, 5)) +
  scale_color_identity() + add_flags +
  theme(legend.position = "none")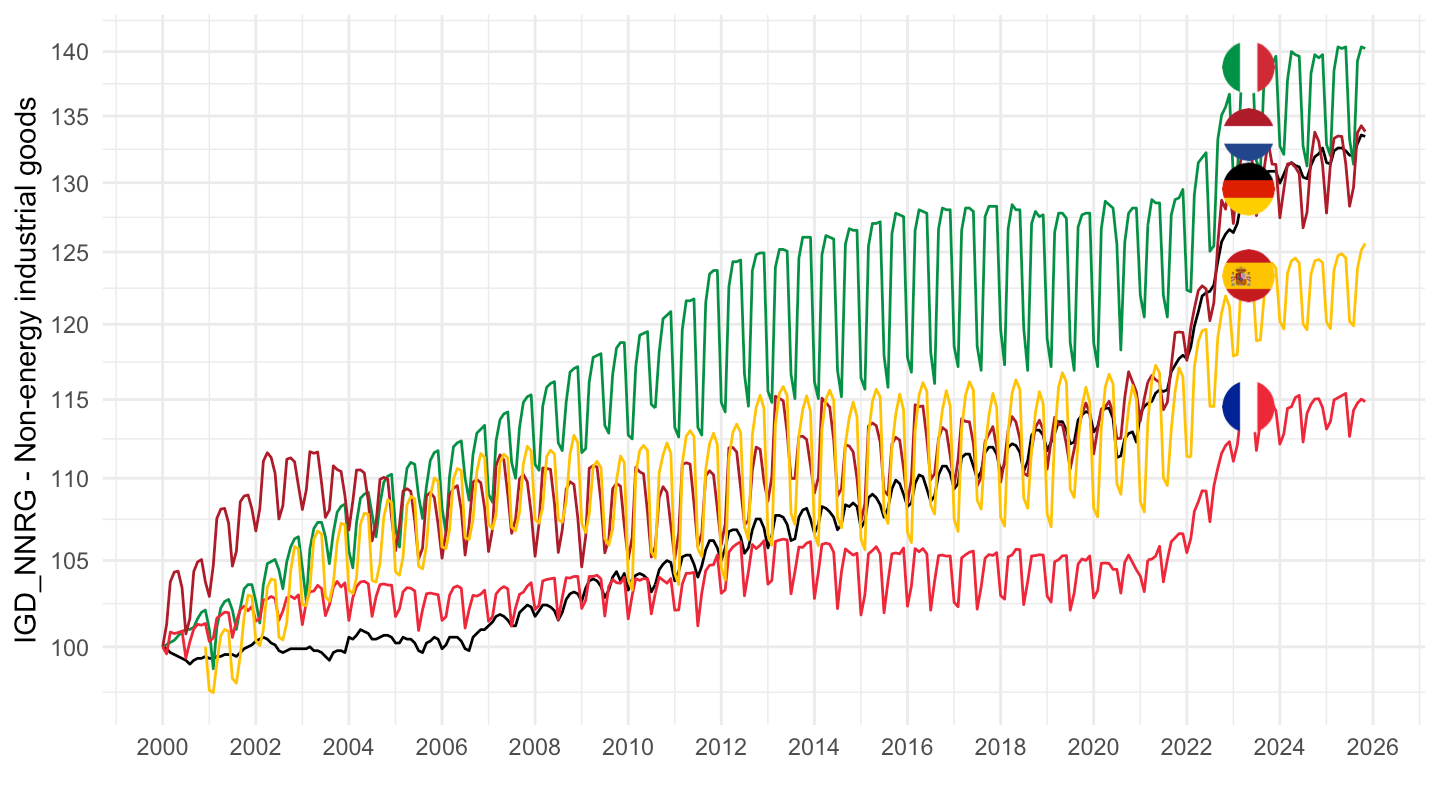
Non-energy industrial goods, semi-durables only
1996–
Code
prc_hicp_midx %>%
  filter(unit == "I15",
         coicop %in% c("IGD_NNRG_SD"),
         geo %in% c("DE", "FR", "IT", "NL", "ES")) %>%

  select(geo, Geo, coicop, time, values) %>%
  month_to_date %>%
  group_by(Geo) %>%
  arrange(date) %>%
  filter(date >= as.Date("1996-01-01")) %>%
  mutate(values = 100*values/values[1]) %>%
  add_colors %>%
  ggplot(.) + geom_line(aes(x = date, y = values, color = color)) +
  theme_minimal() + xlab("") + ylab("IGD_NNRG_SD - Non-energy industrial goods, semi-durables only") +
  scale_x_date(breaks = seq(1960, 2100, 2) %>% paste0("-01-01") %>% as.Date,
               labels = date_format("%Y")) +
  scale_y_log10(breaks = seq(0, 200, 5)) +
  scale_color_identity() + add_flags +
  theme(legend.position = "none")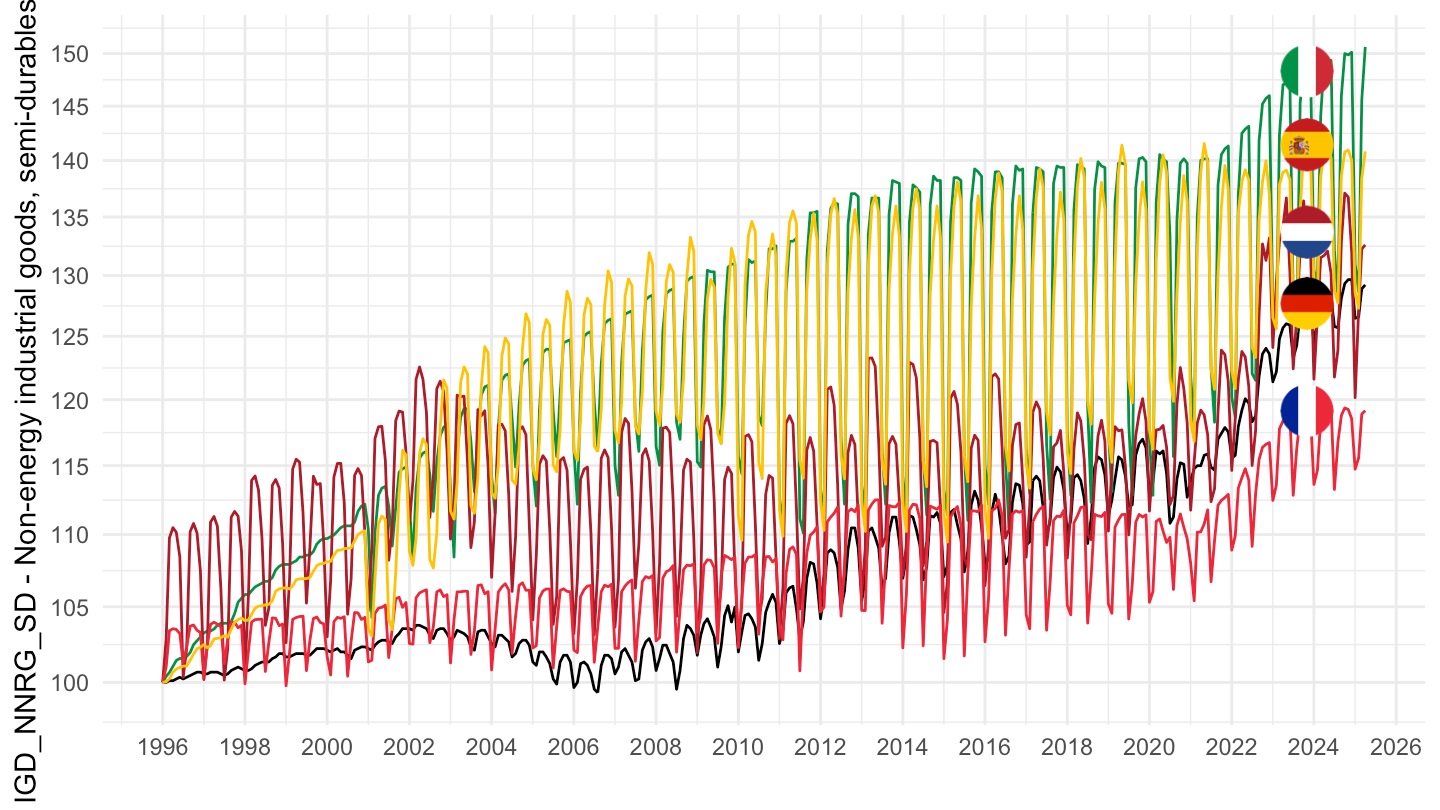
2000-
Code
prc_hicp_midx %>%
  filter(unit == "I15",
         coicop %in% c("IGD_NNRG_SD"),
         geo %in% c("DE", "FR", "IT", "NL", "ES")) %>%

  select(geo, Geo, coicop, time, values) %>%
  month_to_date %>%
  group_by(Geo) %>%
  arrange(date) %>%
  filter(date >= as.Date("2000-01-01")) %>%
  mutate(values = 100*values/values[1]) %>%
  add_colors %>%
  ggplot(.) + geom_line(aes(x = date, y = values, color = color)) +
  theme_minimal() + xlab("") + ylab("IGD_NNRG_SD - Non-energy industrial goods, semi-durables only") +
  scale_x_date(breaks = seq(1960, 2100, 2) %>% paste0("-01-01") %>% as.Date,
               labels = date_format("%Y")) +
  scale_y_log10(breaks = seq(0, 200, 5)) +
  scale_color_identity() + add_flags +
  theme(legend.position = "none")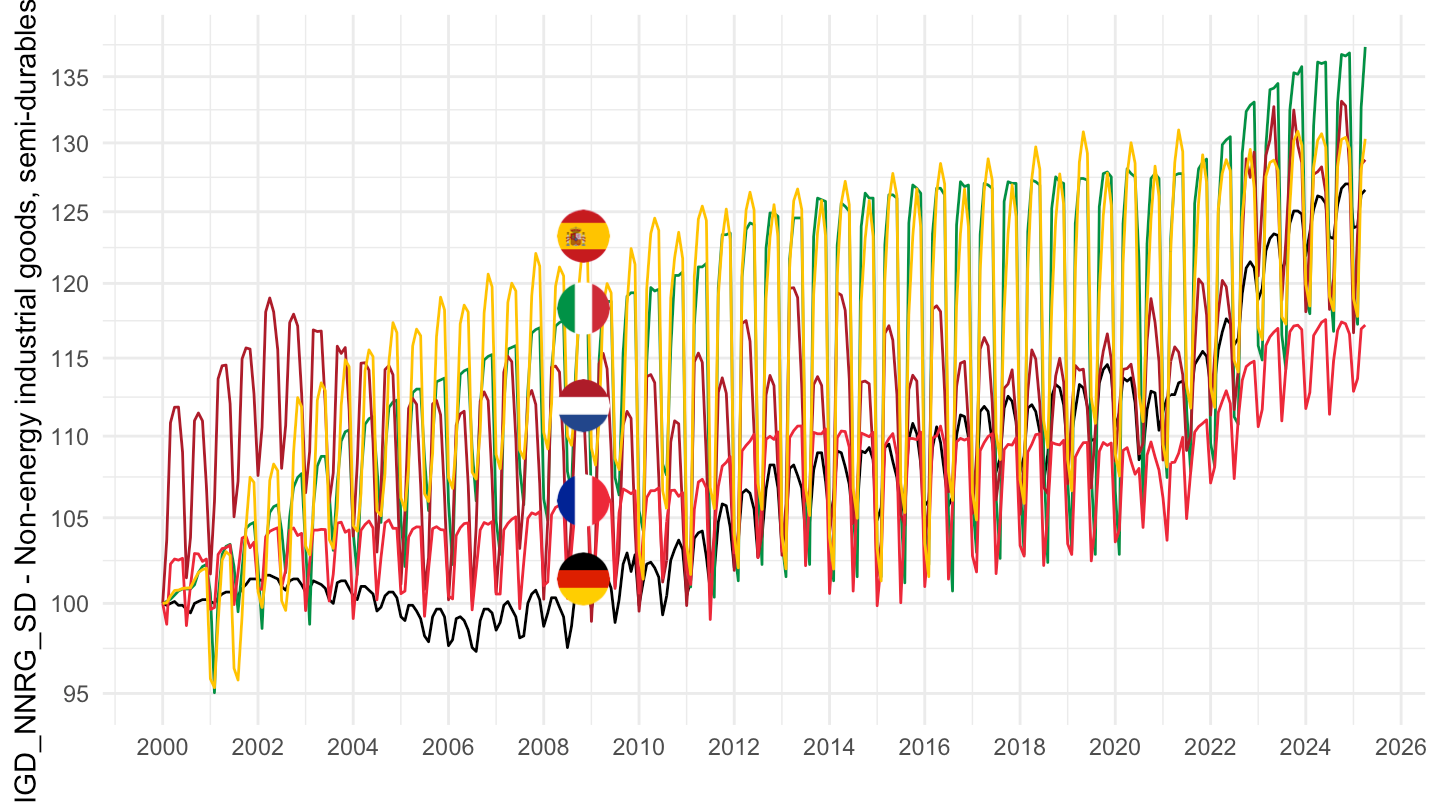
2017-
Code
prc_hicp_midx %>%
  filter(unit == "I15",
         coicop %in% c("IGD_NNRG_SD"),
         geo %in% c("DE", "FR", "IT", "NL", "ES")) %>%

  select(geo, Geo, coicop, time, values) %>%
  month_to_date %>%
  group_by(Geo) %>%
  arrange(date) %>%
  filter(date >= as.Date("2017-01-01")) %>%
  mutate(values = 100*values/values[1]) %>%
  add_colors %>%
  ggplot(.) + geom_line(aes(x = date, y = values, color = color)) +
  theme_minimal() + xlab("") + ylab("IGD_NNRG_SD - Non-energy industrial goods, semi-durables only") +
  scale_x_date(breaks = seq(1960, 2100, 1) %>% paste0("-01-01") %>% as.Date,
               labels = date_format("%Y")) +
  scale_y_log10(breaks = seq(0, 200, 5)) +
  scale_color_identity() + add_flags +
  theme(legend.position = "none")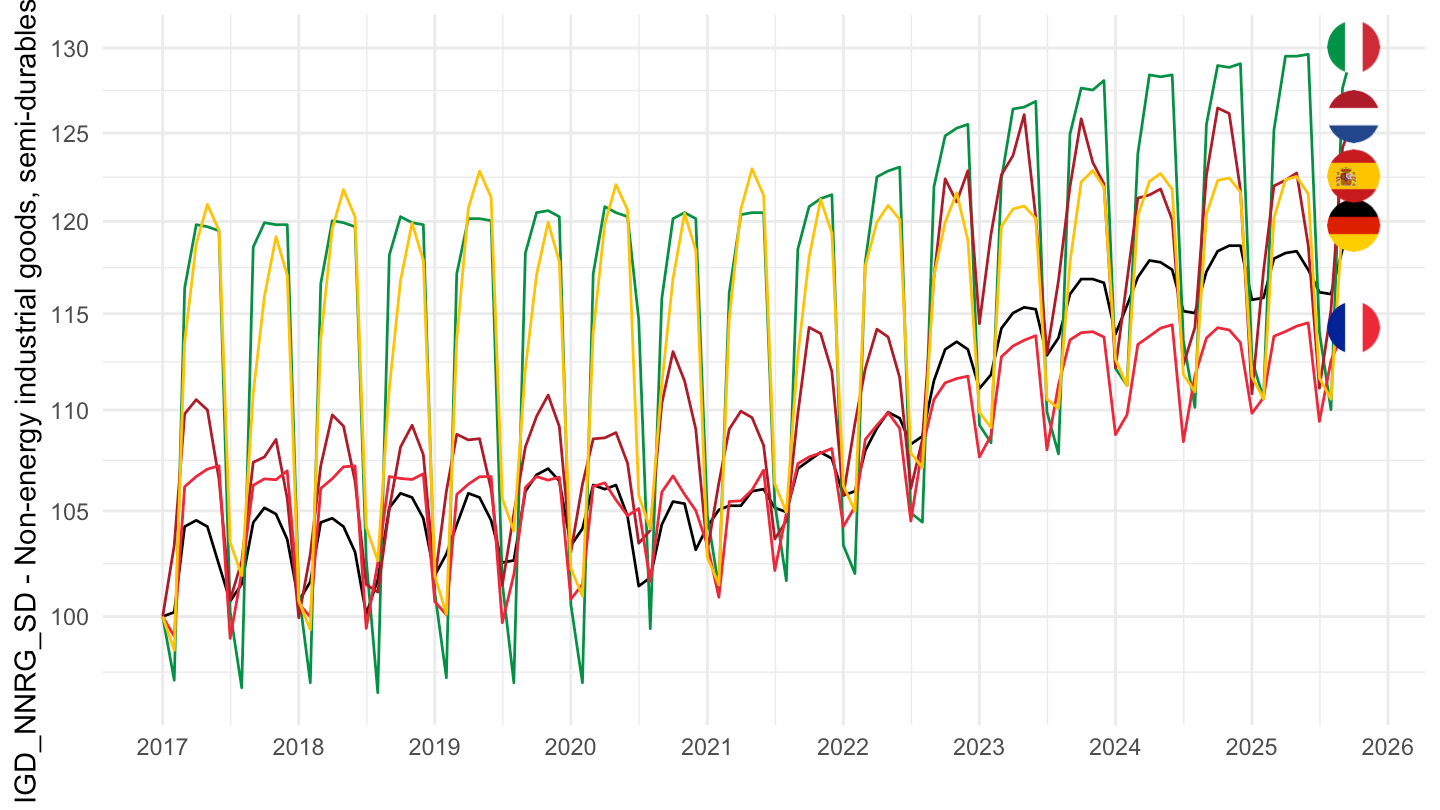
Non-energy industrial goods, durables only
1996–
Code
prc_hicp_midx %>%
  filter(unit == "I15",
         coicop %in% c("IGD_NNRG_D"),
         geo %in% c("DE", "FR", "IT", "NL", "ES")) %>%

  select(geo, Geo, coicop, time, values) %>%
  month_to_date %>%
  group_by(Geo) %>%
  arrange(date) %>%
  filter(date >= as.Date("1996-01-01")) %>%
  mutate(values = 100*values/values[1]) %>%
  add_colors %>%
  ggplot(.) + geom_line(aes(x = date, y = values, color = color)) +
  theme_minimal() + xlab("") + ylab("IGD_NNRG_D - Non-energy industrial goods\n durables only") +
  scale_x_date(breaks = seq(1960, 2100, 2) %>% paste0("-01-01") %>% as.Date,
               labels = date_format("%Y")) +
  scale_y_log10(breaks = seq(0, 200, 5)) +
  scale_color_identity() + add_flags +
  theme(legend.position = "none")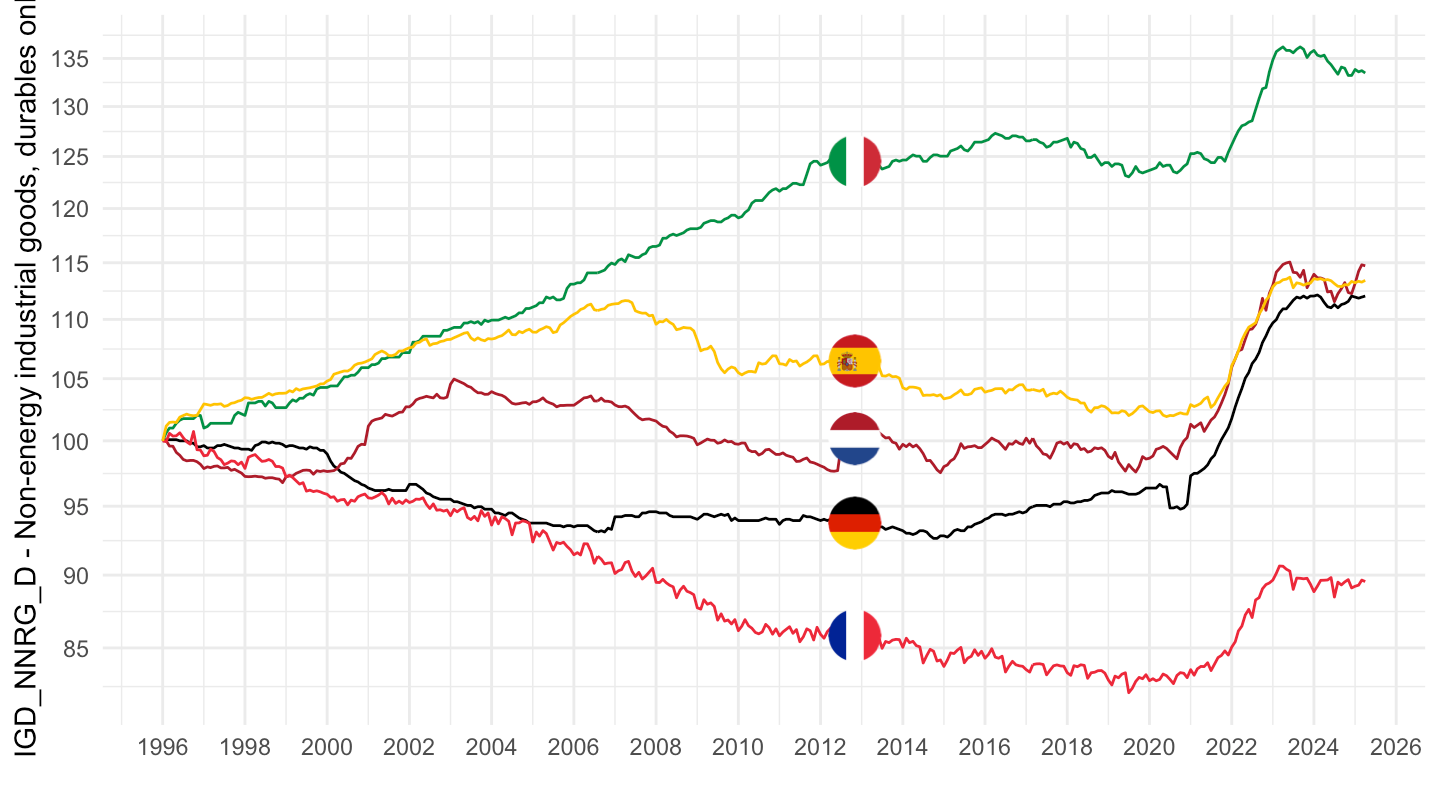
2000-
Code
prc_hicp_midx %>%
  filter(unit == "I15",
         coicop %in% c("IGD_NNRG_D"),
         geo %in% c("DE", "FR", "IT", "NL", "ES")) %>%

  select(geo, Geo, coicop, time, values) %>%
  month_to_date %>%
  group_by(Geo) %>%
  arrange(date) %>%
  filter(date >= as.Date("2000-01-01")) %>%
  mutate(values = 100*values/values[1]) %>%
  add_colors %>%
  ggplot(.) + geom_line(aes(x = date, y = values, color = color)) +
  theme_minimal() + xlab("") + ylab("IGD_NNRG_D - Non-energy industrial goods, durables only") +
  scale_x_date(breaks = seq(1960, 2100, 2) %>% paste0("-01-01") %>% as.Date,
               labels = date_format("%Y")) +
  scale_y_log10(breaks = seq(0, 200, 5)) +
  scale_color_identity() + add_flags +
  theme(legend.position = "none")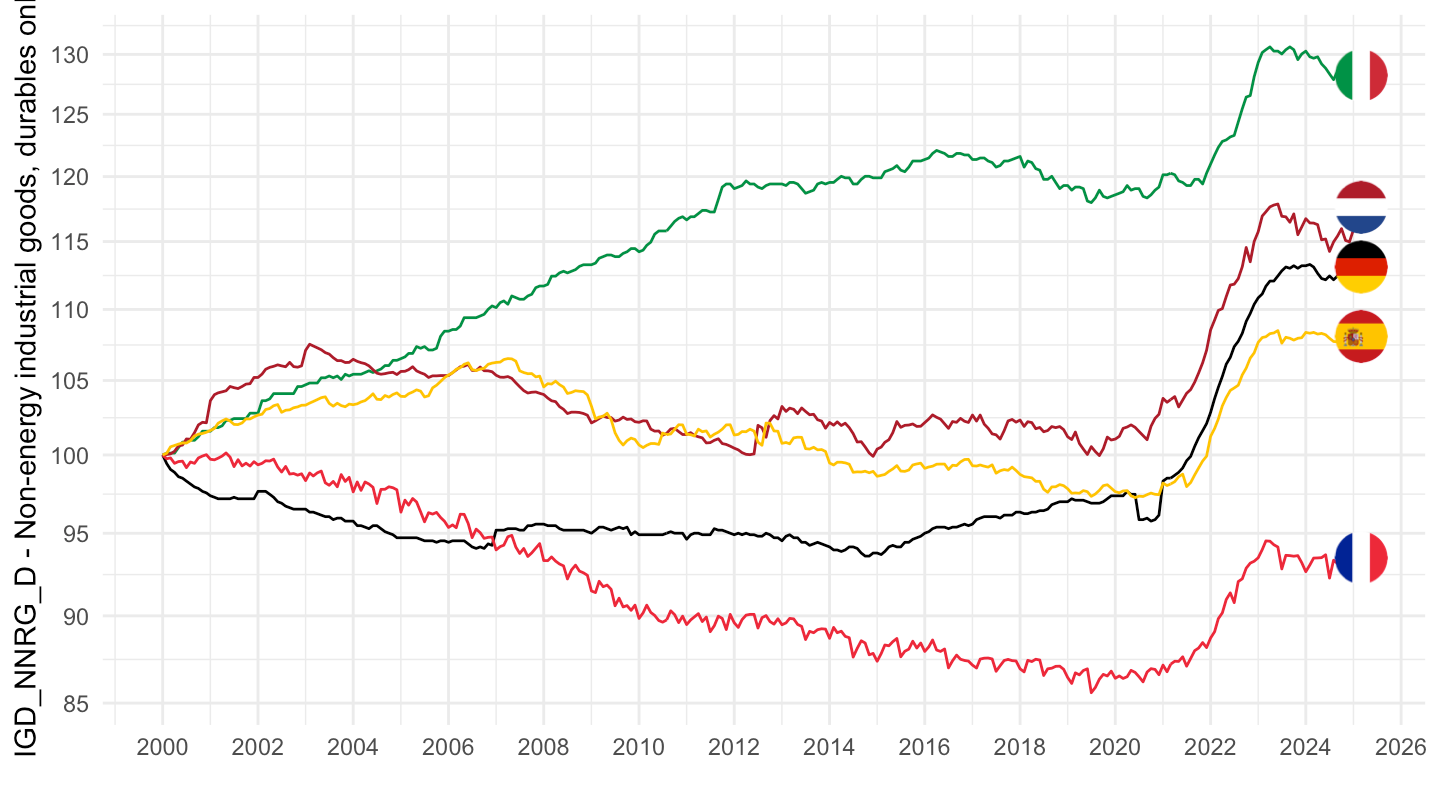
2017-
Code
prc_hicp_midx %>%
  filter(unit == "I15",
         coicop %in% c("IGD_NNRG_D"),
         geo %in% c("DE", "FR", "IT", "NL", "ES")) %>%

  select(geo, Geo, coicop, time, values) %>%
  month_to_date %>%
  group_by(Geo) %>%
  arrange(date) %>%
  filter(date >= as.Date("2017-01-01")) %>%
  mutate(values = 100*values/values[1]) %>%
  add_colors %>%
  ggplot(.) + geom_line(aes(x = date, y = values, color = color)) +
  theme_minimal() + xlab("") + ylab("IGD_NNRG_D - Non-energy industrial goods, durables only") +
  scale_x_date(breaks = seq(1960, 2100, 1) %>% paste0("-01-01") %>% as.Date,
               labels = date_format("%Y")) +
  scale_y_log10(breaks = seq(0, 200, 5)) +
  scale_color_identity() + add_flags +
  theme(legend.position = "none")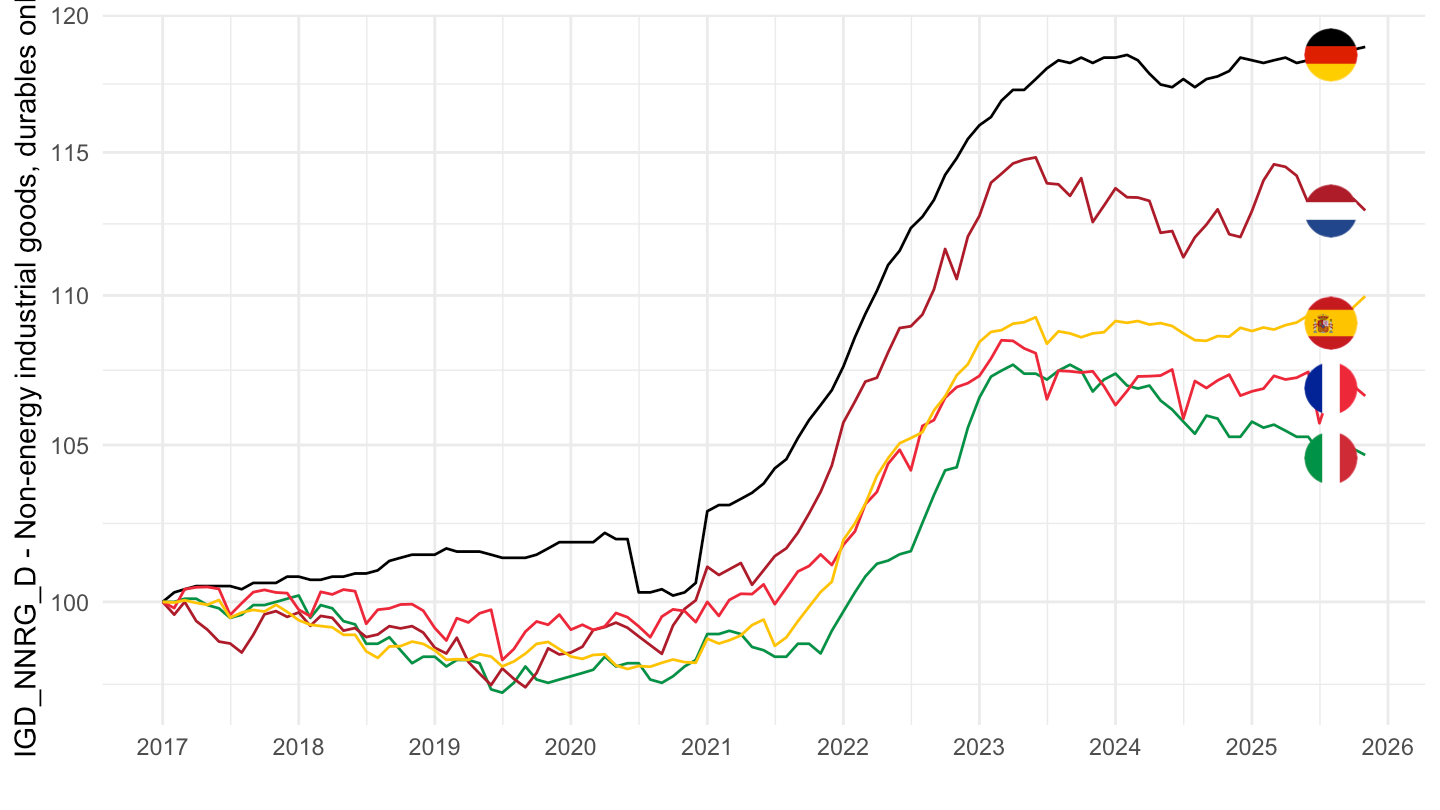
2019-
Code
prc_hicp_midx %>%
  filter(unit == "I15",
         coicop %in% c("IGD_NNRG_D"),
         geo %in% c("DE", "FR", "IT", "NL", "ES")) %>%

  select(geo, Geo, coicop, time, values) %>%
  month_to_date %>%
  group_by(Geo) %>%
  arrange(date) %>%
  filter(date >= as.Date("2019-01-01")) %>%
  mutate(values = 100*values/values[1]) %>%
  add_colors %>%
  ggplot(.) + geom_line(aes(x = date, y = values, color = color)) +
  theme_minimal() + xlab("") + ylab("IGD_NNRG_D - Non-energy industrial goods, durables only") +
  scale_x_date(breaks = seq(1960, 2100, 1) %>% paste0("-01-01") %>% as.Date,
               labels = date_format("%Y")) +
  scale_y_log10(breaks = seq(0, 200, 5)) +
  scale_color_identity() + add_flags +
  theme(legend.position = "none")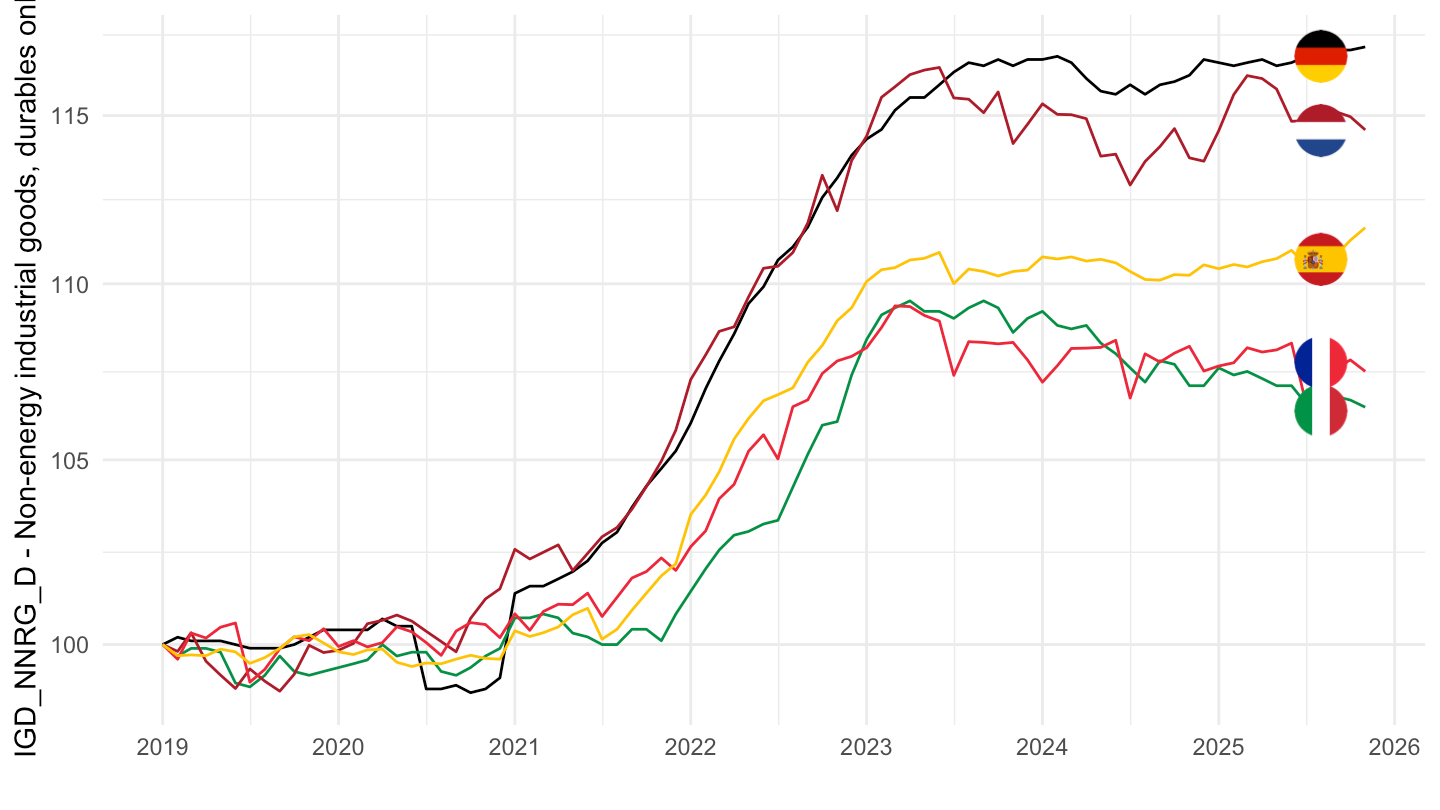
CP08 - Communications
All
Code
prc_hicp_midx %>%
  filter(unit == "I15",
         coicop %in% c("CP08"),
         geo %in% c("DE", "FR", "IT", "NL", "ES")) %>%

  select(geo, Geo, coicop, time, values) %>%
  month_to_date %>%
  group_by(Geo) %>%
  mutate(values = 100*values/values[date == as.Date("1996-01-01")]) %>%
  add_colors %>%
  ggplot(.) + geom_line(aes(x = date, y = values, color = color)) +
  theme_minimal() + xlab("") + ylab("") +
  scale_x_date(breaks = seq(1960, 2100, 2) %>% paste0("-01-01") %>% as.Date,
               labels = date_format("%Y")) +
  scale_y_log10(breaks = seq(0, 200, 5)) +
  scale_color_identity() + add_flags +
  theme(legend.position = "none")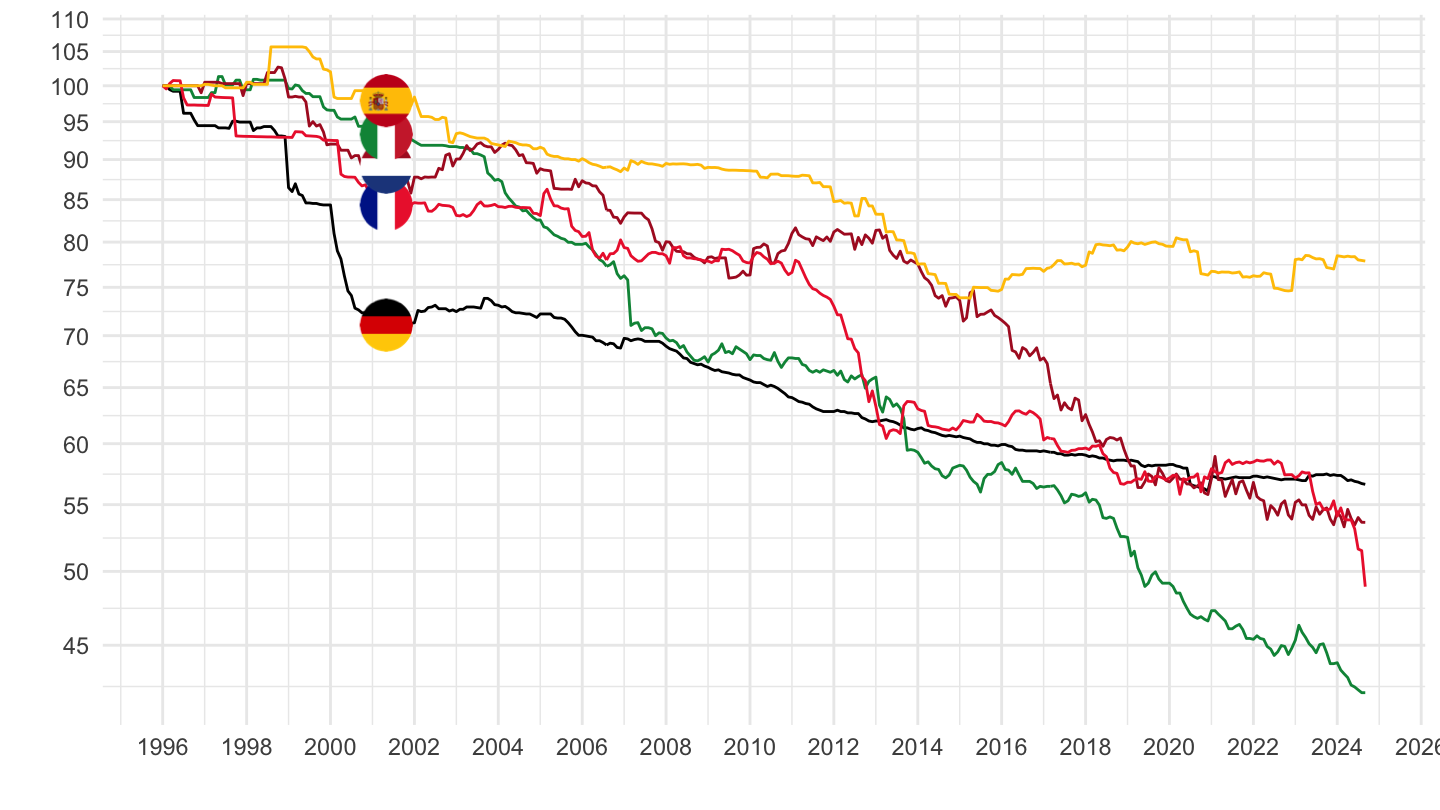
2000-
Code
prc_hicp_midx %>%
  filter(unit == "I15",
         coicop %in% c("CP08"),
         geo %in% c("DE", "FR", "IT", "EA20", "ES")) %>%

  select(geo, Geo, coicop, time, values) %>%
  month_to_date %>%
  filter(date >= as.Date("2000-01-01")) %>%
  group_by(Geo) %>%
  arrange(date) %>%
  mutate(values = 100*values/values[1]) %>%
  add_colors %>%
  ggplot(.) + geom_line(aes(x = date, y = values, color = color)) +
  theme_minimal() + xlab("") + ylab("") +
  scale_x_date(breaks = seq(1960, 2100, 2) %>% paste0("-01-01") %>% as.Date,
               labels = date_format("%Y")) +
  scale_y_log10(breaks = seq(0, 200, 5)) +
  scale_color_identity() + add_flags +
  theme(legend.position = "none")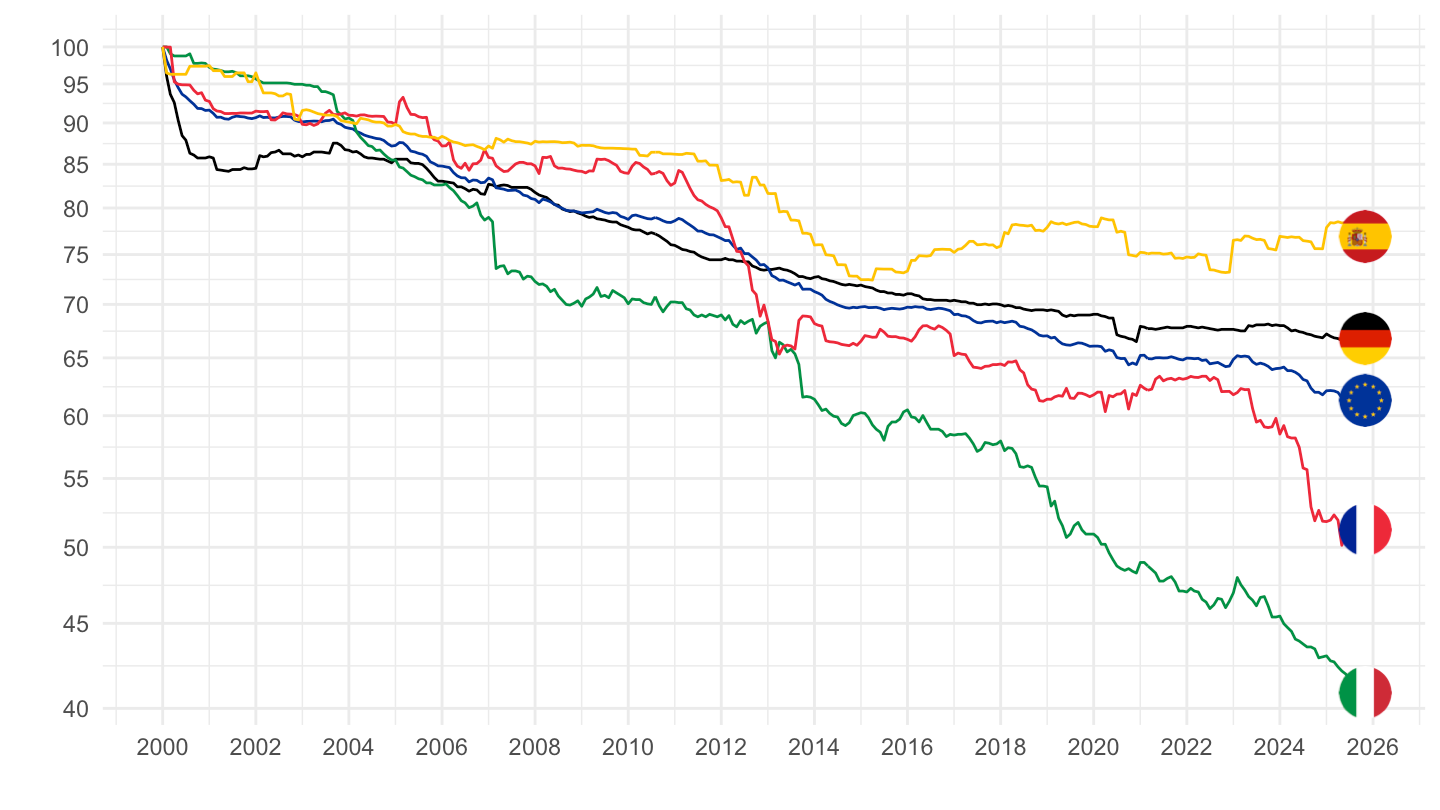
2017-
Code
prc_hicp_midx %>%
  filter(unit == "I15",
         coicop %in% c("CP08"),
         geo %in% c("DE", "FR", "IT", "NL", "ES")) %>%

  select(geo, Geo, coicop, time, values) %>%
  month_to_date %>%
  filter(date >= as.Date("2017-01-01")) %>%
  group_by(Geo) %>%
  arrange(date) %>%
  mutate(values = 100*values/values[1]) %>%
  add_colors %>%
  ggplot(.) + geom_line(aes(x = date, y = values, color = color)) +
  theme_minimal() + xlab("") + ylab("") +
  scale_x_date(breaks = seq(1960, 2100, 1) %>% paste0("-01-01") %>% as.Date,
               labels = date_format("%Y")) +
  scale_y_log10(breaks = seq(0, 200, 5)) +
  scale_color_identity() + add_flags +
  theme(legend.position = "none")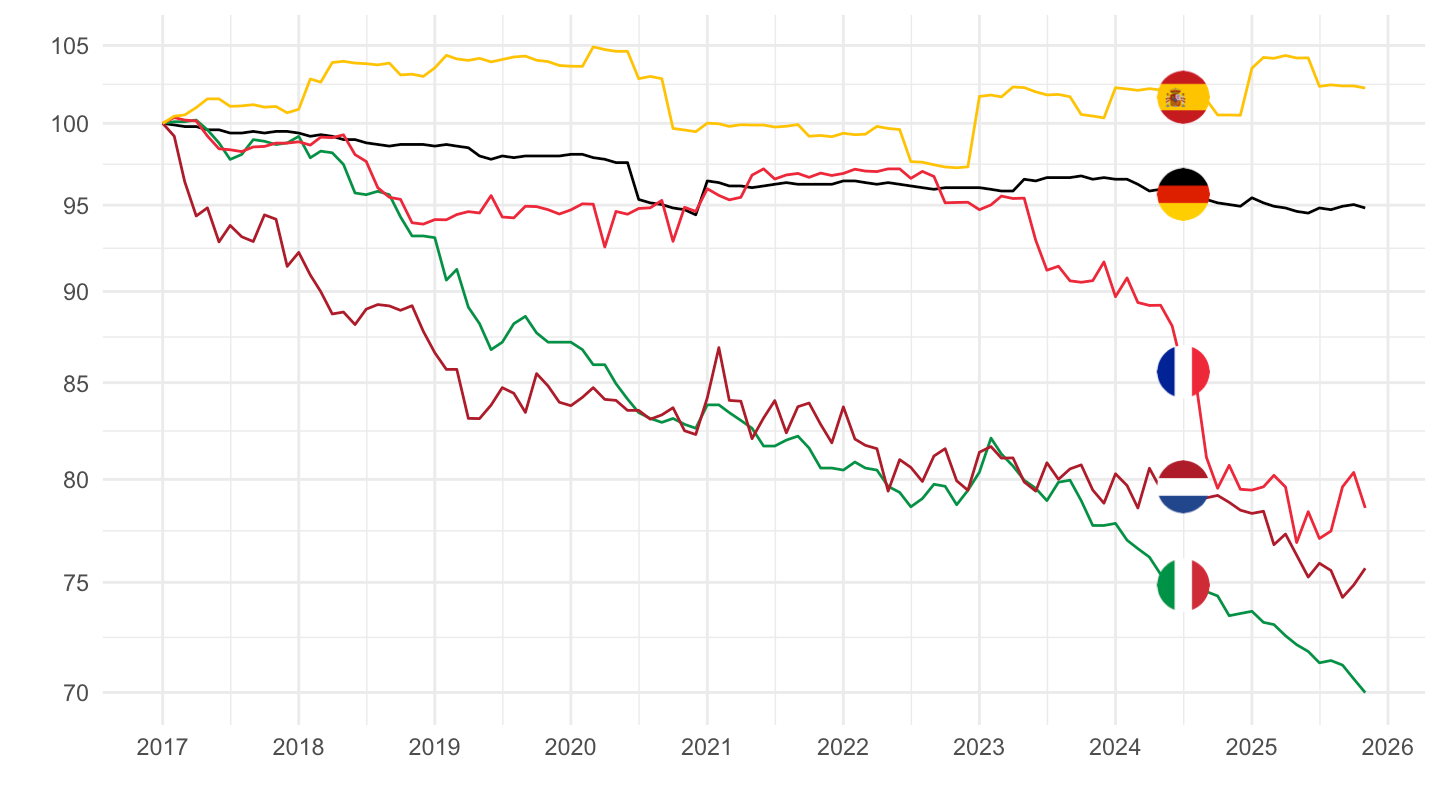
CP053 - Household appliances
Code
prc_hicp_midx %>%
  filter(unit == "I15",
         coicop %in% c("CP053"),
         geo %in% c("DE", "FR", "IT", "ES", "NL")) %>%

  select(geo, Geo, coicop, time, values) %>%
  arrange(time) %>%
  month_to_date %>%
  group_by(Geo) %>%
  arrange(date) %>%
  mutate(values = 100*values/values[1]) %>%
  add_colors %>%
  ggplot(.) + geom_line(aes(x = date, y = values, color = color)) +
  theme_minimal() + xlab("") + ylab("CP053 - Household appliances") +
  scale_x_date(breaks = seq(1960, 2100, 2) %>% paste0("-01-01") %>% as.Date,
               labels = date_format("%Y")) +
  scale_y_log10(breaks = c(seq(0, 200, 10), 2, 3, 5, 15, 8, 4)) +
  scale_color_identity() + add_flags +
  theme(legend.position = "none")
CP126
Code
prc_hicp_midx %>%
  filter(unit == "I15",
         coicop %in% c("CP126"),
         geo %in% c("DE", "FR", "IT", "ES", "NL")) %>%

  select(geo, Geo, coicop, time, values) %>%
  arrange(time) %>%
  month_to_date %>%
  group_by(Geo) %>%
  arrange(date) %>%
  mutate(values = 100*values/values[1]) %>%
  add_colors %>%
  ggplot(.) + geom_line(aes(x = date, y = values, color = color)) +
  theme_minimal() + xlab("") + ylab("CP126") +
  scale_x_date(breaks = seq(1960, 2100, 2) %>% paste0("-01-01") %>% as.Date,
               labels = date_format("%Y")) +
  scale_y_log10(breaks = c(seq(0, 500, 10), 2, 3, 5, 15, 8, 4)) +
  scale_color_identity() + add_flags +
  theme(legend.position = "none")
CP056 - Goods and services for routine household maintenance
Code
prc_hicp_midx %>%
  filter(unit == "I15",
         coicop %in% c("CP056"),
         geo %in% c("DE", "FR", "IT", "ES", "NL")) %>%

  select(geo, Geo, coicop, time, values) %>%
  arrange(time) %>%
  month_to_date %>%
  group_by(Geo) %>%
  arrange(date) %>%
  mutate(values = 100*values/values[1]) %>%
  add_colors %>%
  ggplot(.) + geom_line(aes(x = date, y = values, color = color)) +
  theme_minimal() + xlab("") + ylab("CP056 - Goods and services for routine household maintenance") +
  scale_x_date(breaks = seq(1960, 2100, 2) %>% paste0("-01-01") %>% as.Date,
               labels = date_format("%Y")) +
  scale_y_log10(breaks = c(seq(0, 200, 10), 2, 3, 5, 15, 8, 4)) +
  scale_color_identity() + add_flags +
  theme(legend.position = "none")
CP0830 - Telephone and telefax services
All
Code
prc_hicp_midx %>%
  filter(unit == "I15",
         coicop %in% c("CP0830"),
         geo %in% c("DE", "FR", "IT", "ES", "NL")) %>%

  select(geo, Geo, coicop, time, values) %>%
  arrange(time) %>%
  month_to_date %>%
  group_by(Geo) %>%
  arrange(date) %>%
  mutate(values = 100*values/values[1]) %>%
  add_colors %>%
  ggplot(.) + geom_line(aes(x = date, y = values, color = color)) +
  theme_minimal() + xlab("") + ylab("CP0830 - Telephone and telefax services") +
  scale_x_date(breaks = seq(1960, 2100, 2) %>% paste0("-01-01") %>% as.Date,
               labels = date_format("%Y")) +
  scale_y_log10(breaks = c(seq(0, 200, 10), 2, 3, 5, 15, 8, 4)) +
  scale_color_identity() + add_flags +
  theme(legend.position = "none")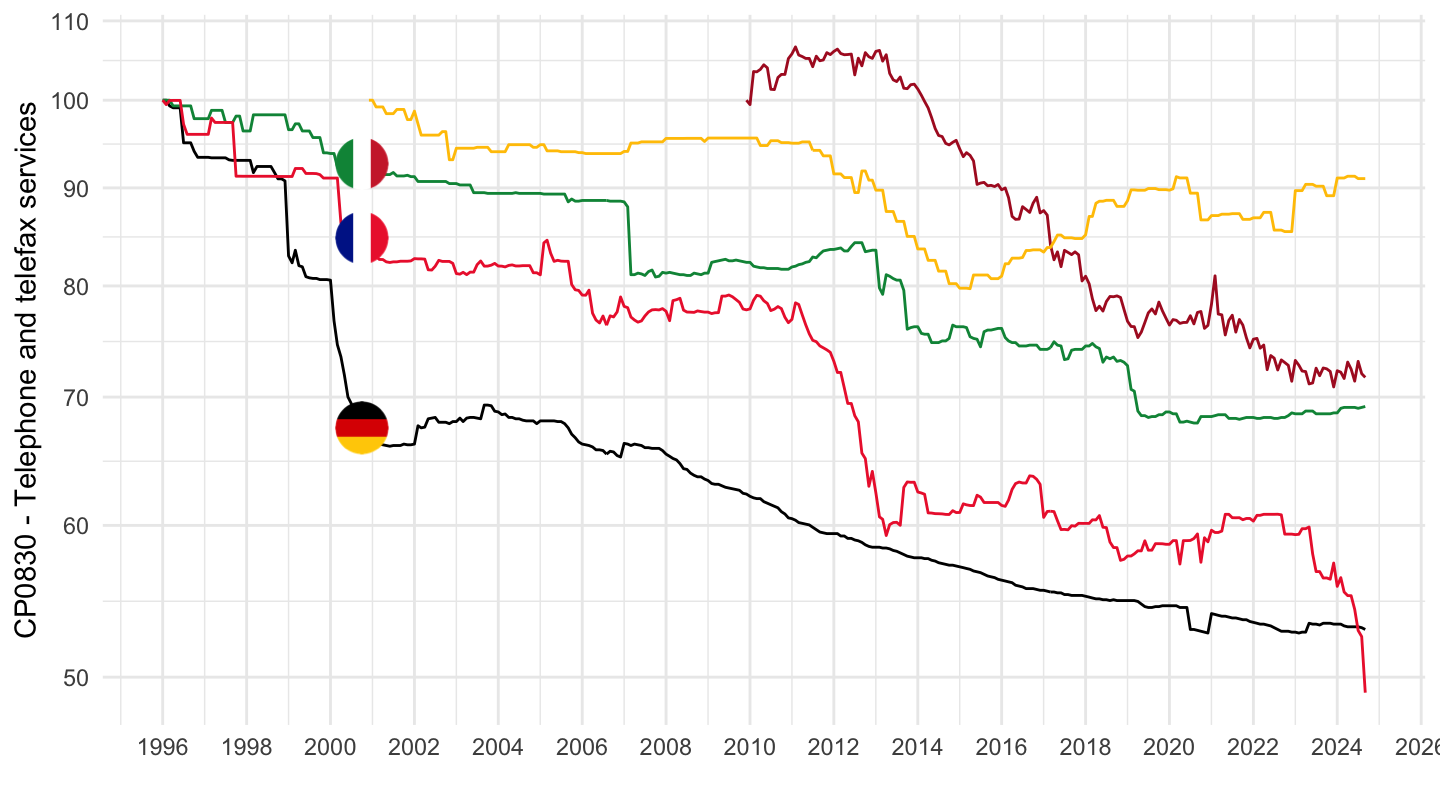
2017
Code
prc_hicp_midx %>%
  filter(unit == "I15",
         coicop %in% c("CP0830"),
         geo %in% c("DE", "FR", "IT", "ES", "EA20")) %>%

  select(geo, Geo, coicop, time, values) %>%
  arrange(time) %>%
  month_to_date %>%
  group_by(Geo) %>%
  arrange(date) %>%
  filter(date >= as.Date("2017-01-01")) %>%
  mutate(values = 100*values/values[1]) %>%
  add_colors %>%
  ggplot(.) + geom_line(aes(x = date, y = values, color = color)) +
  theme_minimal() + xlab("") + ylab("CP0830 - Telephone and telefax services") +
  scale_x_date(breaks = seq(1960, 2100, 1) %>% paste0("-01-01") %>% as.Date,
               labels = date_format("%Y")) +
  scale_y_log10(breaks = c(seq(0, 200, 5), 2, 3, 5, 15, 8, 4)) +
  scale_color_identity() + add_flags +
  theme(legend.position = "none")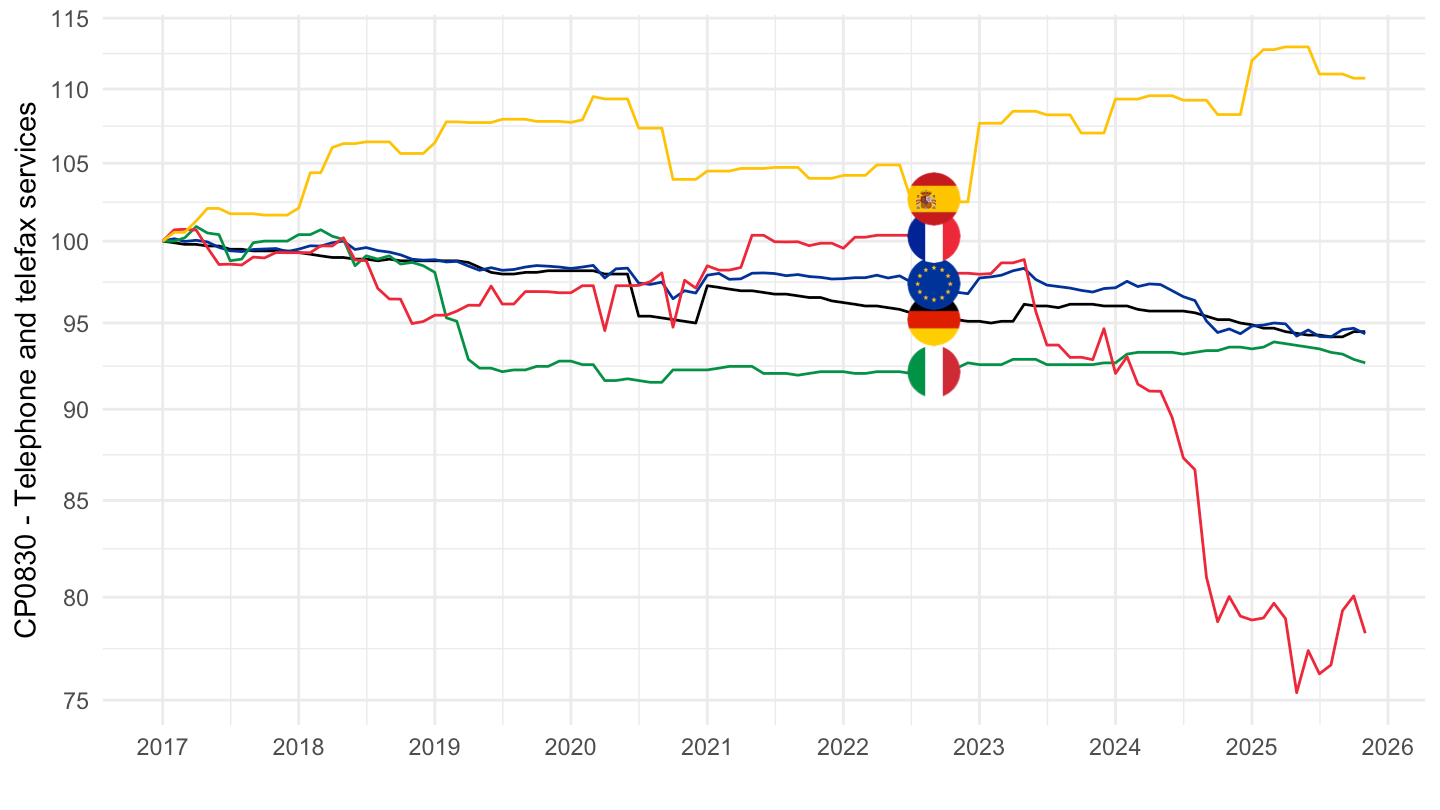
2000-2023
Code
prc_hicp_midx %>%
  filter(unit == "I15",
         coicop %in% c("CP0830"),
         geo %in% c("DE", "FR", "IT", "ES", "EA20")) %>%

  select(geo, Geo, coicop, time, values) %>%
  arrange(time) %>%
  month_to_date %>%
  group_by(Geo) %>%
  arrange(date) %>%
  filter(date >= as.Date("2000-01-01"),
         date <= as.Date("2023-01-01")) %>%
  mutate(values = 100*values/values[1]) %>%
  add_colors %>%
  ggplot(.) + geom_line(aes(x = date, y = values, color = color)) +
  theme_minimal() + xlab("") + ylab("CP0830 - Telephone and telefax services") +
  scale_x_date(breaks = seq(1960, 2100, 1) %>% paste0("-01-01") %>% as.Date,
               labels = date_format("%Y")) +
  scale_y_log10(breaks = c(seq(0, 200, 5), 2, 3, 5, 15, 8, 4)) +
  scale_color_identity() + add_flags +
  theme(legend.position = "none")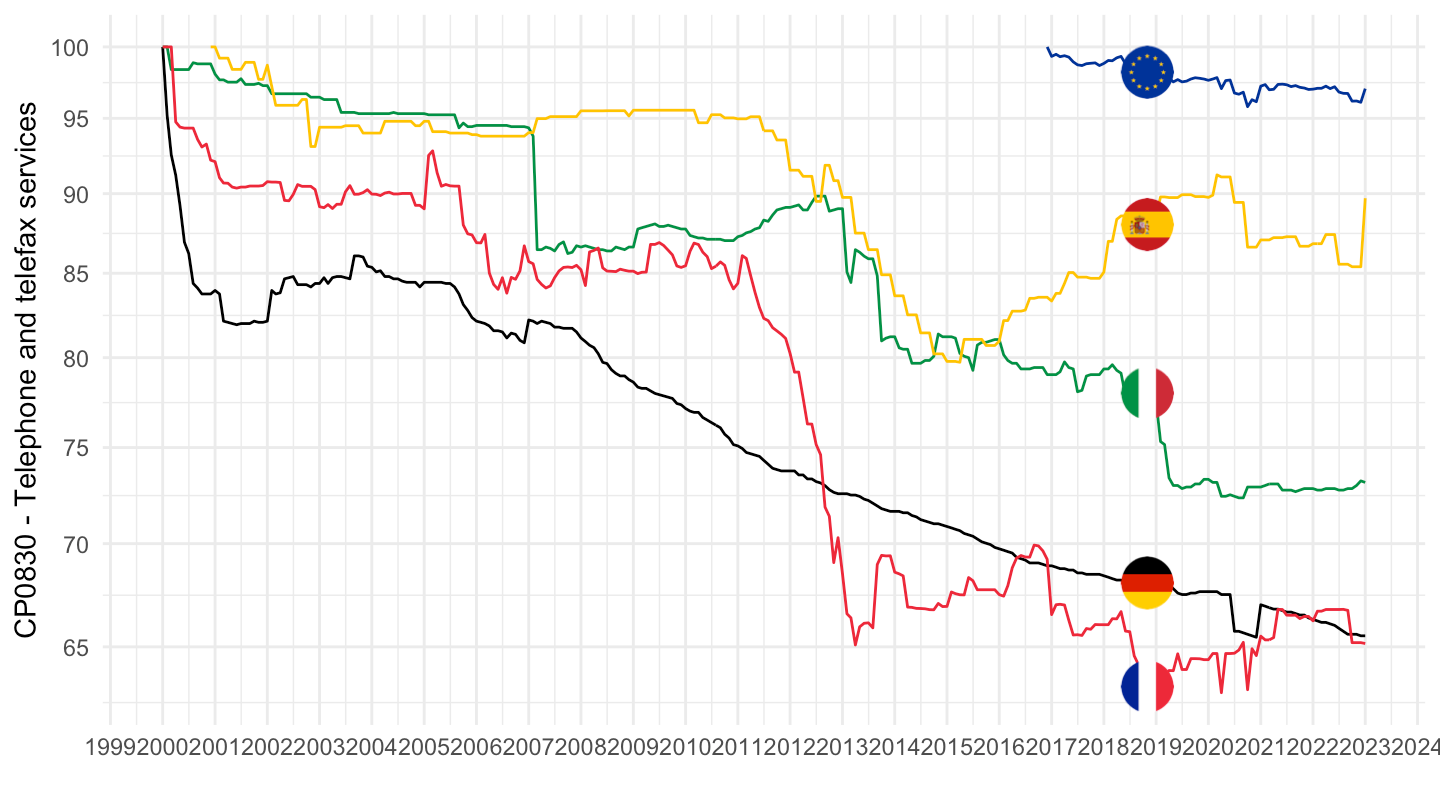
CP0820 - Telephone and telefax equipment
All
Code
prc_hicp_midx %>%
  filter(unit == "I15",
         coicop %in% c("CP0820"),
         geo %in% c("DE", "FR", "IT", "ES", "NL")) %>%

  select(geo, Geo, coicop, time, values) %>%
  arrange(time) %>%
  month_to_date %>%
  group_by(Geo) %>%
  arrange(date) %>%
  mutate(values = 100*values/values[1]) %>%
  add_colors %>%
  ggplot(.) + geom_line(aes(x = date, y = values, color = color)) +
  theme_minimal() + xlab("") + ylab("CP0820 - Telephone and telefax equipment") +
  scale_x_date(breaks = seq(1960, 2100, 2) %>% paste0("-01-01") %>% as.Date,
               labels = date_format("%Y")) +
  scale_y_log10(breaks = c(seq(0, 200, 10), 2, 3, 5, 15, 8, 4)) +
  scale_color_identity() + add_flags +
  theme(legend.position = "none")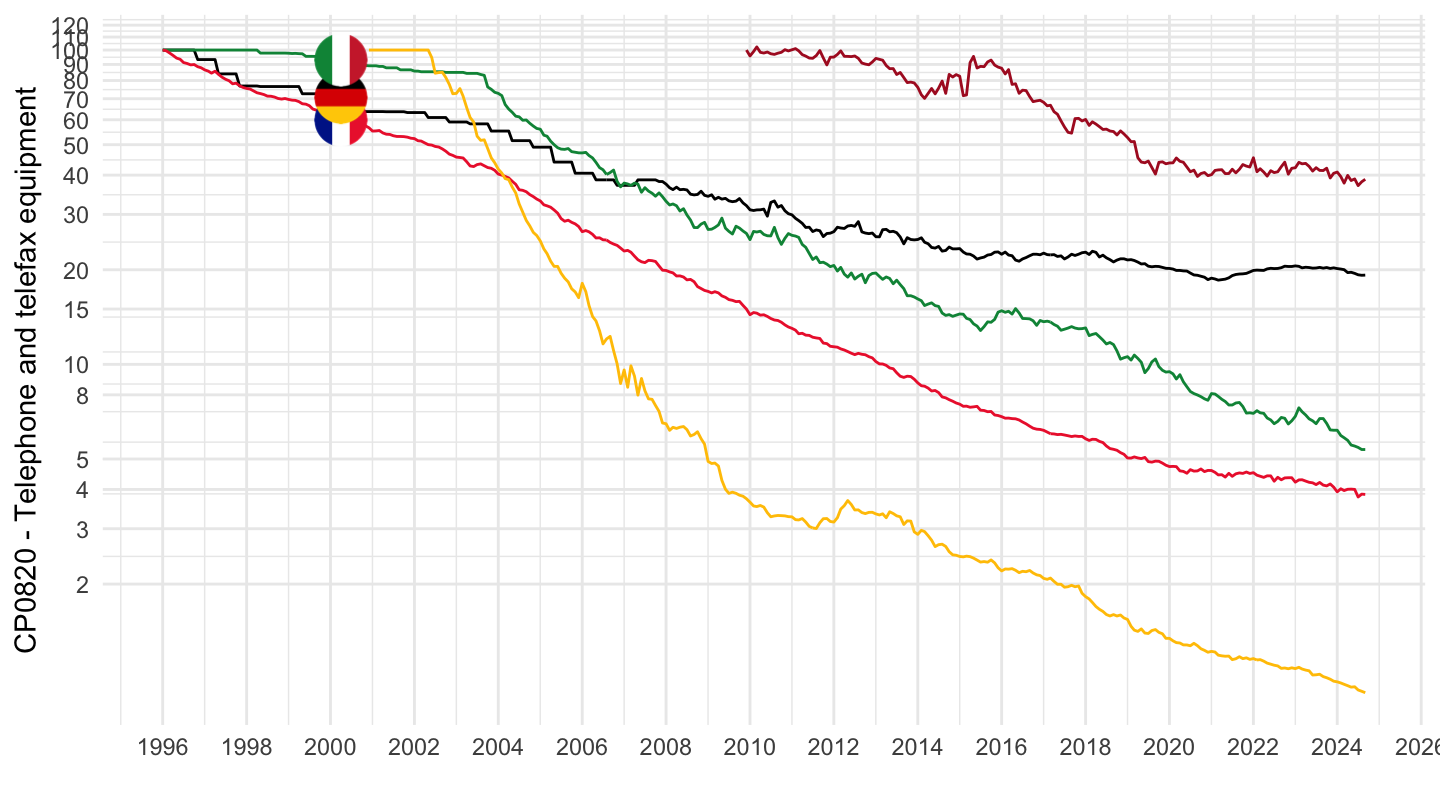
2017-
Code
prc_hicp_midx %>%
  filter(unit == "I15",
         coicop %in% c("CP0820"),
         geo %in% c("DE", "FR", "IT", "ES", "EA20")) %>%

  select(geo, Geo, coicop, time, values) %>%
  arrange(time) %>%
  month_to_date %>%
  group_by(Geo) %>%
  arrange(date) %>%
  filter(date >= as.Date("2017-01-01")) %>%
  mutate(values = 100*values/values[1]) %>%
  add_colors %>%
  ggplot(.) + geom_line(aes(x = date, y = values, color = color)) +
  theme_minimal() + xlab("") + ylab("CP082") +
  scale_x_date(breaks = seq(1960, 2100, 1) %>% paste0("-01-01") %>% as.Date,
               labels = date_format("%Y")) +
  scale_y_log10(breaks = c(seq(0, 200, 5), 2, 3, 5, 15, 8, 4)) +
  scale_color_identity() + add_flags +
  theme(legend.position = "none")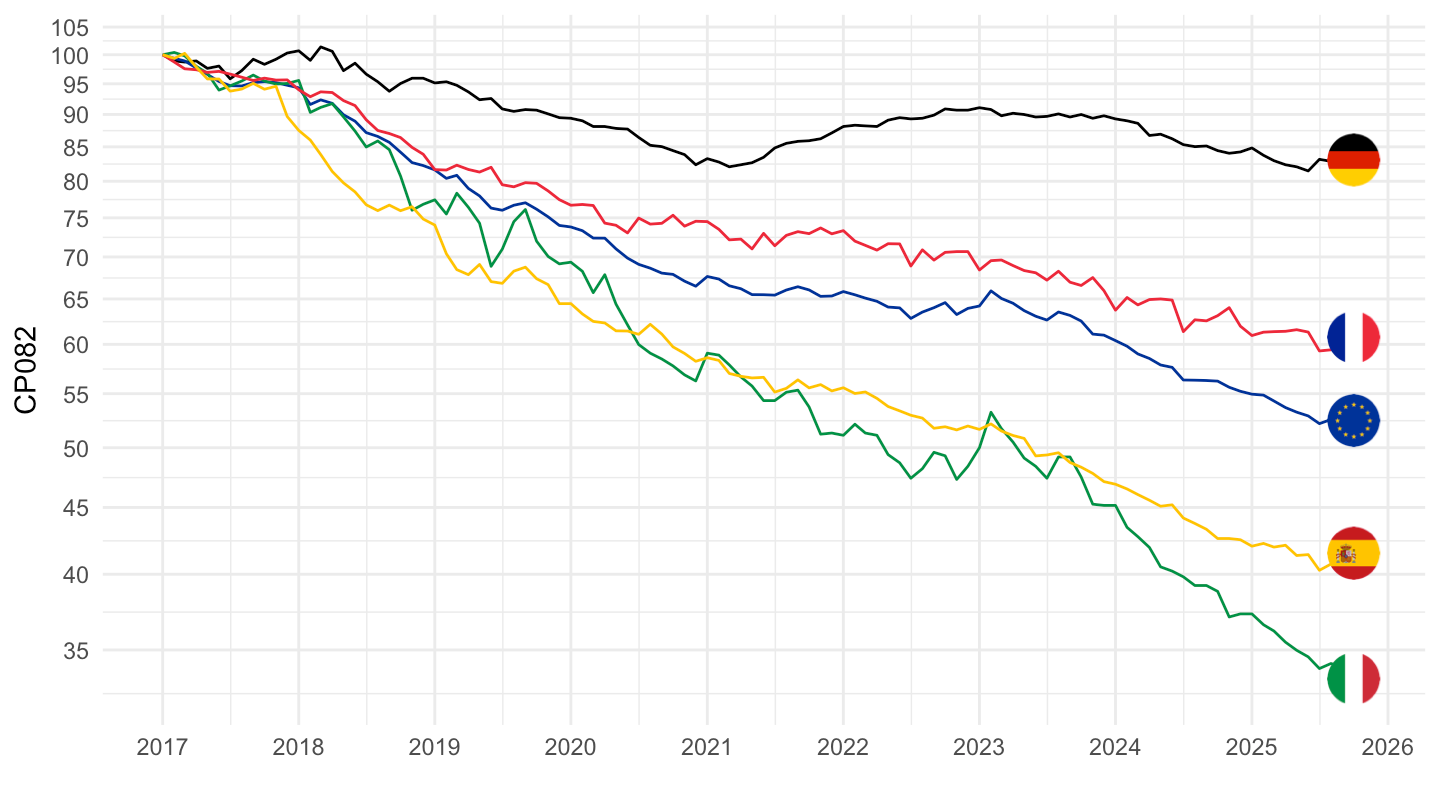
CP126 - Financial services
All
Code
prc_hicp_midx %>%
  filter(unit == "I15",
         coicop %in% c("CP126"),
         geo %in% c("DE", "FR", "IT", "ES", "EA20")) %>%

  select(geo, Geo, coicop, time, values) %>%
  arrange(time) %>%
  month_to_date %>%
  group_by(Geo) %>%
  arrange(date) %>%
  #filter(date >= as.Date("2017-01-01")) %>%
  mutate(values = 100*values/values[1]) %>%
  add_colors %>%
  ggplot(.) + geom_line(aes(x = date, y = values, color = color)) +
  theme_minimal() + xlab("") + ylab("CP126 - Financial services") +
  scale_x_date(breaks = seq(1960, 2100, 5) %>% paste0("-01-01") %>% as.Date,
               labels = date_format("%Y")) +
  scale_y_log10(breaks = c(seq(0, 800, 10), 2, 3, 5, 15, 8, 4)) +
  scale_color_identity() + add_flags +
  theme(legend.position = "none")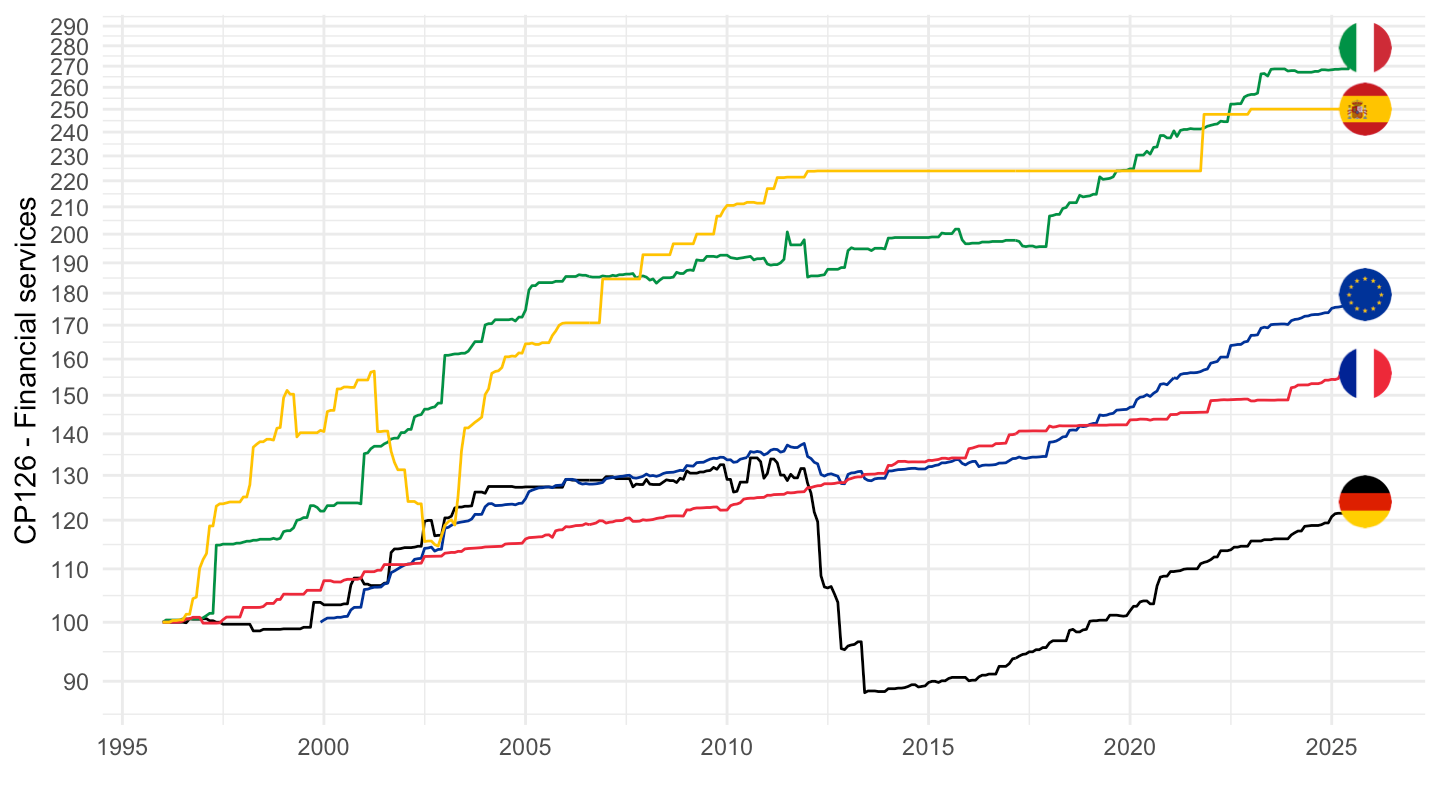
2017-
Code
prc_hicp_midx %>%
  filter(unit == "I15",
         coicop %in% c("CP126"),
         geo %in% c("DE", "FR", "IT", "ES", "EA20")) %>%

  select(geo, Geo, coicop, time, values) %>%
  arrange(time) %>%
  month_to_date %>%
  group_by(Geo) %>%
  arrange(date) %>%
  filter(date >= as.Date("2017-01-01")) %>%
  mutate(values = 100*values/values[1]) %>%
  add_colors %>%
  ggplot(.) + geom_line(aes(x = date, y = values, color = color)) +
  theme_minimal() + xlab("") + ylab("CP126 - Financial services") +
  scale_x_date(breaks = seq(1960, 2100, 1) %>% paste0("-01-01") %>% as.Date,
               labels = date_format("%Y")) +
  scale_y_log10(breaks = c(seq(0, 800, 10), 2, 3, 5, 15, 8, 4)) +
  scale_color_identity() + add_flags +
  theme(legend.position = "none")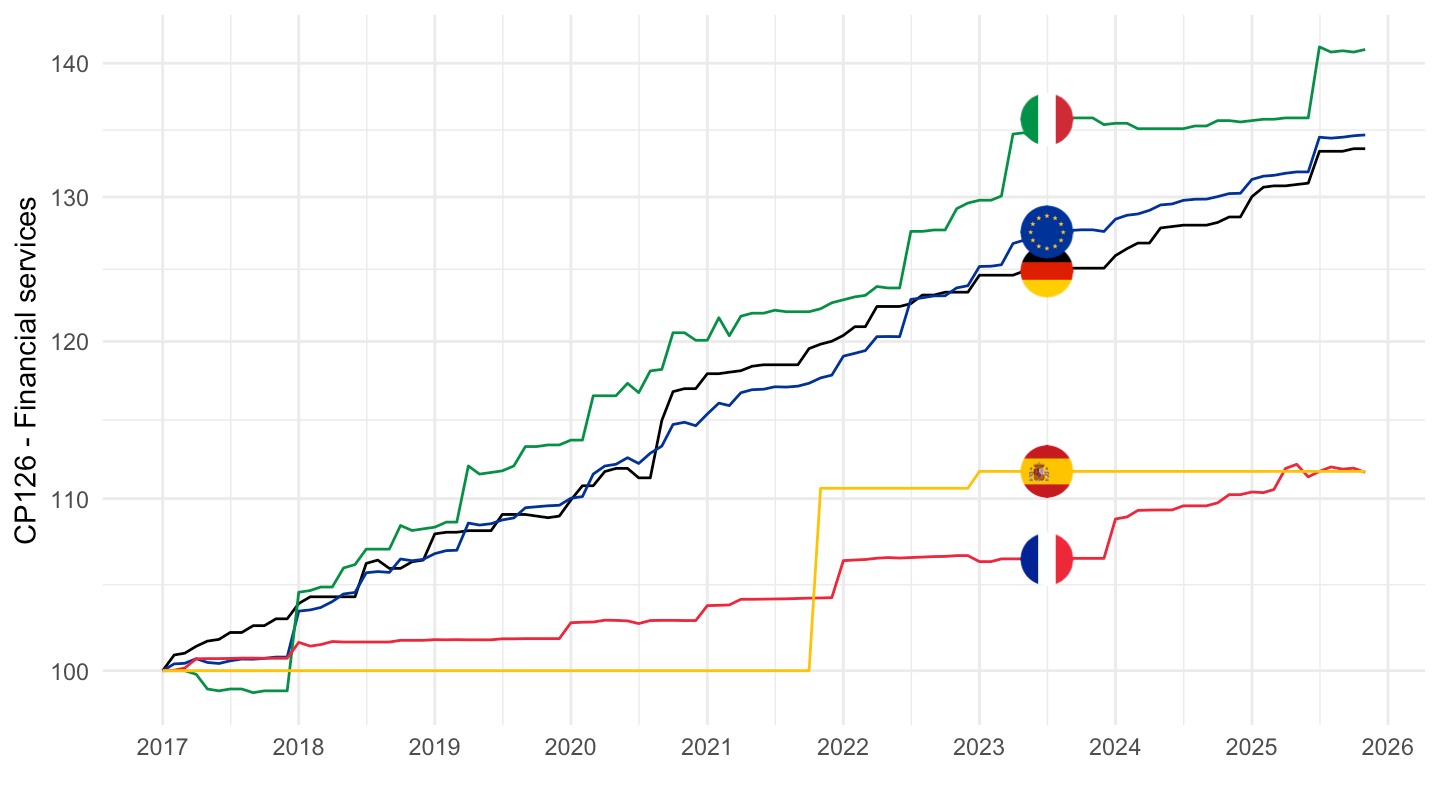
CP096 - Packaged holidays
2017-
Code
prc_hicp_midx %>%
  filter(unit == "I15",
         coicop %in% c("CP096"),
         geo %in% c("DE", "FR", "IT", "ES", "EA20")) %>%

  select(geo, Geo, coicop, time, values) %>%
  arrange(time) %>%
  month_to_date %>%
  group_by(Geo) %>%
  arrange(date) %>%
  filter(date >= as.Date("2017-01-01")) %>%
  mutate(values = 100*values/values[1]) %>%
  add_colors %>%
  ggplot(.) + geom_line(aes(x = date, y = values, color = color)) +
  theme_minimal() + xlab("") + ylab("CP096") +
  scale_x_date(breaks = seq(1960, 2100, 1) %>% paste0("-01-01") %>% as.Date,
               labels = date_format("%Y")) +
  scale_y_log10(breaks = c(seq(0, 800, 10), 2, 3, 5, 15, 8, 4)) +
  scale_color_identity() + add_flags +
  theme(legend.position = "none")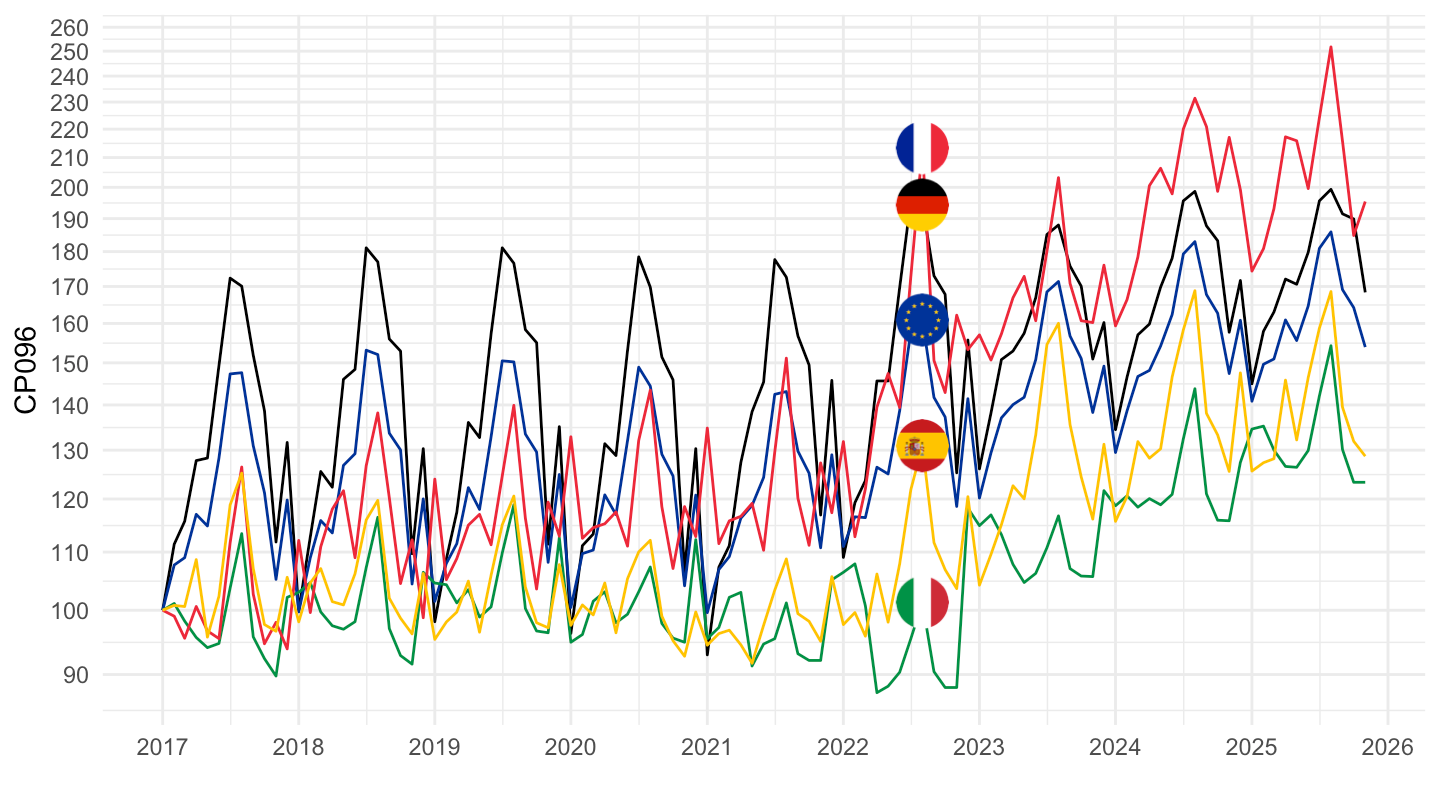
CP0612
2017-
Code
prc_hicp_midx %>%
  filter(unit == "I15",
         coicop %in% c("CP0612"),
         geo %in% c("DE", "FR", "IT", "ES", "EA20")) %>%

  select(geo, Geo, coicop, time, values) %>%
  arrange(time) %>%
  month_to_date %>%
  group_by(Geo) %>%
  arrange(date) %>%
  #filter(date >= as.Date("2017-01-01")) %>%
  mutate(values = 100*values/values[1]) %>%
  add_colors %>%
  ggplot(.) + geom_line(aes(x = date, y = values, color = color)) +
  theme_minimal() + xlab("") + ylab("CP0612") +
  scale_x_date(breaks = seq(1960, 2100, 5) %>% paste0("-01-01") %>% as.Date,
               labels = date_format("%Y")) +
  scale_y_log10(breaks = c(seq(0, 200, 5), 2, 3, 5, 15, 8, 4)) +
  scale_color_identity() + add_flags +
  theme(legend.position = "none")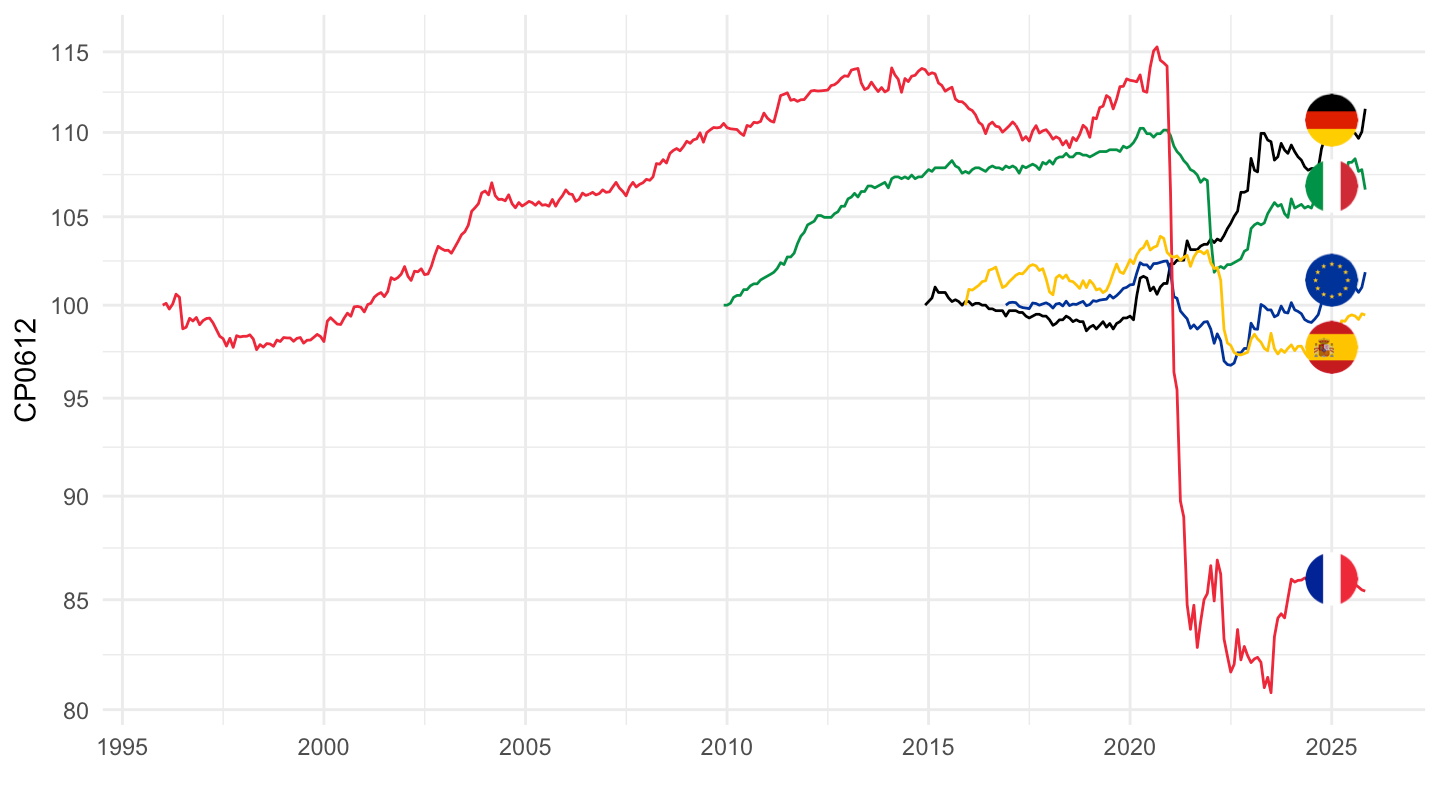
2017-
Code
prc_hicp_midx %>%
  filter(unit == "I15",
         coicop %in% c("CP0612"),
         geo %in% c("DE", "FR", "IT", "ES", "EA20")) %>%

  select(geo, Geo, coicop, time, values) %>%
  arrange(time) %>%
  month_to_date %>%
  group_by(Geo) %>%
  arrange(date) %>%
  filter(date >= as.Date("2017-01-01")) %>%
  mutate(values = 100*values/values[1]) %>%
  add_colors %>%
  ggplot(.) + geom_line(aes(x = date, y = values, color = color)) +
  theme_minimal() + xlab("") + ylab("CP0612") +
  scale_x_date(breaks = seq(1960, 2100, 1) %>% paste0("-01-01") %>% as.Date,
               labels = date_format("%Y")) +
  scale_y_log10(breaks = c(seq(0, 200, 5), 2, 3, 5, 15, 8, 4)) +
  scale_color_identity() + add_flags +
  theme(legend.position = "none")
CP09 - Recreation and culture
Code
prc_hicp_midx %>%
  filter(unit == "I15",
         coicop %in% c("CP09"),
         geo %in% c("DE", "FR", "IT", "NL", "ES")) %>%

  select(geo, Geo, coicop, time, values) %>%
  month_to_date %>%
  group_by(Geo) %>%
  mutate(values = 100*values/values[date == as.Date("1996-01-01")]) %>%
  add_colors %>%
  ggplot(.) + geom_line(aes(x = date, y = values, color = color)) +
  theme_minimal() + xlab("") + ylab("CP09 - Recreation and culture") +
  scale_x_date(breaks = seq(1960, 2100, 2) %>% paste0("-01-01") %>% as.Date,
               labels = date_format("%Y")) +
  scale_y_log10(breaks = seq(0, 200, 5)) +
  scale_color_identity() + add_flags +
  theme(legend.position = "none")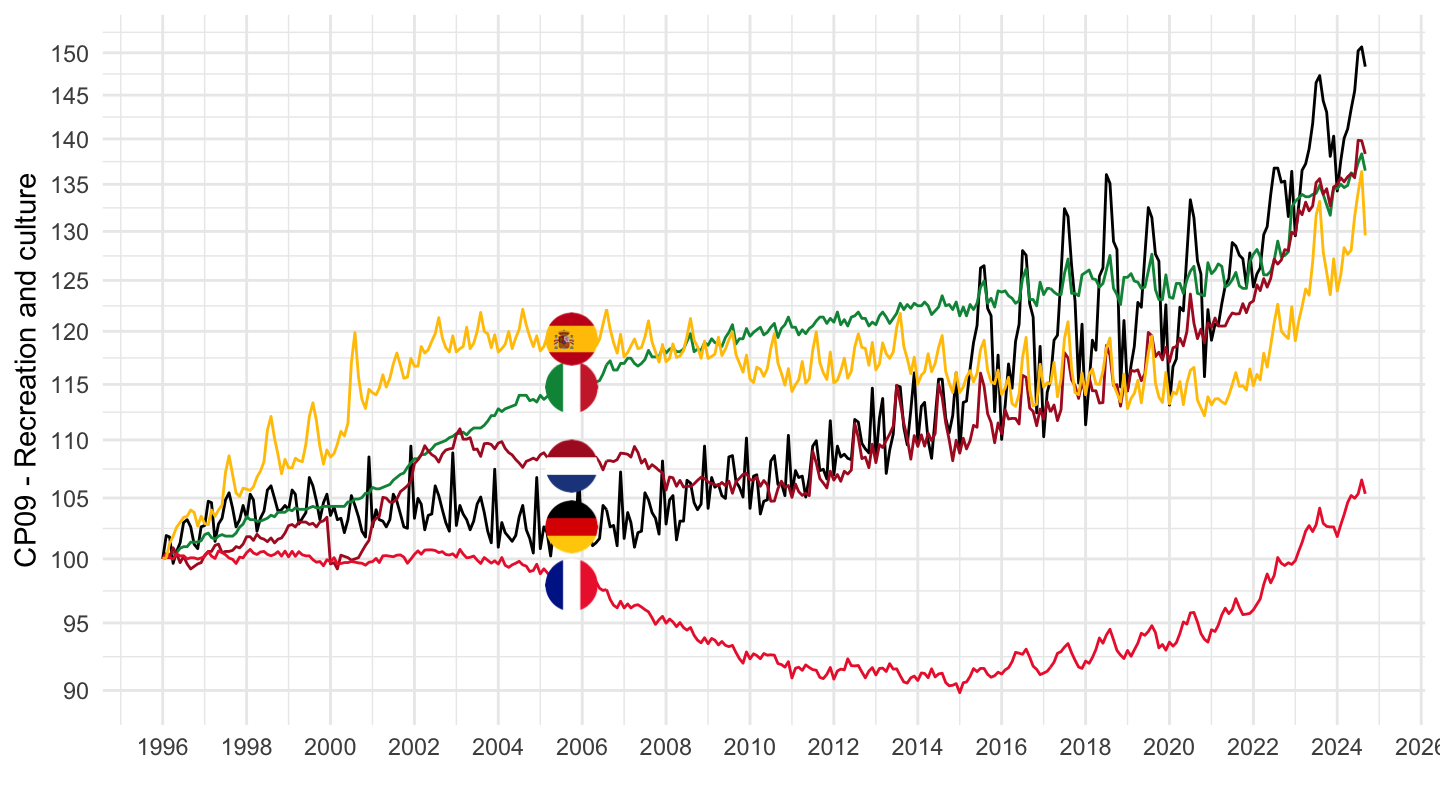
CP02201 - Cigarettes
1996-
Code
prc_hicp_midx %>%
  filter(unit == "I15",
         coicop %in% c("CP02201"),
         geo %in% c("FR")) %>%

  select(geo, Geo, coicop, time, values) %>%
  month_to_date %>%
  arrange(date) %>%
  group_by(Geo) %>%
  mutate(values = 100*values/values[date == as.Date("1996-01-01")]) %>%
  add_colors %>%
  ggplot(.) + geom_line(aes(x = date, y = values)) +
  theme_minimal() + xlab("") + ylab("") +
  scale_x_date(breaks = seq(1960, 2100, 2) %>% paste0("-01-01") %>% as.Date,
               labels = date_format("%Y")) +
  scale_y_log10(breaks = seq(0, 1000, 50)) +
  scale_color_identity() + add_flags +
  theme(legend.position = "none")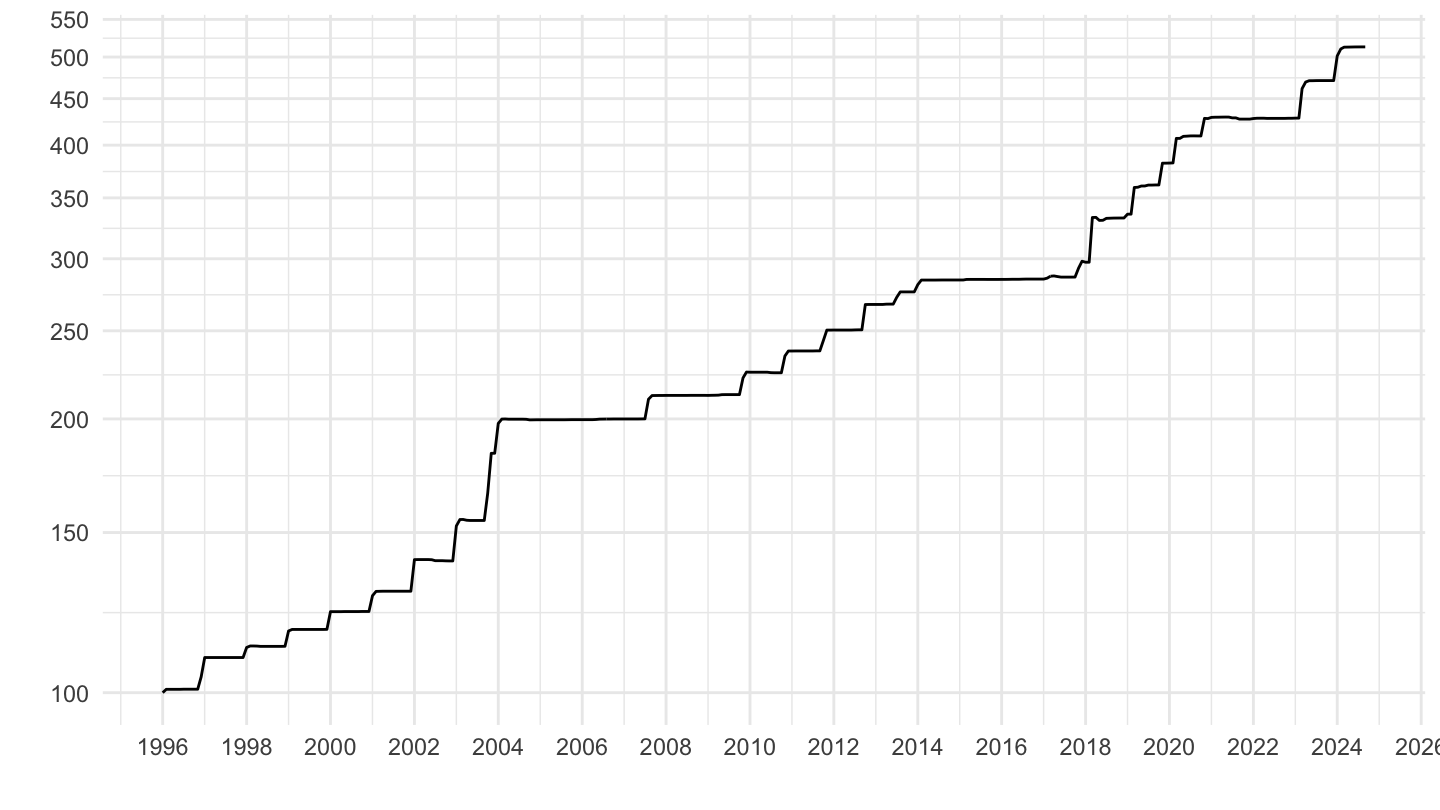
2010-
Code
prc_hicp_midx %>%
  filter(unit == "I15",
         coicop %in% c("CP02201"),
         geo %in% c("DE", "FR", "IT", "NL", "ES")) %>%

  select(geo, Geo, coicop, time, values) %>%
  month_to_date %>%
  filter(date >= as.Date("2016-01-01")) %>%
  arrange(date) %>%
  group_by(Geo) %>%
  mutate(values = 100*values/values[date == as.Date("2016-01-01")]) %>%
  add_colors %>%
  ggplot(.) + geom_line(aes(x = date, y = values, color = color)) +
  theme_minimal() + xlab("") + ylab("") +
  scale_x_date(breaks = seq(1960, 2100, 2) %>% paste0("-01-01") %>% as.Date,
               labels = date_format("%Y")) +
  scale_y_log10(breaks = seq(0, 200, 5)) +
  scale_color_identity() + add_flags +
  theme(legend.position = "none")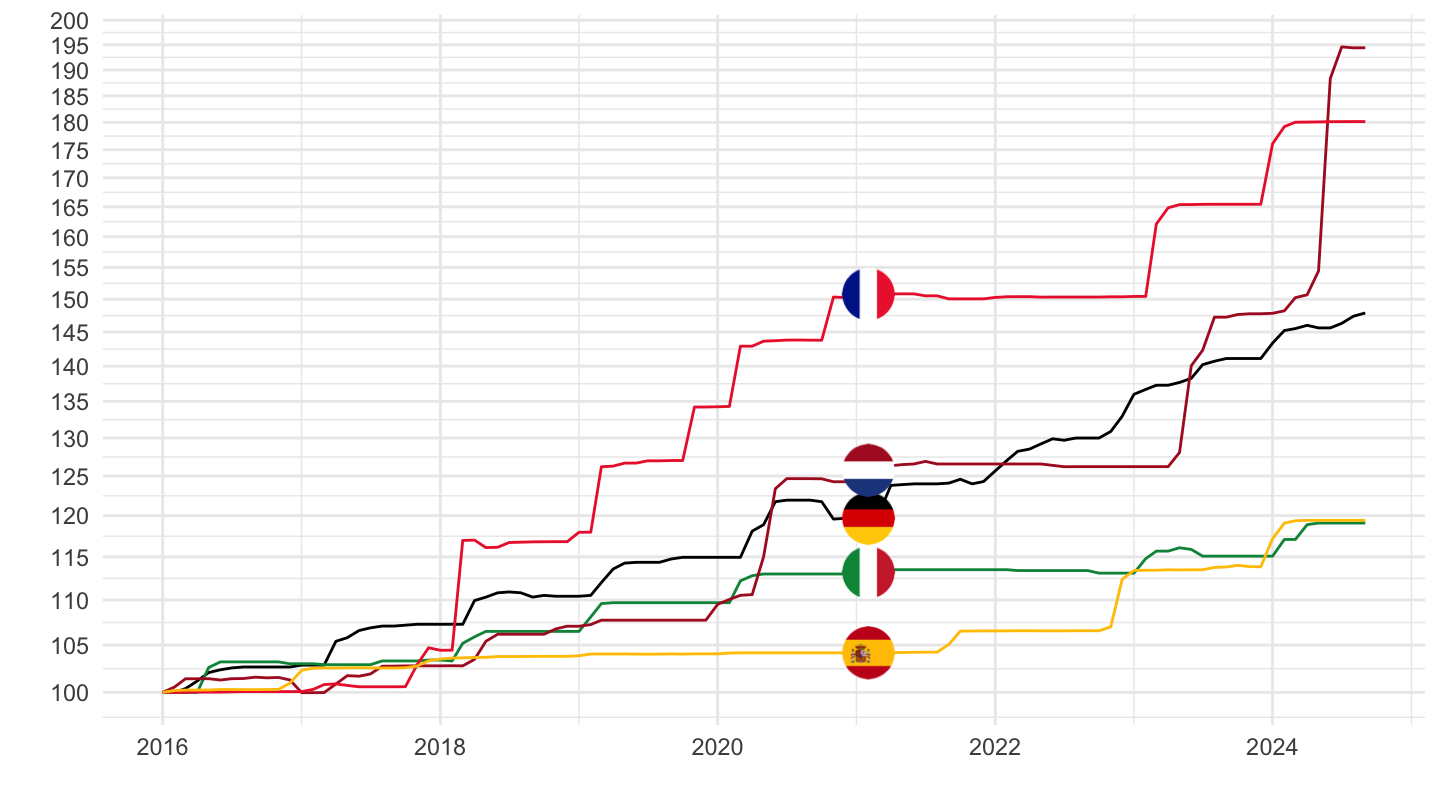
2015-
Code
prc_hicp_midx %>%
  filter(unit == "I15",
         coicop %in% c("CP02201"),
         geo %in% c("DE", "FR", "IT", "NL", "ES")) %>%

  select(geo, Geo, coicop, time, values) %>%
  month_to_date %>%
  filter(date >= as.Date("2016-01-01")) %>%
  arrange(date) %>%
  group_by(Geo) %>%
  mutate(values = 100*values/values[date == as.Date("2016-01-01")]) %>%
  add_colors %>%
  ggplot(.) + geom_line(aes(x = date, y = values, color = color)) +
  theme_minimal() + xlab("") + ylab("") +
  scale_x_date(breaks = seq(1960, 2100, 2) %>% paste0("-01-01") %>% as.Date,
               labels = date_format("%Y")) +
  scale_y_log10(breaks = seq(0, 200, 5)) +
  scale_color_identity() + add_flags +
  theme(legend.position = "none")
2017-
Code
prc_hicp_midx %>%
  filter(unit == "I15",
         coicop %in% c("CP02201"),
         geo %in% c("DE", "FR", "IT", "ES")) %>%

  select(geo, Geo, coicop, time, values) %>%
  month_to_date %>%
  filter(date >= as.Date("2017-01-01")) %>%
  arrange(date) %>%
  group_by(Geo) %>%
  mutate(values = 100*values/values[date == as.Date("2017-01-01")]) %>%
  add_colors %>%
  ggplot(.) + geom_line(aes(x = date, y = values, color = color)) +
  theme_minimal() + xlab("") + ylab("") +
  scale_x_date(breaks = seq(1960, 2100, 1) %>% paste0("-01-01") %>% as.Date,
               labels = date_format("%Y")) +
  scale_y_log10(breaks = seq(0, 200, 5)) +
  scale_color_identity() + add_flags +
  theme(legend.position = "none")
CP0913
Code
prc_hicp_midx %>%
  filter(unit == "I15",
         coicop %in% c("CP0913"),
         geo %in% c("DE", "FR", "IT", "NL", "ES")) %>%

  select(geo, Geo, coicop, time, values) %>%
  month_to_date %>%
  group_by(Geo) %>%
  mutate(values = 100*values/values[date == as.Date("1996-01-01")]) %>%
  add_colors %>%
  ggplot(.) + geom_line(aes(x = date, y = values, color = color)) +
  theme_minimal() + xlab("") + ylab("") +
  scale_x_date(breaks = seq(1960, 2100, 2) %>% paste0("-01-01") %>% as.Date,
               labels = date_format("%Y")) +
  scale_y_log10(breaks = seq(0, 200, 5)) +
  scale_color_identity() + add_flags +
  theme(legend.position = "none")
CP091
Code
prc_hicp_midx %>%
  filter(unit == "I15",
         coicop %in% c("CP091"),
         geo %in% c("DE", "FR", "IT", "NL", "ES")) %>%

  select(geo, Geo, coicop, time, values) %>%
  month_to_date %>%
  group_by(Geo) %>%
  mutate(values = 100*values/values[date == as.Date("1996-01-01")]) %>%
  add_colors %>%
  ggplot(.) + geom_line(aes(x = date, y = values, color = color)) +
  theme_minimal() + xlab("") + ylab("") +
  scale_x_date(breaks = seq(1960, 2100, 2) %>% paste0("-01-01") %>% as.Date,
               labels = date_format("%Y")) +
  scale_y_log10(breaks = seq(0, 200, 5)) +
  scale_color_identity() + add_flags +
  theme(legend.position = "none")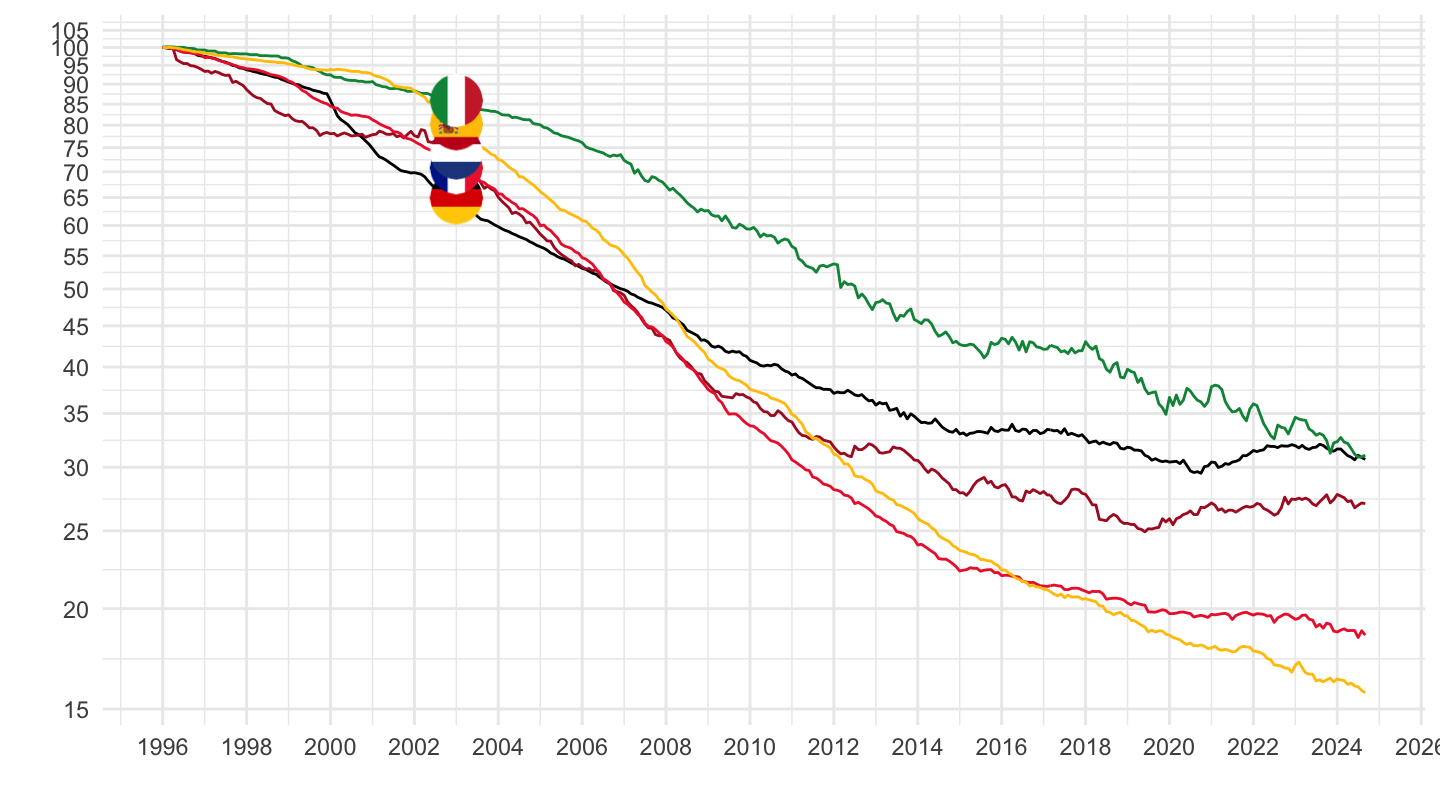
CP092
Code
prc_hicp_midx %>%
  filter(unit == "I15",
         coicop %in% c("CP092"),
         geo %in% c("DE", "FR", "IT", "NL", "ES")) %>%

  select(geo, Geo, coicop, time, values) %>%
  month_to_date %>%
  group_by(Geo) %>%
  arrange(date) %>%
  mutate(values = 100*values/values[1]) %>%
  add_colors %>%
  ggplot(.) + geom_line(aes(x = date, y = values, color = color)) +
  theme_minimal() + xlab("") + ylab("") +
  scale_x_date(breaks = seq(1960, 2100, 2) %>% paste0("-01-01") %>% as.Date,
               labels = date_format("%Y")) +
  scale_y_log10(breaks = seq(0, 500, 5)) +
  scale_color_identity() + add_flags +
  theme(legend.position = "none")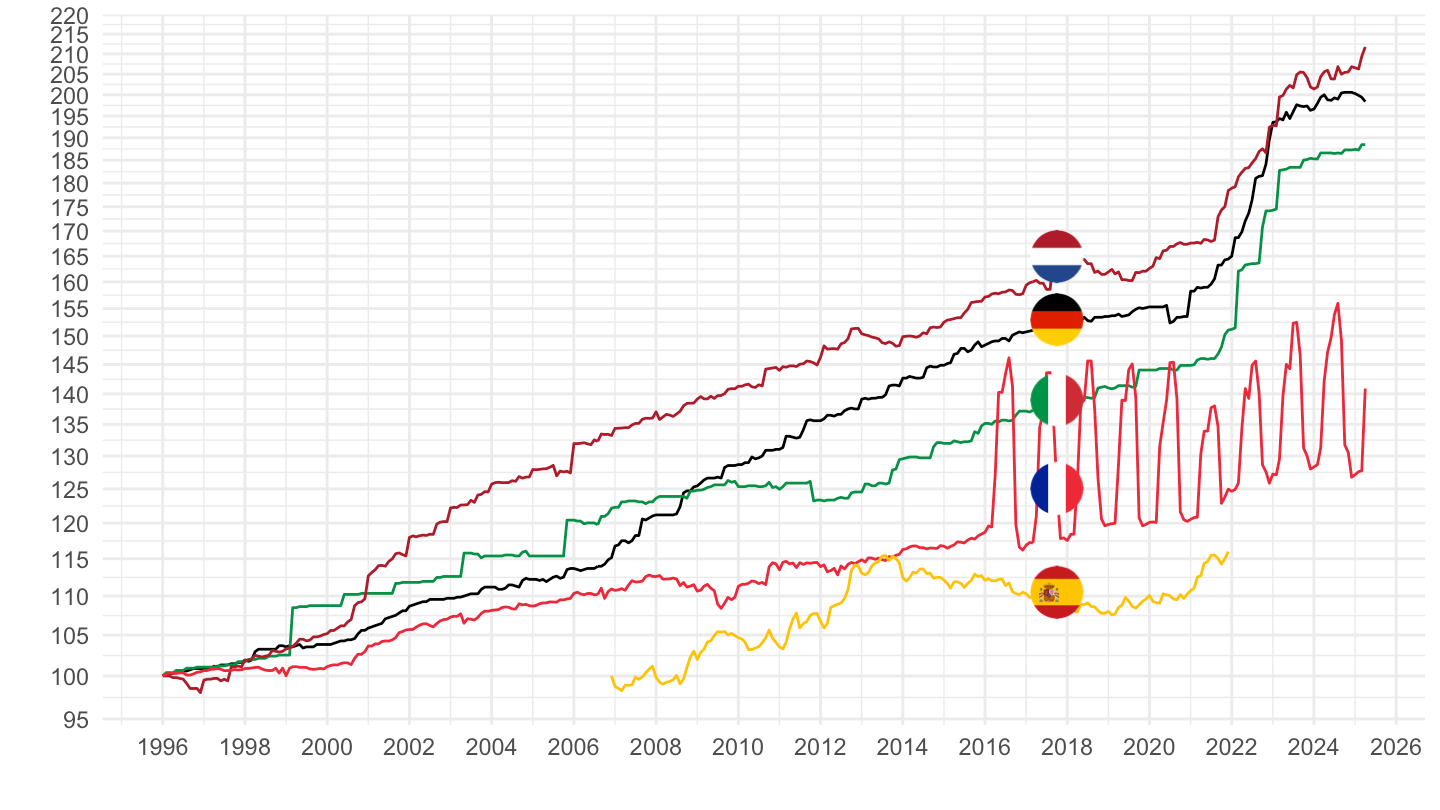
CP09131 - Computers
2015-
Code
prc_hicp_midx %>%
  filter(unit == "I15",
         coicop %in% c("CP09131"),
         geo %in% c("DE", "FR", "IT", "NL")) %>%

  select(geo, Geo, coicop, time, values) %>%
  month_to_date %>%
  filter(date >= as.Date("2015-01-01")) %>%
  group_by(Geo) %>%
  mutate(values = 100*values/values[date == as.Date("2015-01-01")]) %>%
  add_colors %>%
  ggplot(.) + geom_line(aes(x = date, y = values, color = color)) +
  theme_minimal() + xlab("") + ylab("") +
  scale_x_date(breaks = seq(1960, 2100, 2) %>% paste0("-01-01") %>% as.Date,
               labels = date_format("%Y")) +
  scale_y_log10(breaks = seq(0, 200, 5)) +
  scale_color_identity() + add_flags +
  theme(legend.position = "none")
CP08202 - Mobile Telephone equipment
Code
prc_hicp_midx %>%
  filter(unit == "I15",
         coicop %in% c("CP08202"),
         geo %in% c("DE", "FR", "IT", "NL")) %>%

  select(geo, Geo, coicop, time, values) %>%
  month_to_date %>%
  filter(date >= as.Date("2015-01-01")) %>%
  group_by(Geo) %>%
  mutate(values = 100*values/values[date == as.Date("2015-01-01")]) %>%
  add_colors %>%
  ggplot(.) + geom_line(aes(x = date, y = values, color = color)) +
  theme_minimal() + xlab("") + ylab("") +
  scale_x_date(breaks = seq(1960, 2100, 2) %>% paste0("-01-01") %>% as.Date,
               labels = date_format("%Y")) +
  scale_y_log10(breaks = seq(0, 200, 5)) +
  scale_color_identity() + add_flags +
  theme(legend.position = "none")
HICP - Non Europe
Switzerland, Norway, Iceland, Turkey, Serbia, United States, North Macedonia
Switzerland, Euro area
All
Code
prc_hicp_midx %>%
  filter(unit == "I15",
         coicop == "CP00",
         geo %in% c("CH", "EA")) %>%
  month_to_date %>%
  group_by(geo) %>%
  mutate(values = 100*values/values[date == as.Date("2010-01-01")]) %>%

  mutate(Geo = ifelse(geo == "EA", "Europe", Geo),
         Geo = ifelse(geo == "DE", "Germany", Geo)) %>%
  add_colors %>%
  ggplot(.) + geom_line(aes(x = date, y = values, color = color)) + add_flags +
  theme_minimal() + xlab("") + ylab("100 = Janv. 2010") + scale_color_identity() +
  scale_x_date(breaks = seq(1960, 2100, 2) %>% paste0("-01-01") %>% as.Date,
               labels = date_format("%Y")) +
  scale_y_log10(breaks = seq(0, 200, 5))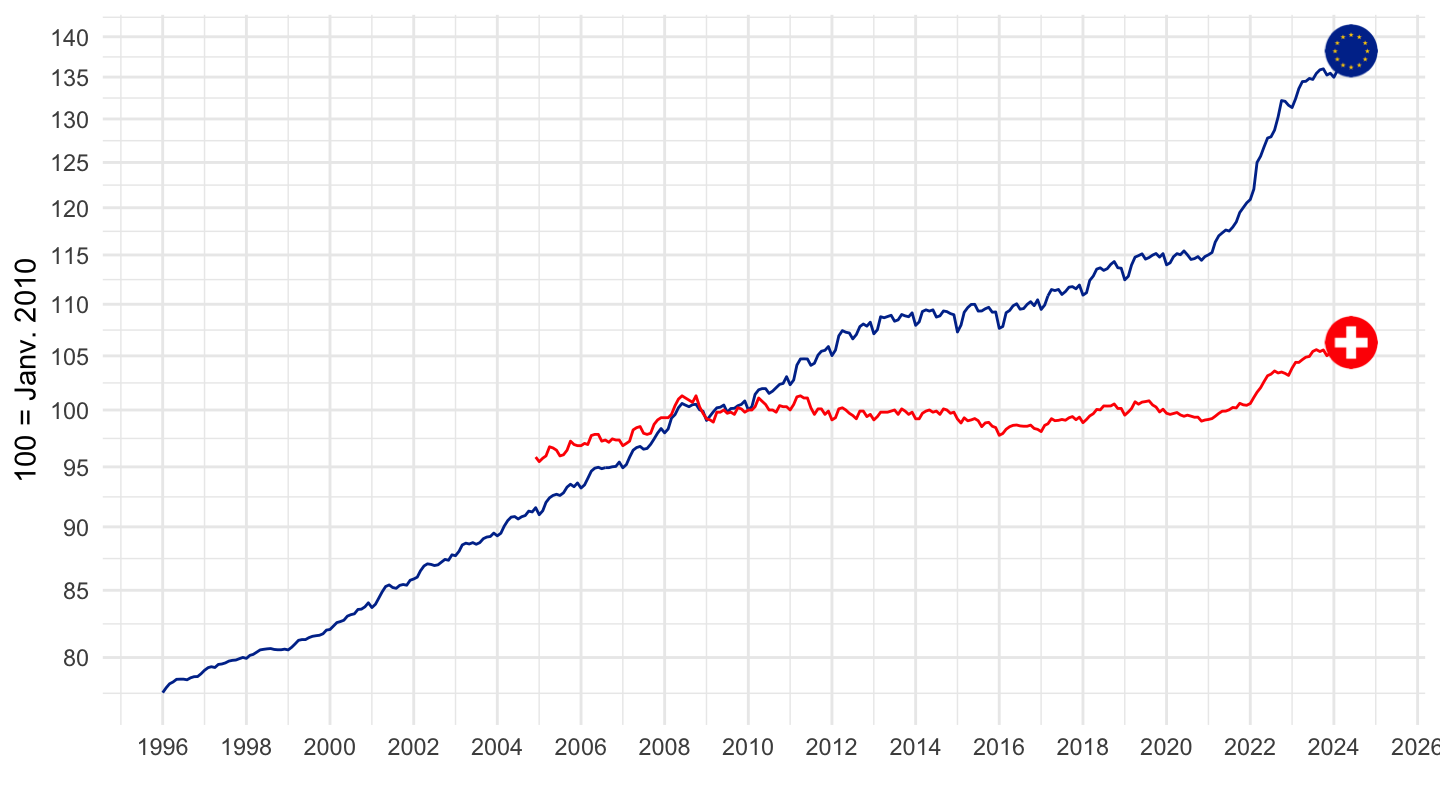
2010-
Code
prc_hicp_midx %>%
  filter(unit == "I15",
         coicop == "CP00",
         geo %in% c("CH", "EA")) %>%
  month_to_date %>%
  filter(date >= as.Date("2010-01-01")) %>%
  group_by(geo) %>%
  mutate(values = 100*values/values[date == as.Date("2010-01-01")]) %>%

  mutate(Geo = ifelse(geo == "EA", "Europe", Geo),
         Geo = ifelse(geo == "DE", "Germany", Geo)) %>%
  add_colors %>%
  ggplot(.) + geom_line(aes(x = date, y = values, color = color)) + add_flags +
  theme_minimal() + xlab("") + ylab("100 = Janv. 2010") + scale_color_identity() +
  scale_x_date(breaks = seq(1960, 2100, 2) %>% paste0("-01-01") %>% as.Date,
               labels = date_format("%Y")) +
  scale_y_log10(breaks = seq(0, 200, 5))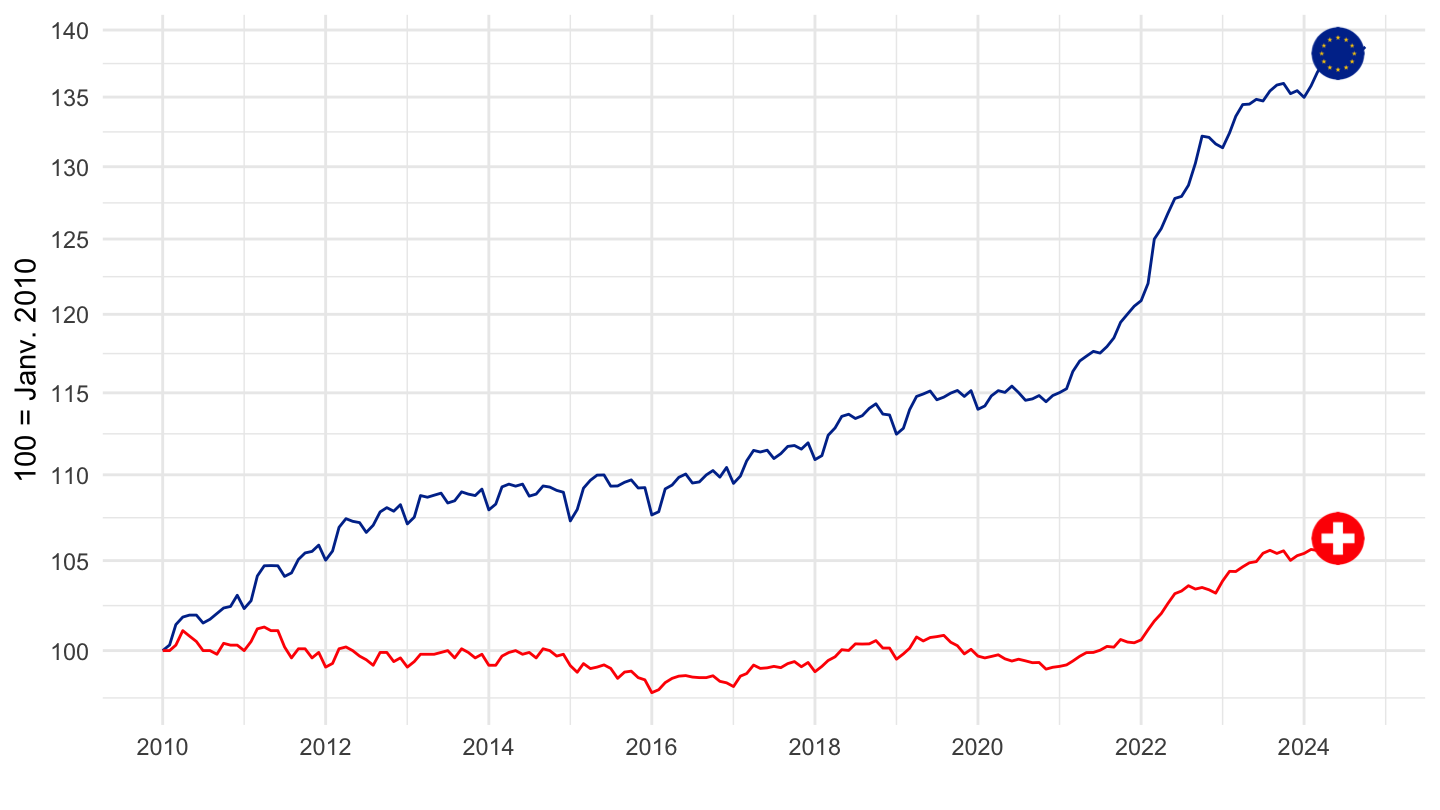
Norway, Euro area
All
Code
prc_hicp_midx %>%
  filter(unit == "I15",
         coicop == "CP00",
         geo %in% c("NO", "EA")) %>%
  month_to_date %>%
  group_by(geo) %>%
  mutate(values = 100*values/values[date == as.Date("2010-01-01")]) %>%

  mutate(Geo = ifelse(geo == "EA", "Europe", Geo),
         Geo = ifelse(geo == "DE", "Germany", Geo)) %>%
  add_colors %>%
  ggplot(.) + geom_line(aes(x = date, y = values, color = color)) + add_flags +
  theme_minimal() + xlab("") + ylab("100 = Janv. 2010") + scale_color_identity() +
  scale_x_date(breaks = seq(1960, 2100, 2) %>% paste0("-01-01") %>% as.Date,
               labels = date_format("%Y")) +
  scale_y_log10(breaks = seq(0, 200, 5))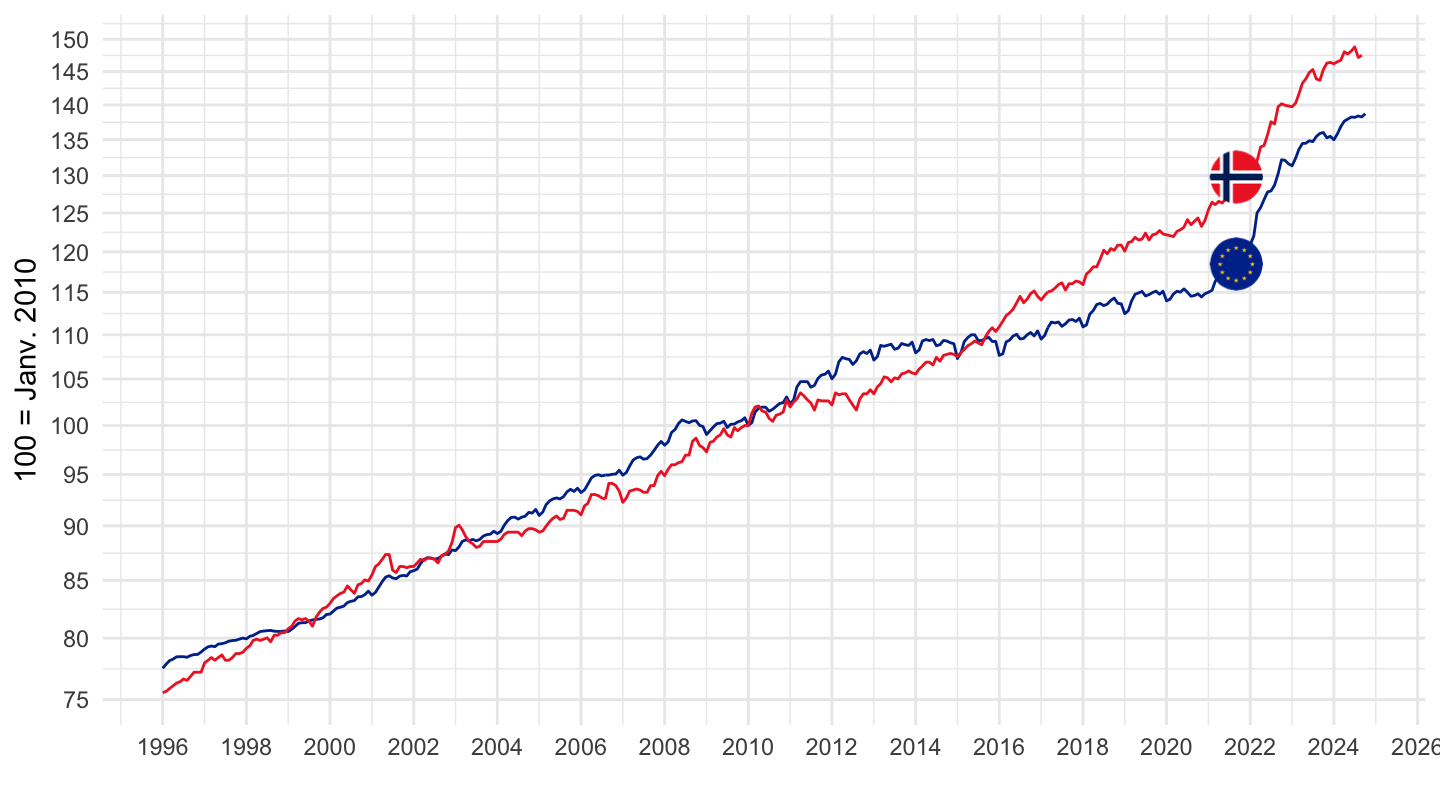
2010-
Code
prc_hicp_midx %>%
  filter(unit == "I15",
         coicop == "CP00",
         geo %in% c("NO", "EA")) %>%
  month_to_date %>%
  filter(date >= as.Date("2010-01-01")) %>%
  group_by(geo) %>%
  mutate(values = 100*values/values[date == as.Date("2010-01-01")]) %>%

  mutate(Geo = ifelse(geo == "EA", "Europe", Geo),
         Geo = ifelse(geo == "DE", "Germany", Geo)) %>%
  add_colors %>%
  ggplot(.) + geom_line(aes(x = date, y = values, color = color)) + add_flags +
  theme_minimal() + xlab("") + ylab("100 = Janv. 2010") + scale_color_identity() +
  scale_x_date(breaks = seq(1960, 2100, 2) %>% paste0("-01-01") %>% as.Date,
               labels = date_format("%Y")) +
  scale_y_log10(breaks = seq(0, 200, 5))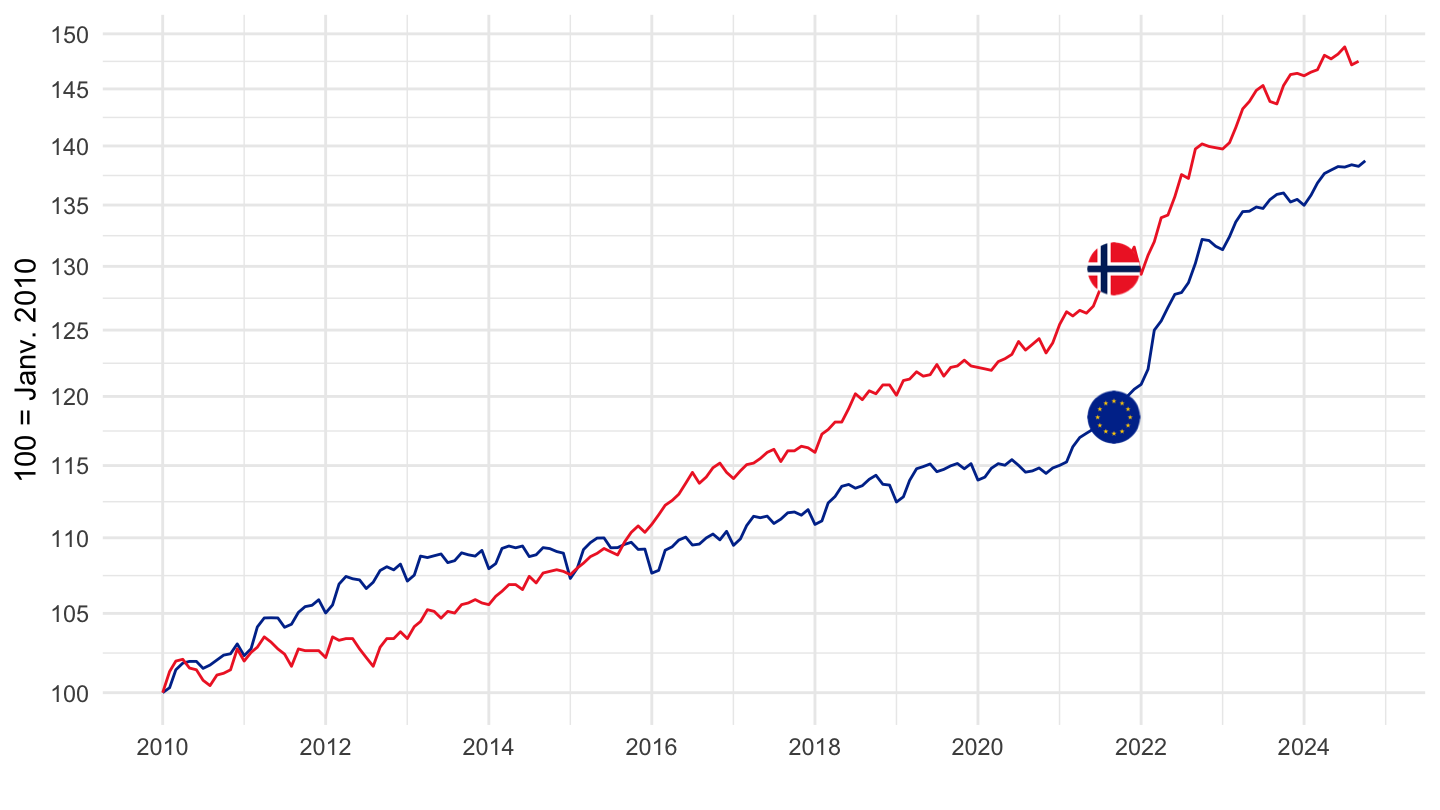
Iceland, Euro area
All
Code
prc_hicp_midx %>%
  filter(unit == "I15",
         coicop == "CP00",
         geo %in% c("IS", "EA")) %>%
  month_to_date %>%
  group_by(geo) %>%
  mutate(values = 100*values/values[date == as.Date("2010-01-01")]) %>%

  mutate(Geo = ifelse(geo == "EA", "Europe", Geo),
         Geo = ifelse(geo == "DE", "Germany", Geo)) %>%
  add_colors %>%
  ggplot(.) + geom_line(aes(x = date, y = values, color = color)) + add_flags +
  theme_minimal() + xlab("") + ylab("100 = Janv. 2010") + scale_color_identity() +
  scale_x_date(breaks = seq(1960, 2100, 2) %>% paste0("-01-01") %>% as.Date,
               labels = date_format("%Y")) +
  scale_y_log10(breaks = seq(0, 200, 5))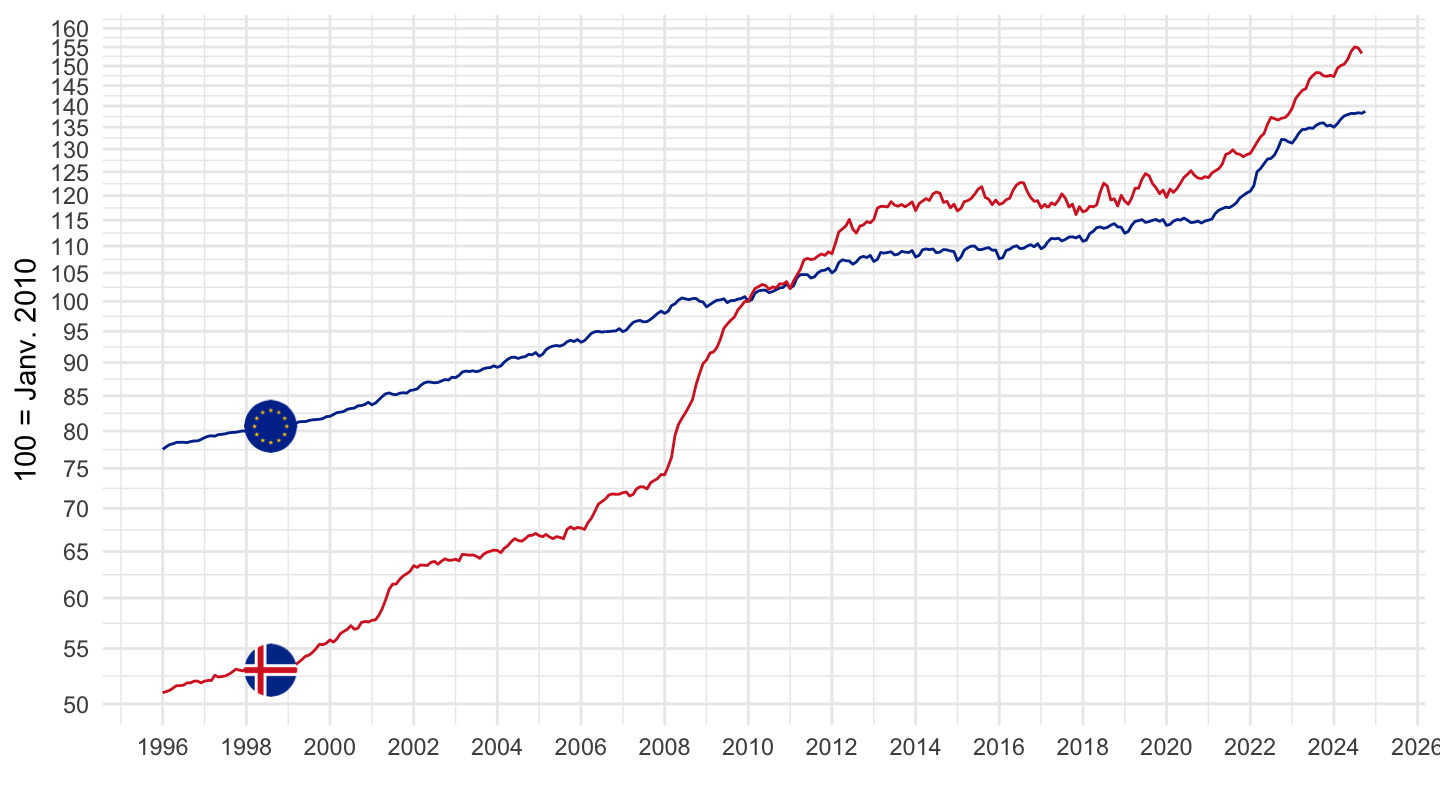
2006-
Code
prc_hicp_midx %>%
  filter(unit == "I15",
         coicop == "CP00",
         geo %in% c("IS", "EA")) %>%
  month_to_date %>%
  filter(date >= as.Date("2006-01-01")) %>%
  group_by(geo) %>%
  mutate(values = 100*values/values[date == as.Date("2006-01-01")]) %>%

  mutate(Geo = ifelse(geo == "EA", "Europe", Geo),
         Geo = ifelse(geo == "DE", "Germany", Geo)) %>%
  add_colors %>%
  ggplot(.) + geom_line(aes(x = date, y = values, color = color)) + add_flags +
  theme_minimal() + xlab("") + ylab("100 = Janv. 2010") + scale_color_identity() +
  scale_x_date(breaks = seq(1960, 2100, 2) %>% paste0("-01-01") %>% as.Date,
               labels = date_format("%Y")) +
  scale_y_log10(breaks = seq(0, 200, 5))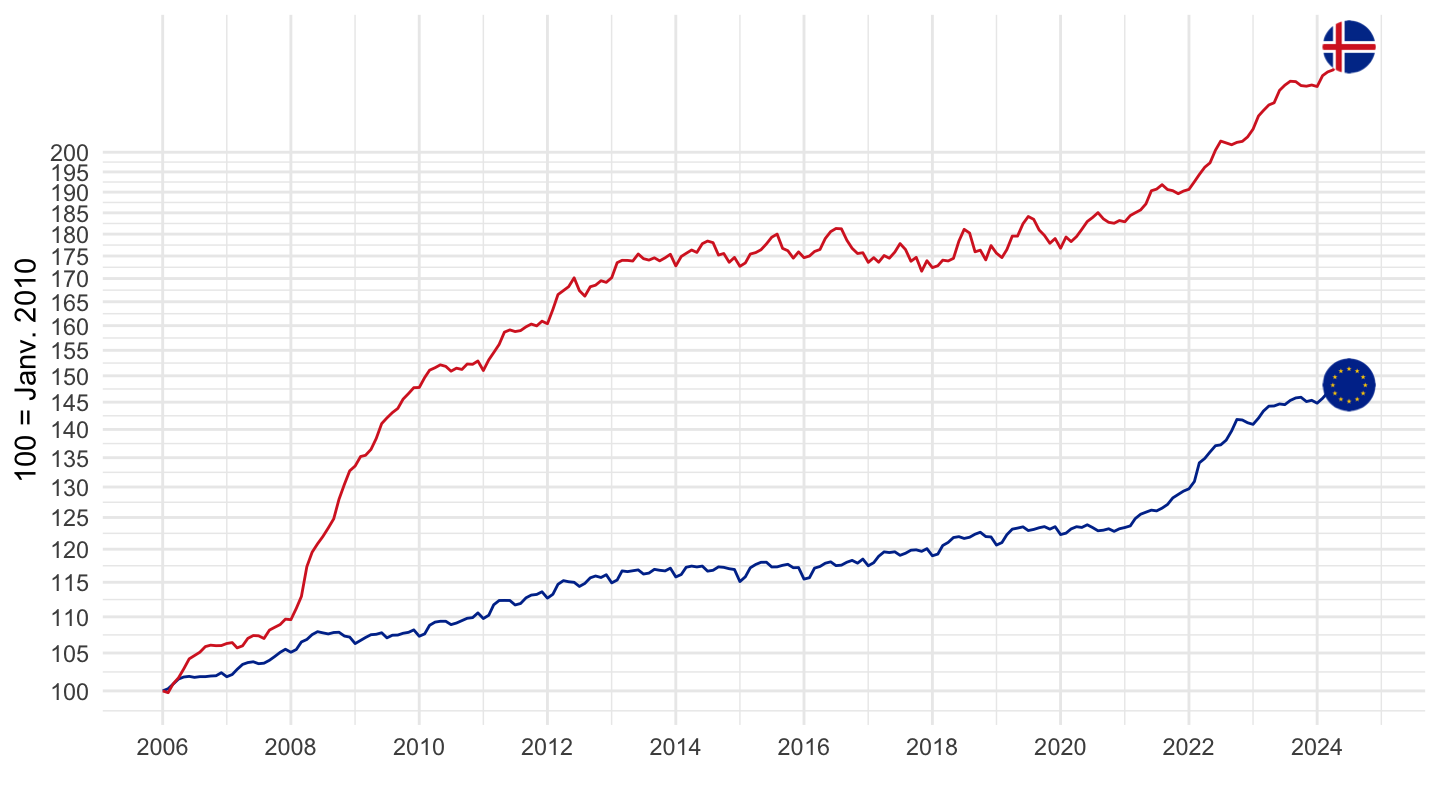
2010-
Code
prc_hicp_midx %>%
  filter(unit == "I15",
         coicop == "CP00",
         geo %in% c("IS", "EA")) %>%
  month_to_date %>%
  filter(date >= as.Date("2010-01-01")) %>%
  group_by(geo) %>%
  mutate(values = 100*values/values[date == as.Date("2010-01-01")]) %>%

  mutate(Geo = ifelse(geo == "EA", "Europe", Geo),
         Geo = ifelse(geo == "DE", "Germany", Geo)) %>%
  add_colors %>%
  ggplot(.) + geom_line(aes(x = date, y = values, color = color)) + add_flags +
  theme_minimal() + xlab("") + ylab("100 = Janv. 2010") + scale_color_identity() +
  scale_x_date(breaks = seq(1960, 2100, 2) %>% paste0("-01-01") %>% as.Date,
               labels = date_format("%Y")) +
  scale_y_log10(breaks = seq(0, 200, 5))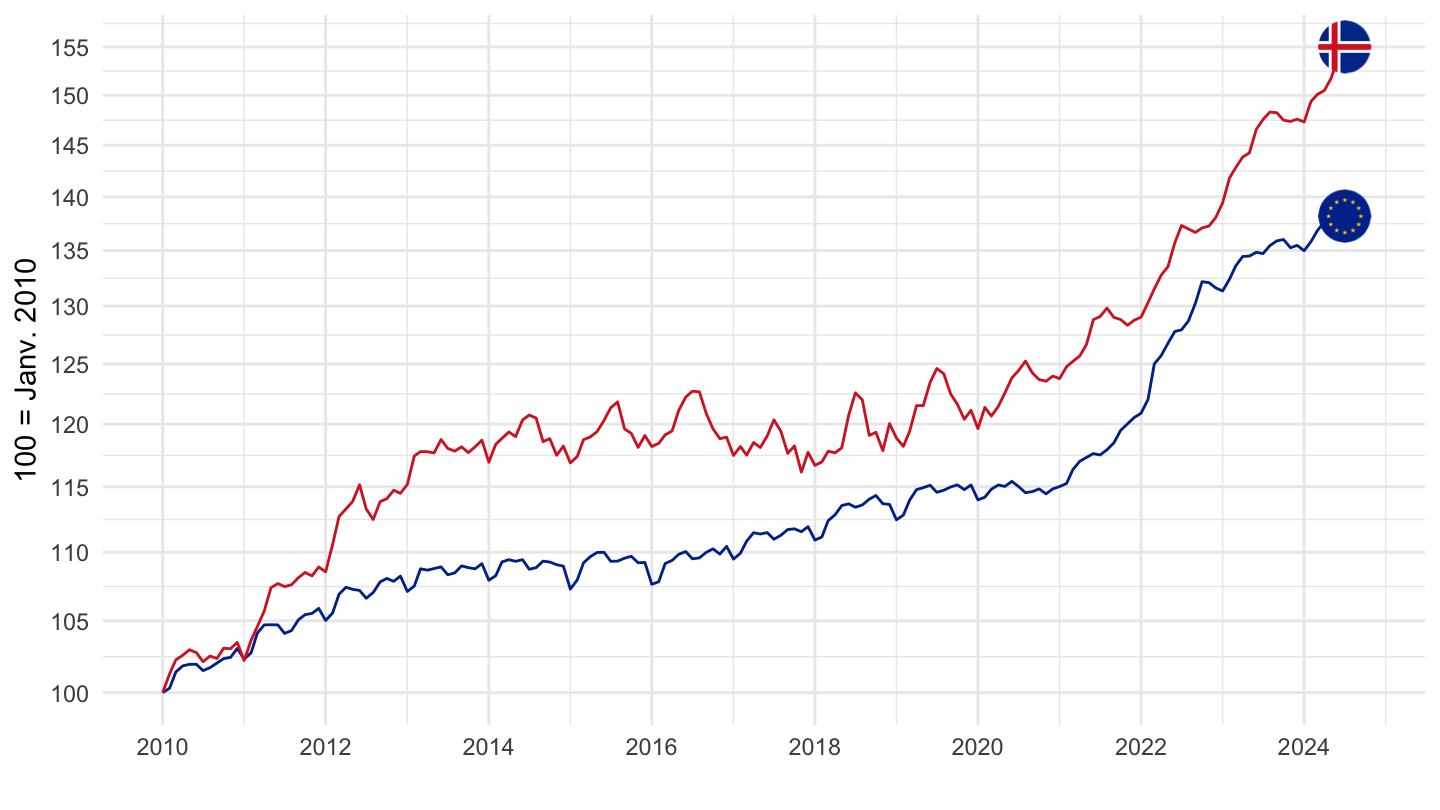
Turkey, Euro area
All
Code
prc_hicp_midx %>%
  filter(unit == "I15",
         coicop == "CP00",
         geo %in% c("TR", "EA")) %>%
  month_to_date %>%
  group_by(geo) %>%
  mutate(values = 100*values/values[date == as.Date("2010-01-01")]) %>%

  mutate(Geo = ifelse(geo == "EA", "Europe", Geo),
         Geo = ifelse(geo == "TR", "Turkey", Geo)) %>%
  add_colors %>%
  ggplot(.) + geom_line(aes(x = date, y = values, color = color)) + add_flags +
  theme_minimal() + xlab("") + ylab("100 = Janv. 2010") + scale_color_identity() +
  scale_x_date(breaks = seq(1960, 2100, 2) %>% paste0("-01-01") %>% as.Date,
               labels = date_format("%Y")) +
  scale_y_log10(breaks = seq(0, 200, 5))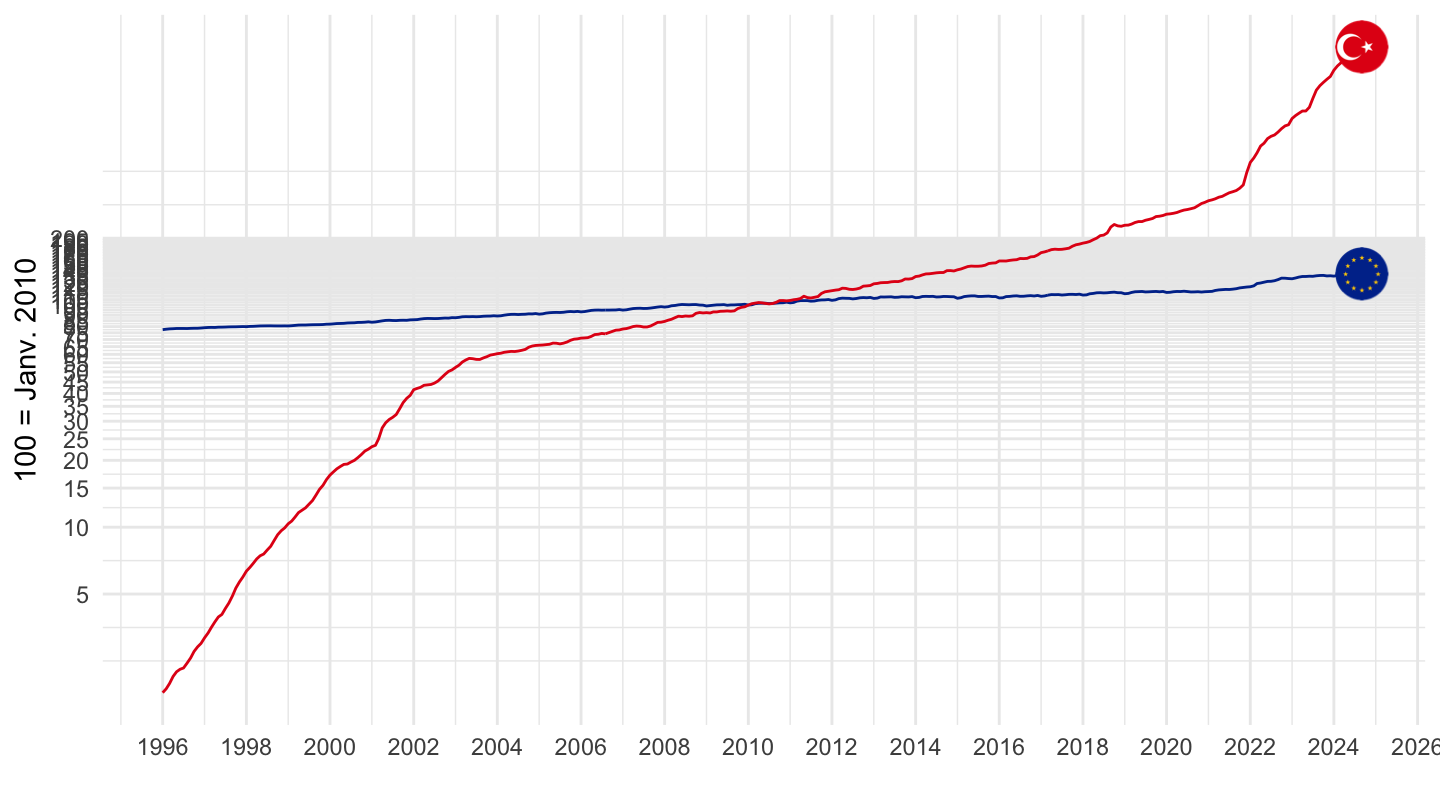
2010-
Code
prc_hicp_midx %>%
  filter(unit == "I15",
         coicop == "CP00",
         geo %in% c("TR", "EA")) %>%
  month_to_date %>%
  filter(date >= as.Date("2010-01-01")) %>%
  group_by(geo) %>%
  mutate(values = 100*values/values[date == as.Date("2010-01-01")]) %>%

  mutate(Geo = ifelse(geo == "EA", "Europe", Geo),
         Geo = ifelse(geo == "TR", "Turkey", Geo)) %>%
  add_colors %>%
  ggplot(.) + geom_line(aes(x = date, y = values, color = color)) + add_flags +
  theme_minimal() + xlab("") + ylab("100 = Janv. 2010") + scale_color_identity() +
  scale_x_date(breaks = seq(1960, 2100, 2) %>% paste0("-01-01") %>% as.Date,
               labels = date_format("%Y")) +
  scale_y_log10(breaks = seq(0, 400, 20))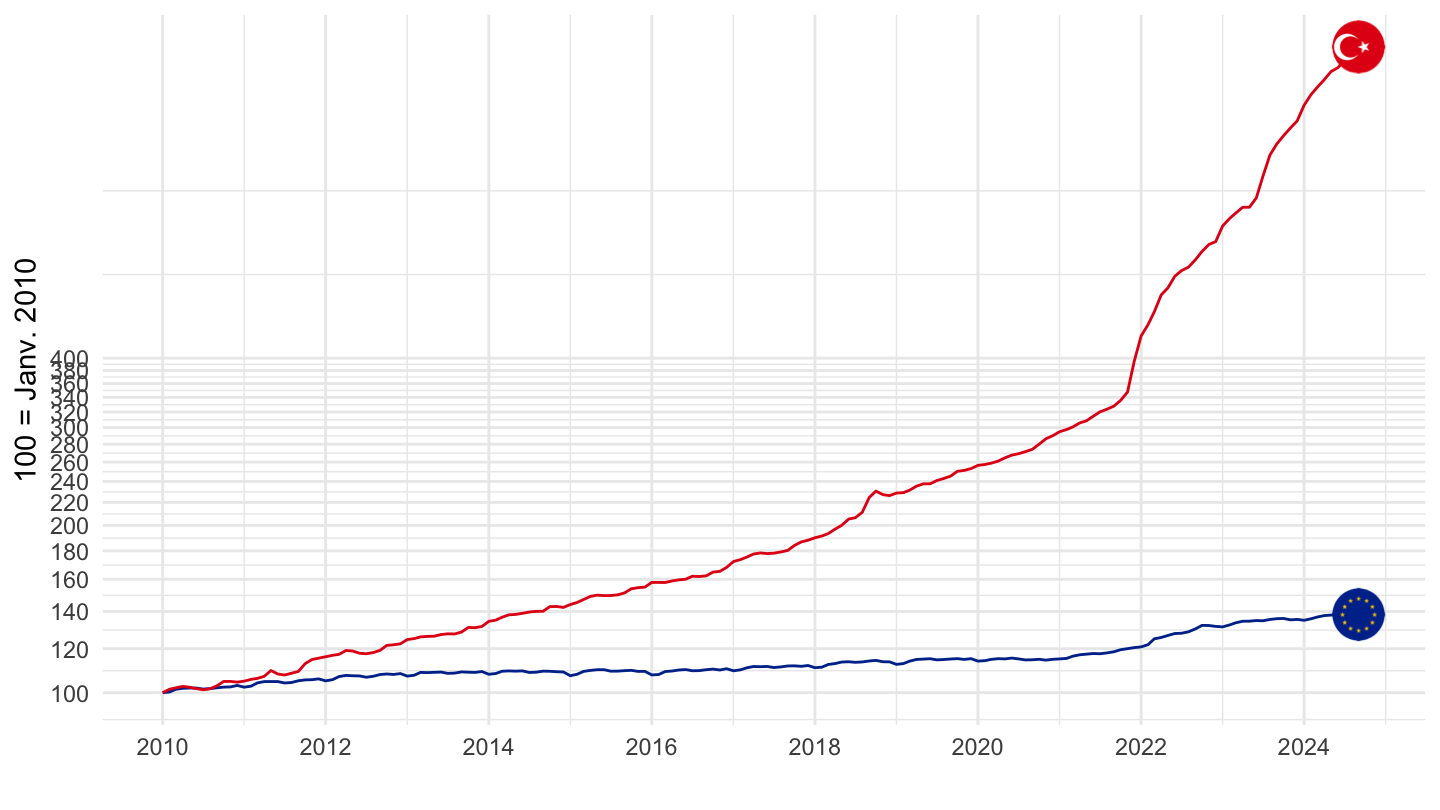
Serbia, Euro area
All
Code
prc_hicp_midx %>%
  filter(unit == "I15",
         coicop == "CP00",
         geo %in% c("RS", "EA")) %>%
  month_to_date %>%
  group_by(geo) %>%
  mutate(values = 100*values/values[date == as.Date("2010-01-01")]) %>%

  mutate(Geo = ifelse(geo == "EA", "Europe", Geo),
         Geo = ifelse(geo == "DE", "Germany", Geo)) %>%
  add_colors %>%
  ggplot(.) + geom_line(aes(x = date, y = values, color = color)) + add_flags +
  theme_minimal() + xlab("") + ylab("100 = Janv. 2010") + scale_color_identity() +
  scale_x_date(breaks = seq(1960, 2100, 2) %>% paste0("-01-01") %>% as.Date,
               labels = date_format("%Y")) +
  scale_y_log10(breaks = seq(0, 200, 5))
2010-
Code
prc_hicp_midx %>%
  filter(unit == "I15",
         coicop == "CP00",
         geo %in% c("RS", "EA")) %>%
  month_to_date %>%
  filter(date >= as.Date("2010-01-01")) %>%
  group_by(geo) %>%
  mutate(values = 100*values/values[date == as.Date("2010-01-01")]) %>%

  mutate(Geo = ifelse(geo == "EA", "Europe", Geo),
         Geo = ifelse(geo == "DE", "Germany", Geo)) %>%
  add_colors %>%
  ggplot(.) + geom_line(aes(x = date, y = values, color = color)) + add_flags +
  theme_minimal() + xlab("") + ylab("100 = Janv. 2010") + scale_color_identity() +
  scale_x_date(breaks = seq(1960, 2100, 2) %>% paste0("-01-01") %>% as.Date,
               labels = date_format("%Y")) +
  scale_y_log10(breaks = seq(0, 200, 5))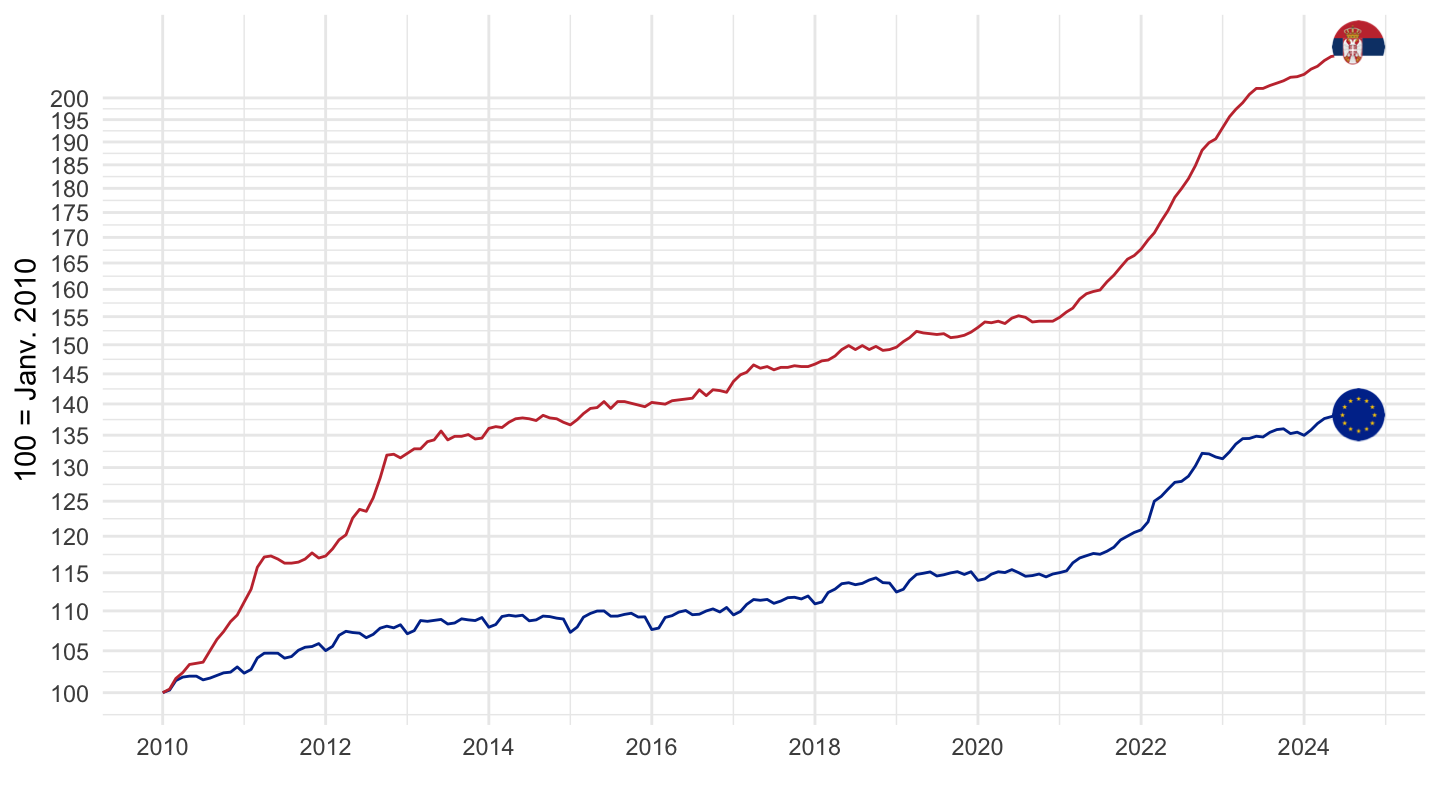
United States, Euro area
All
Code
prc_hicp_midx %>%
  filter(unit == "I15",
         coicop == "CP00",
         geo %in% c("US", "EA")) %>%
  month_to_date %>%
  group_by(geo) %>%
  mutate(values = 100*values/values[date == as.Date("2010-01-01")]) %>%

  mutate(Geo = ifelse(geo == "EA", "Europe", Geo),
         Geo = ifelse(geo == "DE", "Germany", Geo)) %>%
  add_colors %>%
  mutate(color = ifelse(geo == "US", color2, color)) %>%
  ggplot(.) + geom_line(aes(x = date, y = values, color = color)) + add_flags +
  theme_minimal() + xlab("") + ylab("100 = Janv. 2010") + scale_color_identity() +
  scale_x_date(breaks = seq(1960, 2100, 2) %>% paste0("-01-01") %>% as.Date,
               labels = date_format("%Y")) +
  scale_y_log10(breaks = seq(0, 200, 5))
2010-
Code
prc_hicp_midx %>%
  filter(unit == "I15",
         coicop == "CP00",
         geo %in% c("US", "EA")) %>%
  month_to_date %>%
  filter(date >= as.Date("2010-01-01")) %>%
  group_by(geo) %>%
  mutate(values = 100*values/values[date == as.Date("2010-01-01")]) %>%

  mutate(Geo = ifelse(geo == "EA", "Europe", Geo),
         Geo = ifelse(geo == "DE", "Germany", Geo)) %>%
  add_colors %>%
  mutate(color = ifelse(geo == "US", color2, color)) %>%
  ggplot(.) + geom_line(aes(x = date, y = values, color = color)) + add_flags +
  theme_minimal() + xlab("") + ylab("100 = Janv. 2010") + scale_color_identity() +
  scale_x_date(breaks = seq(1960, 2100, 2) %>% paste0("-01-01") %>% as.Date,
               labels = date_format("%Y")) +
  scale_y_log10(breaks = seq(0, 200, 5))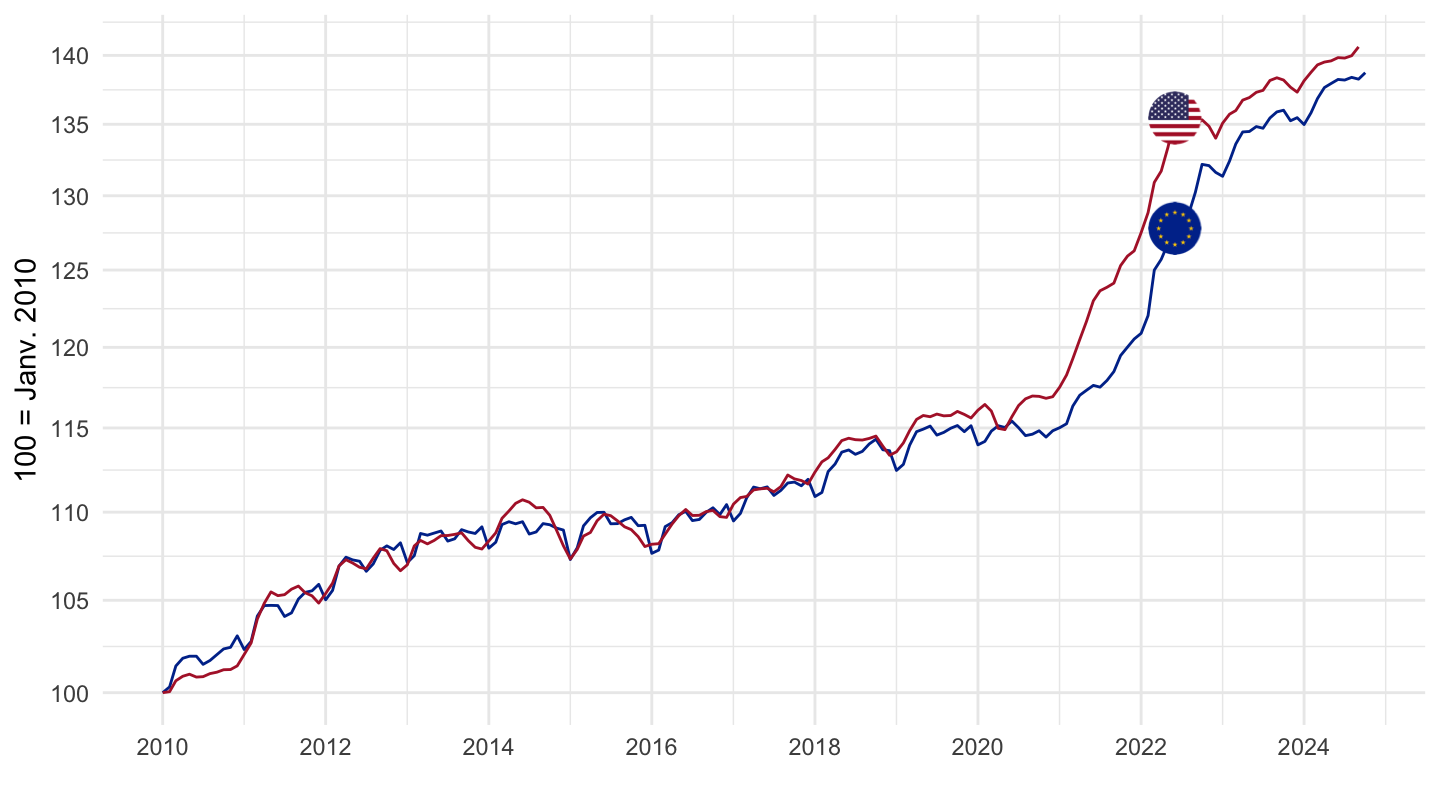
HICP - Eurozone
Austria, Belgium, Cyprus, Estonia, Finland, France, Germany, Greece, Ireland, Italy, Latvia, Lithuania, Luxembourg, Malta, the Netherlands, Portugal, Slovakia, Slovenia, and Spain.
France, Eurozone
2019Q4-
Code
prc_hicp_midx %>%
  filter(unit == "I15",
         coicop == "CP00",
         geo %in% c("FR", "EA")) %>%
  month_to_date %>%
  filter(date >= as.Date("2019-12-01")) %>%
  group_by(geo) %>%
  mutate(values = 100*values/values[date == as.Date("2019-12-01")]) %>%

  mutate(Geo = ifelse(geo == "EA", "Europe", Geo)) %>%
  add_colors %>%
  ggplot(.) + geom_line(aes(x = date, y = values, color = color)) + add_flags +
  theme_minimal() + xlab("") + ylab("100 = Oct 2021") + scale_color_identity() +
  scale_x_date(breaks = "1 month",
               labels = date_format("%b %Y")) +
  scale_y_log10(breaks = seq(0, 400, 2)) +
  theme(axis.text.x = element_text(angle = 45, vjust = 1, hjust = 1))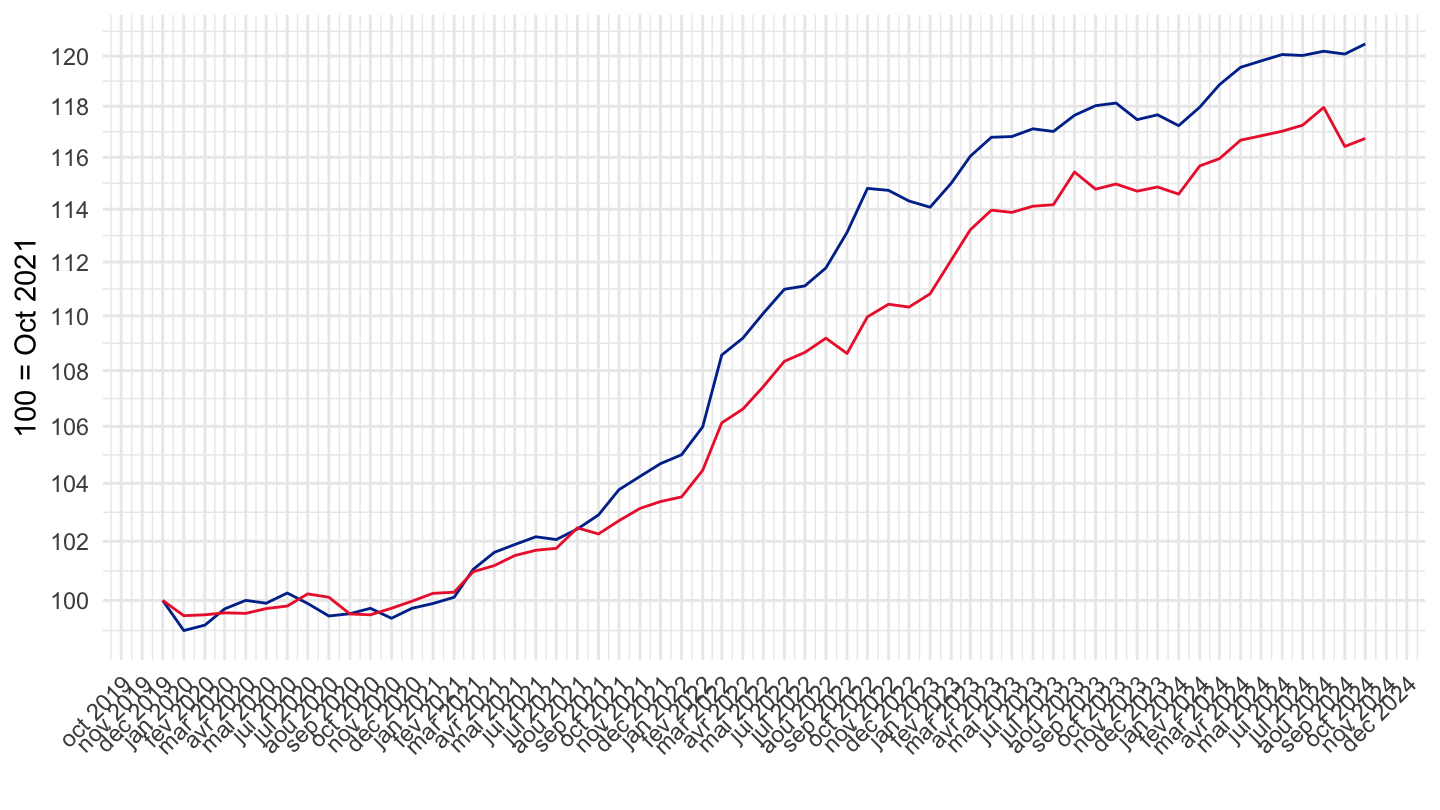
France, Germany
All
Code
prc_hicp_midx %>%
  filter(unit == "I15",
         coicop == "CP00",
         geo %in% c("FR", "DE")) %>%
  month_to_date %>%
  group_by(geo) %>%
  mutate(values = 100*values/values[date == as.Date("1996-01-01")]) %>%

  mutate(Geo = ifelse(geo == "EA", "Europe", Geo),
         Geo = ifelse(geo == "DE", "Germany", Geo)) %>%
  add_colors %>%
  ggplot(.) + geom_line(aes(x = date, y = values, color = color)) + add_flags +
  theme_minimal() + xlab("") + ylab("100 = Janv. 2010") + scale_color_identity() +
  scale_x_date(breaks = seq(1960, 2100, 2) %>% paste0("-01-01") %>% as.Date,
               labels = date_format("%Y")) +
  scale_y_log10(breaks = seq(0, 200, 10))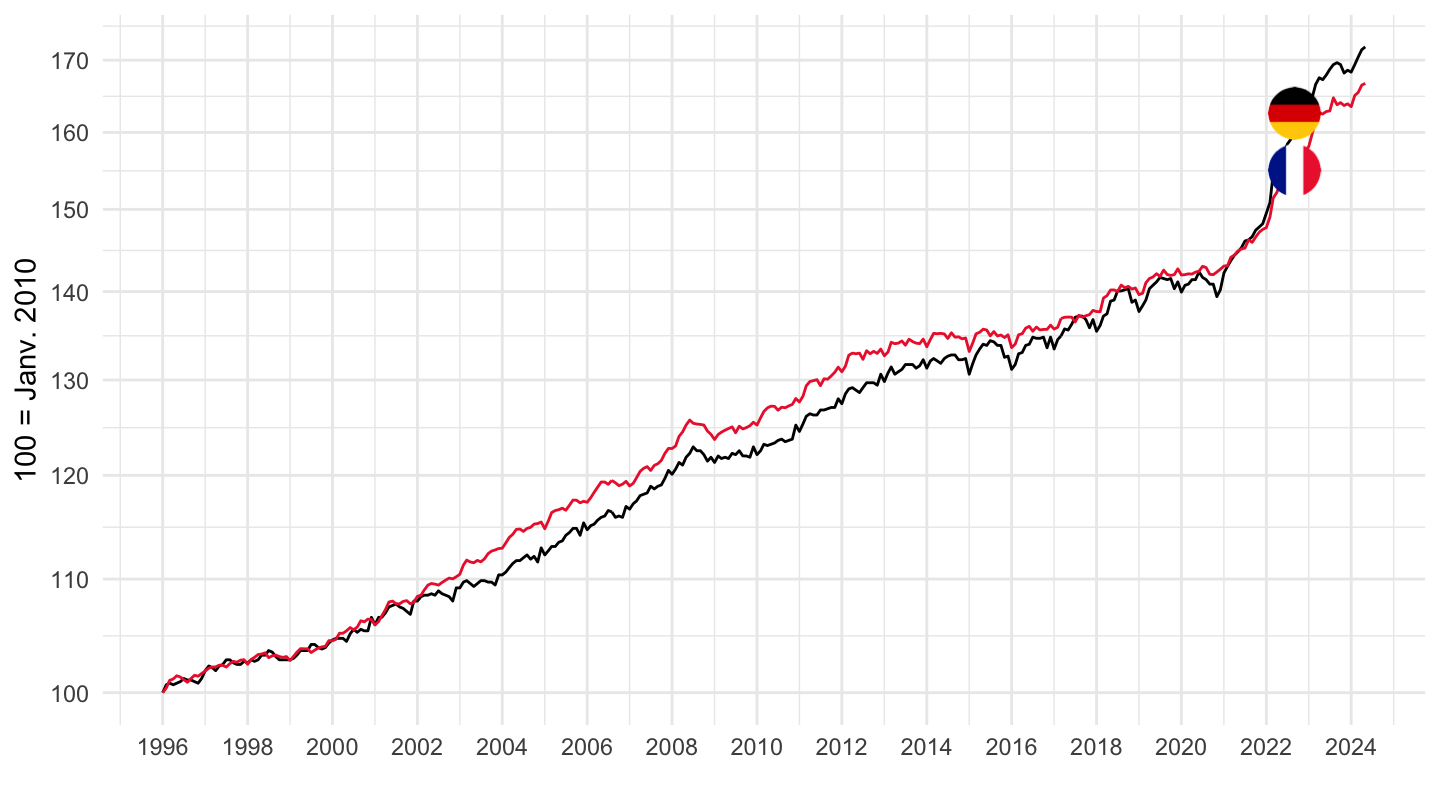
1999-
Code
prc_hicp_midx %>%
  filter(unit == "I15",
         coicop == "CP00",
         geo %in% c("FR", "DE")) %>%
  month_to_date %>%
  filter(date >= as.Date("1999-01-01")) %>%
  group_by(geo) %>%
  mutate(values = 100*values/values[date == as.Date("1999-01-01")]) %>%

  mutate(Geo = ifelse(geo == "EA", "Europe", Geo),
         Geo = ifelse(geo == "DE", "Germany", Geo)) %>%
  add_colors %>%
  ggplot(.) + geom_line(aes(x = date, y = values, color = color)) + add_flags +
  theme_minimal() + xlab("") + ylab("100 = Janv. 2010") + scale_color_identity() +
  scale_x_date(breaks = c(seq(1997, 2100, 5), seq(1999, 2100, 5)) %>% paste0("-01-01") %>% as.Date,
               labels = date_format("%Y")) +
  scale_y_log10(breaks = seq(0, 200, 10)) +
  geom_label_repel(data = . %>% filter(date %in% c(max(date), as.Date("2023-07-01"))), aes(x = date, y = values, color = color, label = round(values, 1)))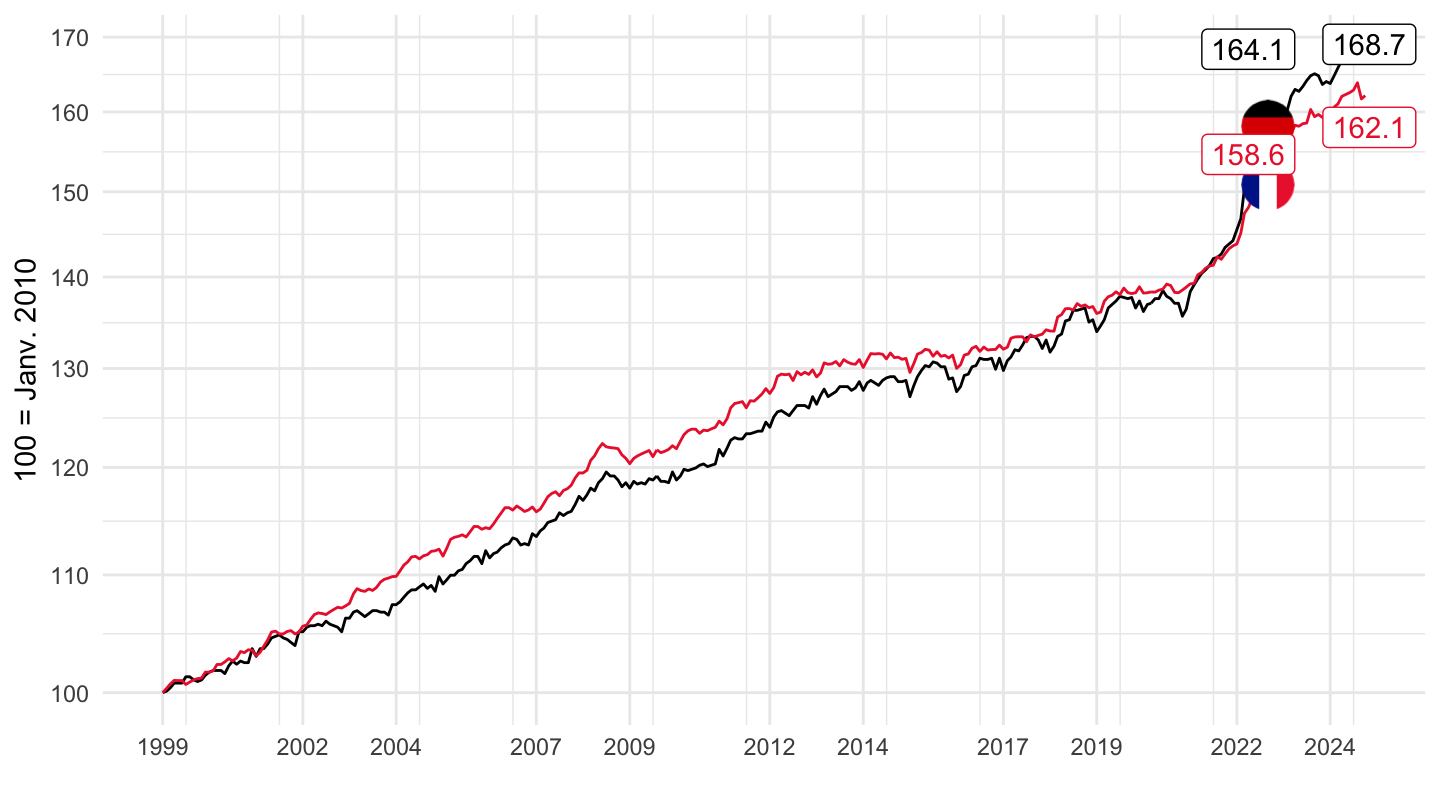
France, Europe, Luxembourg, Belgium
All
Code
prc_hicp_midx %>%
  filter(unit == "I15",
         coicop == "CP00",
         geo %in% c("FR", "EA", "LU", "BE")) %>%
  month_to_date %>%
  group_by(geo) %>%
  mutate(values = 100*values/values[date == as.Date("1996-01-01")]) %>%

  mutate(Geo = ifelse(geo == "EA", "Europe", Geo)) %>%
  add_colors %>%
  ggplot(.) + geom_line(aes(x = date, y = values, color = color)) + add_flags +
  theme_minimal() + xlab("") + ylab("100 = Janv. 2010") + scale_color_identity() +
  scale_x_date(breaks = seq(1960, 2100, 2) %>% paste0("-01-01") %>% as.Date,
               labels = date_format("%Y")) +
  scale_y_log10(breaks = seq(0, 400, 10))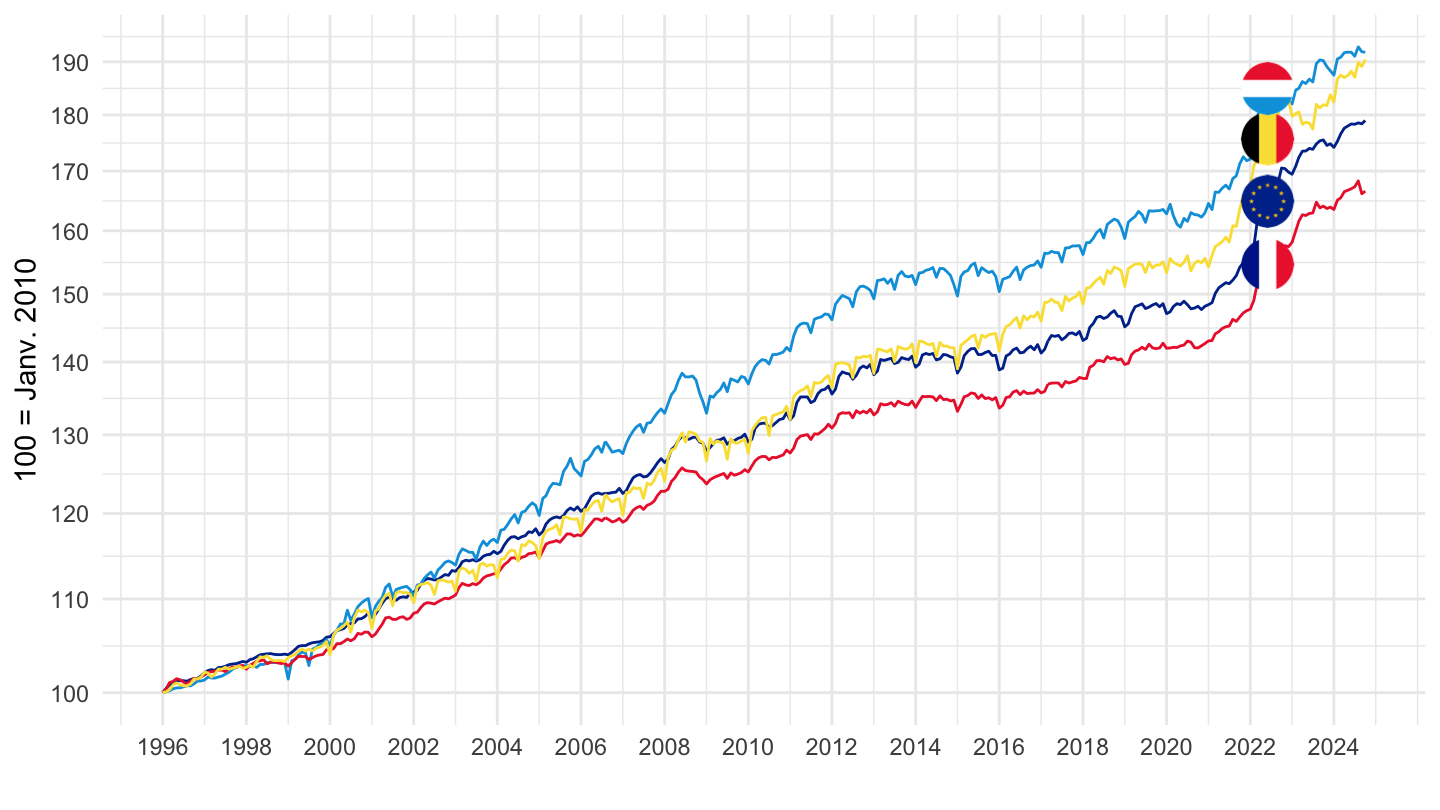
2000-
Code
prc_hicp_midx %>%
  filter(unit == "I15",
         coicop == "CP00",
         geo %in% c("FR", "EA", "LU", "BE")) %>%
  month_to_date %>%
  filter(date >= as.Date("2000-01-01")) %>%
  group_by(geo) %>%
  mutate(values = 100*values/values[date == as.Date("2000-01-01")]) %>%

  mutate(Geo = ifelse(geo == "EA", "Europe", Geo)) %>%
  add_colors %>%
  ggplot(.) + geom_line(aes(x = date, y = values, color = color)) + add_flags +
  theme_minimal() + xlab("") + ylab("100 = Janv. 2010") + scale_color_identity() +
  scale_x_date(breaks = seq(1960, 2100, 2) %>% paste0("-01-01") %>% as.Date,
               labels = date_format("%Y")) +
  scale_y_log10(breaks = seq(0, 400, 10))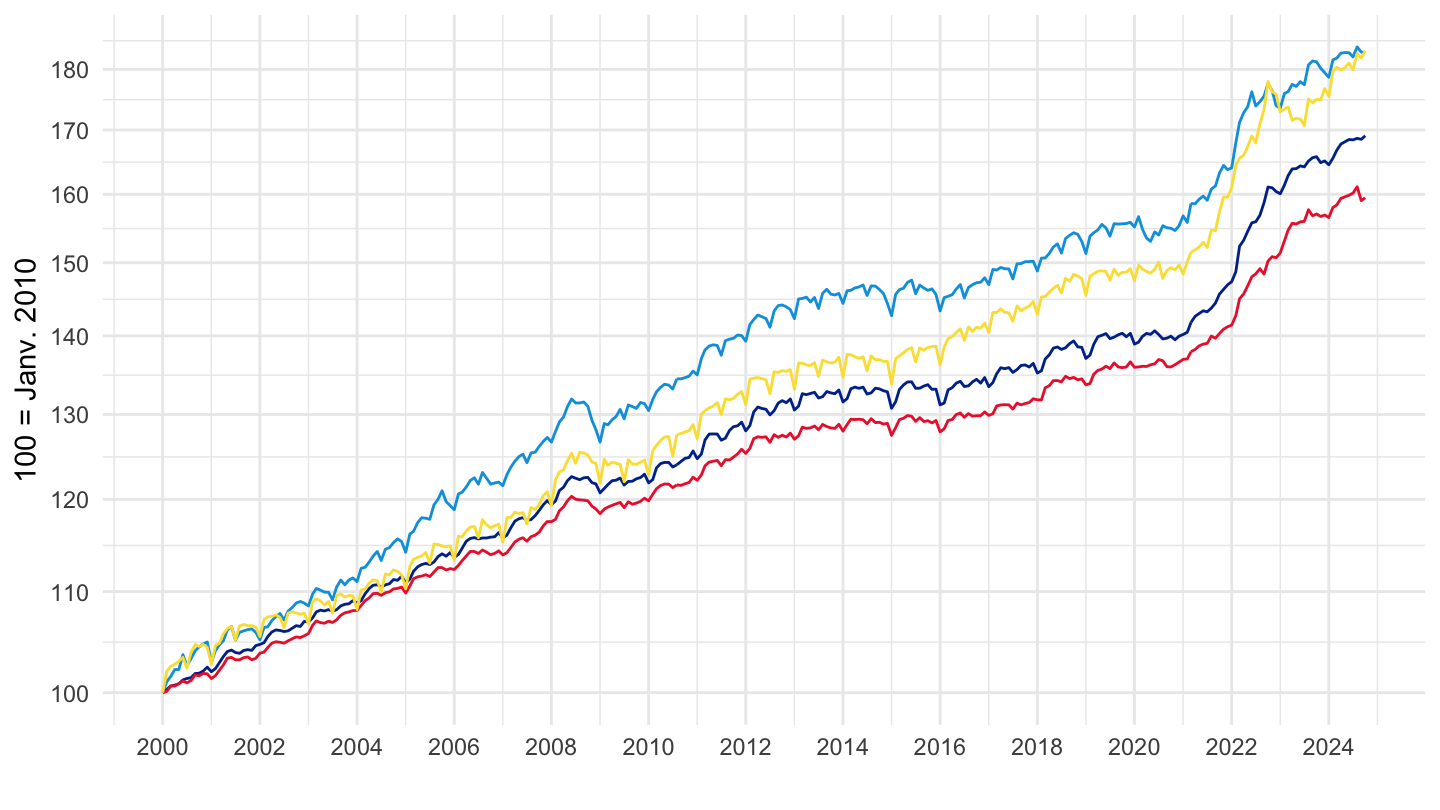
2010-
Code
prc_hicp_midx %>%
  filter(unit == "I15",
         coicop == "CP00",
         geo %in% c("FR", "EA", "LU", "BE")) %>%
  month_to_date %>%
  filter(date >= as.Date("2010-01-01")) %>%
  group_by(geo) %>%
  mutate(values = 100*values/values[date == as.Date("2010-01-01")]) %>%

  mutate(Geo = ifelse(geo == "EA", "Europe", Geo)) %>%
  add_colors %>%
  ggplot(.) + geom_line(aes(x = date, y = values, color = color)) + add_flags +
  theme_minimal() + xlab("") + ylab("100 = Janv. 2010") + scale_color_identity() +
  scale_x_date(breaks = seq(1960, 2100, 2) %>% paste0("-01-01") %>% as.Date,
               labels = date_format("%Y")) +
  scale_y_log10(breaks = seq(0, 400, 5))
2021-
Code
prc_hicp_midx %>%
  filter(unit == "I15",
         coicop == "CP00",
         geo %in% c("FR", "EA", "LU", "BE")) %>%
  month_to_date %>%
  filter(date >= as.Date("2021-01-01")) %>%
  group_by(geo) %>%
  mutate(values = 100*values/values[date == as.Date("2021-01-01")]) %>%

  mutate(Geo = ifelse(geo == "EA", "Europe", Geo)) %>%
  add_colors %>%
  ggplot(.) + geom_line(aes(x = date, y = values, color = color)) + add_flags +
  theme_minimal() + xlab("") + ylab("100 = Oct 2021") + scale_color_identity() +
  scale_x_date(breaks = "1 month",
               labels = date_format("%b %Y")) +
  scale_y_log10(breaks = seq(0, 400, 2)) +
  theme(axis.text.x = element_text(angle = 45, vjust = 1, hjust = 1))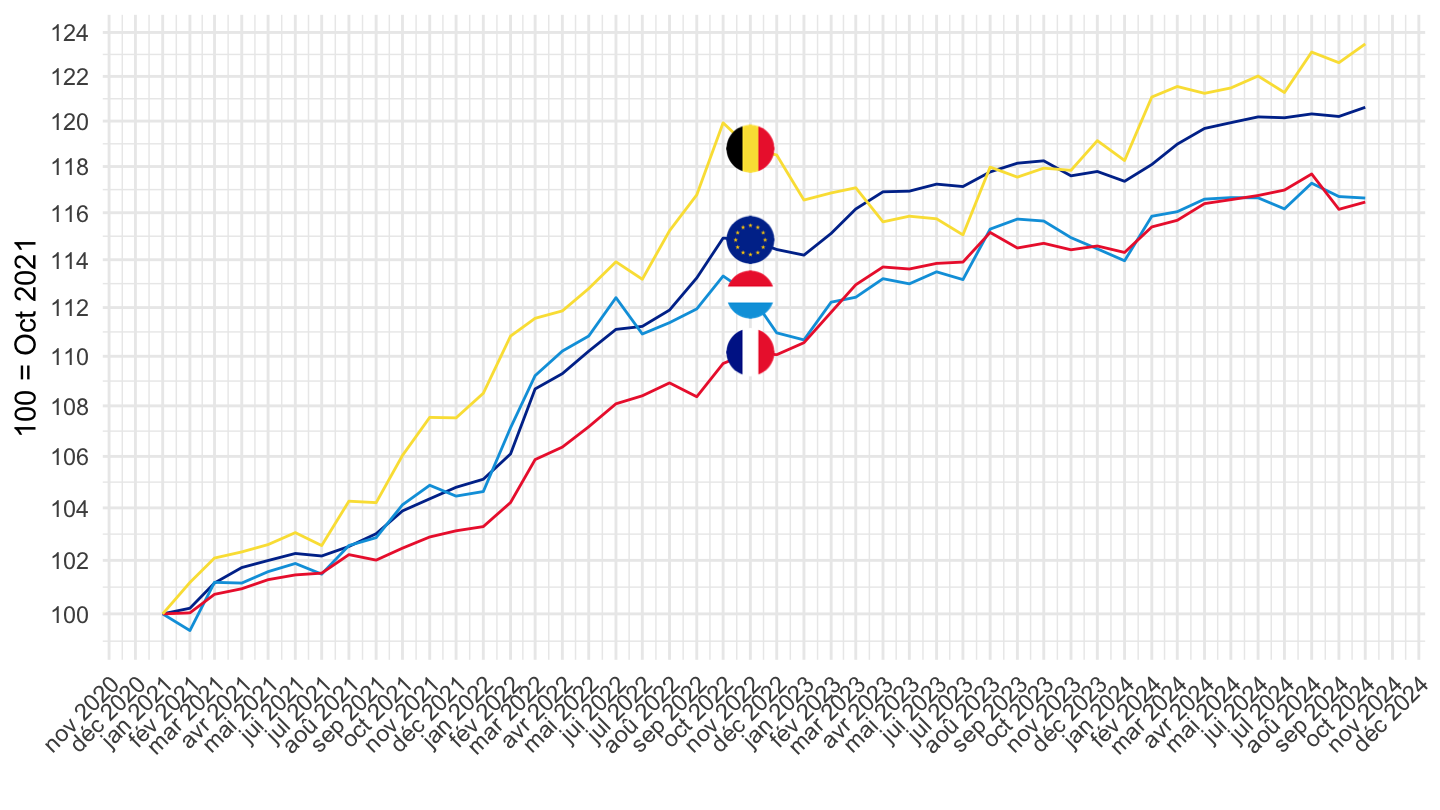
October 2021-
Code
prc_hicp_midx %>%
  filter(unit == "I15",
         coicop == "CP00",
         geo %in% c("FR", "EA", "LU", "BE")) %>%
  month_to_date %>%
  filter(date >= as.Date("2021-10-01")) %>%
  group_by(geo) %>%
  mutate(values = 100*values/values[date == as.Date("2021-10-01")]) %>%

  mutate(Geo = ifelse(geo == "EA", "Europe", Geo)) %>%
  add_colors %>%
  ggplot(.) + geom_line(aes(x = date, y = values, color = color)) + add_flags +
  theme_minimal() + xlab("") + ylab("100 = Oct 2021") + scale_color_identity() +
  scale_x_date(breaks = "1 month",
               labels = date_format("%b %Y")) +
  scale_y_log10(breaks = seq(0, 400, 2)) +
  theme(axis.text.x = element_text(angle = 45, vjust = 1, hjust = 1))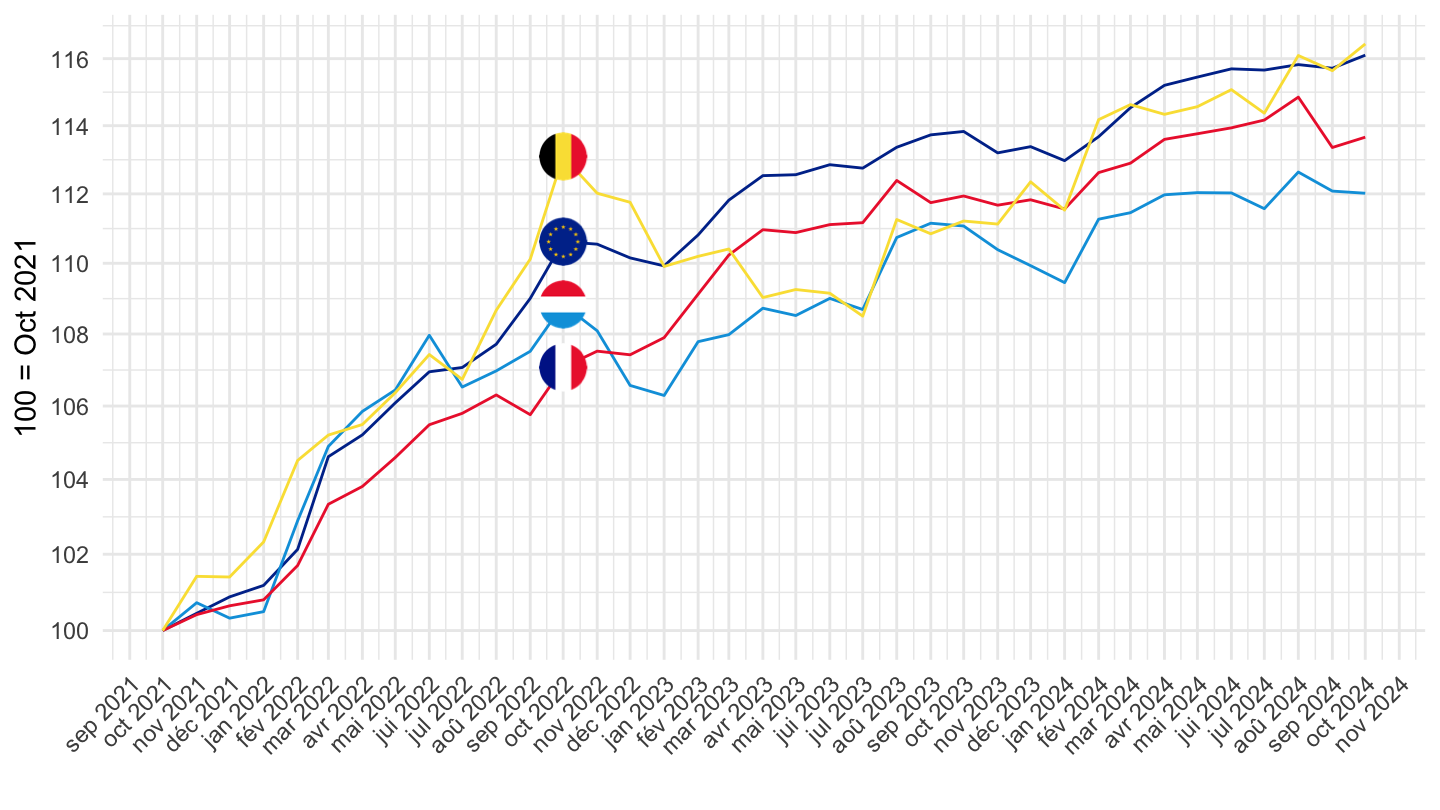
February 2022-
Code
prc_hicp_midx %>%
  filter(unit == "I15",
         coicop == "CP00",
         geo %in% c("FR", "EA", "LU", "BE")) %>%
  month_to_date %>%
  filter(date >= as.Date("2022-02-01")) %>%
  group_by(geo) %>%
  mutate(values = 100*values/values[date == as.Date("2022-02-01")]) %>%

  mutate(Geo = ifelse(geo == "EA", "Europe", Geo)) %>%
  add_colors %>%
  ggplot(.) + geom_line(aes(x = date, y = values, color = color)) + add_flags +
  theme_minimal() + xlab("") + ylab("100 = Oct 2021") + scale_color_identity() +
  scale_x_date(breaks = "3 months",
               labels = date_format("%b %Y")) +
  scale_y_log10(breaks = seq(0, 400, 2))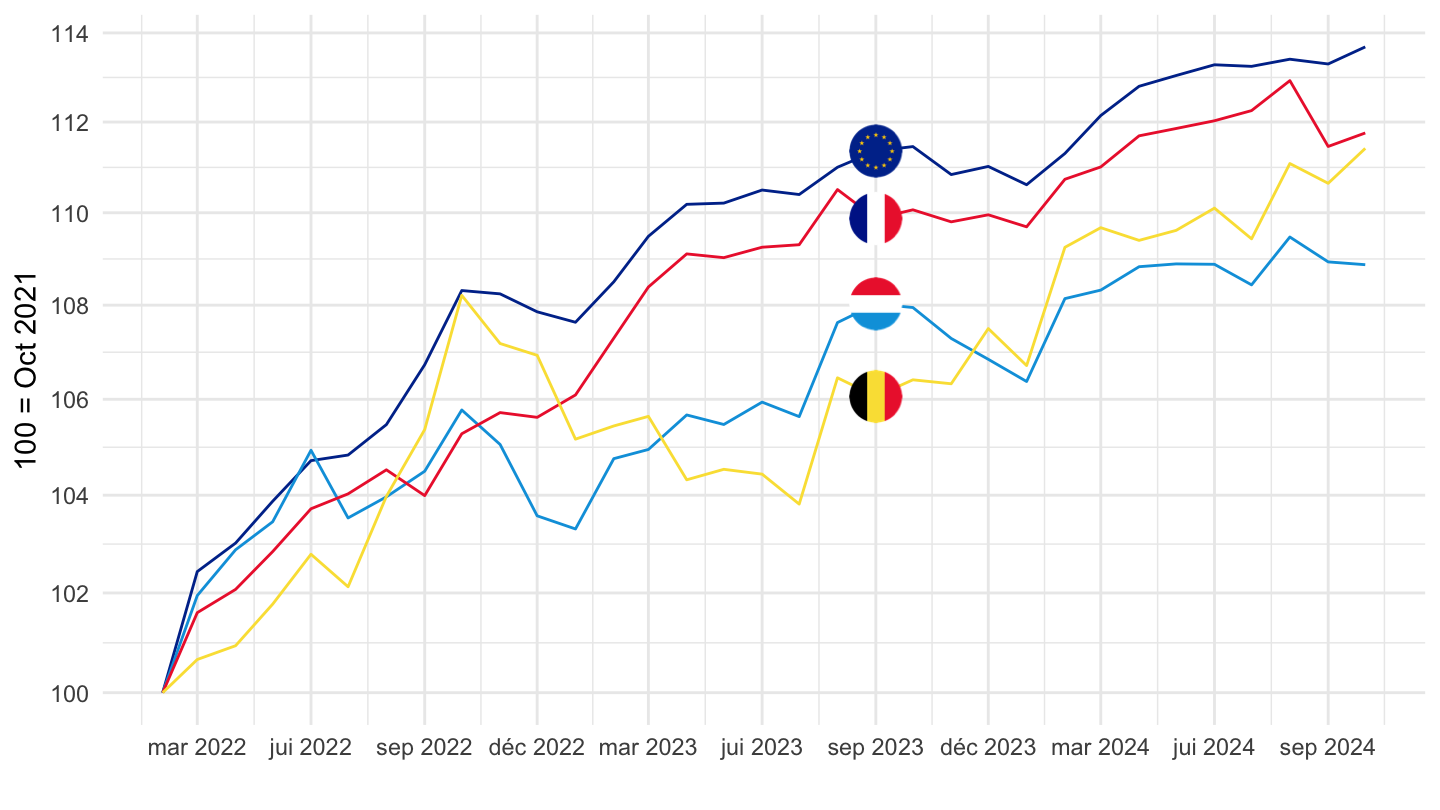
Austria, Belgium, Cyprus, Estonia
Code
prc_hicp_midx %>%
  filter(unit == "I15",
         coicop %in% c("CP00"),
         geo %in% c("AT", "BE", "CY", "EE")) %>%

  select(geo, Geo, coicop, time, values) %>%
  month_to_date %>%
  group_by(Geo) %>%
  mutate(values = 100*values/values[date == as.Date("1996-01-01")]) %>%
  add_colors %>%
  mutate(color = ifelse(geo == "EE", color2, color)) %>%
  ggplot(.) + geom_line(aes(x = date, y = values, color = color)) + add_flags +
  theme_minimal() + xlab("") + ylab("100 = Janv. 2010") + scale_color_identity() +
  scale_x_date(breaks = seq(1960, 2100, 2) %>% paste0("-01-01") %>% as.Date,
               labels = date_format("%Y")) +
  scale_y_log10(breaks = seq(0, 400, 20))
France, Germany, Italy, Greece
Code
prc_hicp_midx %>%
  filter(unit == "I15",
         coicop %in% c("CP00"),
         geo %in% c("FR", "DE", "IT", "EL")) %>%

  select(geo, Geo, coicop, time, values) %>%
  month_to_date %>%
  group_by(Geo) %>%
  mutate(values = 100*values/values[date == as.Date("1996-01-01")]) %>%
  add_colors %>%
  mutate(color = ifelse(geo == "EE", color2, color)) %>%
  ggplot(.) + geom_line(aes(x = date, y = values, color = color)) + add_flags +
  theme_minimal() + xlab("") + ylab("100 = Janv. 2010") + scale_color_identity() +
  scale_x_date(breaks = seq(1960, 2100, 2) %>% paste0("-01-01") %>% as.Date,
               labels = date_format("%Y")) +
  scale_y_log10(breaks = seq(0, 400, 10))
France, Germany, Italy, Spain, Belgium, Netherlands
All
Code
prc_hicp_midx %>%
  filter(unit == "I15",
         coicop %in% c("CP00"),
         geo %in% c("FR", "DE", "IT", "ES", "BE", "NL")) %>%

  select(geo, Geo, coicop, time, values) %>%
  month_to_date %>%
  group_by(Geo) %>%
  mutate(values = 100*values/values[date == as.Date("1996-01-01")]) %>%
  add_colors %>%
  ggplot(.) + geom_line(aes(x = date, y = values, color = color)) + add_flags +
  theme_minimal() + xlab("") + ylab("100 = Janv. 2010") + scale_color_identity() +
  scale_x_date(breaks = seq(1960, 2100, 2) %>% paste0("-01-01") %>% as.Date,
               labels = date_format("%Y")) +
  scale_y_log10(breaks = seq(0, 400, 10))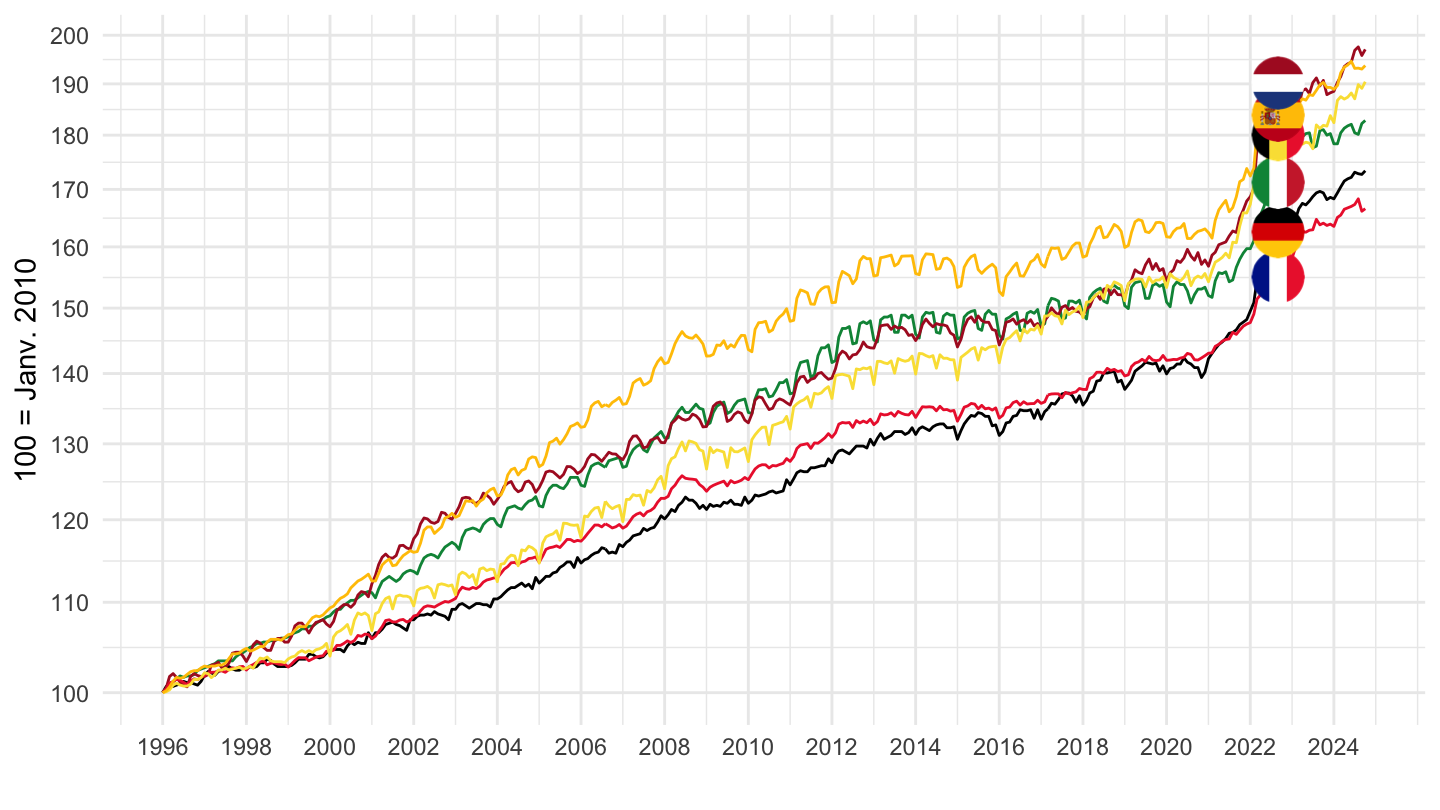
2017-
Code
prc_hicp_midx %>%
  filter(unit == "I15",
         coicop %in% c("CP00"),
         geo %in% c("FR", "DE", "IT", "ES", "BE", "NL")) %>%

  select(geo, Geo, coicop, time, values) %>%
  month_to_date %>%
  filter(date >= as.Date("2017-01-01")) %>%
  group_by(Geo) %>%
  mutate(values = 100*values/values[date == as.Date("2017-01-01")]) %>%
  add_colors %>%
  ggplot(.) + geom_line(aes(x = date, y = values, color = color)) + add_flags +
  theme_minimal() + xlab("") + ylab("100 = Janv. 2010") + scale_color_identity() +
  scale_x_date(breaks = seq(1960, 2100, 2) %>% paste0("-01-01") %>% as.Date,
               labels = date_format("%Y")) +
  scale_y_log10(breaks = seq(0, 400, 10))
October 2021
Code
prc_hicp_midx %>%
  filter(unit == "I15",
         coicop %in% c("CP00"),
         geo %in% c("FR", "DE", "IT", "ES", "BE", "NL")) %>%

  select(geo, Geo, coicop, time, values) %>%
  month_to_date %>%
  filter(date >= as.Date("2021-10-01")) %>%
  group_by(Geo) %>%
  mutate(values = 100*values/values[date == as.Date("2021-10-01")]) %>%
  add_colors %>%
  ggplot(.) + geom_line(aes(x = date, y = values, color = color)) + add_flags +
  theme_minimal() + xlab("") + ylab("") + scale_color_identity() +
  scale_x_date(breaks = "3 months",
               labels = date_format("%b %Y")) +
  scale_y_log10(breaks = seq(0, 400, 2))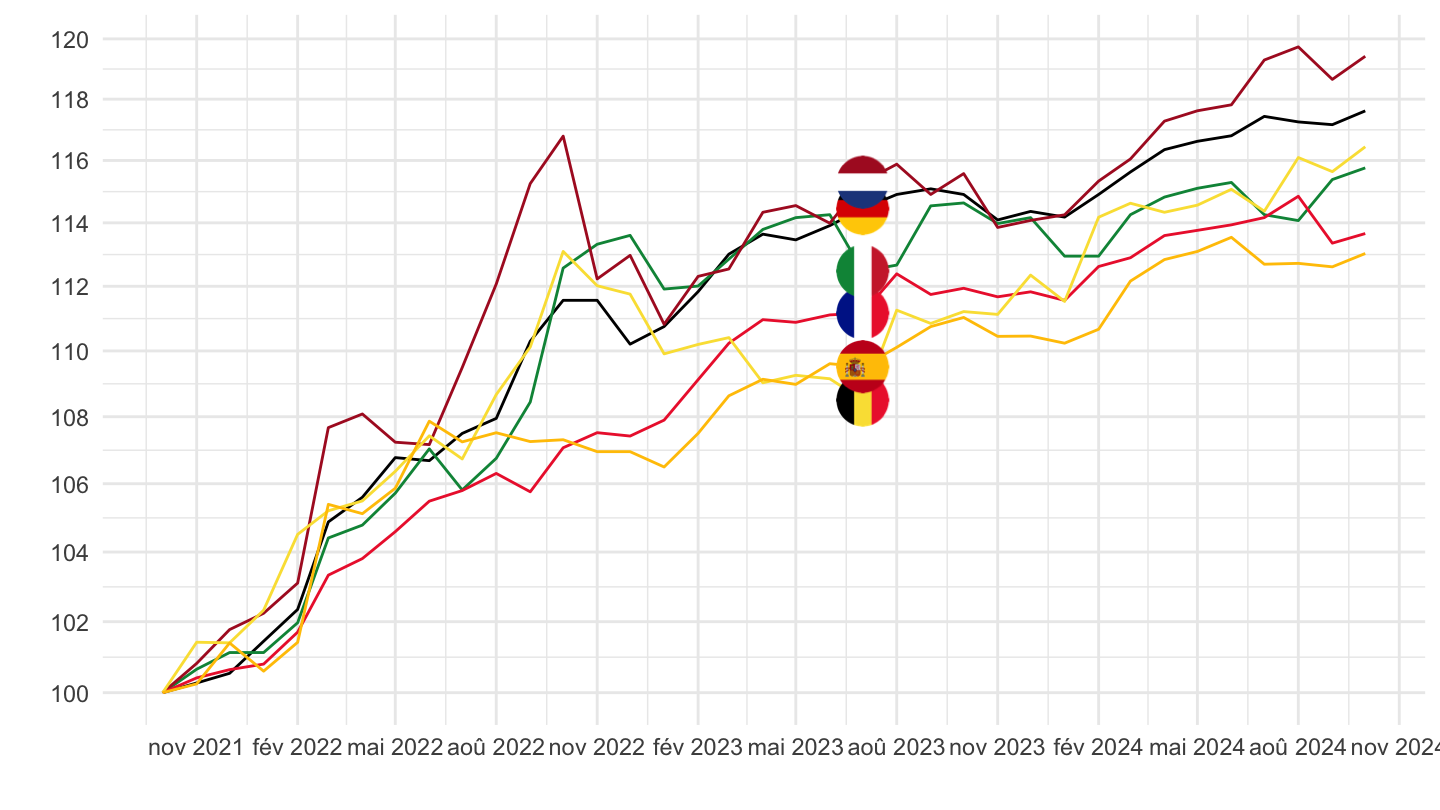
Portugal, Spain, Italy, Greece
Code
prc_hicp_midx %>%
  filter(unit == "I15",
         coicop %in% c("CP00"),
         geo %in% c("PT", "ES", "IT", "EL")) %>%

  select(geo, Geo, coicop, time, values) %>%
  month_to_date %>%
  group_by(Geo) %>%
  mutate(values = 100*values/values[date == as.Date("1996-01-01")]) %>%
  add_colors %>%
  mutate(color = ifelse(geo == "EE", color2, color)) %>%
  ggplot(.) + geom_line(aes(x = date, y = values, color = color)) + add_flags +
  theme_minimal() + xlab("") + ylab("100 = Janv. 2010") + scale_color_identity() +
  scale_x_date(breaks = seq(1960, 2100, 2) %>% paste0("-01-01") %>% as.Date,
               labels = date_format("%Y")) +
  scale_y_log10(breaks = seq(0, 400, 10))
Austria, Euro area
All
Code
prc_hicp_midx %>%
  filter(unit == "I15",
         coicop == "CP00",
         geo %in% c("AT", "EA")) %>%
  month_to_date %>%
  group_by(geo) %>%
  mutate(values = 100*values/values[date == as.Date("2010-01-01")]) %>%

  mutate(Geo = ifelse(geo == "EA", "Europe", Geo)) %>%
  add_colors %>%
  ggplot(.) + geom_line(aes(x = date, y = values, color = color)) + add_flags +
  theme_minimal() + xlab("") + ylab("100 = Janv. 2010") + scale_color_identity() +
  scale_x_date(breaks = seq(1960, 2100, 2) %>% paste0("-01-01") %>% as.Date,
               labels = date_format("%Y")) +
  scale_y_log10(breaks = seq(0, 400, 10))
2000-
Code
prc_hicp_midx %>%
  filter(unit == "I15",
         coicop == "CP00",
         geo %in% c("AT", "EA")) %>%
  month_to_date %>%
  filter(date >= as.Date("2000-01-01")) %>%
  group_by(geo) %>%
  mutate(values = 100*values/values[date == as.Date("2000-01-01")]) %>%

  mutate(Geo = ifelse(geo == "EA", "Europe", Geo)) %>%
  add_colors %>%
  ggplot(.) + geom_line(aes(x = date, y = values, color = color)) + add_flags +
  theme_minimal() + xlab("") + ylab("100 = Janv. 2010") + scale_color_identity() +
  scale_x_date(breaks = seq(1960, 2100, 2) %>% paste0("-01-01") %>% as.Date,
               labels = date_format("%Y")) +
  scale_y_log10(breaks = seq(0, 400, 10))
2010-
Code
prc_hicp_midx %>%
  filter(unit == "I15",
         coicop == "CP00",
         geo %in% c("AT", "EA")) %>%
  month_to_date %>%
  filter(date >= as.Date("2010-01-01")) %>%
  group_by(geo) %>%
  mutate(values = 100*values/values[date == as.Date("2010-01-01")]) %>%

  mutate(Geo = ifelse(geo == "EA", "Europe", Geo)) %>%
  add_colors %>%
  ggplot(.) + geom_line(aes(x = date, y = values, color = color)) + add_flags +
  theme_minimal() + xlab("") + ylab("100 = Janv. 2010") + scale_color_identity() +
  scale_x_date(breaks = seq(1960, 2100, 2) %>% paste0("-01-01") %>% as.Date,
               labels = date_format("%Y")) +
  scale_y_log10(breaks = seq(0, 400, 5))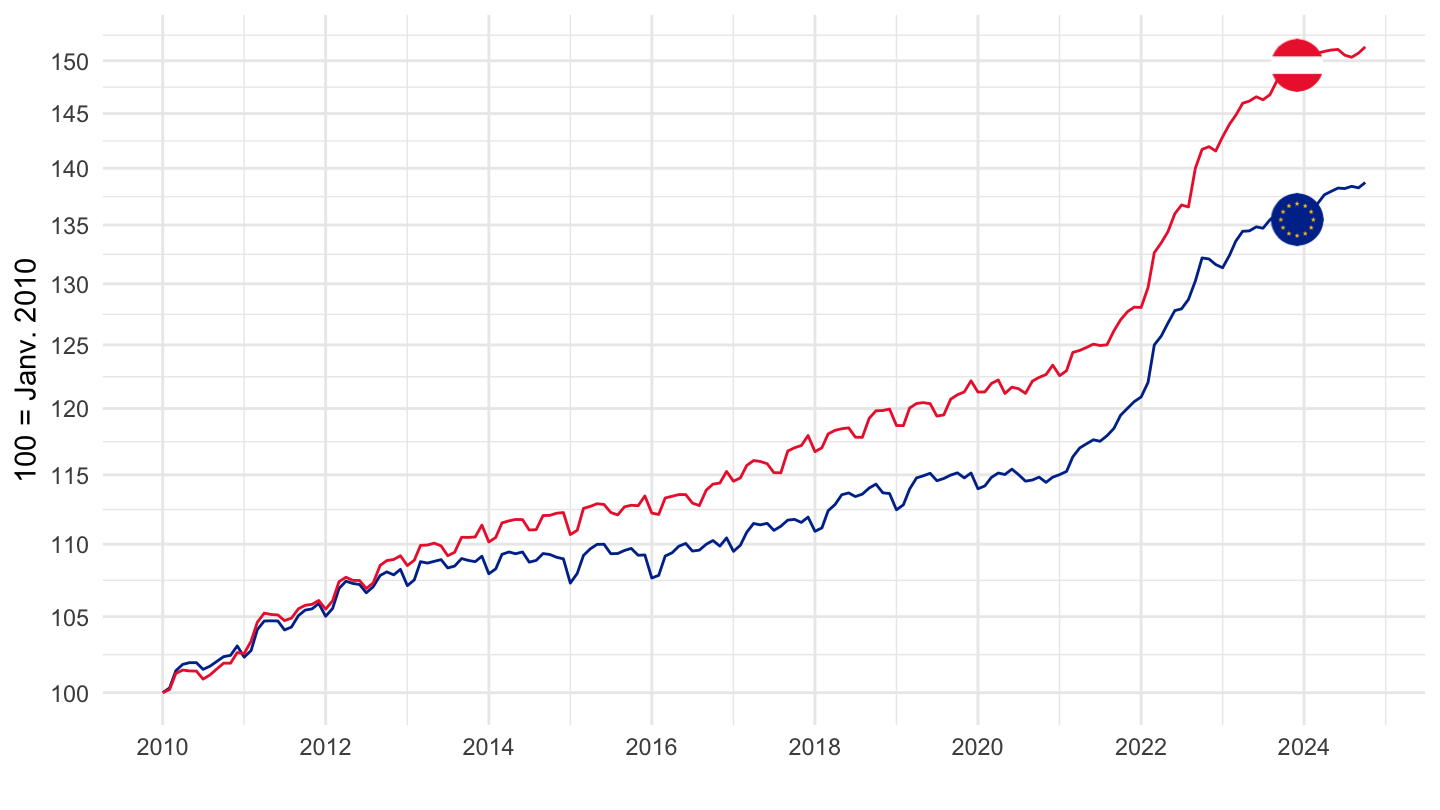
Belgium, Euro area
All
Code
prc_hicp_midx %>%
  filter(unit == "I15",
         coicop == "CP00",
         geo %in% c("BE", "EA")) %>%
  month_to_date %>%
  group_by(geo) %>%
  mutate(values = 100*values/values[date == as.Date("2010-01-01")]) %>%

  mutate(Geo = ifelse(geo == "EA", "Europe", Geo)) %>%
  add_colors %>%
  ggplot(.) + geom_line(aes(x = date, y = values, color = color)) + add_flags +
  theme_minimal() + xlab("") + ylab("100 = Janv. 2010") + scale_color_identity() +
  scale_x_date(breaks = seq(1960, 2100, 2) %>% paste0("-01-01") %>% as.Date,
               labels = date_format("%Y")) +
  scale_y_log10(breaks = seq(0, 400, 10))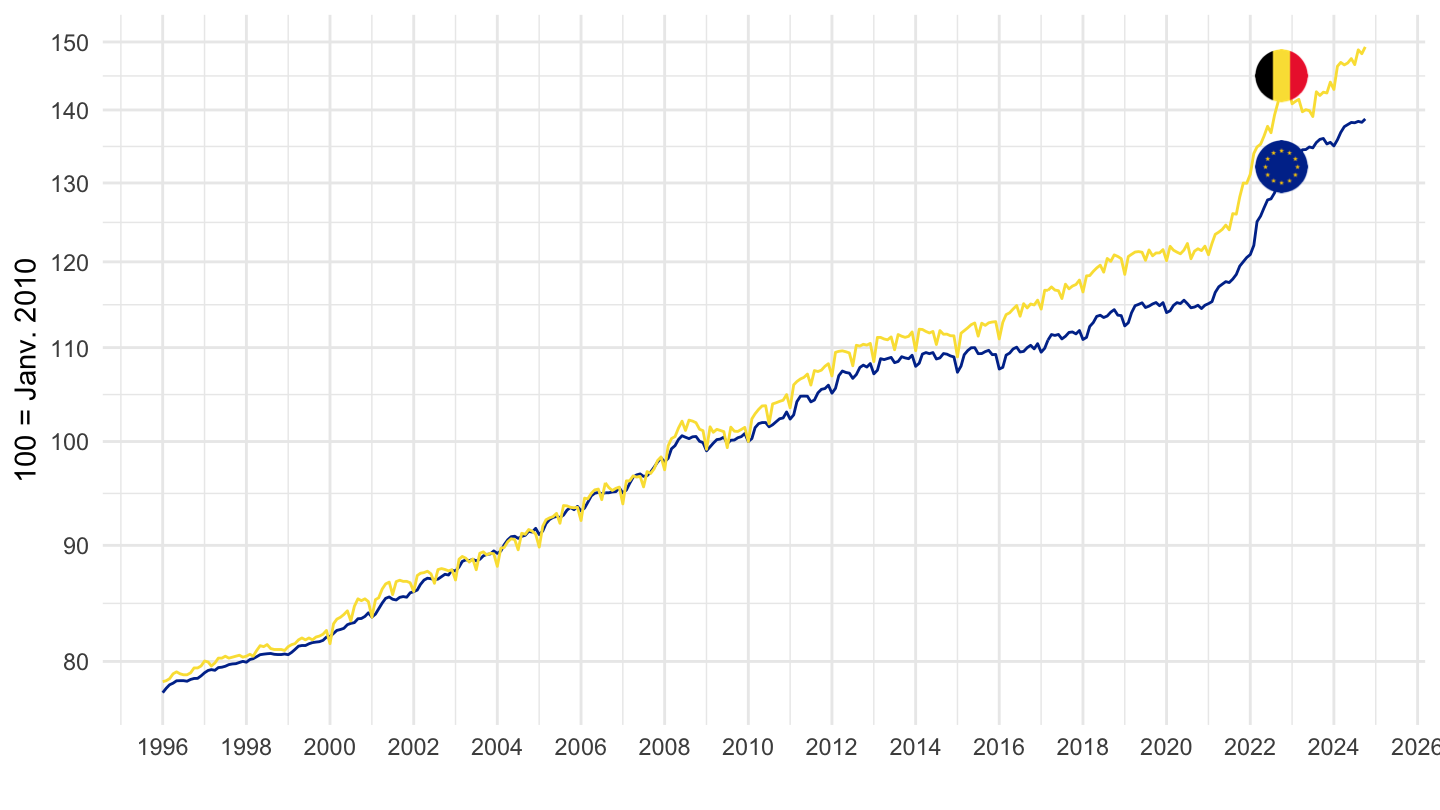
2000-
Code
prc_hicp_midx %>%
  filter(unit == "I15",
         coicop == "CP00",
         geo %in% c("BE", "EA")) %>%
  month_to_date %>%
  filter(date >= as.Date("2000-01-01")) %>%
  group_by(geo) %>%
  mutate(values = 100*values/values[date == as.Date("2000-01-01")]) %>%

  mutate(Geo = ifelse(geo == "EA", "Europe", Geo)) %>%
  add_colors %>%
  ggplot(.) + geom_line(aes(x = date, y = values, color = color)) + add_flags +
  theme_minimal() + xlab("") + ylab("100 = Janv. 2010") + scale_color_identity() +
  scale_x_date(breaks = seq(1960, 2100, 2) %>% paste0("-01-01") %>% as.Date,
               labels = date_format("%Y")) +
  scale_y_log10(breaks = seq(0, 400, 10))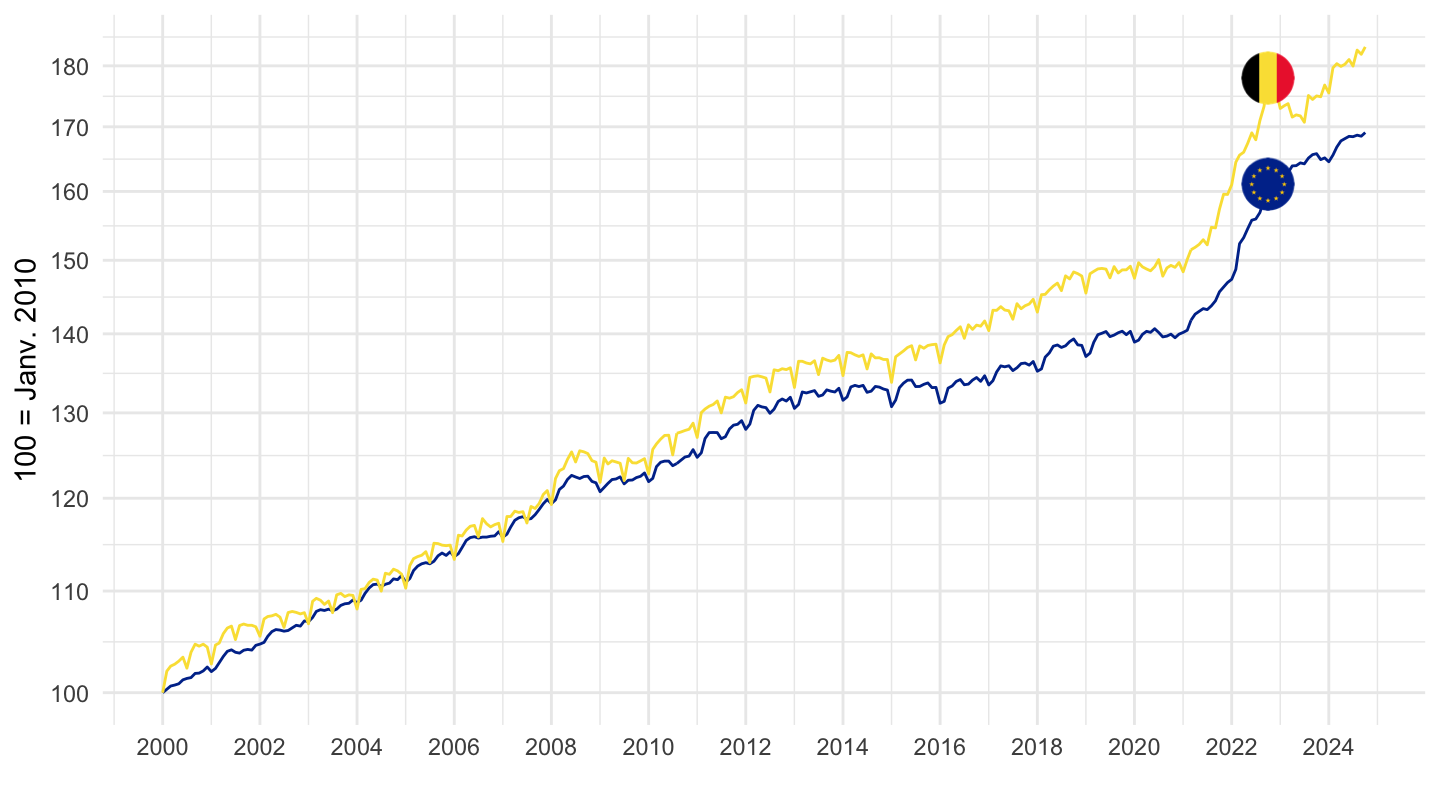
2010-
Code
prc_hicp_midx %>%
  filter(unit == "I15",
         coicop == "CP00",
         geo %in% c("BE", "EA")) %>%
  month_to_date %>%
  filter(date >= as.Date("2010-01-01")) %>%
  group_by(geo) %>%
  mutate(values = 100*values/values[date == as.Date("2010-01-01")]) %>%

  mutate(Geo = ifelse(geo == "EA", "Europe", Geo)) %>%
  add_colors %>%
  ggplot(.) + geom_line(aes(x = date, y = values, color = color)) + add_flags +
  theme_minimal() + xlab("") + ylab("100 = Janv. 2010") + scale_color_identity() +
  scale_x_date(breaks = seq(1960, 2100, 2) %>% paste0("-01-01") %>% as.Date,
               labels = date_format("%Y")) +
  scale_y_log10(breaks = seq(0, 400, 5))
Cyprus, Euro area
All
Code
prc_hicp_midx %>%
  filter(unit == "I15",
         coicop == "CP00",
         geo %in% c("CY", "EA")) %>%
  month_to_date %>%
  group_by(geo) %>%
  mutate(values = 100*values/values[date == as.Date("2010-01-01")]) %>%

  mutate(Geo = ifelse(geo == "EA", "Europe", Geo)) %>%
  add_colors %>%
  ggplot(.) + geom_line(aes(x = date, y = values, color = color)) + add_flags +
  theme_minimal() + xlab("") + ylab("100 = Janv. 2010") + scale_color_identity() +
  scale_x_date(breaks = seq(1960, 2100, 2) %>% paste0("-01-01") %>% as.Date,
               labels = date_format("%Y")) +
  scale_y_log10(breaks = seq(0, 400, 10))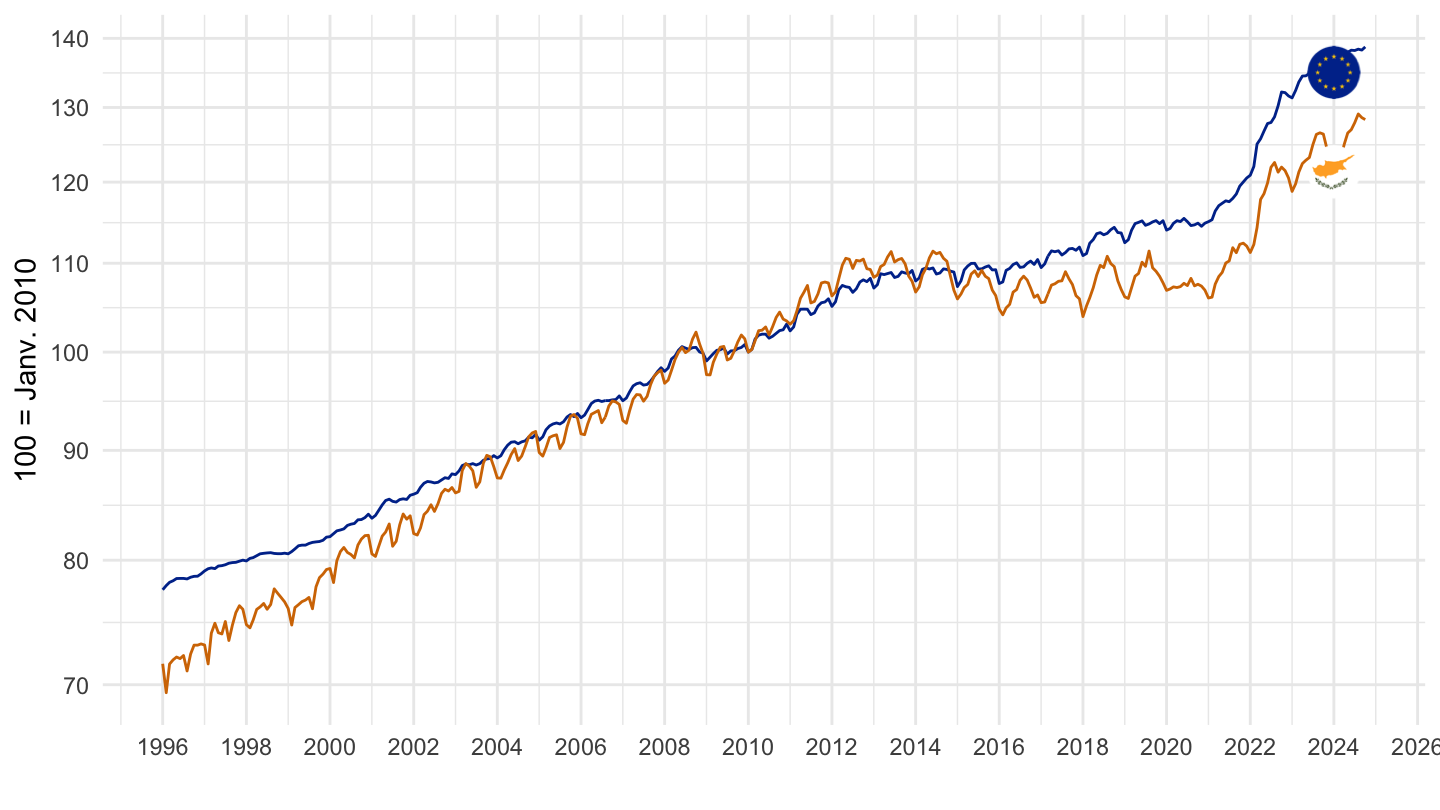
2000-
Code
prc_hicp_midx %>%
  filter(unit == "I15",
         coicop == "CP00",
         geo %in% c("CY", "EA")) %>%
  month_to_date %>%
  filter(date >= as.Date("2000-01-01")) %>%
  group_by(geo) %>%
  mutate(values = 100*values/values[date == as.Date("2000-01-01")]) %>%

  mutate(Geo = ifelse(geo == "EA", "Europe", Geo)) %>%
  add_colors %>%
  ggplot(.) + geom_line(aes(x = date, y = values, color = color)) + add_flags +
  theme_minimal() + xlab("") + ylab("100 = Janv. 2010") + scale_color_identity() +
  scale_x_date(breaks = seq(1960, 2100, 2) %>% paste0("-01-01") %>% as.Date,
               labels = date_format("%Y")) +
  scale_y_log10(breaks = seq(0, 400, 10))
2010-
Code
prc_hicp_midx %>%
  filter(unit == "I15",
         coicop == "CP00",
         geo %in% c("CY", "EA")) %>%
  month_to_date %>%
  filter(date >= as.Date("2010-01-01")) %>%
  group_by(geo) %>%
  mutate(values = 100*values/values[date == as.Date("2010-01-01")]) %>%

  mutate(Geo = ifelse(geo == "EA", "Europe", Geo)) %>%
  add_colors %>%
  ggplot(.) + geom_line(aes(x = date, y = values, color = color)) + add_flags +
  theme_minimal() + xlab("") + ylab("100 = Janv. 2010") + scale_color_identity() +
  scale_x_date(breaks = seq(1960, 2100, 2) %>% paste0("-01-01") %>% as.Date,
               labels = date_format("%Y")) +
  scale_y_log10(breaks = seq(0, 400, 5))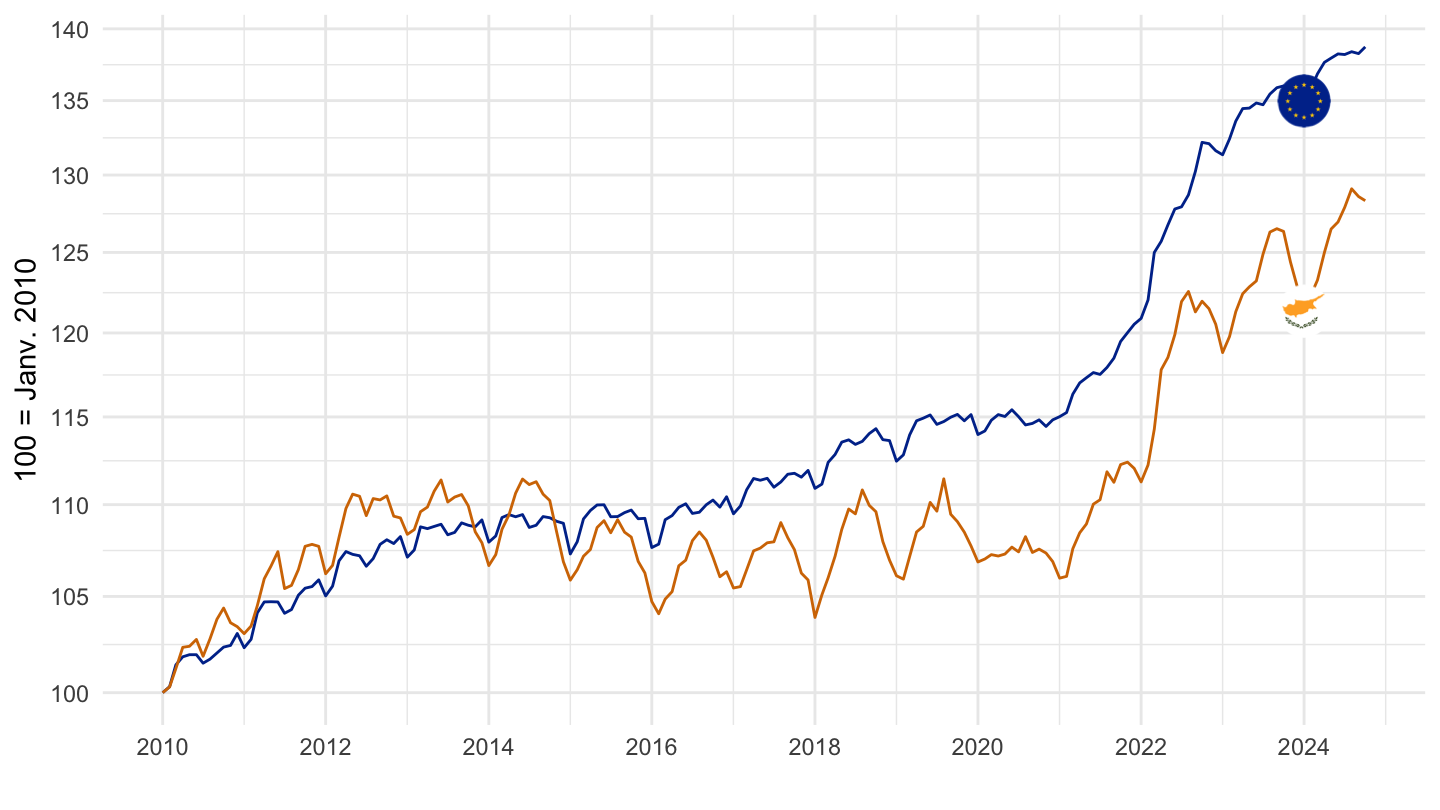
Estonia, Euro area
All
Code
prc_hicp_midx %>%
  filter(unit == "I15",
         coicop == "CP00",
         geo %in% c("EE", "EA")) %>%
  month_to_date %>%
  group_by(geo) %>%
  mutate(values = 100*values/values[date == as.Date("2010-01-01")]) %>%

  mutate(Geo = ifelse(geo == "EA", "Europe", Geo)) %>%
  add_colors %>%
  mutate(color = ifelse(geo == "EE", color2, color)) %>%
  ggplot(.) + geom_line(aes(x = date, y = values, color = color)) + add_flags +
  theme_minimal() + xlab("") + ylab("100 = Janv. 2010") + scale_color_identity() +
  scale_x_date(breaks = seq(1960, 2100, 2) %>% paste0("-01-01") %>% as.Date,
               labels = date_format("%Y")) +
  scale_y_log10(breaks = seq(0, 400, 10))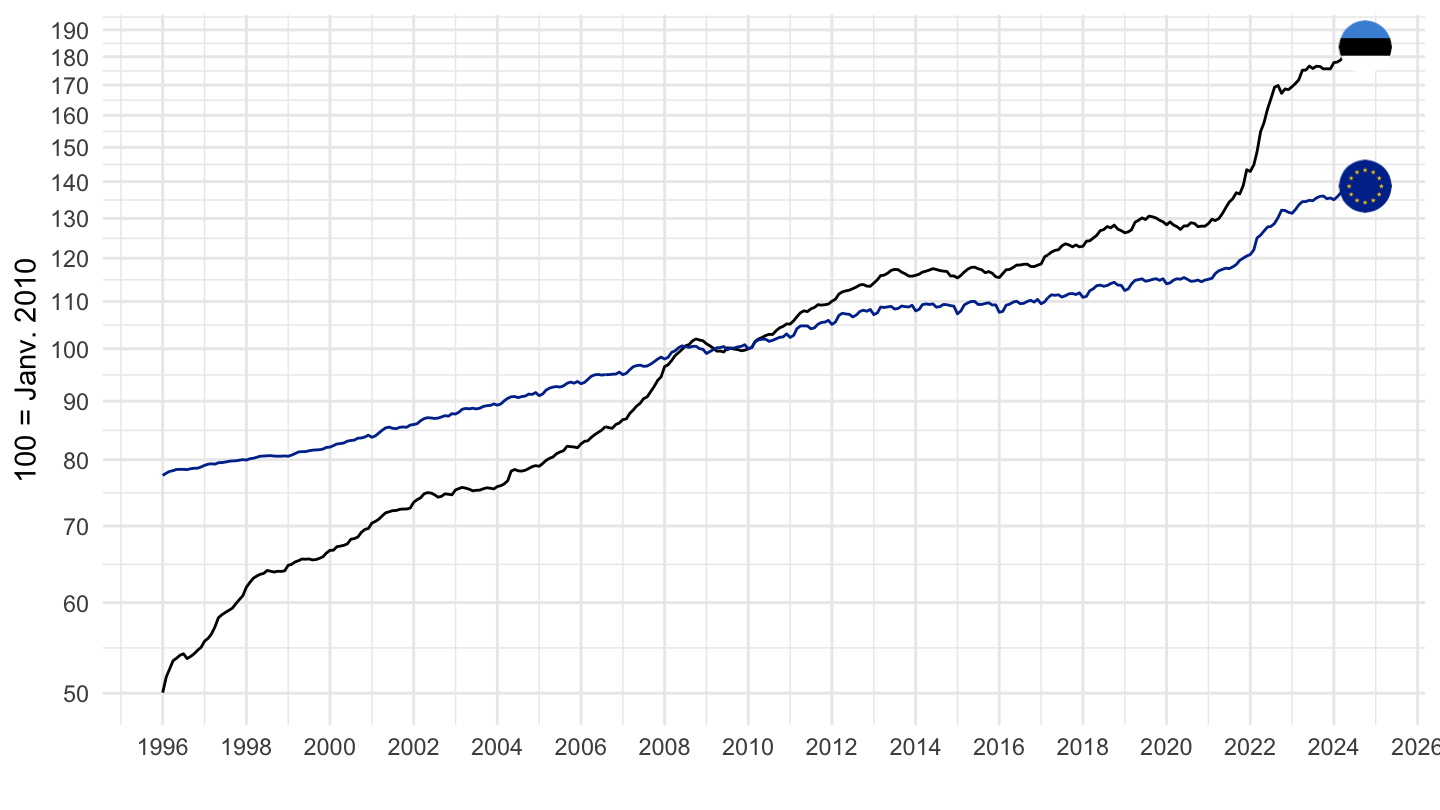
2010-
Code
prc_hicp_midx %>%
  filter(unit == "I15",
         coicop == "CP00",
         geo %in% c("EE", "EA")) %>%
  month_to_date %>%
  filter(date >= as.Date("2010-01-01")) %>%
  group_by(geo) %>%
  mutate(values = 100*values/values[date == as.Date("2010-01-01")]) %>%

  mutate(Geo = ifelse(geo == "EA", "Europe", Geo)) %>%
  add_colors %>%
  mutate(color = ifelse(geo == "EE", color2, color)) %>%
  ggplot(.) + geom_line(aes(x = date, y = values, color = color)) + add_flags +
  theme_minimal() + xlab("") + ylab("100 = Janv. 2010") + scale_color_identity() +
  scale_x_date(breaks = seq(1960, 2100, 2) %>% paste0("-01-01") %>% as.Date,
               labels = date_format("%Y")) +
  scale_y_log10(breaks = seq(0, 400, 10))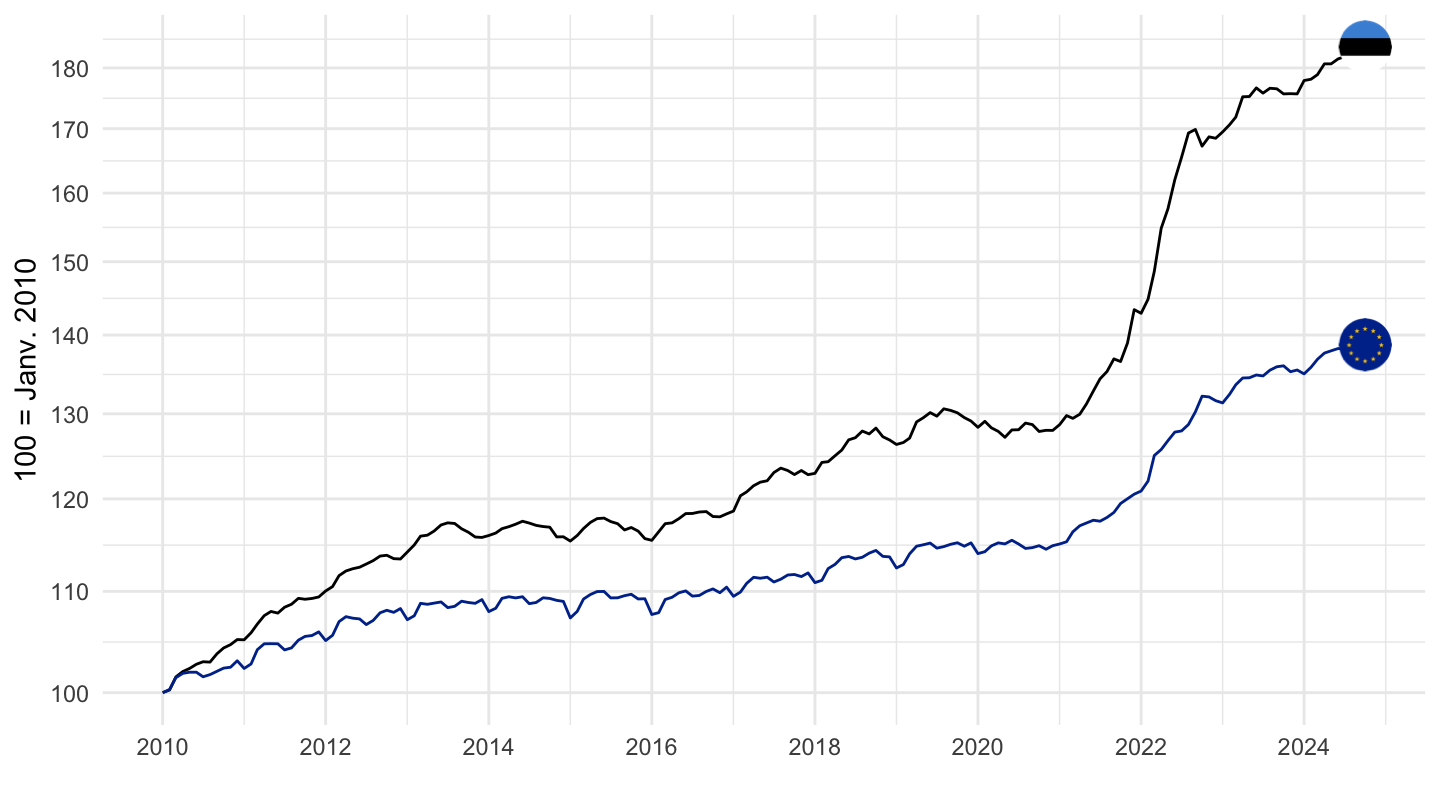
Finland, Euro area
All
Code
prc_hicp_midx %>%
  filter(unit == "I15",
         coicop == "CP00",
         geo %in% c("FI", "EA")) %>%
  month_to_date %>%
  group_by(geo) %>%
  mutate(values = 100*values/values[date == as.Date("2010-01-01")]) %>%

  mutate(Geo = ifelse(geo == "EA", "Europe", Geo)) %>%
  add_colors %>%
  mutate(color = ifelse(geo == "EE", color2, color)) %>%
  ggplot(.) + geom_line(aes(x = date, y = values, color = color)) + add_flags +
  theme_minimal() + xlab("") + ylab("100 = Janv. 2010") + scale_color_identity() +
  scale_x_date(breaks = seq(1960, 2100, 2) %>% paste0("-01-01") %>% as.Date,
               labels = date_format("%Y")) +
  scale_y_log10(breaks = seq(0, 400, 10))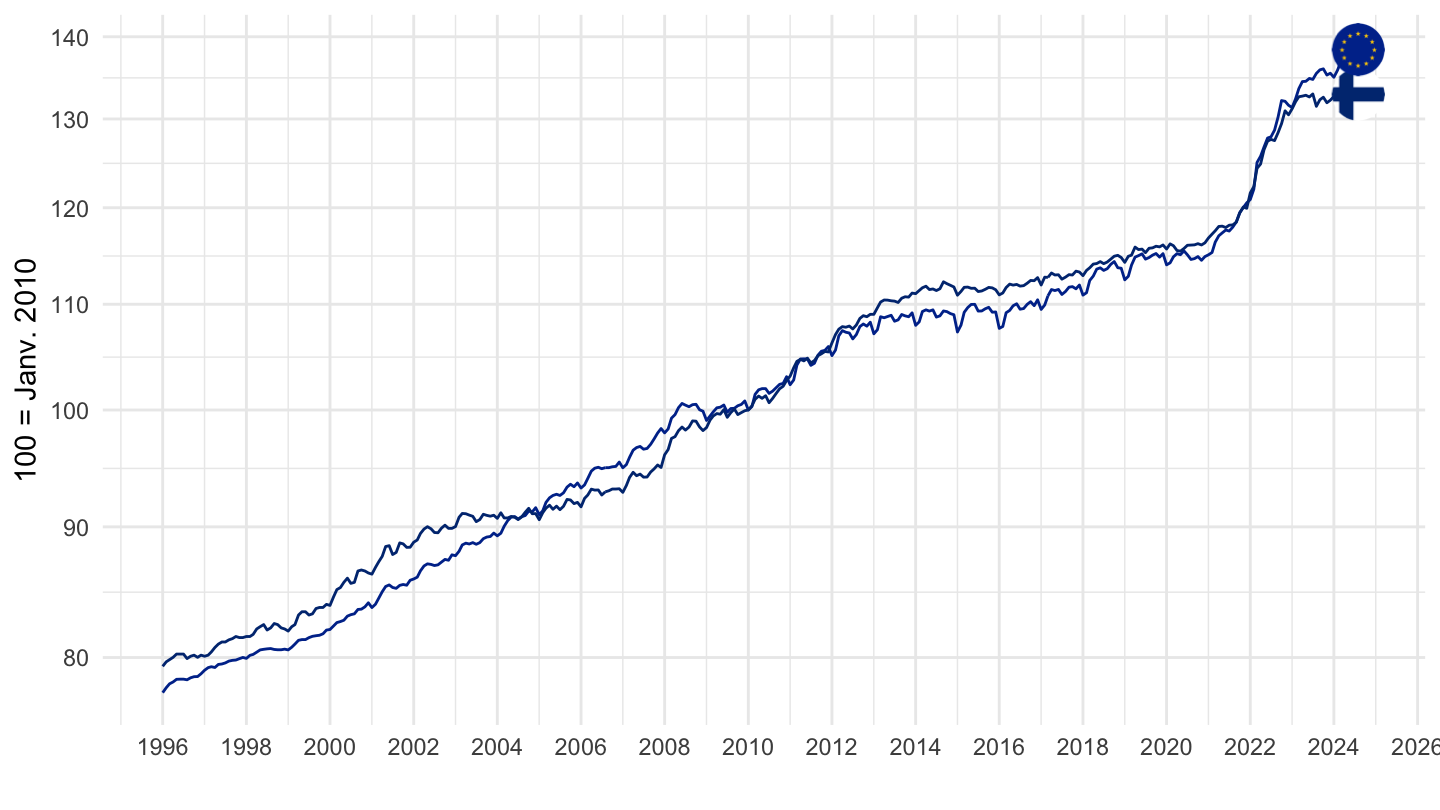
2010-
Code
prc_hicp_midx %>%
  filter(unit == "I15",
         coicop == "CP00",
         geo %in% c("FI", "EA")) %>%
  month_to_date %>%
  filter(date >= as.Date("2010-01-01")) %>%
  group_by(geo) %>%
  mutate(values = 100*values/values[date == as.Date("2010-01-01")]) %>%

  mutate(Geo = ifelse(geo == "EA", "Europe", Geo)) %>%
  add_colors %>%
  ggplot(.) + geom_line(aes(x = date, y = values, color = color)) + add_flags +
  theme_minimal() + xlab("") + ylab("100 = Janv. 2010") + scale_color_identity() +
  scale_x_date(breaks = seq(1960, 2100, 2) %>% paste0("-01-01") %>% as.Date,
               labels = date_format("%Y")) +
  scale_y_log10(breaks = seq(0, 400, 10))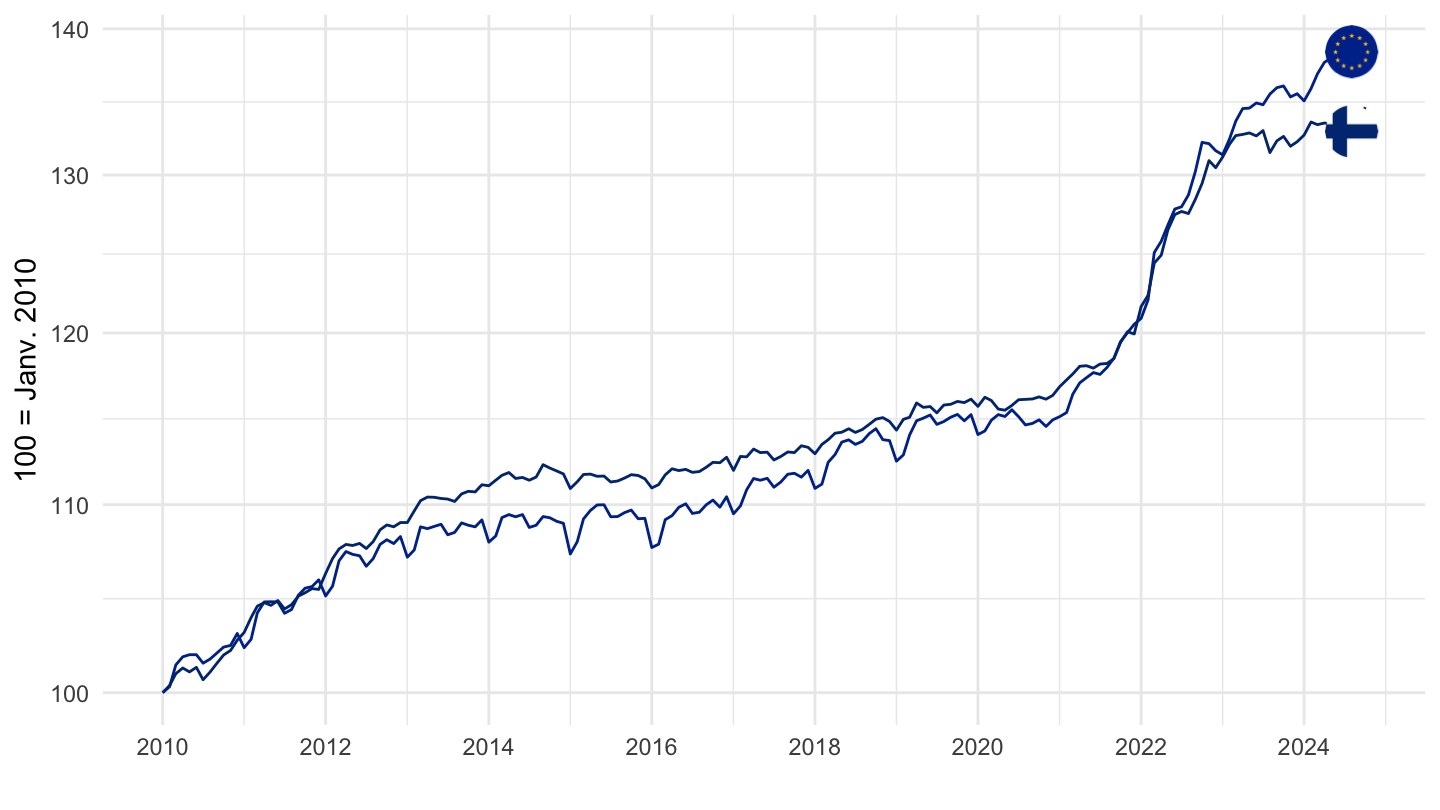
France, Euro area
All
Code
prc_hicp_midx %>%
  filter(unit == "I15",
         coicop == "CP00",
         geo %in% c("FR", "EA")) %>%
  month_to_date %>%
  group_by(geo) %>%
  mutate(values = 100*values/values[date == as.Date("2010-01-01")]) %>%

  mutate(Geo = ifelse(geo == "EA", "Europe", Geo)) %>%
  add_colors %>%
  ggplot(.) + geom_line(aes(x = date, y = values, color = color)) + add_flags +
  theme_minimal() + xlab("") + ylab("100 = Janv. 2010") + scale_color_identity() +
  scale_x_date(breaks = seq(1960, 2100, 2) %>% paste0("-01-01") %>% as.Date,
               labels = date_format("%Y")) +
  scale_y_log10(breaks = seq(0, 400, 10))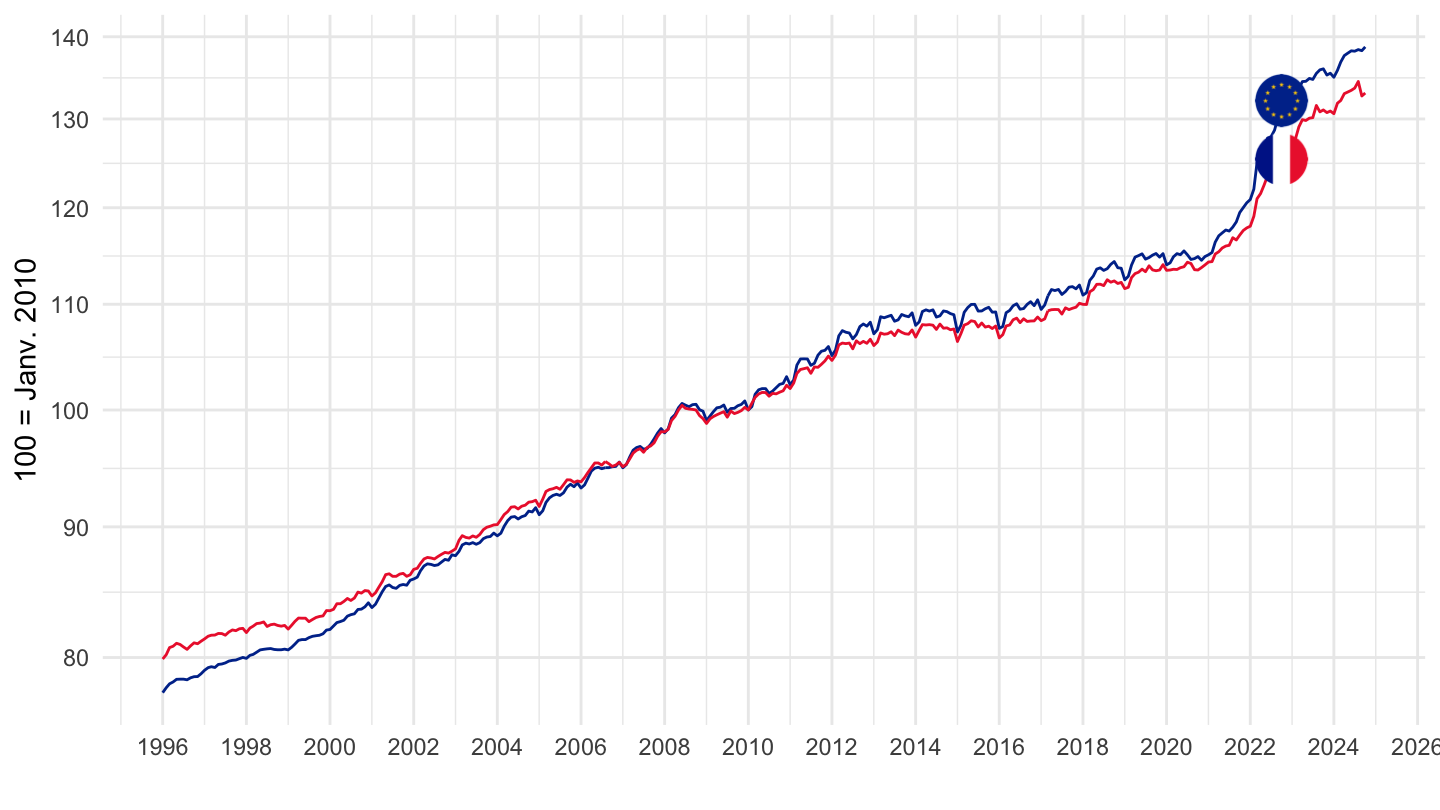
2010-
Code
prc_hicp_midx %>%
  filter(unit == "I15",
         coicop == "CP00",
         geo %in% c("FR", "EA")) %>%
  month_to_date %>%
  filter(date >= as.Date("2010-01-01")) %>%
  group_by(geo) %>%
  mutate(values = 100*values/values[date == as.Date("2010-01-01")]) %>%

  mutate(Geo = ifelse(geo == "EA", "Europe", Geo)) %>%
  add_colors %>%
  ggplot(.) + geom_line(aes(x = date, y = values, color = color)) + add_flags +
  theme_minimal() + xlab("") + ylab("100 = Janv. 2010") + scale_color_identity() +
  scale_x_date(breaks = seq(1960, 2100, 2) %>% paste0("-01-01") %>% as.Date,
               labels = date_format("%Y")) +
  scale_y_log10(breaks = seq(0, 400, 10))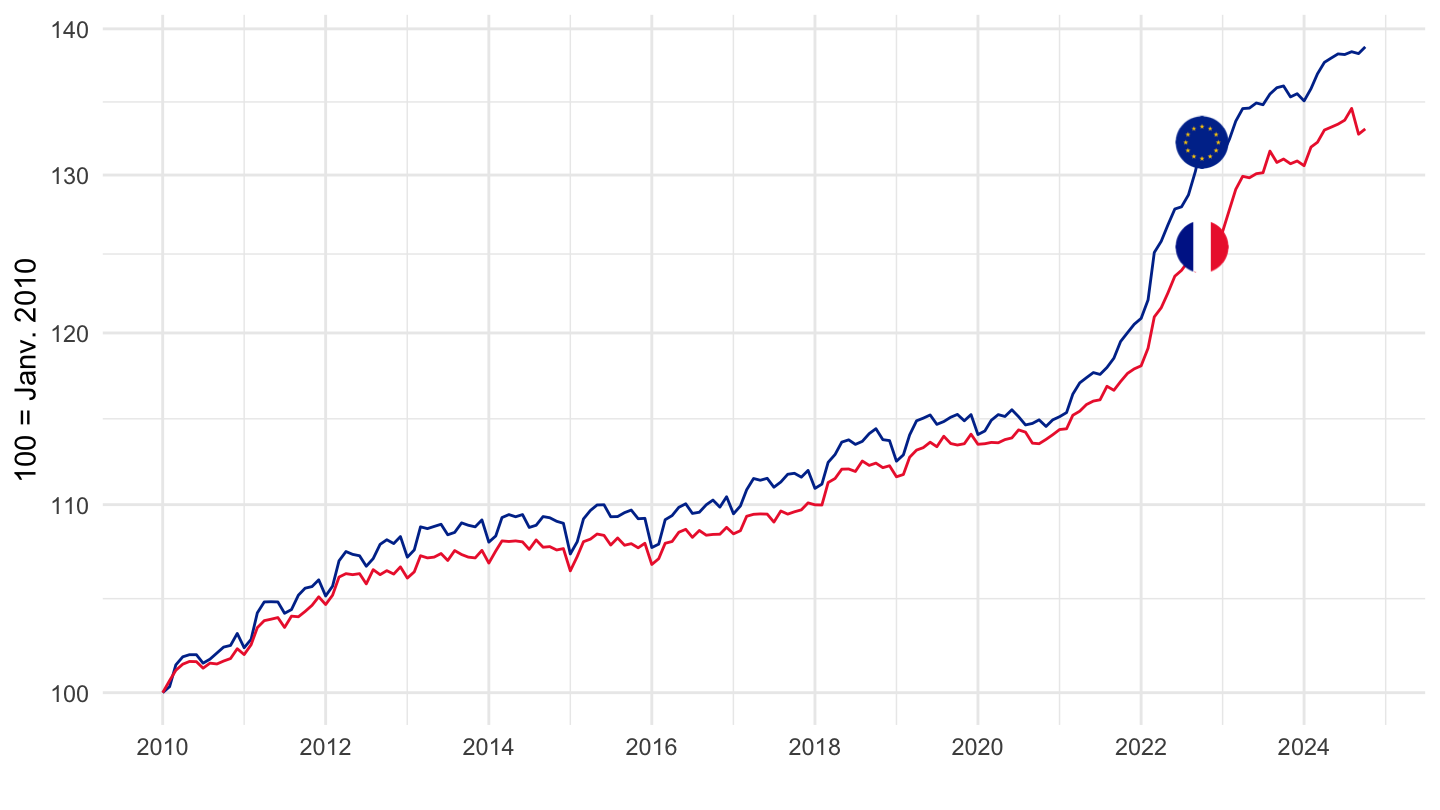
Germany, Euro area
All
Code
prc_hicp_midx %>%
  filter(unit == "I15",
         coicop == "CP00",
         geo %in% c("DE", "EA")) %>%
  month_to_date %>%
  group_by(geo) %>%
  mutate(values = 100*values/values[date == as.Date("2010-01-01")]) %>%

  mutate(Geo = ifelse(geo == "EA", "Europe", Geo),
         Geo = ifelse(geo == "DE", "Germany", Geo)) %>%
  add_colors %>%
  ggplot(.) + geom_line(aes(x = date, y = values, color = color)) + add_flags +
  theme_minimal() + xlab("") + ylab("100 = Janv. 2010") + scale_color_identity() +
  scale_x_date(breaks = seq(1960, 2100, 2) %>% paste0("-01-01") %>% as.Date,
               labels = date_format("%Y")) +
  scale_y_log10(breaks = seq(0, 400, 10))
2010-
Code
prc_hicp_midx %>%
  filter(unit == "I15",
         coicop == "CP00",
         geo %in% c("DE", "EA")) %>%
  month_to_date %>%
  filter(date >= as.Date("2010-01-01")) %>%
  group_by(geo) %>%
  mutate(values = 100*values/values[date == as.Date("2010-01-01")]) %>%

  mutate(Geo = ifelse(geo == "EA", "Europe", Geo),
         Geo = ifelse(geo == "DE", "Germany", Geo)) %>%
  add_colors %>%
  ggplot(.) + geom_line(aes(x = date, y = values, color = color)) + add_flags +
  theme_minimal() + xlab("") + ylab("100 = Janv. 2010") + scale_color_identity() +
  scale_x_date(breaks = seq(1960, 2100, 2) %>% paste0("-01-01") %>% as.Date,
               labels = date_format("%Y")) +
  scale_y_log10(breaks = seq(0, 400, 5))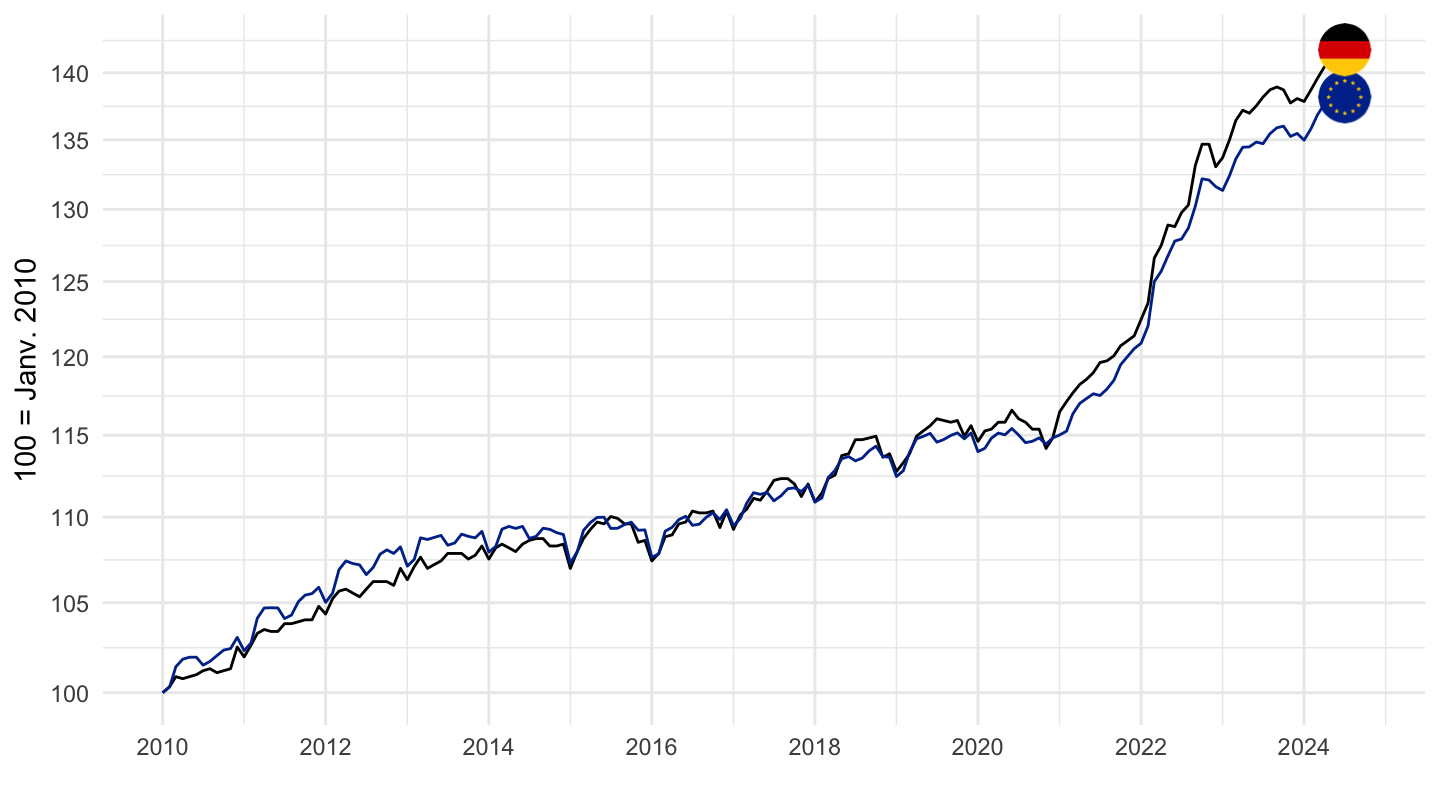
Greece, Euro area
All
Code
prc_hicp_midx %>%
  filter(unit == "I15",
         coicop == "CP00",
         geo %in% c("EL", "EA")) %>%
  month_to_date %>%
  group_by(geo) %>%
  mutate(values = 100*values/values[date == as.Date("2010-01-01")]) %>%

  mutate(Geo = ifelse(geo == "EA", "Europe", Geo),
         Geo = ifelse(geo == "DE", "Germany", Geo)) %>%
  add_colors %>%
  ggplot(.) + geom_line(aes(x = date, y = values, color = color)) + add_flags +
  theme_minimal() + xlab("") + ylab("100 = Janv. 2010") + scale_color_identity() +
  scale_x_date(breaks = seq(1960, 2100, 2) %>% paste0("-01-01") %>% as.Date,
               labels = date_format("%Y")) +
  scale_y_log10(breaks = seq(0, 400, 10))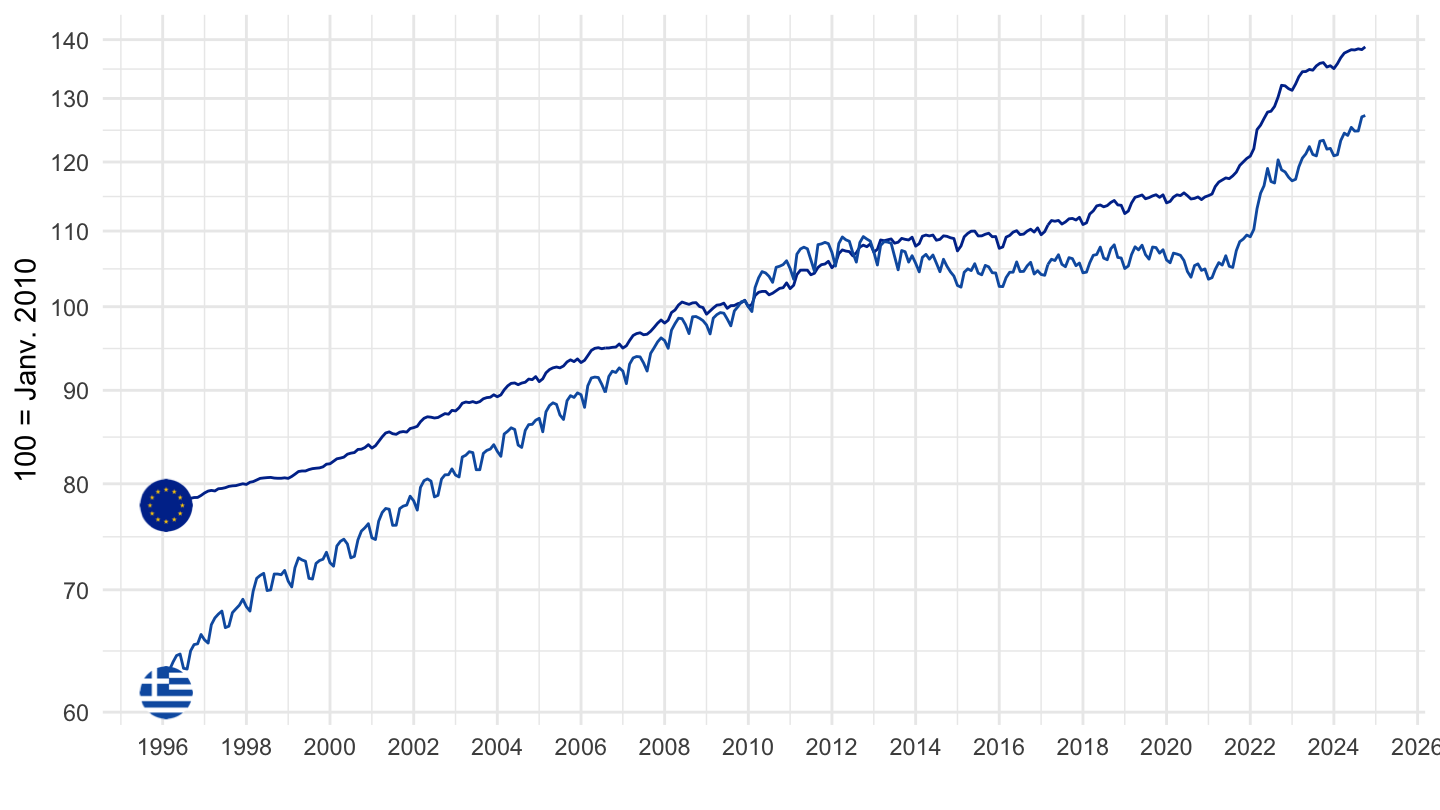
2010-
Code
prc_hicp_midx %>%
  filter(unit == "I15",
         coicop == "CP00",
         geo %in% c("EL", "EA")) %>%
  month_to_date %>%
  filter(date >= as.Date("2010-01-01")) %>%
  group_by(geo) %>%
  mutate(values = 100*values/values[date == as.Date("2010-01-01")]) %>%

  mutate(Geo = ifelse(geo == "EA", "Europe", Geo),
         Geo = ifelse(geo == "DE", "Germany", Geo)) %>%
  add_colors %>%
  ggplot(.) + geom_line(aes(x = date, y = values, color = color)) + add_flags +
  theme_minimal() + xlab("") + ylab("100 = Janv. 2010") + scale_color_identity() +
  scale_x_date(breaks = seq(1960, 2100, 2) %>% paste0("-01-01") %>% as.Date,
               labels = date_format("%Y")) +
  scale_y_log10(breaks = seq(0, 400, 5))
Ireland, Euro area
All
Code
prc_hicp_midx %>%
  filter(unit == "I15",
         coicop == "CP00",
         geo %in% c("IE", "EA")) %>%
  month_to_date %>%
  group_by(geo) %>%
  mutate(values = 100*values/values[date == as.Date("2010-01-01")]) %>%

  mutate(Geo = ifelse(geo == "EA", "Europe", Geo),
         Geo = ifelse(geo == "DE", "Germany", Geo)) %>%
  add_colors %>%
  ggplot(.) + geom_line(aes(x = date, y = values, color = color)) + add_flags +
  theme_minimal() + xlab("") + ylab("100 = Janv. 2010") + scale_color_identity() +
  scale_x_date(breaks = seq(1960, 2100, 2) %>% paste0("-01-01") %>% as.Date,
               labels = date_format("%Y")) +
  scale_y_log10(breaks = seq(0, 400, 5))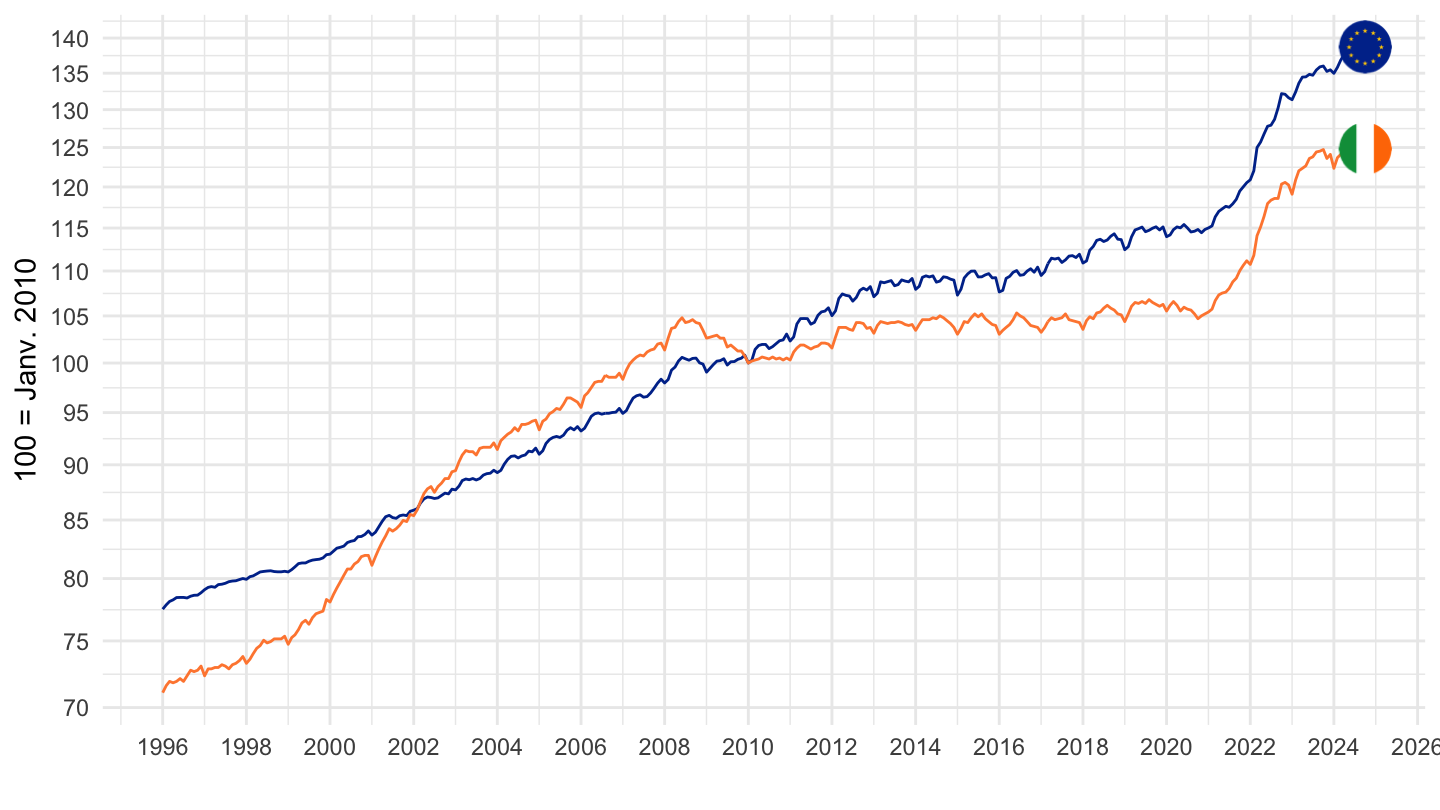
2006-
Code
prc_hicp_midx %>%
  filter(unit == "I15",
         coicop == "CP00",
         geo %in% c("IE", "EA")) %>%
  month_to_date %>%
  filter(date >= as.Date("2006-01-01")) %>%
  group_by(geo) %>%
  mutate(values = 100*values/values[date == as.Date("2006-01-01")]) %>%

  mutate(Geo = ifelse(geo == "EA", "Europe", Geo),
         Geo = ifelse(geo == "DE", "Germany", Geo)) %>%
  add_colors %>%
  ggplot(.) + geom_line(aes(x = date, y = values, color = color)) + add_flags +
  theme_minimal() + xlab("") + ylab("100 = Janv. 2010") + scale_color_identity() +
  scale_x_date(breaks = seq(1960, 2100, 2) %>% paste0("-01-01") %>% as.Date,
               labels = date_format("%Y")) +
  scale_y_log10(breaks = seq(0, 400, 5))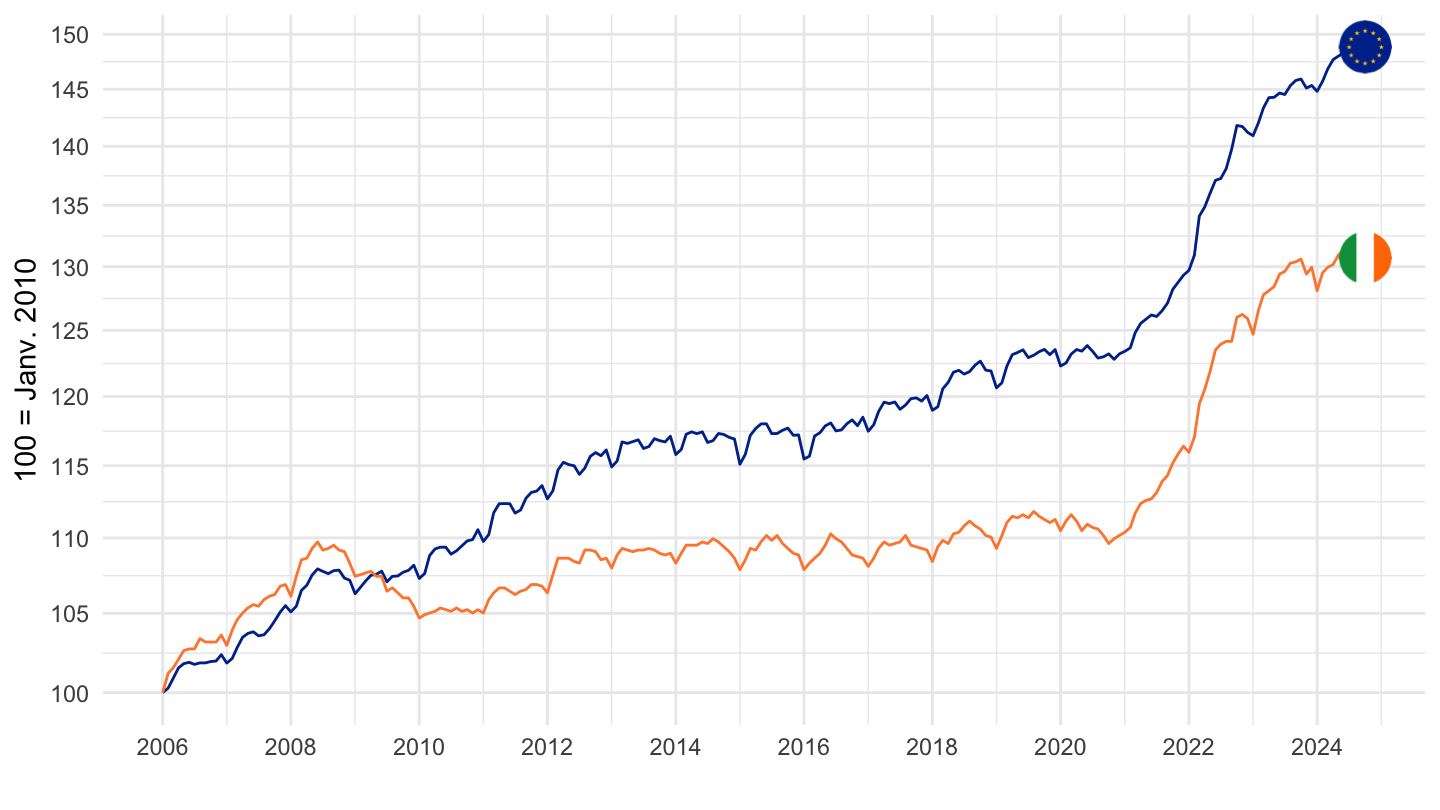
2010-
Code
prc_hicp_midx %>%
  filter(unit == "I15",
         coicop == "CP00",
         geo %in% c("IE", "EA")) %>%
  month_to_date %>%
  filter(date >= as.Date("2010-01-01")) %>%
  group_by(geo) %>%
  mutate(values = 100*values/values[date == as.Date("2010-01-01")]) %>%

  mutate(Geo = ifelse(geo == "EA", "Europe", Geo),
         Geo = ifelse(geo == "DE", "Germany", Geo)) %>%
  add_colors %>%
  ggplot(.) + geom_line(aes(x = date, y = values, color = color)) + add_flags +
  theme_minimal() + xlab("") + ylab("100 = Janv. 2010") + scale_color_identity() +
  scale_x_date(breaks = seq(1960, 2100, 2) %>% paste0("-01-01") %>% as.Date,
               labels = date_format("%Y")) +
  scale_y_log10(breaks = seq(0, 400, 5))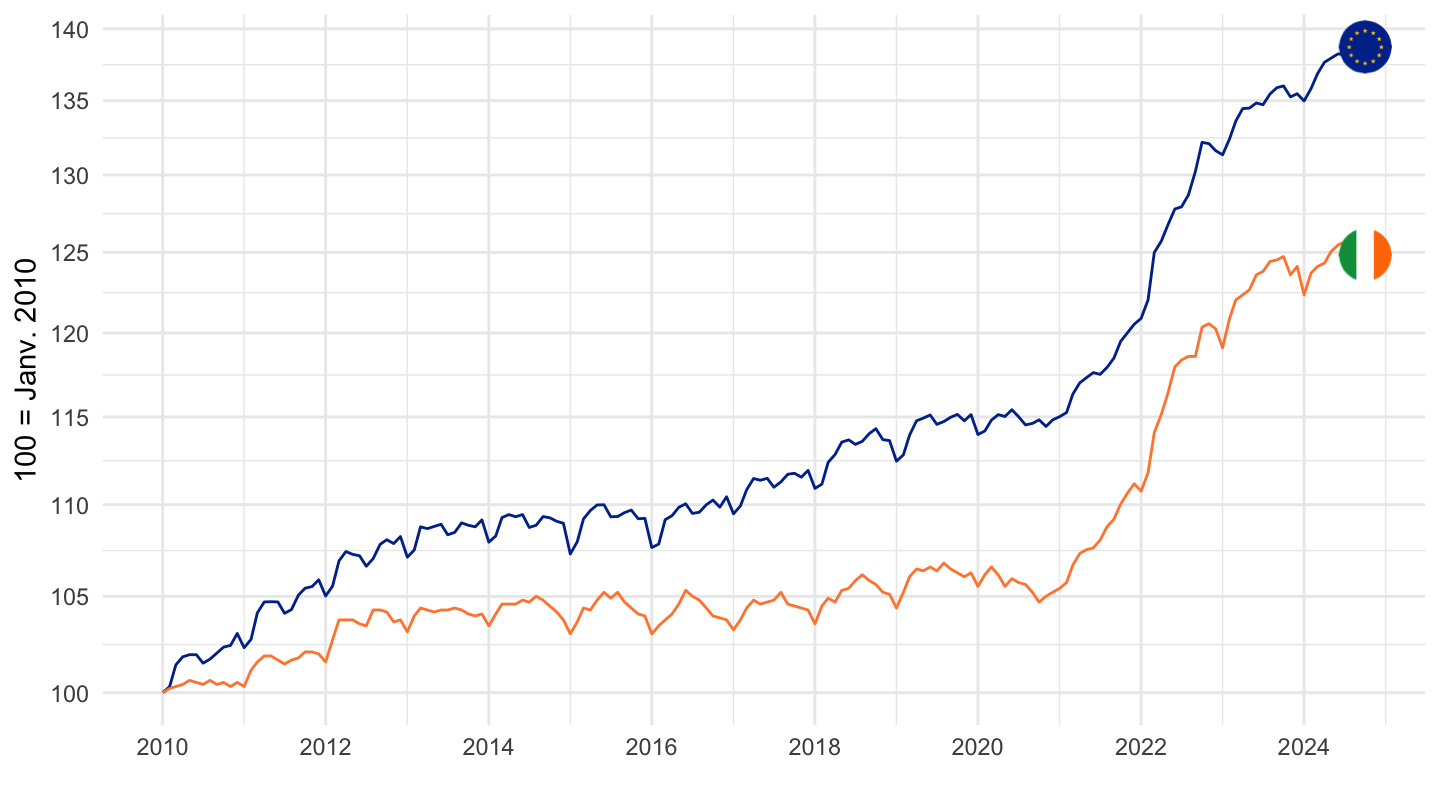
Italy, Euro area
All
Code
prc_hicp_midx %>%
  filter(unit == "I15",
         coicop == "CP00",
         geo %in% c("IT", "EA")) %>%
  month_to_date %>%
  group_by(geo) %>%
  mutate(values = 100*values/values[date == as.Date("2010-01-01")]) %>%

  mutate(Geo = ifelse(geo == "EA", "Europe", Geo),
         Geo = ifelse(geo == "DE", "Germany", Geo)) %>%
  add_colors %>%
  ggplot(.) + geom_line(aes(x = date, y = values, color = color)) + add_flags +
  theme_minimal() + xlab("") + ylab("100 = Janv. 2010") + scale_color_identity() +
  scale_x_date(breaks = seq(1960, 2100, 2) %>% paste0("-01-01") %>% as.Date,
               labels = date_format("%Y")) +
  scale_y_log10(breaks = seq(0, 400, 5))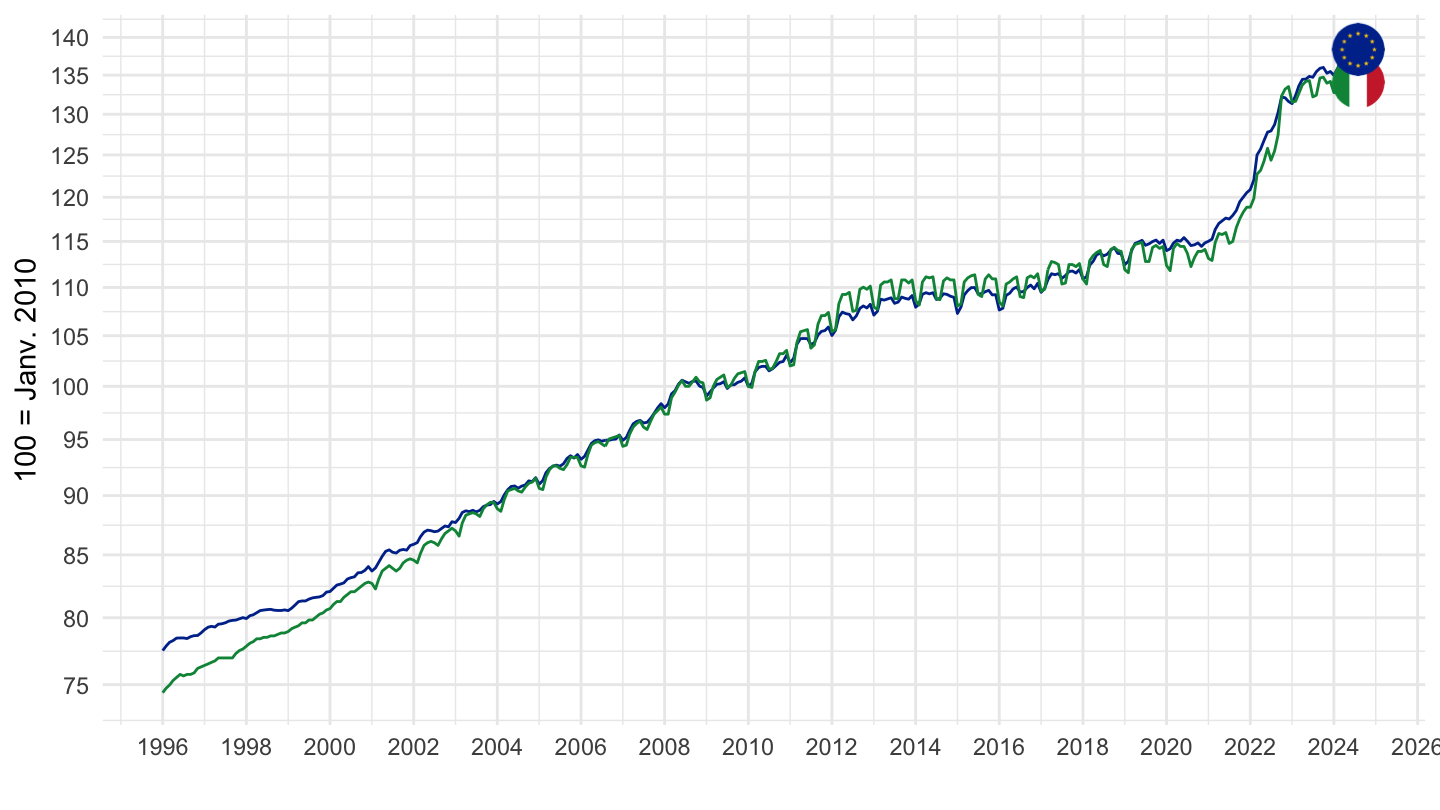
2010-
Code
prc_hicp_midx %>%
  filter(unit == "I15",
         coicop == "CP00",
         geo %in% c("IT", "EA")) %>%
  month_to_date %>%
  filter(date >= as.Date("2010-01-01")) %>%
  group_by(geo) %>%
  mutate(values = 100*values/values[date == as.Date("2010-01-01")]) %>%

  mutate(Geo = ifelse(geo == "EA", "Europe", Geo),
         Geo = ifelse(geo == "DE", "Germany", Geo)) %>%
  add_colors %>%
  ggplot(.) + geom_line(aes(x = date, y = values, color = color)) + add_flags +
  theme_minimal() + xlab("") + ylab("100 = Janv. 2010") + scale_color_identity() +
  scale_x_date(breaks = seq(1960, 2100, 2) %>% paste0("-01-01") %>% as.Date,
               labels = date_format("%Y")) +
  scale_y_log10(breaks = seq(0, 400, 5))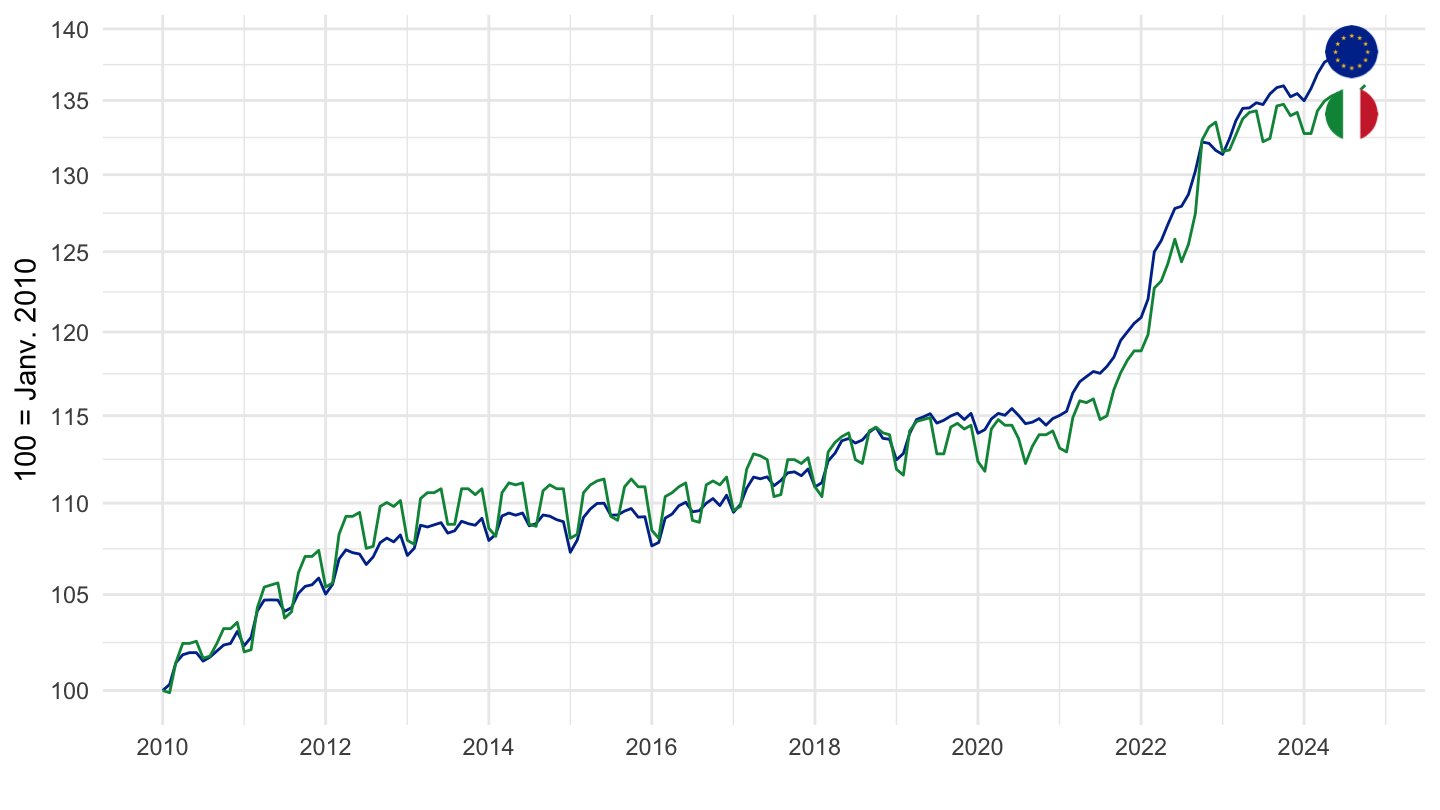
Latvia, Euro area
All
Code
prc_hicp_midx %>%
  filter(unit == "I15",
         coicop == "CP00",
         geo %in% c("LV", "EA")) %>%
  month_to_date %>%
  group_by(geo) %>%
  mutate(values = 100*values/values[date == as.Date("2010-01-01")]) %>%

  mutate(Geo = ifelse(geo == "EA", "Europe", Geo),
         Geo = ifelse(geo == "DE", "Germany", Geo)) %>%
  add_colors %>%
  ggplot(.) + geom_line(aes(x = date, y = values, color = color)) + add_flags +
  theme_minimal() + xlab("") + ylab("100 = Janv. 2010") + scale_color_identity() +
  scale_x_date(breaks = seq(1960, 2100, 2) %>% paste0("-01-01") %>% as.Date,
               labels = date_format("%Y")) +
  scale_y_log10(breaks = seq(0, 400, 5))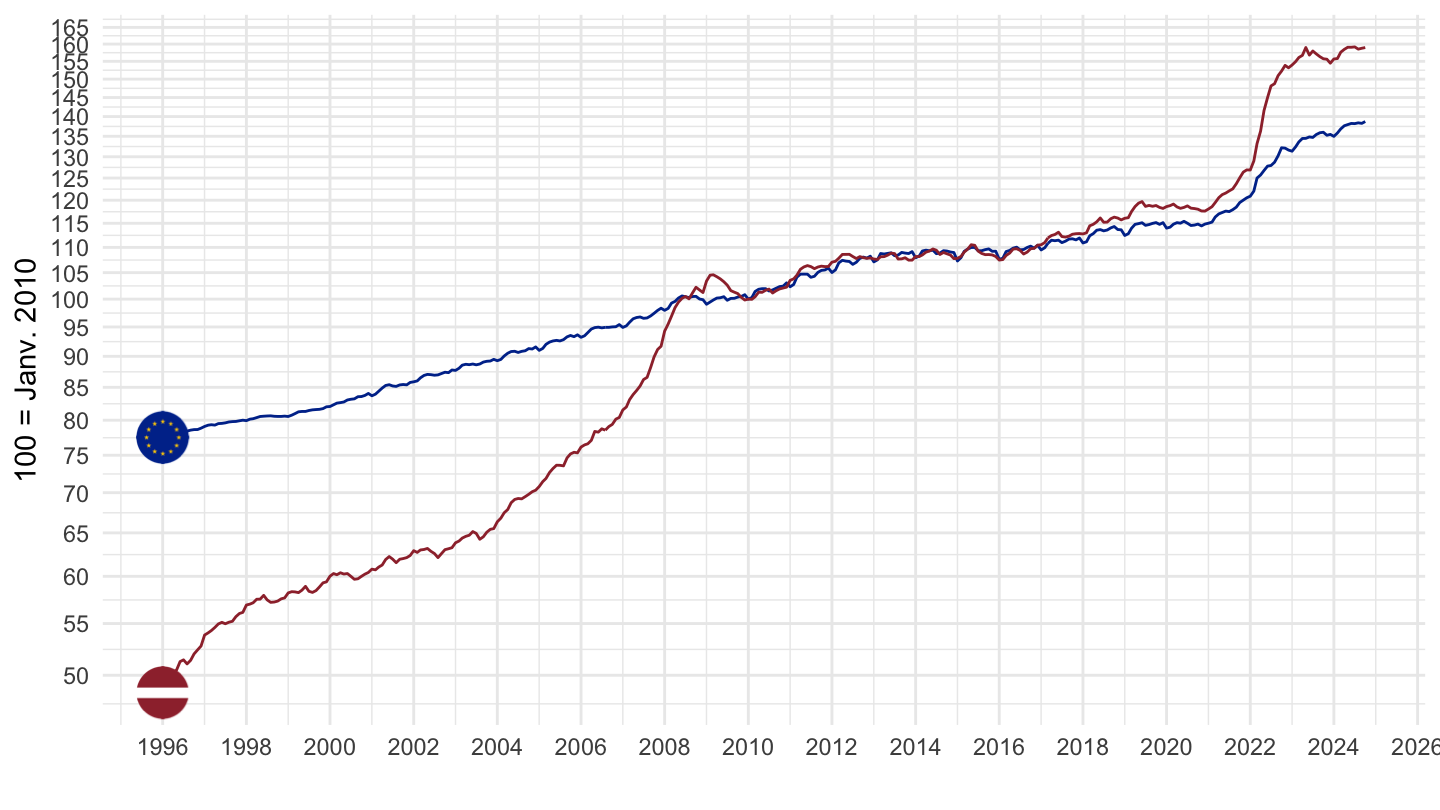
2010-
Code
prc_hicp_midx %>%
  filter(unit == "I15",
         coicop == "CP00",
         geo %in% c("LV", "EA")) %>%
  month_to_date %>%
  filter(date >= as.Date("2010-01-01")) %>%
  group_by(geo) %>%
  mutate(values = 100*values/values[date == as.Date("2010-01-01")]) %>%

  mutate(Geo = ifelse(geo == "EA", "Europe", Geo),
         Geo = ifelse(geo == "DE", "Germany", Geo)) %>%
  add_colors %>%
  ggplot(.) + geom_line(aes(x = date, y = values, color = color)) + add_flags +
  theme_minimal() + xlab("") + ylab("100 = Janv. 2010") + scale_color_identity() +
  scale_x_date(breaks = seq(1960, 2100, 2) %>% paste0("-01-01") %>% as.Date,
               labels = date_format("%Y")) +
  scale_y_log10(breaks = seq(0, 400, 5))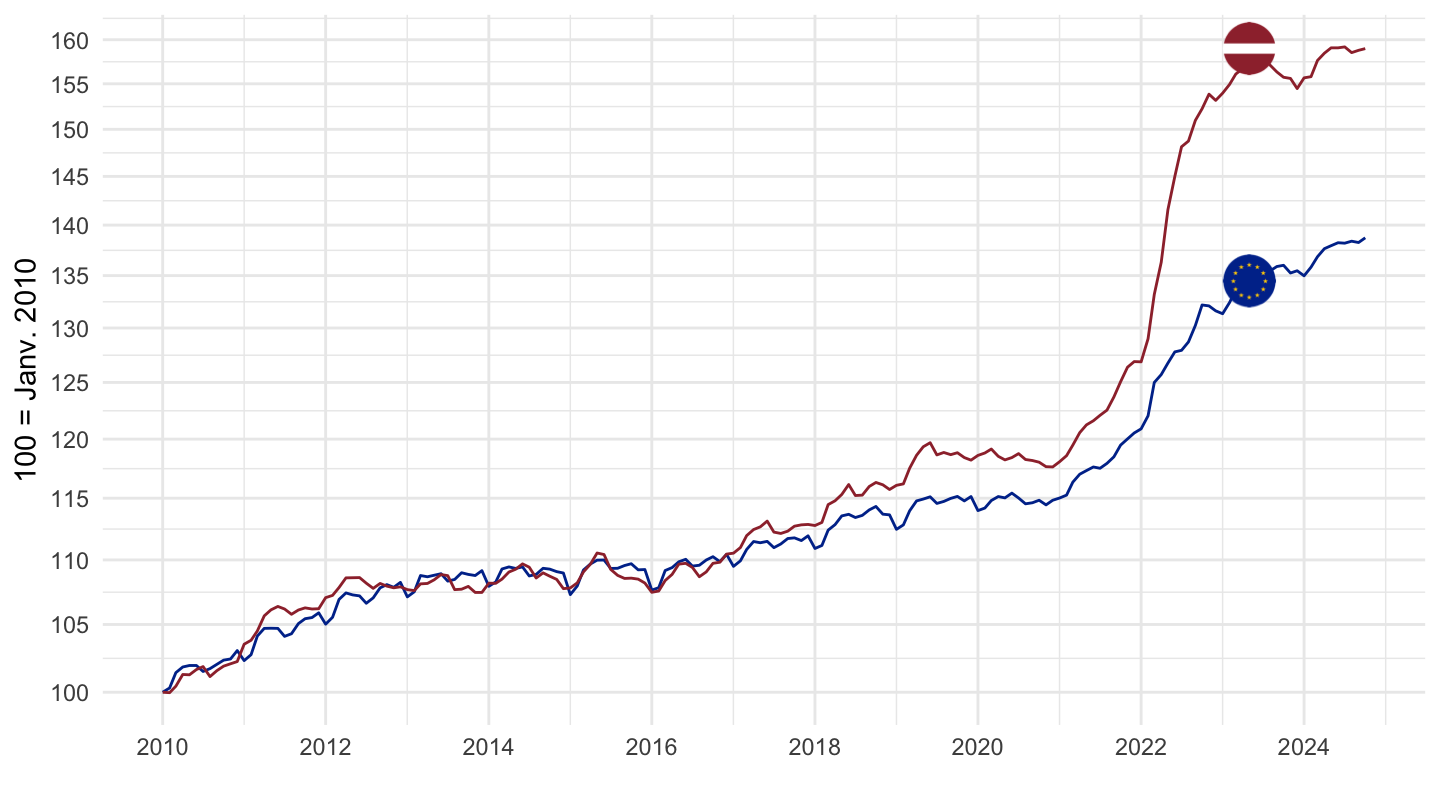
Lithuania, Euro area
All
Code
prc_hicp_midx %>%
  filter(unit == "I15",
         coicop == "CP00",
         geo %in% c("LT", "EA")) %>%
  month_to_date %>%
  group_by(geo) %>%
  mutate(values = 100*values/values[date == as.Date("2010-01-01")]) %>%

  mutate(Geo = ifelse(geo == "EA", "Europe", Geo),
         Geo = ifelse(geo == "DE", "Germany", Geo)) %>%
  add_colors %>%
  ggplot(.) + geom_line(aes(x = date, y = values, color = color)) + add_flags +
  theme_minimal() + xlab("") + ylab("100 = Janv. 2010") + scale_color_identity() +
  scale_x_date(breaks = seq(1960, 2100, 2) %>% paste0("-01-01") %>% as.Date,
               labels = date_format("%Y")) +
  scale_y_log10(breaks = seq(0, 400, 5))
2010-
Code
prc_hicp_midx %>%
  filter(unit == "I15",
         coicop == "CP00",
         geo %in% c("LT", "EA")) %>%
  month_to_date %>%
  filter(date >= as.Date("2010-01-01")) %>%
  group_by(geo) %>%
  mutate(values = 100*values/values[date == as.Date("2010-01-01")]) %>%

  mutate(Geo = ifelse(geo == "EA", "Europe", Geo),
         Geo = ifelse(geo == "DE", "Germany", Geo)) %>%
  add_colors %>%
  ggplot(.) + geom_line(aes(x = date, y = values, color = color)) + add_flags +
  theme_minimal() + xlab("") + ylab("100 = Janv. 2010") + scale_color_identity() +
  scale_x_date(breaks = seq(1960, 2100, 2) %>% paste0("-01-01") %>% as.Date,
               labels = date_format("%Y")) +
  scale_y_log10(breaks = seq(0, 400, 5))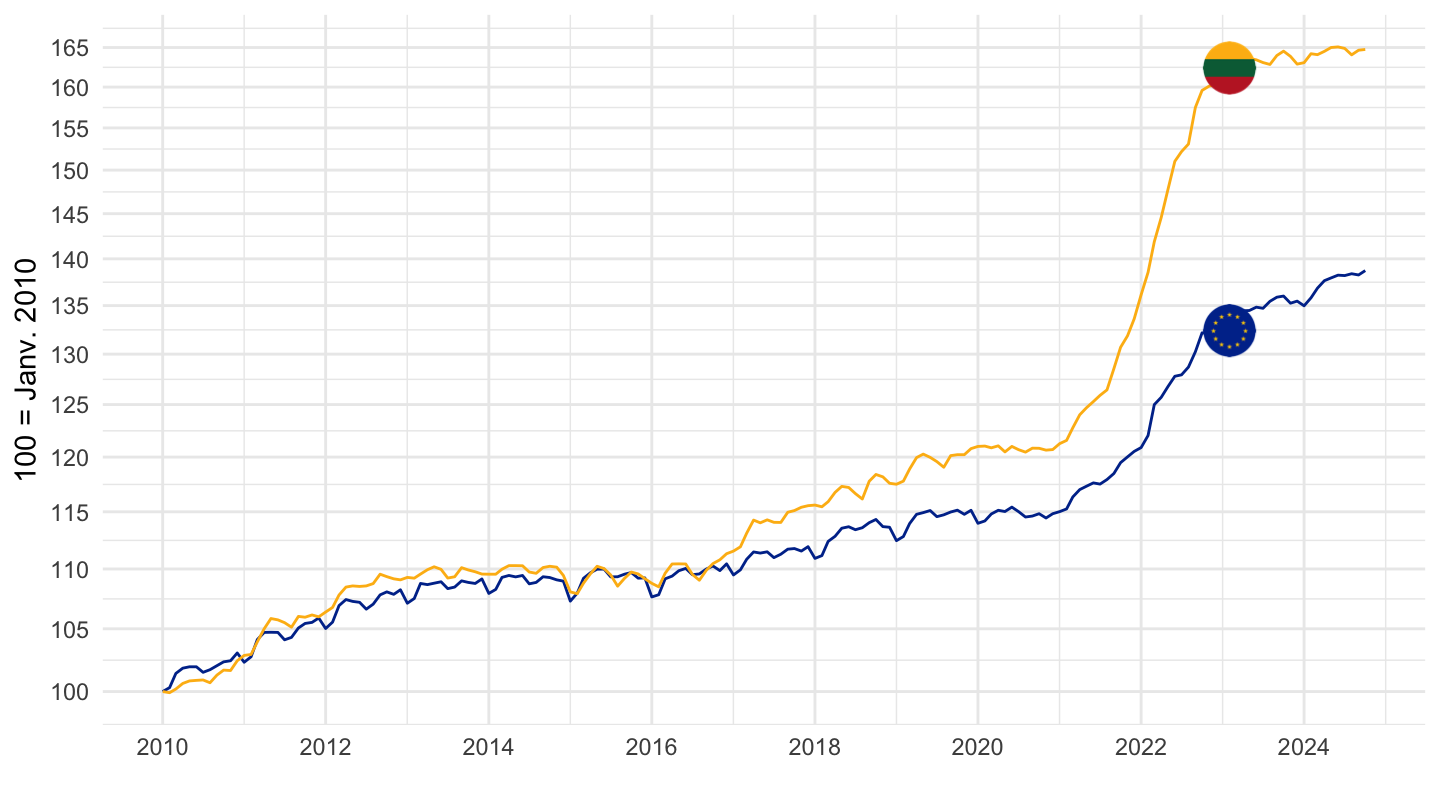
Luxembourg, Euro area
All
Code
prc_hicp_midx %>%
  filter(unit == "I15",
         coicop == "CP00",
         geo %in% c("LU", "EA")) %>%
  month_to_date %>%
  group_by(geo) %>%
  mutate(values = 100*values/values[date == as.Date("2010-01-01")]) %>%

  mutate(Geo = ifelse(geo == "EA", "Europe", Geo),
         Geo = ifelse(geo == "DE", "Germany", Geo)) %>%
  add_colors %>%
  ggplot(.) + geom_line(aes(x = date, y = values, color = color)) + add_flags +
  theme_minimal() + xlab("") + ylab("100 = Janv. 2010") + scale_color_identity() +
  scale_x_date(breaks = seq(1960, 2100, 2) %>% paste0("-01-01") %>% as.Date,
               labels = date_format("%Y")) +
  scale_y_log10(breaks = seq(0, 400, 5))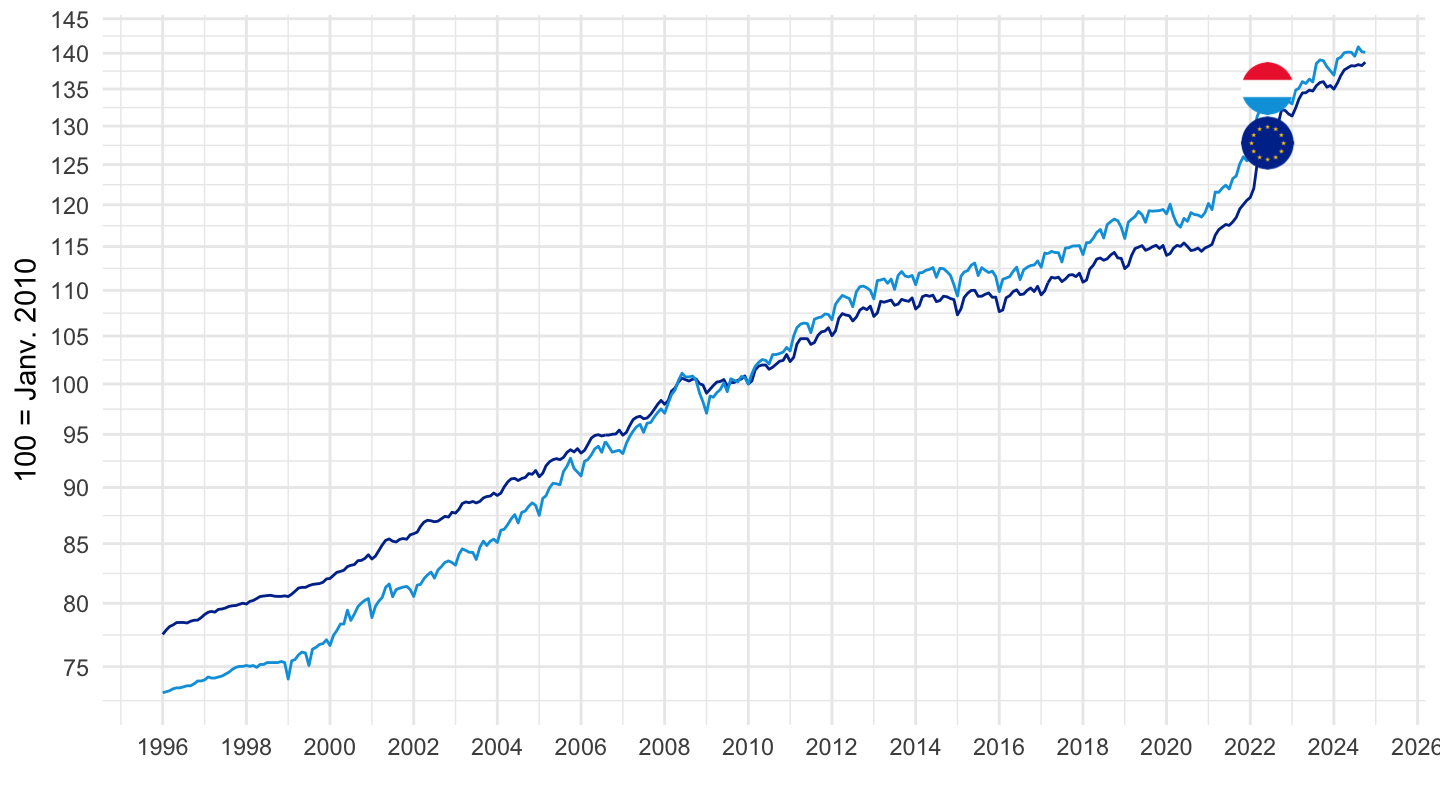
2010-
Code
prc_hicp_midx %>%
  filter(unit == "I15",
         coicop == "CP00",
         geo %in% c("LU", "EA")) %>%
  month_to_date %>%
  filter(date >= as.Date("2010-01-01")) %>%
  group_by(geo) %>%
  mutate(values = 100*values/values[date == as.Date("2010-01-01")]) %>%

  mutate(Geo = ifelse(geo == "EA", "Europe", Geo),
         Geo = ifelse(geo == "DE", "Germany", Geo)) %>%
  add_colors %>%
  ggplot(.) + geom_line(aes(x = date, y = values, color = color)) + add_flags +
  theme_minimal() + xlab("") + ylab("100 = Janv. 2010") + scale_color_identity() +
  scale_x_date(breaks = seq(1960, 2100, 2) %>% paste0("-01-01") %>% as.Date,
               labels = date_format("%Y")) +
  scale_y_log10(breaks = seq(0, 400, 5))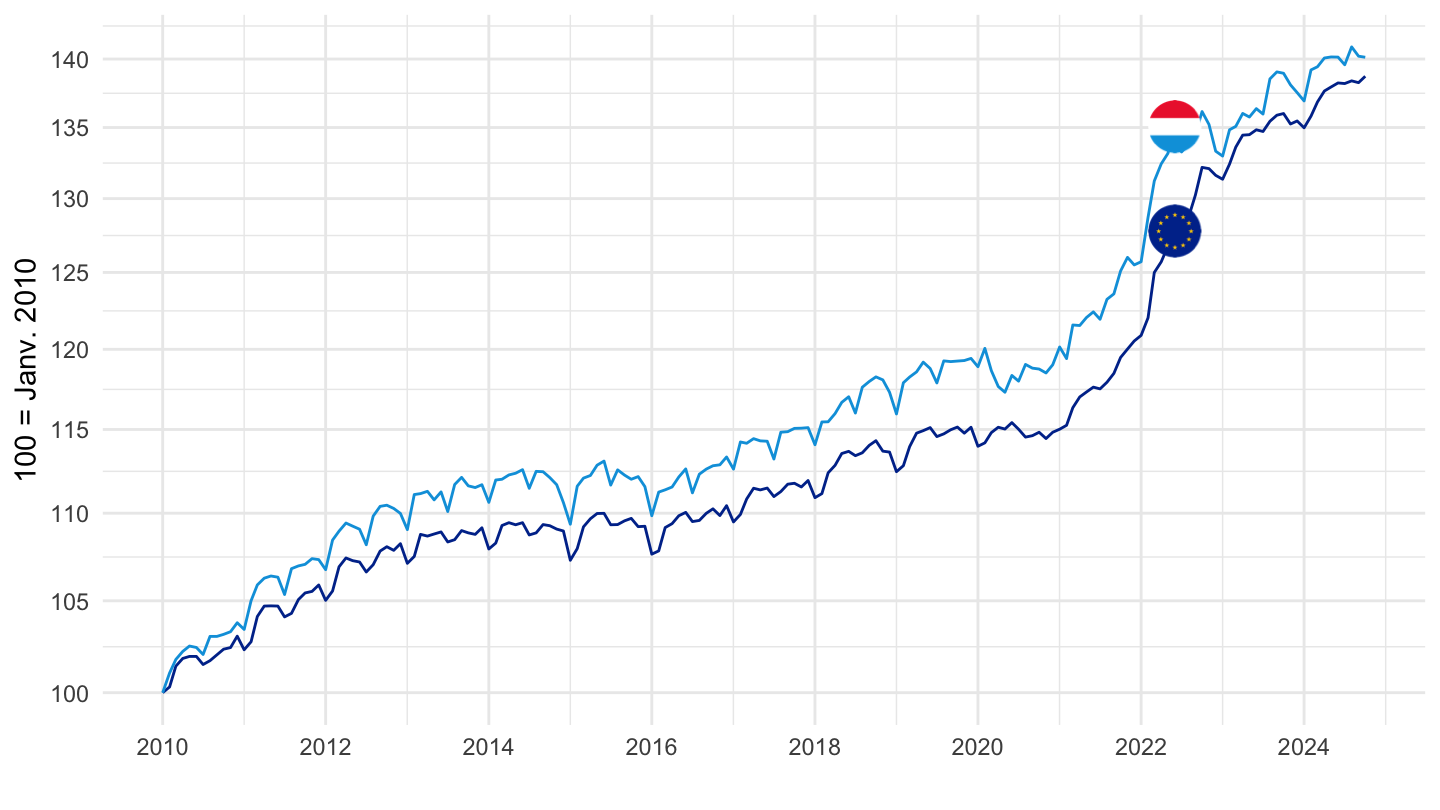
Malta, Euro area
All
Code
prc_hicp_midx %>%
  filter(unit == "I15",
         coicop == "CP00",
         geo %in% c("MT", "EA")) %>%
  month_to_date %>%
  group_by(geo) %>%
  mutate(values = 100*values/values[date == as.Date("2010-01-01")]) %>%

  mutate(Geo = ifelse(geo == "EA", "Europe", Geo),
         Geo = ifelse(geo == "DE", "Germany", Geo)) %>%
  add_colors %>%
  ggplot(.) + geom_line(aes(x = date, y = values, color = color)) + add_flags +
  theme_minimal() + xlab("") + ylab("100 = Janv. 2010") + scale_color_identity() +
  scale_x_date(breaks = seq(1960, 2100, 2) %>% paste0("-01-01") %>% as.Date,
               labels = date_format("%Y")) +
  scale_y_log10(breaks = seq(0, 400, 5))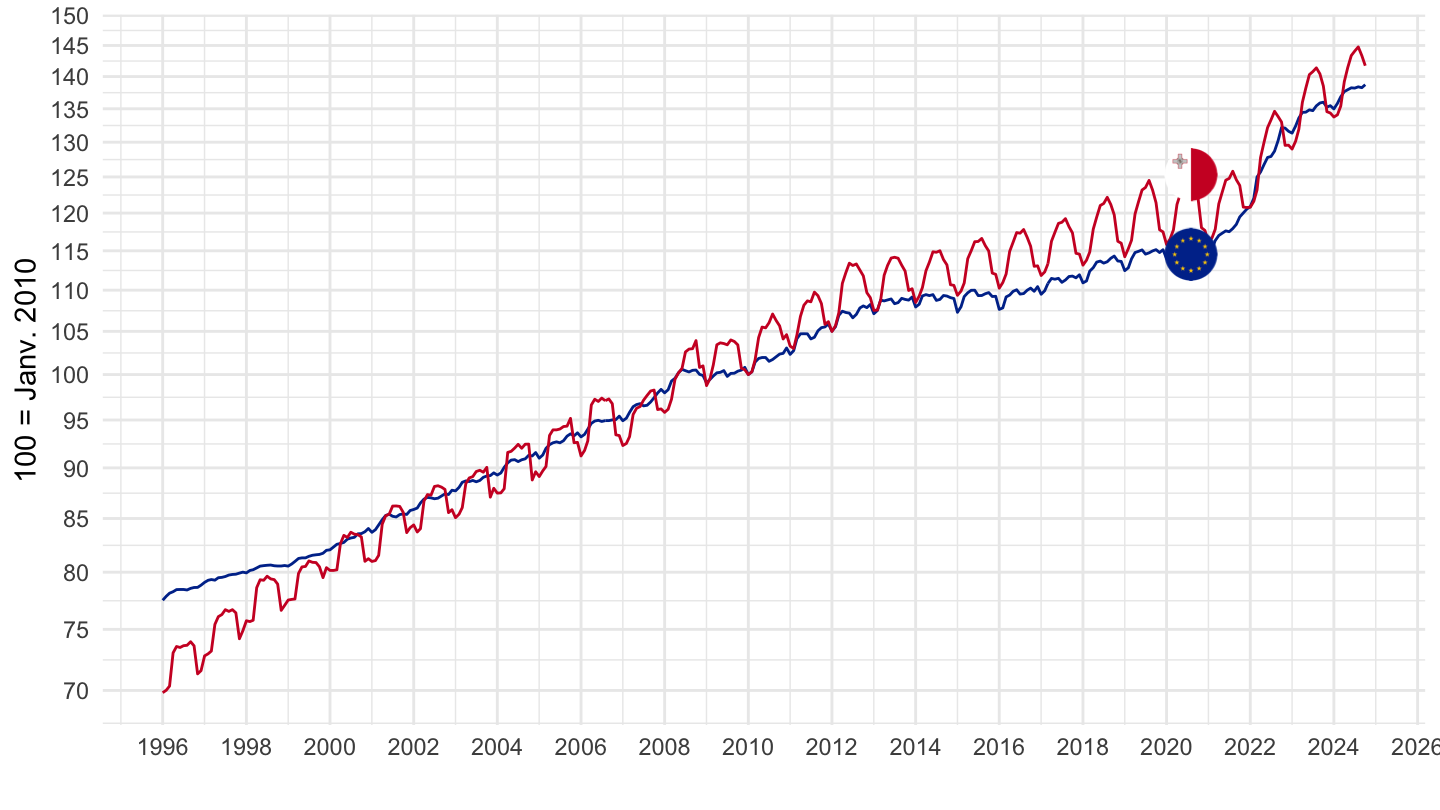
2010-
Code
prc_hicp_midx %>%
  filter(unit == "I15",
         coicop == "CP00",
         geo %in% c("MT", "EA")) %>%
  month_to_date %>%
  filter(date >= as.Date("2010-01-01")) %>%
  group_by(geo) %>%
  mutate(values = 100*values/values[date == as.Date("2010-01-01")]) %>%

  mutate(Geo = ifelse(geo == "EA", "Europe", Geo),
         Geo = ifelse(geo == "DE", "Germany", Geo)) %>%
  add_colors %>%
  ggplot(.) + geom_line(aes(x = date, y = values, color = color)) + add_flags +
  theme_minimal() + xlab("") + ylab("100 = Janv. 2010") + scale_color_identity() +
  scale_x_date(breaks = seq(1960, 2100, 2) %>% paste0("-01-01") %>% as.Date,
               labels = date_format("%Y")) +
  scale_y_log10(breaks = seq(0, 400, 5))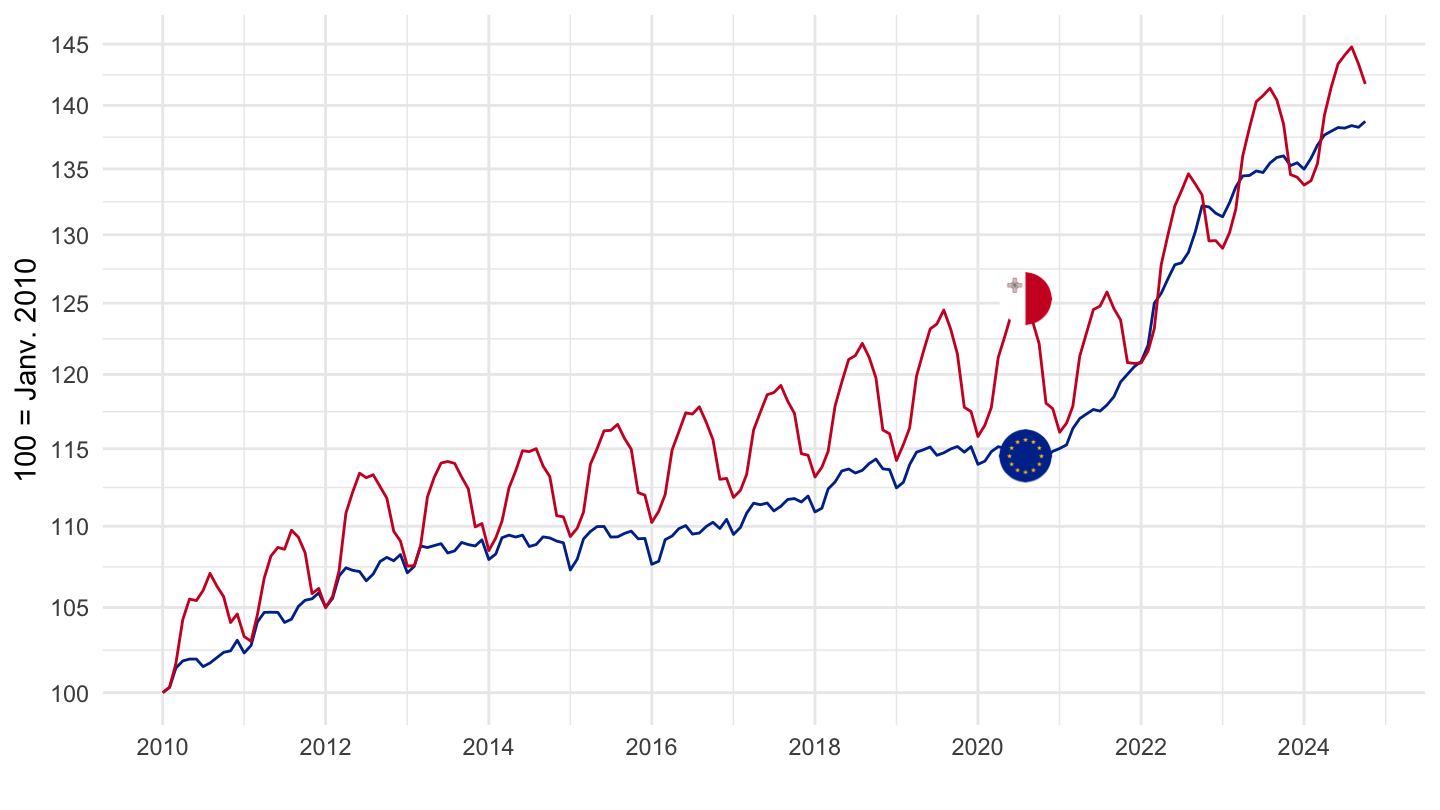
the Netherlands, Euro area
All
Code
prc_hicp_midx %>%
  filter(unit == "I15",
         coicop == "CP00",
         geo %in% c("NL", "EA")) %>%
  month_to_date %>%
  group_by(geo) %>%
  mutate(values = 100*values/values[date == as.Date("2010-01-01")]) %>%

  mutate(Geo = ifelse(geo == "EA", "Europe", Geo),
         Geo = ifelse(geo == "DE", "Germany", Geo)) %>%
  add_colors %>%
  ggplot(.) + geom_line(aes(x = date, y = values, color = color)) + add_flags +
  theme_minimal() + xlab("") + ylab("100 = Janv. 2010") + scale_color_identity() +
  scale_x_date(breaks = seq(1960, 2100, 2) %>% paste0("-01-01") %>% as.Date,
               labels = date_format("%Y")) +
  scale_y_log10(breaks = seq(0, 400, 5))
2010-
Code
prc_hicp_midx %>%
  filter(unit == "I15",
         coicop == "CP00",
         geo %in% c("NL", "EA")) %>%
  month_to_date %>%
  filter(date >= as.Date("2010-01-01")) %>%
  group_by(geo) %>%
  mutate(values = 100*values/values[date == as.Date("2010-01-01")]) %>%

  mutate(Geo = ifelse(geo == "EA", "Europe", Geo),
         Geo = ifelse(geo == "DE", "Germany", Geo)) %>%
  add_colors %>%
  ggplot(.) + geom_line(aes(x = date, y = values, color = color)) + add_flags +
  theme_minimal() + xlab("") + ylab("100 = Janv. 2010") + scale_color_identity() +
  scale_x_date(breaks = seq(1960, 2100, 2) %>% paste0("-01-01") %>% as.Date,
               labels = date_format("%Y")) +
  scale_y_log10(breaks = seq(0, 400, 5))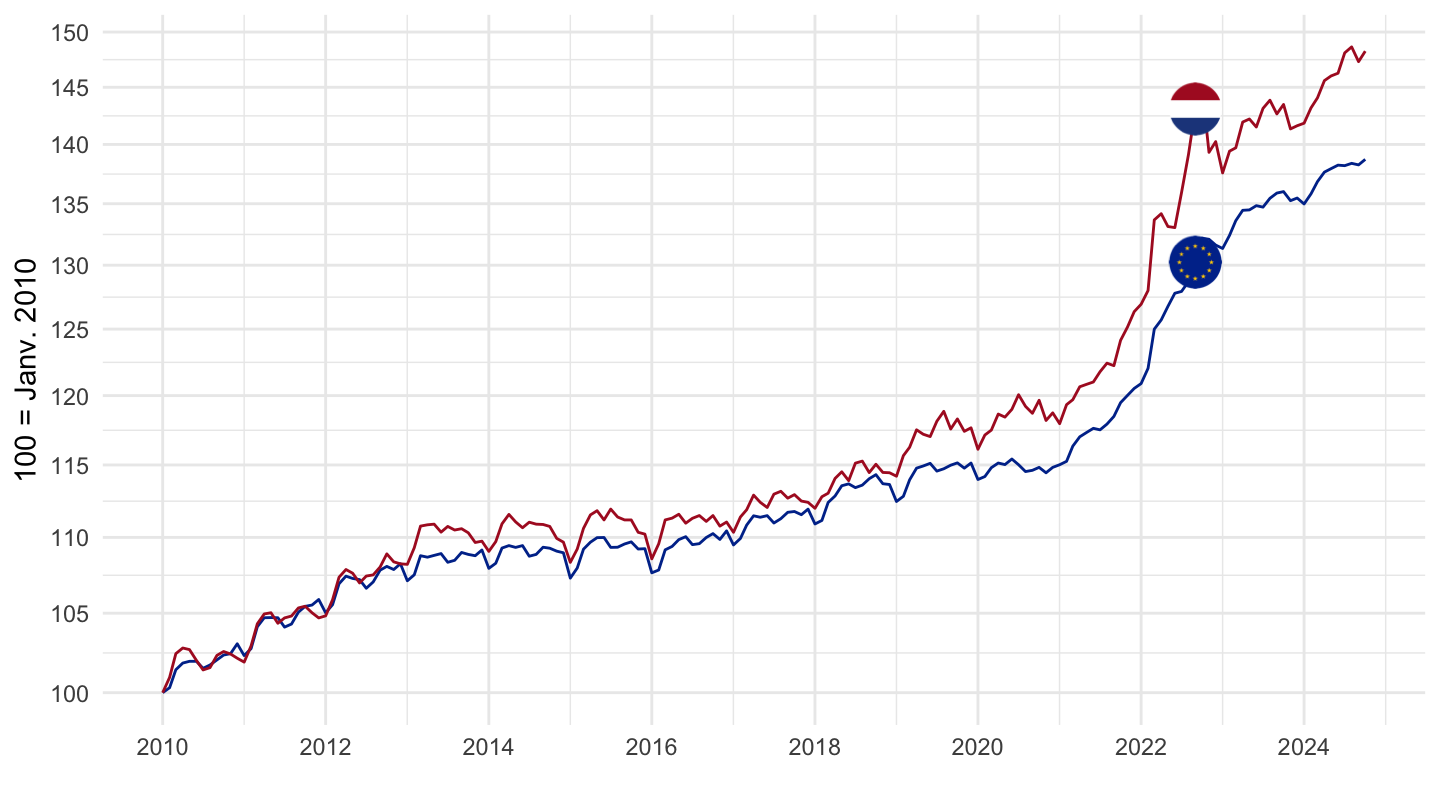
Portugal, Euro area
All
Code
prc_hicp_midx %>%
  filter(unit == "I15",
         coicop == "CP00",
         geo %in% c("PT", "EA")) %>%
  month_to_date %>%
  group_by(geo) %>%
  mutate(values = 100*values/values[date == as.Date("2010-01-01")]) %>%

  mutate(Geo = ifelse(geo == "EA", "Europe", Geo),
         Geo = ifelse(geo == "DE", "Germany", Geo)) %>%
  add_colors %>%
  ggplot(.) + geom_line(aes(x = date, y = values, color = color)) + add_flags +
  theme_minimal() + xlab("") + ylab("100 = Janv. 2010") + scale_color_identity() +
  scale_x_date(breaks = seq(1960, 2100, 2) %>% paste0("-01-01") %>% as.Date,
               labels = date_format("%Y")) +
  scale_y_log10(breaks = seq(0, 400, 5))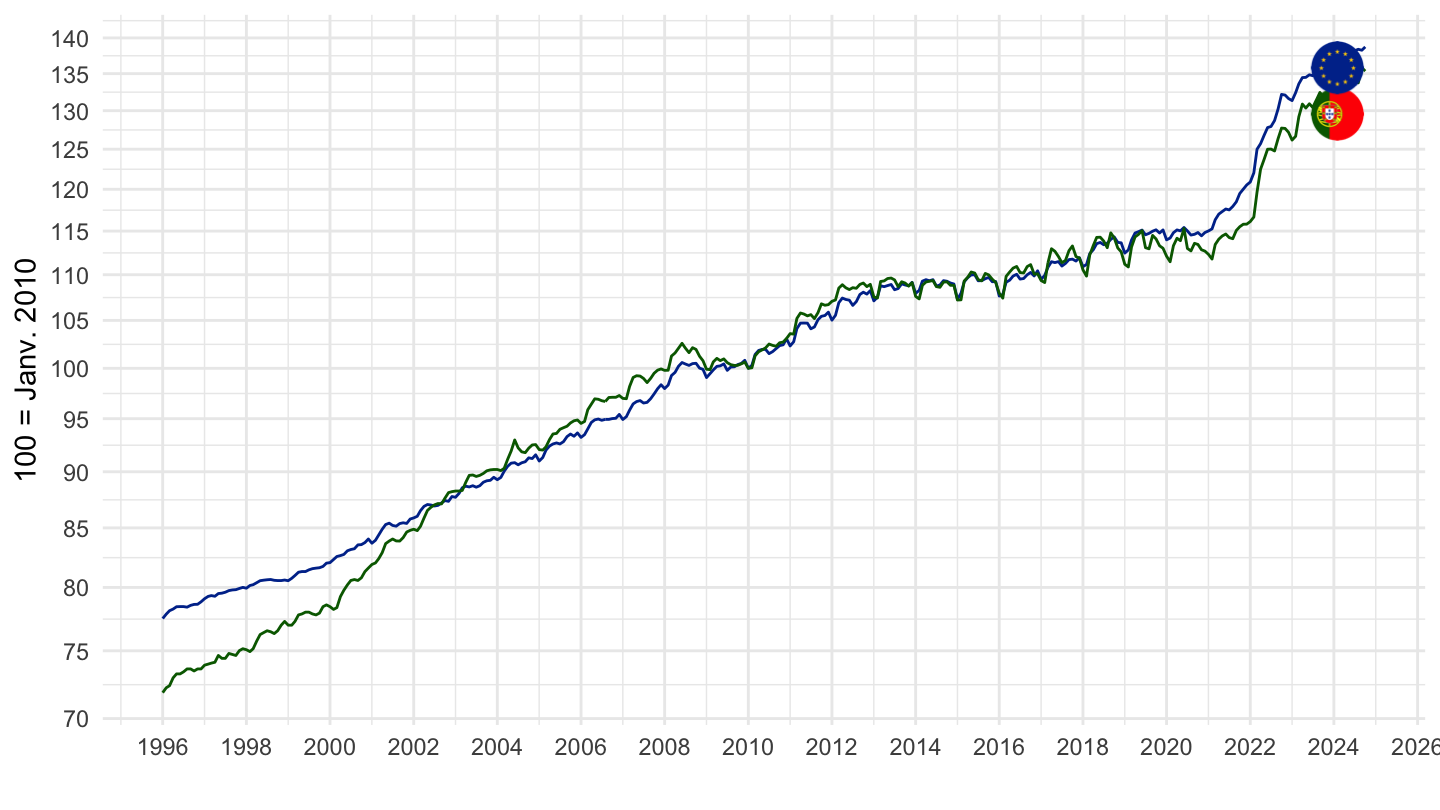
2010-
Code
prc_hicp_midx %>%
  filter(unit == "I15",
         coicop == "CP00",
         geo %in% c("PT", "EA")) %>%
  month_to_date %>%
  filter(date >= as.Date("2010-01-01")) %>%
  group_by(geo) %>%
  mutate(values = 100*values/values[date == as.Date("2010-01-01")]) %>%

  mutate(Geo = ifelse(geo == "EA", "Europe", Geo),
         Geo = ifelse(geo == "DE", "Germany", Geo)) %>%
  add_colors %>%
  ggplot(.) + geom_line(aes(x = date, y = values, color = color)) + add_flags +
  theme_minimal() + xlab("") + ylab("100 = Janv. 2010") + scale_color_identity() +
  scale_x_date(breaks = seq(1960, 2100, 2) %>% paste0("-01-01") %>% as.Date,
               labels = date_format("%Y")) +
  scale_y_log10(breaks = seq(0, 400, 5))
Slovakia, Euro area
All
Code
prc_hicp_midx %>%
  filter(unit == "I15",
         coicop == "CP00",
         geo %in% c("SK", "EA")) %>%
  month_to_date %>%
  group_by(geo) %>%
  mutate(values = 100*values/values[date == as.Date("2010-01-01")]) %>%

  mutate(Geo = ifelse(geo == "EA", "Europe", Geo),
         Geo = ifelse(geo == "DE", "Germany", Geo)) %>%
  add_colors %>%
  ggplot(.) + geom_line(aes(x = date, y = values, color = color)) + add_flags +
  theme_minimal() + xlab("") + ylab("100 = Janv. 2010") + scale_color_identity() +
  scale_x_date(breaks = seq(1960, 2100, 2) %>% paste0("-01-01") %>% as.Date,
               labels = date_format("%Y")) +
  scale_y_log10(breaks = seq(0, 400, 5))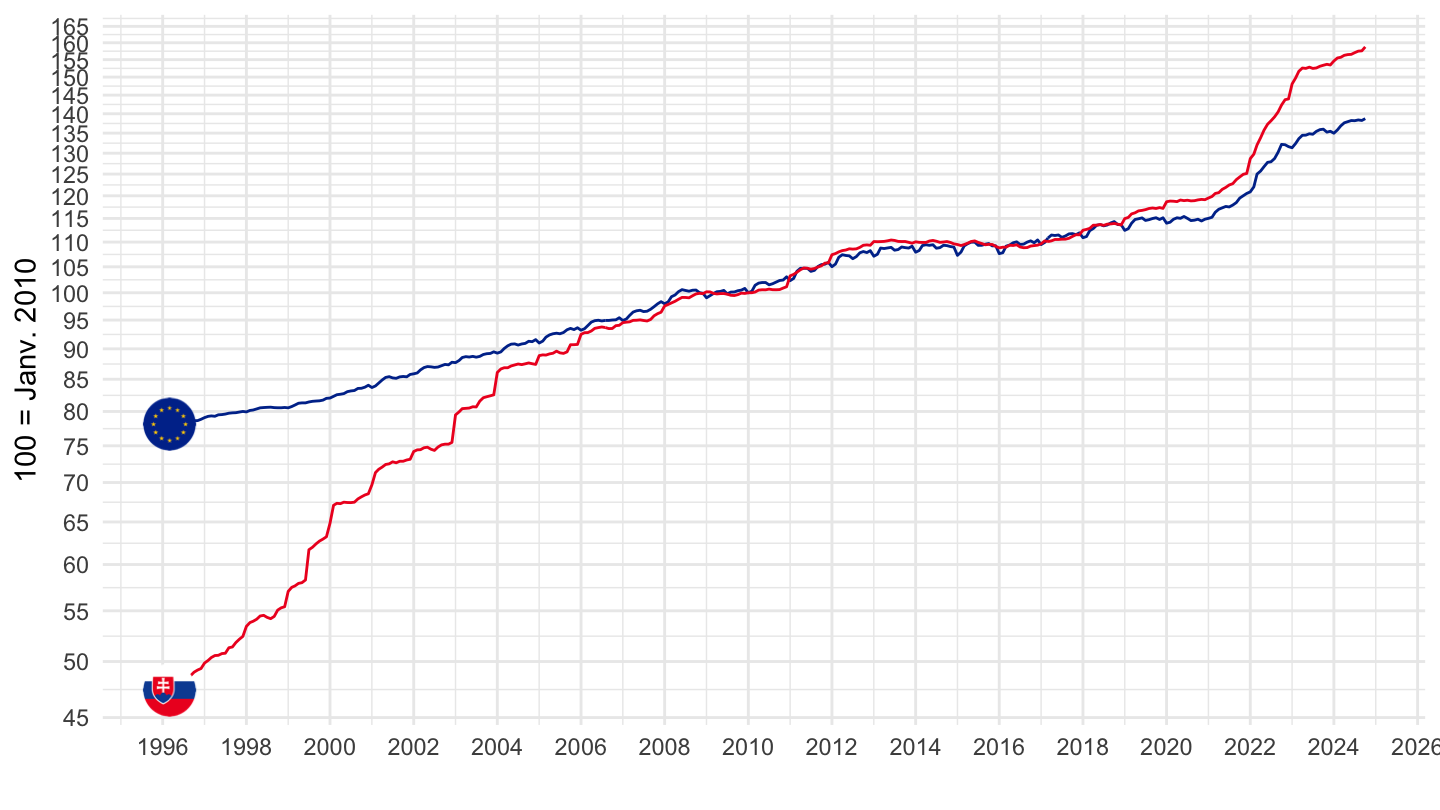
2010-
Code
prc_hicp_midx %>%
  filter(unit == "I15",
         coicop == "CP00",
         geo %in% c("SK", "EA")) %>%
  month_to_date %>%
  filter(date >= as.Date("2010-01-01")) %>%
  group_by(geo) %>%
  mutate(values = 100*values/values[date == as.Date("2010-01-01")]) %>%

  mutate(Geo = ifelse(geo == "EA", "Europe", Geo),
         Geo = ifelse(geo == "DE", "Germany", Geo)) %>%
  add_colors %>%
  ggplot(.) + geom_line(aes(x = date, y = values, color = color)) + add_flags +
  theme_minimal() + xlab("") + ylab("100 = Janv. 2010") + scale_color_identity() +
  scale_x_date(breaks = seq(1960, 2100, 2) %>% paste0("-01-01") %>% as.Date,
               labels = date_format("%Y")) +
  scale_y_log10(breaks = seq(0, 400, 5))
Slovenia, Euro area
All
Code
prc_hicp_midx %>%
  filter(unit == "I15",
         coicop == "CP00",
         geo %in% c("SI", "EA")) %>%
  month_to_date %>%
  group_by(geo) %>%
  mutate(values = 100*values/values[date == as.Date("2010-01-01")]) %>%

  mutate(Geo = ifelse(geo == "EA", "Europe", Geo),
         Geo = ifelse(geo == "DE", "Germany", Geo)) %>%
  add_colors %>%
  ggplot(.) + geom_line(aes(x = date, y = values, color = color)) + add_flags +
  theme_minimal() + xlab("") + ylab("100 = Janv. 2010") + scale_color_identity() +
  scale_x_date(breaks = seq(1960, 2100, 2) %>% paste0("-01-01") %>% as.Date,
               labels = date_format("%Y")) +
  scale_y_log10(breaks = seq(0, 400, 5))
2010-
Code
prc_hicp_midx %>%
  filter(unit == "I15",
         coicop == "CP00",
         geo %in% c("SI", "EA")) %>%
  month_to_date %>%
  filter(date >= as.Date("2010-01-01")) %>%
  group_by(geo) %>%
  mutate(values = 100*values/values[date == as.Date("2010-01-01")]) %>%

  mutate(Geo = ifelse(geo == "EA", "Europe", Geo),
         Geo = ifelse(geo == "DE", "Germany", Geo)) %>%
  add_colors %>%
  ggplot(.) + geom_line(aes(x = date, y = values, color = color)) + add_flags +
  theme_minimal() + xlab("") + ylab("100 = Janv. 2010") + scale_color_identity() +
  scale_x_date(breaks = seq(1960, 2100, 2) %>% paste0("-01-01") %>% as.Date,
               labels = date_format("%Y")) +
  scale_y_log10(breaks = seq(0, 400, 5))
Spain, Euro area
All
Code
prc_hicp_midx %>%
  filter(unit == "I15",
         coicop == "CP00",
         geo %in% c("ES", "EA")) %>%
  month_to_date %>%
  group_by(geo) %>%
  mutate(values = 100*values/values[date == as.Date("2010-01-01")]) %>%

  mutate(Geo = ifelse(geo == "EA", "Europe", Geo),
         Geo = ifelse(geo == "DE", "Germany", Geo)) %>%
  add_colors %>%
  ggplot(.) + geom_line(aes(x = date, y = values, color = color)) + add_flags +
  theme_minimal() + xlab("") + ylab("100 = Janv. 2010") + scale_color_identity() +
  scale_x_date(breaks = seq(1960, 2100, 2) %>% paste0("-01-01") %>% as.Date,
               labels = date_format("%Y")) +
  scale_y_log10(breaks = seq(0, 400, 5))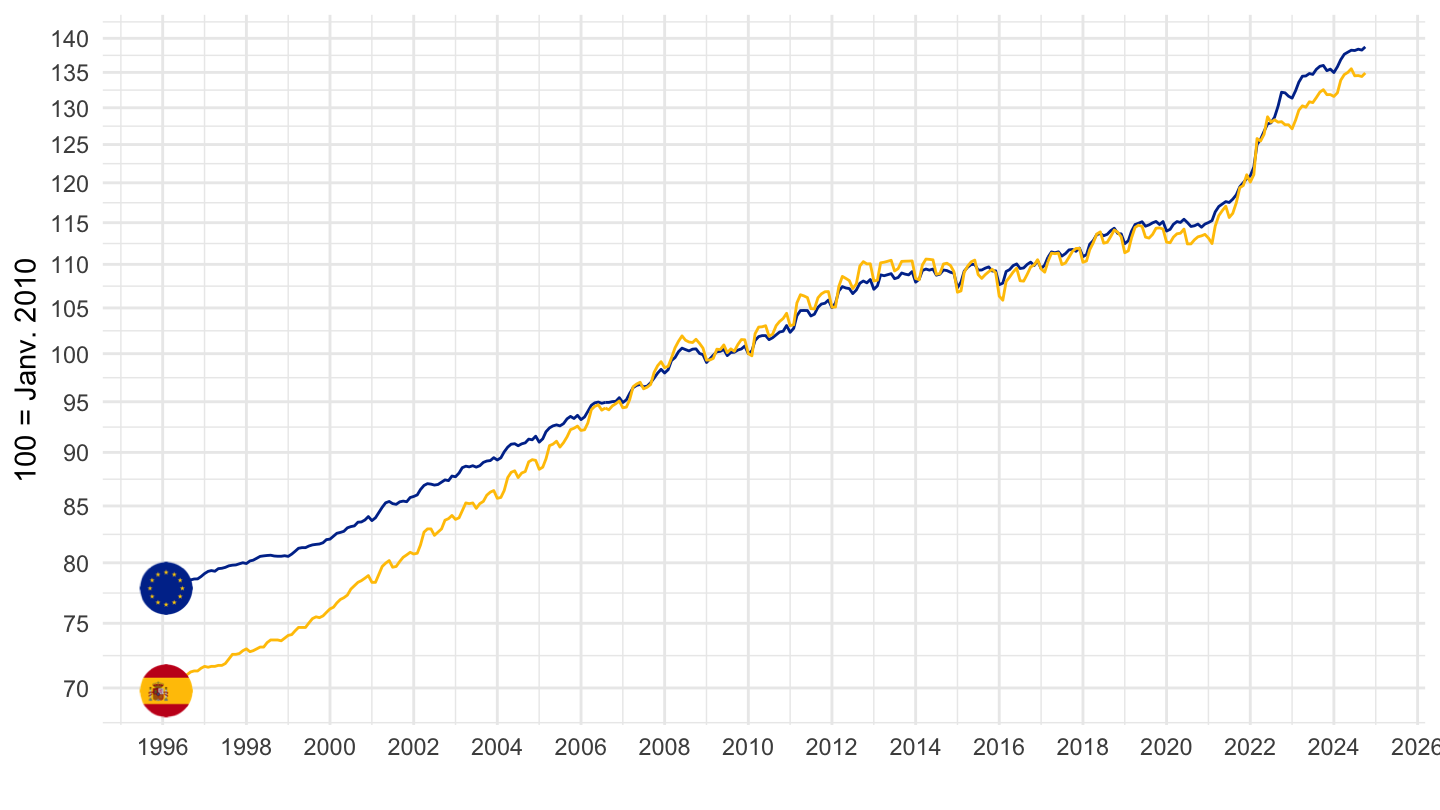
2010-
Code
prc_hicp_midx %>%
  filter(unit == "I15",
         coicop == "CP00",
         geo %in% c("ES", "EA")) %>%
  month_to_date %>%
  filter(date >= as.Date("2010-01-01")) %>%
  group_by(geo) %>%
  mutate(values = 100*values/values[date == as.Date("2010-01-01")]) %>%

  mutate(Geo = ifelse(geo == "EA", "Europe", Geo),
         Geo = ifelse(geo == "DE", "Germany", Geo)) %>%
  add_colors %>%
  ggplot(.) + geom_line(aes(x = date, y = values, color = color)) + add_flags +
  theme_minimal() + xlab("") + ylab("100 = Janv. 2010") + scale_color_identity() +
  scale_x_date(breaks = seq(1960, 2100, 2) %>% paste0("-01-01") %>% as.Date,
               labels = date_format("%Y")) +
  scale_y_log10(breaks = seq(0, 400, 5))
France, Germany, Spain
All
Code
prc_hicp_midx %>%
  filter(unit == "I15",
         coicop == "CP00",
         geo %in% c("FR", "DE", "ES")) %>%
  month_to_date %>%
  group_by(geo) %>%
  mutate(values = 100*values/values[date == as.Date("1996-01-01")]) %>%

  add_colors %>%
  ggplot(.) + geom_line(aes(x = date, y = values, color = color)) + add_flags +
  theme_minimal() + xlab("") + ylab("100 = Janv. 2010") + scale_color_identity() +
  scale_x_date(breaks = seq(1960, 2100, 2) %>% paste0("-01-01") %>% as.Date,
               labels = date_format("%Y")) +
  scale_y_log10(breaks = seq(0, 400, 5))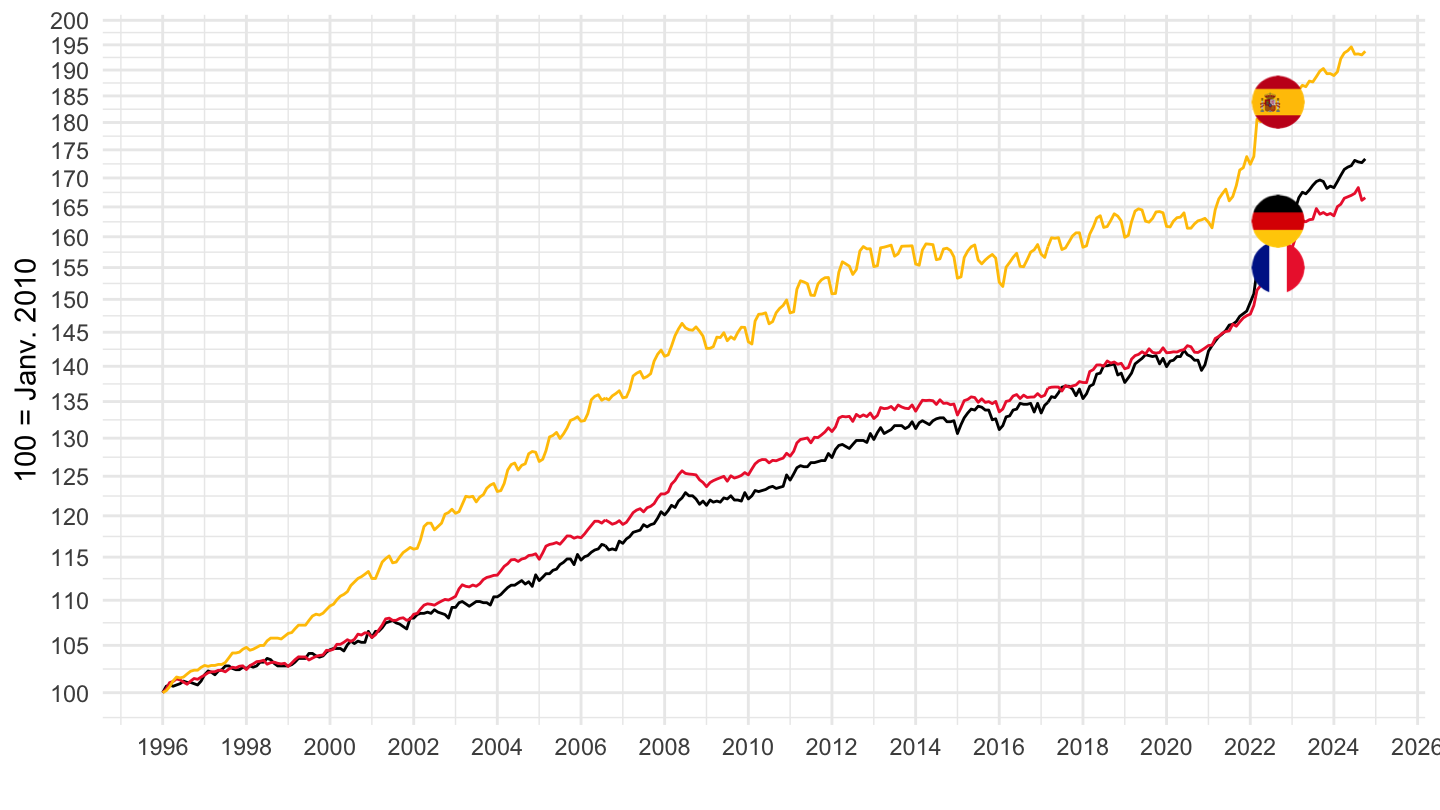
2000-
Code
prc_hicp_midx %>%
  filter(unit == "I15",
         coicop == "CP00",
         geo %in% c("FR", "DE", "ES")) %>%
  month_to_date %>%
  filter(date >= as.Date("2000-01-01")) %>%
  group_by(geo) %>%
  mutate(values = 100*values/values[date == as.Date("2000-01-01")]) %>%

  mutate(Geo = ifelse(geo == "DE", "Germany", Geo)) %>%
  add_colors %>%
  ggplot(.) + geom_line(aes(x = date, y = values, color = color)) + add_flags +
  theme_minimal() + xlab("") + ylab("100 = Janv. 2010") + scale_color_identity() +
  scale_x_date(breaks = seq(1960, 2100, 2) %>% paste0("-01-01") %>% as.Date,
               labels = date_format("%Y")) +
  scale_y_log10(breaks = seq(0, 400, 5))
2010-
Code
prc_hicp_midx %>%
  filter(unit == "I15",
         coicop == "CP00",
         geo %in% c("FR", "DE", "ES")) %>%
  month_to_date %>%
  filter(date >= as.Date("2010-01-01")) %>%
  group_by(geo) %>%
  mutate(values = 100*values/values[date == as.Date("2010-01-01")]) %>%

  mutate(Geo = ifelse(geo == "DE", "Germany", Geo)) %>%
  add_colors %>%
  ggplot(.) + geom_line(aes(x = date, y = values, color = color)) + add_flags +
  theme_minimal() + xlab("") + ylab("100 = Janv. 2010") + scale_color_identity() +
  scale_x_date(breaks = seq(1960, 2100, 2) %>% paste0("-01-01") %>% as.Date,
               labels = date_format("%Y")) +
  scale_y_log10(breaks = seq(0, 400, 5))
HICP - Europe non Eurozone
Bulgaria, Euro area
All
Code
prc_hicp_midx %>%
  filter(unit == "I15",
         coicop == "CP00",
         geo %in% c("BG", "EA")) %>%
  month_to_date %>%
  group_by(geo) %>%
  mutate(values = 100*values/values[date == as.Date("2010-01-01")]) %>%

  mutate(Geo = ifelse(geo == "EA", "Europe", Geo)) %>%
  add_colors %>%
  ggplot(.) + geom_line(aes(x = date, y = values, color = color)) + add_flags +
  theme_minimal() + xlab("") + ylab("100 = Janv. 2010") + scale_color_identity() +
  scale_x_date(breaks = seq(1960, 2100, 2) %>% paste0("-01-01") %>% as.Date,
               labels = date_format("%Y")) +
  scale_y_log10(breaks = seq(0, 400, 5))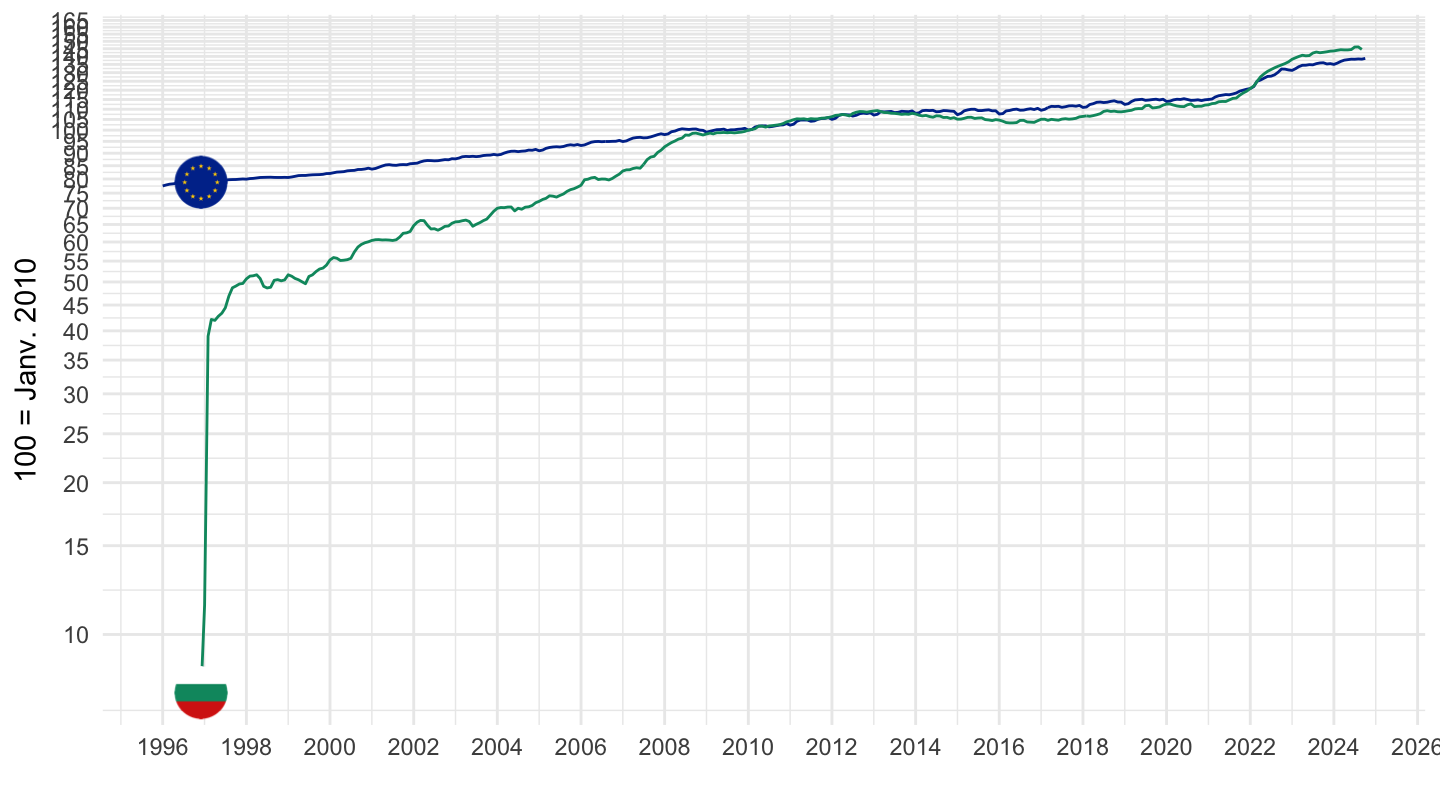
2000-
Code
prc_hicp_midx %>%
  filter(unit == "I15",
         coicop == "CP00",
         geo %in% c("BG", "EA")) %>%
  month_to_date %>%
  filter(date >= as.Date("2000-01-01")) %>%
  group_by(geo) %>%
  mutate(values = 100*values/values[date == as.Date("2010-01-01")]) %>%

  mutate(Geo = ifelse(geo == "EA", "Europe", Geo)) %>%
  add_colors %>%
  ggplot(.) + geom_line(aes(x = date, y = values, color = color)) + add_flags +
  theme_minimal() + xlab("") + ylab("100 = Janv. 2010") + scale_color_identity() +
  scale_x_date(breaks = seq(1960, 2100, 2) %>% paste0("-01-01") %>% as.Date,
               labels = date_format("%Y")) +
  scale_y_log10(breaks = seq(0, 400, 5))
2010
Code
prc_hicp_midx %>%
  filter(unit == "I15",
         coicop == "CP00",
         geo %in% c("BG", "EA")) %>%
  month_to_date %>%
  filter(date >= as.Date("2010-01-01")) %>%
  group_by(geo) %>%
  mutate(values = 100*values/values[date == as.Date("2010-01-01")]) %>%

  mutate(Geo = ifelse(geo == "EA", "Europe", Geo)) %>%
  add_colors %>%
  ggplot(.) + geom_line(aes(x = date, y = values, color = color)) + add_flags +
  theme_minimal() + xlab("") + ylab("100 = Janv. 2010") + scale_color_identity() +
  scale_x_date(breaks = seq(1960, 2100, 2) %>% paste0("-01-01") %>% as.Date,
               labels = date_format("%Y")) +
  scale_y_log10(breaks = seq(0, 400, 5))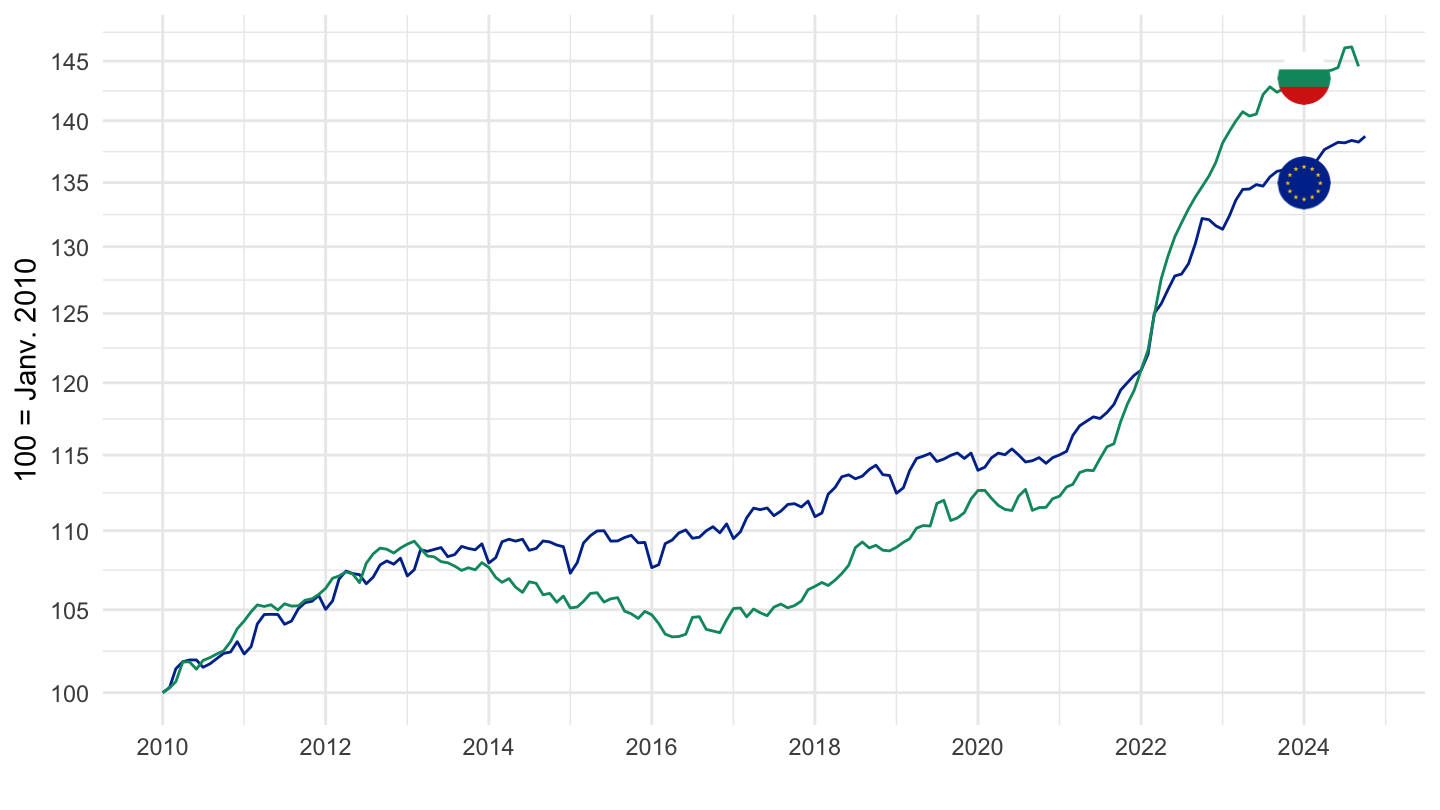
Croatia, Euro area
All
Code
prc_hicp_midx %>%
  filter(unit == "I15",
         coicop == "CP00",
         geo %in% c("HR", "EA")) %>%
  month_to_date %>%
  group_by(geo) %>%
  mutate(values = 100*values/values[date == as.Date("2010-01-01")]) %>%

  mutate(Geo = ifelse(geo == "EA", "Europe", Geo)) %>%
  add_colors %>%
  ggplot(.) + geom_line(aes(x = date, y = values, color = color)) + add_flags +
  theme_minimal() + xlab("") + ylab("100 = Janv. 2010") + scale_color_identity() +
  scale_x_date(breaks = seq(1960, 2100, 2) %>% paste0("-01-01") %>% as.Date,
               labels = date_format("%Y")) +
  scale_y_log10(breaks = seq(0, 400, 5))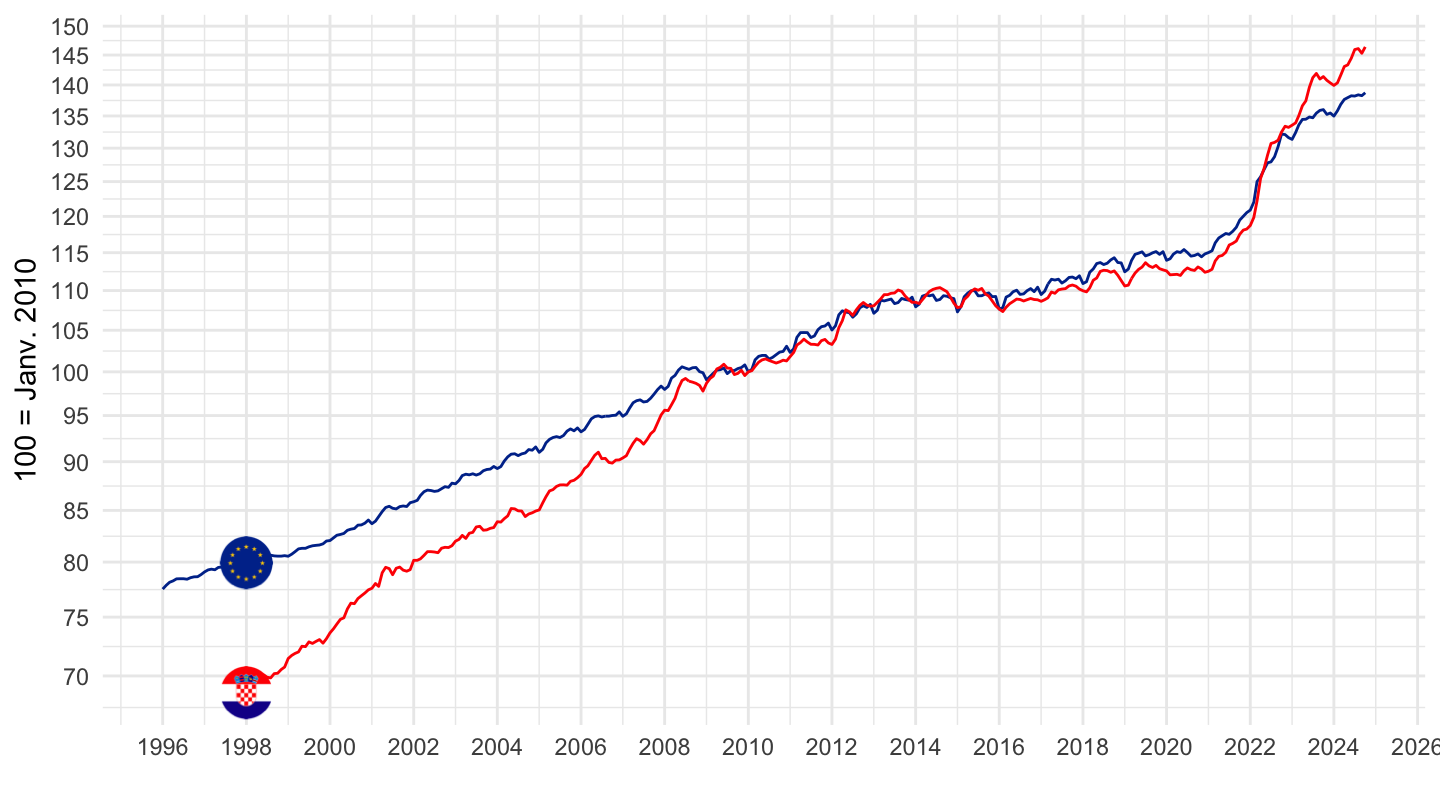
2000-
Code
prc_hicp_midx %>%
  filter(unit == "I15",
         coicop == "CP00",
         geo %in% c("HR", "EA")) %>%
  month_to_date %>%
  filter(date >= as.Date("2000-01-01")) %>%
  group_by(geo) %>%
  mutate(values = 100*values/values[date == as.Date("2010-01-01")]) %>%

  mutate(Geo = ifelse(geo == "EA", "Europe", Geo)) %>%
  add_colors %>%
  ggplot(.) + geom_line(aes(x = date, y = values, color = color)) + add_flags +
  theme_minimal() + xlab("") + ylab("100 = Janv. 2010") + scale_color_identity() +
  scale_x_date(breaks = seq(1960, 2100, 2) %>% paste0("-01-01") %>% as.Date,
               labels = date_format("%Y")) +
  scale_y_log10(breaks = seq(0, 400, 5))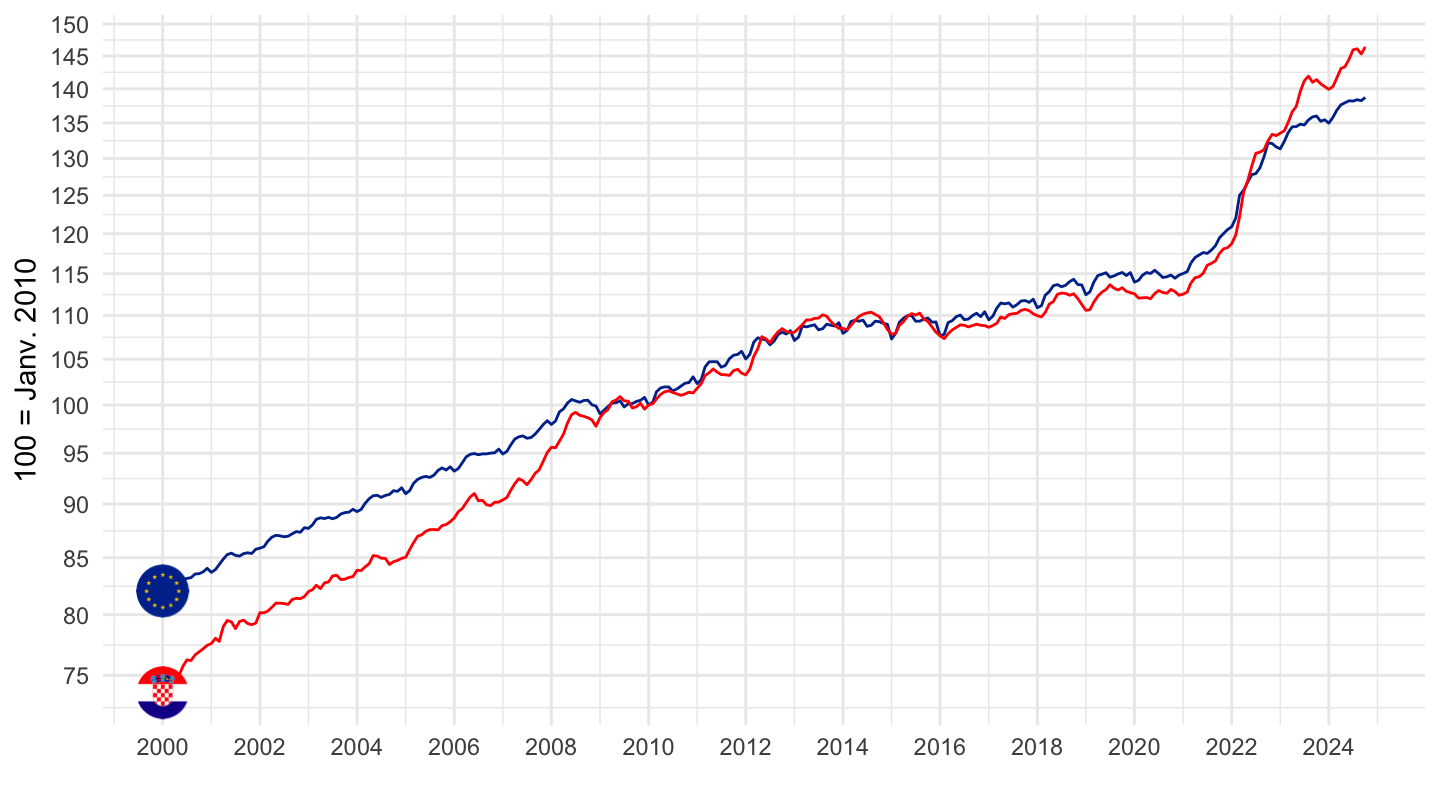
2010
Code
prc_hicp_midx %>%
  filter(unit == "I15",
         coicop == "CP00",
         geo %in% c("HR", "EA")) %>%
  month_to_date %>%
  filter(date >= as.Date("2010-01-01")) %>%
  group_by(geo) %>%
  mutate(values = 100*values/values[date == as.Date("2010-01-01")]) %>%

  mutate(Geo = ifelse(geo == "EA", "Europe", Geo)) %>%
  add_colors %>%
  ggplot(.) + geom_line(aes(x = date, y = values, color = color)) + add_flags +
  theme_minimal() + xlab("") + ylab("100 = Janv. 2010") + scale_color_identity() +
  scale_x_date(breaks = seq(1960, 2100, 2) %>% paste0("-01-01") %>% as.Date,
               labels = date_format("%Y")) +
  scale_y_log10(breaks = seq(0, 400, 5))
Czech Republic, Euro area
All
Code
prc_hicp_midx %>%
  filter(unit == "I15",
         coicop == "CP00",
         geo %in% c("CZ", "EA")) %>%
  month_to_date %>%
  group_by(geo) %>%
  mutate(values = 100*values/values[date == as.Date("2010-01-01")]) %>%

  mutate(Geo = ifelse(geo == "EA", "Europe", Geo)) %>%
  add_colors %>%
  ggplot(.) + geom_line(aes(x = date, y = values, color = color)) + add_flags +
  theme_minimal() + xlab("") + ylab("100 = Janv. 2010") + scale_color_identity() +
  scale_x_date(breaks = seq(1960, 2100, 2) %>% paste0("-01-01") %>% as.Date,
               labels = date_format("%Y")) +
  scale_y_log10(breaks = seq(0, 400, 5))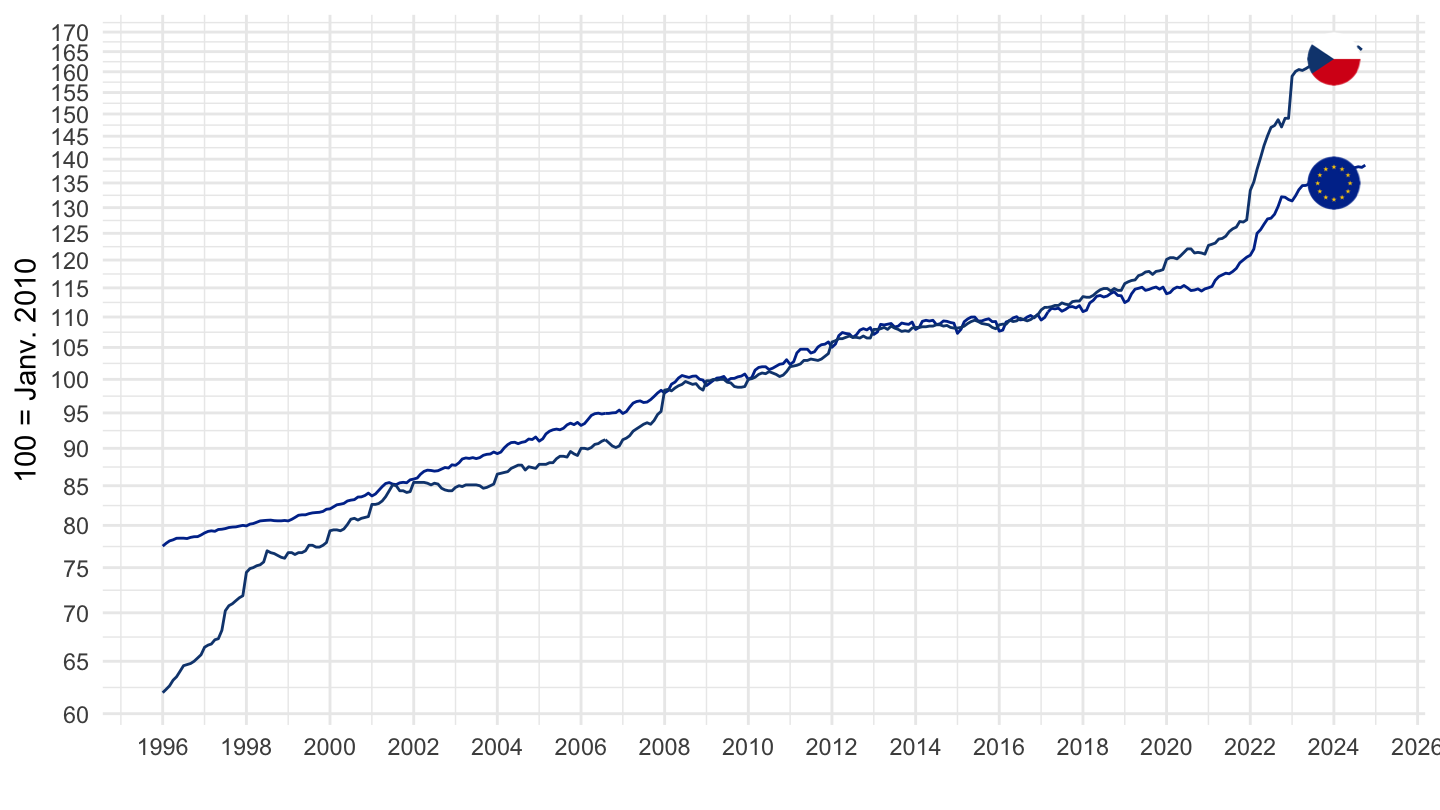
2000-
Code
prc_hicp_midx %>%
  filter(unit == "I15",
         coicop == "CP00",
         geo %in% c("CZ", "EA")) %>%
  month_to_date %>%
  filter(date >= as.Date("2000-01-01")) %>%
  group_by(geo) %>%
  mutate(values = 100*values/values[date == as.Date("2010-01-01")]) %>%

  mutate(Geo = ifelse(geo == "EA", "Europe", Geo)) %>%
  add_colors %>%
  ggplot(.) + geom_line(aes(x = date, y = values, color = color)) + add_flags +
  theme_minimal() + xlab("") + ylab("100 = Janv. 2010") + scale_color_identity() +
  scale_x_date(breaks = seq(1960, 2100, 2) %>% paste0("-01-01") %>% as.Date,
               labels = date_format("%Y")) +
  scale_y_log10(breaks = seq(0, 400, 5))
2010
Code
prc_hicp_midx %>%
  filter(unit == "I15",
         coicop == "CP00",
         geo %in% c("CZ", "EA")) %>%
  month_to_date %>%
  filter(date >= as.Date("2010-01-01")) %>%
  group_by(geo) %>%
  mutate(values = 100*values/values[date == as.Date("2010-01-01")]) %>%

  mutate(Geo = ifelse(geo == "EA", "Europe", Geo)) %>%
  add_colors %>%
  ggplot(.) + geom_line(aes(x = date, y = values, color = color)) + add_flags +
  theme_minimal() + xlab("") + ylab("100 = Janv. 2010") + scale_color_identity() +
  scale_x_date(breaks = seq(1960, 2100, 2) %>% paste0("-01-01") %>% as.Date,
               labels = date_format("%Y")) +
  scale_y_log10(breaks = seq(0, 400, 5))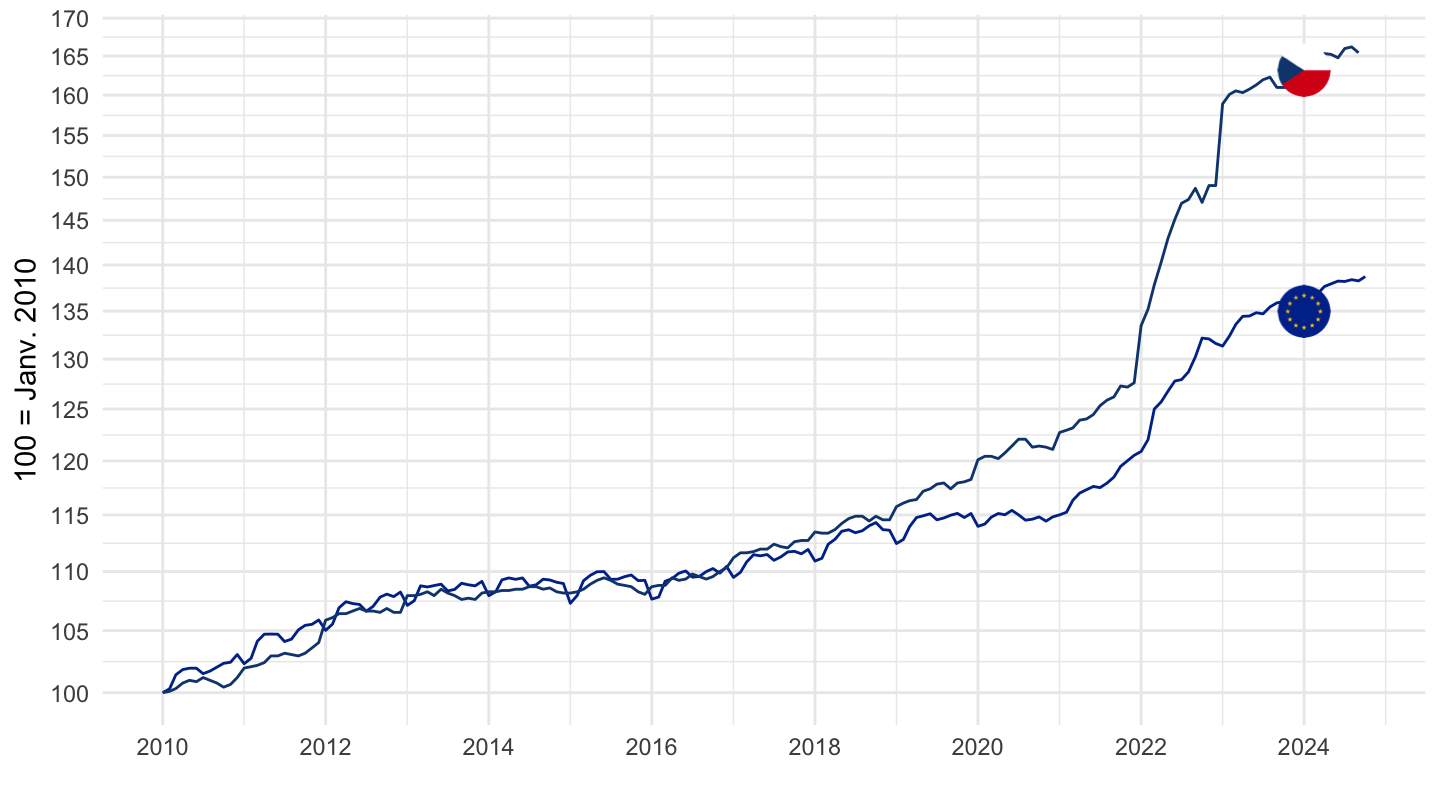
Denmark, Euro area
All
Code
prc_hicp_midx %>%
  filter(unit == "I15",
         coicop == "CP00",
         geo %in% c("DK", "EA")) %>%
  month_to_date %>%
  group_by(geo) %>%
  mutate(values = 100*values/values[date == as.Date("2010-01-01")]) %>%

  mutate(Geo = ifelse(geo == "EA", "Europe", Geo)) %>%
  add_colors %>%
  ggplot(.) + geom_line(aes(x = date, y = values, color = color)) + add_flags +
  theme_minimal() + xlab("") + ylab("100 = Janv. 2010") + scale_color_identity() +
  scale_x_date(breaks = seq(1960, 2100, 2) %>% paste0("-01-01") %>% as.Date,
               labels = date_format("%Y")) +
  scale_y_log10(breaks = seq(0, 400, 5))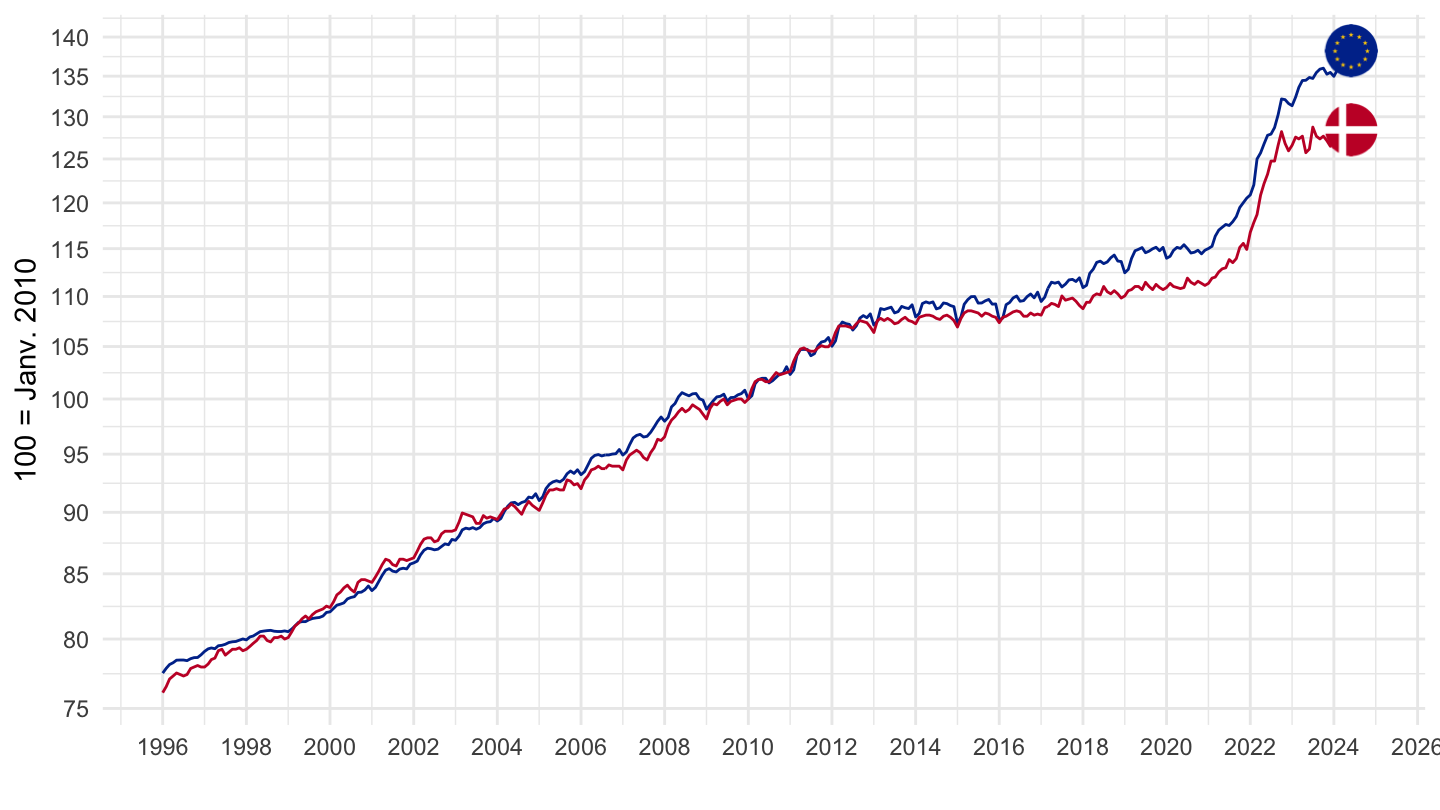
2000-
Code
prc_hicp_midx %>%
  filter(unit == "I15",
         coicop == "CP00",
         geo %in% c("DK", "EA")) %>%
  month_to_date %>%
  filter(date >= as.Date("2000-01-01")) %>%
  group_by(geo) %>%
  mutate(values = 100*values/values[date == as.Date("2010-01-01")]) %>%

  mutate(Geo = ifelse(geo == "EA", "Europe", Geo)) %>%
  add_colors %>%
  ggplot(.) + geom_line(aes(x = date, y = values, color = color)) + add_flags +
  theme_minimal() + xlab("") + ylab("100 = Janv. 2010") + scale_color_identity() +
  scale_x_date(breaks = seq(1960, 2100, 2) %>% paste0("-01-01") %>% as.Date,
               labels = date_format("%Y")) +
  scale_y_log10(breaks = seq(0, 400, 5))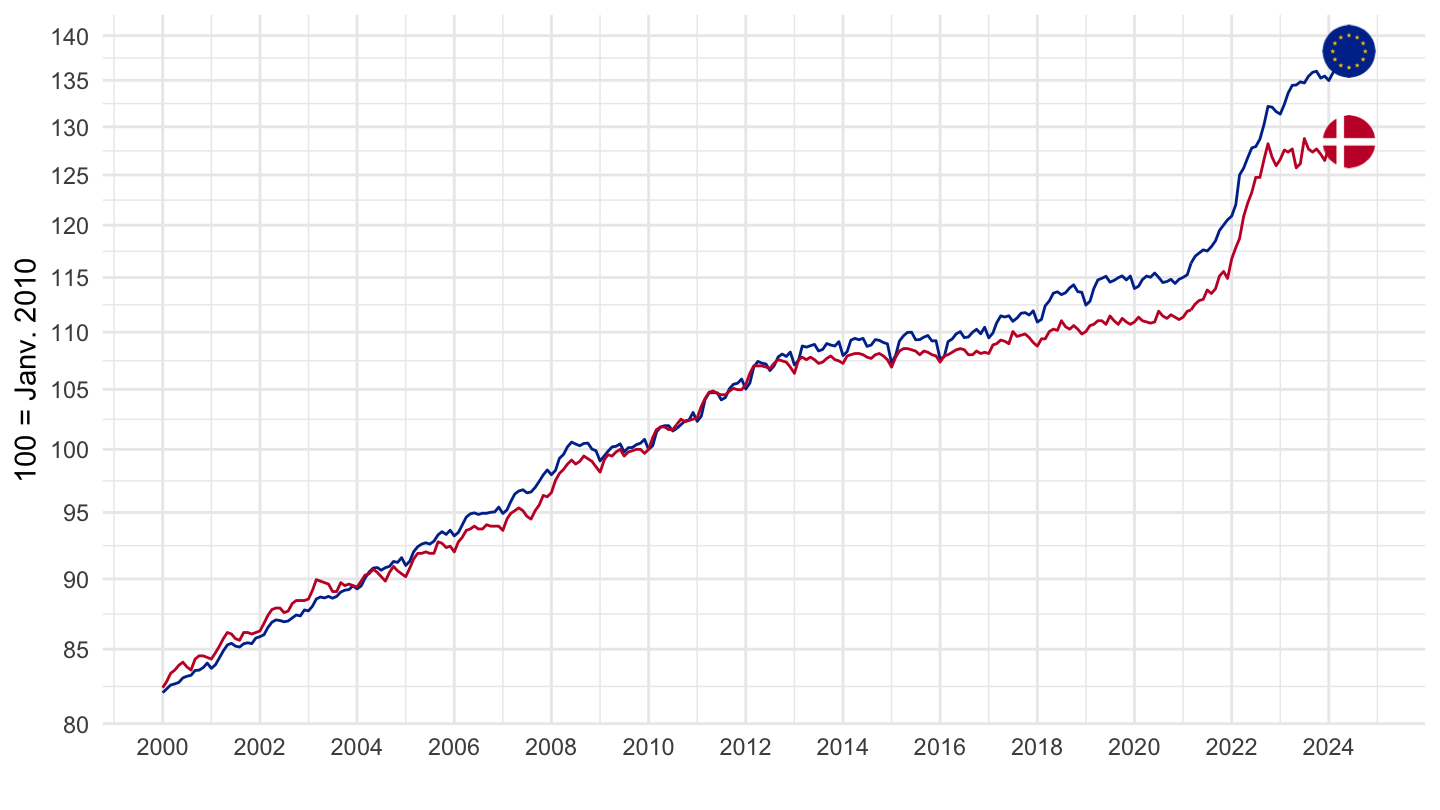
2010
Code
prc_hicp_midx %>%
  filter(unit == "I15",
         coicop == "CP00",
         geo %in% c("DK", "EA")) %>%
  month_to_date %>%
  filter(date >= as.Date("2010-01-01")) %>%
  group_by(geo) %>%
  mutate(values = 100*values/values[date == as.Date("2010-01-01")]) %>%

  mutate(Geo = ifelse(geo == "EA", "Europe", Geo)) %>%
  add_colors %>%
  ggplot(.) + geom_line(aes(x = date, y = values, color = color)) + add_flags +
  theme_minimal() + xlab("") + ylab("100 = Janv. 2010") + scale_color_identity() +
  scale_x_date(breaks = seq(1960, 2100, 2) %>% paste0("-01-01") %>% as.Date,
               labels = date_format("%Y")) +
  scale_y_log10(breaks = seq(0, 400, 5))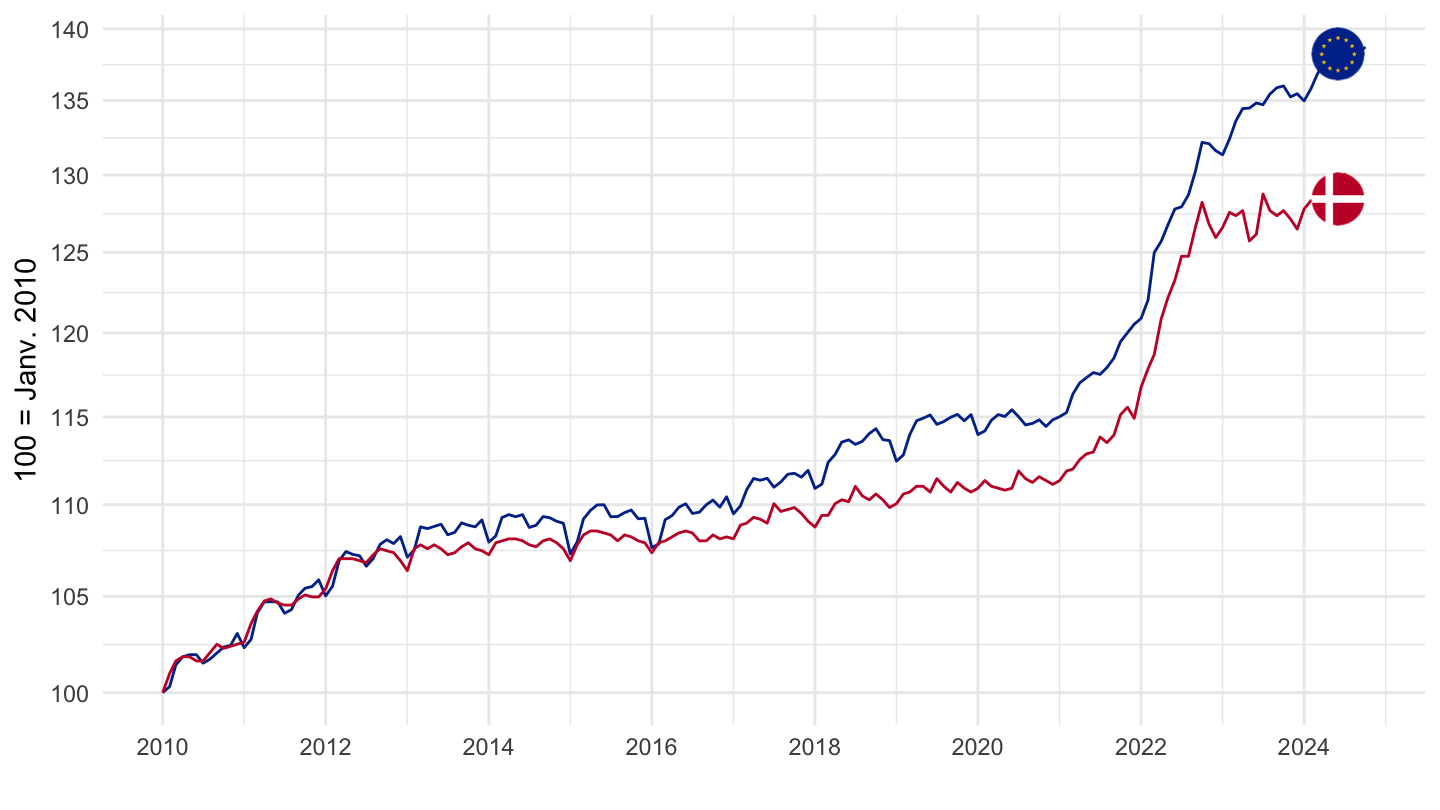
Hungary, Euro area
All
Code
prc_hicp_midx %>%
  filter(unit == "I15",
         coicop == "CP00",
         geo %in% c("HU", "EA")) %>%
  month_to_date %>%
  group_by(geo) %>%
  mutate(values = 100*values/values[date == as.Date("2010-01-01")]) %>%

  mutate(Geo = ifelse(geo == "EA", "Europe", Geo)) %>%
  add_colors %>%
  ggplot(.) + geom_line(aes(x = date, y = values, color = color)) + add_flags +
  theme_minimal() + xlab("") + ylab("100 = Janv. 2010") + scale_color_identity() +
  scale_x_date(breaks = seq(1960, 2100, 2) %>% paste0("-01-01") %>% as.Date,
               labels = date_format("%Y")) +
  scale_y_log10(breaks = seq(0, 400, 5))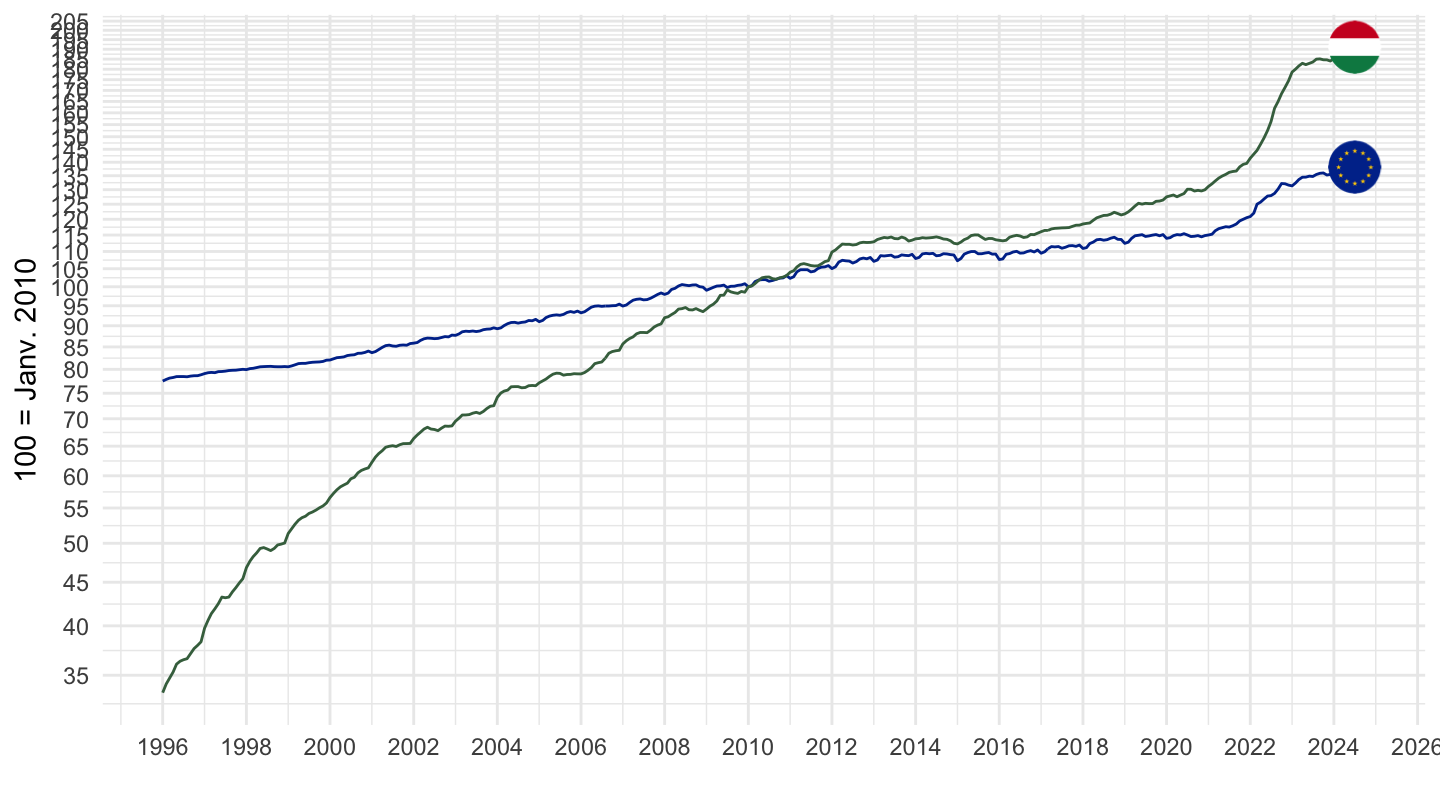
2000-
Code
prc_hicp_midx %>%
  filter(unit == "I15",
         coicop == "CP00",
         geo %in% c("HU", "EA")) %>%
  month_to_date %>%
  filter(date >= as.Date("2000-01-01")) %>%
  group_by(geo) %>%
  mutate(values = 100*values/values[date == as.Date("2010-01-01")]) %>%

  mutate(Geo = ifelse(geo == "EA", "Europe", Geo)) %>%
  add_colors %>%
  ggplot(.) + geom_line(aes(x = date, y = values, color = color)) + add_flags +
  theme_minimal() + xlab("") + ylab("100 = Janv. 2010") + scale_color_identity() +
  scale_x_date(breaks = seq(1960, 2100, 2) %>% paste0("-01-01") %>% as.Date,
               labels = date_format("%Y")) +
  scale_y_log10(breaks = seq(0, 400, 5))
2010
Code
prc_hicp_midx %>%
  filter(unit == "I15",
         coicop == "CP00",
         geo %in% c("HU", "EA")) %>%
  month_to_date %>%
  filter(date >= as.Date("2010-01-01")) %>%
  group_by(geo) %>%
  mutate(values = 100*values/values[date == as.Date("2010-01-01")]) %>%

  mutate(Geo = ifelse(geo == "EA", "Europe", Geo)) %>%
  add_colors %>%
  ggplot(.) + geom_line(aes(x = date, y = values, color = color)) + add_flags +
  theme_minimal() + xlab("") + ylab("100 = Janv. 2010") + scale_color_identity() +
  scale_x_date(breaks = seq(1960, 2100, 2) %>% paste0("-01-01") %>% as.Date,
               labels = date_format("%Y")) +
  scale_y_log10(breaks = seq(0, 400, 5))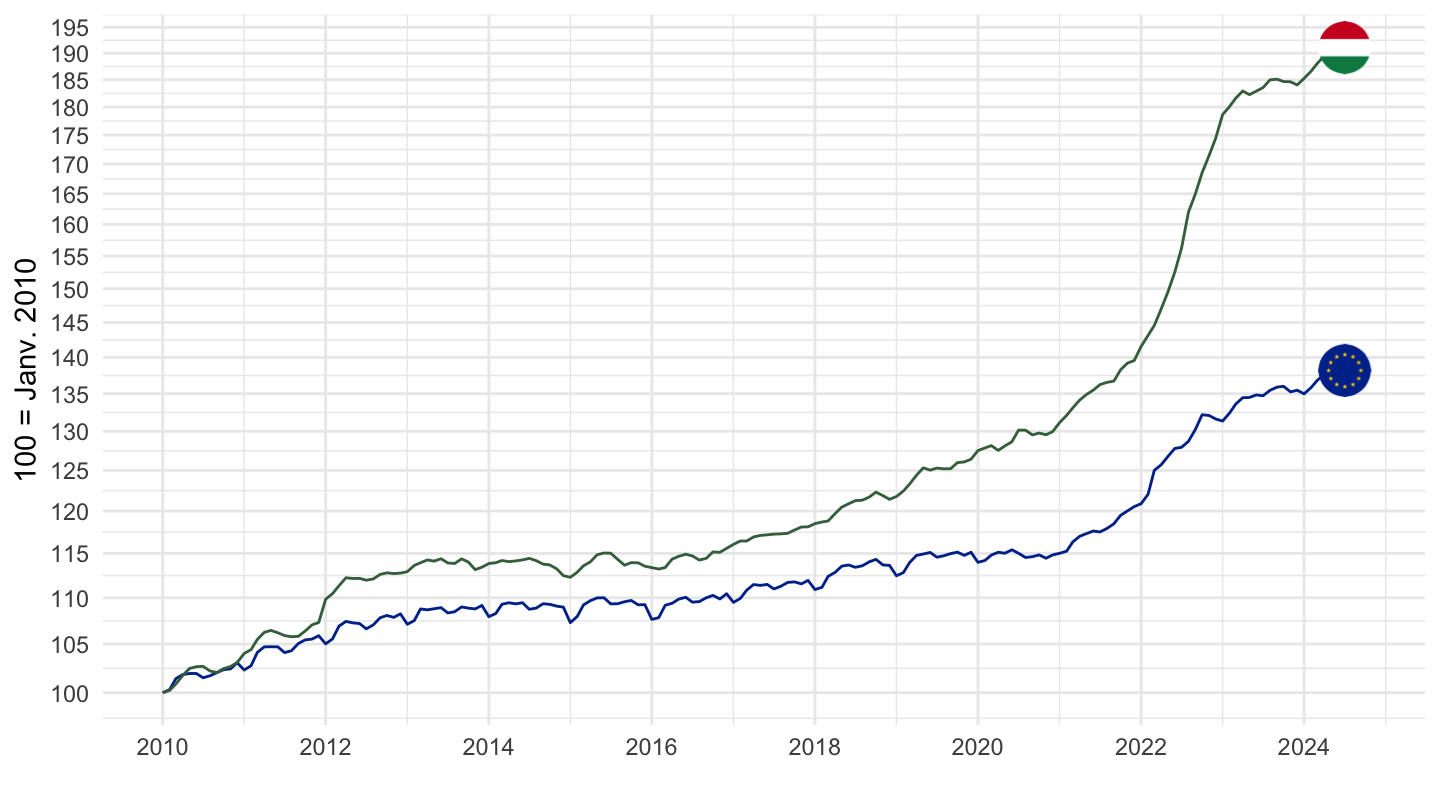
Poland, Euro area
All
Code
prc_hicp_midx %>%
  filter(unit == "I15",
         coicop == "CP00",
         geo %in% c("PL", "EA")) %>%
  month_to_date %>%
  group_by(geo) %>%
  mutate(values = 100*values/values[date == as.Date("2010-01-01")]) %>%

  mutate(Geo = ifelse(geo == "EA", "Europe", Geo)) %>%
  add_colors %>%
  ggplot(.) + geom_line(aes(x = date, y = values, color = color)) + add_flags +
  theme_minimal() + xlab("") + ylab("100 = Janv. 2010") + scale_color_identity() +
  scale_x_date(breaks = seq(1960, 2100, 2) %>% paste0("-01-01") %>% as.Date,
               labels = date_format("%Y")) +
  scale_y_log10(breaks = seq(0, 400, 5))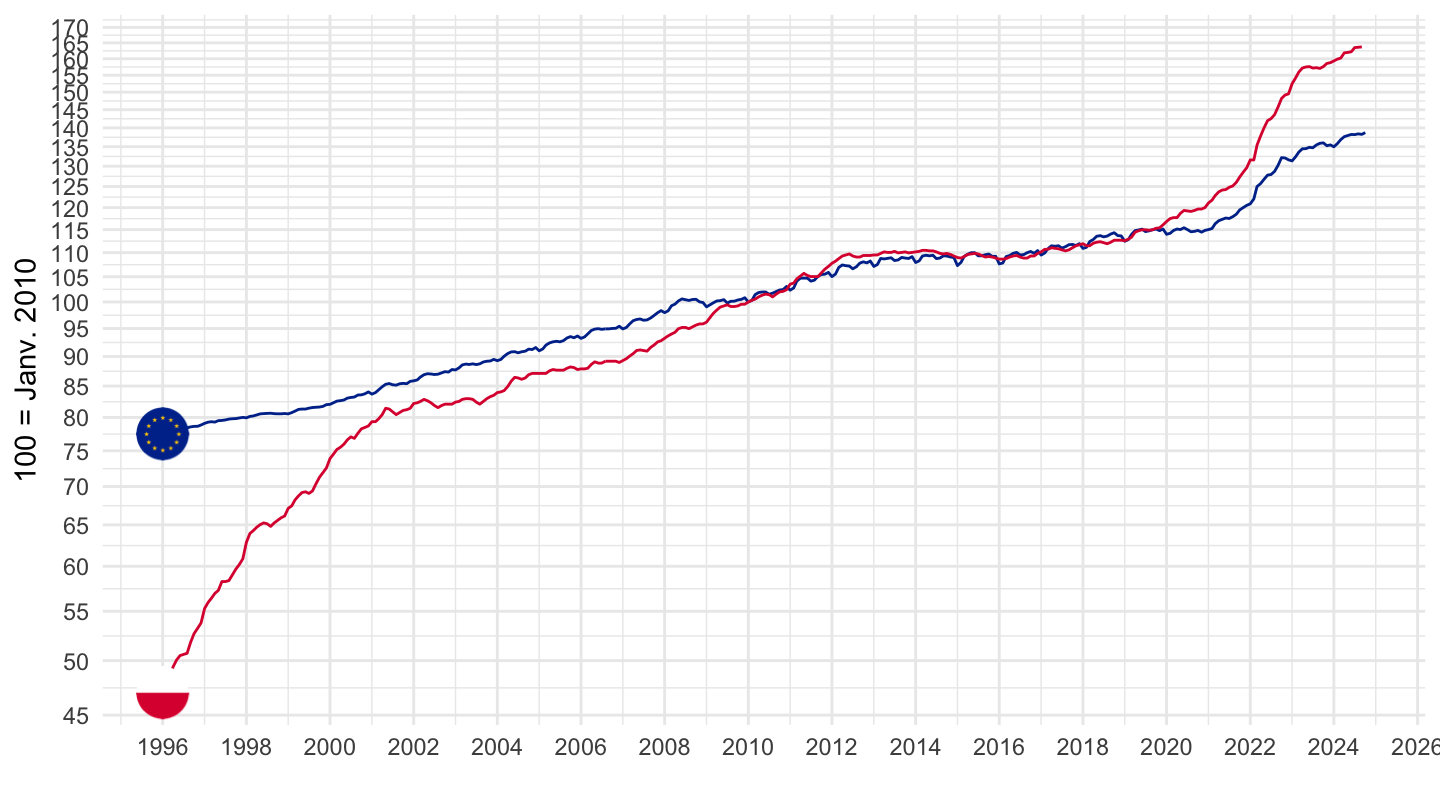
2000-
Code
prc_hicp_midx %>%
  filter(unit == "I15",
         coicop == "CP00",
         geo %in% c("PL", "EA")) %>%
  month_to_date %>%
  filter(date >= as.Date("2000-01-01")) %>%
  group_by(geo) %>%
  mutate(values = 100*values/values[date == as.Date("2010-01-01")]) %>%

  mutate(Geo = ifelse(geo == "EA", "Europe", Geo)) %>%
  add_colors %>%
  ggplot(.) + geom_line(aes(x = date, y = values, color = color)) + add_flags +
  theme_minimal() + xlab("") + ylab("100 = Janv. 2010") + scale_color_identity() +
  scale_x_date(breaks = seq(1960, 2100, 2) %>% paste0("-01-01") %>% as.Date,
               labels = date_format("%Y")) +
  scale_y_log10(breaks = seq(0, 400, 5))
2010
Code
prc_hicp_midx %>%
  filter(unit == "I15",
         coicop == "CP00",
         geo %in% c("PL", "EA")) %>%
  month_to_date %>%
  filter(date >= as.Date("2010-01-01")) %>%
  group_by(geo) %>%
  mutate(values = 100*values/values[date == as.Date("2010-01-01")]) %>%

  mutate(Geo = ifelse(geo == "EA", "Europe", Geo)) %>%
  add_colors %>%
  ggplot(.) + geom_line(aes(x = date, y = values, color = color)) + add_flags +
  theme_minimal() + xlab("") + ylab("100 = Janv. 2010") + scale_color_identity() +
  scale_x_date(breaks = seq(1960, 2100, 2) %>% paste0("-01-01") %>% as.Date,
               labels = date_format("%Y")) +
  scale_y_log10(breaks = seq(0, 400, 5))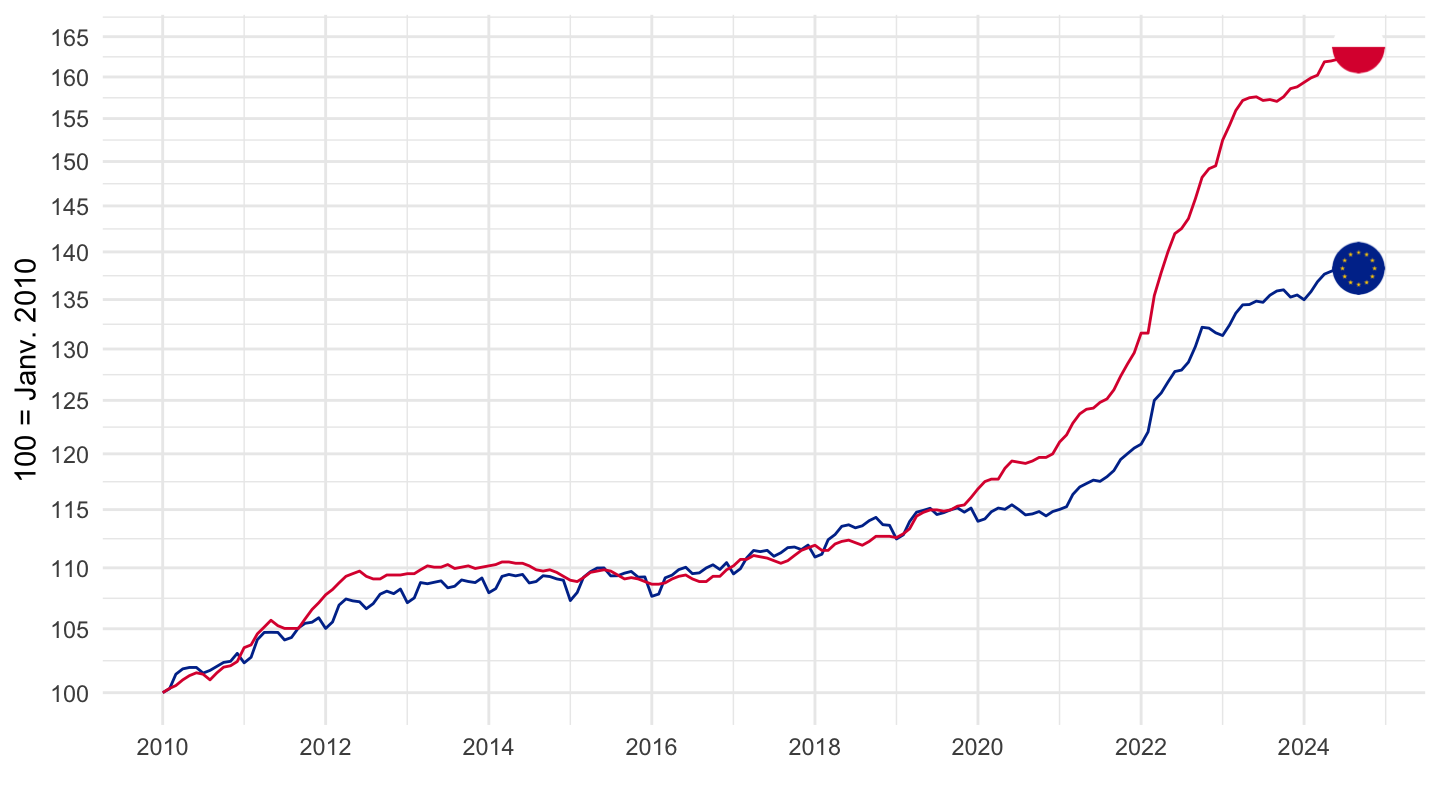
Romania, Euro area
All
Code
prc_hicp_midx %>%
  filter(unit == "I15",
         coicop == "CP00",
         geo %in% c("RO", "EA")) %>%
  month_to_date %>%
  group_by(geo) %>%
  mutate(values = 100*values/values[date == as.Date("2010-01-01")]) %>%

  mutate(Geo = ifelse(geo == "EA", "Europe", Geo)) %>%
  add_colors %>%
  ggplot(.) + geom_line(aes(x = date, y = values, color = color)) + add_flags +
  theme_minimal() + xlab("") + ylab("100 = Janv. 2010") + scale_color_identity() +
  scale_x_date(breaks = seq(1960, 2100, 2) %>% paste0("-01-01") %>% as.Date,
               labels = date_format("%Y")) +
  scale_y_log10(breaks = seq(0, 400, 5))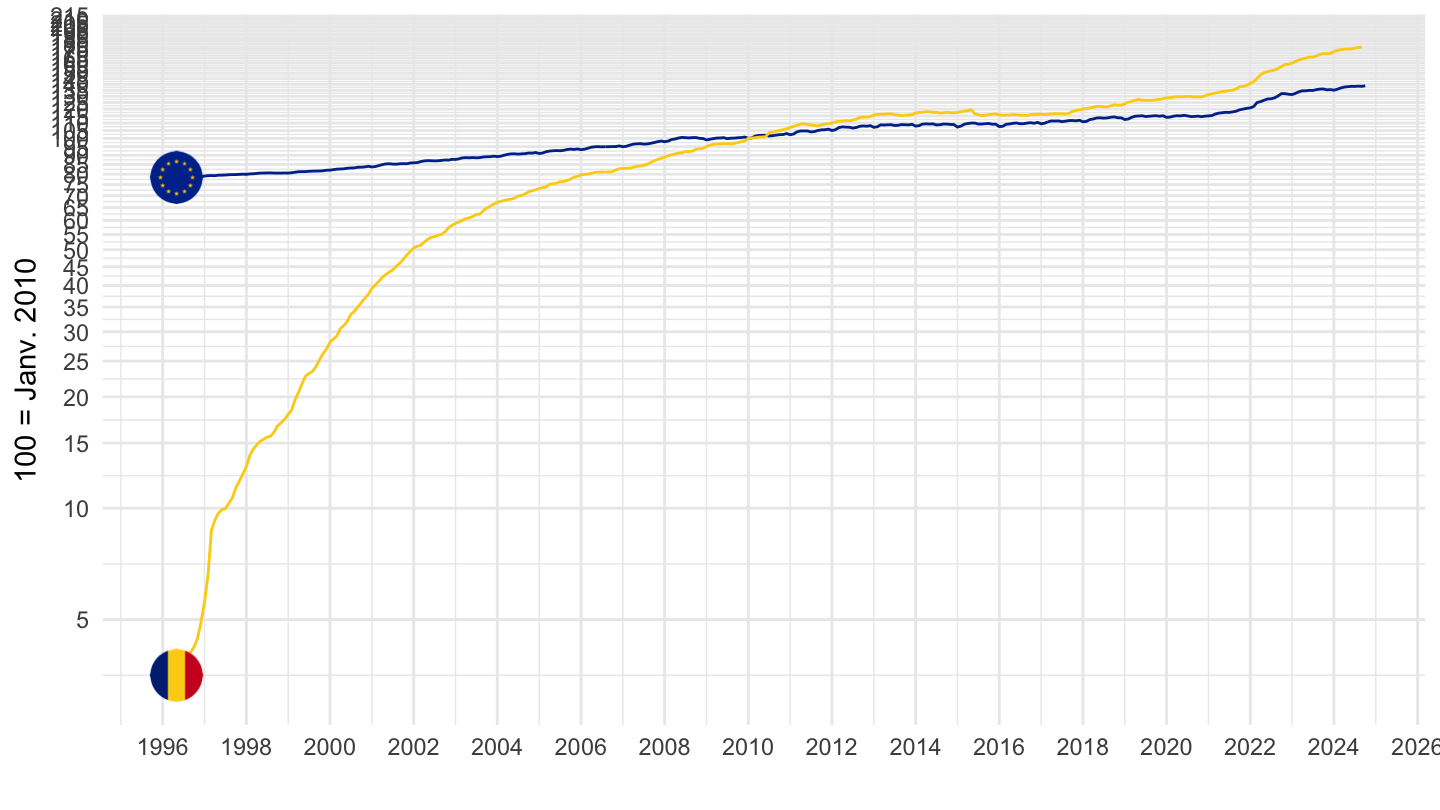
2000-
Code
prc_hicp_midx %>%
  filter(unit == "I15",
         coicop == "CP00",
         geo %in% c("RO", "EA")) %>%
  month_to_date %>%
  filter(date >= as.Date("2000-01-01")) %>%
  group_by(geo) %>%
  mutate(values = 100*values/values[date == as.Date("2010-01-01")]) %>%

  mutate(Geo = ifelse(geo == "EA", "Europe", Geo)) %>%
  add_colors %>%
  ggplot(.) + geom_line(aes(x = date, y = values, color = color)) + add_flags +
  theme_minimal() + xlab("") + ylab("100 = Janv. 2010") + scale_color_identity() +
  scale_x_date(breaks = seq(1960, 2100, 2) %>% paste0("-01-01") %>% as.Date,
               labels = date_format("%Y")) +
  scale_y_log10(breaks = seq(0, 400, 5))
2010
Code
prc_hicp_midx %>%
filter(unit == "I15",
coicop == "CP00",
geo %in% c("RO", "EA")) %>%
month_to_date %>%
filter(date >= as.Date("2010-01-01")) %>%
group_by(geo) %>%
mutate(values = 100*values/values[date == as.Date("2010-01-01")]) %>%
mutate(Geo = ifelse(geo == "EA", "Europe", Geo)) %>%
add_colors %>%
ggplot(.) + geom_line(aes(x = date, y = values, color = color)) + add_flags +
theme_minimal() + xlab("") + ylab("100 = Janv. 2010") + scale_color_identity() +
scale_x_date(breaks = seq(1960, 2100, 2) %>% paste0("-01-01") %>% as.Date,
labels = date_format("%Y")) +
scale_y_log10(breaks = seq(0, 400, 5))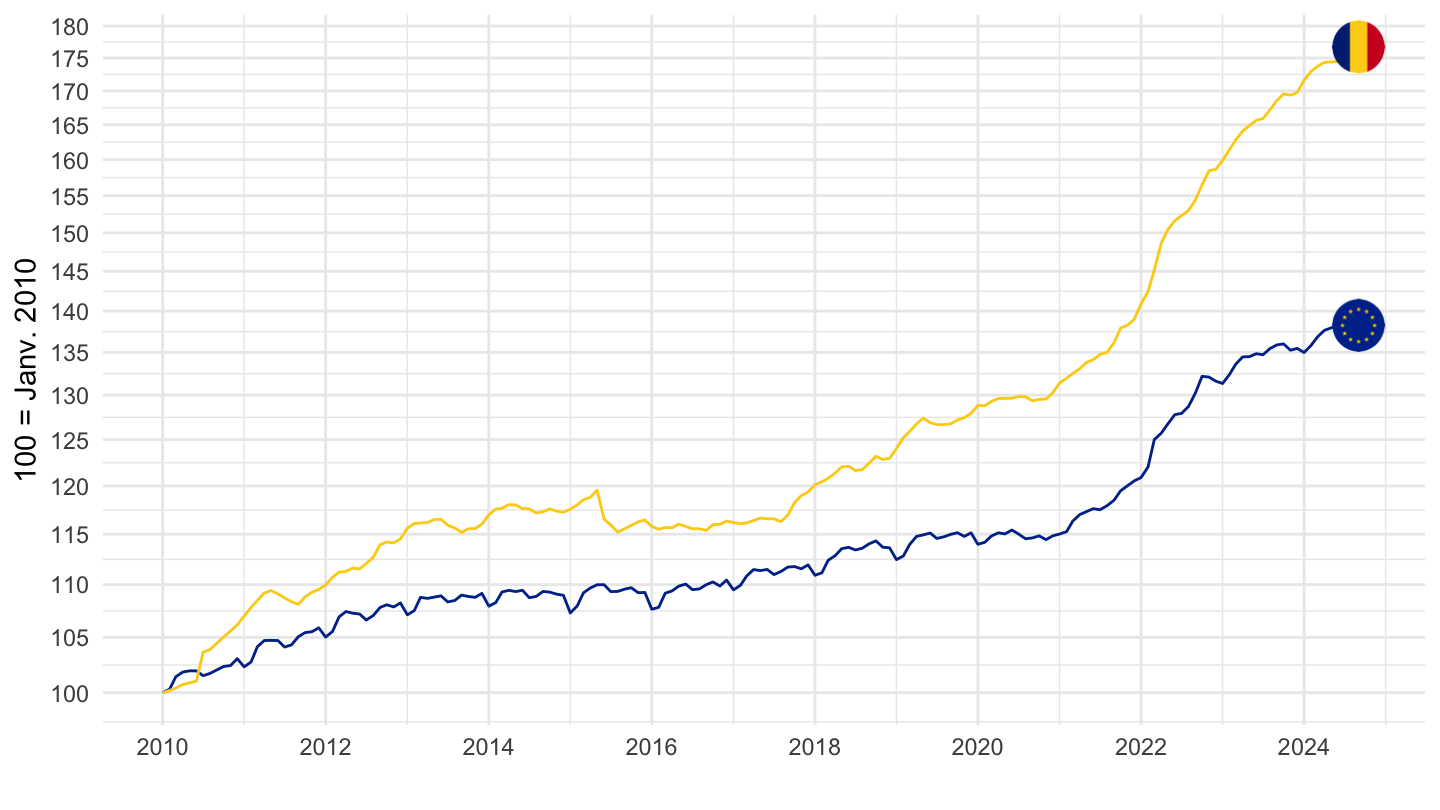
Sweden, Euro area
All
Code
prc_hicp_midx %>%
filter(unit == "I15",
coicop == "CP00",
geo %in% c("SE", "EA")) %>%
month_to_date %>%
group_by(geo) %>%
mutate(values = 100*values/values[date == as.Date("2010-01-01")]) %>%
mutate(Geo = ifelse(geo == "EA", "Europe", Geo)) %>%
add_colors %>%
ggplot(.) + geom_line(aes(x = date, y = values, color = color)) + add_flags +
theme_minimal() + xlab("") + ylab("100 = Janv. 2010") + scale_color_identity() +
scale_x_date(breaks = seq(1960, 2100, 2) %>% paste0("-01-01") %>% as.Date,
labels = date_format("%Y")) +
scale_y_log10(breaks = seq(0, 400, 5))
2000-
Code
prc_hicp_midx %>%
filter(unit == "I15",
coicop == "CP00",
geo %in% c("SE", "EA")) %>%
month_to_date %>%
filter(date >= as.Date("2000-01-01")) %>%
group_by(geo) %>%
mutate(values = 100*values/values[date == as.Date("2010-01-01")]) %>%
mutate(Geo = ifelse(geo == "EA", "Europe", Geo)) %>%
add_colors %>%
ggplot(.) + geom_line(aes(x = date, y = values, color = color)) + add_flags +
theme_minimal() + xlab("") + ylab("100 = Janv. 2010") + scale_color_identity() +
scale_x_date(breaks = seq(1960, 2100, 2) %>% paste0("-01-01") %>% as.Date,
labels = date_format("%Y")) +
scale_y_log10(breaks = seq(0, 400, 5))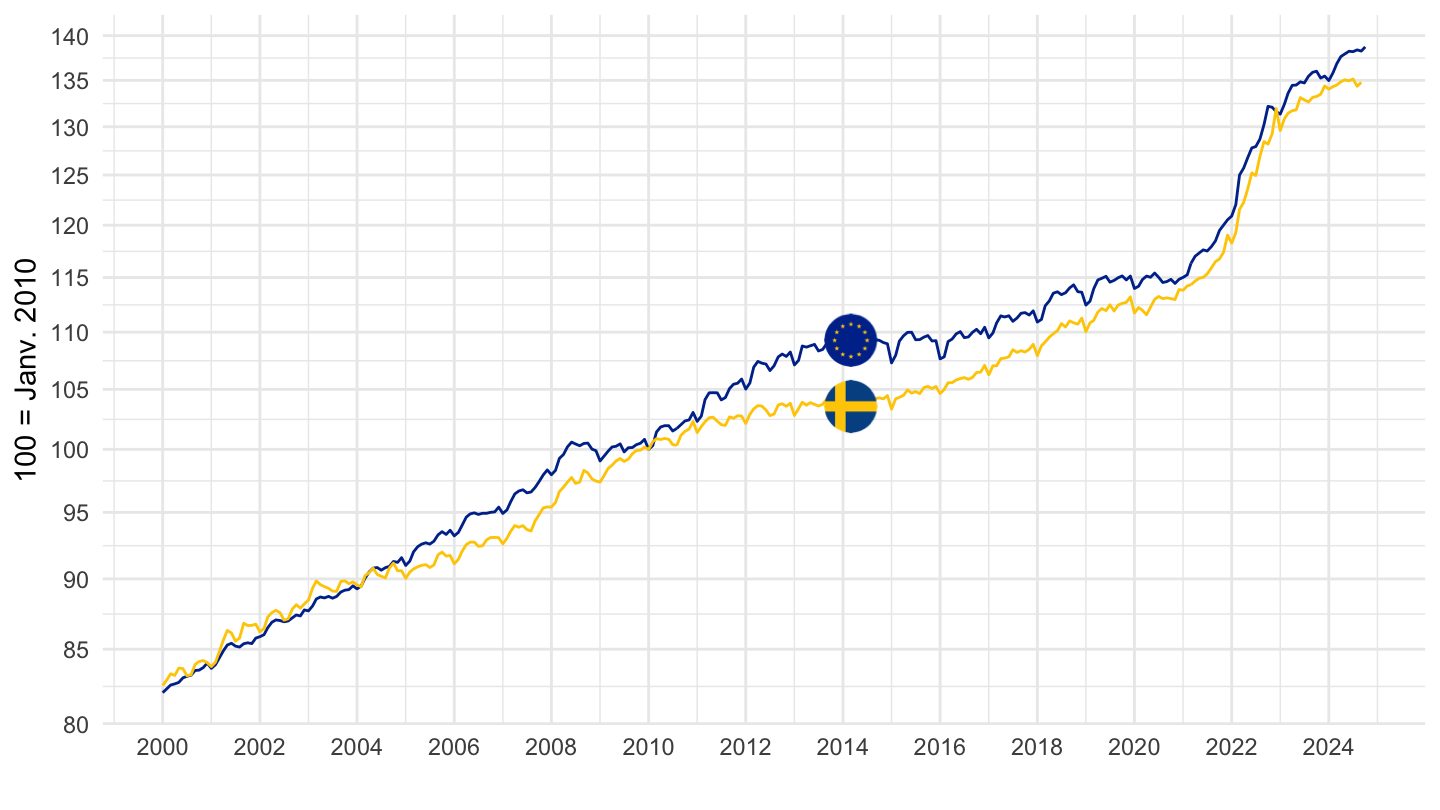
2010
Code
prc_hicp_midx %>%
filter(unit == "I15",
coicop == "CP00",
geo %in% c("SE", "EA")) %>%
month_to_date %>%
filter(date >= as.Date("2010-01-01")) %>%
group_by(geo) %>%
mutate(values = 100*values/values[date == as.Date("2010-01-01")]) %>%
mutate(Geo = ifelse(geo == "EA", "Europe", Geo)) %>%
add_colors %>%
ggplot(.) + geom_line(aes(x = date, y = values, color = color)) + add_flags +
theme_minimal() + xlab("") + ylab("100 = Janv. 2010") + scale_color_identity() +
scale_x_date(breaks = seq(1960, 2100, 2) %>% paste0("-01-01") %>% as.Date,
labels = date_format("%Y")) +
scale_y_log10(breaks = seq(0, 400, 5))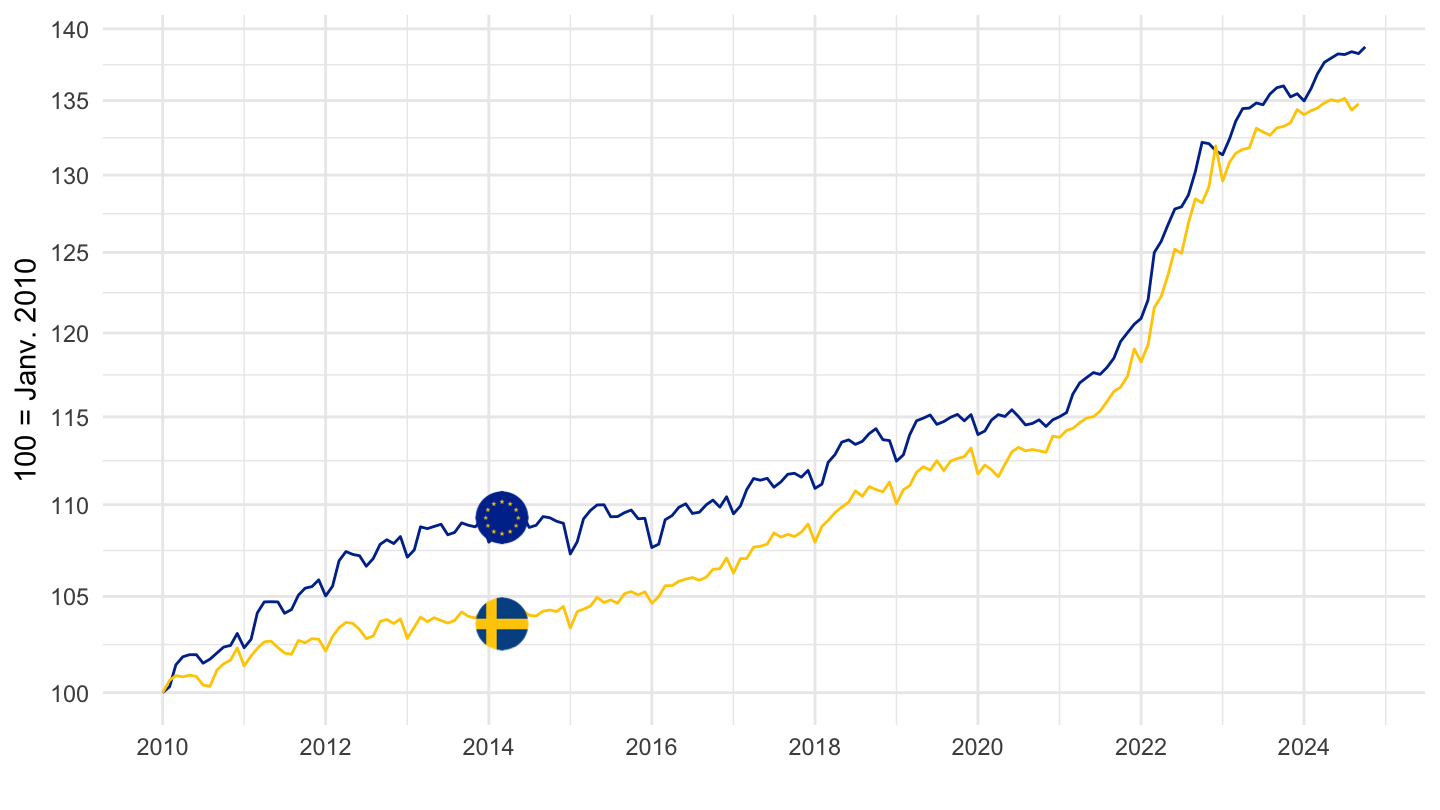
United Kingdom, Euro area
All
Code
prc_hicp_midx %>%
filter(unit == "I15",
coicop == "CP00",
geo %in% c("UK", "EA")) %>%
month_to_date %>%
group_by(geo) %>%
mutate(values = 100*values/values[date == as.Date("2010-01-01")]) %>%
mutate(Geo = ifelse(geo == "EA", "Europe", Geo)) %>%
add_colors %>%
ggplot(.) + geom_line(aes(x = date, y = values, color = color)) + add_flags +
theme_minimal() + xlab("") + ylab("100 = Janv. 2010") + scale_color_identity() +
scale_x_date(breaks = seq(1960, 2100, 2) %>% paste0("-01-01") %>% as.Date,
labels = date_format("%Y")) +
scale_y_log10(breaks = seq(0, 400, 5))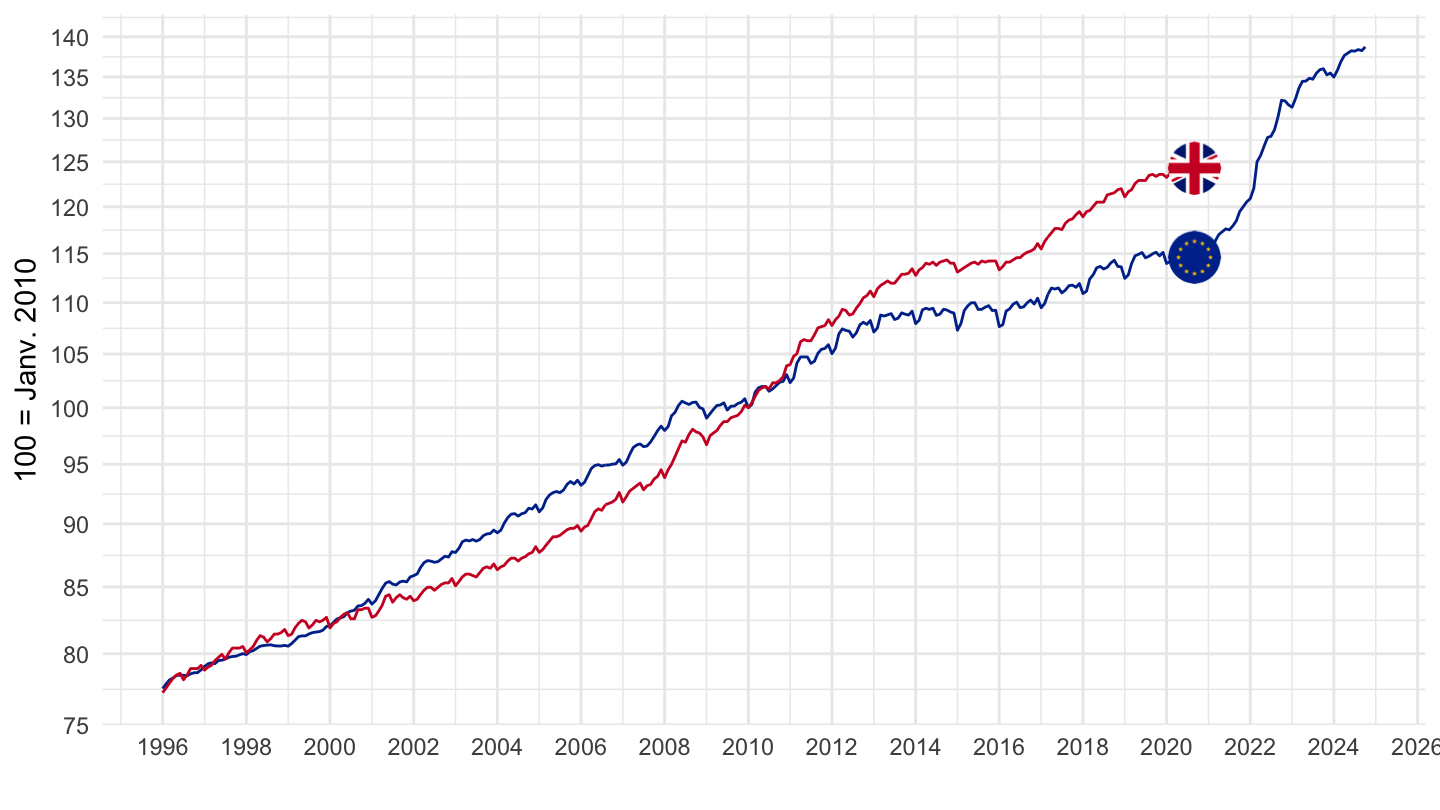
2000-
Code
prc_hicp_midx %>%
filter(unit == "I15",
coicop == "CP00",
geo %in% c("UK", "EA")) %>%
month_to_date %>%
filter(date >= as.Date("2000-01-01")) %>%
group_by(geo) %>%
mutate(values = 100*values/values[date == as.Date("2010-01-01")]) %>%
mutate(Geo = ifelse(geo == "EA", "Europe", Geo)) %>%
add_colors %>%
ggplot(.) + geom_line(aes(x = date, y = values, color = color)) + add_flags +
theme_minimal() + xlab("") + ylab("100 = Janv. 2010") + scale_color_identity() +
scale_x_date(breaks = seq(1960, 2100, 2) %>% paste0("-01-01") %>% as.Date,
labels = date_format("%Y")) +
scale_y_log10(breaks = seq(0, 400, 5))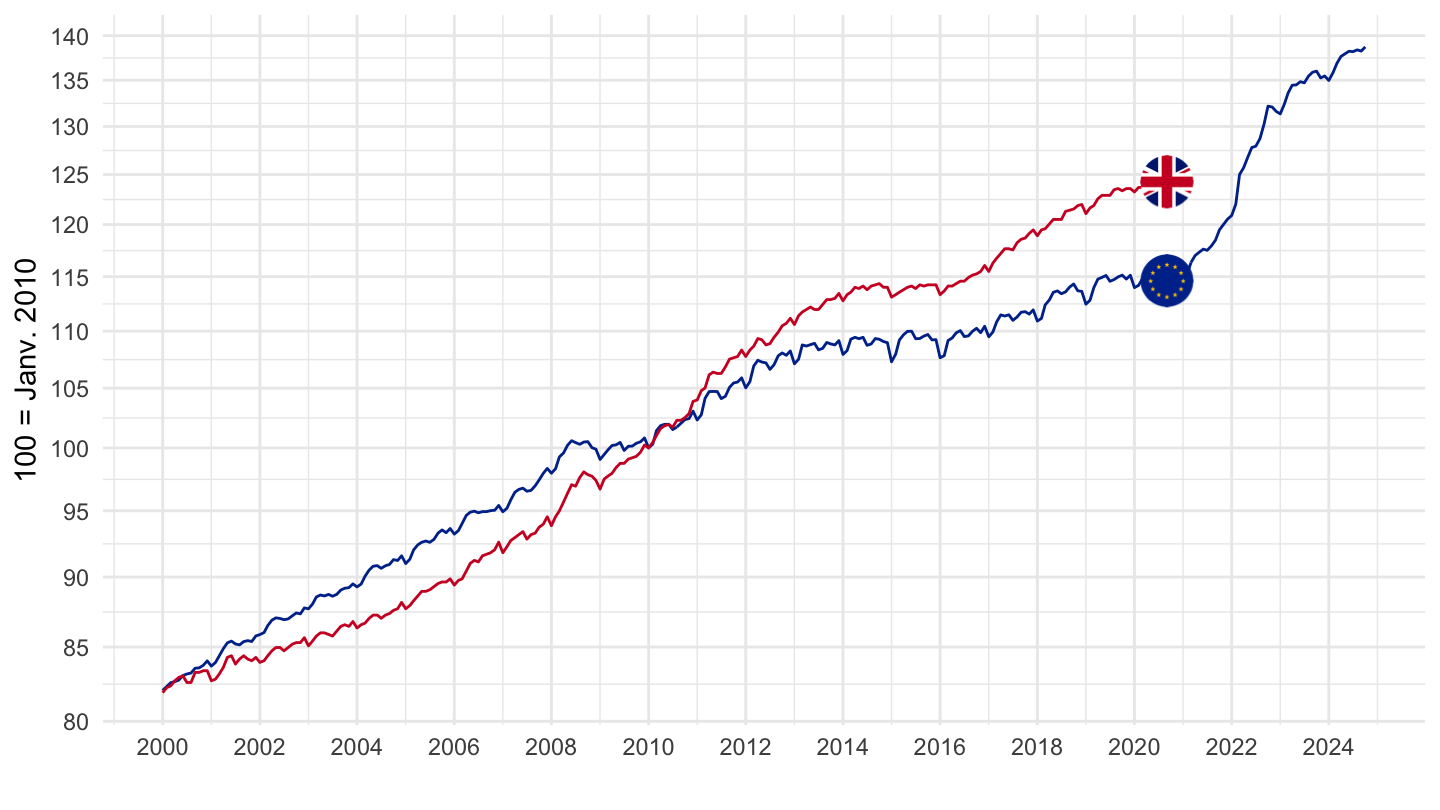
2010
Code
prc_hicp_midx %>%
filter(unit == "I15",
coicop == "CP00",
geo %in% c("UK", "EA")) %>%
month_to_date %>%
filter(date >= as.Date("2010-01-01")) %>%
group_by(geo) %>%
mutate(values = 100*values/values[date == as.Date("2010-01-01")]) %>%
mutate(Geo = ifelse(geo == "EA", "Europe", Geo)) %>%
ggplot(.) + geom_line(aes(x = date, y = values, color = Geo)) +
theme_minimal() + xlab("") + ylab("100 = Janv. 2010") +
scale_x_date(breaks = seq(1960, 2100, 2) %>% paste0("-01-01") %>% as.Date,
labels = date_format("%Y")) + add_flags +
scale_y_log10(breaks = seq(0, 200, 5)) +
scale_color_manual(values = c("#003399", "#CF142B")) +
theme(legend.position = "none",
legend.title = element_blank())
Housing VS Non-Housing
Table
Javascript
Code
prc_hicp_midx %>%
filter(unit == "I15",
coicop %in% c("CP041", "CP00"),
time %in% c("2011M01", "2013M12")) %>%
select(geo, Geo, time, coicop, values) %>%
spread(coicop, values) %>%
mutate(`CP041/CP00` = 100*CP041/CP00) %>%
gather(coicop, values, -time, -geo, -Geo) %>%
left_join(tibble(coicop = c("CP041/CP00", "CP041", "CP00"),
Coicop = c("Rents (real)",
"Rents",
"HICP")), by = "coicop") %>%
group_by(Coicop, geo, Geo) %>%
arrange(time) %>%
summarise(growth = round(100*(values[2]/values[1]-1), 2)) %>%
select(geo, Geo, Coicop, growth) %>%
spread(Coicop, growth) %>%
arrange(`Rents (real)`) %>%
mutate(Geo = ifelse(geo == "DE", "Germany", Geo)) %>%
mutate(Flag = gsub(" ", "-", str_to_lower(Geo)),
Flag = paste0('<img src="../../bib/flags/vsmall/', Flag, '.png" alt="Flag">')) %>%
select(Flag, everything()) %>%
{if (is_html_output()) datatable(., filter = 'top', rownames = F, escape = F) else .}png
Code
i_g("bib/eurostat/prc_hicp_midx_ex2.png")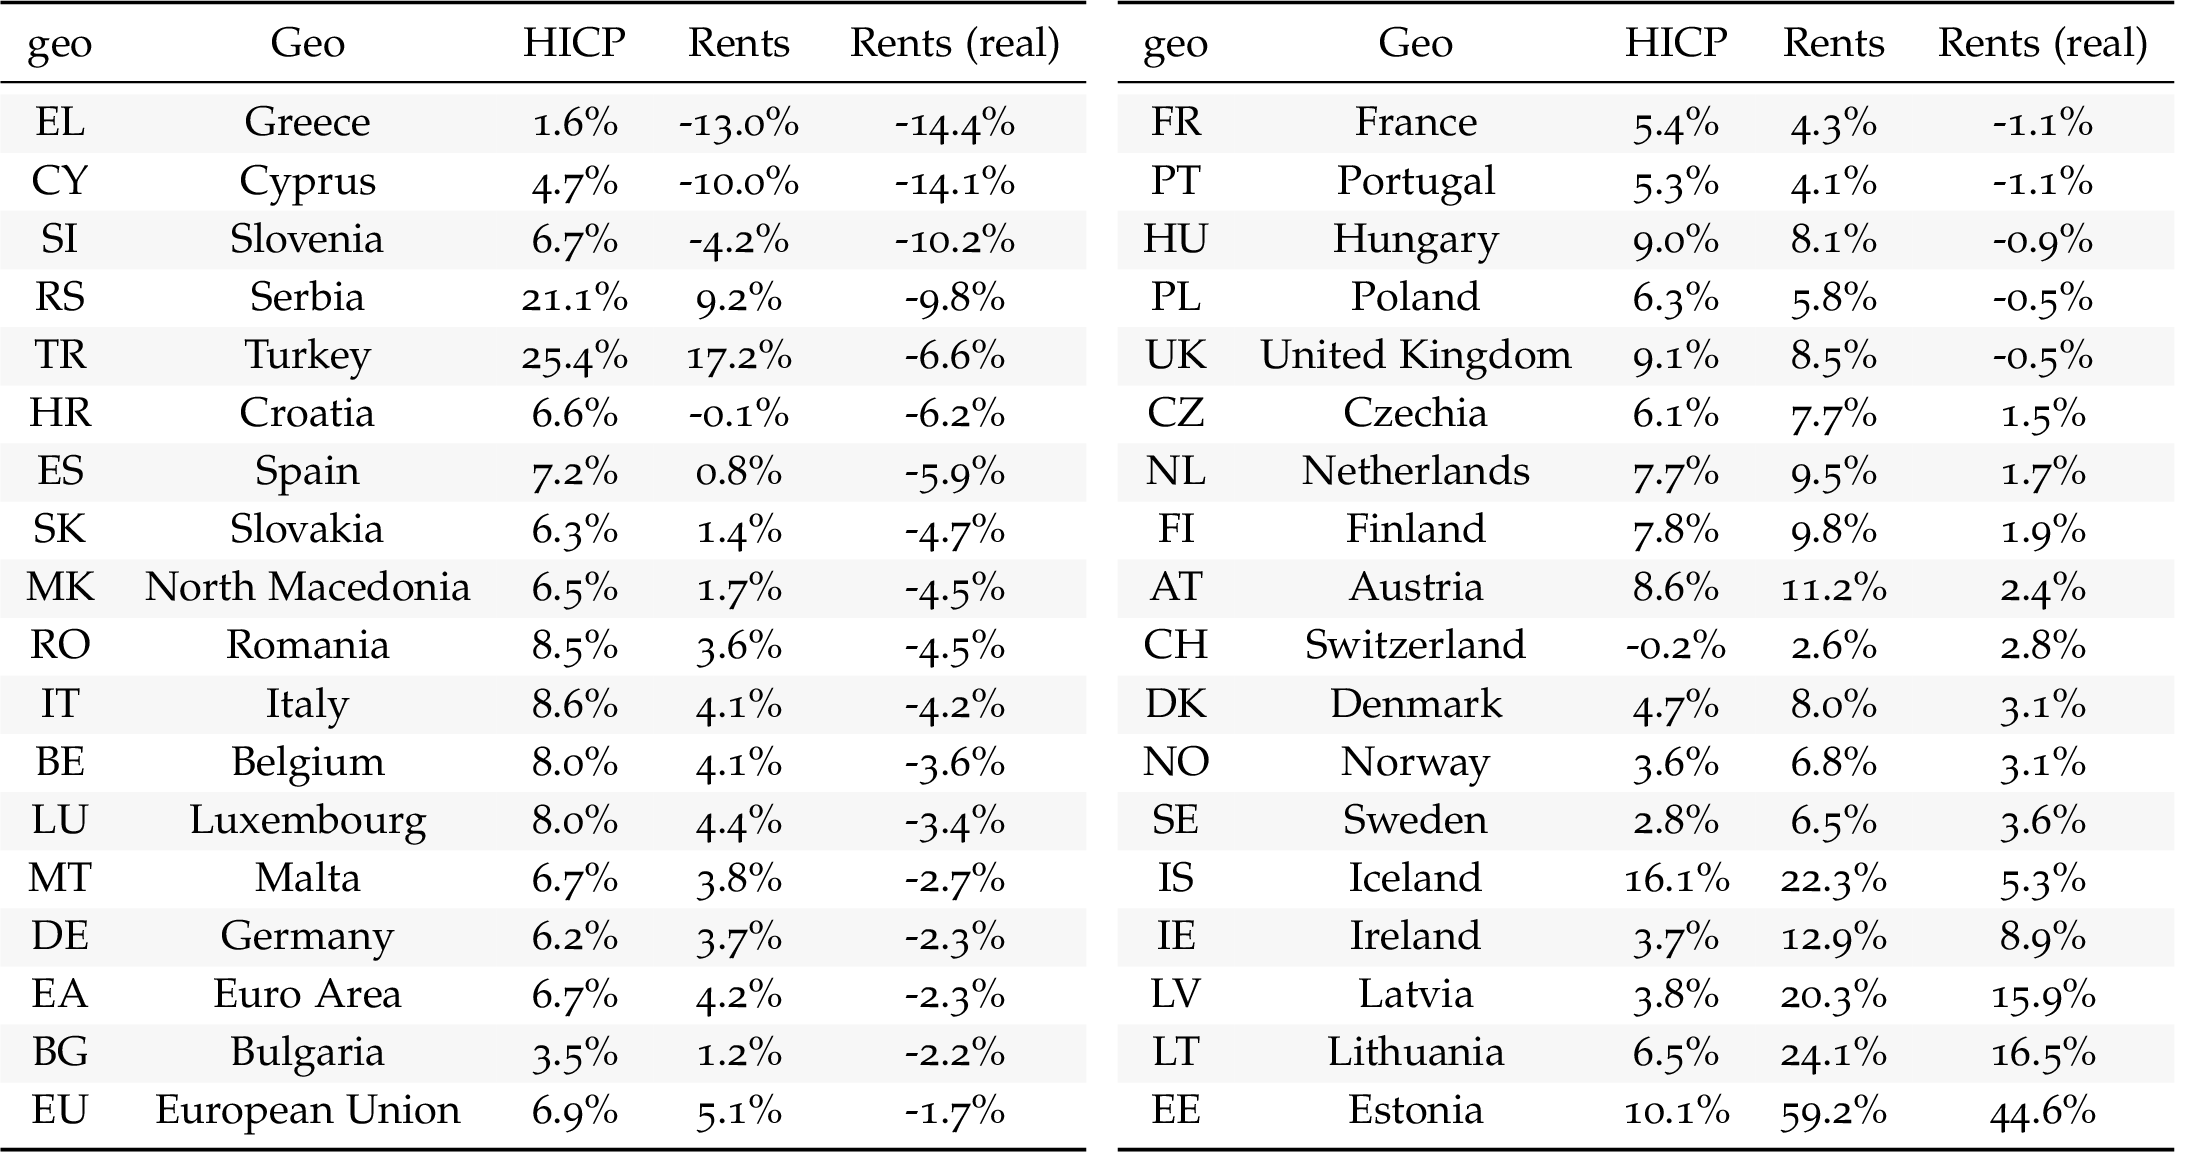
Greece
Code
prc_hicp_midx %>%
filter(unit == "I15",
coicop %in% c("CP00", "CP041"),
geo %in% c("EL")) %>%
month_to_date %>%
select(date, coicop, values) %>%
spread(coicop, values) %>%
mutate(`CP041/CP00` = 100*CP041/CP00) %>%
gather(coicop, values, -date) %>%
left_join(tibble(coicop = c("CP041/CP00", "CP041", "CP00"),
Coicop = c("Rentals (relative to HICP)",
"Rentals",
"HICP")), by = "coicop") %>%
ggplot(.) + geom_line(aes(x = date, y = values, color = Coicop)) +
theme_minimal() + xlab("") + ylab("") +
scale_x_date(breaks = seq(1960, 2100, 5) %>% paste0("-01-01") %>% as.Date,
labels = date_format("%Y")) +
scale_y_log10(breaks = seq(0, 200, 5)) +
scale_color_manual(values = viridis(4)[1:3]) +
theme(legend.position = c(0.7, 0.2),
legend.title = element_blank())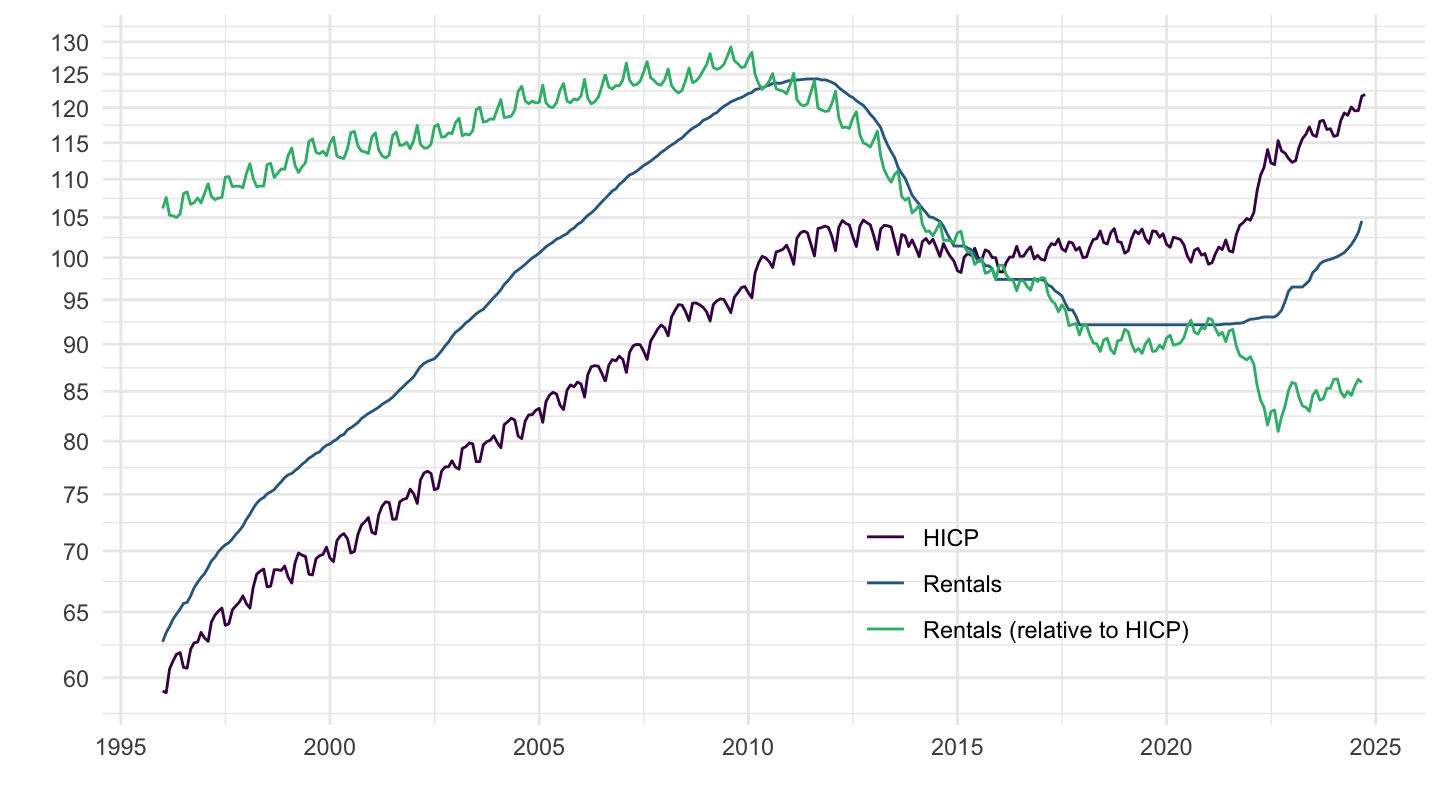
Cyprus
Code
prc_hicp_midx %>%
filter(unit == "I15",
coicop %in% c("CP00", "CP041"),
geo %in% c("CY")) %>%
month_to_date %>%
select(date, coicop, values) %>%
spread(coicop, values) %>%
mutate(`CP041/CP00` = 100*CP041/CP00) %>%
gather(coicop, values, -date) %>%
left_join(tibble(coicop = c("CP041/CP00", "CP041", "CP00"),
Coicop = c("Rentals (relative to HICP)",
"Rentals",
"HICP")), by = "coicop") %>%
ggplot(.) + geom_line(aes(x = date, y = values, color = Coicop)) +
theme_minimal() + xlab("") + ylab("") +
scale_x_date(breaks = seq(1960, 2100, 5) %>% paste0("-01-01") %>% as.Date,
labels = date_format("%Y")) +
scale_y_log10(breaks = seq(0, 200, 5)) +
scale_color_manual(values = viridis(4)[1:3]) +
theme(legend.position = c(0.7, 0.2),
legend.title = element_blank())
Slovenia
Code
prc_hicp_midx %>%
filter(unit == "I15",
coicop %in% c("CP00", "CP041"),
geo %in% c("SI")) %>%
month_to_date %>%
select(date, coicop, values) %>%
spread(coicop, values) %>%
mutate(`CP041/CP00` = 100*CP041/CP00) %>%
gather(coicop, values, -date) %>%
left_join(tibble(coicop = c("CP041/CP00", "CP041", "CP00"),
Coicop = c("Rentals (relative to HICP)",
"Rentals",
"HICP")), by = "coicop") %>%
ggplot(.) + geom_line(aes(x = date, y = values, color = Coicop)) +
theme_minimal() + xlab("") + ylab("") +
scale_x_date(breaks = seq(1960, 2100, 5) %>% paste0("-01-01") %>% as.Date,
labels = date_format("%Y")) +
scale_y_log10(breaks = seq(0, 200, 5)) +
scale_color_manual(values = viridis(4)[1:3]) +
theme(legend.position = c(0.7, 0.2),
legend.title = element_blank())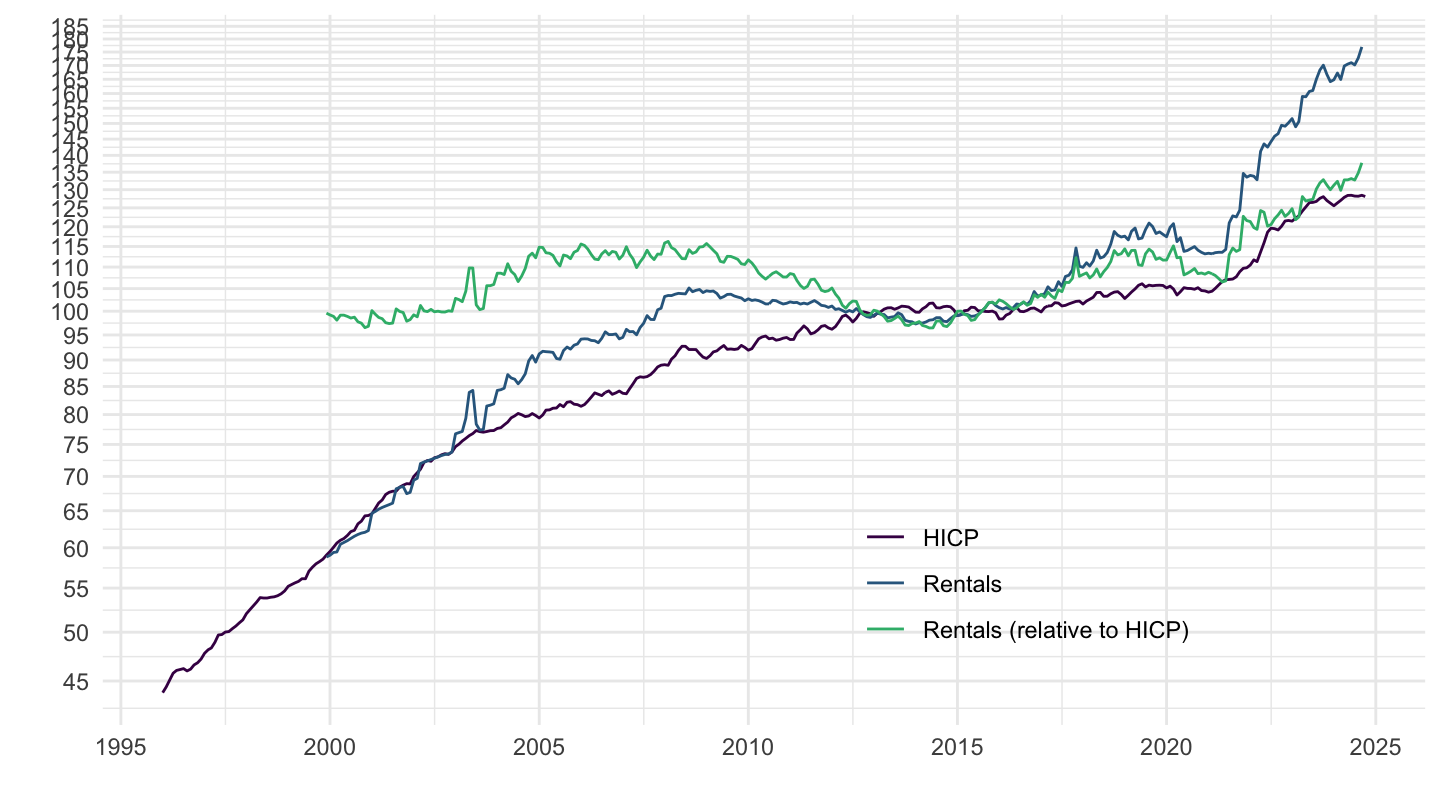
Serbia
Code
prc_hicp_midx %>%
filter(unit == "I15",
coicop %in% c("CP00", "CP041"),
geo %in% c("RS")) %>%
month_to_date %>%
select(date, coicop, values) %>%
spread(coicop, values) %>%
mutate(`CP041/CP00` = 100*CP041/CP00) %>%
gather(coicop, values, -date) %>%
left_join(tibble(coicop = c("CP041/CP00", "CP041", "CP00"),
Coicop = c("Rentals (relative to HICP)",
"Rentals",
"HICP")), by = "coicop") %>%
ggplot(.) + geom_line(aes(x = date, y = values, color = Coicop)) +
theme_minimal() + xlab("") + ylab("") +
scale_x_date(breaks = seq(1960, 2100, 5) %>% paste0("-01-01") %>% as.Date,
labels = date_format("%Y")) +
scale_y_log10(breaks = seq(0, 200, 5)) +
scale_color_manual(values = viridis(4)[1:3]) +
theme(legend.position = c(0.7, 0.2),
legend.title = element_blank())
Turkey
Code
prc_hicp_midx %>%
filter(unit == "I15",
coicop %in% c("CP00", "CP041"),
geo %in% c("TR")) %>%
month_to_date %>%
select(date, coicop, values) %>%
spread(coicop, values) %>%
mutate(`CP041/CP00` = 100*CP041/CP00) %>%
gather(coicop, values, -date) %>%
left_join(tibble(coicop = c("CP041/CP00", "CP041", "CP00"),
Coicop = c("Rentals (relative to HICP)",
"Rentals",
"HICP")), by = "coicop") %>%
ggplot(.) + geom_line(aes(x = date, y = values, color = Coicop)) +
theme_minimal() + xlab("") + ylab("") +
scale_x_date(breaks = seq(1960, 2100, 5) %>% paste0("-01-01") %>% as.Date,
labels = date_format("%Y")) +
scale_y_log10(breaks = seq(0, 200, 5)) +
scale_color_manual(values = viridis(4)[1:3]) +
theme(legend.position = c(0.7, 0.2),
legend.title = element_blank())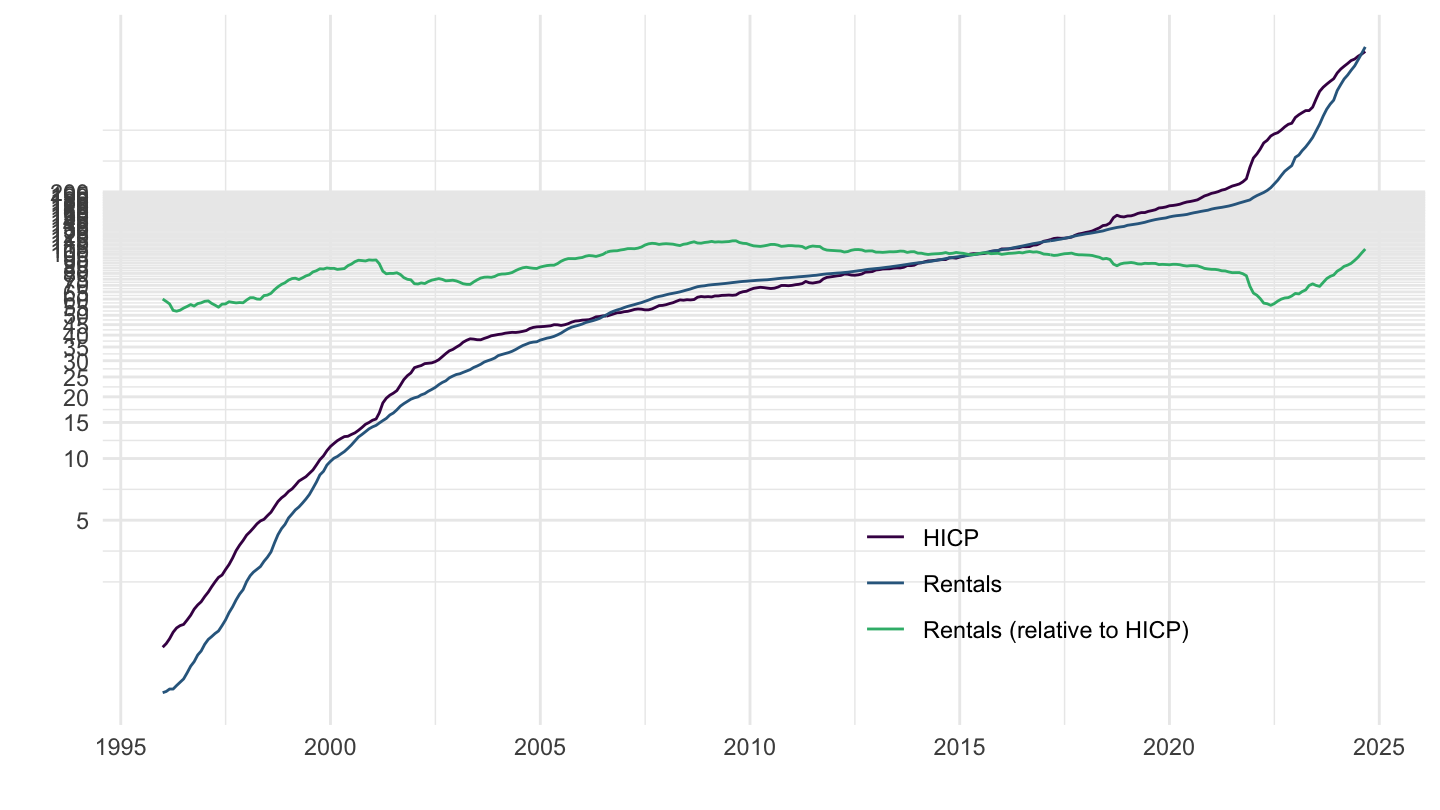
Croatia
Code
prc_hicp_midx %>%
filter(unit == "I15",
coicop %in% c("CP00", "CP041"),
geo %in% c("HR")) %>%
month_to_date %>%
select(date, coicop, values) %>%
spread(coicop, values) %>%
mutate(`CP041/CP00` = 100*CP041/CP00) %>%
gather(coicop, values, -date) %>%
left_join(tibble(coicop = c("CP041/CP00", "CP041", "CP00"),
Coicop = c("Rentals (relative to HICP)",
"Rentals",
"HICP")), by = "coicop") %>%
ggplot(.) + geom_line(aes(x = date, y = values, color = Coicop)) +
theme_minimal() + xlab("") + ylab("") +
scale_x_date(breaks = seq(1960, 2100, 5) %>% paste0("-01-01") %>% as.Date,
labels = date_format("%Y")) +
scale_y_log10(breaks = seq(0, 200, 5)) +
scale_color_manual(values = viridis(4)[1:3]) +
theme(legend.position = c(0.7, 0.2),
legend.title = element_blank())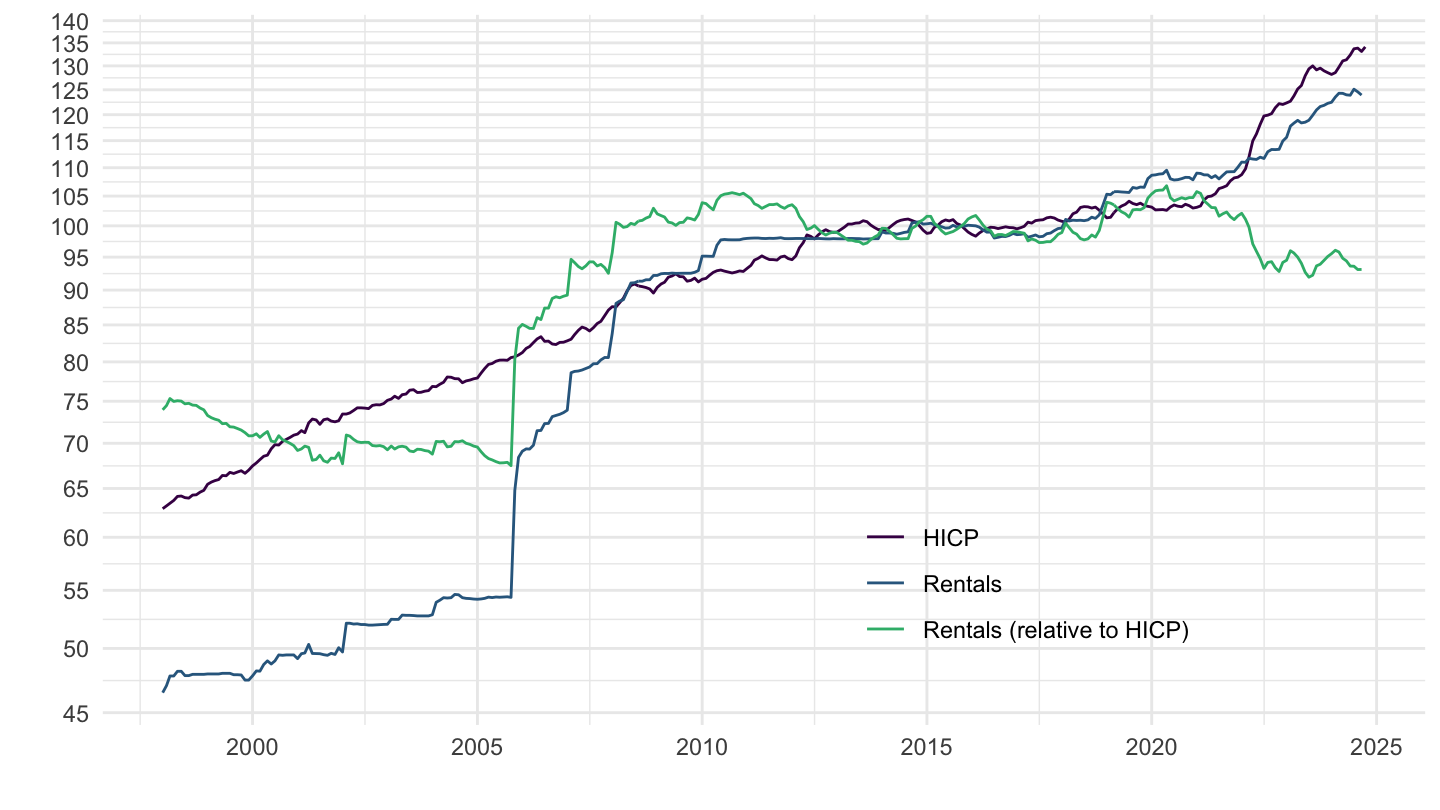
Spain
All
Code
prc_hicp_midx %>%
filter(unit == "I15",
coicop %in% c("CP00", "CP041"),
geo %in% c("ES")) %>%
month_to_date %>%
select(date, coicop, values) %>%
spread(coicop, values) %>%
mutate(`CP041/CP00` = 100*CP041/CP00) %>%
gather(coicop, values, -date) %>%
left_join(tibble(coicop = c("CP041/CP00", "CP041", "CP00"),
Coicop = c("Rentals (relative to HICP)",
"Rentals",
"HICP")), by = "coicop") %>%
ggplot(.) + geom_line(aes(x = date, y = values, color = Coicop)) +
theme_minimal() + xlab("") + ylab("") +
scale_x_date(breaks = seq(1960, 2100, 5) %>% paste0("-01-01") %>% as.Date,
labels = date_format("%Y")) +
scale_y_log10(breaks = seq(0, 200, 5)) +
scale_color_manual(values = viridis(4)[1:3]) +
theme(legend.position = c(0.7, 0.2),
legend.title = element_blank())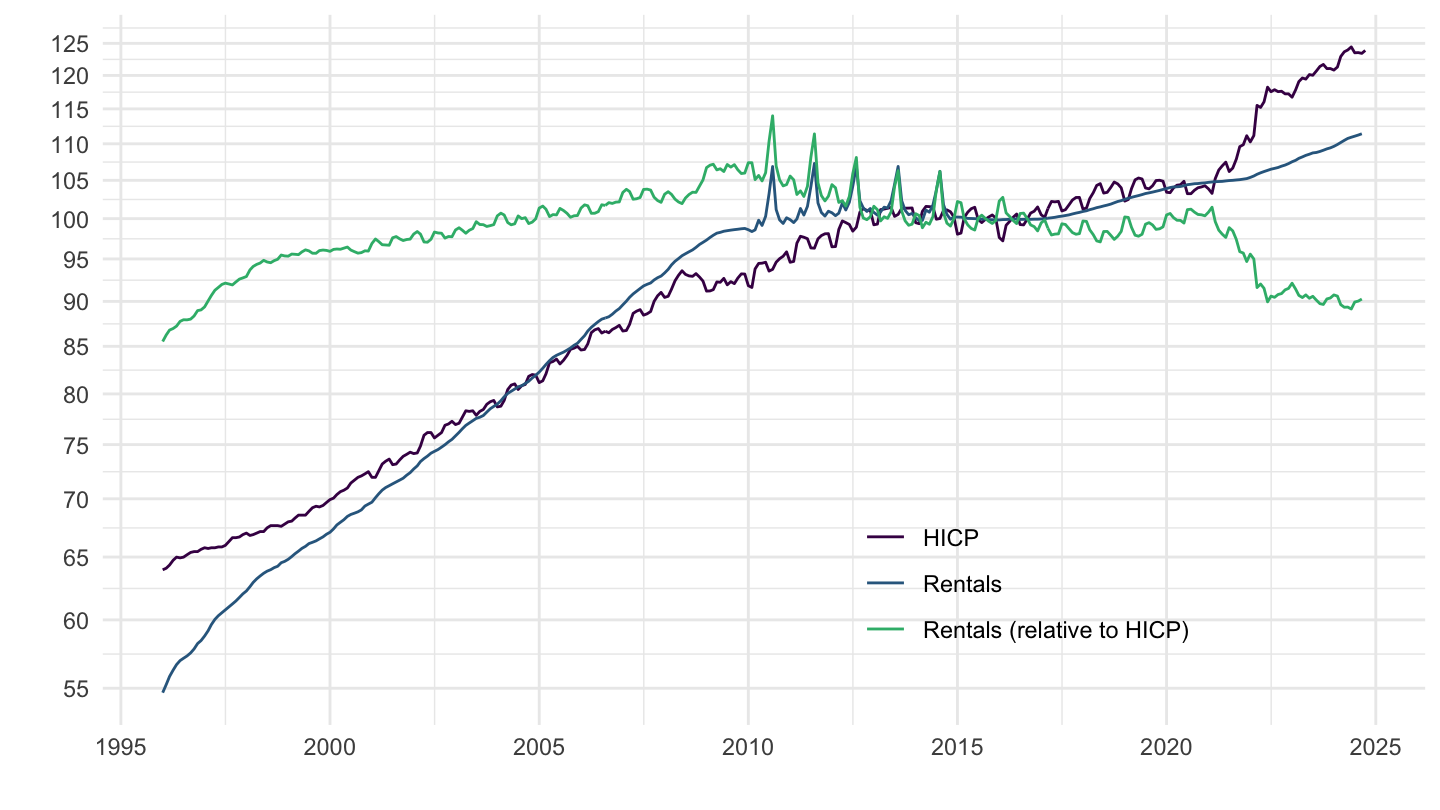
All
Code
prc_hicp_midx %>%
filter(unit == "I15",
coicop %in% c("CP00", "CP041"),
geo %in% c("ES")) %>%
month_to_date %>%
filter(date >= as.Date("2005-01-01"),
date <= as.Date("2016-01-01")) %>%
select(date, coicop, values) %>%
spread(coicop, values) %>%
mutate(`CP041/CP00` = 100*CP041/CP00) %>%
gather(coicop, values, -date) %>%
left_join(tibble(coicop = c("CP041/CP00", "CP041", "CP00"),
Coicop = c("Rentals (relative to HICP)",
"Rentals",
"HICP")), by = "coicop") %>%
ggplot(.) + geom_line(aes(x = date, y = values, color = Coicop)) +
theme_minimal() + xlab("") + ylab("") +
scale_x_date(breaks = seq(1960, 2100, 2) %>% paste0("-01-01") %>% as.Date,
labels = date_format("%Y")) +
scale_y_log10(breaks = seq(0, 200, 5)) +
scale_color_manual(values = viridis(4)[1:3]) +
theme(legend.position = c(0.7, 0.2),
legend.title = element_blank())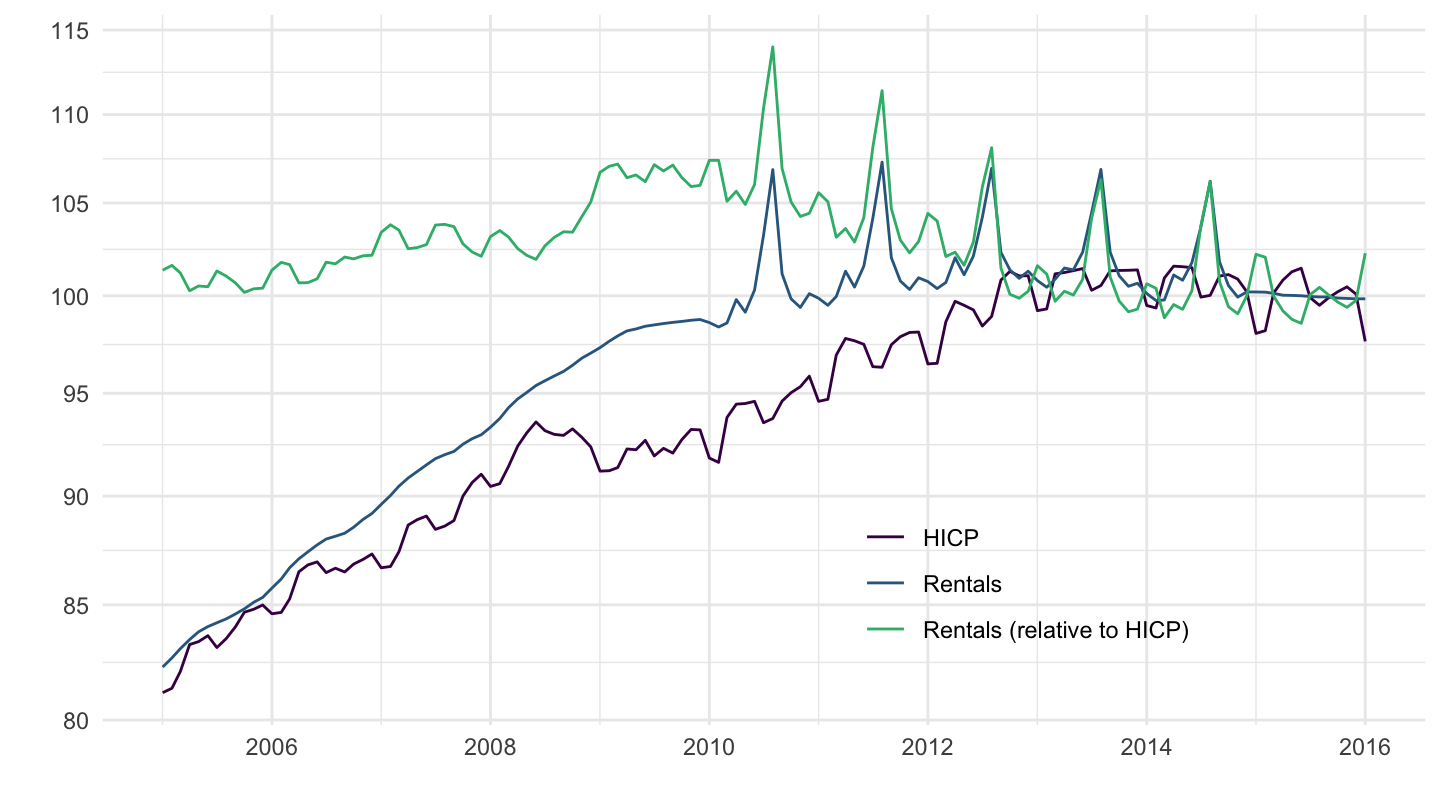
Slovakia
Code
prc_hicp_midx %>%
filter(unit == "I15",
coicop %in% c("CP00", "CP041"),
geo %in% c("SK")) %>%
month_to_date %>%
select(date, coicop, values) %>%
spread(coicop, values) %>%
mutate(`CP041/CP00` = 100*CP041/CP00) %>%
gather(coicop, values, -date) %>%
left_join(tibble(coicop = c("CP041/CP00", "CP041", "CP00"),
Coicop = c("Rentals (relative to HICP)",
"Rentals",
"HICP")), by = "coicop") %>%
ggplot(.) + geom_line(aes(x = date, y = values, color = Coicop)) +
theme_minimal() + xlab("") + ylab("") +
scale_x_date(breaks = seq(1960, 2100, 5) %>% paste0("-01-01") %>% as.Date,
labels = date_format("%Y")) +
scale_y_log10(breaks = seq(0, 200, 5)) +
scale_color_manual(values = viridis(4)[1:3]) +
theme(legend.position = c(0.7, 0.2),
legend.title = element_blank())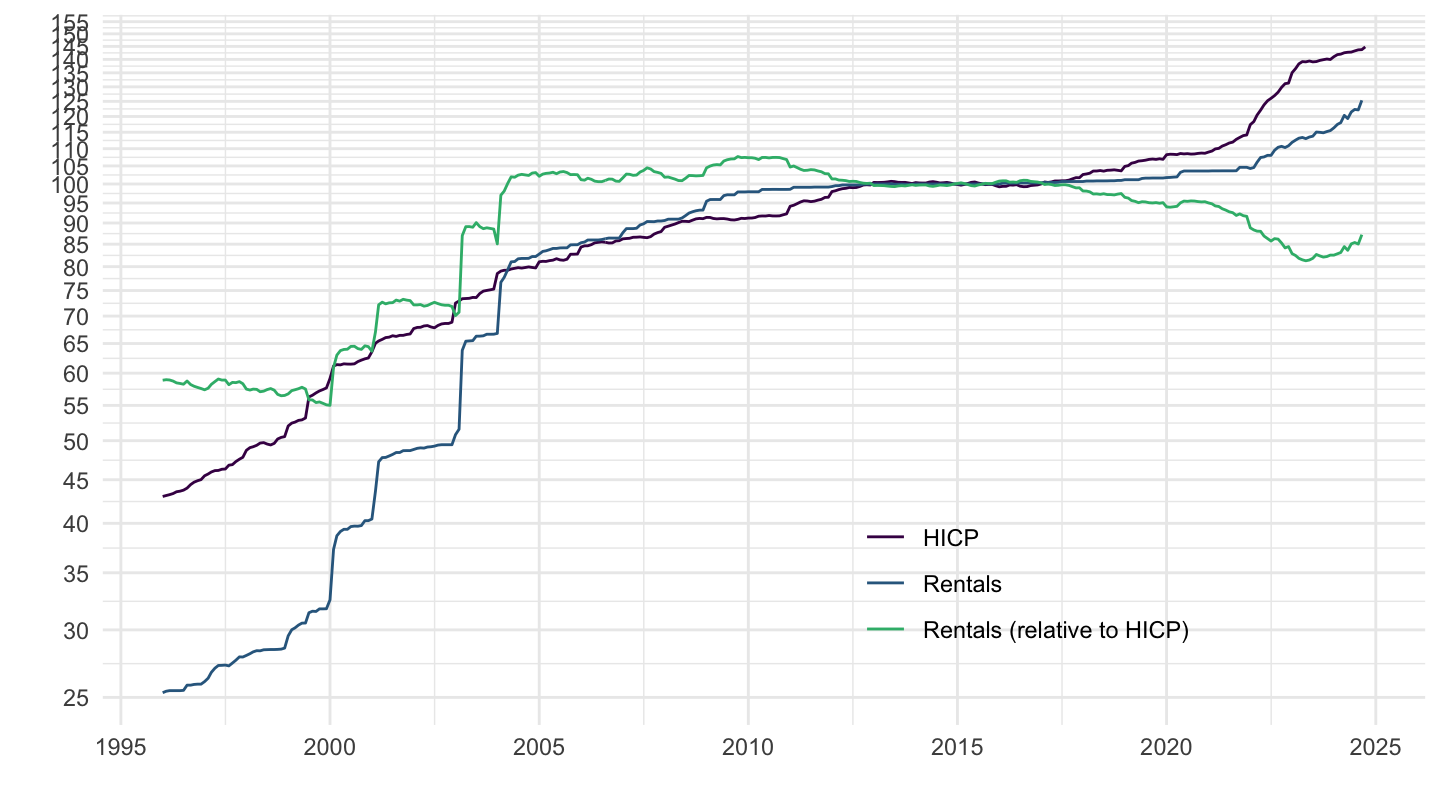
North Macedonia
Code
prc_hicp_midx %>%
filter(unit == "I15",
coicop %in% c("CP00", "CP041"),
geo %in% c("MK")) %>%
month_to_date %>%
select(date, coicop, values) %>%
spread(coicop, values) %>%
mutate(`CP041/CP00` = 100*CP041/CP00) %>%
gather(coicop, values, -date) %>%
left_join(tibble(coicop = c("CP041/CP00", "CP041", "CP00"),
Coicop = c("Rentals (relative to HICP)",
"Rentals",
"HICP")), by = "coicop") %>%
ggplot(.) + geom_line(aes(x = date, y = values, color = Coicop)) +
theme_minimal() + xlab("") + ylab("") +
scale_x_date(breaks = seq(1960, 2100, 2) %>% paste0("-01-01") %>% as.Date,
labels = date_format("%Y")) +
scale_y_log10(breaks = seq(0, 200, 5)) +
scale_color_manual(values = viridis(4)[1:3]) +
theme(legend.position = c(0.7, 0.2),
legend.title = element_blank())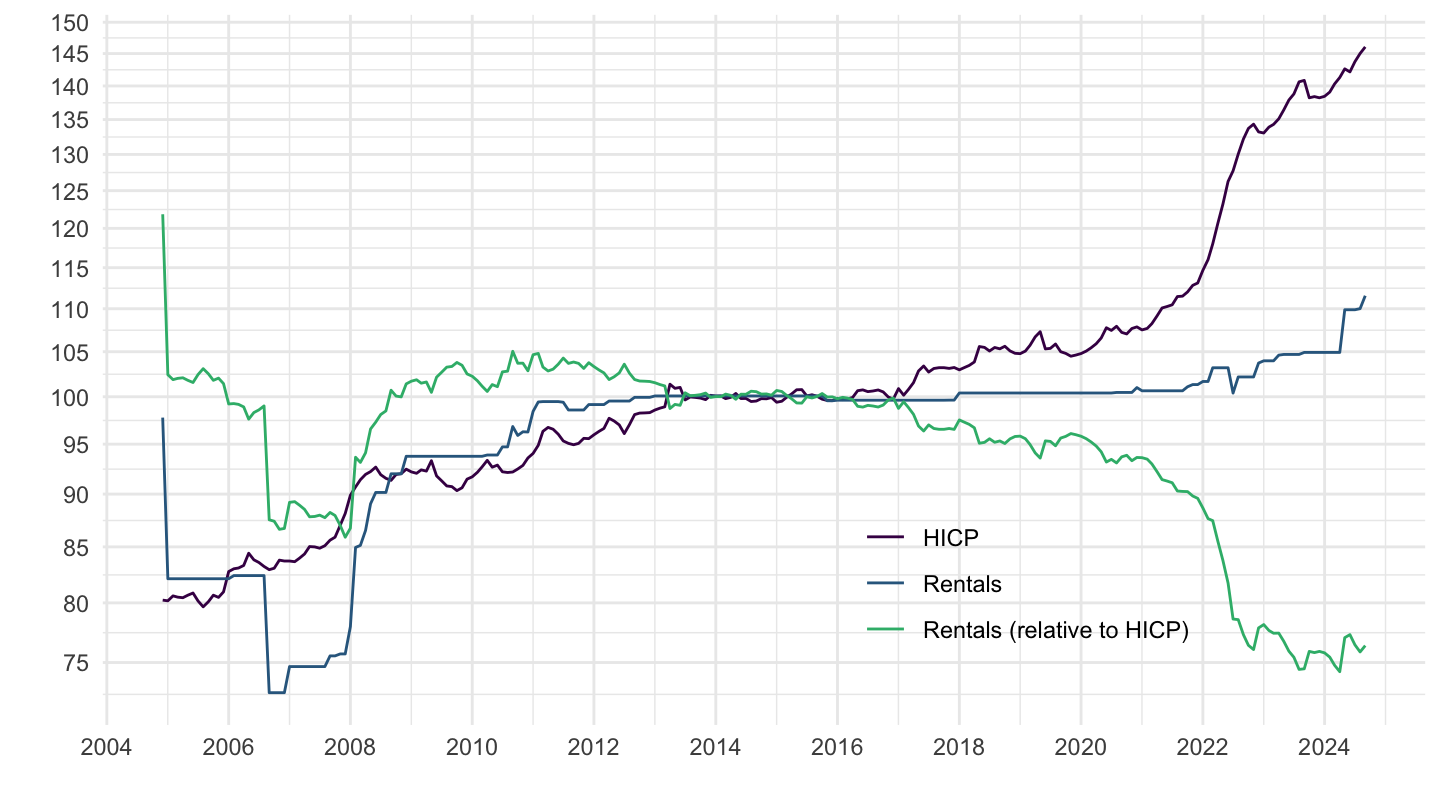
Romania
Code
prc_hicp_midx %>%
filter(unit == "I15",
coicop %in% c("CP00", "CP041"),
geo %in% c("RO")) %>%
month_to_date %>%
select(date, coicop, values) %>%
spread(coicop, values) %>%
mutate(`CP041/CP00` = 100*CP041/CP00) %>%
gather(coicop, values, -date) %>%
left_join(tibble(coicop = c("CP041/CP00", "CP041", "CP00"),
Coicop = c("Rentals (relative to HICP)",
"Rentals",
"HICP")), by = "coicop") %>%
ggplot(.) + geom_line(aes(x = date, y = values, color = Coicop)) +
theme_minimal() + xlab("") + ylab("") +
scale_x_date(breaks = seq(1960, 2100, 5) %>% paste0("-01-01") %>% as.Date,
labels = date_format("%Y")) +
scale_y_log10(breaks = seq(0, 200, 5)) +
scale_color_manual(values = viridis(4)[1:3]) +
theme(legend.position = c(0.7, 0.2),
legend.title = element_blank())
Italy
Code
prc_hicp_midx %>%
filter(unit == "I15",
coicop %in% c("CP00", "CP041"),
geo %in% c("IT")) %>%
month_to_date %>%
select(date, coicop, values) %>%
spread(coicop, values) %>%
mutate(`CP041/CP00` = 100*CP041/CP00) %>%
gather(coicop, values, -date) %>%
left_join(tibble(coicop = c("CP041/CP00", "CP041", "CP00"),
Coicop = c("Rentals (relative to HICP)",
"Rentals",
"HICP")), by = "coicop") %>%
ggplot(.) + geom_line(aes(x = date, y = values, color = Coicop)) +
theme_minimal() + xlab("") + ylab("") +
scale_x_date(breaks = seq(1960, 2100, 5) %>% paste0("-01-01") %>% as.Date,
labels = date_format("%Y")) +
scale_y_log10(breaks = seq(0, 200, 5)) +
scale_color_manual(values = viridis(4)[1:3]) +
theme(legend.position = c(0.7, 0.2),
legend.title = element_blank())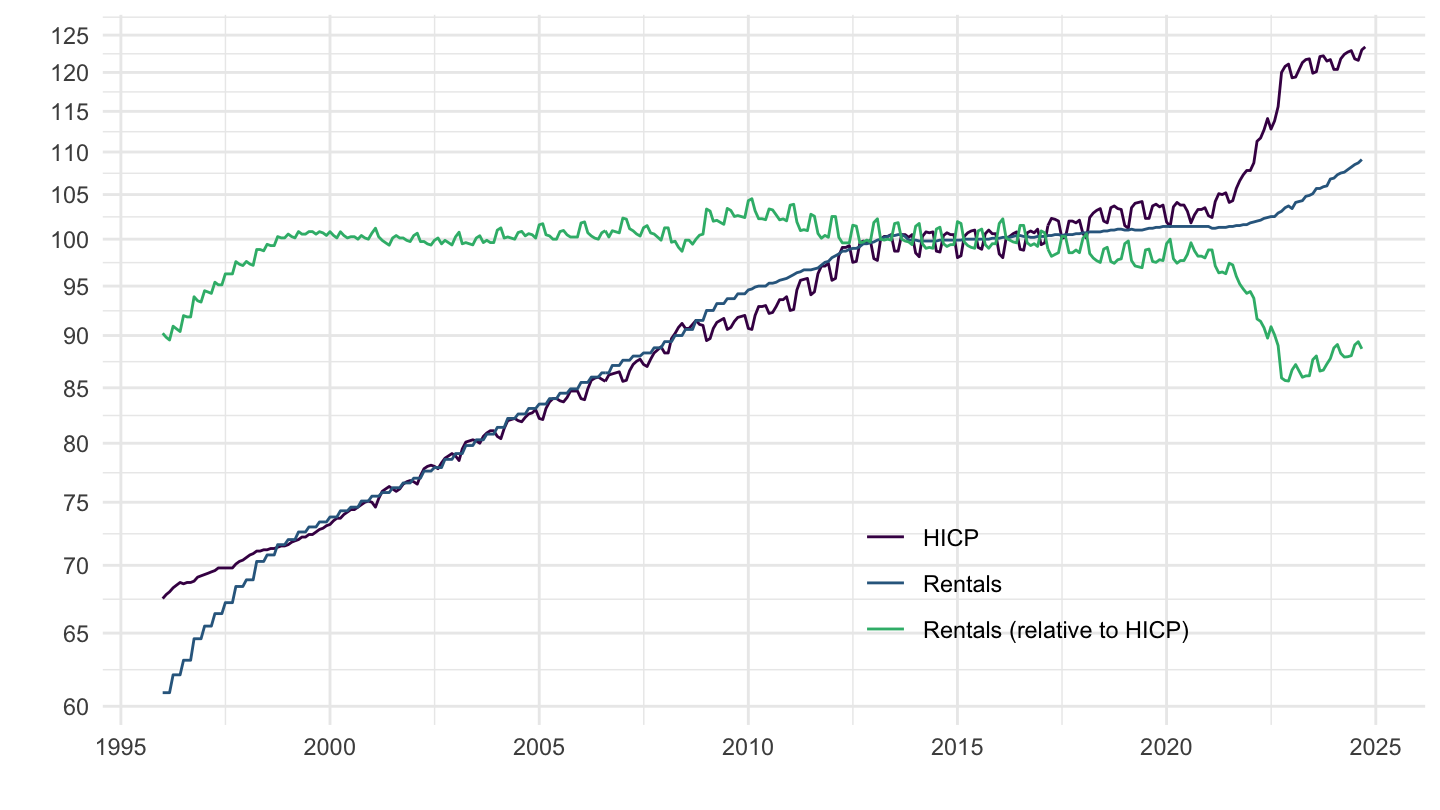
Belgium
Code
prc_hicp_midx %>%
filter(unit == "I15",
coicop %in% c("CP00", "CP041"),
geo %in% c("BE")) %>%
month_to_date %>%
select(date, coicop, values) %>%
spread(coicop, values) %>%
mutate(`CP041/CP00` = 100*CP041/CP00) %>%
gather(coicop, values, -date) %>%
left_join(tibble(coicop = c("CP041/CP00", "CP041", "CP00"),
Coicop = c("Rentals (relative to HICP)",
"Rentals",
"HICP")), by = "coicop") %>%
ggplot(.) + geom_line(aes(x = date, y = values, color = Coicop)) +
theme_minimal() + xlab("") + ylab("") +
scale_x_date(breaks = seq(1960, 2100, 5) %>% paste0("-01-01") %>% as.Date,
labels = date_format("%Y")) +
scale_y_log10(breaks = seq(0, 200, 5)) +
scale_color_manual(values = viridis(4)[1:3]) +
theme(legend.position = c(0.7, 0.2),
legend.title = element_blank())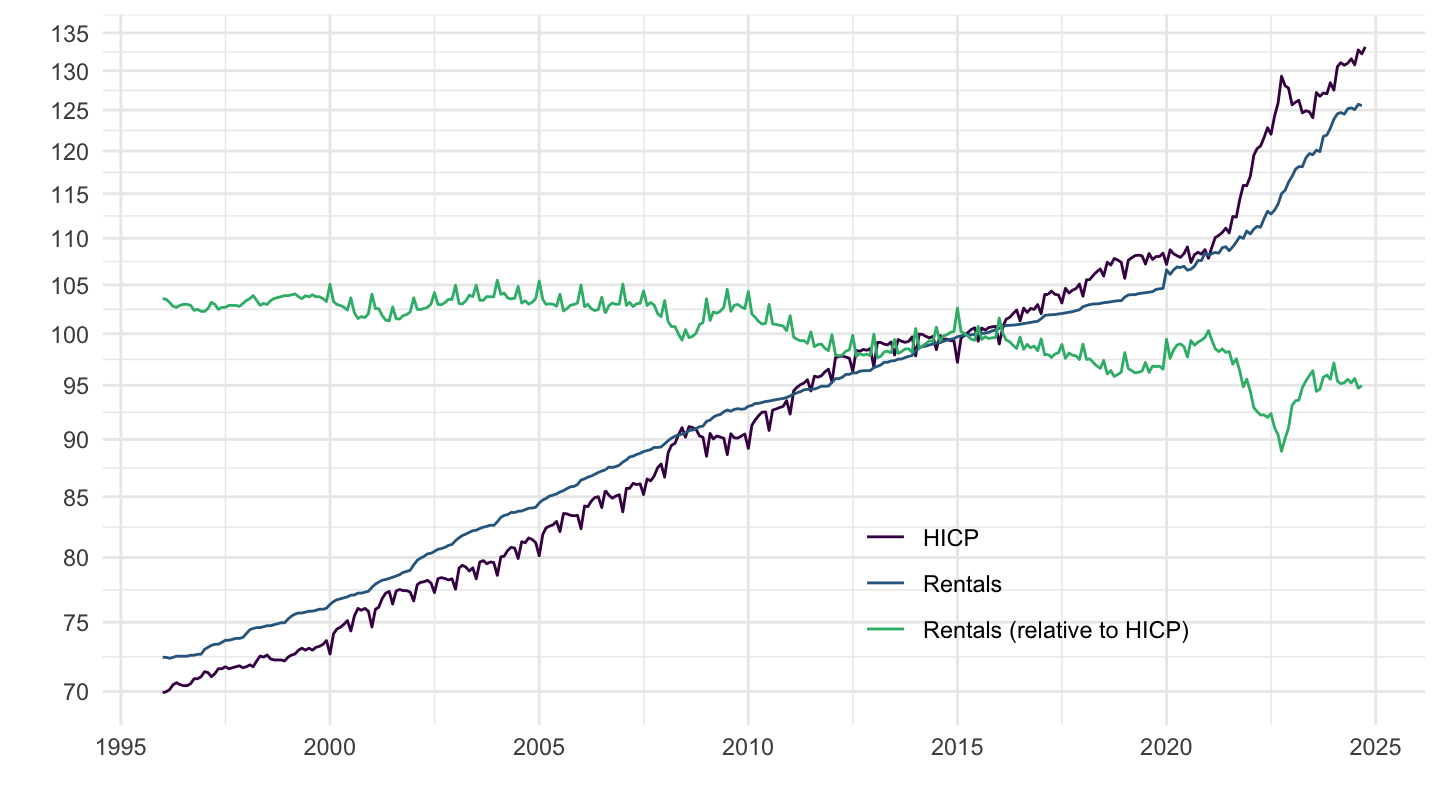
Luxembourg
Code
prc_hicp_midx %>%
filter(unit == "I15",
coicop %in% c("CP00", "CP041"),
geo %in% c("LU")) %>%
month_to_date %>%
select(date, coicop, values) %>%
spread(coicop, values) %>%
mutate(`CP041/CP00` = 100*CP041/CP00) %>%
gather(coicop, values, -date) %>%
left_join(tibble(coicop = c("CP041/CP00", "CP041", "CP00"),
Coicop = c("Rentals (relative to HICP)",
"Rentals",
"HICP")), by = "coicop") %>%
ggplot(.) + geom_line(aes(x = date, y = values, color = Coicop)) +
theme_minimal() + xlab("") + ylab("") +
scale_x_date(breaks = seq(1960, 2100, 5) %>% paste0("-01-01") %>% as.Date,
labels = date_format("%Y")) +
scale_y_log10(breaks = seq(0, 200, 5)) +
scale_color_manual(values = viridis(4)[1:3]) +
theme(legend.position = c(0.7, 0.2),
legend.title = element_blank())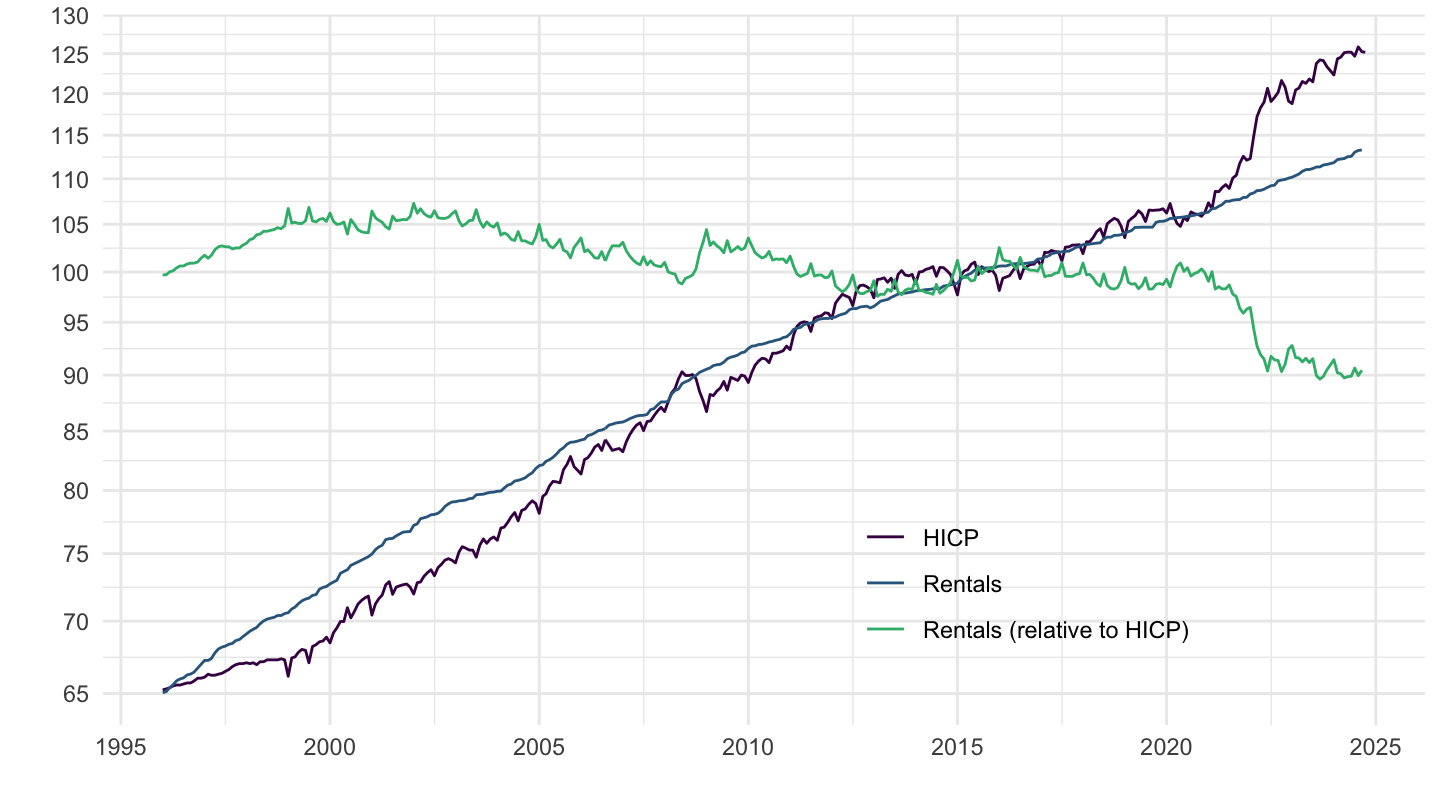
Malta
Code
prc_hicp_midx %>%
filter(unit == "I15",
coicop %in% c("CP00", "CP041"),
geo %in% c("MT")) %>%
month_to_date %>%
select(date, coicop, values) %>%
spread(coicop, values) %>%
mutate(`CP041/CP00` = 100*CP041/CP00) %>%
gather(coicop, values, -date) %>%
left_join(tibble(coicop = c("CP041/CP00", "CP041", "CP00"),
Coicop = c("Rentals (relative to HICP)",
"Rentals",
"HICP")), by = "coicop") %>%
ggplot(.) + geom_line(aes(x = date, y = values, color = Coicop)) +
theme_minimal() + xlab("") + ylab("") +
scale_x_date(breaks = seq(1960, 2100, 5) %>% paste0("-01-01") %>% as.Date,
labels = date_format("%Y")) +
scale_y_log10(breaks = seq(0, 200, 5)) +
scale_color_manual(values = viridis(4)[1:3]) +
theme(legend.position = c(0.7, 0.2),
legend.title = element_blank())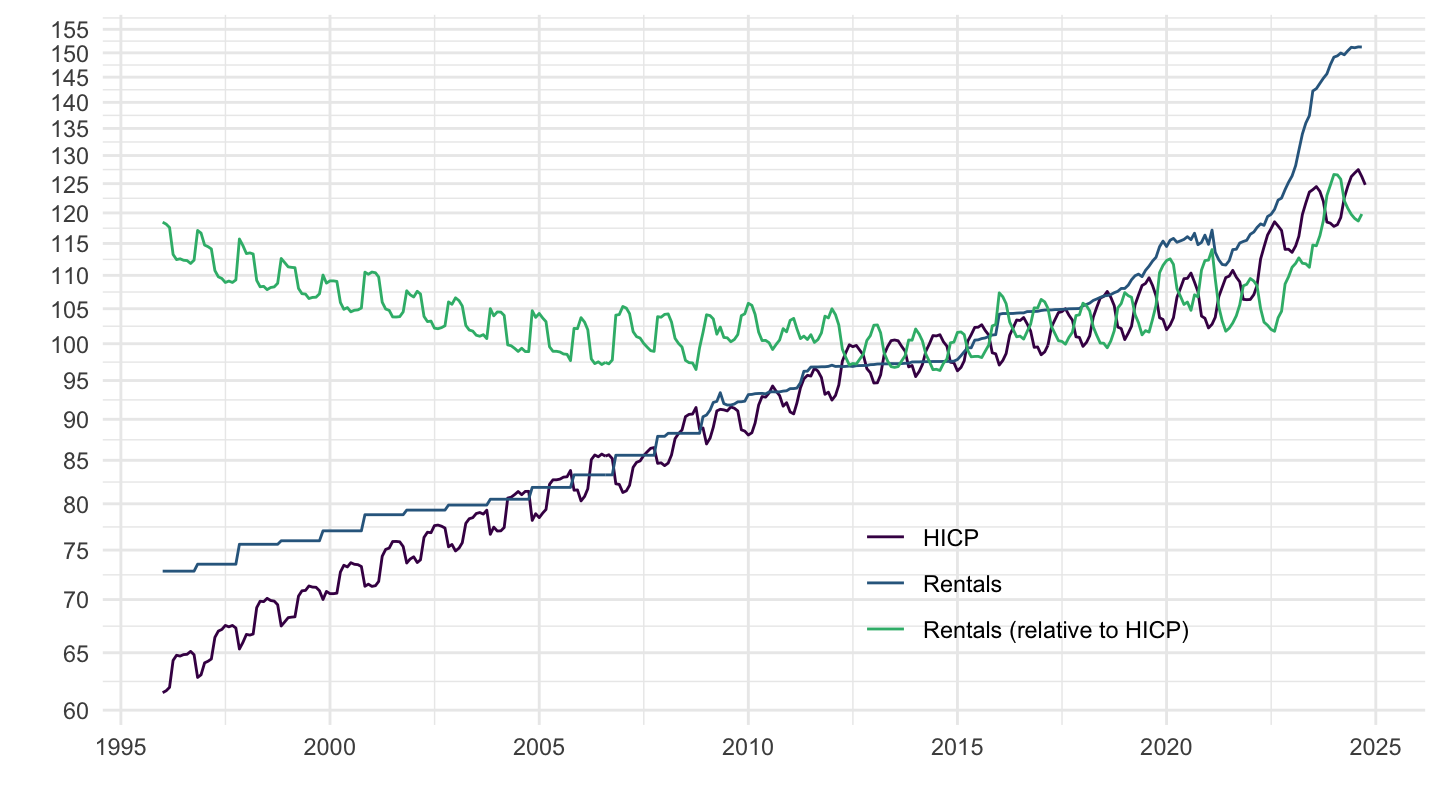
Germany
Code
prc_hicp_midx %>%
filter(unit == "I15",
coicop %in% c("CP00", "CP041"),
geo %in% c("DE")) %>%
month_to_date %>%
select(date, coicop, values) %>%
spread(coicop, values) %>%
mutate(`CP041/CP00` = 100*CP041/CP00) %>%
gather(coicop, values, -date) %>%
left_join(tibble(coicop = c("CP041/CP00", "CP041", "CP00"),
Coicop = c("Rentals (relative to HICP)",
"Rentals",
"HICP")), by = "coicop") %>%
ggplot(.) + geom_line(aes(x = date, y = values, color = Coicop)) +
theme_minimal() + xlab("") + ylab("") +
scale_x_date(breaks = seq(1960, 2100, 5) %>% paste0("-01-01") %>% as.Date,
labels = date_format("%Y")) +
scale_y_log10(breaks = seq(0, 200, 5)) +
scale_color_manual(values = viridis(4)[1:3]) +
theme(legend.position = c(0.7, 0.2),
legend.title = element_blank())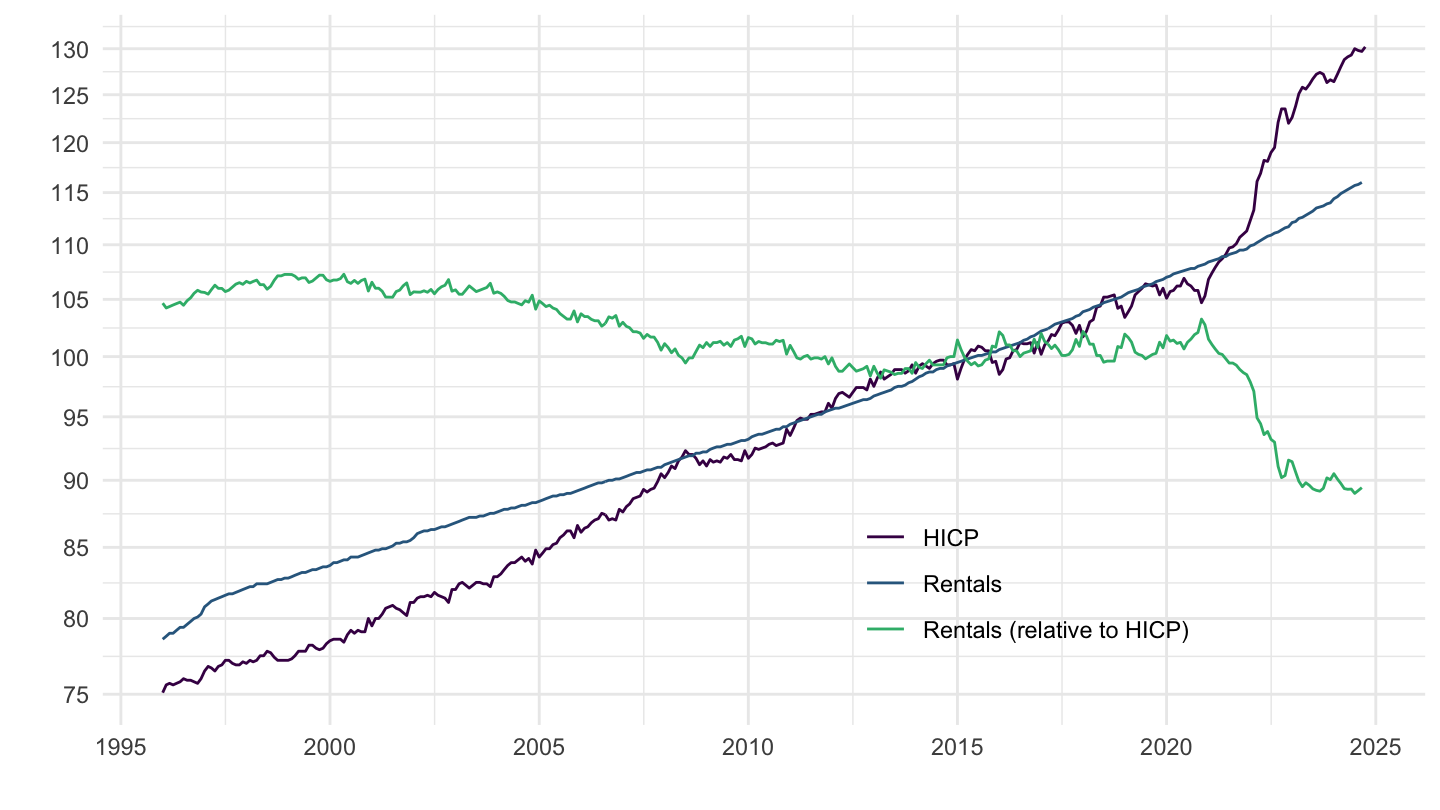
Euro area
Code
prc_hicp_midx %>%
filter(unit == "I15",
coicop %in% c("CP00", "CP041"),
geo %in% c("EA")) %>%
month_to_date %>%
select(date, coicop, values) %>%
spread(coicop, values) %>%
mutate(`CP041/CP00` = 100*CP041/CP00) %>%
gather(coicop, values, -date) %>%
left_join(tibble(coicop = c("CP041/CP00", "CP041", "CP00"),
Coicop = c("Rentals (relative to HICP)",
"Rentals",
"HICP")), by = "coicop") %>%
ggplot(.) + geom_line(aes(x = date, y = values, color = Coicop)) +
theme_minimal() + xlab("") + ylab("") +
scale_x_date(breaks = seq(1960, 2100, 5) %>% paste0("-01-01") %>% as.Date,
labels = date_format("%Y")) +
scale_y_log10(breaks = seq(0, 200, 5)) +
scale_color_manual(values = viridis(4)[1:3]) +
theme(legend.position = c(0.7, 0.2),
legend.title = element_blank())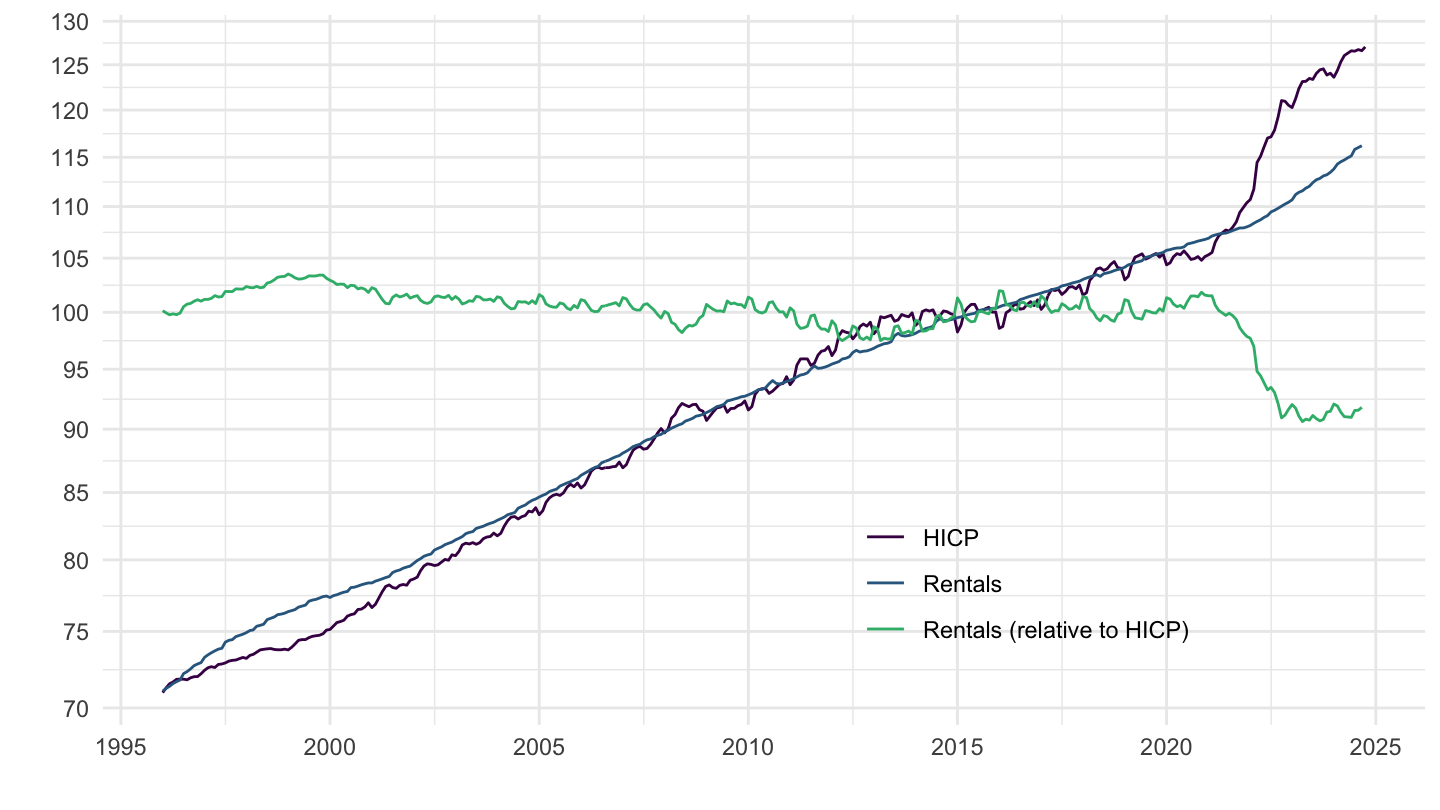
France
Code
prc_hicp_midx %>%
filter(unit == "I15",
coicop %in% c("CP00", "CP041"),
geo %in% c("FR")) %>%
month_to_date %>%
select(date, coicop, values) %>%
spread(coicop, values) %>%
mutate(`CP041/CP00` = 100*CP041/CP00) %>%
gather(coicop, values, -date) %>%
left_join(tibble(coicop = c("CP041/CP00", "CP041", "CP00"),
Coicop = c("Rentals (relative to HICP)",
"Rentals",
"HICP")), by = "coicop") %>%
ggplot(.) + geom_line(aes(x = date, y = values, color = Coicop)) +
theme_minimal() + xlab("") + ylab("") +
scale_x_date(breaks = seq(1960, 2100, 5) %>% paste0("-01-01") %>% as.Date,
labels = date_format("%Y")) +
scale_y_log10(breaks = seq(0, 200, 5)) +
scale_color_manual(values = viridis(4)[1:3]) +
theme(legend.position = c(0.7, 0.2),
legend.title = element_blank())
Portugal
Code
prc_hicp_midx %>%
filter(unit == "I15",
coicop %in% c("CP00", "CP041"),
geo %in% c("PT")) %>%
month_to_date %>%
select(date, coicop, values) %>%
spread(coicop, values) %>%
mutate(`CP041/CP00` = 100*CP041/CP00) %>%
gather(coicop, values, -date) %>%
left_join(tibble(coicop = c("CP041/CP00", "CP041", "CP00"),
Coicop = c("Rentals (relative to HICP)",
"Rentals",
"HICP")), by = "coicop") %>%
ggplot(.) + geom_line(aes(x = date, y = values, color = Coicop)) +
theme_minimal() + xlab("") + ylab("") +
scale_x_date(breaks = seq(1960, 2100, 5) %>% paste0("-01-01") %>% as.Date,
labels = date_format("%Y")) +
scale_y_log10(breaks = seq(0, 200, 5)) +
scale_color_manual(values = viridis(4)[1:3]) +
theme(legend.position = c(0.7, 0.2),
legend.title = element_blank())
Hungary
All
Code
prc_hicp_midx %>%
filter(unit == "I15",
coicop %in% c("CP00", "CP041"),
geo %in% c("HU")) %>%
month_to_date %>%
select(date, coicop, values) %>%
spread(coicop, values) %>%
mutate(`CP041/CP00` = 100*CP041/CP00) %>%
gather(coicop, values, -date) %>%
left_join(tibble(coicop = c("CP041/CP00", "CP041", "CP00"),
Coicop = c("Rentals (relative to HICP)",
"Rentals",
"HICP")), by = "coicop") %>%
ggplot(.) + geom_line(aes(x = date, y = values, color = Coicop)) +
theme_minimal() + xlab("") + ylab("") +
scale_x_date(breaks = seq(1960, 2100, 5) %>% paste0("-01-01") %>% as.Date,
labels = date_format("%Y")) +
scale_y_log10(breaks = seq(0, 200, 5)) +
scale_color_manual(values = viridis(4)[1:3]) +
theme(legend.position = c(0.7, 0.2),
legend.title = element_blank())
2005-2015
Code
prc_hicp_midx %>%
filter(unit == "I15",
coicop %in% c("CP00", "CP041"),
geo %in% c("HU")) %>%
month_to_date %>%
filter(date >= as.Date("2005-01-01"),
date <= as.Date("2015-01-01")) %>%
select(date, coicop, values) %>%
spread(coicop, values) %>%
mutate(`CP041/CP00` = 100*CP041/CP00) %>%
gather(coicop, values, -date) %>%
left_join(tibble(coicop = c("CP041/CP00", "CP041", "CP00"),
Coicop = c("Rentals (relative to HICP)",
"Rentals",
"HICP")), by = "coicop") %>%
ggplot(.) + geom_line(aes(x = date, y = values, color = Coicop)) +
theme_minimal() + xlab("") + ylab("") +
scale_x_date(breaks = seq(1960, 2100, 2) %>% paste0("-01-01") %>% as.Date,
labels = date_format("%Y")) +
scale_y_log10(breaks = seq(0, 200, 5)) +
scale_color_manual(values = viridis(4)[1:3]) +
theme(legend.position = c(0.7, 0.2),
legend.title = element_blank())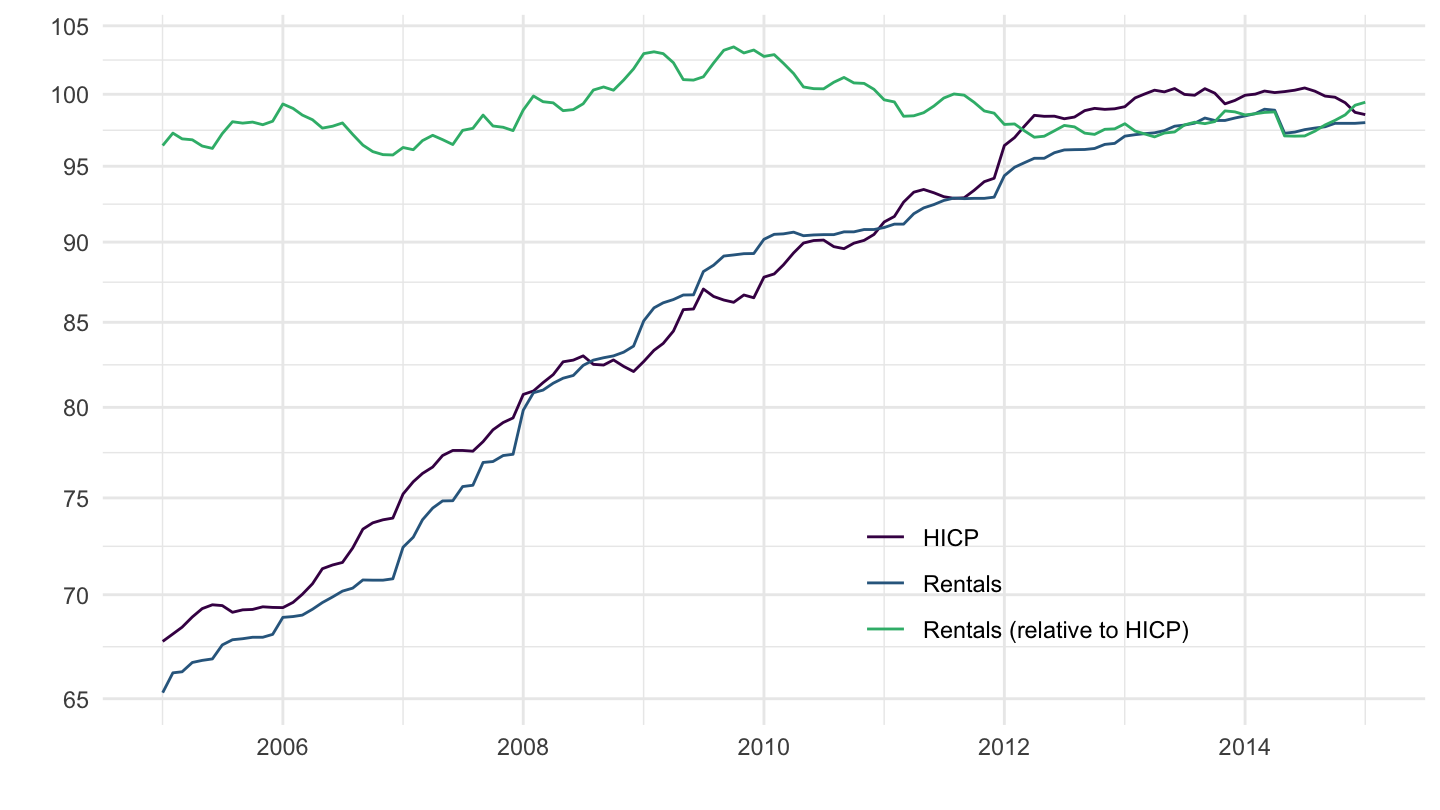
Poland
Code
prc_hicp_midx %>%
filter(unit == "I15",
coicop %in% c("CP00", "CP041"),
geo %in% c("PL")) %>%
month_to_date %>%
select(date, coicop, values) %>%
spread(coicop, values) %>%
mutate(`CP041/CP00` = 100*CP041/CP00) %>%
gather(coicop, values, -date) %>%
left_join(tibble(coicop = c("CP041/CP00", "CP041", "CP00"),
Coicop = c("Rentals (relative to HICP)",
"Rentals",
"HICP")), by = "coicop") %>%
ggplot(.) + geom_line(aes(x = date, y = values, color = Coicop)) +
theme_minimal() + xlab("") + ylab("") +
scale_x_date(breaks = seq(1960, 2100, 5) %>% paste0("-01-01") %>% as.Date,
labels = date_format("%Y")) +
scale_y_log10(breaks = seq(0, 200, 5)) +
scale_color_manual(values = viridis(4)[1:3]) +
theme(legend.position = c(0.7, 0.2),
legend.title = element_blank())
United Kingdom
Code
prc_hicp_midx %>%
filter(unit == "I15",
coicop %in% c("CP00", "CP041"),
geo %in% c("UK")) %>%
month_to_date %>%
select(date, coicop, values) %>%
spread(coicop, values) %>%
mutate(`CP041/CP00` = 100*CP041/CP00) %>%
gather(coicop, values, -date) %>%
left_join(tibble(coicop = c("CP041/CP00", "CP041", "CP00"),
Coicop = c("Rentals (relative to HICP)",
"Rentals",
"HICP")), by = "coicop") %>%
ggplot(.) + geom_line(aes(x = date, y = values, color = Coicop)) +
theme_minimal() + xlab("") + ylab("") +
scale_x_date(breaks = seq(1960, 2100, 5) %>% paste0("-01-01") %>% as.Date,
labels = date_format("%Y")) +
scale_y_log10(breaks = seq(0, 200, 5)) +
scale_color_manual(values = viridis(4)[1:3]) +
theme(legend.position = c(0.7, 0.2),
legend.title = element_blank())
Czechia
Code
prc_hicp_midx %>%
filter(unit == "I15",
coicop %in% c("CP00", "CP041"),
geo %in% c("CZ")) %>%
month_to_date %>%
select(date, coicop, values) %>%
spread(coicop, values) %>%
mutate(`CP041/CP00` = 100*CP041/CP00) %>%
gather(coicop, values, -date) %>%
left_join(tibble(coicop = c("CP041/CP00", "CP041", "CP00"),
Coicop = c("Rentals (relative to HICP)",
"Rentals",
"HICP")), by = "coicop") %>%
ggplot(.) + geom_line(aes(x = date, y = values, color = Coicop)) +
theme_minimal() + xlab("") + ylab("") +
scale_x_date(breaks = seq(1960, 2100, 5) %>% paste0("-01-01") %>% as.Date,
labels = date_format("%Y")) +
scale_y_log10(breaks = seq(0, 200, 5)) +
scale_color_manual(values = viridis(4)[1:3]) +
theme(legend.position = c(0.7, 0.2),
legend.title = element_blank())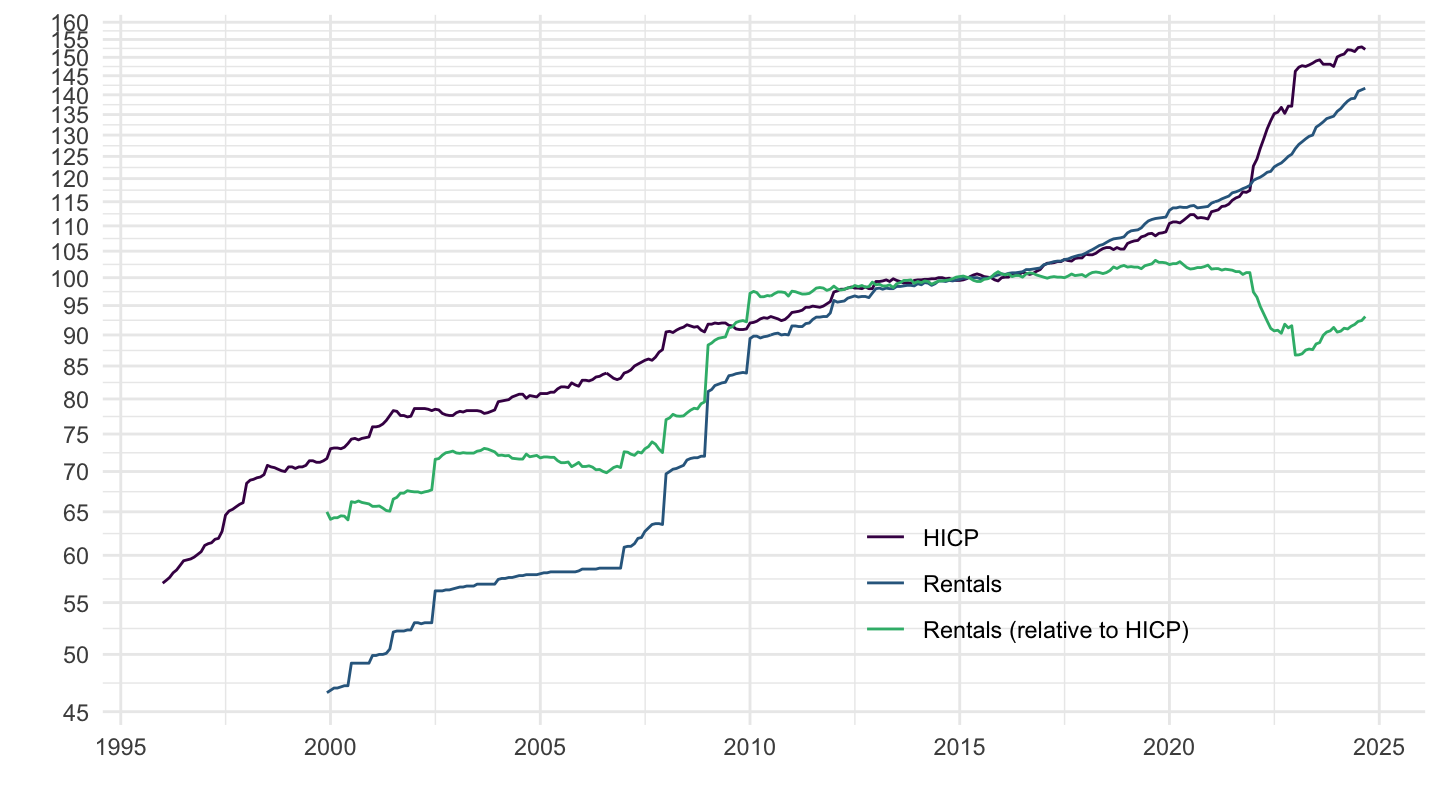
Netherlands
Code
prc_hicp_midx %>%
filter(unit == "I15",
coicop %in% c("CP00", "CP041"),
geo %in% c("NL")) %>%
month_to_date %>%
select(date, coicop, values) %>%
spread(coicop, values) %>%
mutate(`CP041/CP00` = 100*CP041/CP00) %>%
gather(coicop, values, -date) %>%
left_join(tibble(coicop = c("CP041/CP00", "CP041", "CP00"),
Coicop = c("Rentals (relative to HICP)",
"Rentals",
"HICP")), by = "coicop") %>%
ggplot(.) + geom_line(aes(x = date, y = values, color = Coicop)) +
theme_minimal() + xlab("") + ylab("") +
scale_x_date(breaks = seq(1960, 2100, 5) %>% paste0("-01-01") %>% as.Date,
labels = date_format("%Y")) +
scale_y_log10(breaks = seq(0, 200, 5)) +
scale_color_manual(values = viridis(4)[1:3]) +
theme(legend.position = c(0.7, 0.2),
legend.title = element_blank())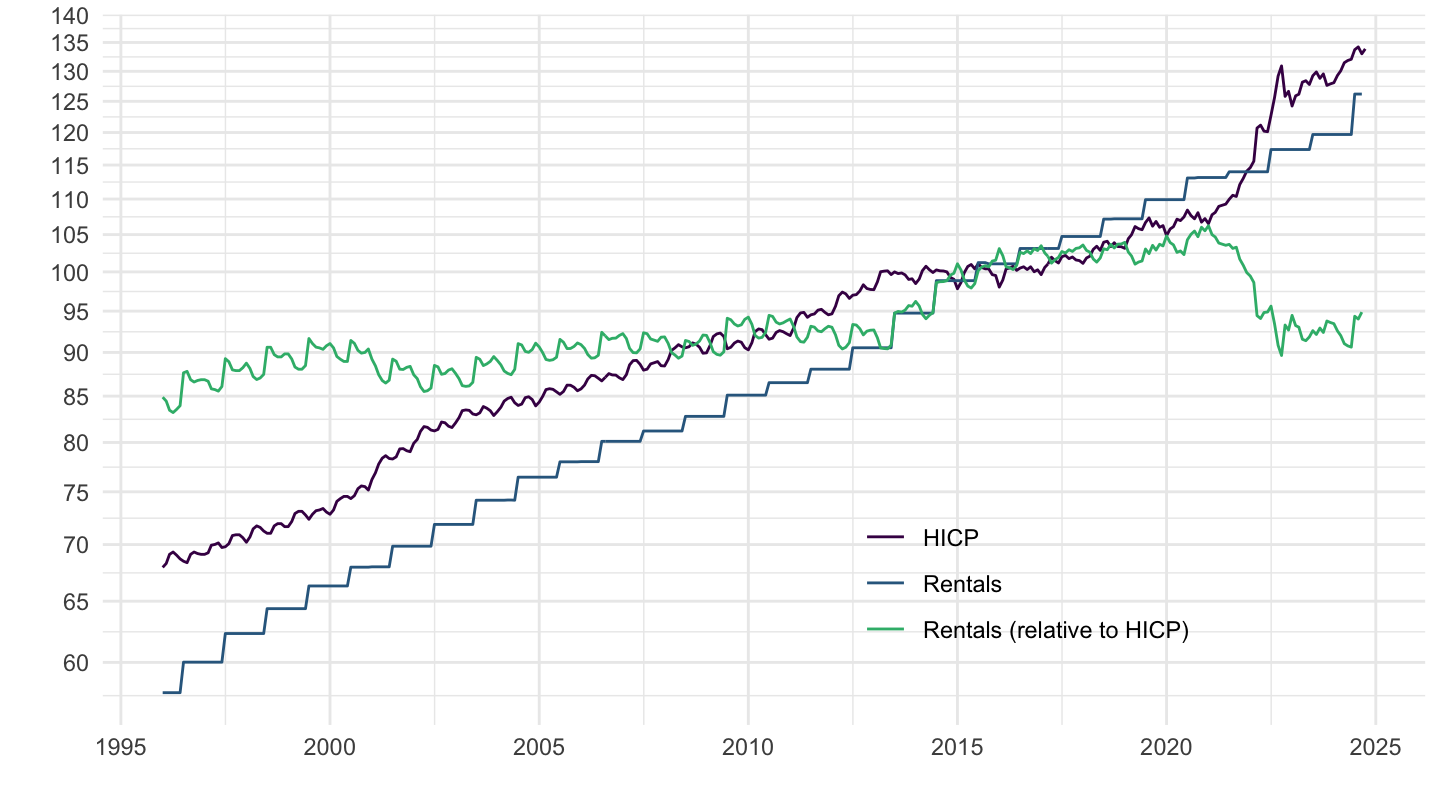
Finland
Code
prc_hicp_midx %>%
filter(unit == "I15",
coicop %in% c("CP00", "CP041"),
geo %in% c("FI")) %>%
month_to_date %>%
select(date, coicop, values) %>%
spread(coicop, values) %>%
mutate(`CP041/CP00` = 100*CP041/CP00) %>%
gather(coicop, values, -date) %>%
left_join(tibble(coicop = c("CP041/CP00", "CP041", "CP00"),
Coicop = c("Rentals (relative to HICP)",
"Rentals",
"HICP")), by = "coicop") %>%
ggplot(.) + geom_line(aes(x = date, y = values, color = Coicop)) +
theme_minimal() + xlab("") + ylab("") +
scale_x_date(breaks = seq(1960, 2100, 5) %>% paste0("-01-01") %>% as.Date,
labels = date_format("%Y")) +
scale_y_log10(breaks = seq(0, 200, 5)) +
scale_color_manual(values = viridis(4)[1:3]) +
theme(legend.position = c(0.7, 0.2),
legend.title = element_blank())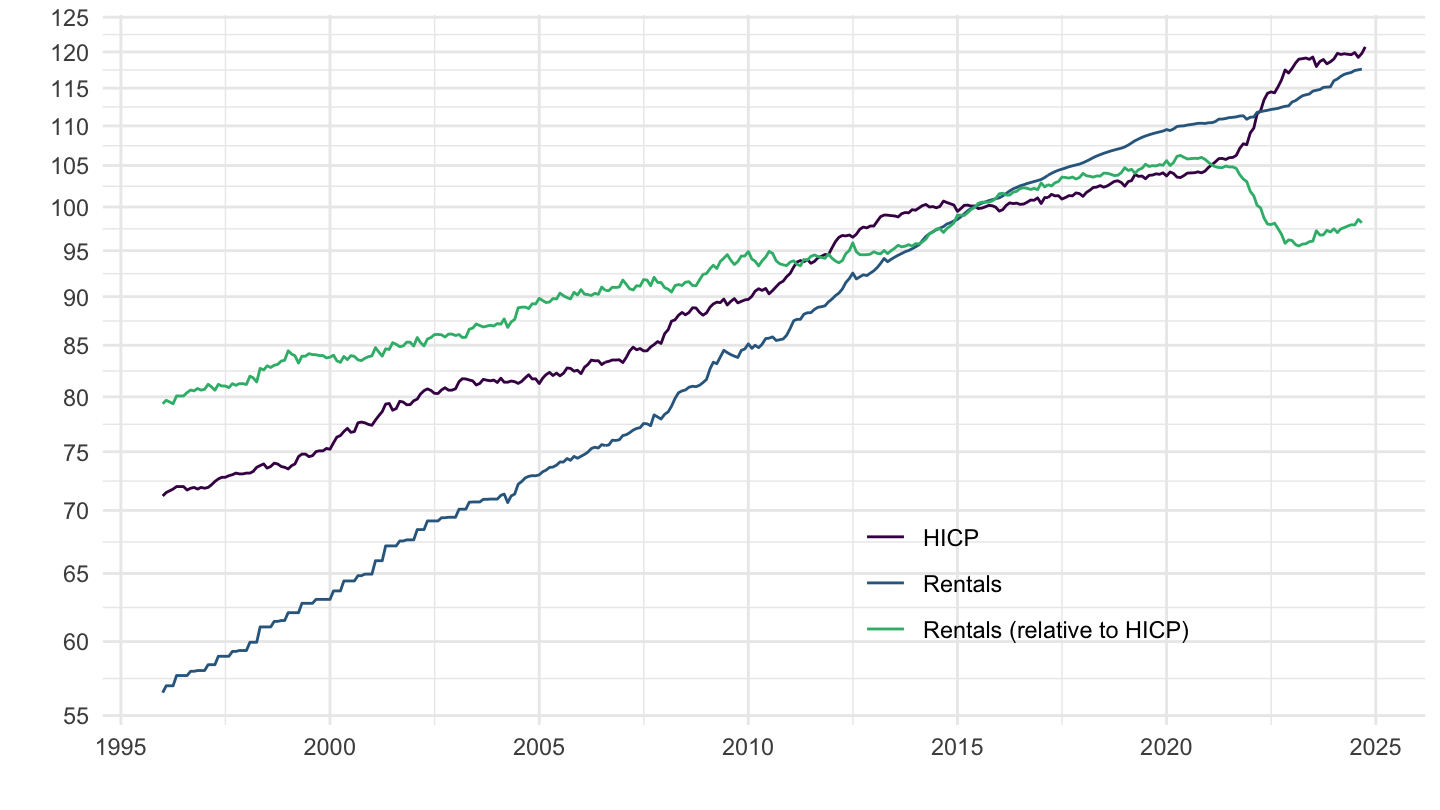
Austria
Code
prc_hicp_midx %>%
filter(unit == "I15",
coicop %in% c("CP00", "CP041"),
geo %in% c("AT")) %>%
month_to_date %>%
select(date, coicop, values) %>%
spread(coicop, values) %>%
mutate(`CP041/CP00` = 100*CP041/CP00) %>%
gather(coicop, values, -date) %>%
left_join(tibble(coicop = c("CP041/CP00", "CP041", "CP00"),
Coicop = c("Rentals (relative to HICP)",
"Rentals",
"HICP")), by = "coicop") %>%
ggplot(.) + geom_line(aes(x = date, y = values, color = Coicop)) +
theme_minimal() + xlab("") + ylab("") +
scale_x_date(breaks = seq(1960, 2100, 5) %>% paste0("-01-01") %>% as.Date,
labels = date_format("%Y")) +
scale_y_log10(breaks = seq(0, 200, 5)) +
scale_color_manual(values = viridis(4)[1:3]) +
theme(legend.position = c(0.7, 0.2),
legend.title = element_blank())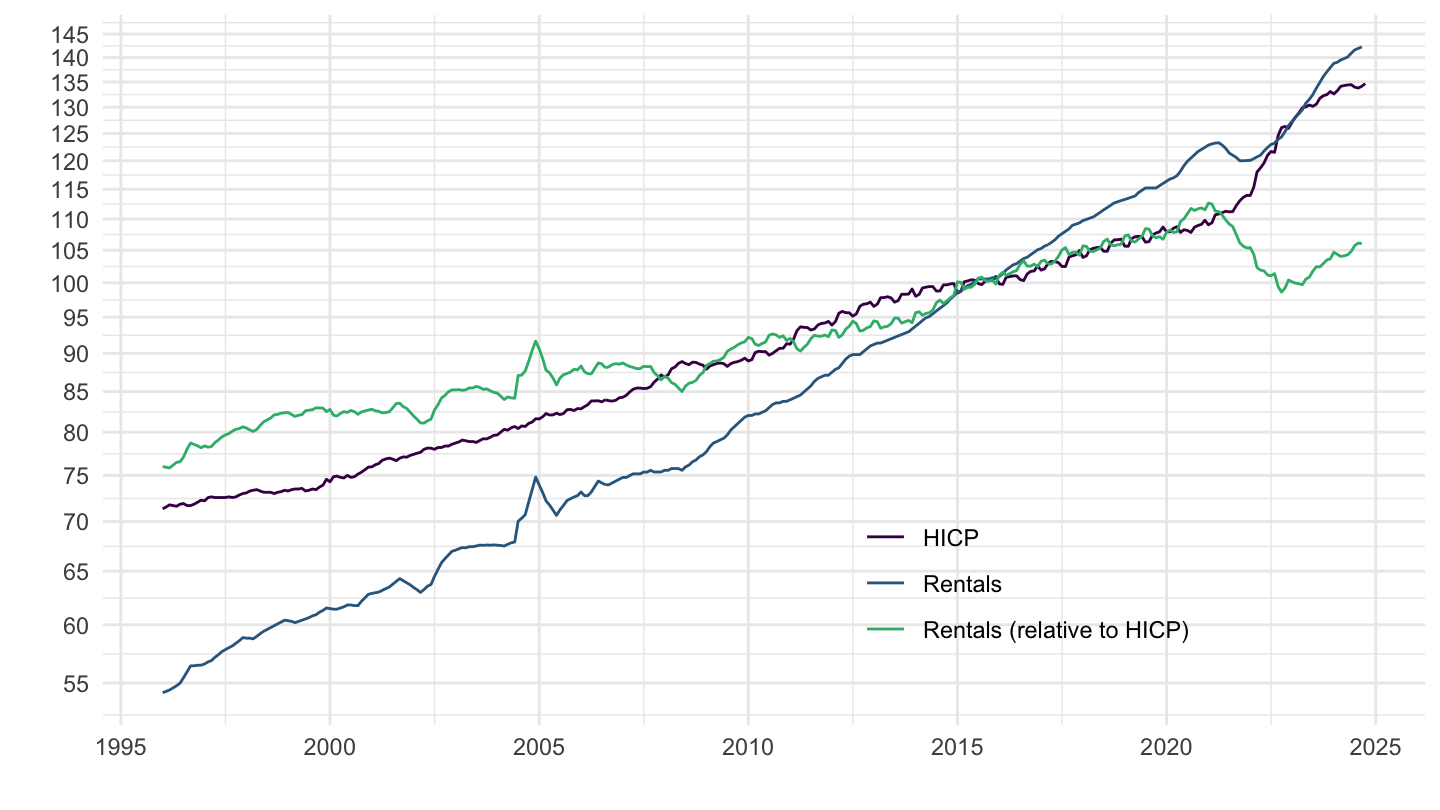
Switzerland
Code
prc_hicp_midx %>%
filter(unit == "I15",
coicop %in% c("CP00", "CP041"),
geo %in% c("CH")) %>%
month_to_date %>%
select(date, coicop, values) %>%
spread(coicop, values) %>%
mutate(`CP041/CP00` = 100*CP041/CP00) %>%
gather(coicop, values, -date) %>%
left_join(tibble(coicop = c("CP041/CP00", "CP041", "CP00"),
Coicop = c("Rentals (relative to HICP)",
"Rentals",
"HICP")), by = "coicop") %>%
ggplot(.) + geom_line(aes(x = date, y = values, color = Coicop)) +
theme_minimal() + xlab("") + ylab("") +
scale_x_date(breaks = seq(1960, 2100, 5) %>% paste0("-01-01") %>% as.Date,
labels = date_format("%Y")) +
scale_y_log10(breaks = seq(0, 200, 5)) +
scale_color_manual(values = viridis(4)[1:3]) +
theme(legend.position = c(0.7, 0.2),
legend.title = element_blank())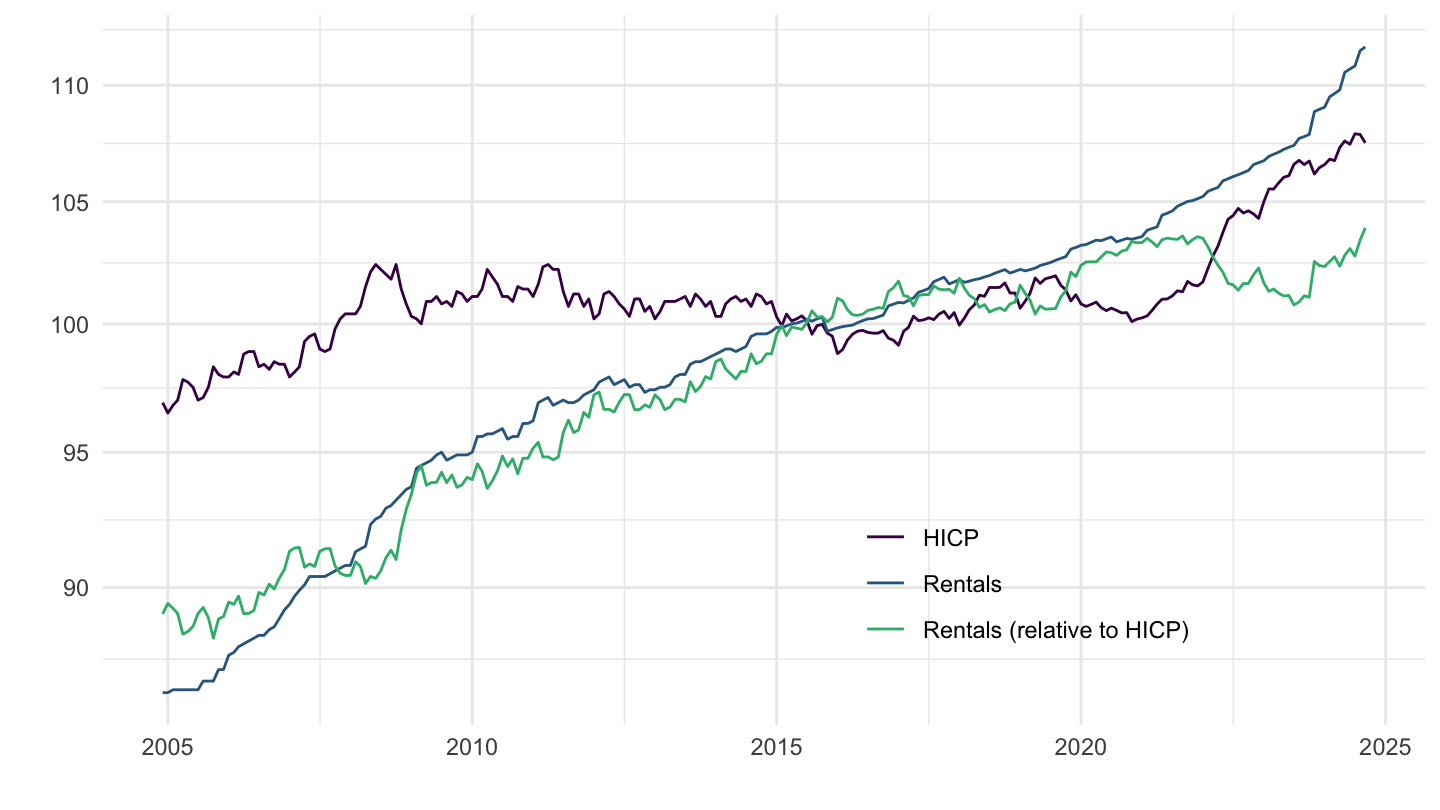
Denmark
Code
prc_hicp_midx %>%
filter(unit == "I15",
coicop %in% c("CP00", "CP041"),
geo %in% c("DK")) %>%
month_to_date %>%
select(date, coicop, values) %>%
spread(coicop, values) %>%
mutate(`CP041/CP00` = 100*CP041/CP00) %>%
gather(coicop, values, -date) %>%
left_join(tibble(coicop = c("CP041/CP00", "CP041", "CP00"),
Coicop = c("Rentals (relative to HICP)",
"Rentals",
"HICP")), by = "coicop") %>%
ggplot(.) + geom_line(aes(x = date, y = values, color = Coicop)) +
theme_minimal() + xlab("") + ylab("") +
scale_x_date(breaks = seq(1960, 2100, 5) %>% paste0("-01-01") %>% as.Date,
labels = date_format("%Y")) +
scale_y_log10(breaks = seq(0, 200, 5)) +
scale_color_manual(values = viridis(4)[1:3]) +
theme(legend.position = c(0.7, 0.2),
legend.title = element_blank())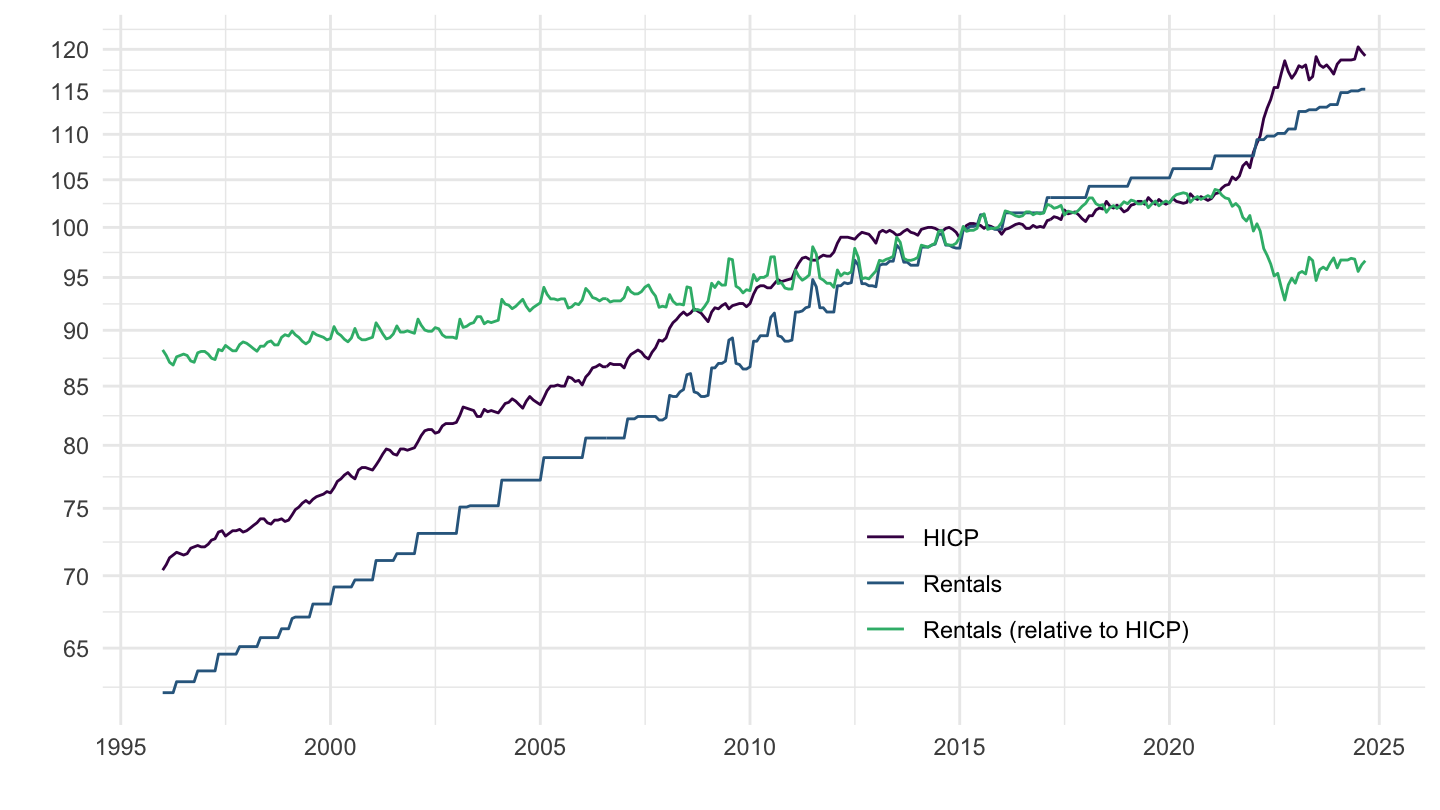
Norway
Code
prc_hicp_midx %>%
filter(unit == "I15",
coicop %in% c("CP00", "CP041"),
geo == "NO") %>%
month_to_date %>%
select(date, coicop, values) %>%
spread(coicop, values) %>%
mutate(`CP041/CP00` = 100*CP041/CP00) %>%
gather(coicop, values, -date) %>%
left_join(tibble(coicop = c("CP041/CP00", "CP041", "CP00"),
Coicop = c("Rentals (relative to HICP)",
"Rentals",
"HICP")), by = "coicop") %>%
ggplot(.) + geom_line(aes(x = date, y = values, color = Coicop)) +
theme_minimal() + xlab("") + ylab("") +
scale_x_date(breaks = seq(1960, 2100, 5) %>% paste0("-01-01") %>% as.Date,
labels = date_format("%Y")) +
scale_y_log10(breaks = seq(0, 200, 5)) +
scale_color_manual(values = viridis(4)[1:3]) +
theme(legend.position = c(0.7, 0.2),
legend.title = element_blank())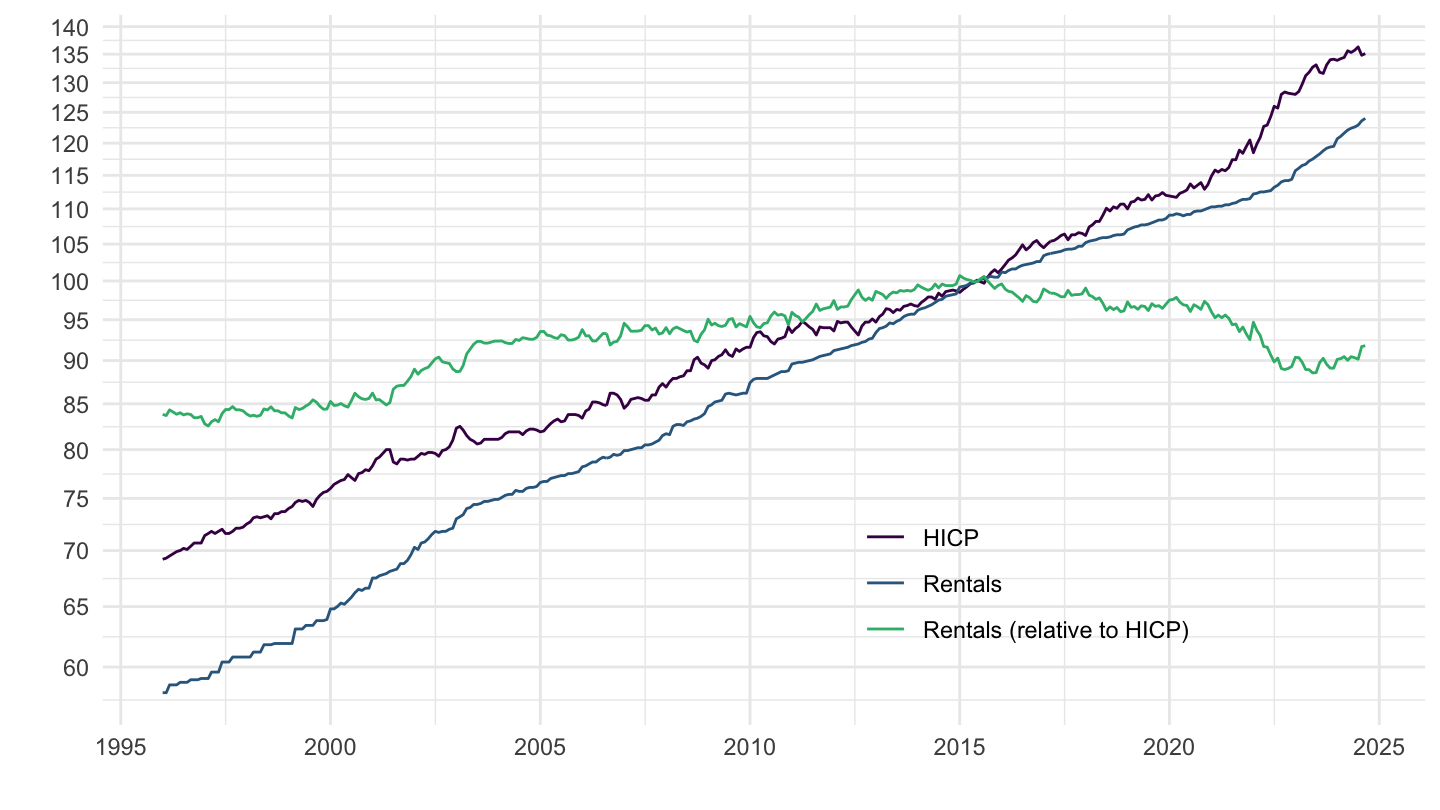
Sweden
Code
prc_hicp_midx %>%
filter(unit == "I15",
coicop %in% c("CP00", "CP041"),
geo == "SE") %>%
month_to_date %>%
select(date, coicop, values) %>%
spread(coicop, values) %>%
mutate(`CP041/CP00` = 100*CP041/CP00) %>%
gather(coicop, values, -date) %>%
left_join(tibble(coicop = c("CP041/CP00", "CP041", "CP00"),
Coicop = c("Rentals (relative to HICP)",
"Rentals",
"HICP")), by = "coicop") %>%
ggplot(.) + geom_line(aes(x = date, y = values, color = Coicop)) +
theme_minimal() + xlab("") + ylab("") +
scale_x_date(breaks = seq(1960, 2100, 5) %>% paste0("-01-01") %>% as.Date,
labels = date_format("%Y")) +
scale_y_log10(breaks = seq(0, 200, 5)) +
scale_color_manual(values = viridis(4)[1:3]) +
theme(legend.position = c(0.7, 0.2),
legend.title = element_blank())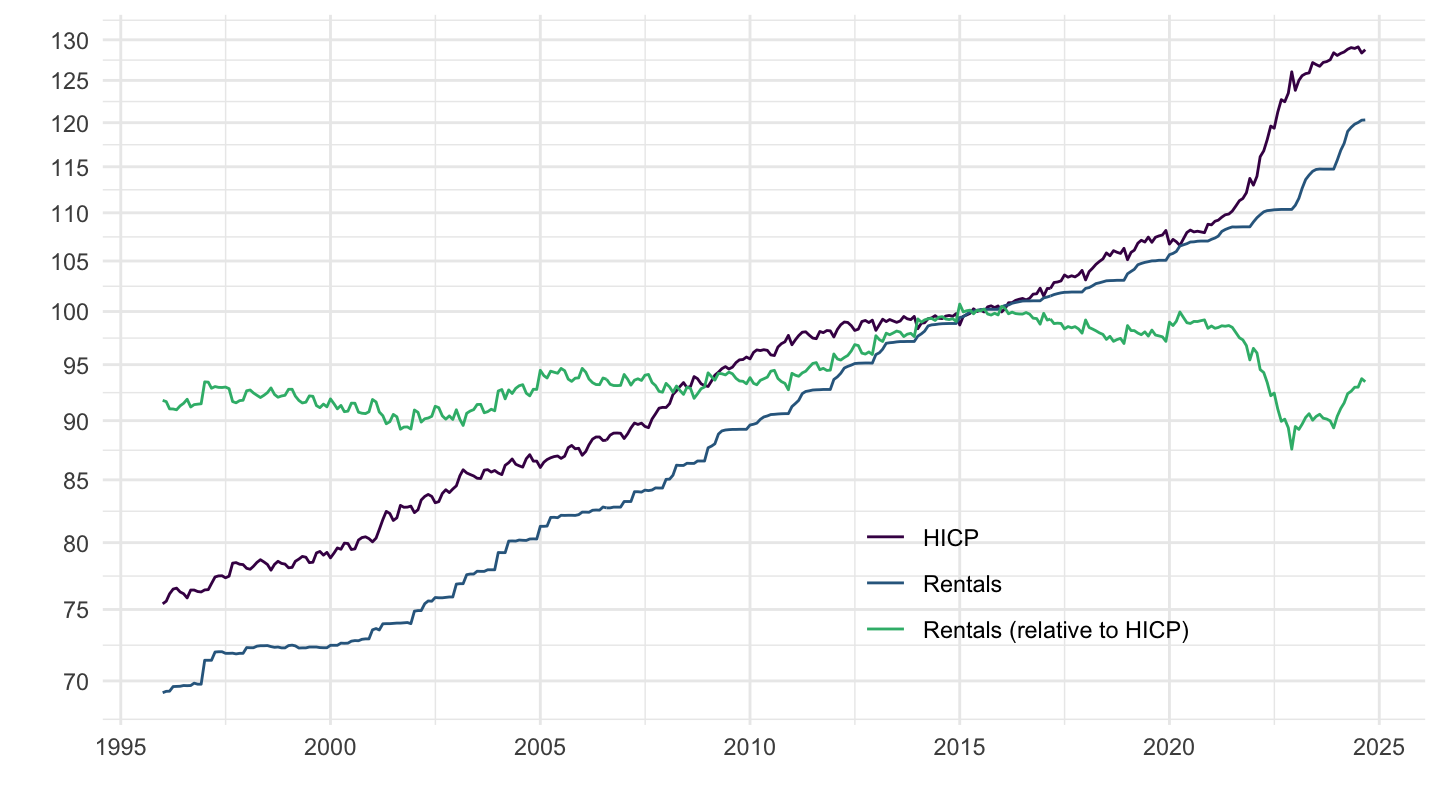
Iceland
All
Code
prc_hicp_midx %>%
filter(unit == "I15",
coicop %in% c("CP00", "CP041"),
geo == "IS") %>%
month_to_date %>%
select(date, coicop, values) %>%
spread(coicop, values) %>%
mutate(`CP041/CP00` = 100*CP041/CP00) %>%
gather(coicop, values, -date) %>%
left_join(tibble(coicop = c("CP041/CP00", "CP041", "CP00"),
Coicop = c("Rentals (relative to HICP)",
"Rentals",
"HICP")), by = "coicop") %>%
ggplot(.) + geom_line(aes(x = date, y = values, color = Coicop)) +
theme_minimal() + xlab("") + ylab("") +
scale_x_date(breaks = seq(1960, 2100, 5) %>% paste0("-01-01") %>% as.Date,
labels = date_format("%Y")) +
scale_y_log10(breaks = seq(0, 200, 5)) +
scale_color_manual(values = viridis(4)[1:3]) +
theme(legend.position = c(0.7, 0.2),
legend.title = element_blank())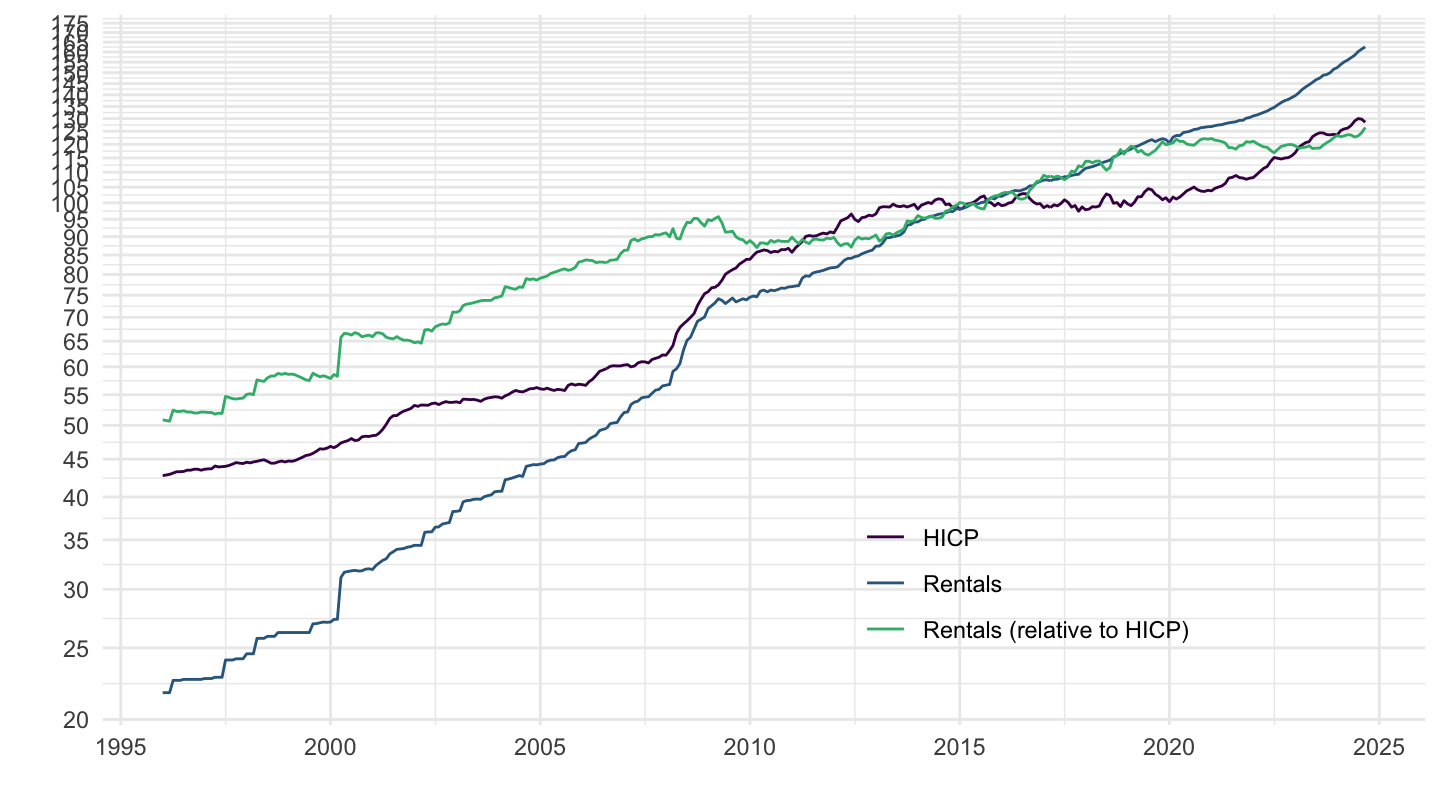
2005-2015
Code
prc_hicp_midx %>%
filter(unit == "I15",
coicop %in% c("CP00", "CP041"),
geo == "IS") %>%
month_to_date %>%
filter(date >= as.Date("2005-01-01"),
date <= as.Date("2015-01-01")) %>%
select(date, coicop, values) %>%
spread(coicop, values) %>%
mutate(`CP041/CP00` = 100*CP041/CP00) %>%
gather(coicop, values, -date) %>%
left_join(tibble(coicop = c("CP041/CP00", "CP041", "CP00"),
Coicop = c("Rentals (relative to HICP)",
"Rentals",
"HICP")), by = "coicop") %>%
ggplot(.) + geom_line(aes(x = date, y = values, color = Coicop)) +
theme_minimal() + xlab("") + ylab("") +
scale_x_date(breaks = seq(1960, 2100, 2) %>% paste0("-01-01") %>% as.Date,
labels = date_format("%Y")) +
scale_y_log10(breaks = seq(0, 200, 5)) +
scale_color_manual(values = viridis(4)[1:3]) +
theme(legend.position = c(0.7, 0.2),
legend.title = element_blank())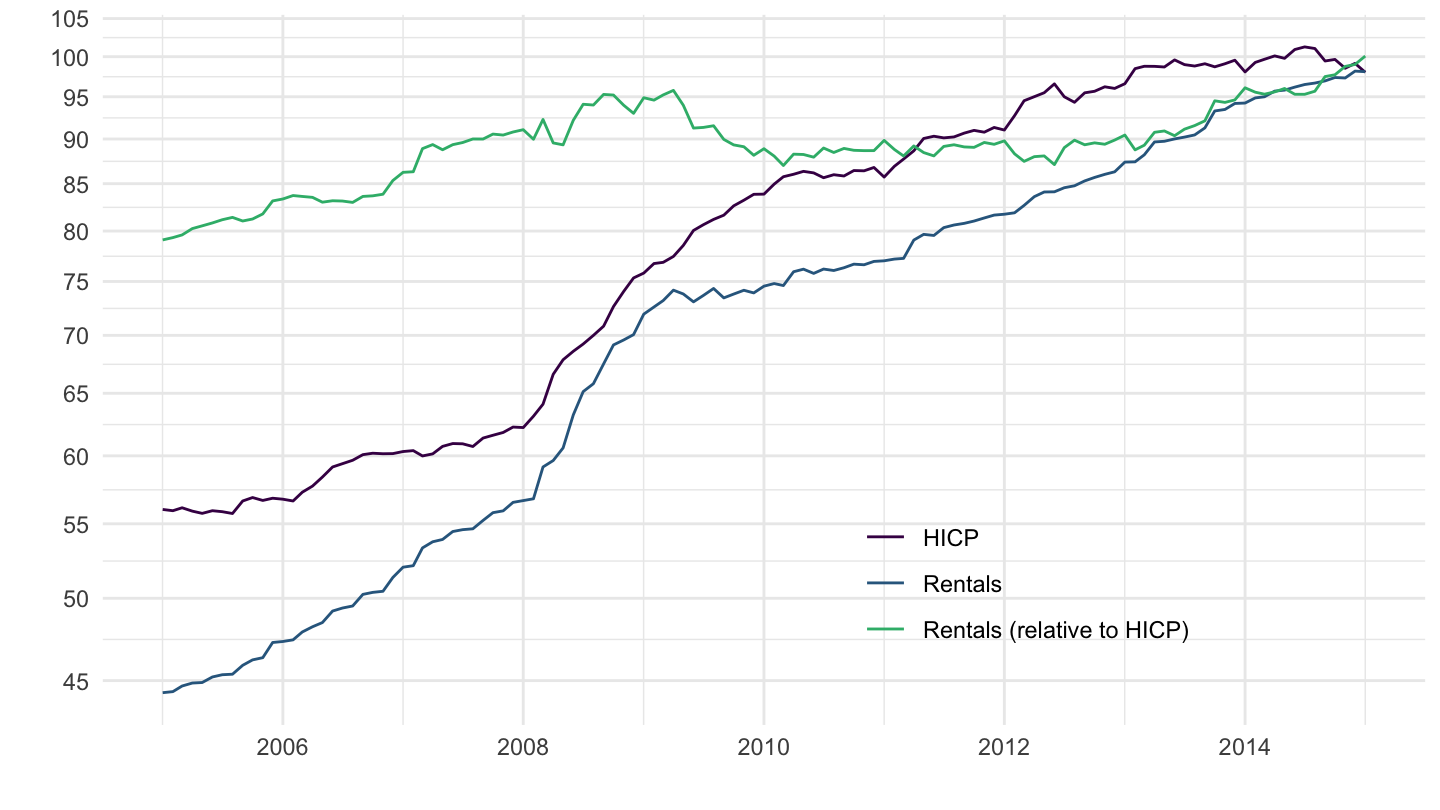
Ireland
Code
prc_hicp_midx %>%
filter(unit == "I15",
coicop %in% c("CP00", "CP041"),
geo == "IE") %>%
month_to_date %>%
select(date, coicop, values) %>%
spread(coicop, values) %>%
mutate(`CP041/CP00` = 100*CP041/CP00) %>%
gather(coicop, values, -date) %>%
left_join(tibble(coicop = c("CP041/CP00", "CP041", "CP00"),
Coicop = c("Rentals (relative to HICP)",
"Rentals",
"HICP")), by = "coicop") %>%
ggplot(.) + geom_line(aes(x = date, y = values, color = Coicop)) +
theme_minimal() + xlab("") + ylab("") +
scale_x_date(breaks = seq(1960, 2100, 5) %>% paste0("-01-01") %>% as.Date,
labels = date_format("%Y")) +
scale_y_log10(breaks = seq(0, 200, 5)) +
scale_color_manual(values = viridis(4)[1:3]) +
theme(legend.position = c(0.7, 0.2),
legend.title = element_blank())
Latvia
Code
prc_hicp_midx %>%
filter(unit == "I15",
coicop %in% c("CP00", "CP041"),
geo == "LV") %>%
month_to_date %>%
select(date, coicop, values) %>%
spread(coicop, values) %>%
mutate(`CP041/CP00` = 100*CP041/CP00) %>%
gather(coicop, values, -date) %>%
left_join(tibble(coicop = c("CP041/CP00", "CP041", "CP00"),
Coicop = c("Rentals (relative to HICP)",
"Rentals",
"HICP")), by = "coicop") %>%
ggplot(.) + geom_line(aes(x = date, y = values, color = Coicop)) +
theme_minimal() + xlab("") + ylab("") +
scale_x_date(breaks = seq(1960, 2100, 5) %>% paste0("-01-01") %>% as.Date,
labels = date_format("%Y")) +
scale_y_log10(breaks = seq(0, 200, 5)) +
scale_color_manual(values = viridis(4)[1:3]) +
theme(legend.position = c(0.7, 0.2),
legend.title = element_blank())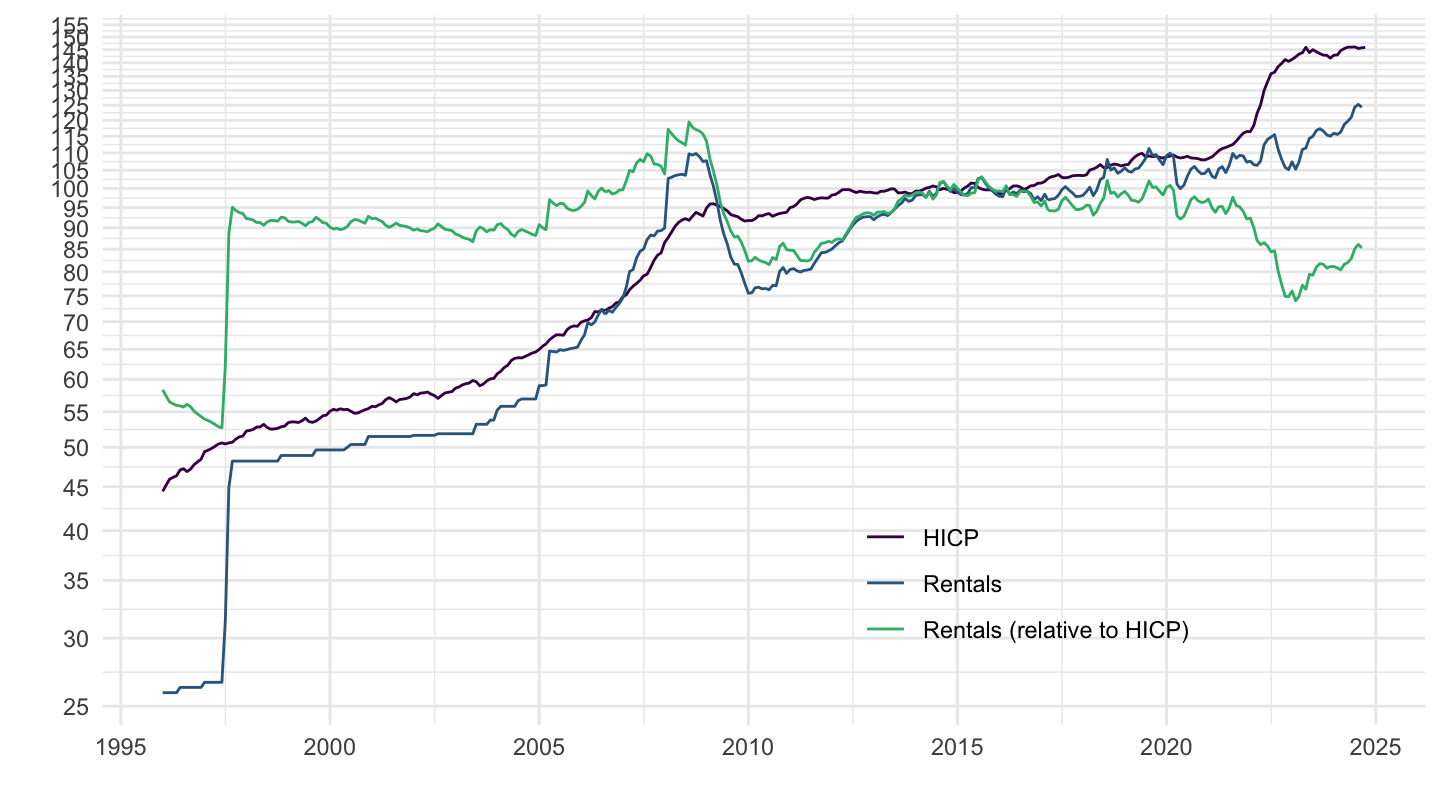
Lithuania
Code
prc_hicp_midx %>%
filter(unit == "I15",
coicop %in% c("CP00", "CP041"),
geo == "LT") %>%
month_to_date %>%
select(date, coicop, values) %>%
spread(coicop, values) %>%
mutate(`CP041/CP00` = 100*CP041/CP00) %>%
gather(coicop, values, -date) %>%
left_join(tibble(coicop = c("CP041/CP00", "CP041", "CP00"),
Coicop = c("Rentals (relative to HICP)",
"Rentals",
"HICP")), by = "coicop") %>%
ggplot(.) + geom_line(aes(x = date, y = values, color = Coicop)) +
theme_minimal() + xlab("") + ylab("") +
scale_x_date(breaks = seq(1960, 2100, 5) %>% paste0("-01-01") %>% as.Date,
labels = date_format("%Y")) +
scale_y_log10(breaks = seq(0, 200, 5)) +
scale_color_manual(values = viridis(4)[1:3]) +
theme(legend.position = c(0.7, 0.2),
legend.title = element_blank())
Estonia
Code
prc_hicp_midx %>%
filter(unit == "I15",
coicop %in% c("CP00", "CP041"),
geo == "EE") %>%
month_to_date %>%
select(date, coicop, values) %>%
spread(coicop, values) %>%
mutate(`CP041/CP00` = 100*CP041/CP00) %>%
gather(coicop, values, -date) %>%
left_join(tibble(coicop = c("CP041/CP00", "CP041", "CP00"),
Coicop = c("Rentals (relative to HICP)",
"Rentals",
"HICP")), by = "coicop") %>%
ggplot(.) + geom_line(aes(x = date, y = values, color = Coicop)) +
theme_minimal() + xlab("") + ylab("") +
scale_x_date(breaks = seq(1960, 2100, 5) %>% paste0("-01-01") %>% as.Date,
labels = date_format("%Y")) +
scale_y_log10(breaks = seq(0, 200, 5)) +
scale_color_manual(values = viridis(4)[1:3]) +
theme(legend.position = c(0.7, 0.2),
legend.title = element_blank())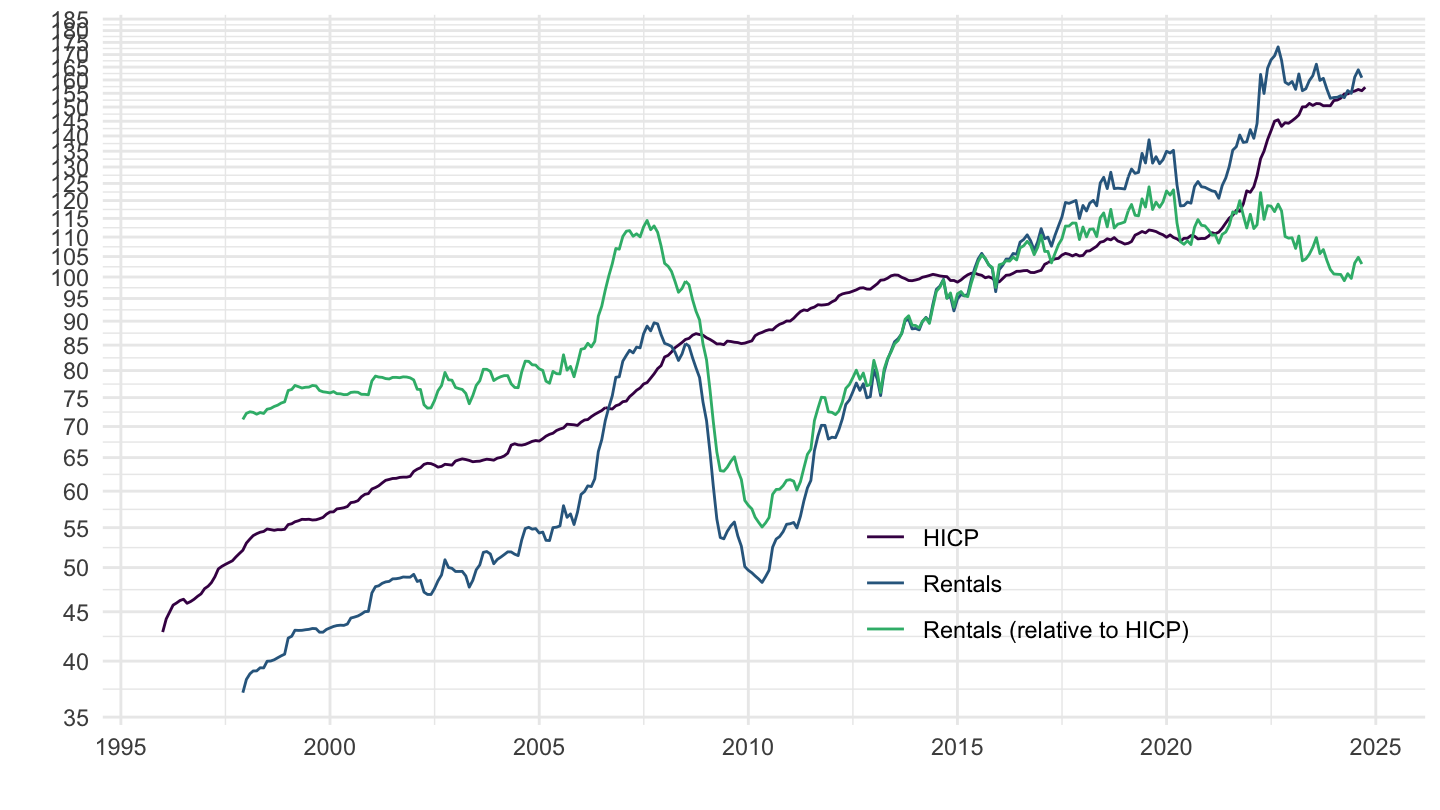
Real Rentals for Housing
Table
Code
prc_hicp_midx %>%
filter(unit == "I15",
coicop %in% c("CP041", "CP00"),
time %in% c("2000M10", "2005M10", "2010M10", "2015M10", "2020M10")) %>%
select(geo, Geo, coicop, time, values) %>%
spread(coicop, values) %>%
mutate(values = 100*CP041/CP00) %>%
select(geo, Geo, time, values) %>%
spread(time, values) %>%
mutate(Geo = ifelse(geo == "DE", "Germany", Geo)) %>%
mutate(Flag = gsub(" ", "-", str_to_lower(Geo)),
Flag = paste0('<img src="../../bib/flags/vsmall/', Flag, '.png" alt="Flag">')) %>%
select(Flag, everything()) %>%
{if (is_html_output()) datatable(., filter = 'top', rownames = F, escape = F) else .}Spain, Greece, Italy, Portugal
Code
prc_hicp_midx %>%
filter(unit == "I15",
coicop %in% c("CP041", "CP00"),
geo %in% c("ES", "PT", "IT", "EL")) %>%
select(geo, Geo, coicop, time, values) %>%
spread(coicop, values) %>%
mutate(values = 100*CP041/CP00) %>%
month_to_date %>%
group_by(Geo) %>%
mutate(values = 100*values/values[date == as.Date("1996-01-01")]) %>%
ggplot(.) + geom_line(aes(x = date, y = values, color = Geo)) +
theme_minimal() + xlab("") + ylab("") +
scale_x_date(breaks = seq(1960, 2100, 5) %>% paste0("-01-01") %>% as.Date,
labels = date_format("%Y")) + add_flags +
scale_y_log10(breaks = seq(0, 200, 10)) +
scale_color_manual(values = c("#0D5EAF", "#009246", "#FF0000", "#FFC400")) +
theme(legend.position = "none")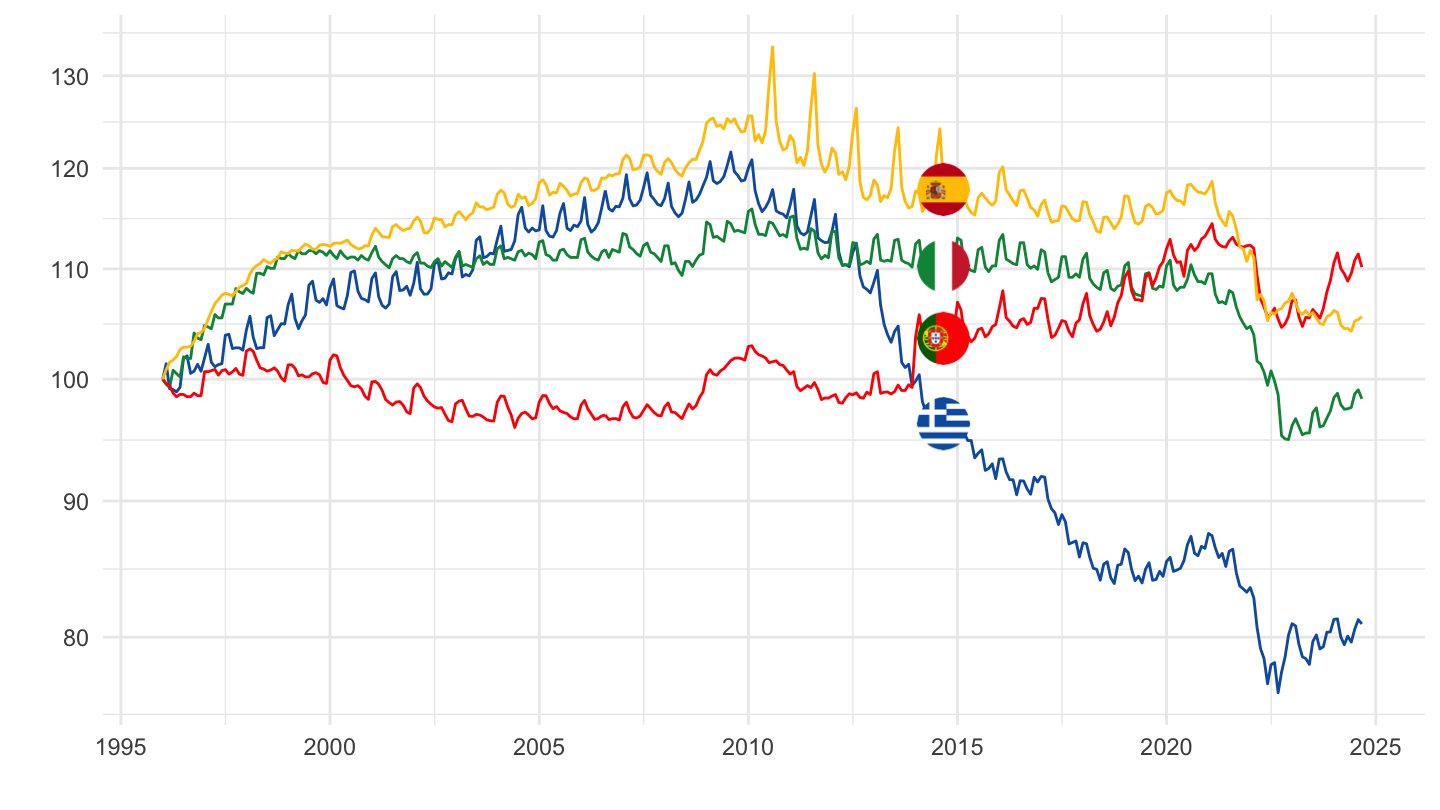
France, Germany, Italy, Greece
All
Code
prc_hicp_midx %>%
filter(unit == "I15",
coicop %in% c("CP041", "CP00"),
geo %in% c("FR", "DE", "IT", "EL")) %>%
select(geo, Geo, coicop, time, values) %>%
spread(coicop, values) %>%
mutate(values = 100*CP041/CP00) %>%
month_to_date %>%
add_colors %>%
ggplot(.) + geom_line(aes(x = date, y = values, color = color)) + add_flags +
theme_minimal() + xlab("") + ylab("100 = Janv. 2010") + scale_color_identity() +
scale_x_date(breaks = seq(1960, 2100, 2) %>% paste0("-01-01") %>% as.Date,
labels = date_format("%Y")) +
scale_y_log10(breaks = seq(0, 400, 10))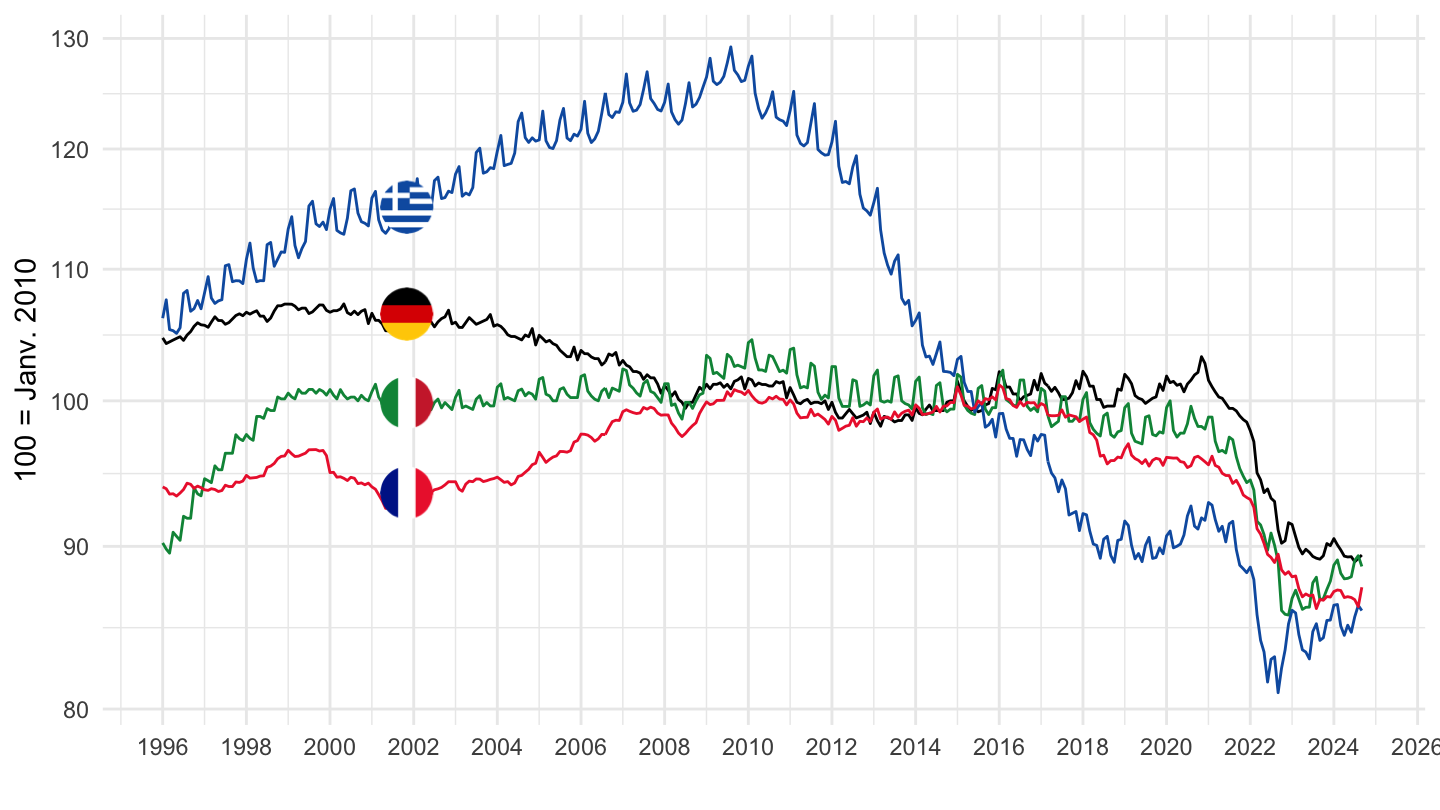
Flags
Code
prc_hicp_midx %>%
filter(unit == "I15",
coicop %in% c("CP041", "CP00"),
geo %in% c("FR", "DE", "IT", "EL")) %>%
select(geo, Geo, coicop, time, values) %>%
spread(coicop, values) %>%
mutate(values = 100*CP041/CP00) %>%
month_to_date %>%
add_colors %>%
ggplot(.) + geom_line(aes(x = date, y = values, color = color)) + add_flags +
theme_minimal() + xlab("") + ylab("100 = Janv. 2010") + scale_color_identity() +
scale_x_date(breaks = seq(1960, 2100, 2) %>% paste0("-01-01") %>% as.Date,
labels = date_format("%Y")) +
scale_y_log10(breaks = seq(0, 400, 10))
Austria, Belgium, Cyprus, Switzerland
Code
prc_hicp_midx %>%
filter(unit == "I15",
coicop %in% c("CP041", "CP00"),
geo %in% c("AT", "BE", "CY", "CH")) %>%
select(geo, Geo, coicop, time, values) %>%
spread(coicop, values) %>%
mutate(values = 100*CP041/CP00) %>%
month_to_date %>%
add_colors %>%
ggplot(.) + geom_line(aes(x = date, y = values, color = color)) + add_flags +
theme_minimal() + xlab("") + ylab("100 = Janv. 2010") + scale_color_identity() +
scale_x_date(breaks = seq(1960, 2100, 2) %>% paste0("-01-01") %>% as.Date,
labels = date_format("%Y")) +
scale_y_log10(breaks = seq(0, 400, 10))
Czechia, Bulgaria, Hungary
Code
prc_hicp_midx %>%
filter(unit == "I15",
coicop %in% c("CP041", "CP00"),
geo %in% c("CZ", "BG", "HU")) %>%
select(geo, Geo, coicop, time, values) %>%
spread(coicop, values) %>%
mutate(values = 100*CP041/CP00) %>%
month_to_date %>%
add_colors %>%
ggplot(.) + geom_line(aes(x = date, y = values, color = color)) + add_flags +
theme_minimal() + xlab("") + ylab("100 = Janv. 2010") + scale_color_identity() +
scale_x_date(breaks = seq(1960, 2100, 2) %>% paste0("-01-01") %>% as.Date,
labels = date_format("%Y")) +
scale_y_log10(breaks = seq(0, 400, 10))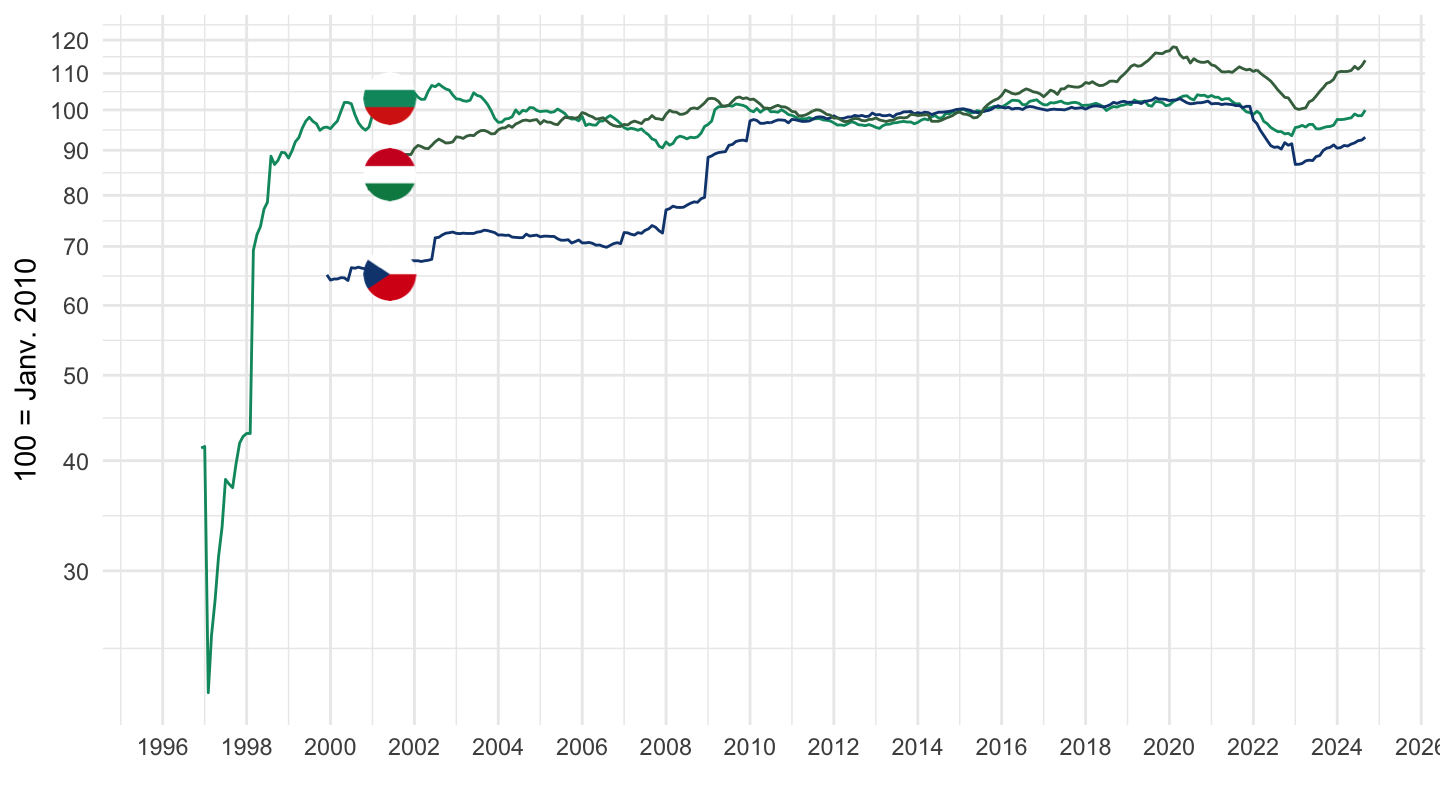
Eurozone, Switzerland, Iceland
Code
prc_hicp_midx %>%
filter(unit == "I15",
coicop %in% c("CP041", "CP00"),
geo %in% c("EA", "CH", "IS")) %>%
select(-Geo) %>%
left_join(tibble(geo = c("EA", "CH", "IS"),
Geo = c("Europe",
"Switzerland",
"Iceland")),
by = "geo") %>%
select(geo, Geo, coicop, time, values) %>%
spread(coicop, values) %>%
mutate(values = 100*CP041/CP00) %>%
month_to_date %>%
add_colors %>%
ggplot(.) + geom_line(aes(x = date, y = values, color = color)) + add_flags +
theme_minimal() + xlab("") + ylab("100 = Janv. 2010") + scale_color_identity() +
scale_x_date(breaks = seq(1960, 2100, 2) %>% paste0("-01-01") %>% as.Date,
labels = date_format("%Y")) +
scale_y_log10(breaks = seq(0, 400, 10))
Euro area
Value
Code
prc_hicp_midx %>%
filter(unit == "I15",
coicop %in% c("CP041", "CP00"),
geo %in% c("EA", "EA18", "EA19")) %>%
select(-Geo) %>%
left_join(tibble(geo = c("EA", "EA18", "EA19"),
Geo = c("Euro area (time-dep geography)",
"Euro area (18 countries)",
"Euro area (19 countries)")),
by = "geo") %>%
select(geo, Geo, coicop, time, values) %>%
spread(coicop, values) %>%
mutate(values = 100*CP041/CP00) %>%
month_to_date %>%
ggplot(.) + geom_line(aes(x = date, y = values, color = Geo)) +
theme_minimal() + xlab("") + ylab("") +
scale_x_date(breaks = seq(1960, 2100, 5) %>% paste0("-01-01") %>% as.Date,
labels = date_format("%Y")) +
scale_y_log10(breaks = seq(0, 200, 2)) +
theme(legend.position = c(0.5, 0.85),
legend.title = element_blank())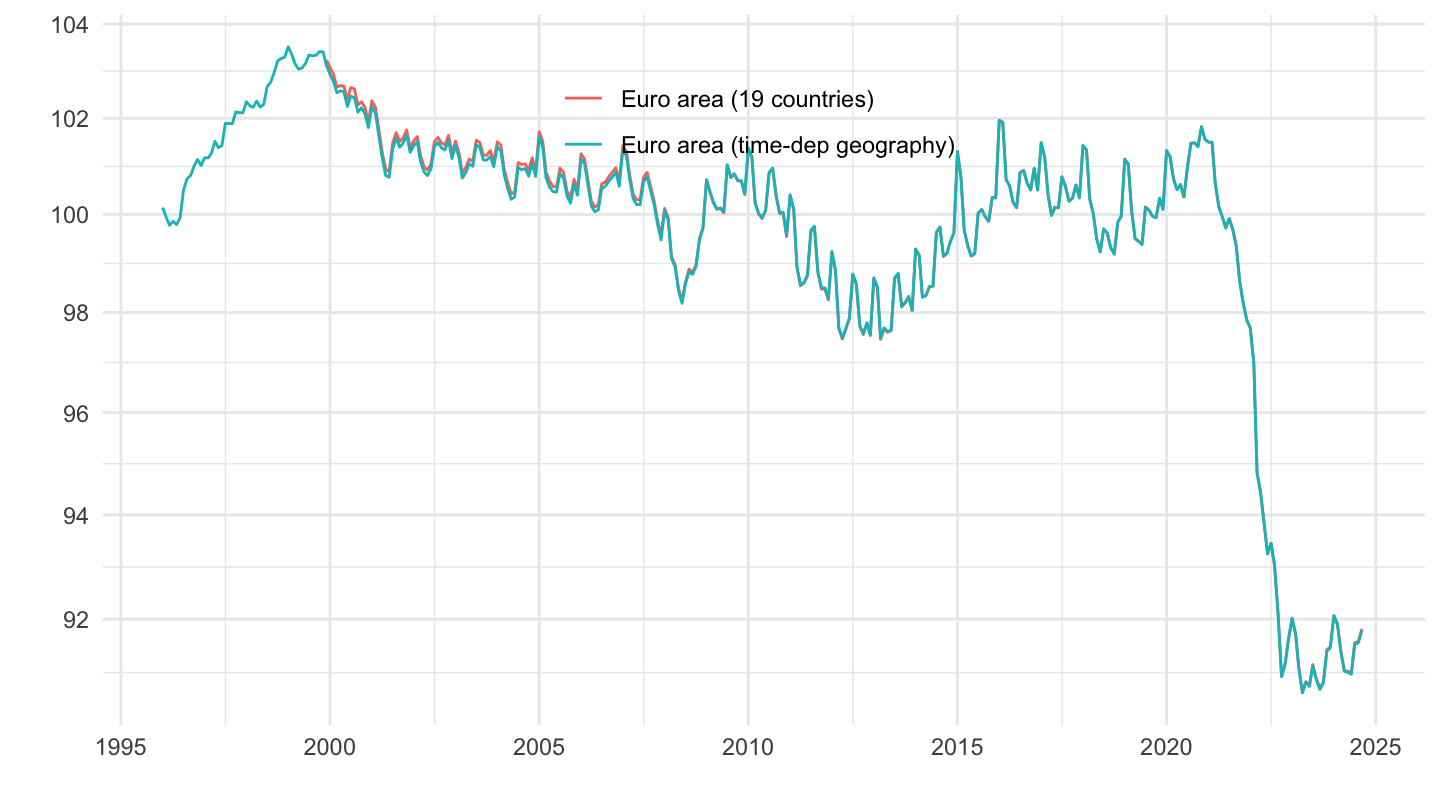
Log Value
Code
prc_hicp_midx %>%
filter(unit == "I15",
coicop %in% c("CP041", "CP00"),
geo %in% c("EA", "EA18", "EA19")) %>%
select(-Geo) %>%
left_join(tibble(geo = c("EA", "EA18", "EA19"),
Geo = c("Euro area (time-dep geography)",
"Euro area (18 countries)",
"Euro area (19 countries)")),
by = "geo") %>%
select(geo, Geo, coicop, time, values) %>%
spread(coicop, values) %>%
mutate(CP041_CP00 = log(CP041/CP00)) %>%
month_to_date %>%
group_by(Geo) %>%
ggplot(.) + geom_line(aes(x = date, y = CP041_CP00, color = Geo)) +
theme_minimal() + xlab("") + ylab("") +
scale_x_date(breaks = seq(1960, 2100, 5) %>% paste0("-01-01") %>% as.Date,
labels = date_format("%Y")) +
scale_y_continuous(breaks = 0.01*seq(-20, 20, 2),
labels = percent_format(acc = 1)) +
theme(legend.position = c(0.5, 0.85),
legend.title = element_blank())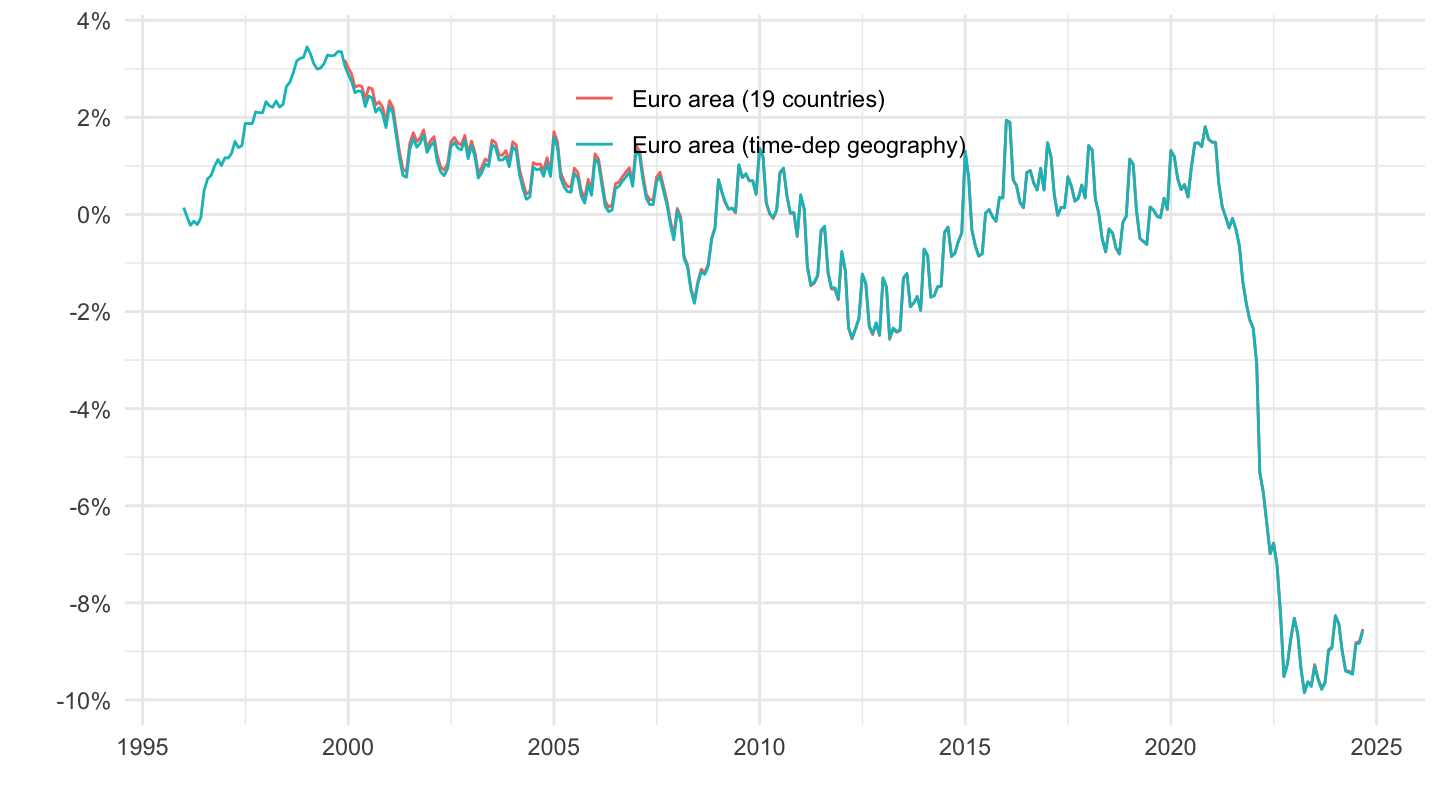
Inflation
Code
prc_hicp_midx %>%
filter(unit == "I15",
coicop %in% c("CP041", "CP00"),
geo %in% c("EA", "EA18", "EA19")) %>%
select(-Geo) %>%
left_join(tibble(geo = c("EA", "EA18", "EA19"),
Geo = c("Euro area (time-dep geography)",
"Euro area (18 countries)",
"Euro area (19 countries)")),
by = "geo") %>%
select(geo, Geo, coicop, time, values) %>%
spread(coicop, values) %>%
mutate(CP041_CP00 = 100*CP041/CP00) %>%
month_to_date %>%
group_by(Geo) %>%
mutate(CP041_CP00_d1ln12 = log(CP041_CP00) - lag(log(CP041_CP00), 12)) %>%
ggplot(.) + geom_line(aes(x = date, y = CP041_CP00_d1ln12, color = Geo)) +
theme_minimal() + xlab("") + ylab("") +
scale_x_date(breaks = seq(1960, 2100, 5) %>% paste0("-01-01") %>% as.Date,
labels = date_format("%Y")) +
scale_y_continuous(breaks = 0.01*seq(-20, 20, 2),
labels = percent_format(acc = 1)) +
theme(legend.position = c(0.5, 0.85),
legend.title = element_blank())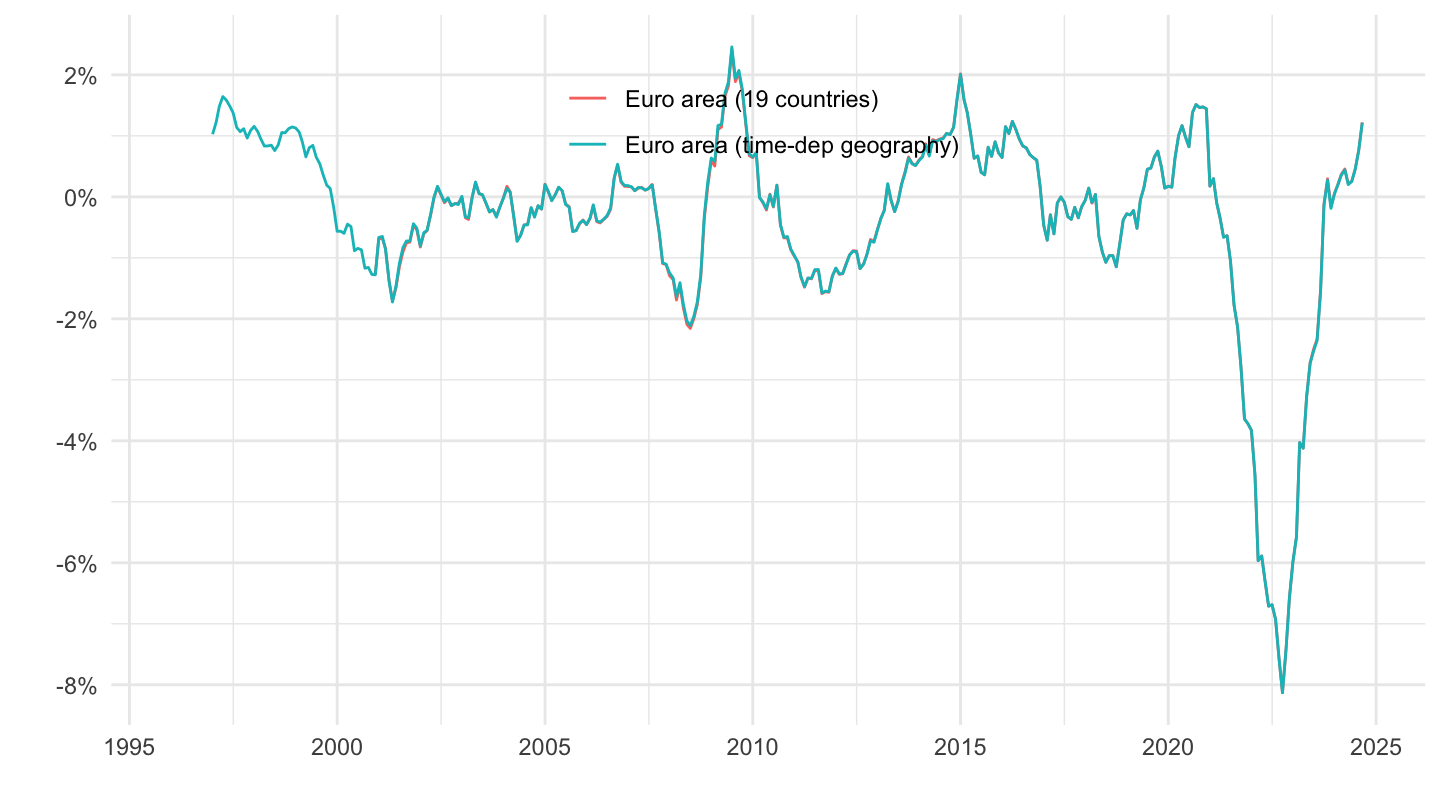
Germany, Europe
Code
prc_hicp_midx %>%
filter(unit == "I15",
coicop %in% c("CP041", "CP00"),
geo %in% c("DE", "EA", "EA18", "EA19")) %>%
select(geo, Geo, coicop, time, values) %>%
spread(coicop, values) %>%
mutate(values = 100*CP041/CP00) %>%
month_to_date %>%
ggplot(.) + geom_line(aes(x = date, y = values, color = Geo)) +
theme_minimal() + xlab("") + ylab("") +
scale_x_date(breaks = seq(1960, 2100, 5) %>% paste0("-01-01") %>% as.Date,
labels = date_format("%Y")) +
scale_y_log10(breaks = seq(0, 200, 10),
limits = c(70, 125)) +
theme(legend.position = c(0.5, 0.85),
legend.title = element_blank())
Estonia, Greece, Spain, Finland
Code
prc_hicp_midx %>%
filter(unit == "I15",
coicop %in% c("CP041", "CP00"),
geo %in% c("EE", "EL", "ES", "FI")) %>%
select(geo, Geo, coicop, time, values) %>%
spread(coicop, values) %>%
mutate(values = 100*CP041/CP00) %>%
month_to_date %>%
add_colors %>%
ggplot(.) + geom_line(aes(x = date, y = values, color = color)) + add_flags +
theme_minimal() + xlab("") + ylab("100 = Janv. 2010") + scale_color_identity() +
scale_x_date(breaks = seq(1960, 2100, 2) %>% paste0("-01-01") %>% as.Date,
labels = date_format("%Y")) +
scale_y_log10(breaks = seq(0, 400, 10))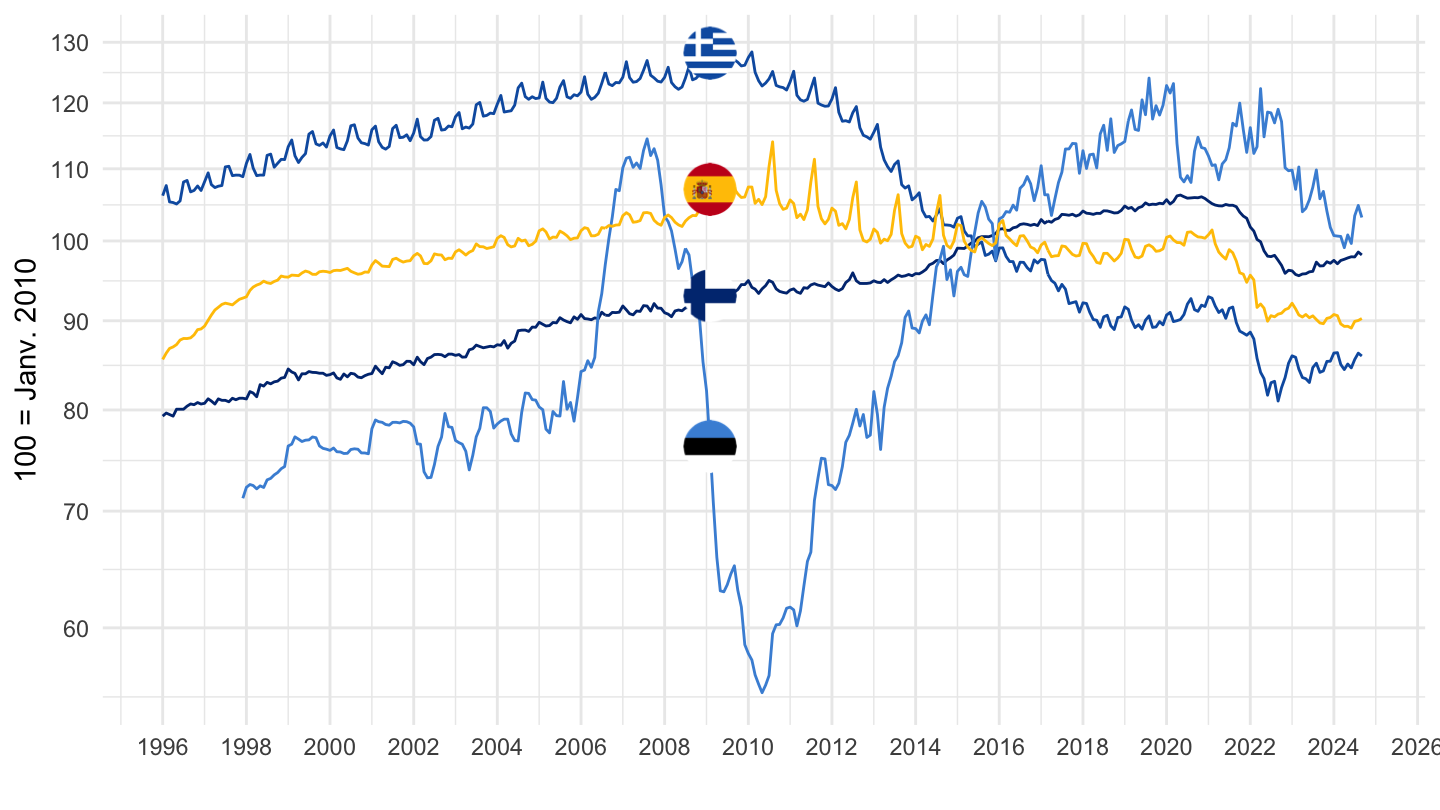
Croatia, Iceland, Ireland, Lithunia
Code
prc_hicp_midx %>%
filter(unit == "I15",
coicop %in% c("CP041", "CP00"),
geo %in% c("HR", "IE", "IS", "LT")) %>%
select(geo, Geo, coicop, time, values) %>%
spread(coicop, values) %>%
mutate(values = 100*CP041/CP00) %>%
month_to_date %>%
add_colors %>%
ggplot(.) + geom_line(aes(x = date, y = values, color = color)) + add_flags +
theme_minimal() + xlab("") + ylab("100 = Janv. 2010") + scale_color_identity() +
scale_x_date(breaks = seq(1960, 2100, 2) %>% paste0("-01-01") %>% as.Date,
labels = date_format("%Y")) +
scale_y_log10(breaks = seq(0, 400, 10))
Latvia, Luxembourg, Malta, North Macedonia
Code
prc_hicp_midx %>%
filter(unit == "I15",
coicop %in% c("CP041", "CP00"),
geo %in% c("LU", "LV", "MK", "MT")) %>%
select(geo, Geo, coicop, time, values) %>%
spread(coicop, values) %>%
mutate(values = 100*CP041/CP00) %>%
month_to_date %>%
add_colors %>%
ggplot(.) + geom_line(aes(x = date, y = values, color = color)) + add_flags +
theme_minimal() + xlab("") + ylab("100 = Janv. 2010") + scale_color_identity() +
scale_x_date(breaks = seq(1960, 2100, 2) %>% paste0("-01-01") %>% as.Date,
labels = date_format("%Y")) +
scale_y_log10(breaks = seq(0, 400, 10))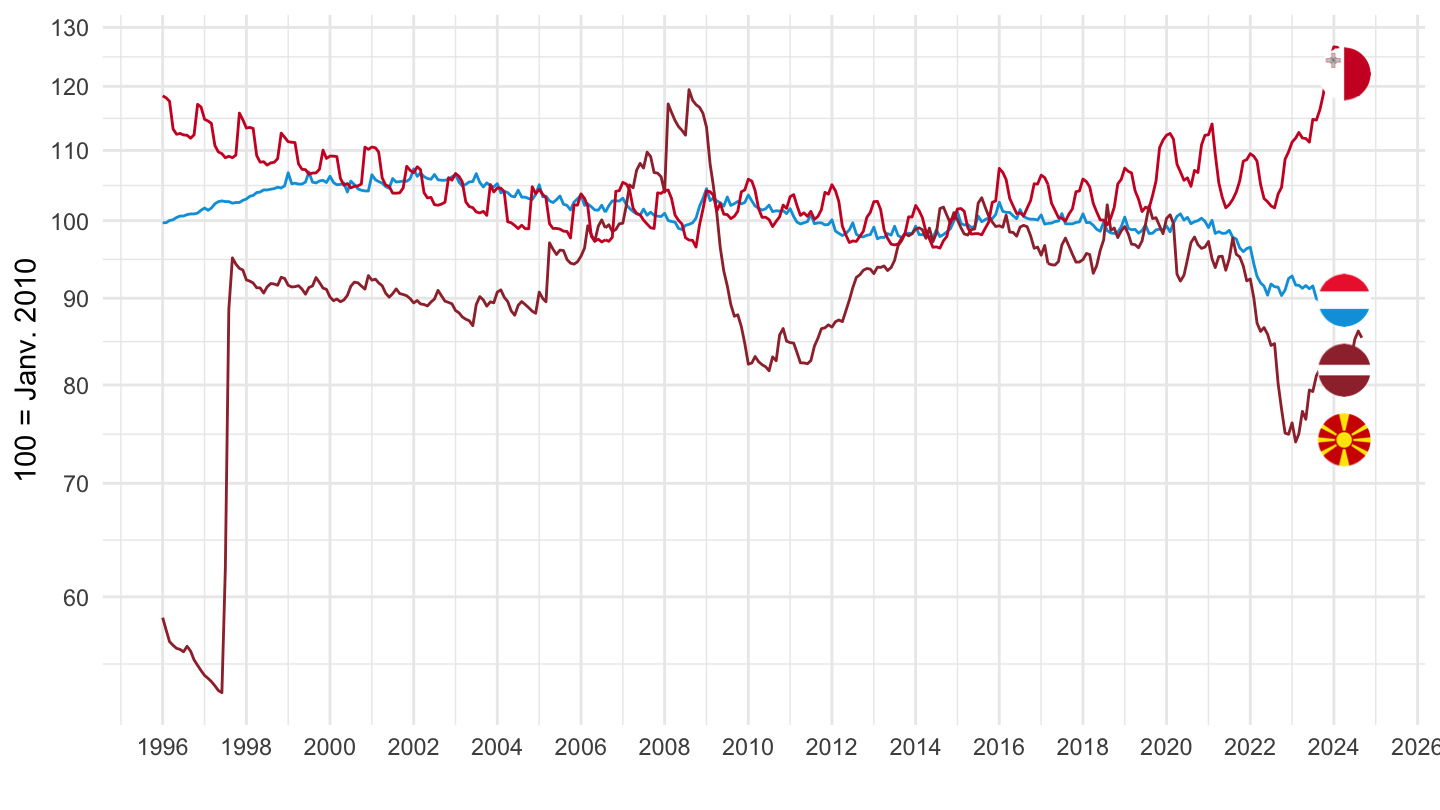
Netherlands, Norway, Portugal, Poland
Code
prc_hicp_midx %>%
filter(unit == "I15",
coicop %in% c("CP041", "CP00"),
geo %in% c("NL", "NO", "PL", "PT")) %>%
select(geo, Geo, coicop, time, values) %>%
spread(coicop, values) %>%
mutate(values = 100*CP041/CP00) %>%
month_to_date %>%
add_colors %>%
ggplot(.) + geom_line(aes(x = date, y = values, color = color)) + add_flags +
theme_minimal() + xlab("") + ylab("100 = Janv. 2010") + scale_color_identity() +
scale_x_date(breaks = seq(1960, 2100, 2) %>% paste0("-01-01") %>% as.Date,
labels = date_format("%Y")) +
scale_y_log10(breaks = seq(0, 400, 10))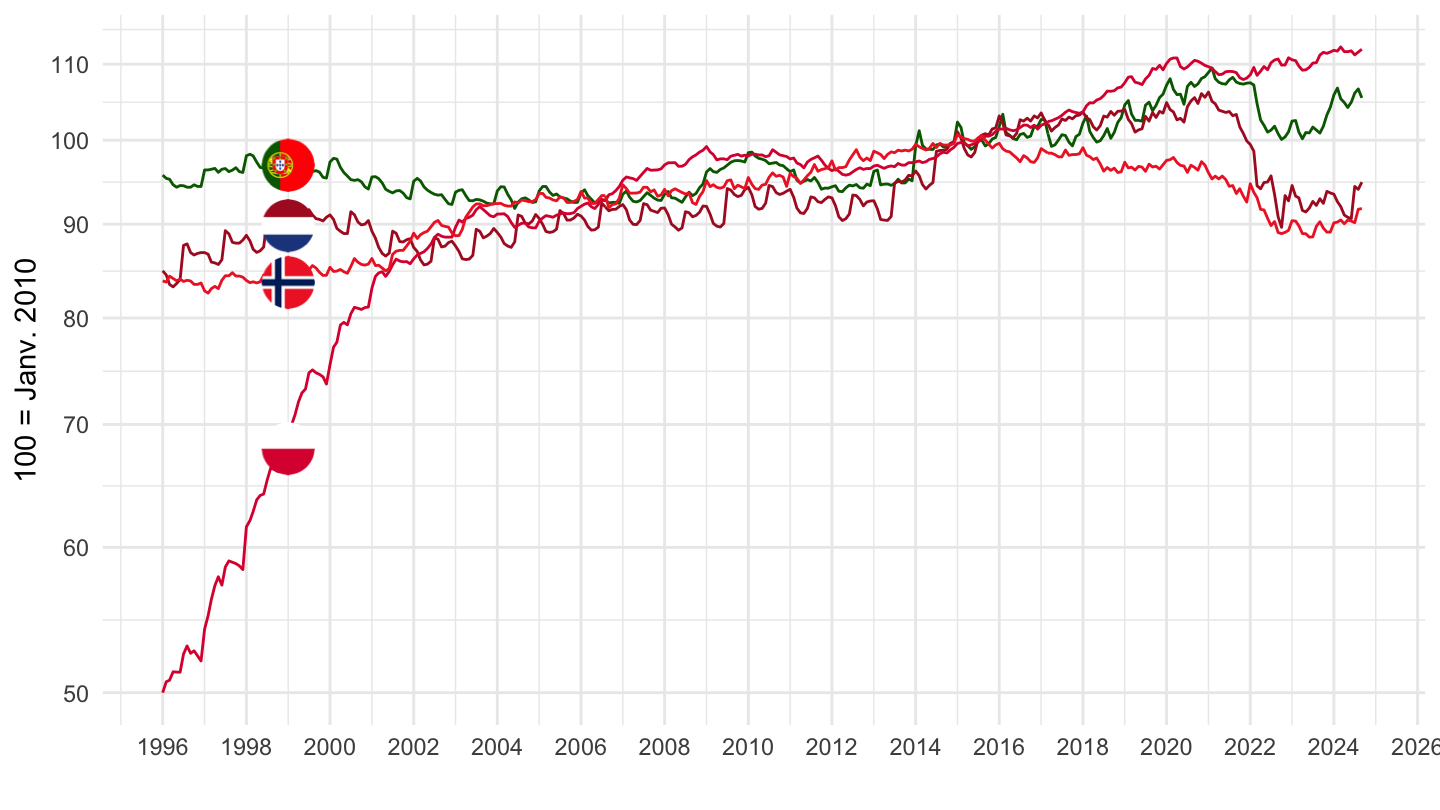
Romania, Serbia, Slovenia, Sweden
Code
prc_hicp_midx %>%
filter(unit == "I15",
coicop %in% c("CP041", "CP00"),
geo %in% c("RO", "RS", "SE", "SI")) %>%
select(geo, Geo, coicop, time, values) %>%
spread(coicop, values) %>%
mutate(values = 100*CP041/CP00) %>%
month_to_date %>%
add_colors %>%
ggplot(.) + geom_line(aes(x = date, y = values, color = color)) + add_flags +
theme_minimal() + xlab("") + ylab("100 = Janv. 2010") + scale_color_identity() +
scale_x_date(breaks = seq(1960, 2100, 2) %>% paste0("-01-01") %>% as.Date,
labels = date_format("%Y")) +
scale_y_log10(breaks = seq(0, 400, 10))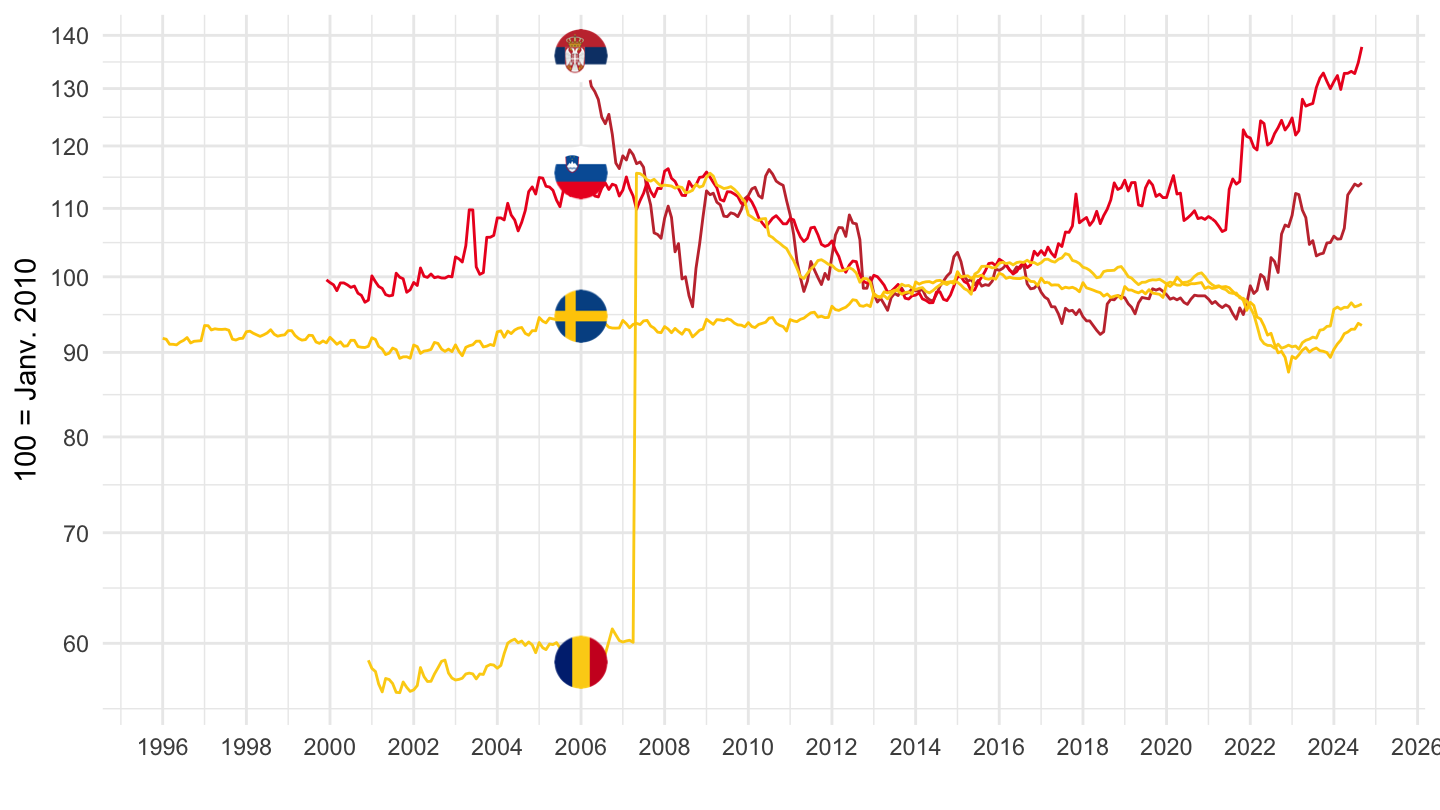
Slovakia, Turkey, United Kingdom
Code
prc_hicp_midx %>%
filter(unit == "I15",
coicop %in% c("CP041", "CP00"),
geo %in% c("SK", "TR", "UK")) %>%
select(geo, Geo, coicop, time, values) %>%
spread(coicop, values) %>%
mutate(values = 100*CP041/CP00) %>%
month_to_date %>%
mutate(Geo = ifelse(geo == "EA", "Europe", Geo),
Geo = ifelse(geo == "TR", "Turkey", Geo)) %>%
add_colors %>%
ggplot(.) + geom_line(aes(x = date, y = values, color = color)) + add_flags +
theme_minimal() + xlab("") + ylab("100 = Janv. 2010") + scale_color_identity() +
scale_x_date(breaks = seq(1960, 2100, 2) %>% paste0("-01-01") %>% as.Date,
labels = date_format("%Y")) +
scale_y_log10(breaks = seq(0, 400, 10))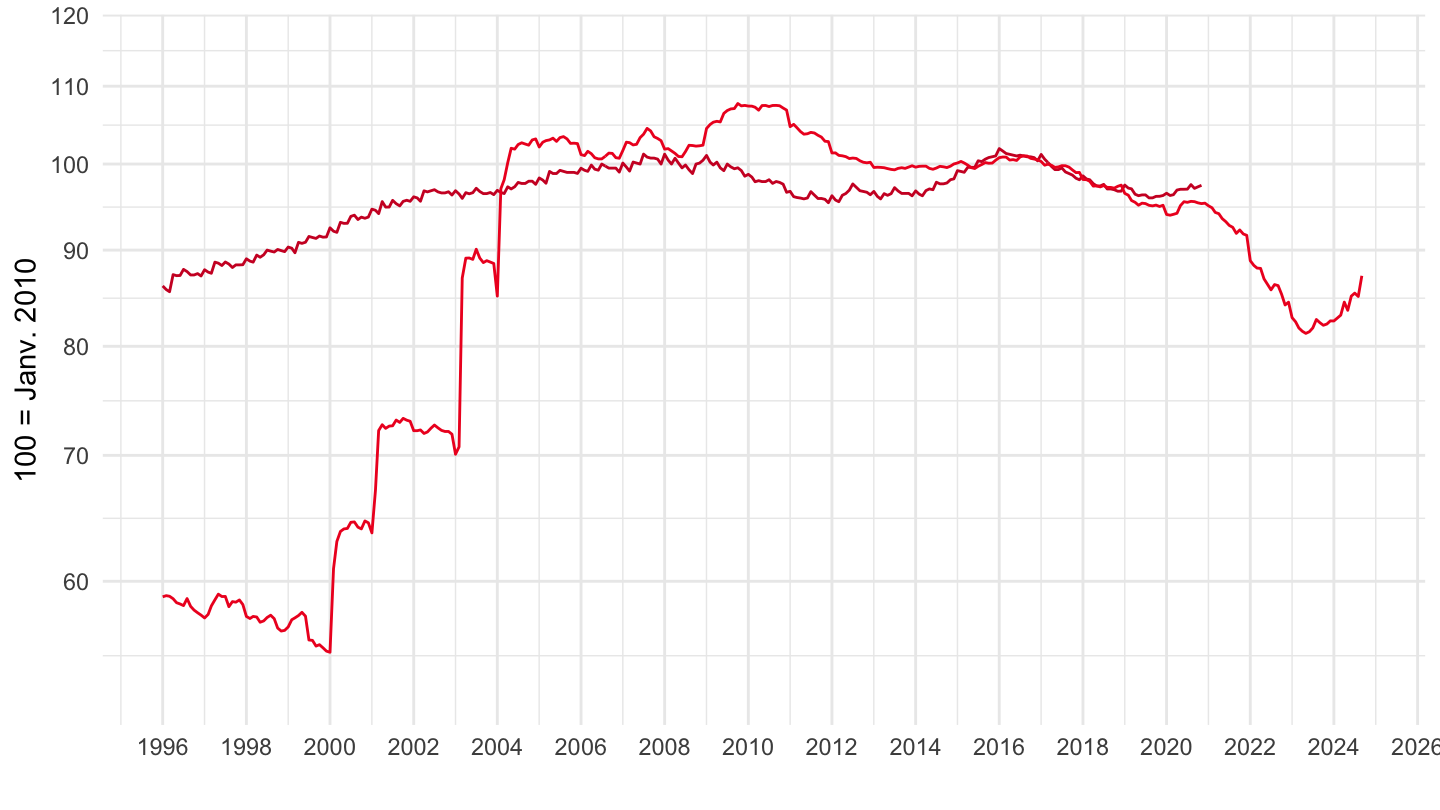
Actual Rentals for Housing
Table
Code
prc_hicp_midx %>%
filter(unit == "I15",
coicop %in% c("CP041"),
time %in% c("2000M10", "2005M10", "2010M10", "2015M10", "2020M10")) %>%
select(geo, Geo, time, values) %>%
spread(time, values) %>%
mutate(Geo = ifelse(geo == "DE", "Germany", Geo)) %>%
mutate(Flag = gsub(" ", "-", str_to_lower(Geo)),
Flag = paste0('<img src="../../bib/flags/vsmall/', Flag, '.png" alt="Flag">')) %>%
select(Flag, everything()) %>%
{if (is_html_output()) datatable(., filter = 'top', rownames = F, escape = F) else .}France, Germany, Italy, Greece
Code
prc_hicp_midx %>%
filter(unit == "I15",
coicop %in% c("CP041"),
geo %in% c("FR", "EL", "ES", "IS", "IT")) %>%
month_to_date %>%
filter(date >= as.Date("2005-01-01")) %>%
add_colors %>%
mutate(color = ifelse(geo == "EE", color2, color)) %>%
ggplot(.) + geom_line(aes(x = date, y = values, color = color)) + add_flags +
theme_minimal() + xlab("") + ylab("100 = Janv. 2010") + scale_color_identity() +
scale_x_date(breaks = seq(1960, 2100, 2) %>% paste0("-01-01") %>% as.Date,
labels = date_format("%Y")) +
scale_y_log10(breaks = seq(0, 400, 10))
Eurozone, Switzerland, Iceland
Code
prc_hicp_midx %>%
filter(unit == "I15",
coicop %in% c("CP041"),
geo %in% c("EA", "CH", "IS")) %>%
select(-Geo) %>%
left_join(tibble(geo = c("EA", "CH", "IS"),
Geo = c("Europe",
"Switzerland",
"Iceland")),
by = "geo") %>%
month_to_date %>%
group_by(geo) %>%
mutate(values = 100*values/values[date == as.Date("2008-01-01")]) %>%
filter(date >= as.Date("2005-01-01")) %>%
add_colors %>%
mutate(color = ifelse(geo == "EE", color2, color)) %>%
ggplot(.) + geom_line(aes(x = date, y = values, color = color)) + add_flags +
theme_minimal() + xlab("") + ylab("100 = Janv. 2010") + scale_color_identity() +
scale_x_date(breaks = seq(1960, 2100, 2) %>% paste0("-01-01") %>% as.Date,
labels = date_format("%Y")) +
scale_y_log10(breaks = seq(0, 400, 20))
Eurozone, Switzerland, Iceland
Code
prc_hicp_midx %>%
filter(unit == "I15",
coicop %in% c("CP041"),
geo %in% c("EA", "CH")) %>%
select(-Geo) %>%
left_join(tibble(geo = c("EA", "CH", "IS"),
Geo = c("Europe",
"Switzerland",
"Iceland")),
by = "geo") %>%
month_to_date %>%
group_by(geo) %>%
mutate(values = 100*values/values[date == as.Date("2008-01-01")]) %>%
filter(date >= as.Date("2005-01-01"),
date <= as.Date("2019-01-01")) %>%
add_colors %>%
mutate(color = ifelse(geo == "EE", color2, color)) %>%
ggplot(.) + geom_line(aes(x = date, y = values, color = color)) + add_flags +
theme_minimal() + xlab("") + ylab("100 = Janv. 2010") + scale_color_identity() +
scale_x_date(breaks = seq(1960, 2100, 2) %>% paste0("-01-01") %>% as.Date,
labels = date_format("%Y")) +
scale_y_log10(breaks = seq(0, 400, 5))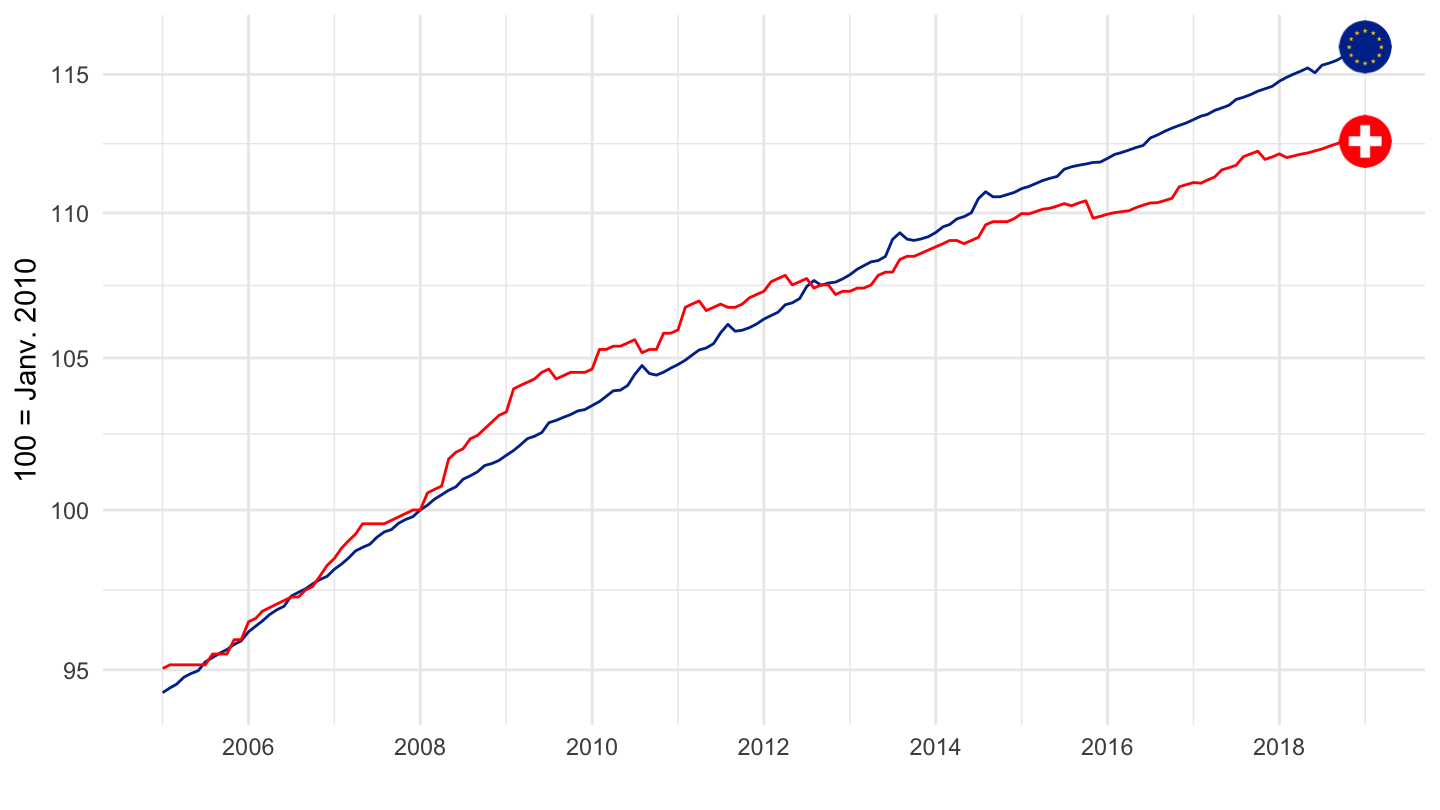
Austria, Belgium, Cyprus, Switzerland
Baseline
Code
prc_hicp_midx %>%
filter(unit == "I15",
coicop %in% c("CP041"),
geo %in% c("AT", "BE", "CY", "CH")) %>%
month_to_date %>%
add_colors %>%
mutate(color = ifelse(geo == "EE", color2, color)) %>%
ggplot(.) + geom_line(aes(x = date, y = values, color = color)) + add_flags +
theme_minimal() + xlab("") + ylab("100 = Janv. 2010") + scale_color_identity() +
scale_x_date(breaks = seq(1960, 2100, 2) %>% paste0("-01-01") %>% as.Date,
labels = date_format("%Y")) +
scale_y_log10(breaks = seq(0, 400, 5))
Czechia, Bulgaria, Hungary
Code
prc_hicp_midx %>%
filter(unit == "I15",
coicop %in% c("CP041"),
geo %in% c("CZ", "BG", "HU")) %>%
month_to_date %>%
add_colors %>%
mutate(color = ifelse(geo == "EE", color2, color)) %>%
ggplot(.) + geom_line(aes(x = date, y = values, color = color)) + add_flags +
theme_minimal() + xlab("") + ylab("100 = Janv. 2010") + scale_color_identity() +
scale_x_date(breaks = seq(1960, 2100, 2) %>% paste0("-01-01") %>% as.Date,
labels = date_format("%Y")) +
scale_y_log10(breaks = seq(0, 400, 5))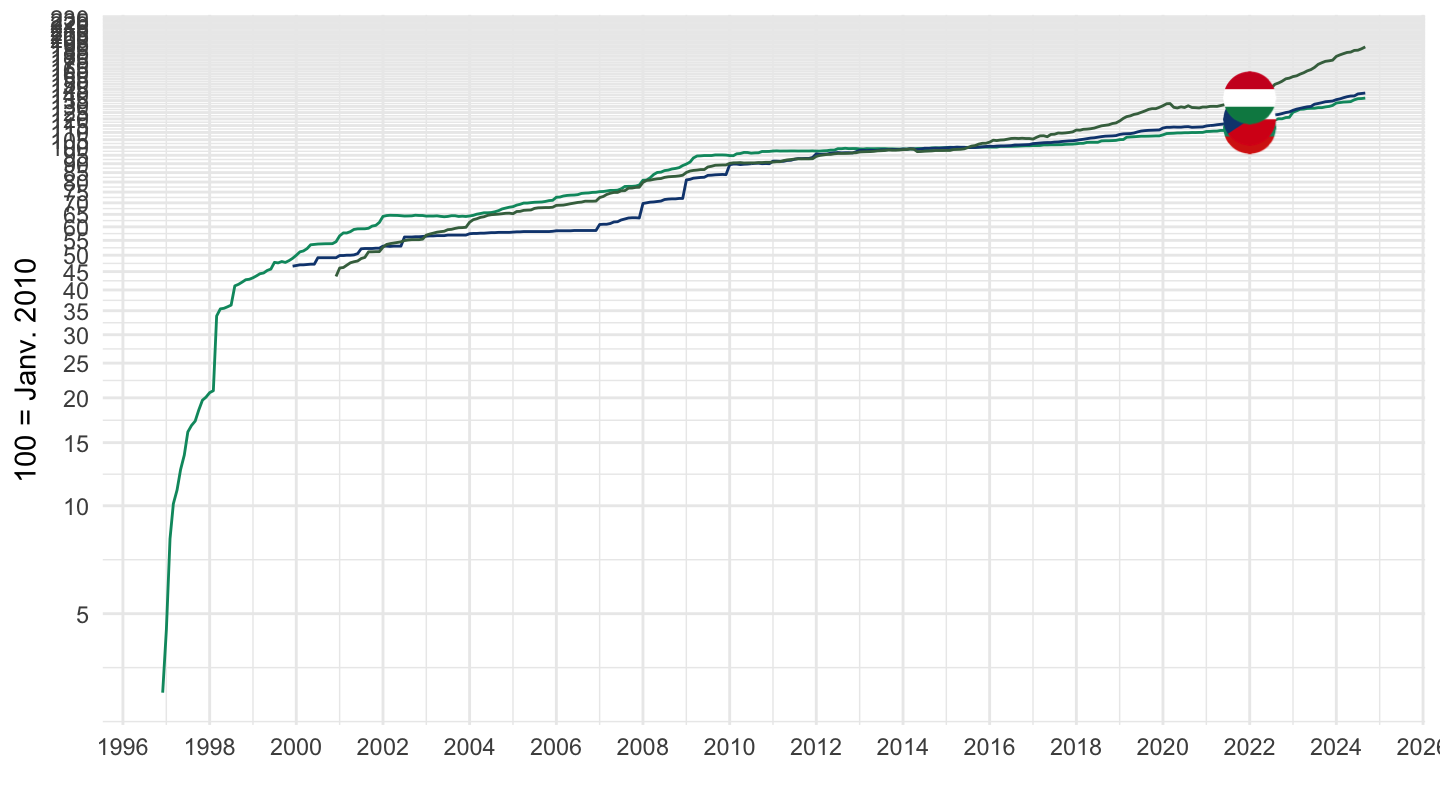
Euro area
Code
prc_hicp_midx %>%
filter(unit == "I15",
coicop %in% c("CP041"),
geo %in% c("EA", "EA18", "EA19")) %>%
month_to_date %>%
ggplot(.) + geom_line(aes(x = date, y = values, color = Geo)) +
theme_minimal() + xlab("") + ylab("") +
scale_x_date(breaks = seq(1960, 2100, 5) %>% paste0("-01-01") %>% as.Date,
labels = date_format("%Y")) +
scale_y_log10(breaks = seq(0, 200, 10),
limits = c(70, 125)) +
theme(legend.position = c(0.5, 0.85),
legend.title = element_blank())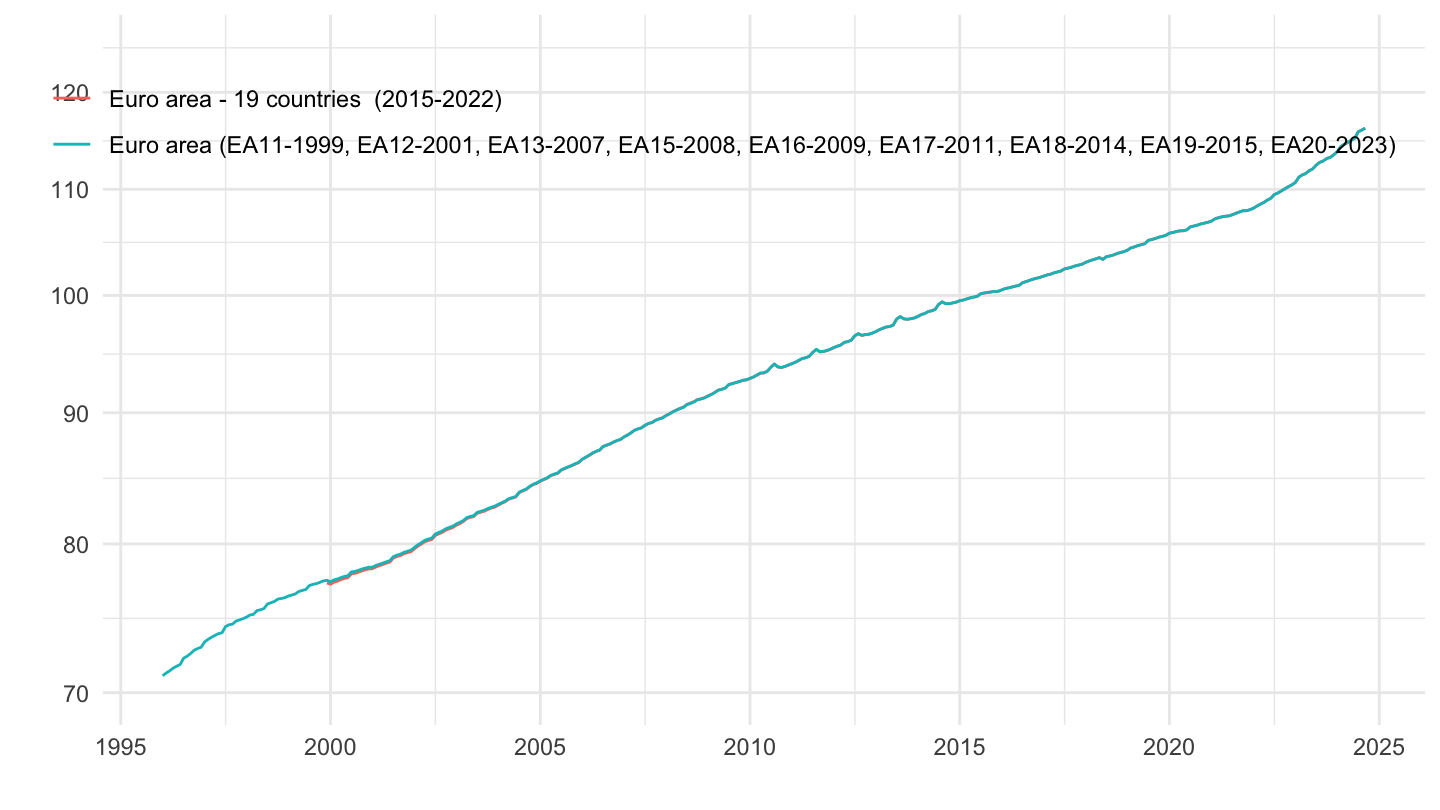
Czechia, Europe
Code
prc_hicp_midx %>%
filter(unit == "I15",
coicop %in% c("CP041"),
geo %in% c("DE", "EA", "EA18", "EA19")) %>%
month_to_date %>%
ggplot(.) + geom_line(aes(x = date, y = values, color = Geo)) +
theme_minimal() + xlab("") + ylab("") +
scale_x_date(breaks = seq(1960, 2100, 5) %>% paste0("-01-01") %>% as.Date,
labels = date_format("%Y")) +
scale_y_log10(breaks = seq(0, 200, 10),
limits = c(70, 125)) +
theme(legend.position = c(0.5, 0.85),
legend.title = element_blank())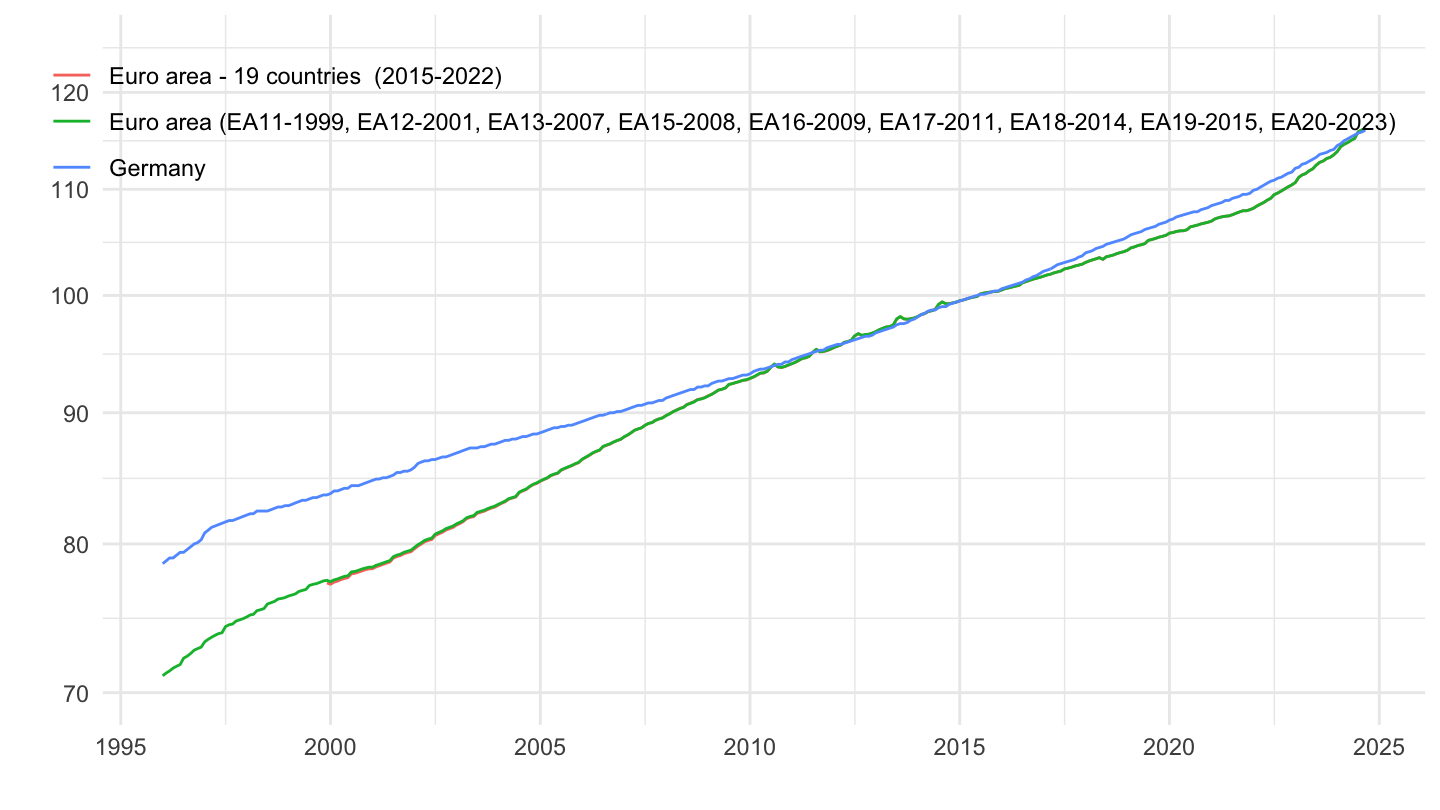
Estonia, Greece, Spain, Finland
Code
prc_hicp_midx %>%
filter(unit == "I15",
coicop %in% c("CP041"),
geo %in% c("EE", "EL", "ES", "FI")) %>%
month_to_date %>%
add_colors %>%
mutate(color = ifelse(geo == "EE", color2, color)) %>%
ggplot(.) + geom_line(aes(x = date, y = values, color = color)) + add_flags +
theme_minimal() + xlab("") + ylab("100 = Janv. 2010") + scale_color_identity() +
scale_x_date(breaks = seq(1960, 2100, 2) %>% paste0("-01-01") %>% as.Date,
labels = date_format("%Y")) +
scale_y_log10(breaks = seq(0, 400, 5))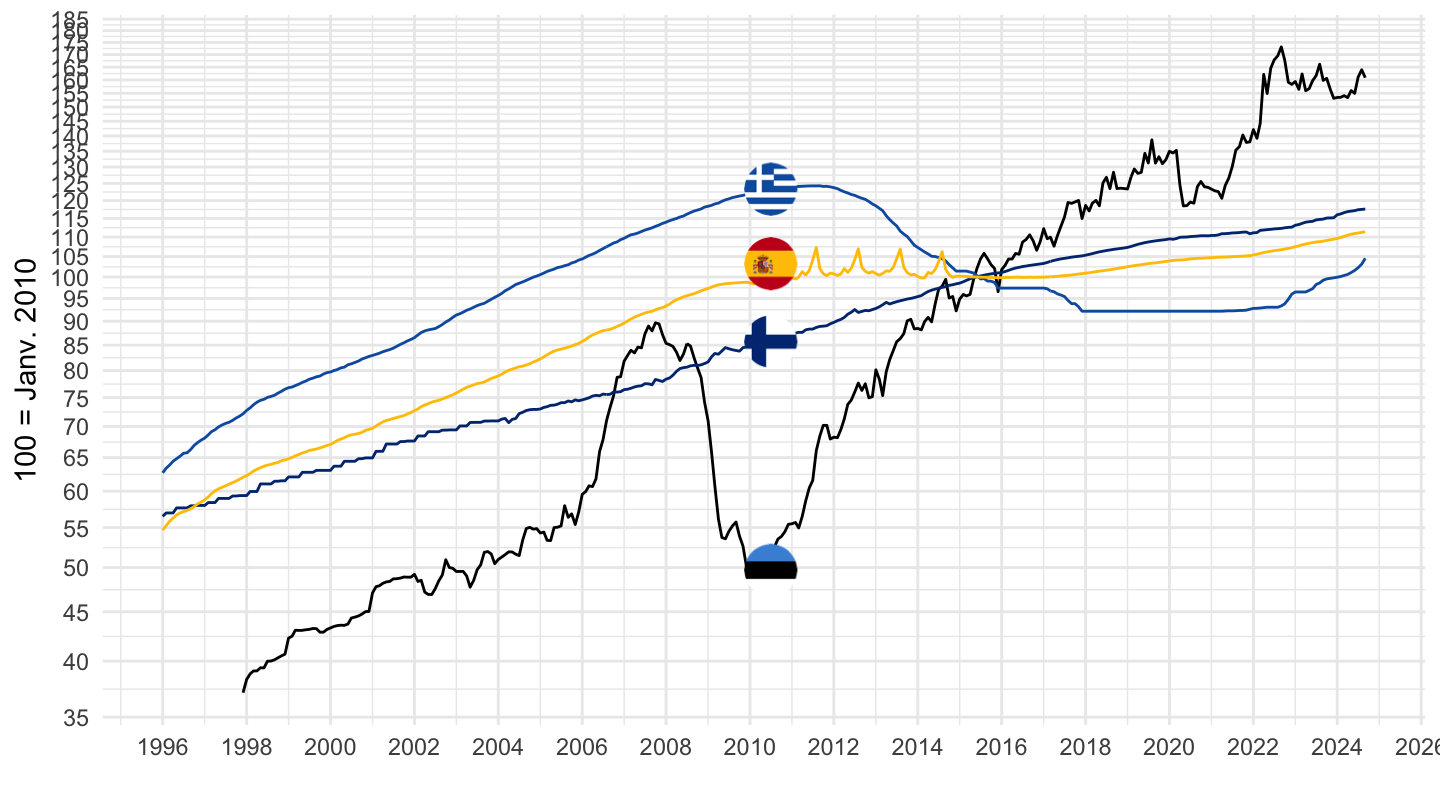
Croatia, Iceland, Ireland, Lithunia
Code
prc_hicp_midx %>%
filter(unit == "I15",
coicop %in% c("CP041"),
geo %in% c("HR", "IE", "IS", "LT")) %>%
month_to_date %>%
add_colors %>%
mutate(color = ifelse(geo == "EE", color2, color)) %>%
ggplot(.) + geom_line(aes(x = date, y = values, color = color)) + add_flags +
theme_minimal() + xlab("") + ylab("100 = Janv. 2010") + scale_color_identity() +
scale_x_date(breaks = seq(1960, 2100, 2) %>% paste0("-01-01") %>% as.Date,
labels = date_format("%Y")) +
scale_y_log10(breaks = seq(0, 400, 5))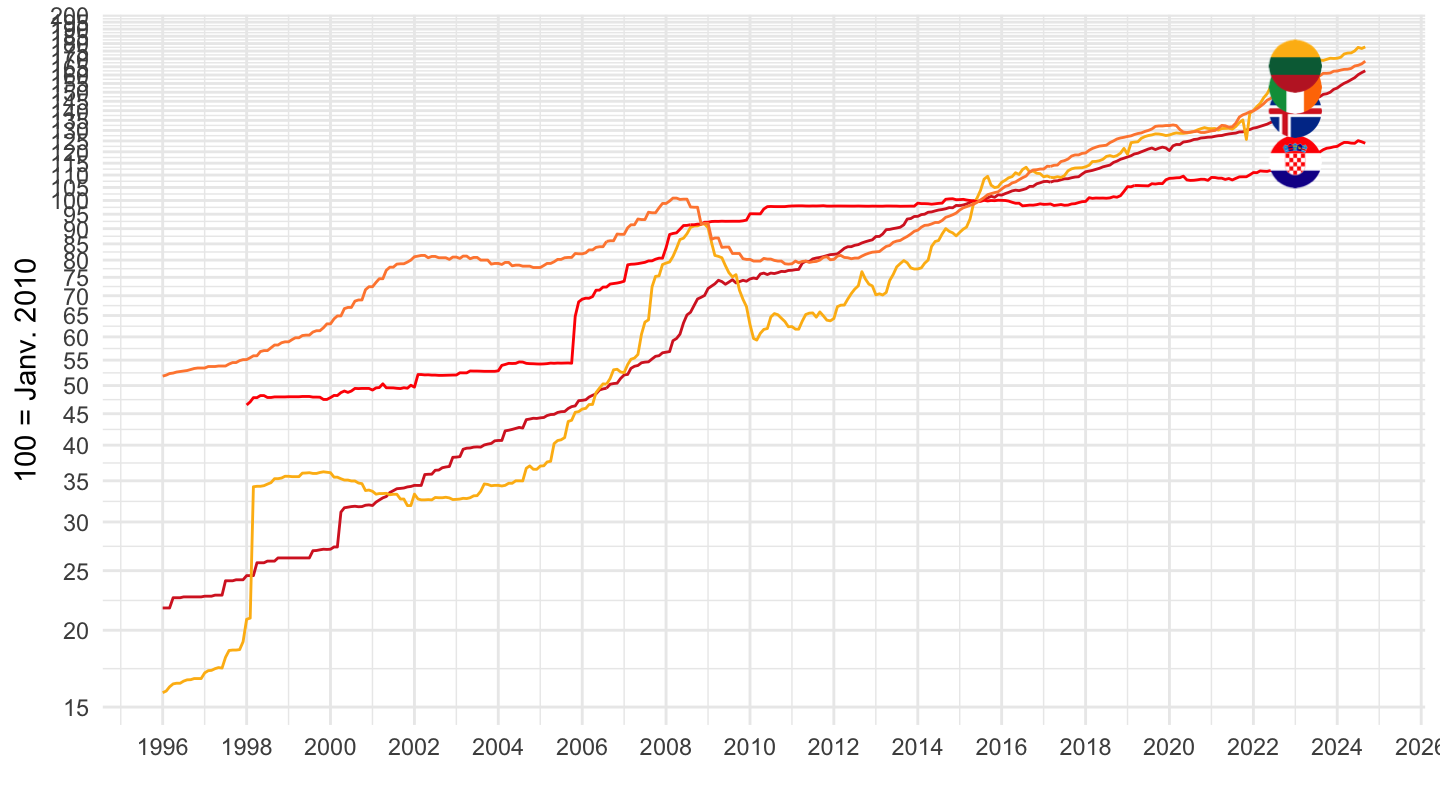
Latvia, Luxembourg, Malta, North Macedonia
Code
prc_hicp_midx %>%
filter(unit == "I15",
coicop %in% c("CP041"),
geo %in% c("LU", "LV", "MK", "MT")) %>%
month_to_date %>%
add_colors %>%
mutate(color = ifelse(geo == "EE", color2, color)) %>%
ggplot(.) + geom_line(aes(x = date, y = values, color = color)) + add_flags +
theme_minimal() + xlab("") + ylab("100 = Janv. 2010") + scale_color_identity() +
scale_x_date(breaks = seq(1960, 2100, 2) %>% paste0("-01-01") %>% as.Date,
labels = date_format("%Y")) +
scale_y_log10(breaks = seq(0, 400, 5))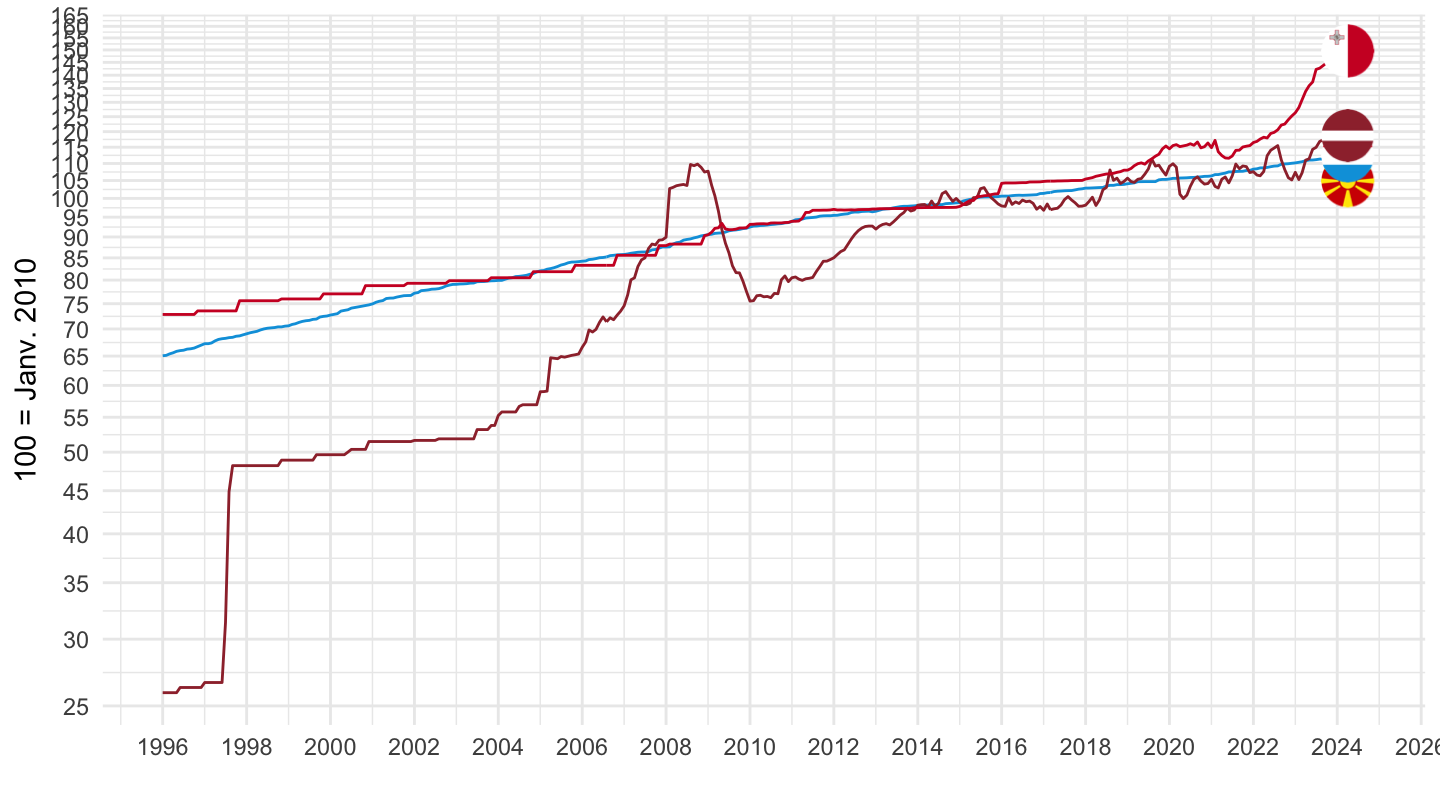
Netherlands, Norway, Portugal, Poland
Code
prc_hicp_midx %>%
filter(unit == "I15",
coicop %in% c("CP041"),
geo %in% c("NL", "NO", "PL", "PT")) %>%
month_to_date %>%
add_colors %>%
mutate(color = ifelse(geo == "EE", color2, color)) %>%
ggplot(.) + geom_line(aes(x = date, y = values, color = color)) + add_flags +
theme_minimal() + xlab("") + ylab("100 = Janv. 2010") + scale_color_identity() +
scale_x_date(breaks = seq(1960, 2100, 2) %>% paste0("-01-01") %>% as.Date,
labels = date_format("%Y")) +
scale_y_log10(breaks = seq(0, 400, 5))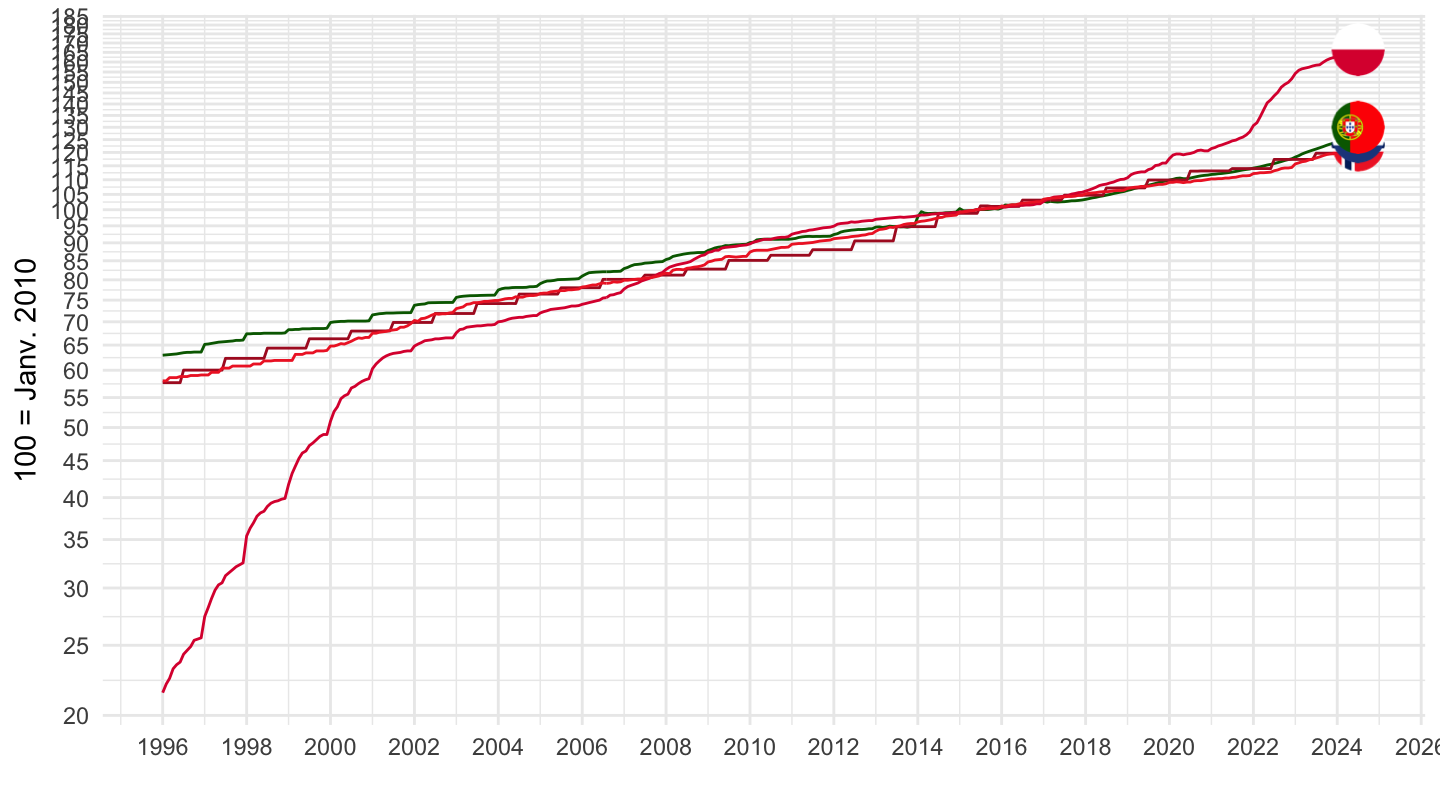
Romania, Serbia, Slovenia, Sweden
Code
prc_hicp_midx %>%
filter(unit == "I15",
coicop %in% c("CP041"),
geo %in% c("RO", "RS", "SE", "SI")) %>%
month_to_date %>%
add_colors %>%
mutate(color = ifelse(geo == "EE", color2, color)) %>%
ggplot(.) + geom_line(aes(x = date, y = values, color = color)) + add_flags +
theme_minimal() + xlab("") + ylab("100 = Janv. 2010") + scale_color_identity() +
scale_x_date(breaks = seq(1960, 2100, 2) %>% paste0("-01-01") %>% as.Date,
labels = date_format("%Y")) +
scale_y_log10(breaks = seq(0, 400, 5))
Slovakia, Turkey, United Kingdom
Code
prc_hicp_midx %>%
filter(unit == "I15",
coicop %in% c("CP041"),
geo %in% c("SK", "TR", "UK")) %>%
month_to_date %>%
mutate(Geo = ifelse(geo == "TR", "Turkey", Geo)) %>%
add_colors %>%
mutate(color = ifelse(geo == "EE", color2, color)) %>%
ggplot(.) + geom_line(aes(x = date, y = values, color = color)) + add_flags +
theme_minimal() + xlab("") + ylab("100 = Janv. 2010") + scale_color_identity() +
scale_x_date(breaks = seq(1960, 2100, 2) %>% paste0("-01-01") %>% as.Date,
labels = date_format("%Y")) +
scale_y_log10(breaks = seq(0, 400, 5))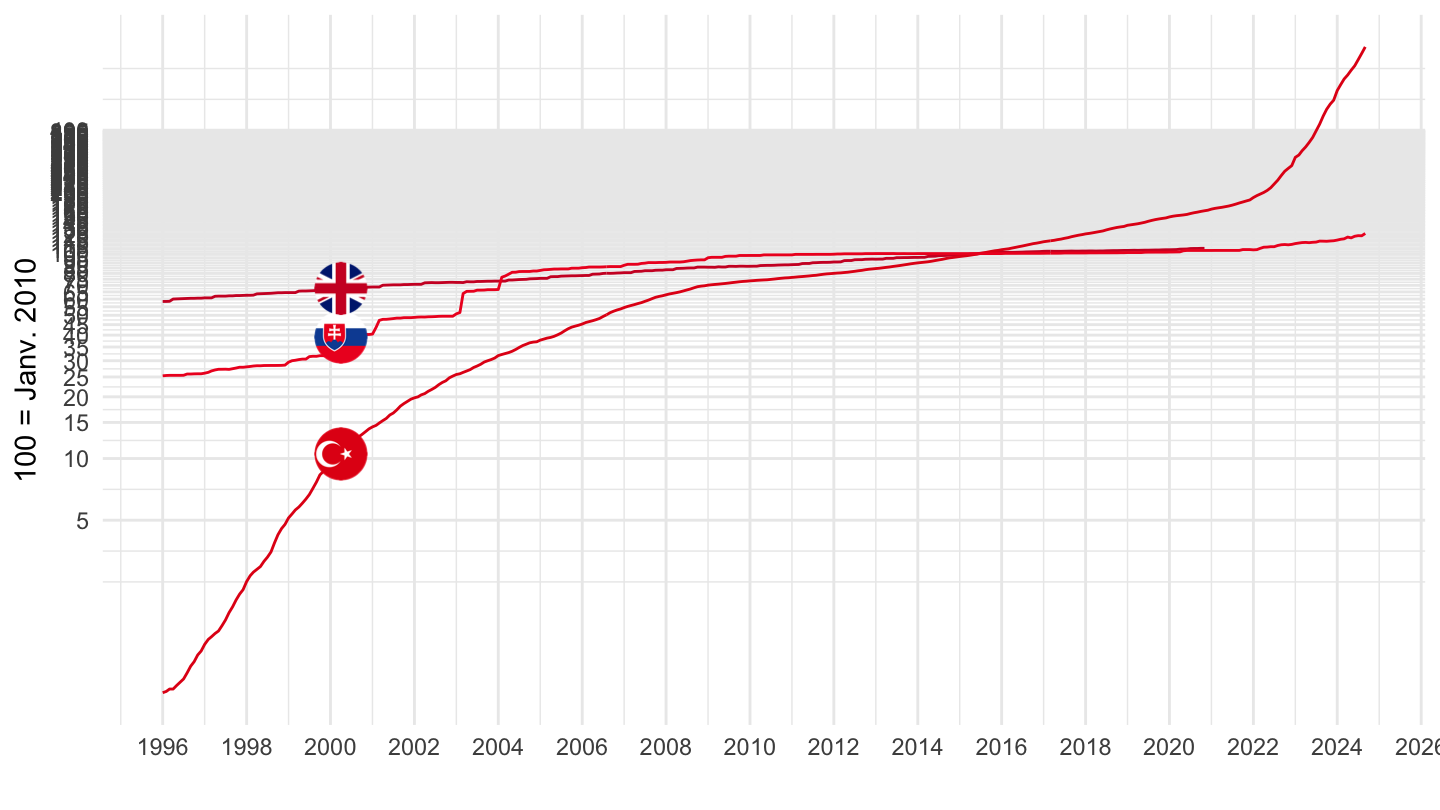
Rents, Housing
France
Code
prc_hicp_midx %>%
filter(unit == "I15",
coicop %in% c("CP04", "CP041", "CP043", "CP045"),
geo %in% c("FR")) %>%
month_to_date %>%
ggplot(.) + geom_line(aes(x = date, y = values, color = Coicop)) +
theme_minimal() + xlab("") + ylab("") +
scale_x_date(breaks = seq(1960, 2100, 5) %>% paste0("-01-01") %>% as.Date,
labels = date_format("%Y")) +
scale_y_log10(breaks = seq(0, 200, 10)) +
theme(legend.position = c(0.7, 0.2),
legend.title = element_blank())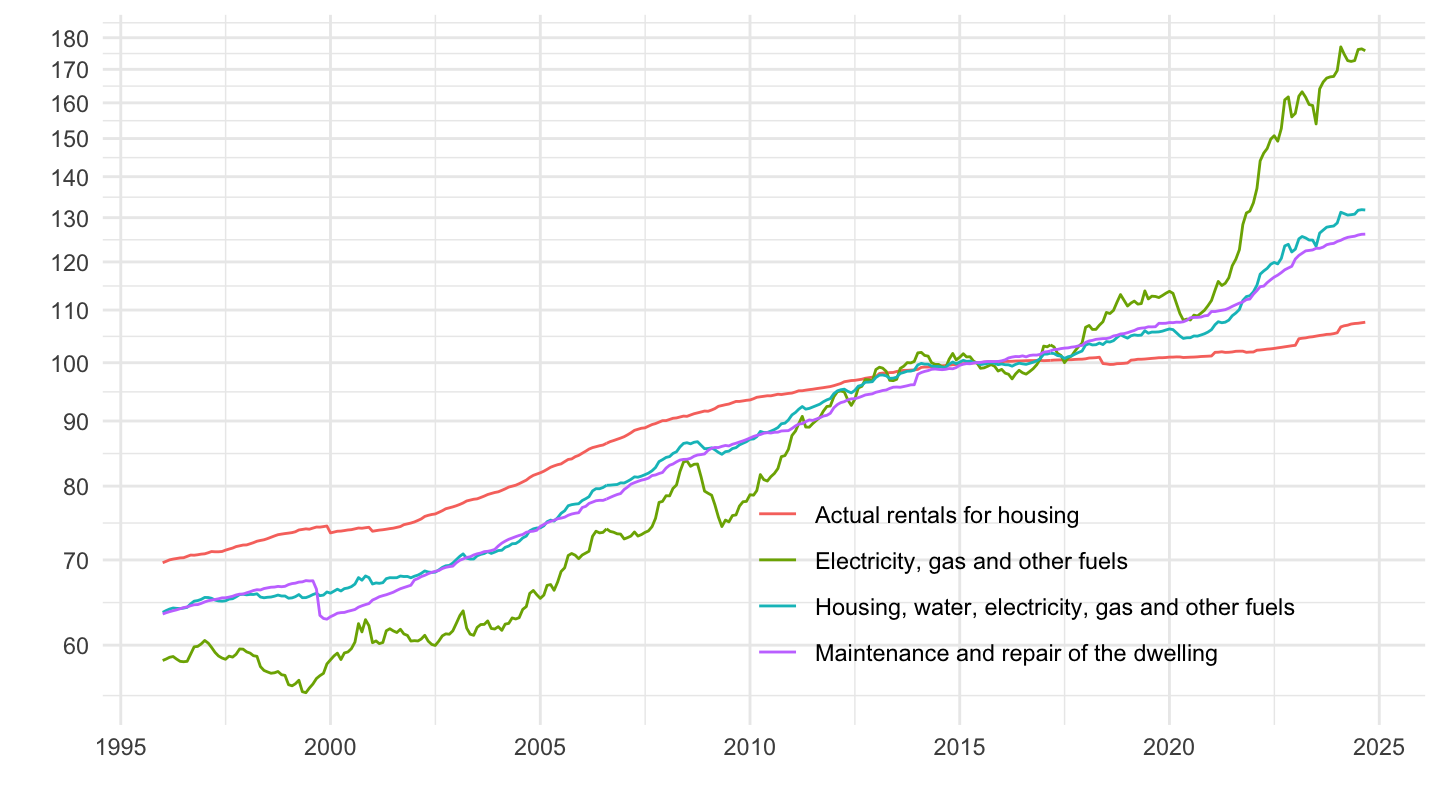
Germany
Code
prc_hicp_midx %>%
filter(unit == "I15",
coicop %in% c("CP04", "CP041", "CP043", "CP045"),
geo %in% c("DE")) %>%
month_to_date %>%
ggplot(.) + geom_line(aes(x = date, y = values, color = Coicop)) +
theme_minimal() + xlab("") + ylab("") +
scale_x_date(breaks = seq(1960, 2100, 5) %>% paste0("-01-01") %>% as.Date,
labels = date_format("%Y")) +
scale_y_log10(breaks = seq(0, 200, 10)) +
theme(legend.position = c(0.7, 0.2),
legend.title = element_blank())
Italy
Code
prc_hicp_midx %>%
filter(unit == "I15",
coicop %in% c("CP04", "CP041", "CP043", "CP045"),
geo %in% c("IT")) %>%
month_to_date %>%
ggplot(.) + geom_line(aes(x = date, y = values, color = Coicop)) +
theme_minimal() + xlab("") + ylab("") +
scale_x_date(breaks = seq(1960, 2100, 5) %>% paste0("-01-01") %>% as.Date,
labels = date_format("%Y")) +
scale_y_log10(breaks = seq(0, 200, 10)) +
theme(legend.position = c(0.7, 0.2),
legend.title = element_blank())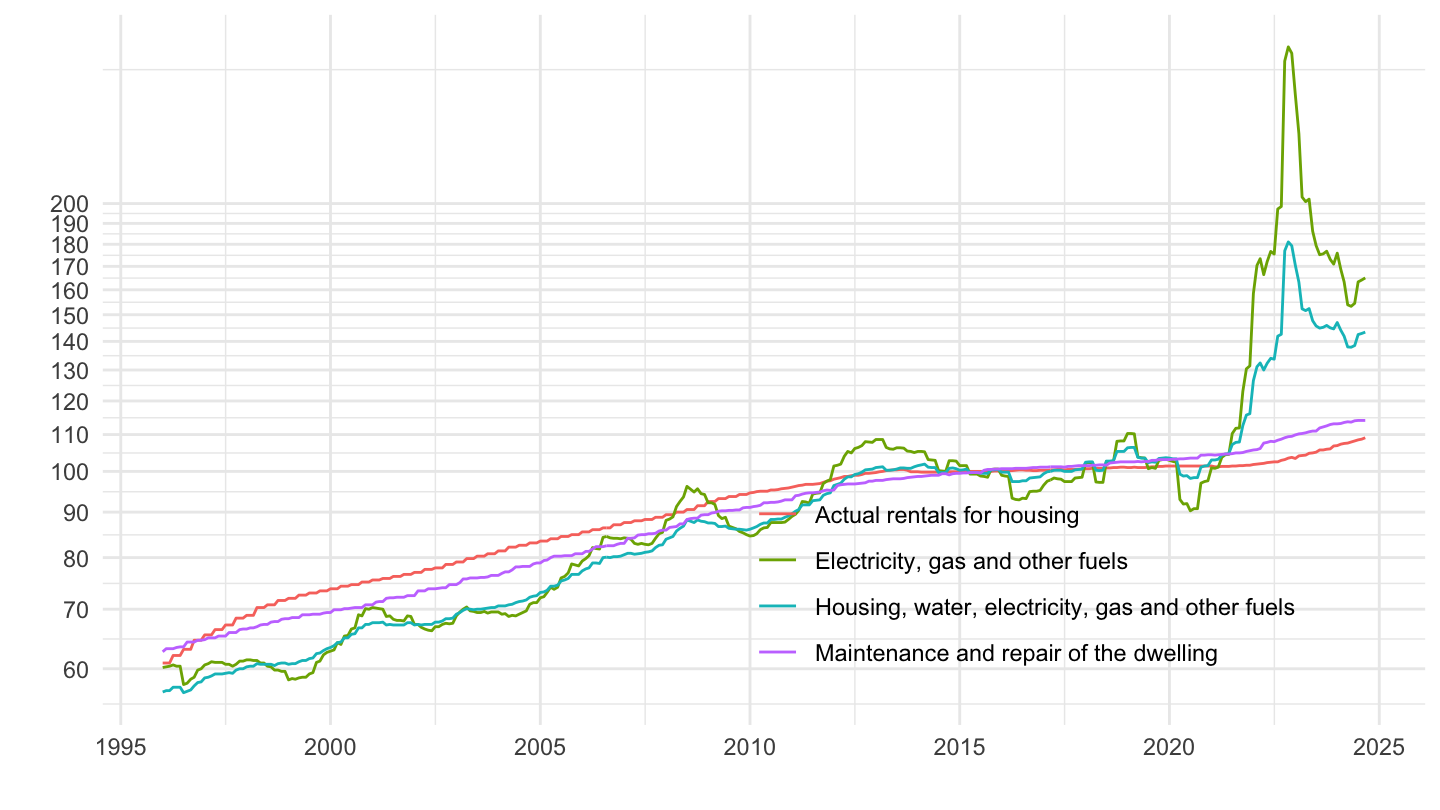
Spain
Code
prc_hicp_midx %>%
filter(unit == "I15",
coicop %in% c("CP04", "CP041", "CP043", "CP045"),
geo %in% c("ES")) %>%
month_to_date %>%
ggplot(.) + geom_line(aes(x = date, y = values, color = Coicop)) +
theme_minimal() + xlab("") + ylab("") +
scale_x_date(breaks = seq(1960, 2100, 5) %>% paste0("-01-01") %>% as.Date,
labels = date_format("%Y")) +
scale_y_log10(breaks = seq(0, 200, 10)) +
theme(legend.position = c(0.7, 0.2),
legend.title = element_blank())
Greece
Code
prc_hicp_midx %>%
filter(unit == "I15",
coicop %in% c("CP04", "CP041", "CP043", "CP045"),
geo %in% c("EL")) %>%
month_to_date %>%
ggplot(.) + geom_line(aes(x = date, y = values, color = Coicop)) +
theme_minimal() + xlab("") + ylab("") +
scale_x_date(breaks = seq(1960, 2100, 5) %>% paste0("-01-01") %>% as.Date,
labels = date_format("%Y")) +
scale_y_log10(breaks = seq(0, 200, 10)) +
theme(legend.position = c(0.7, 0.2),
legend.title = element_blank())
Rents
France, Germany, Greece, Portugal
Code
prc_hicp_midx %>%
filter(unit == "I15",
coicop %in% c("CP041"),
geo %in% c("FR", "DE", "EL", "PT")) %>%
month_to_date %>%
add_colors %>%
mutate(color = ifelse(geo == "EE", color2, color)) %>%
ggplot(.) + geom_line(aes(x = date, y = values, color = color)) + add_flags +
theme_minimal() + xlab("") + ylab("2015 = Janv. 2010") + scale_color_identity() +
scale_x_date(breaks = seq(1960, 2100, 2) %>% paste0("-01-01") %>% as.Date,
labels = date_format("%Y")) +
scale_y_log10(breaks = seq(0, 400, 10))
Spain, Austria, Ireland, Switzerland
Code
prc_hicp_midx %>%
filter(unit == "I15",
coicop %in% c("CP041"),
geo %in% c("ES", "CH", "AT", "IE")) %>%
month_to_date %>%
add_colors %>%
mutate(color = ifelse(geo == "EE", color2, color)) %>%
ggplot(.) + geom_line(aes(x = date, y = values, color = color)) + add_flags +
theme_minimal() + xlab("") + ylab("2015 = Janv. 2010") + scale_color_identity() +
scale_x_date(breaks = seq(1960, 2100, 2) %>% paste0("-01-01") %>% as.Date,
labels = date_format("%Y")) +
scale_y_log10(breaks = seq(0, 400, 10))
United Kingdom, Iceland, Luxembourg, Norway
Code
prc_hicp_midx %>%
filter(unit == "I15",
coicop %in% c("CP041"),
geo %in% c("UK", "IS", "LU", "NO")) %>%
month_to_date %>%
add_colors %>%
mutate(color = ifelse(geo == "EE", color2, color)) %>%
ggplot(.) + geom_line(aes(x = date, y = values, color = color)) + add_flags +
theme_minimal() + xlab("") + ylab("2015 = Janv. 2010") + scale_color_identity() +
scale_x_date(breaks = seq(1960, 2100, 2) %>% paste0("-01-01") %>% as.Date,
labels = date_format("%Y")) +
scale_y_log10(breaks = seq(0, 400, 10))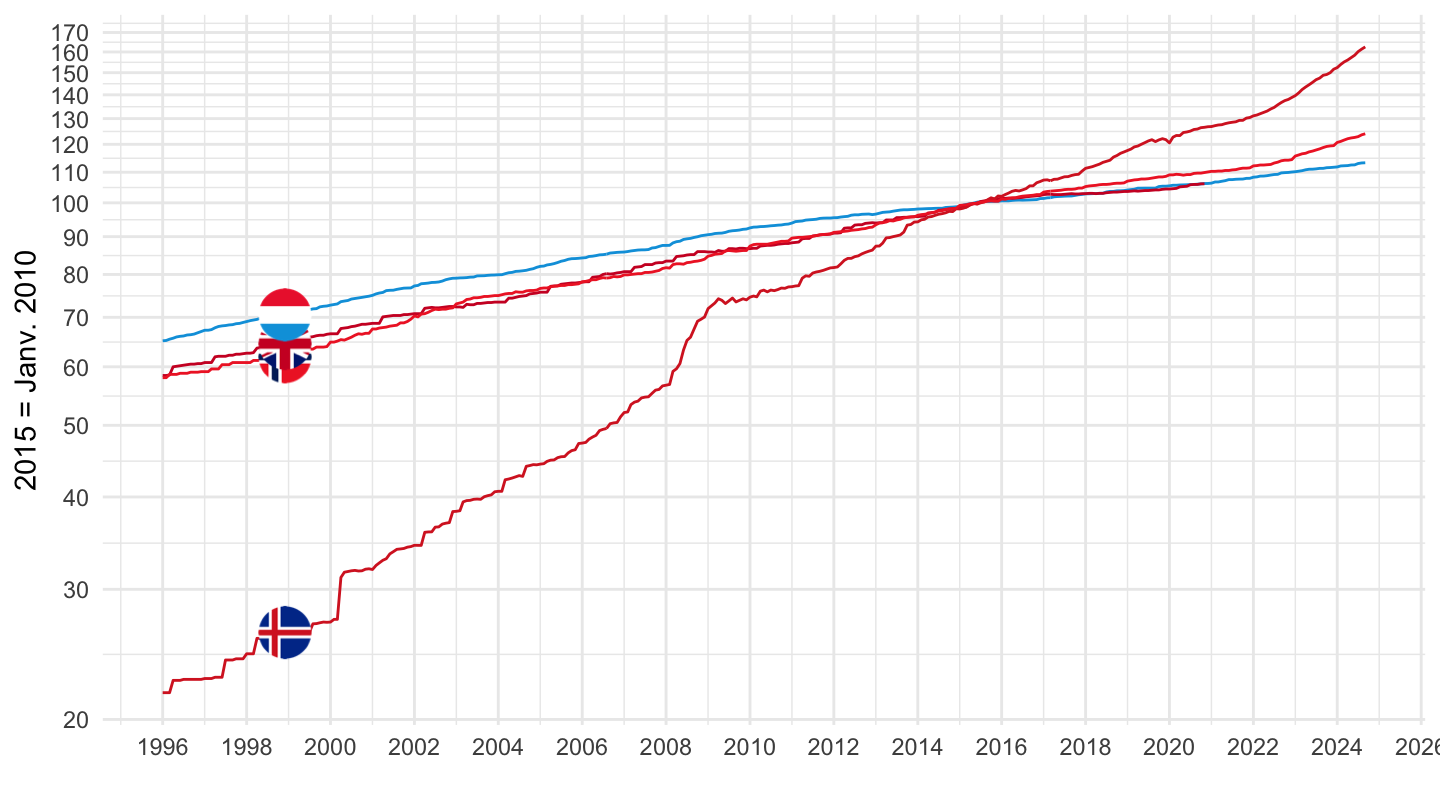
Table by Country
France
Code
prc_hicp_midx %>%
filter(geo == "FR",
unit == "I15",
time %in% c("2020M10", "2015M10", "2010M10", "2000M10", "1990M10", "1996M01")) %>%
select(coicop, Coicop, time, values) %>%
spread(time, values) %>%
{if (is_html_output()) datatable(., filter = 'top', rownames = F) else .}Code
prc_hicp_midx %>%
filter(geo == "FR",
unit == "I15",
time %in% c("2020M10", "2015M10", "2010M10", "2000M10", "1990M10", "1996M01"),
grepl("CP04", coicop)) %>%
select(coicop, Coicop, time, values) %>%
spread(time, values) %>%
{if (is_html_output()) datatable(., filter = 'top', rownames = F) else .}France
Inflationary episode: main
Table - All
Code
prc_hicp_midx %>%
filter(unit == "I15",
geo %in% c("FR")) %>%
month_to_date %>%
filter(date %in% c(max(date), max(date) - years(2))) %>%
group_by(coicop) %>%
arrange(date) %>%
mutate(values = 100*values/values[1]) %>%
filter(date == max(date)) %>%
select_if(~ n_distinct(.) > 1) %>%
arrange(desc(values)) %>%
print_table_conditional()Table - 3 digit
Code
FR_3digit_2year <- prc_hicp_midx %>%
filter(unit == "I15",
geo %in% c("FR"),
nchar(coicop) == 5 | coicop %in% c("CP082_083"),
time %in% c("2021M10", "2023M10")) %>%
group_by(coicop) %>%
mutate(values = 100*values[time == "2023M10"]/values[time == "2021M10"]) %>%
filter(time == "2023M10") %>%
select_if(~ n_distinct(.) > 1) %>%
ungroup
dir.create("prc_hicp_midx_files/data-RData")
do.call(save, list("FR_3digit_2year", file = "prc_hicp_midx_files/data-RData/FR_3digit_2year.RData"))
FR_3digit_2year %>%
select(coicop, Coicop, values) %>%
arrange(-values) %>%
gt::gt() %>%
gt::gtsave(filename = "prc_hicp_midx_files/figure-html/FR_3digit_2year-1.png")
FR_3digit_2year %>%
select(coicop, Coicop, values) %>%
arrange(-values) %>%
print_table_conditional()Main variations
Code
prc_hicp_midx %>%
filter(unit == "I15",
coicop %in% c("CP041", "CP01", "CP045", "CP00"),
geo %in% c("FR")) %>%
month_to_date %>%
filter(date >= max(date) - years(2)) %>%
group_by(coicop) %>%
arrange(date) %>%
mutate(values = 100*values/values[1]) %>%
ggplot(.) + geom_line(aes(x = date, y = values, color = Coicop)) +
theme_minimal() + xlab("") + ylab("") +
scale_x_date(breaks = seq.Date(as.Date("2019-09-01"), as.Date("2100-09-01"), "1 month"),
labels = date_format("%b %Y")) +
scale_y_log10(breaks = seq(0, 200, 2)) +
theme(legend.position = c(0.2, 0.8),
legend.title = element_blank(),
axis.text.x = element_text(angle = 45, vjust = 1, hjust = 1)) 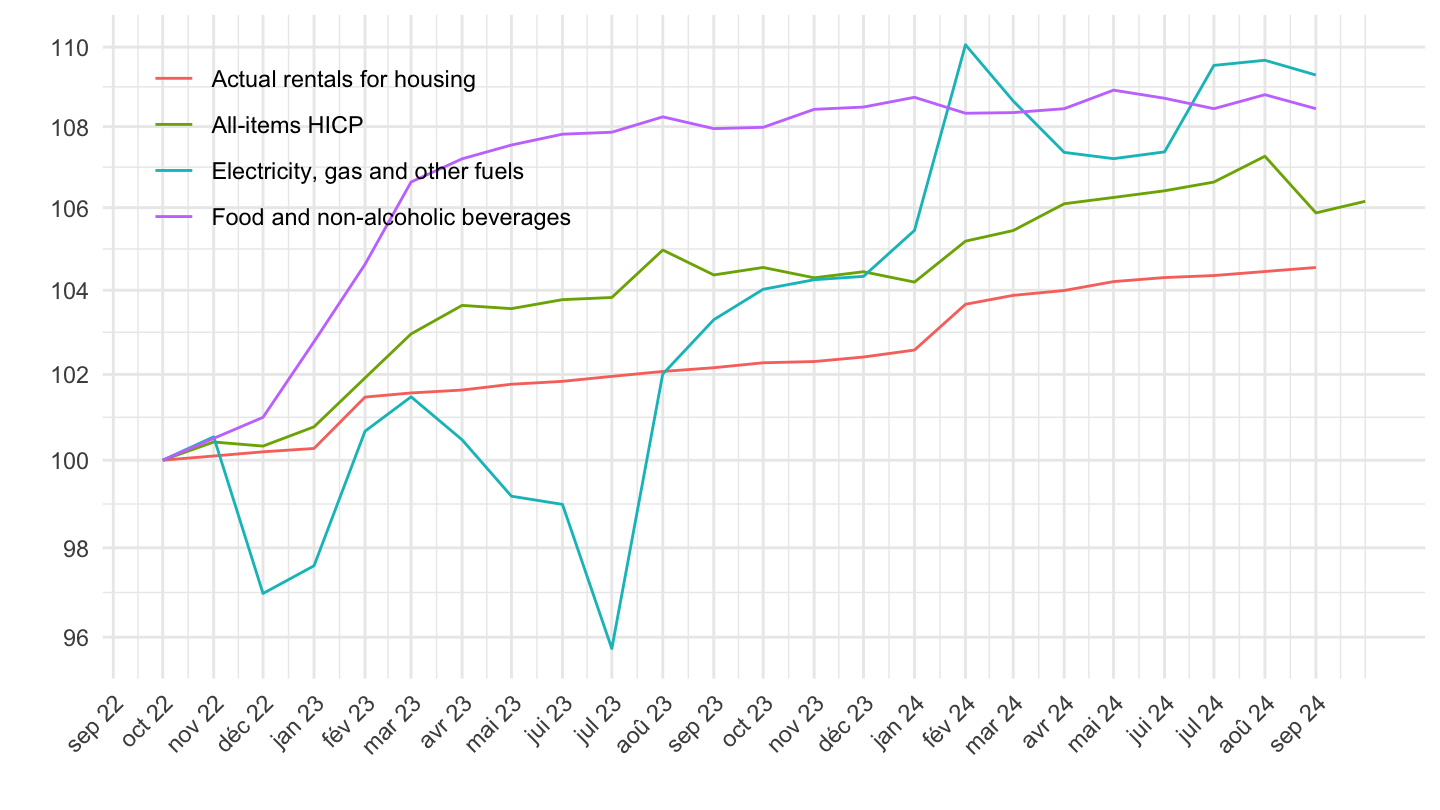
CP01, CP02, CP00
Code
prc_hicp_midx %>%
filter(unit == "I15",
coicop %in% c("CP01", "CP02", "CP00"),
geo %in% c("FR")) %>%
month_to_date %>%
filter(date >= max(date) - years(2)) %>%
group_by(coicop) %>%
arrange(date) %>%
mutate(values = 100*values/values[1]) %>%
ggplot(.) + geom_line(aes(x = date, y = values, color = Coicop)) +
theme_minimal() + xlab("") + ylab("") +
scale_x_date(breaks = seq.Date(as.Date("2019-09-01"), as.Date("2100-09-01"), "1 month"),
labels = date_format("%b %Y")) +
scale_y_log10(breaks = seq(0, 200, 2)) +
theme(legend.position = c(0.2, 0.8),
legend.title = element_blank(),
axis.text.x = element_text(angle = 45, vjust = 1, hjust = 1)) 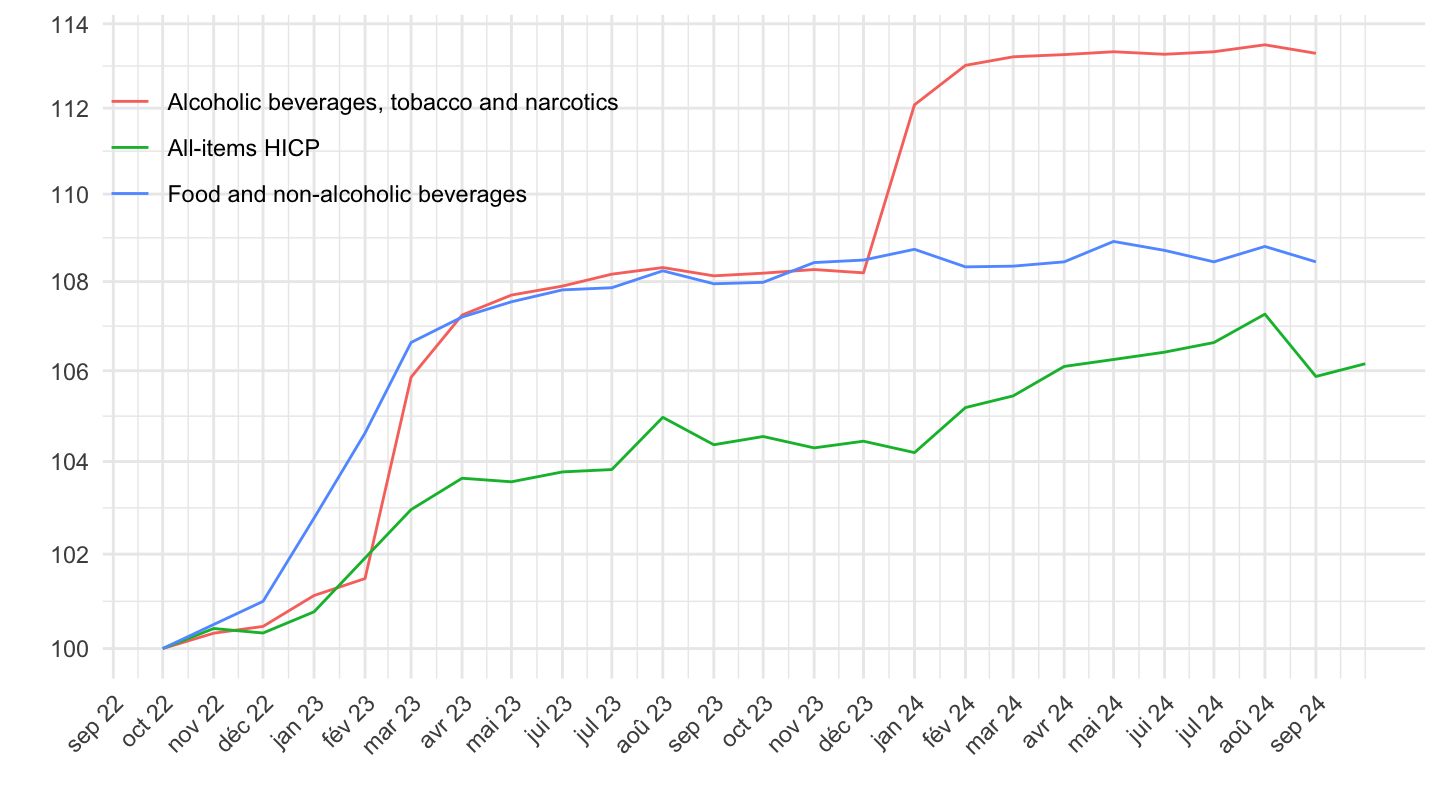
CP07, CP072, CP073
Code
prc_hicp_midx %>%
filter(unit == "I15",
coicop %in% c("CP072", "CP073", "CP07", "CP00"),
geo %in% c("FR")) %>%
month_to_date %>%
filter(date >= max(date) - years(2)) %>%
group_by(coicop) %>%
arrange(date) %>%
mutate(values = 100*values/values[1]) %>%
ggplot(.) + geom_line(aes(x = date, y = values, color = Coicop)) +
theme_minimal() + xlab("") + ylab("") +
scale_x_date(breaks = seq.Date(as.Date("2019-09-01"), as.Date("2100-09-01"), "1 month"),
labels = date_format("%b %Y")) +
scale_y_log10(breaks = seq(0, 200, 2)) +
theme(legend.position = c(0.23, 0.85),
legend.title = element_blank(),
axis.text.x = element_text(angle = 45, vjust = 1, hjust = 1)) 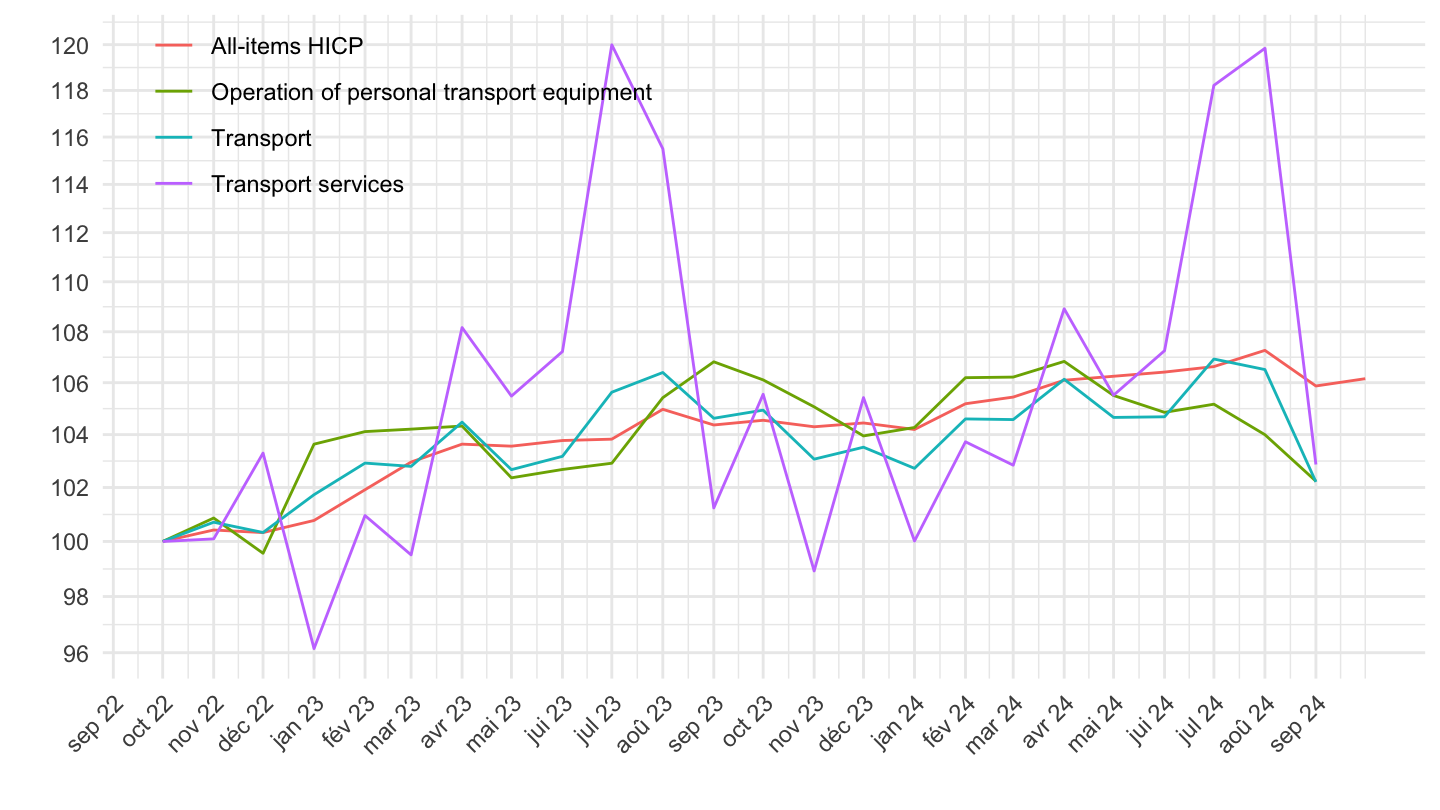
CP01, CP02, CP03, CP04
Code
prc_hicp_midx %>%
filter(unit == "I15",
coicop %in% c("CP01", "CP02", "CP03", "CP04"),
geo %in% c("FR")) %>%
month_to_date %>%
ggplot(.) + geom_line(aes(x = date, y = values, color = Coicop)) +
theme_minimal() + xlab("") + ylab("") +
scale_x_date(breaks = seq(1960, 2100, 5) %>% paste0("-01-01") %>% as.Date,
labels = date_format("%Y")) +
scale_y_log10(breaks = seq(0, 200, 10)) +
theme(legend.position = c(0.7, 0.2),
legend.title = element_blank())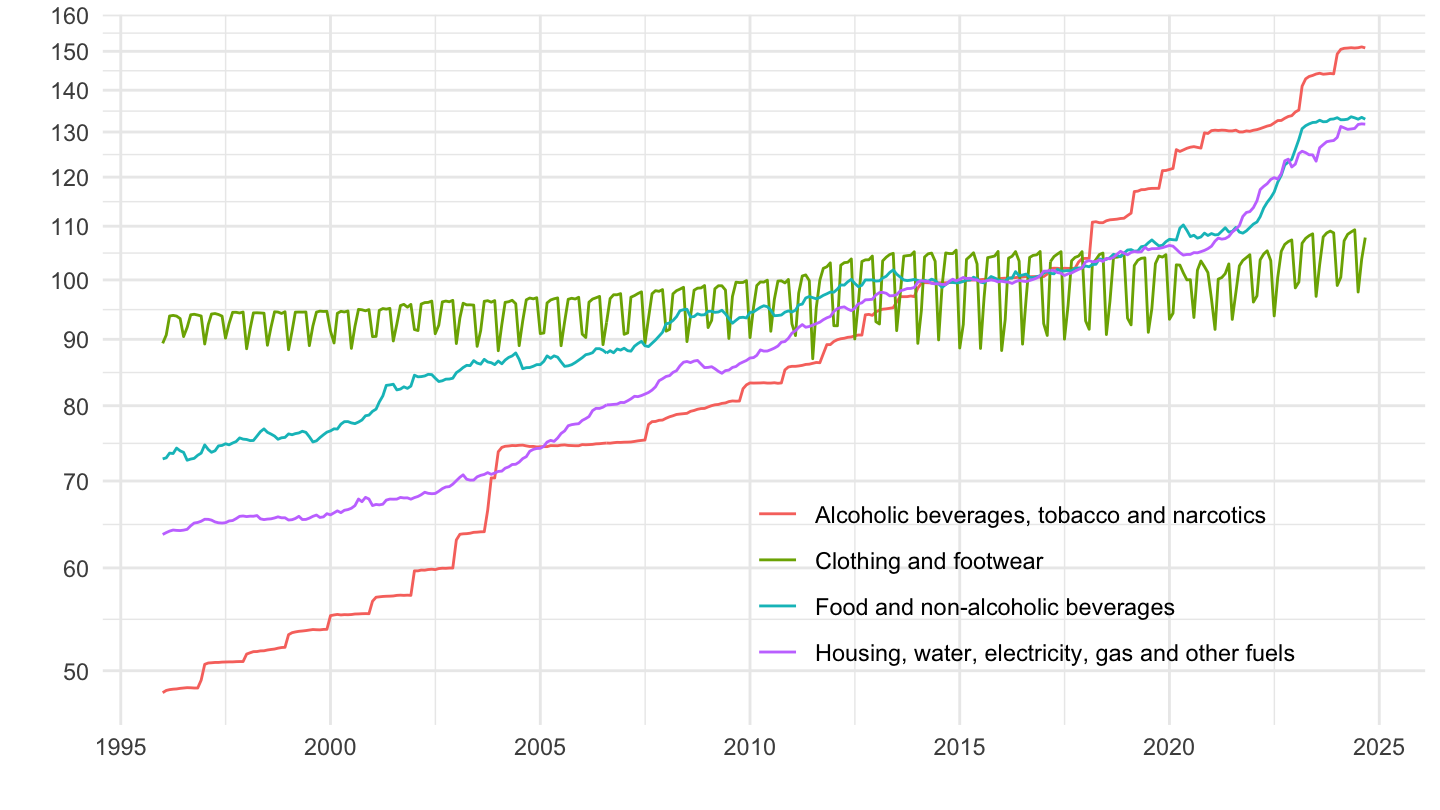
CP05, CP06, CP07, CP08
Code
prc_hicp_midx %>%
filter(unit == "I15",
coicop %in% c("CP05", "CP06", "CP07", "CP08"),
geo %in% c("FR")) %>%
month_to_date %>%
ggplot(.) + geom_line(aes(x = date, y = values, color = Coicop)) +
theme_minimal() + xlab("") + ylab("") +
scale_x_date(breaks = seq(1960, 2100, 5) %>% paste0("-01-01") %>% as.Date,
labels = date_format("%Y")) +
scale_y_log10(breaks = seq(0, 200, 10)) +
theme(legend.position = c(0.7, 0.2),
legend.title = element_blank())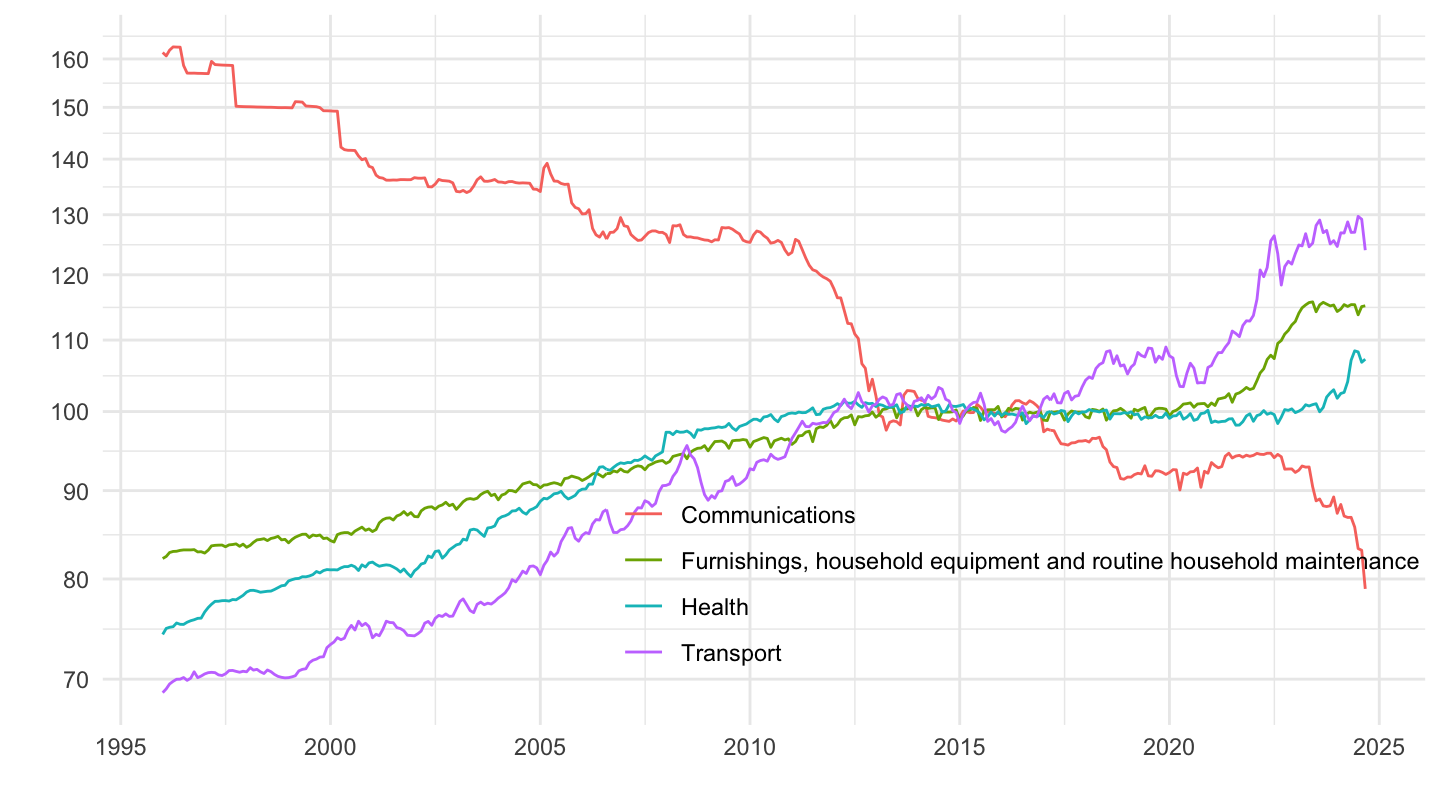
CP09, CP10, CP11, CP12
Code
prc_hicp_midx %>%
filter(unit == "I15",
coicop %in% c("CP09", "CP10", "CP11", "CP12"),
geo %in% c("FR")) %>%
month_to_date %>%
ggplot(.) + geom_line(aes(x = date, y = values, color = Coicop)) +
theme_minimal() + xlab("") + ylab("") +
scale_x_date(breaks = seq(1960, 2100, 5) %>% paste0("-01-01") %>% as.Date,
labels = date_format("%Y")) +
scale_y_log10(breaks = seq(0, 200, 10)) +
theme(legend.position = c(0.7, 0.2),
legend.title = element_blank())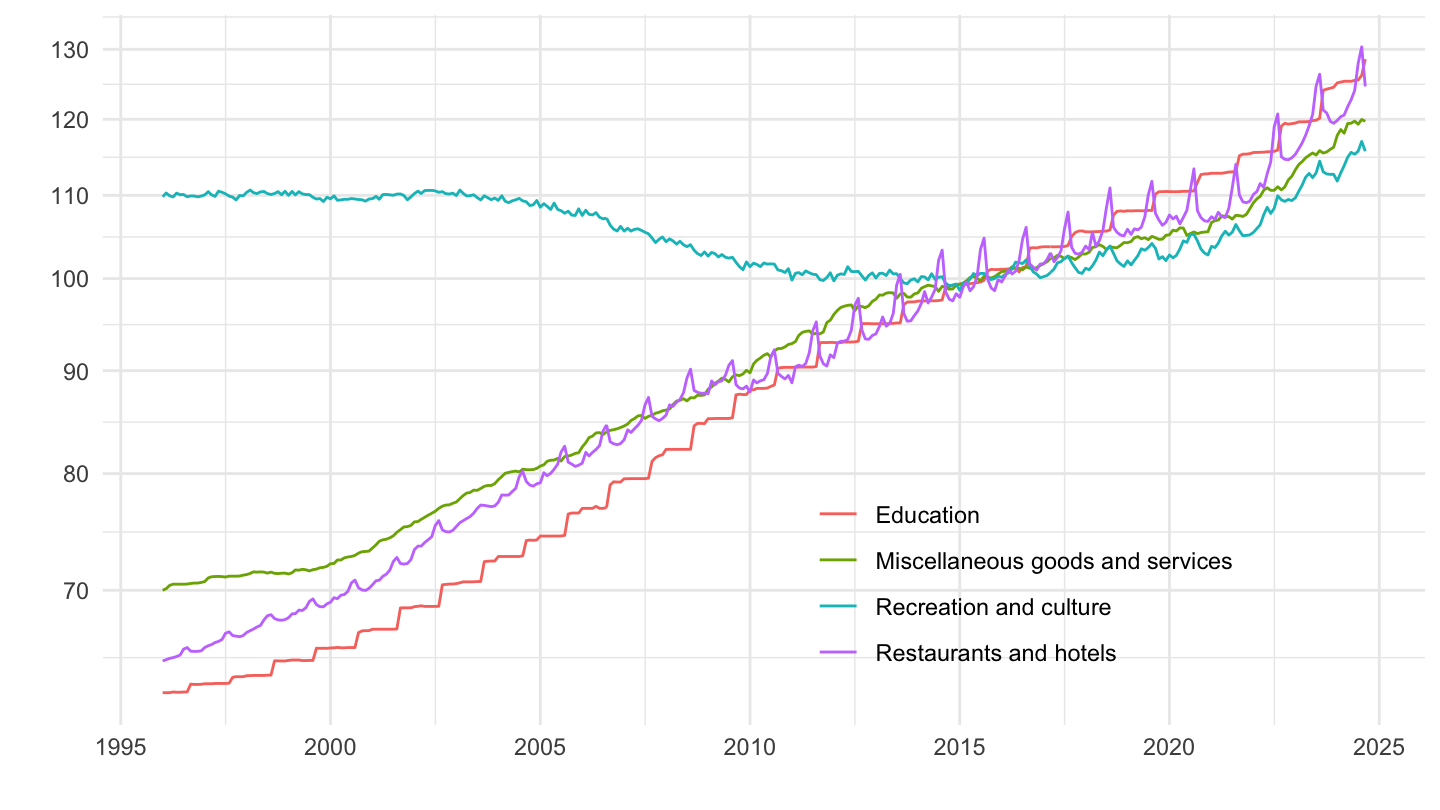
Germany
CP01, CP02, CP03, CP04
Code
prc_hicp_midx %>%
filter(unit == "I15",
coicop %in% c("CP01", "CP02", "CP03", "CP04"),
geo %in% c("DE")) %>%
month_to_date %>%
ggplot(.) + geom_line(aes(x = date, y = values, color = Coicop)) +
theme_minimal() + xlab("") + ylab("") +
scale_x_date(breaks = seq(1960, 2100, 5) %>% paste0("-01-01") %>% as.Date,
labels = date_format("%Y")) +
scale_y_log10(breaks = seq(0, 200, 10)) +
theme(legend.position = c(0.7, 0.2),
legend.title = element_blank())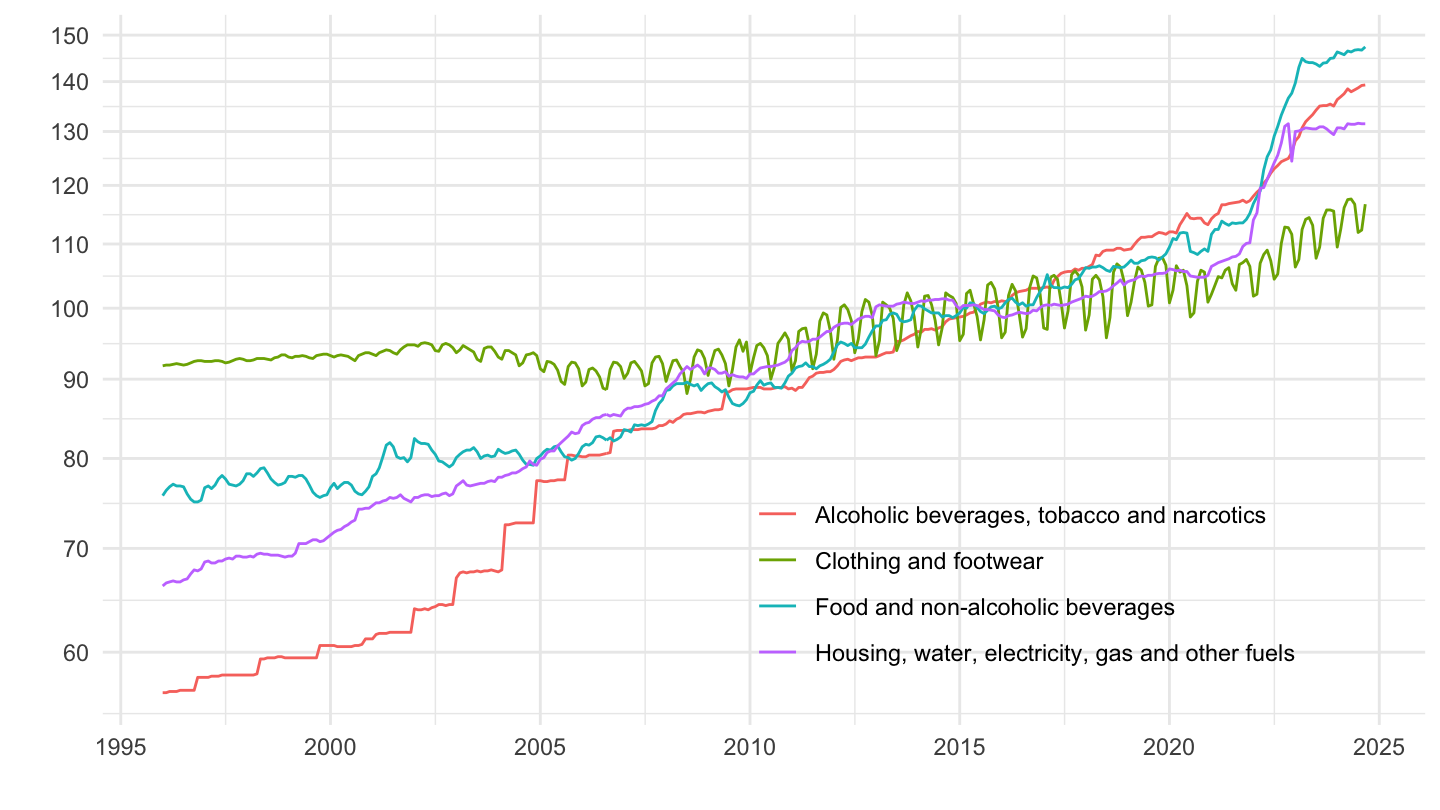
CP05, CP06, CP07, CP08
Code
prc_hicp_midx %>%
filter(unit == "I15",
coicop %in% c("CP05", "CP06", "CP07", "CP08"),
geo %in% c("DE")) %>%
month_to_date %>%
ggplot(.) + geom_line(aes(x = date, y = values, color = Coicop)) +
theme_minimal() + xlab("") + ylab("") +
scale_x_date(breaks = seq(1960, 2100, 5) %>% paste0("-01-01") %>% as.Date,
labels = date_format("%Y")) +
scale_y_log10(breaks = seq(0, 200, 10)) +
theme(legend.position = c(0.7, 0.8),
legend.title = element_blank())
CP09, CP10, CP11, CP12
Code
prc_hicp_midx %>%
filter(unit == "I15",
coicop %in% c("CP09", "CP10", "CP11", "CP12"),
geo %in% c("DE")) %>%
month_to_date %>%
ggplot(.) + geom_line(aes(x = date, y = values, color = Coicop)) +
theme_minimal() + xlab("") + ylab("") +
scale_x_date(breaks = seq(1960, 2100, 5) %>% paste0("-01-01") %>% as.Date,
labels = date_format("%Y")) +
scale_y_log10(breaks = seq(0, 200, 10)) +
theme(legend.position = c(0.7, 0.2),
legend.title = element_blank())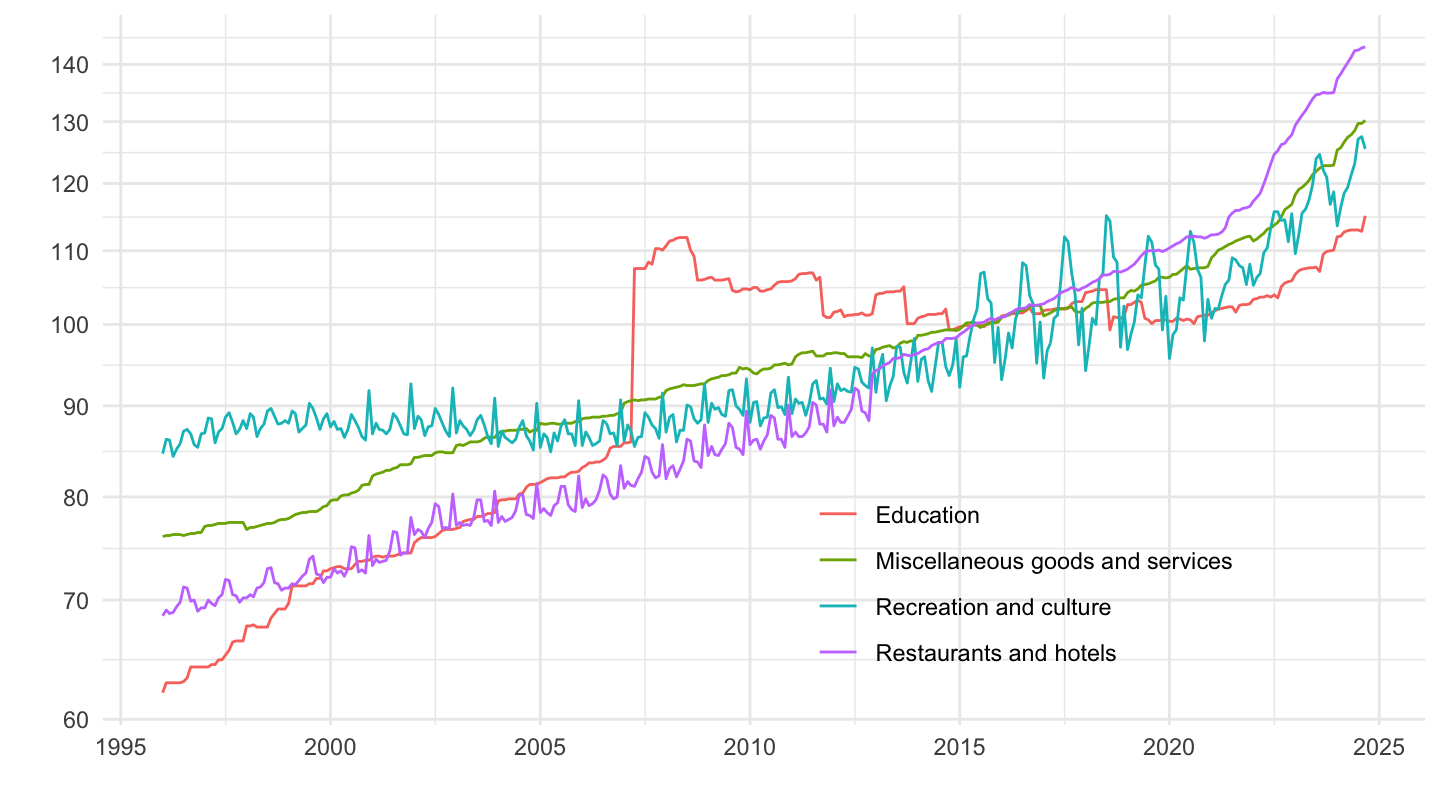
Italy
CP01, CP02, CP03, CP04
Code
prc_hicp_midx %>%
filter(unit == "I15",
coicop %in% c("CP01", "CP02", "CP03", "CP04"),
geo %in% c("IT")) %>%
month_to_date %>%
ggplot(.) + geom_line(aes(x = date, y = values, color = Coicop)) +
theme_minimal() + xlab("") + ylab("") +
scale_x_date(breaks = seq(1960, 2100, 5) %>% paste0("-01-01") %>% as.Date,
labels = date_format("%Y")) +
scale_y_log10(breaks = seq(0, 200, 10)) +
theme(legend.position = c(0.7, 0.2),
legend.title = element_blank())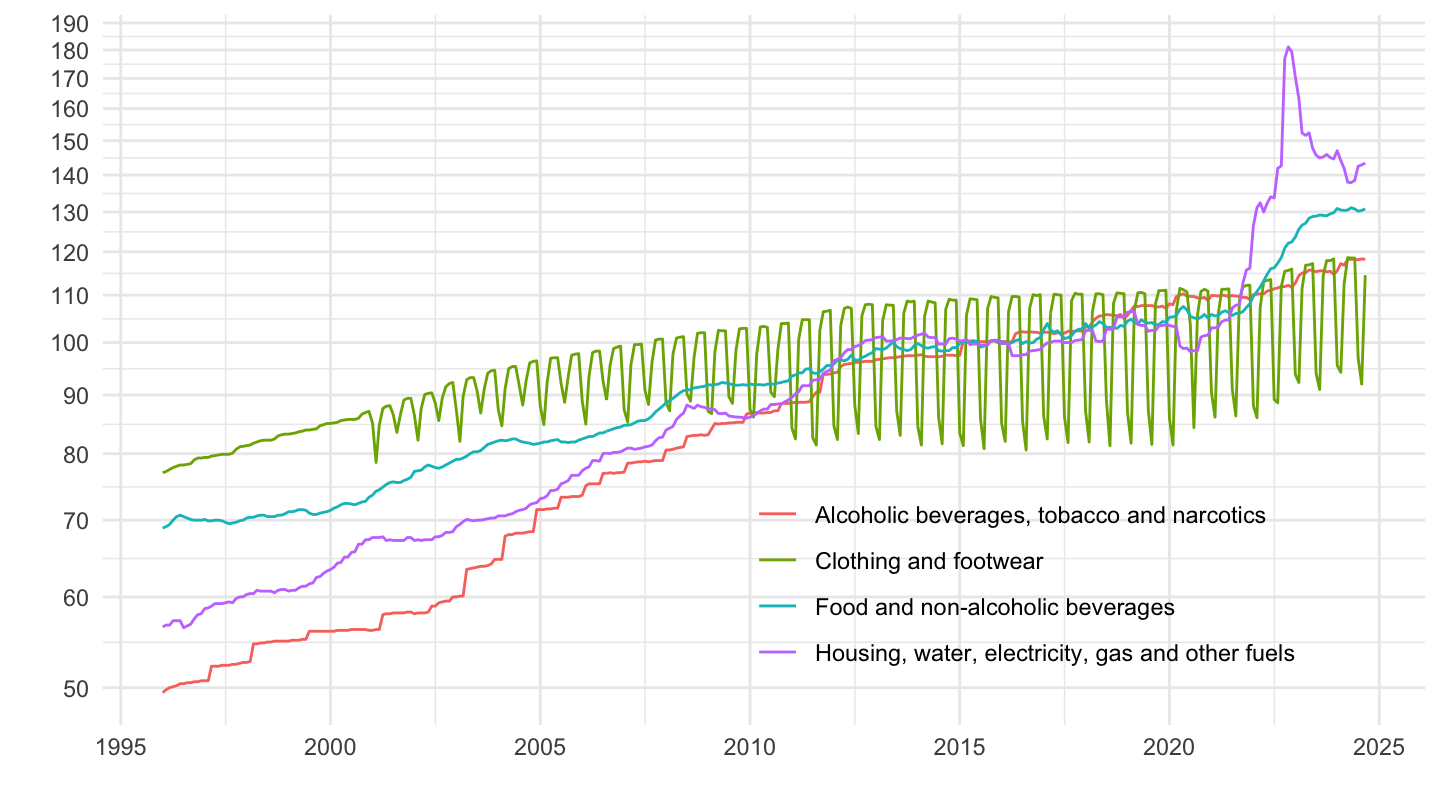
CP05, CP06, CP07, CP08
Code
prc_hicp_midx %>%
filter(unit == "I15",
coicop %in% c("CP05", "CP06", "CP07", "CP08"),
geo %in% c("IT")) %>%
month_to_date %>%
ggplot(.) + geom_line(aes(x = date, y = values, color = Coicop)) +
theme_minimal() + xlab("") + ylab("") +
scale_x_date(breaks = seq(1960, 2100, 5) %>% paste0("-01-01") %>% as.Date,
labels = date_format("%Y")) +
scale_y_log10(breaks = seq(0, 200, 10)) +
theme(legend.position = c(0.7, 0.8),
legend.title = element_blank())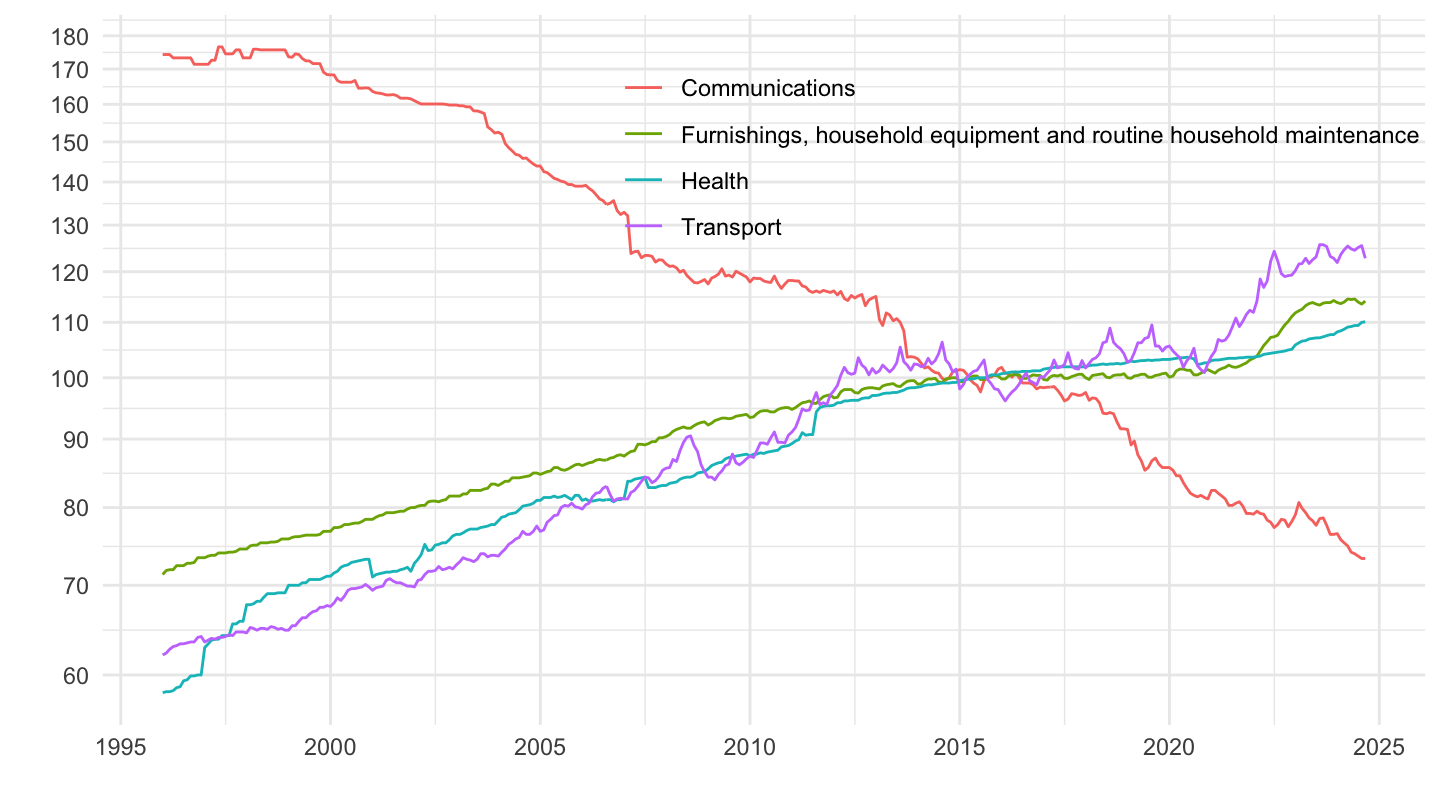
CP09, CP10, CP11, CP12
Code
prc_hicp_midx %>%
filter(unit == "I15",
coicop %in% c("CP09", "CP10", "CP11", "CP12"),
geo %in% c("IT")) %>%
month_to_date %>%
ggplot(.) + geom_line(aes(x = date, y = values, color = Coicop)) +
theme_minimal() + xlab("") + ylab("") +
scale_x_date(breaks = seq(1960, 2100, 5) %>% paste0("-01-01") %>% as.Date,
labels = date_format("%Y")) +
scale_y_log10(breaks = seq(0, 200, 10)) +
theme(legend.position = c(0.7, 0.2),
legend.title = element_blank())
Spain
CP01, CP02, CP03, CP04
Code
prc_hicp_midx %>%
filter(unit == "I15",
coicop %in% c("CP01", "CP02", "CP03", "CP04"),
geo %in% c("ES")) %>%
month_to_date %>%
ggplot(.) + geom_line(aes(x = date, y = values, color = Coicop)) +
theme_minimal() + xlab("") + ylab("") +
scale_x_date(breaks = seq(1960, 2100, 5) %>% paste0("-01-01") %>% as.Date,
labels = date_format("%Y")) +
scale_y_log10(breaks = seq(0, 200, 10)) +
theme(legend.position = c(0.7, 0.2),
legend.title = element_blank())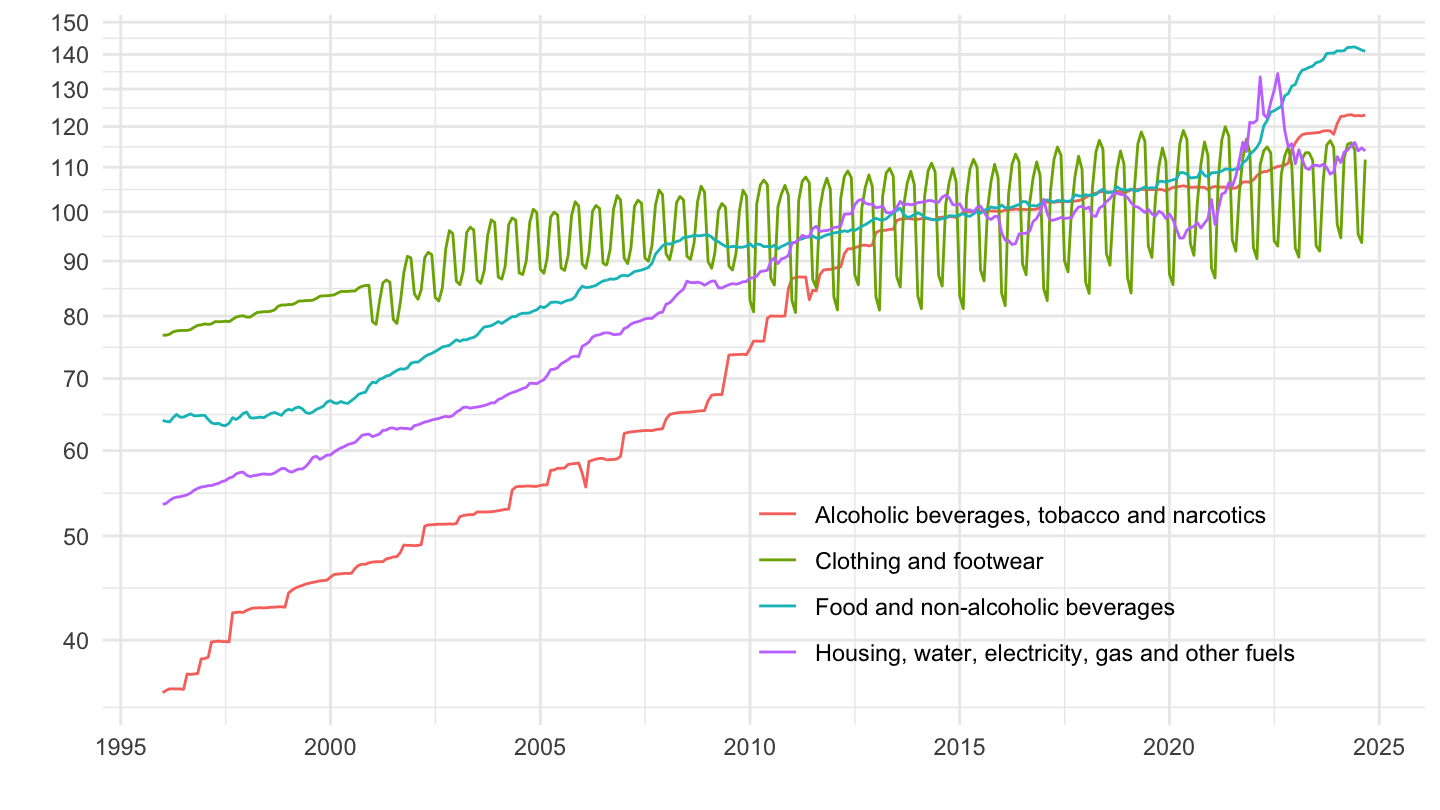
CP05, CP06, CP07, CP08
Code
prc_hicp_midx %>%
filter(unit == "I15",
coicop %in% c("CP05", "CP06", "CP07", "CP08"),
geo %in% c("ES")) %>%
month_to_date %>%
ggplot(.) + geom_line(aes(x = date, y = values, color = Coicop)) +
theme_minimal() + xlab("") + ylab("") +
scale_x_date(breaks = seq(1960, 2100, 5) %>% paste0("-01-01") %>% as.Date,
labels = date_format("%Y")) +
scale_y_log10(breaks = seq(0, 200, 10)) +
theme(legend.position = c(0.7, 0.8),
legend.title = element_blank())
CP09, CP10, CP11, CP12
Code
prc_hicp_midx %>%
filter(unit == "I15",
coicop %in% c("CP09", "CP10", "CP11", "CP12"),
geo %in% c("ES")) %>%
month_to_date %>%
ggplot(.) + geom_line(aes(x = date, y = values, color = Coicop)) +
theme_minimal() + xlab("") + ylab("") +
scale_x_date(breaks = seq(1960, 2100, 5) %>% paste0("-01-01") %>% as.Date,
labels = date_format("%Y")) +
scale_y_log10(breaks = seq(0, 200, 10)) +
theme(legend.position = c(0.7, 0.2),
legend.title = element_blank())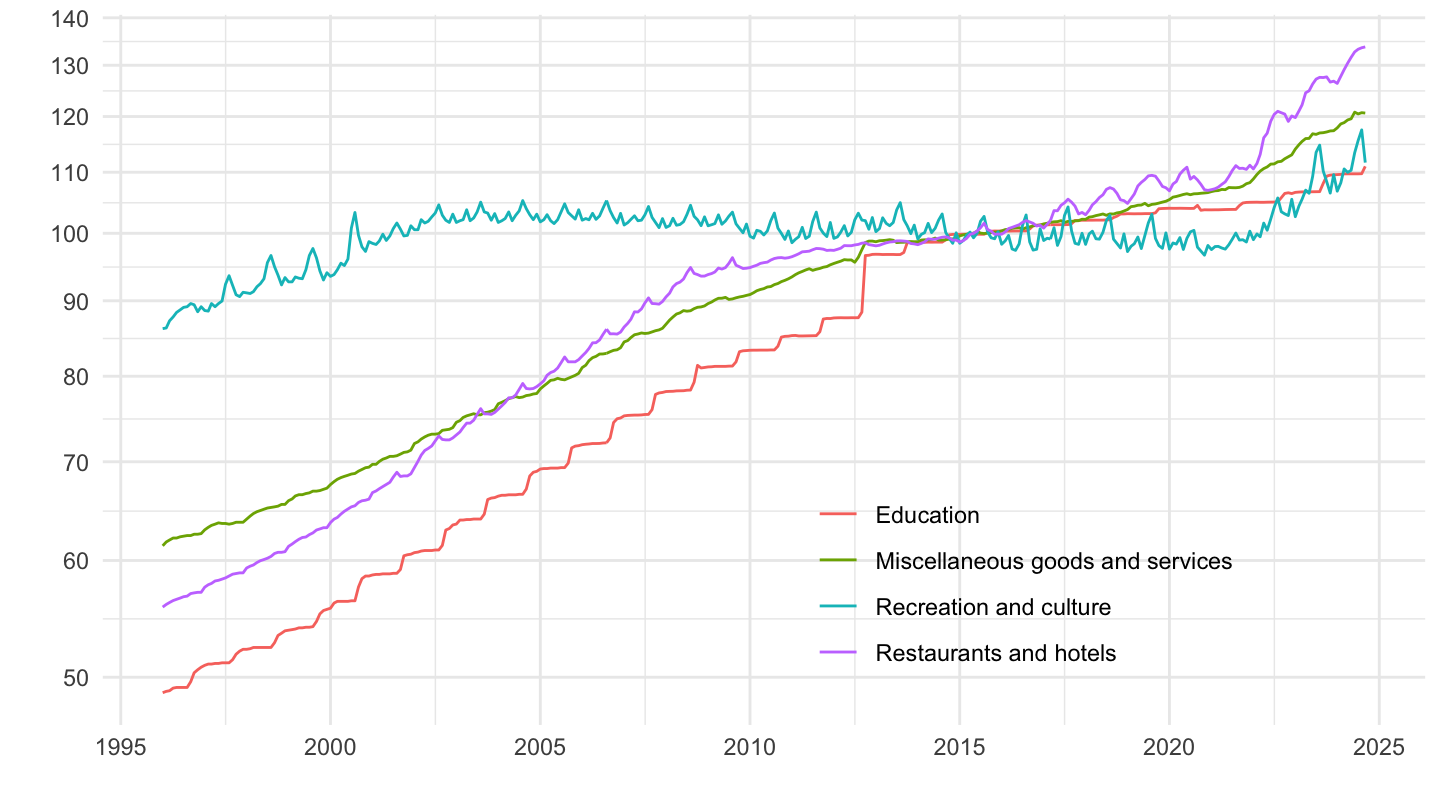
Greece
CP01, CP02, CP03, CP04
Code
prc_hicp_midx %>%
filter(unit == "I15",
coicop %in% c("CP01", "CP02", "CP03", "CP04"),
geo %in% c("EL")) %>%
month_to_date %>%
ggplot(.) + geom_line(aes(x = date, y = values, color = Coicop)) +
theme_minimal() + xlab("") + ylab("") +
scale_x_date(breaks = seq(1960, 2100, 5) %>% paste0("-01-01") %>% as.Date,
labels = date_format("%Y")) +
scale_y_log10(breaks = seq(0, 200, 10)) +
theme(legend.position = c(0.7, 0.2),
legend.title = element_blank())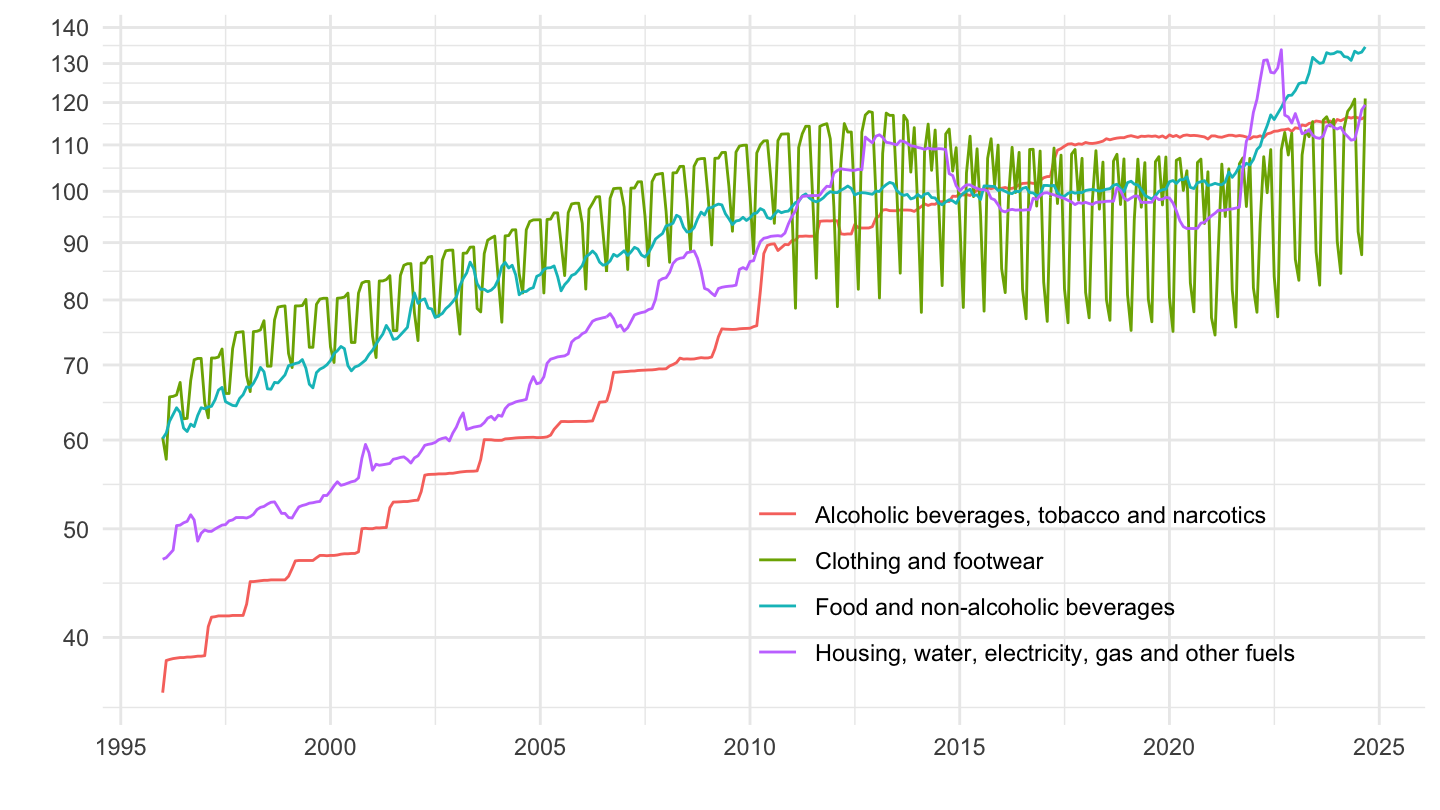
CP05, CP06, CP07, CP08
Code
prc_hicp_midx %>%
filter(unit == "I15",
coicop %in% c("CP05", "CP06", "CP07", "CP08"),
geo %in% c("EL")) %>%
month_to_date %>%
ggplot(.) + geom_line(aes(x = date, y = values, color = Coicop)) +
theme_minimal() + xlab("") + ylab("") +
scale_x_date(breaks = seq(1960, 2100, 5) %>% paste0("-01-01") %>% as.Date,
labels = date_format("%Y")) +
scale_y_log10(breaks = seq(0, 200, 10)) +
theme(legend.position = c(0.7, 0.8),
legend.title = element_blank())
CP09, CP10, CP11, CP12
Code
prc_hicp_midx %>%
filter(unit == "I15",
coicop %in% c("CP09", "CP10", "CP11", "CP12"),
geo %in% c("EL")) %>%
month_to_date %>%
ggplot(.) + geom_line(aes(x = date, y = values, color = Coicop)) +
theme_minimal() + xlab("") + ylab("") +
scale_x_date(breaks = seq(1960, 2100, 5) %>% paste0("-01-01") %>% as.Date,
labels = date_format("%Y")) +
scale_y_log10(breaks = seq(0, 200, 10)) +
theme(legend.position = c(0.7, 0.2),
legend.title = element_blank())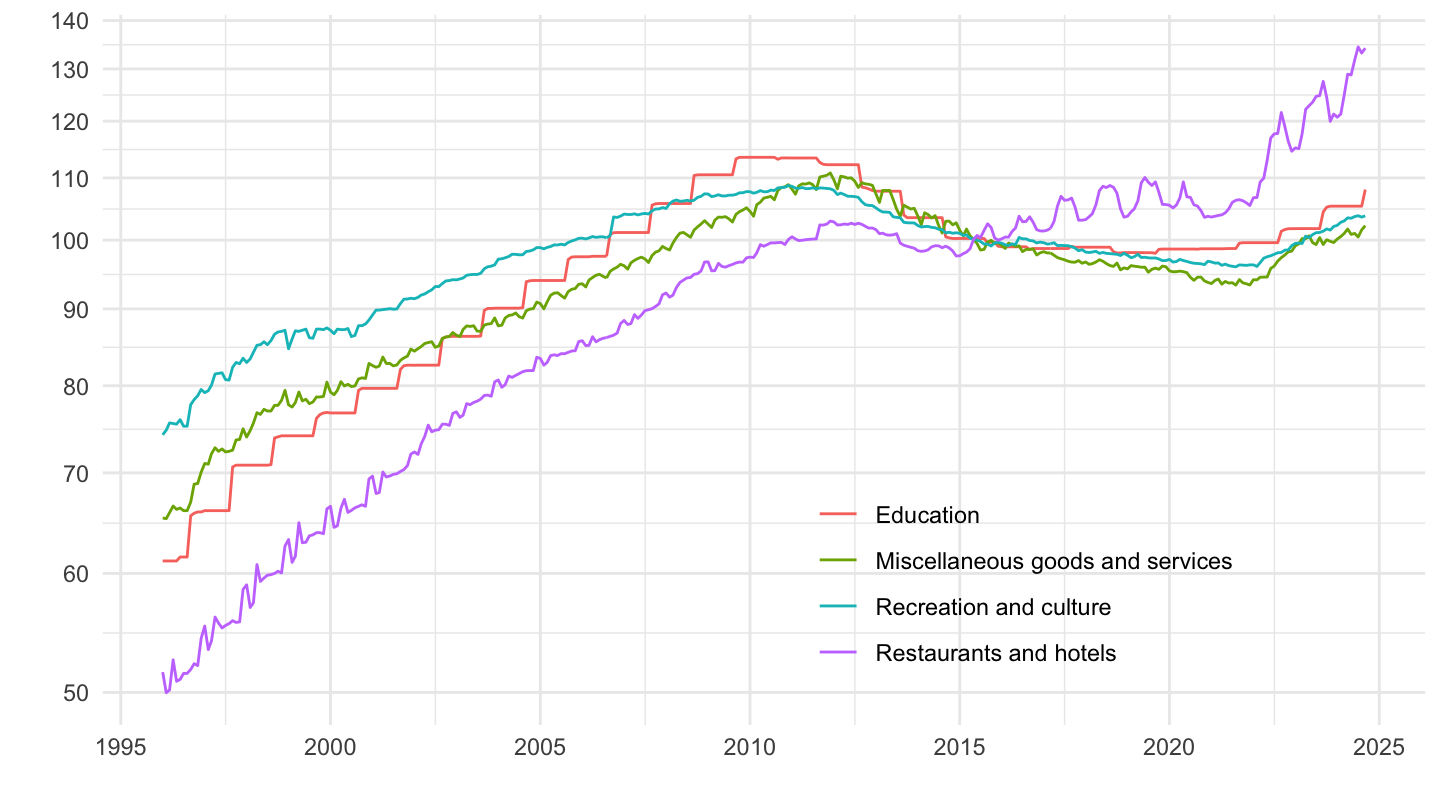
Euro area
Code
prc_hicp_midx %>%
filter(unit == "I15",
coicop %in% c("CP00", "CP04","CP041", "TOT_X_HOUS"),
geo %in% c("EA")) %>%
month_to_date %>%
ggplot(.) + geom_line(aes(x = date, y = values, color = Coicop)) +
theme_minimal() + xlab("") + ylab("") +
scale_x_date(breaks = seq(1960, 2100, 5) %>% paste0("-01-01") %>% as.Date,
labels = date_format("%Y")) +
scale_y_log10(breaks = seq(0, 200, 10)) +
theme(legend.position = c(0.7, 0.2),
legend.title = element_blank())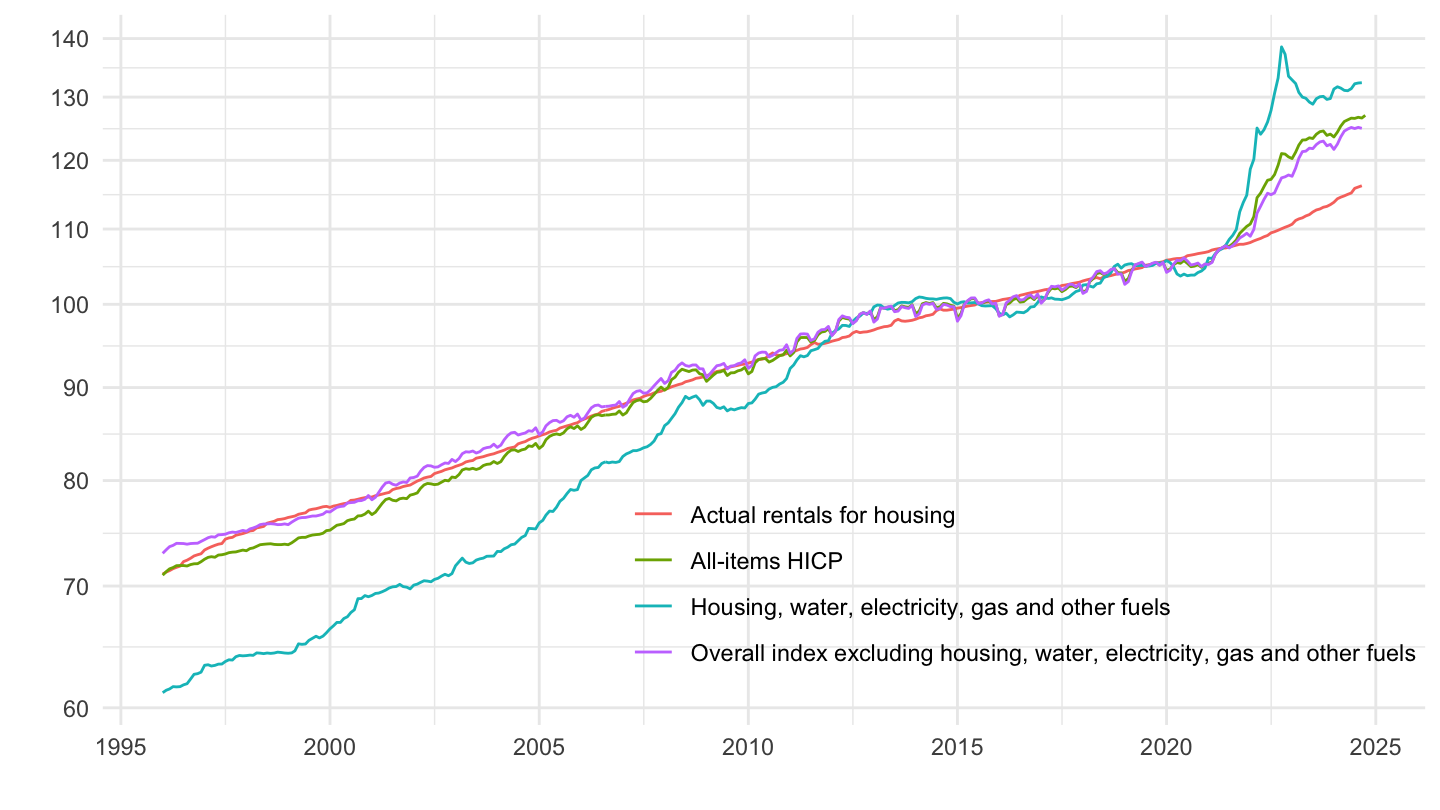
Rents, All, Food, Restaurants
France
Code
prc_hicp_midx %>%
filter(unit == "I15",
coicop %in% c("CP00", "CP041", "CP11", "CP01"),
geo %in% c("FR")) %>%
month_to_date %>%
ggplot(.) + geom_line(aes(x = date, y = values, color = Coicop)) +
theme_minimal() + xlab("") + ylab("") +
scale_x_date(breaks = seq(1960, 2100, 5) %>% paste0("-01-01") %>% as.Date,
labels = date_format("%Y")) +
scale_y_log10(breaks = seq(0, 200, 10)) +
theme(legend.position = c(0.7, 0.2),
legend.title = element_blank())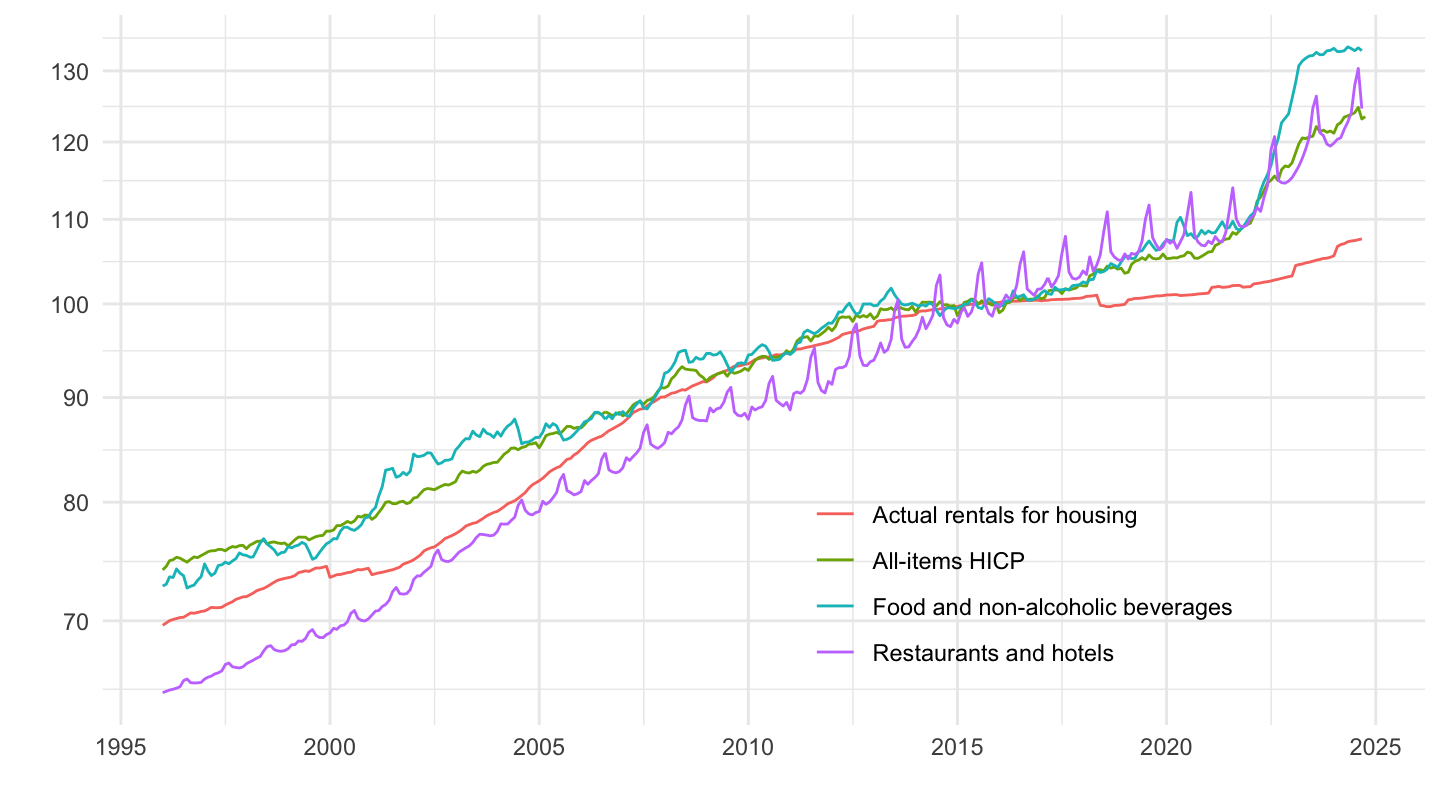
Germany
Code
prc_hicp_midx %>%
filter(unit == "I15",
coicop %in% c("CP00", "CP041", "CP11", "CP01"),
geo %in% c("DE")) %>%
month_to_date %>%
ggplot(.) + geom_line(aes(x = date, y = values, color = Coicop)) +
theme_minimal() + xlab("") + ylab("") +
scale_x_date(breaks = seq(1960, 2100, 5) %>% paste0("-01-01") %>% as.Date,
labels = date_format("%Y")) +
scale_y_log10(breaks = seq(0, 200, 10)) +
theme(legend.position = c(0.7, 0.2),
legend.title = element_blank())
Spain
All
Code
prc_hicp_midx %>%
filter(unit == "I15",
coicop %in% c("CP00", "CP041", "CP11", "CP01"),
geo %in% c("ES")) %>%
month_to_date %>%
ggplot(.) + geom_line(aes(x = date, y = values, color = Coicop)) +
theme_minimal() + xlab("") + ylab("") +
scale_x_date(breaks = seq(1960, 2100, 5) %>% paste0("-01-01") %>% as.Date,
labels = date_format("%Y")) +
scale_y_log10(breaks = seq(0, 200, 10)) +
theme(legend.position = c(0.7, 0.2),
legend.title = element_blank())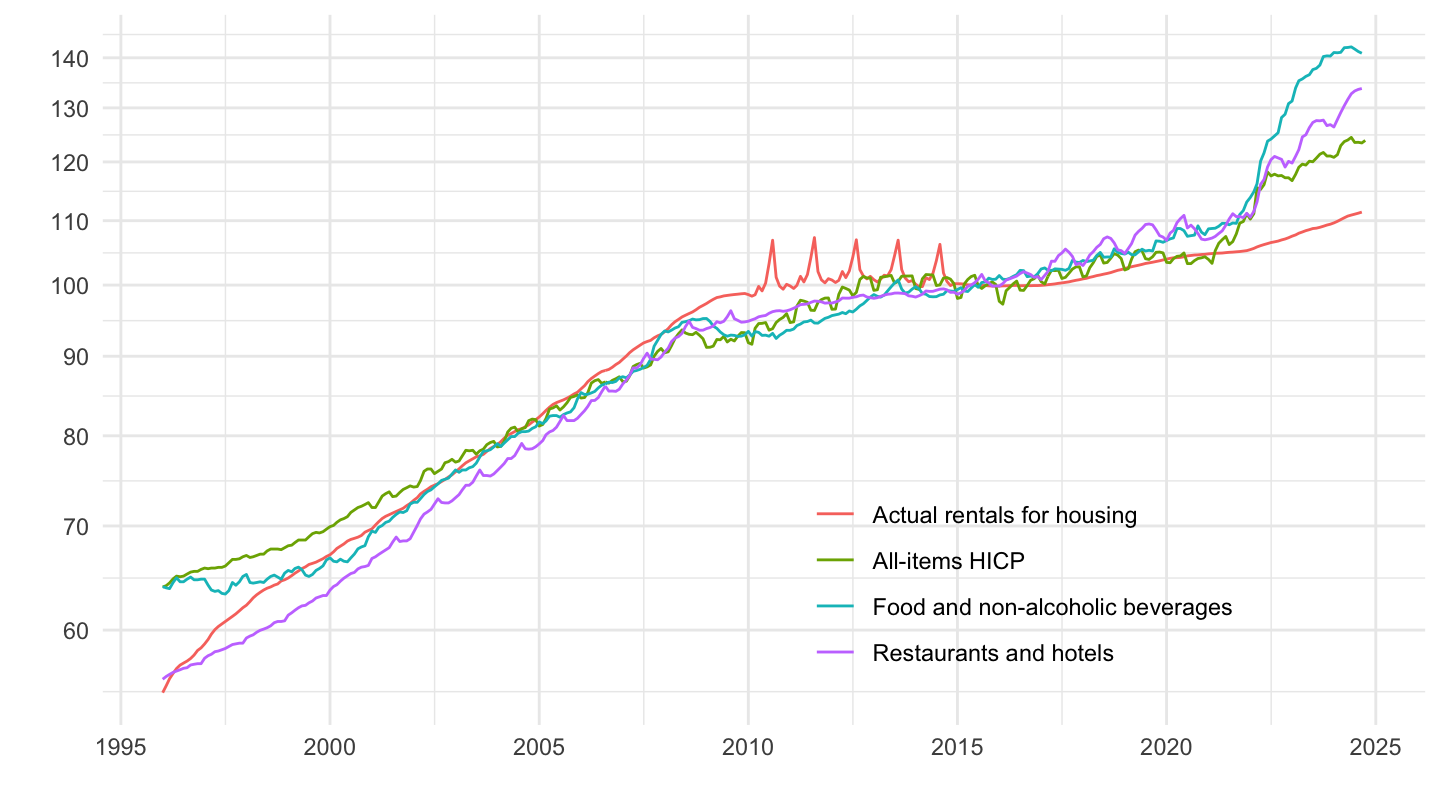
2007-
Code
prc_hicp_midx %>%
filter(unit == "I15",
coicop %in% c("CP00", "CP041", "CP11", "CP01"),
geo %in% c("ES")) %>%
month_to_date %>%
filter(date >= as.Date("2007-01-01")) %>%
ggplot(.) + geom_line(aes(x = date, y = values, color = Coicop)) +
theme_minimal() + xlab("") + ylab("") +
scale_x_date(breaks = seq(1960, 2100, 5) %>% paste0("-01-01") %>% as.Date,
labels = date_format("%Y")) +
scale_y_log10(breaks = seq(0, 200, 2)) +
theme(legend.position = c(0.7, 0.2),
legend.title = element_blank())
Greece
Code
prc_hicp_midx %>%
filter(unit == "I15",
coicop %in% c("CP00", "CP041", "CP11", "CP01"),
geo %in% c("EL")) %>%
month_to_date %>%
ggplot(.) + geom_line(aes(x = date, y = values, color = Coicop)) +
theme_minimal() + xlab("") + ylab("") +
scale_x_date(breaks = seq(1960, 2100, 5) %>% paste0("-01-01") %>% as.Date,
labels = date_format("%Y")) +
scale_y_log10(breaks = seq(0, 200, 10)) +
theme(legend.position = c(0.7, 0.2),
legend.title = element_blank())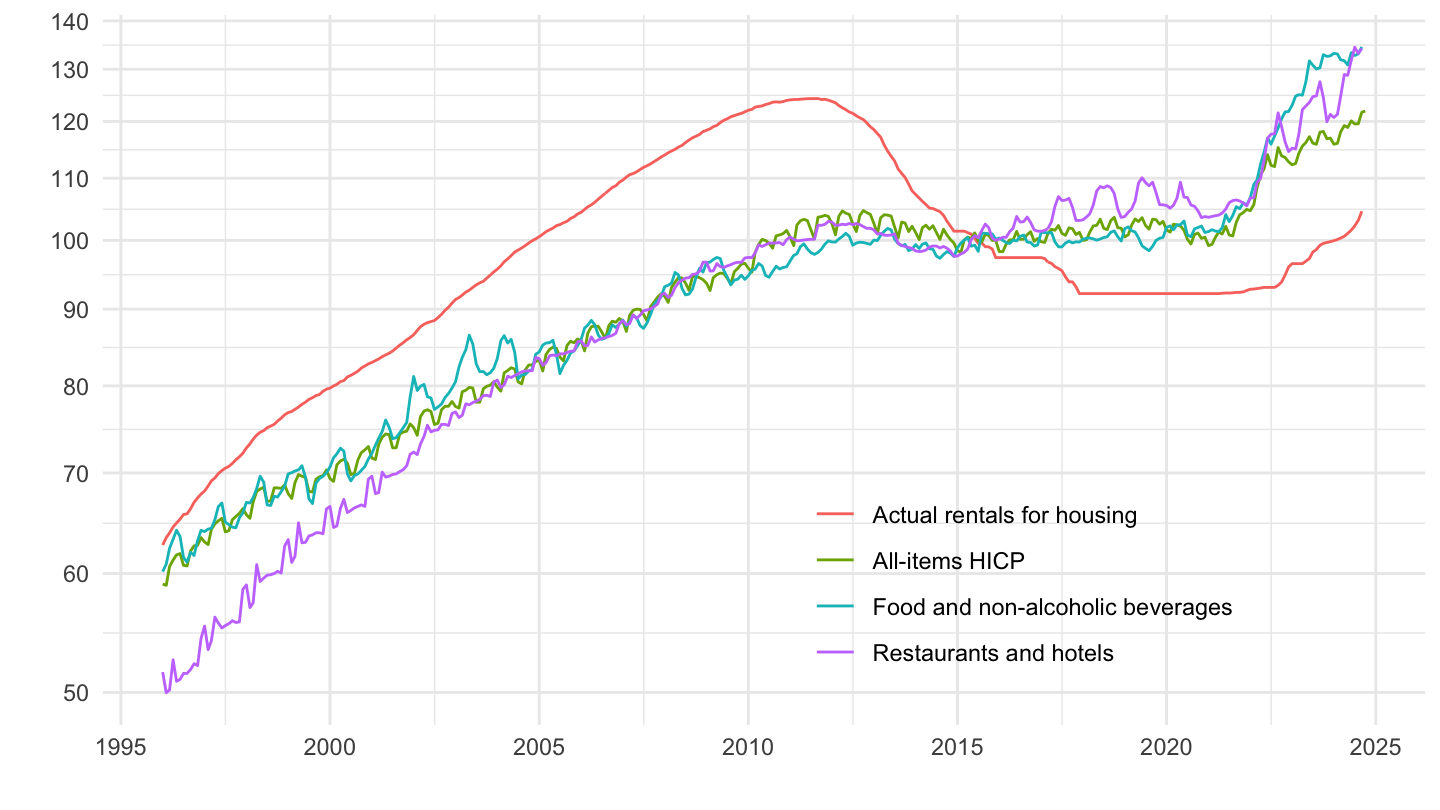
Belgium
Code
prc_hicp_midx %>%
filter(unit == "I15",
coicop %in% c("CP00", "CP041", "CP11", "CP01"),
geo %in% c("BE")) %>%
month_to_date %>%
ggplot(.) + geom_line(aes(x = date, y = values, color = Coicop)) +
theme_minimal() + xlab("") + ylab("") +
scale_x_date(breaks = seq(1960, 2100, 5) %>% paste0("-01-01") %>% as.Date,
labels = date_format("%Y")) +
scale_y_log10(breaks = seq(0, 200, 10)) +
theme(legend.position = c(0.7, 0.2),
legend.title = element_blank())
Iceland
All
Code
prc_hicp_midx %>%
filter(unit == "I15",
coicop %in% c("CP00", "CP041", "CP11", "CP01"),
geo %in% c("IS")) %>%
month_to_date %>%
ggplot(.) + geom_line(aes(x = date, y = values, color = Coicop)) +
theme_minimal() + xlab("") + ylab("") +
scale_x_date(breaks = seq(1960, 2100, 5) %>% paste0("-01-01") %>% as.Date,
labels = date_format("%Y")) +
scale_y_log10(breaks = seq(0, 200, 10)) +
theme(legend.position = c(0.7, 0.2),
legend.title = element_blank())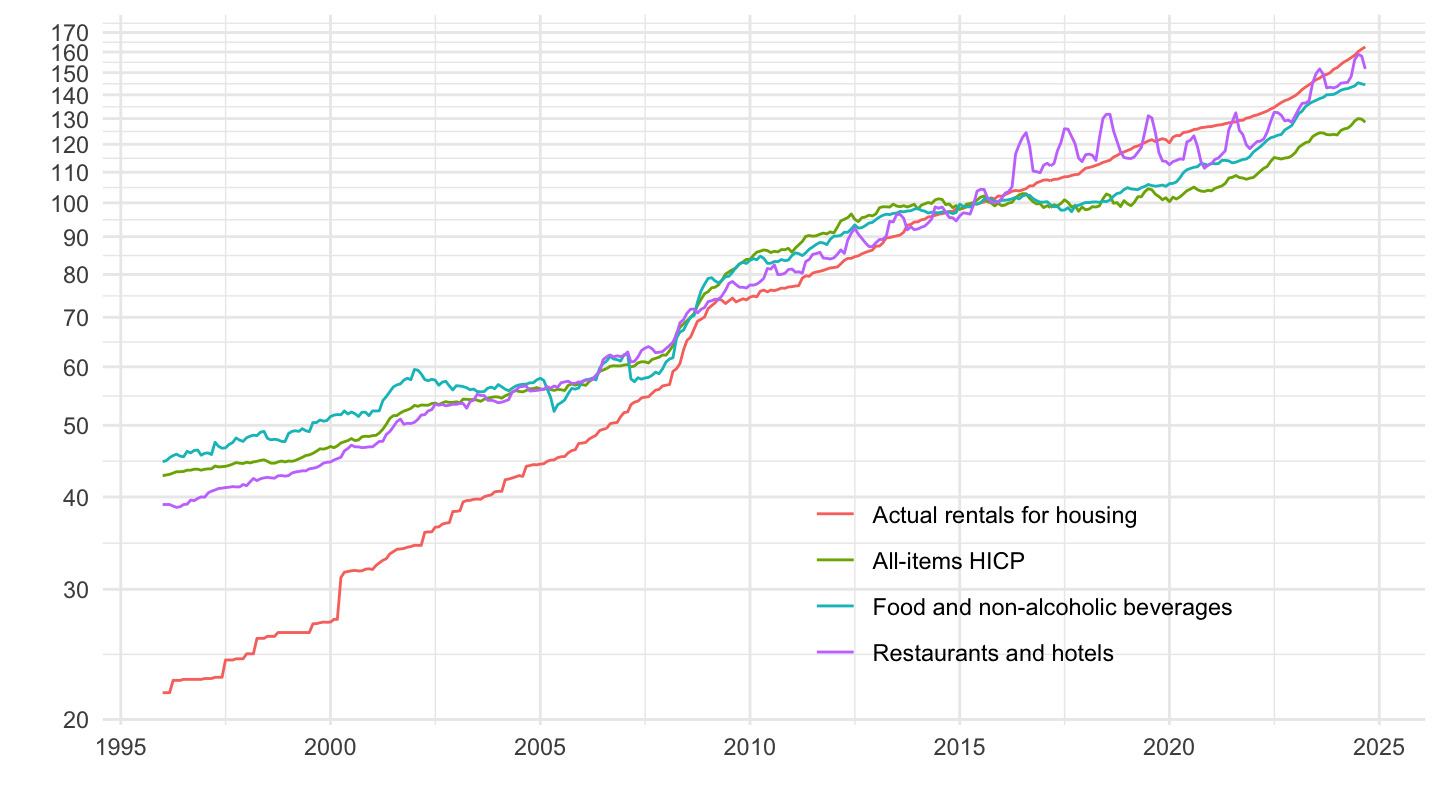
2007
Code
prc_hicp_midx %>%
filter(unit == "I15",
coicop %in% c("CP00", "CP041", "CP11", "CP01"),
geo %in% c("IS")) %>%
month_to_date %>%
filter(date >= as.Date("2007-01-01")) %>%
ggplot(.) + geom_line(aes(x = date, y = values, color = Coicop)) +
theme_minimal() + xlab("") + ylab("") +
scale_x_date(breaks = seq(1960, 2100, 2) %>% paste0("-01-01") %>% as.Date,
labels = date_format("%Y")) +
scale_y_log10(breaks = seq(0, 200, 10)) +
theme(legend.position = c(0.7, 0.2),
legend.title = element_blank())