
Last observation: déc. 1992 (N = 228) · 1992 (N = 375)
First observation: 1949 (N = 117) · janv. 1949 (N = 105)
Last data update: 09 oct. 2026, 22:44
Last compile: 10 oct. 2026, 01:13
`IPC-1970-1980` |>
  group_by(TIME_PERIOD) |>
  summarise(Nobs = n()) |>
  arrange(desc(TIME_PERIOD)) |>
  head(1) |>
print_table_conditional()| TIME_PERIOD | Nobs |
|---|---|
| 1992-12 | 228 |
i_g("bib/insee/series-longues-macroeconomiques-1949-1979/historique.png")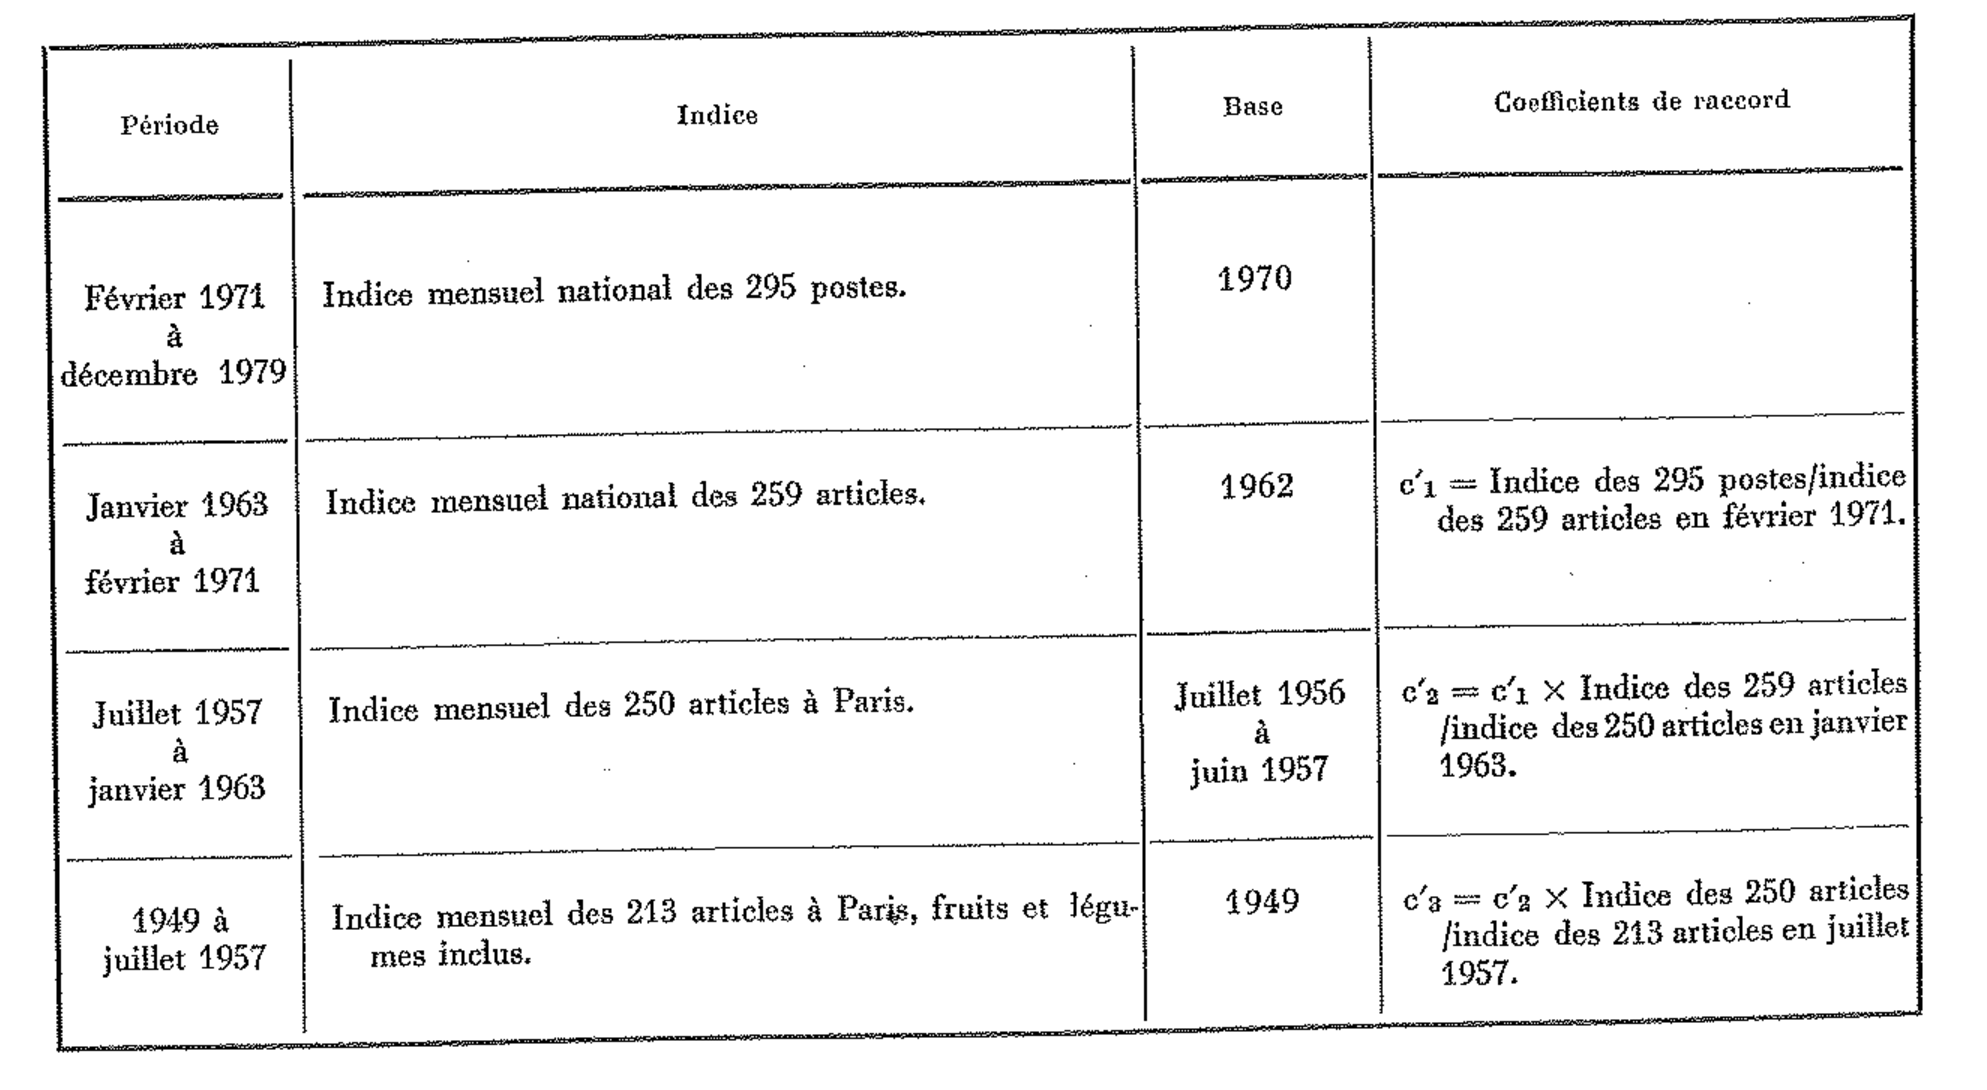
`IPC-1970-1980` |>
  filter(TIME_PERIOD %in% c("1949", "1969", "1992", "1979", "1989"),
         CORRECTION == "BRUT",
         NATURE == "POND",
         REF_AREA == "FM") |>
  select_if(function(col) length(unique(col)) > 1) |>
  select(-IDBANK, -TITLE_FR, -TITLE_EN, -DECIMALS) |>


  spread(TIME_PERIOD, OBS_VALUE) |>
print_table_conditional()`IPC-1970-1980` |>
filter(NATURE == "POND",
PRODUITS_IPC_1970_1980 == "760") |>
year_to_date() |>
mutate(OBS_VALUE = OBS_VALUE/10000) |>
ggplot() + ylab("Poids des services de santé") + xlab("") + theme_minimal() +
geom_line(aes(x = date, y = OBS_VALUE)) +
scale_color_manual(values = viridis(3)[1:2]) +
scale_x_date(breaks = seq(1920, 2100, 2) |> paste0("-01-01") |> as.Date(),
labels = date_format("%Y")) +
scale_y_continuous(breaks = 0.01*seq(0, 10, 0.1),
labels = percent_format(accuracy = .1))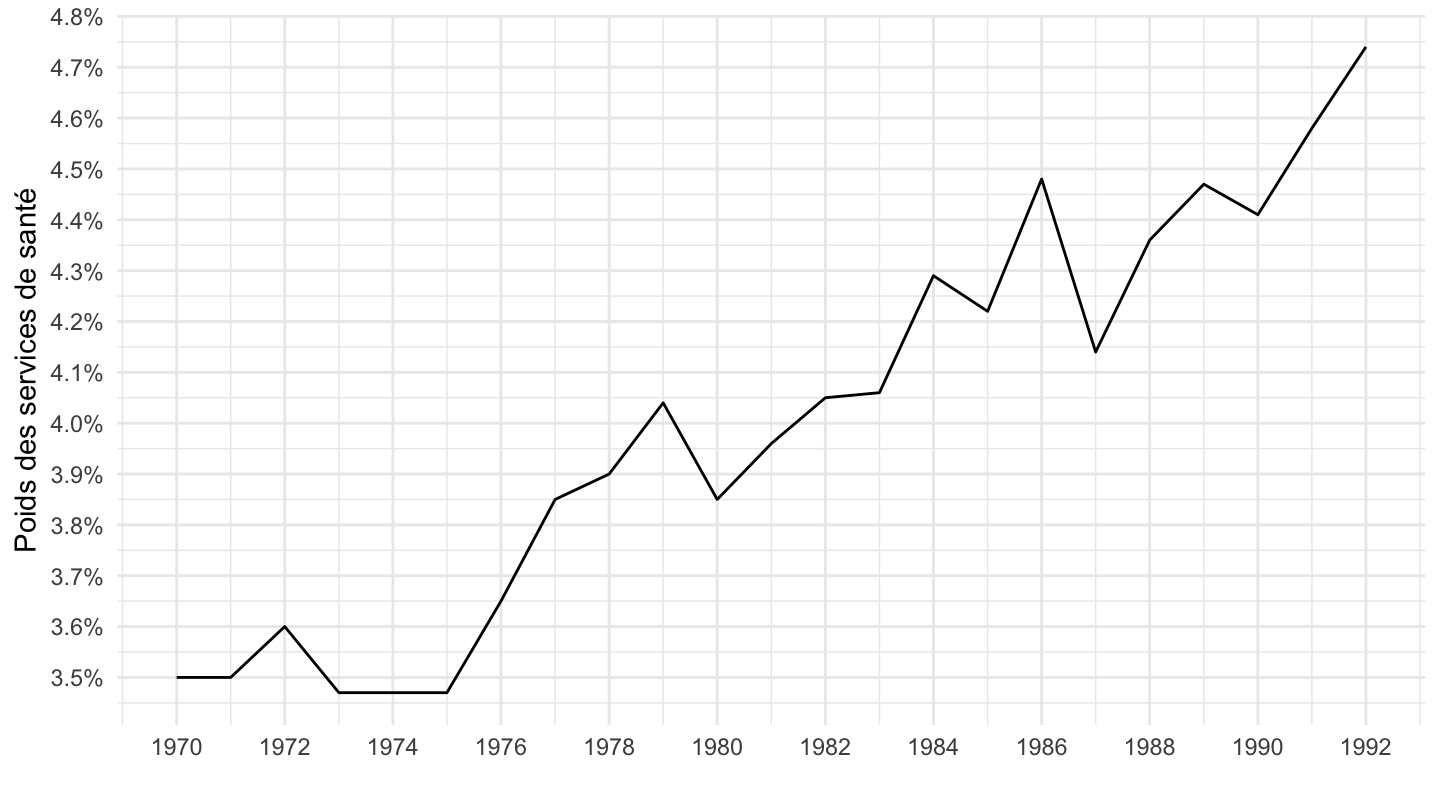
`IPC-1970-1980` |>
  filter(NATURE == "POND",
         PRODUITS_IPC_1970_1980 == "587") |>
  year_to_date() |>
  mutate(OBS_VALUE = OBS_VALUE/10000) |>
  ggplot() + ylab("Poids des produits pharmaceutiques") + xlab("") + theme_minimal() +
  geom_line(aes(x = date, y = OBS_VALUE)) +
  scale_color_manual(values = viridis(3)[1:2]) +
  scale_x_date(breaks = seq(1920, 2100, 2) |> paste0("-01-01") |> as.Date(),
               labels = date_format("%Y")) +
  scale_y_continuous(breaks = 0.01*seq(0, 10, 0.1),
                     labels = percent_format(accuracy = .1))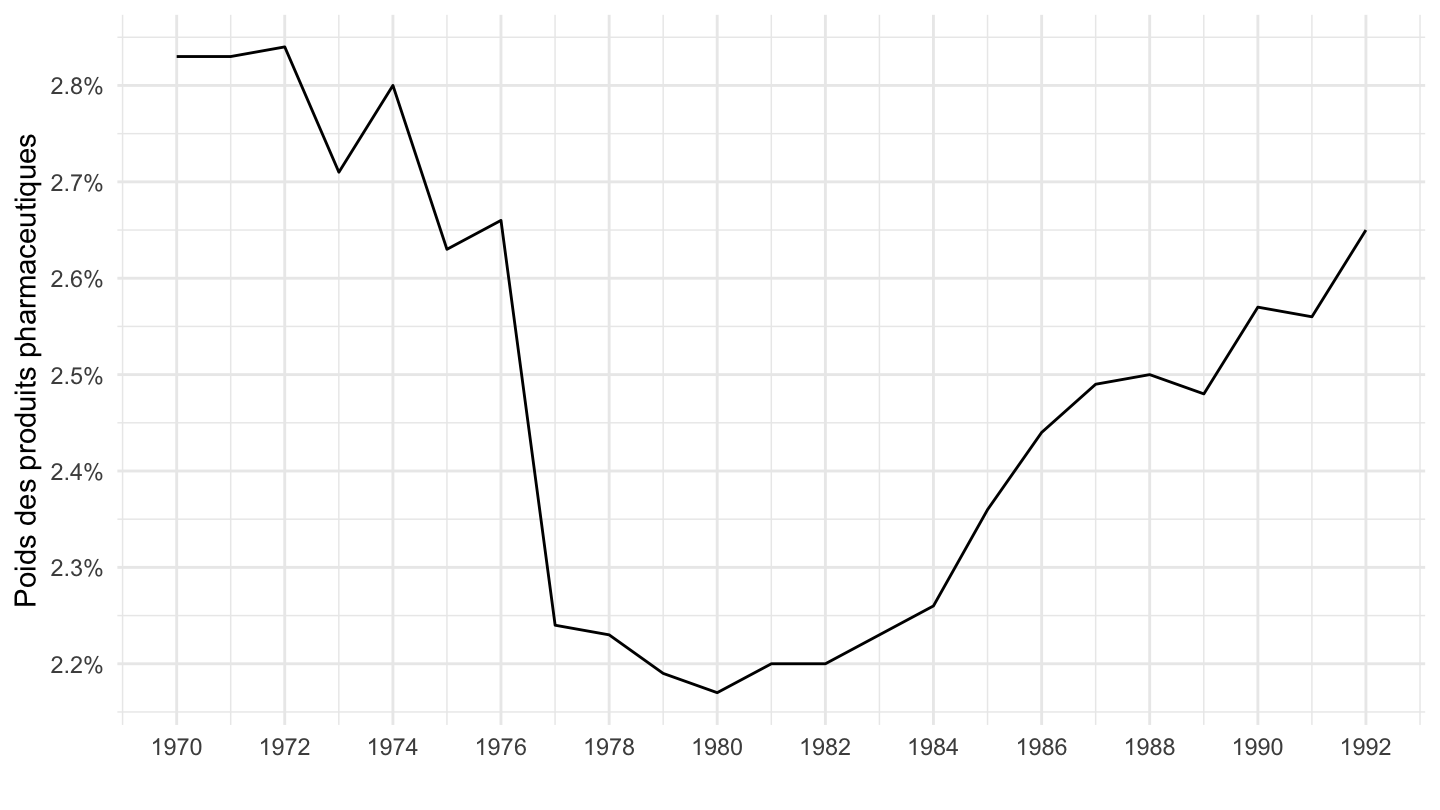
`IPC-1970-1980` |>
  filter(TIME_PERIOD %in% c("1949", "1969"),
         CORRECTION == "BRUT",
         NATURE == "INDICE",
         REF_AREA == "FM") |>
  mutate(TITLE_FR = gsub("Indice des prix des 295 postes - Base 100 en 1970 - ", "", TITLE_FR),
         TITLE_FR = gsub("Indice des prix des 295 postes - Base 100 en 1980 - ", "", TITLE_FR)) |>
  select(TITLE_FR, BASIND, PROD = PRODUITS_IPC_1970_1980, REGR = REGROUPEMENTS_IPC_1970_1980, TIME_PERIOD, OBS_VALUE) |>
  spread(TIME_PERIOD, OBS_VALUE) |>
print_table_conditional()`IPC-1970-1980` |>
filter(INDICATEUR == "IPC",
REGROUPEMENTS_IPC_1970_1980 == "PARIS11" | PRODUITS_IPC_1970_1980 == "711",
BASIND == "1980",
FREQ == "M") |>
month_to_date() |>
group_by(REGROUPEMENTS_IPC_1970_1980, PRODUITS_IPC_1970_1980) |>
mutate(OBS_VALUE = 100*OBS_VALUE/OBS_VALUE[date == as.Date("1990-01-01")]) |>
ggplot() + ylab("Indice des prix") + xlab("") + theme_minimal() +
geom_line(aes(x = date, y = OBS_VALUE, color = TITLE_FR, linetype = TITLE_FR)) +
scale_color_manual(values = viridis(4)[1:3]) +
scale_x_date(breaks = seq(1920, 2100, 5) |> paste0("-01-01") |> as.Date(),
labels = date_format("%Y")) +
theme(legend.position = c(0.75, 0.3),
legend.title = element_blank()) +
scale_y_log10(breaks = seq(0, 200, 10),
labels = dollar_format(accuracy = 1, prefix = ""))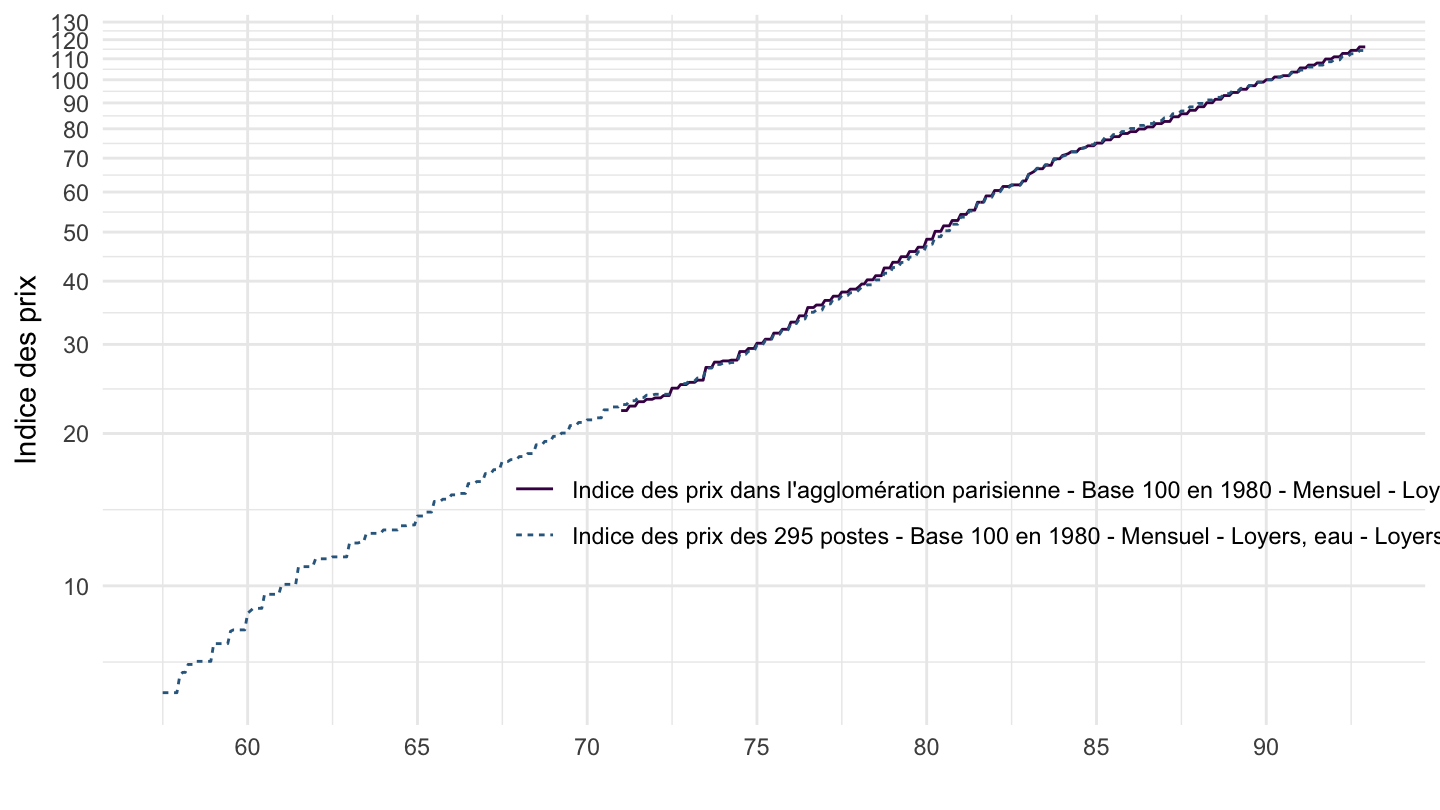
`IPC-1970-1980` |>
  filter(INDICATEUR == "IPC",
         REGROUPEMENTS_IPC_1970_1980 == "PARIS11" | PRODUITS_IPC_1970_1980 == "711",
         BASIND == "1970",
         FREQ == "M") |>
  month_to_date() |>
  group_by(REGROUPEMENTS_IPC_1970_1980, PRODUITS_IPC_1970_1980) |>
  mutate(OBS_VALUE = 100*OBS_VALUE/OBS_VALUE[date == as.Date("1983-01-01")]) |>
  ggplot() + ylab("Indice des prix") + xlab("") + theme_minimal() +
  geom_line(aes(x = date, y = OBS_VALUE, color = TITLE_FR, linetype = TITLE_FR)) +
  scale_color_manual(values = viridis(4)[1:3]) +
  scale_x_date(breaks = seq(1920, 2100, 5) |> paste0("-01-01") |> as.Date(),
               labels = date_format("%Y")) +
  theme(legend.position = c(0.75, 0.3),
        legend.title = element_blank()) +
  scale_y_log10(breaks = seq(0, 200, 10),
                     labels = dollar_format(accuracy = 1, prefix = ""))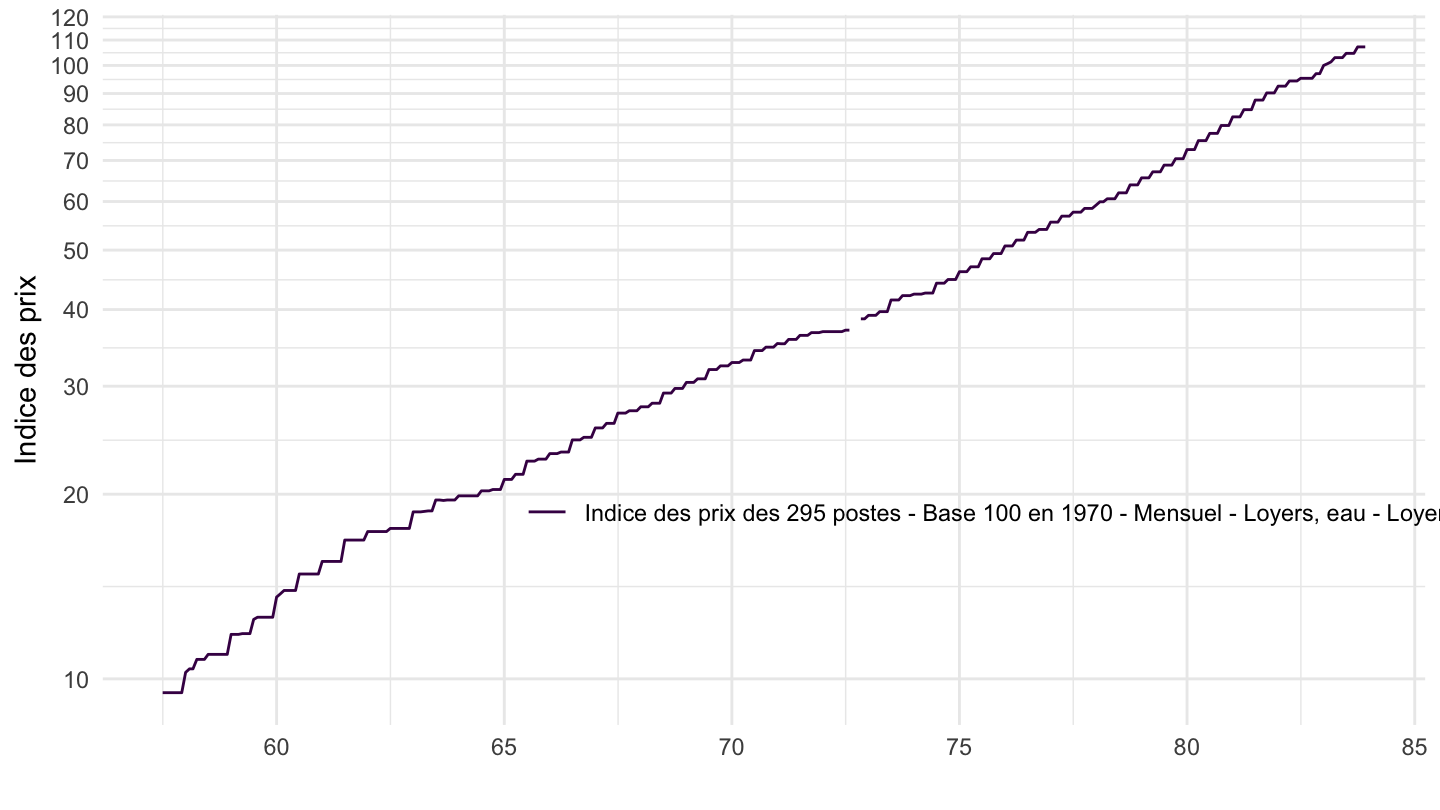
`IPC-1970-1980` |>
  filter(INDICATEUR == "IPC",
         PRODUITS_IPC_1970_1980 %in% c("711", "SO"),
         BASIND == "1970",
         FREQ == "M") |>
  month_to_date() |>

  group_by(PRODUITS_IPC_1970_1980) |>
  mutate(OBS_VALUE = 100*OBS_VALUE/OBS_VALUE[date == as.Date("1983-01-01")]) |>
  ggplot() + ylab("Indice des prix") + xlab("") + theme_minimal() +
  geom_line(aes(x = date, y = OBS_VALUE, color = PRODUITS_IPC_1970_1980, linetype = PRODUITS_IPC_1970_1980)) +
  scale_color_manual(values = viridis(4)[1:3]) +
  scale_x_date(breaks = seq(1920, 2100, 5) |> paste0("-01-01") |> as.Date(),
               labels = date_format("%Y")) +
  theme(legend.position = c(0.75, 0.3),
        legend.title = element_blank()) +
  scale_y_log10(breaks = seq(0, 200, 10),
                     labels = dollar_format(accuracy = 1, prefix = ""))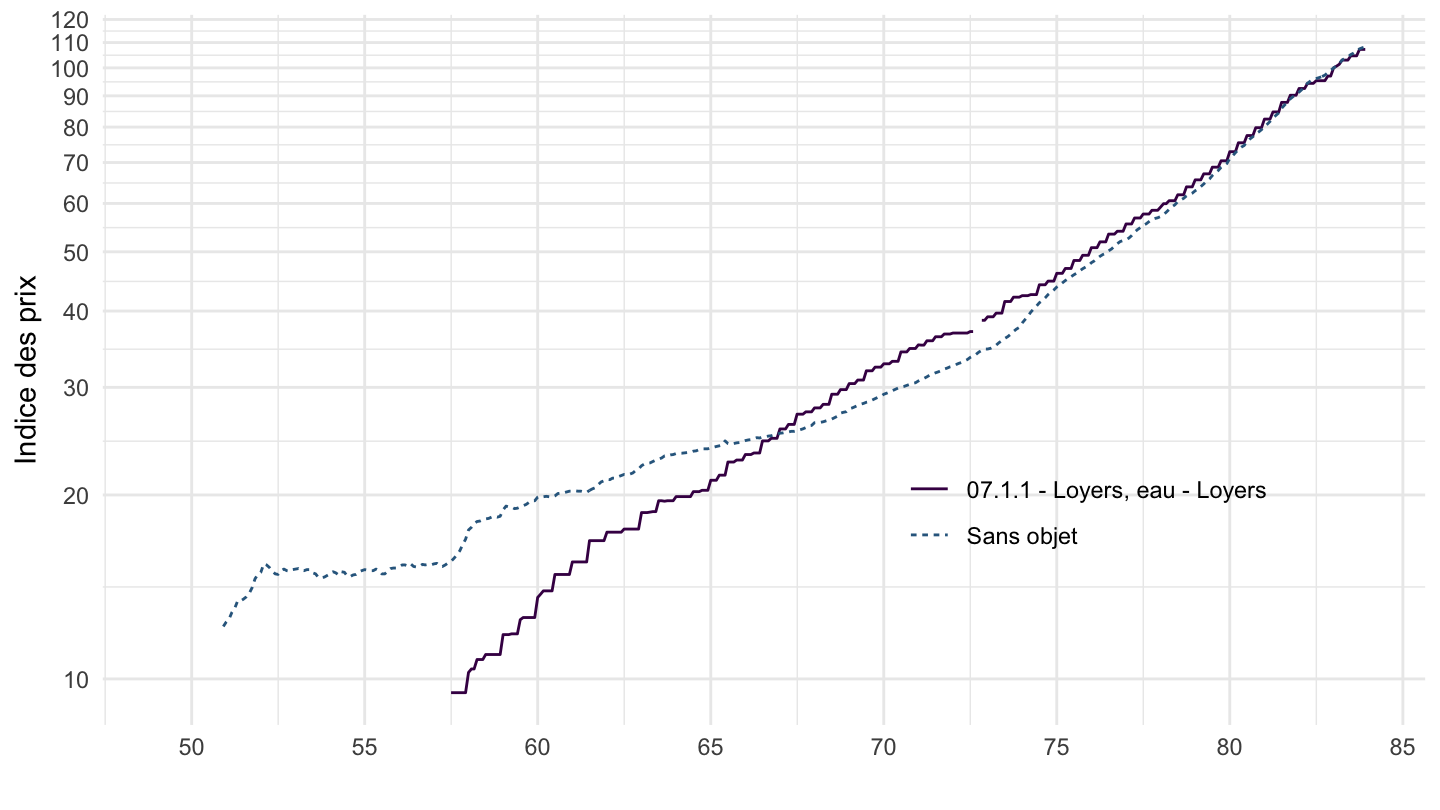
`IPC-1970-1980` |>
  filter(INDICATEUR == "IPC",
         PRODUITS_IPC_1970_1980 %in% c("711", "SO"),
         BASIND == "1970",
         FREQ == "M") |>
  month_to_date() |>
  filter(date >=as.Date("1960-01-01")) |>

  group_by(PRODUITS_IPC_1970_1980) |>
  mutate(OBS_VALUE = 100*OBS_VALUE/OBS_VALUE[date == as.Date("1960-01-01")]) |>
  ggplot() + ylab("Indice des prix") + xlab("") + theme_minimal() +
  geom_line(aes(x = date, y = OBS_VALUE, color = PRODUITS_IPC_1970_1980, linetype = PRODUITS_IPC_1970_1980)) +
  scale_color_manual(values = viridis(4)[1:3]) +
  scale_x_date(breaks = seq(1920, 2100, 5) |> paste0("-01-01") |> as.Date(),
               labels = date_format("%Y")) +
  theme(legend.position = c(0.75, 0.3),
        legend.title = element_blank()) +
  scale_y_log10(breaks = seq(0, 1000, 50),
                     labels = dollar_format(accuracy = 1, prefix = ""))
`IPC-1970-1980` |>
  filter(INDICATEUR == "IPC",
         PRODUITS_IPC_1970_1980 %in% c("711", "SO"),
         REGROUPEMENTS_IPC_1970_1980 == "SO",
         BASIND == "1980",
         FREQ == "M") |>
  month_to_date() |>

  group_by(PRODUITS_IPC_1970_1980) |>
  mutate(OBS_VALUE = 100*OBS_VALUE/OBS_VALUE[date == as.Date("1983-01-01")]) |>
  ggplot() + ylab("Indice des prix") + xlab("") + theme_minimal() +
  geom_line(aes(x = date, y = OBS_VALUE, color = PRODUITS_IPC_1970_1980, linetype = PRODUITS_IPC_1970_1980)) +
  scale_color_manual(values = viridis(4)[1:3]) +
  scale_x_date(breaks = seq(1920, 2100, 5) |> paste0("-01-01") |> as.Date(),
               labels = date_format("%Y")) +
  theme(legend.position = c(0.75, 0.3),
        legend.title = element_blank()) +
  scale_y_log10(breaks = seq(0, 200, 10),
                     labels = dollar_format(accuracy = 1, prefix = ""))
`IPC-1970-1980` |>
  filter(INDICATEUR == "IPC",
         REGROUPEMENTS_IPC_1970_1980 == "PARIS11" | PRODUITS_IPC_1970_1980 == "711",
         BASIND == "1970",
         FREQ == "A") |>
  year_to_date() |>
  group_by(REGROUPEMENTS_IPC_1970_1980, PRODUITS_IPC_1970_1980) |>
  mutate(OBS_VALUE = 100*OBS_VALUE/OBS_VALUE[date == as.Date("1983-01-01")]) |>
  ggplot() + ylab("Indice des prix") + xlab("") + theme_minimal() +
  geom_line(aes(x = date, y = OBS_VALUE, color = TITLE_FR, linetype = TITLE_FR)) +
  scale_color_manual(values = viridis(4)[1:3]) +
  scale_x_date(breaks = seq(1920, 2100, 5) |> paste0("-01-01") |> as.Date(),
               labels = date_format("%Y")) +
  theme(legend.position = c(0.75, 0.3),
        legend.title = element_blank()) +
  scale_y_log10(breaks = seq(0, 200, 10),
                     labels = dollar_format(accuracy = 1, prefix = ""))