2017 PPP Benchmark results
Data - OECD
François Geerolf
Info
Data on inflation
inflation %>%
  arrange(-(dataset == "PPP2017")) %>%
  mutate(Title = read_lines(paste0("~/Dropbox/website/data/", source, "/",dataset, ".Rmd"), skip = 1, n_max = 1) %>% gsub("title: ", "", .) %>% gsub("\"", "", .)) %>%
  mutate(Download = as.Date(file.info(paste0("~/Dropbox/website/data/", source, "/", dataset, ".RData"))$mtime),
         Compile = as.Date(file.info(paste0("~/Dropbox/website/data/", source, "/", dataset, ".html"))$mtime)) %>%
  mutate(Compile = paste0("[", Compile, "](https://fgeerolf.com/data/", source, "/", dataset, '.html)')) %>%
print_table_conditional_30()| source | dataset | Title | Download | Compile |
|---|---|---|---|---|
| oecd | PPP2017 | 2017 PPP Benchmark results | 2023-07-25 | 2024-04-15 |
| bis | CPI | Consumer Price Index | 2022-01-20 | 2024-04-15 |
| ecb | CES | Consumer Expectations Survey | 2024-01-12 | 2024-04-15 |
| eurostat | nama_10_co3_p3 | Final consumption expenditure of households by consumption purpose (COICOP 3 digit) | 2024-04-15 | 2024-04-15 |
| eurostat | prc_hicp_cow | HICP - country weights | 2024-04-15 | 2024-04-15 |
| eurostat | prc_hicp_ctrb | Contributions to euro area annual inflation (in percentage points) | 2024-04-09 | 2024-04-15 |
| eurostat | prc_hicp_inw | HICP - item weights | 2024-04-09 | 2024-04-15 |
| eurostat | prc_hicp_manr | HICP (2015 = 100) - monthly data (annual rate of change) | 2024-04-15 | 2024-04-15 |
| eurostat | prc_hicp_midx | HICP (2015 = 100) - monthly data (index) | 2024-04-09 | 2024-04-15 |
| eurostat | prc_hicp_mmor | HICP (2015 = 100) - monthly data (monthly rate of change) | 2024-04-15 | 2024-04-15 |
| eurostat | prc_ppp_ind | Purchasing power parities (PPPs), price level indices and real expenditures for ESA 2010 aggregates | 2024-04-09 | 2024-04-15 |
| eurostat | sts_inpp_m | Producer prices in industry, total - monthly data | 2024-04-15 | 2024-04-15 |
| eurostat | sts_inppd_m | Producer prices in industry, domestic market - monthly data | 2024-04-15 | 2024-04-15 |
| eurostat | sts_inppnd_m | Producer prices in industry, non domestic market - monthly data | 2024-04-09 | 2024-04-15 |
| fred | cpi | Consumer Price Index | 2024-04-15 | 2024-04-15 |
| fred | inflation | Inflation | 2024-04-15 | 2024-04-15 |
| imf | CPI | Consumer Price Index - CPI | 2020-03-13 | 2024-01-06 |
| oecd | MEI_PRICES_PPI | Producer Prices - MEI_PRICES_PPI | 2024-04-15 | 2024-04-16 |
| oecd | PRICES_CPI | Consumer price indices (CPIs) | 2024-04-15 | 2024-04-15 |
| wdi | FP.CPI.TOTL.ZG | Inflation, consumer prices (annual %) | 2024-04-14 | 2023-01-15 |
| wdi | NY.GDP.DEFL.KD.ZG | Inflation, GDP deflator (annual %) | 2024-04-14 | 2024-04-14 |
Last
| obsTime | Nobs |
|---|---|
| 2017 | 56680 |
TAB
CAT
UNIT
PPP2017 %>%
  left_join(PPP2017_var$UNIT, by = "UNIT") %>%
  group_by(UNIT, Unit) %>%
  summarise(Nobs = n()) %>%
print_table_conditional()| UNIT | Unit | Nobs |
|---|---|---|
| EUIDX | European Union = 100 | 12064 |
| EUR | Euro | 9984 |
| NATCUR | National currency | 5096 |
| NATEU | National currency per Euro | 2496 |
| NATUSD | National currency per US dollar | 4992 |
| OECDIDX | OECD=100 | 12064 |
| USD | US Dollar | 9984 |
LOCATION
PPP2017 %>%
  left_join(PPP2017_var$LOCATION, by = "LOCATION") %>%
  group_by(LOCATION, Location) %>%
  summarise(Nobs = n()) %>%
  arrange(-Nobs) %>%
  mutate(Flag = gsub(" ", "-", str_to_lower(gsub(" ", "-", Location))),
         Flag = paste0('<img src="../../icon/flag/vsmall/', Flag, '.png" alt="Flag">')) %>%
  select(Flag, everything()) %>%
  {if (is_html_output()) datatable(., filter = 'top', rownames = F, escape = F) else .}
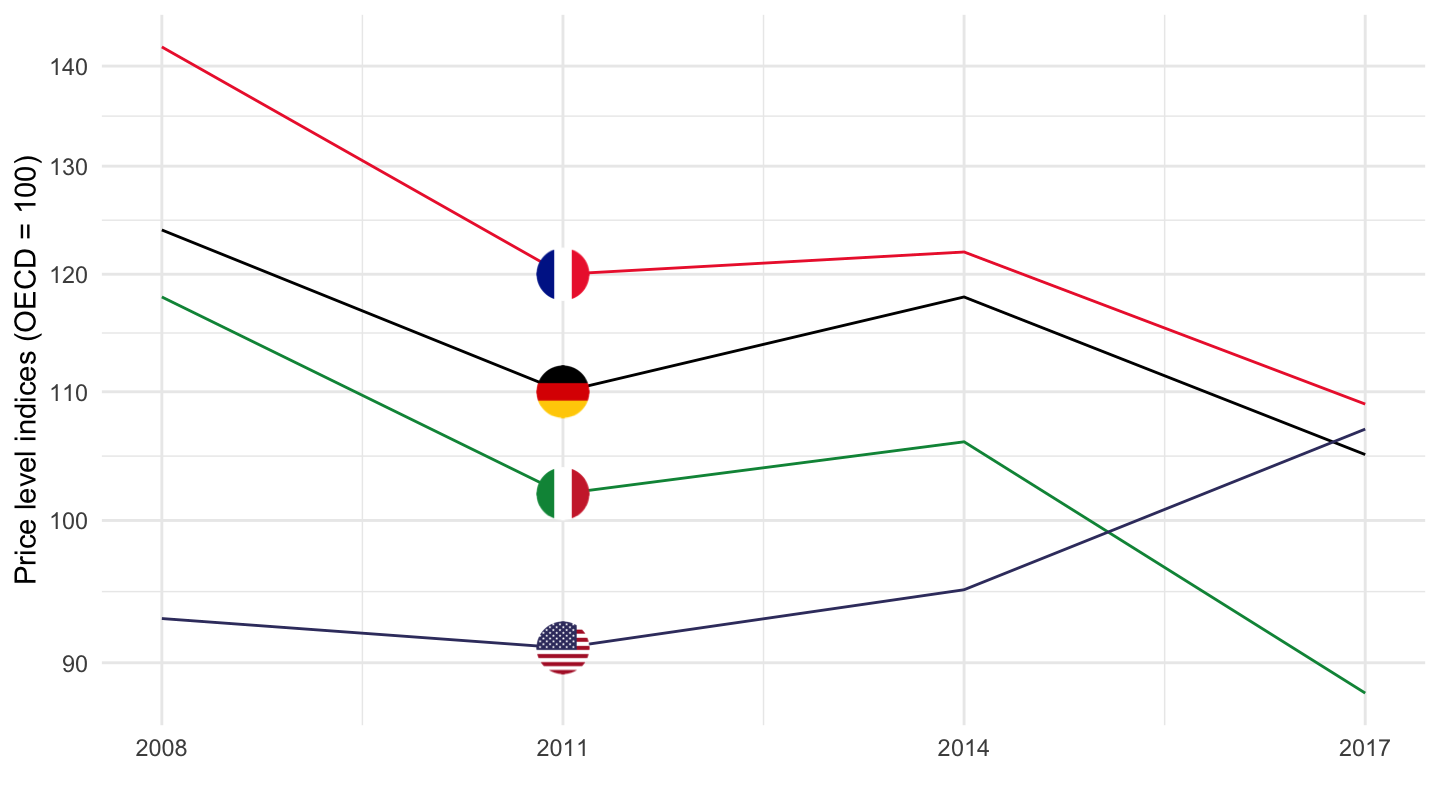
Table 1.11: Price level indices (OECD = 100)
Table
PPP %>%
  filter(TAB == "TAB1_11",
         LOCATION %in% c("FRA", "ITA", "USA"),
         obsTime == "2017") %>%
  left_join(PPP2017_var$CAT, by = "CAT") %>%
  left_join(PPP2017_var$LOCATION, by = "LOCATION") %>%
  select(-LOCATION) %>%
  select_if(~ n_distinct(.) > 1) %>%
  spread(Location, obsValue) %>%
  arrange(-`France`) %>%
  print_table_conditional()
A0104 - Housing, water, electricity, gas and other fuels
PPP %>%
  filter(TAB == "TAB1_11",
         LOCATION %in% c("FRA", "ITA", "USA", "DEU"),
         CAT == "A0104") %>%
  left_join(PPP2017_var$LOCATION, by = "LOCATION") %>%
  year_to_date %>%
  left_join(colors, by = c("Location" = "country")) %>%
  ggplot(.) + theme_minimal() + scale_color_identity() +
  geom_line(aes(x = date, y = obsValue, color = color)) +
  xlab("") + ylab("Price level indices (OECD = 100)") + add_4flags +
  scale_x_date(breaks = seq(2005, 2020, 3) %>% paste0("-01-01") %>% as.Date,
               labels = date_format("%Y")) +
  scale_y_log10(breaks = seq(0, 200, 10))