Indices de prix de production et d’importation dans l’industrie
Data - INSEE
Info
Données sur l’inflation en France
| source | dataset | Title | .html | .rData |
|---|---|---|---|---|
| insee | ILC-ILAT-ICC | Indices pour la révision d’un bail commercial ou professionnel | 2026-02-16 | 2026-02-15 |
| insee | INDICES_LOYERS | Indices des loyers d'habitation (ILH) | 2026-02-16 | 2026-02-15 |
| insee | IPC-1970-1980 | Indice des prix à la consommation - Base 1970, 1980 | 2026-02-16 | 2026-02-15 |
| insee | IPC-1990 | Indices des prix à la consommation - Base 1990 | 2026-02-16 | 2026-02-15 |
| insee | IPC-2015 | Indice des prix à la consommation - Base 2015 | 2026-02-16 | 2026-02-16 |
| insee | IPC-PM-2015 | Prix moyens de vente de détail | 2026-02-16 | 2026-02-15 |
| insee | IPCH-2015 | Indices des prix à la consommation harmonisés | 2026-02-16 | 2026-02-15 |
| insee | IPCH-IPC-2015-ensemble | Indices des prix à la consommation harmonisés | 2026-02-16 | 2026-02-16 |
| insee | IPGD-2015 | Indice des prix dans la grande distribution | 2026-02-16 | 2025-12-20 |
| insee | IPLA-IPLNA-2015 | Indices des prix des logements neufs et Indices Notaires-Insee des prix des logements anciens | 2026-02-16 | 2026-02-15 |
| insee | IPPI-2015 | Indices de prix de production et d'importation dans l'industrie | 2026-02-16 | 2026-02-16 |
| insee | IRL | Indice pour la révision d’un loyer d’habitation | 2026-01-08 | 2026-02-16 |
| insee | SERIES_LOYERS | Variation des loyers | 2026-02-16 | 2026-02-16 |
| insee | T_CONSO_EFF_FONCTION | Consommation effective des ménages par fonction | 2026-02-16 | 2025-12-22 |
| insee | bdf2017 | Budget de famille 2017 | 2026-02-03 | 2023-11-21 |
| insee | echantillon-agglomerations-IPC-2024 | Échantillon d’agglomérations enquêtées de l’IPC en 2024 | 2026-01-27 | 2026-01-27 |
| insee | echantillon-agglomerations-IPC-2025 | Échantillon d’agglomérations enquêtées de l’IPC en 2025 | 2026-01-27 | 2026-01-27 |
| insee | liste-varietes-IPC-2024 | Liste des variétés pour la mesure de l'IPC en 2024 | 2026-01-27 | 2025-04-02 |
| insee | liste-varietes-IPC-2025 | Liste des variétés pour la mesure de l'IPC en 2025 | 2026-01-27 | 2026-01-27 |
| insee | ponderations-elementaires-IPC-2024 | Pondérations élémentaires 2024 intervenant dans le calcul de l’IPC | 2026-01-27 | 2025-04-02 |
| insee | ponderations-elementaires-IPC-2025 | Pondérations élémentaires 2025 intervenant dans le calcul de l’IPC | 2026-01-27 | 2026-01-27 |
| insee | table_conso_moyenne_par_categorie_menages | Montants de consommation selon différentes catégories de ménages | 2026-02-16 | 2026-01-27 |
| insee | table_poste_au_sein_sous_classe_ecoicopv2_france_entiere_ | Ventilation de chaque sous-classe (niveau 4 de la COICOP v2) en postes et leurs pondérations | 2026-02-16 | 2026-01-27 |
| insee | tranches_unitesurbaines | Poids de chaque tranche d’unités urbaines dans la consommation | 2026-02-16 | 2026-01-27 |
Info
LAST_UPDATE
Code
`IPPI-2015` %>%
  group_by(LAST_UPDATE) %>%
  summarise(Nobs = n()) %>%
  arrange(desc(LAST_UPDATE)) %>%
  print_table_conditional()
LAST_COMPILE
| LAST_COMPILE |
|---|
| 2026-02-21 |
Last
Code
`IPPI-2015` %>%
  group_by(TIME_PERIOD) %>%
  summarise(Nobs = n()) %>%
  arrange(desc(TIME_PERIOD)) %>%
  head(1) %>%
print_table_conditional()| TIME_PERIOD | Nobs |
|---|---|
| 2023-09 | 1810 |
INDICATEUR
Code
`IPPI-2015` %>%
  left_join(INDICATEUR, by = "INDICATEUR") %>%
  group_by(INDICATEUR, Indicateur) %>%
  summarise(Nobs = n()) %>%
  arrange(-Nobs) %>%
print_table_conditional()| INDICATEUR | Indicateur | Nobs |
|---|---|---|
| FR_PB_IPP | Indices des prix de production de l'industrie française pour le marché français - Prix de base | 96838 |
| ENS_IPP | Indices des prix de production de l'industrie française pour l'ensemble des marchés | 58597 |
| EXT_IPP | Indices des prix de production de l'industrie française pour les marchés extérieurs - Toutes zones | 50643 |
| IMP_IPP | Indices des prix d'importation des produits industriels - Toutes zones | 48075 |
| FR_PM_IPP | Indices des prix de production de l'industrie française pour le marché français - Prix de marché (indexation de contrats) | 38151 |
| EXT_ZE_IPP | Indices des prix de production de l'industrie française pour les marchés extérieurs - Zone Euro | 23269 |
| EXT_HZE_IPP | Indices des prix de production de l'industrie française pour les marchés extérieurs - Hors zone Euro | 22505 |
| IMP_ZE_IPP | Indices des prix d'importation des produits industriels - Zone Euro | 17849 |
| IMP_HZE_IPP | Indices des prix d'importation des produits industriels - Hors zone Euro | 17809 |
| OI_IPP | Indices de prix de l'offre intérieure de produits industriels (indexation de contrats) | 1342 |
PRODUIT_IPPI
Code
`IPPI-2015` %>%
  left_join(PRODUIT_IPPI, by = "PRODUIT_IPPI") %>%
  group_by(PRODUIT_IPPI, Produit_ippi) %>%
  summarise(Nobs = n()) %>%
  arrange(-Nobs) %>%
  print_table_conditional()
PRODUIT_DETAILLE_IPPI
Code
`IPPI-2015` %>%
  left_join(PRODUIT_DETAILLE_IPPI, by = "PRODUIT_DETAILLE_IPPI") %>%
  group_by(PRODUIT_DETAILLE_IPPI, Produit_detaille_ippi) %>%
  summarise(Nobs = n()) %>%
  arrange(-Nobs) %>%
  print_table_conditional()
TITLE_FR
Code
`IPPI-2015` %>%
  group_by(IDBANK, TITLE_FR) %>%
  summarise(Nobs = n()) %>%
  arrange(-Nobs) %>%
  {if (is_html_output()) datatable(., filter = 'top', rownames = F) else .}
EUROSTAT_IPPI
Code
`IPPI-2015` %>%
  left_join(EUROSTAT_IPPI, by = "EUROSTAT_IPPI") %>%
  group_by(EUROSTAT_IPPI, Eurostat_ippi) %>%
  summarise(Nobs = n()) %>%
  arrange(-Nobs) %>%
print_table_conditional()| EUROSTAT_IPPI | Eurostat_ippi | Nobs |
|---|---|---|
| BDM_EUR | BDM_EUR | 218831 |
| BDM | BDM | 156247 |
TIME_PERIOD
Code
`IPPI-2015` %>%
  group_by(TIME_PERIOD) %>%
  summarise(Nobs = n()) %>%
  arrange(desc(TIME_PERIOD)) %>%
  {if (is_html_output()) datatable(., filter = 'top', rownames = F) else .}
CPF 10.12 − Viandes de volailles
Prix de production
Tous
Code
`IPPI-2015` %>%
  filter(INDICATEUR %in% c("ENS_IPP", "EXT_IPP", "EXT_ZE_IPP", "EXT_HZE_IPP", "FR_PB_IPP", "FR_PM_IPP"),
         PRODUIT_IPPI == "CPF_10-12",
         PRODUIT_DETAILLE_IPPI == "SO") %>%
  left_join(INDICATEUR, by = "INDICATEUR") %>%
  month_to_date %>%
  ggplot + geom_line(aes(x = date, y = OBS_VALUE, color = Indicateur)) +
  theme_minimal() + xlab("") + ylab("") +
  theme(legend.position = c(0.5, 0.8),
        legend.title = element_blank()) +
  scale_y_continuous(breaks = seq(-100, 500, 5)) +
  scale_x_date(breaks = seq(1920, 2050, 5) %>% paste0("-01-01") %>% as.Date,
               labels = date_format("%Y"))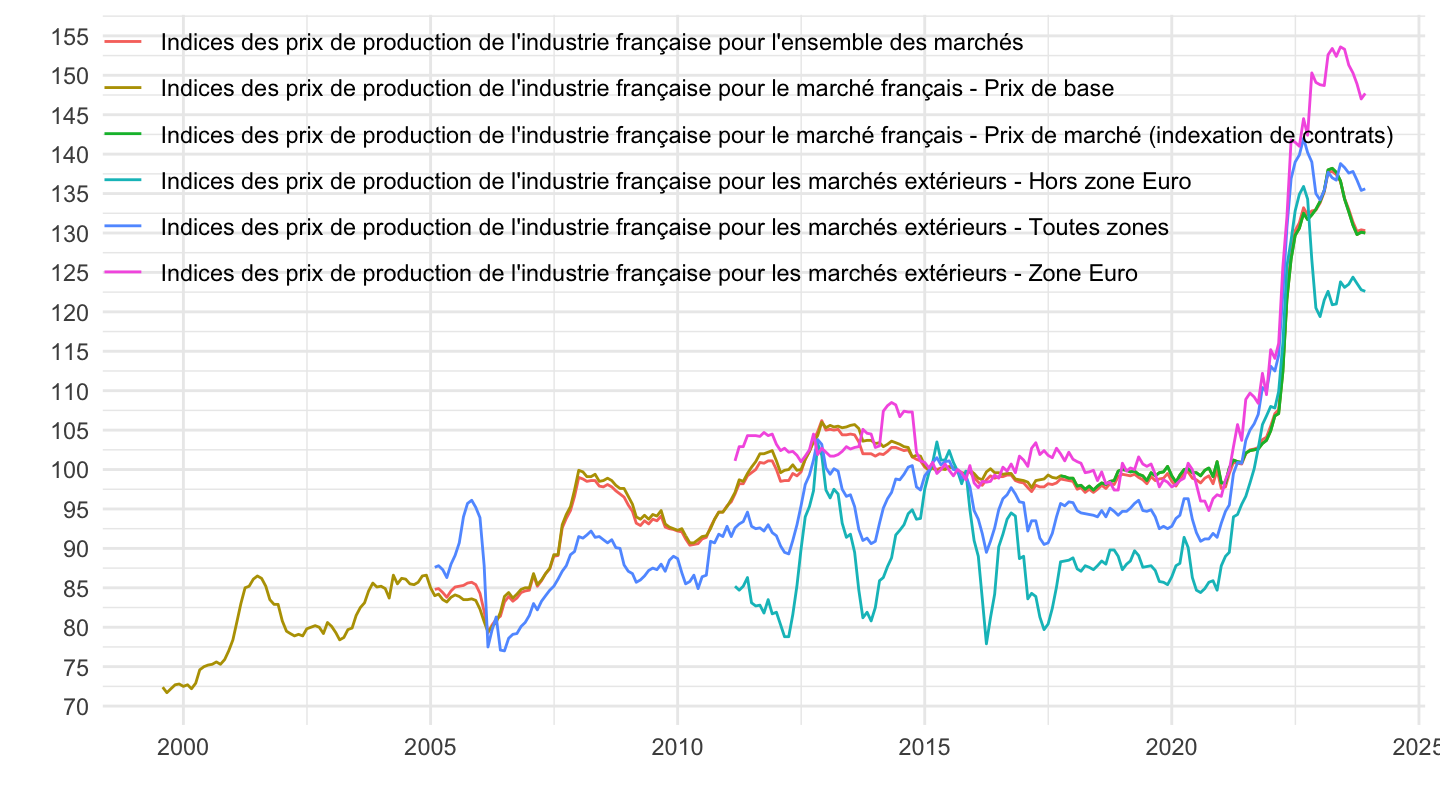
2017-
Code
`IPPI-2015` %>%
  filter(INDICATEUR %in% c("ENS_IPP", "EXT_IPP", "EXT_ZE_IPP", "EXT_HZE_IPP", "FR_PB_IPP", "FR_PM_IPP"),
         PRODUIT_IPPI == "CPF_10-12",
         PRODUIT_DETAILLE_IPPI == "SO") %>%
  left_join(INDICATEUR, by = "INDICATEUR") %>%
  month_to_date %>%
  filter(date >= as.Date("2017-01-01")) %>%
  ggplot + geom_line(aes(x = date, y = OBS_VALUE, color = Indicateur)) +
  theme_minimal() + xlab("") + ylab("") +
  theme(legend.position = c(0.5, 0.8),
        legend.title = element_blank()) +
  scale_y_continuous(breaks = seq(-100, 500, 5)) +
  scale_x_date(breaks = seq(1920, 2050, 1) %>% paste0("-01-01") %>% as.Date,
               labels = date_format("%Y"))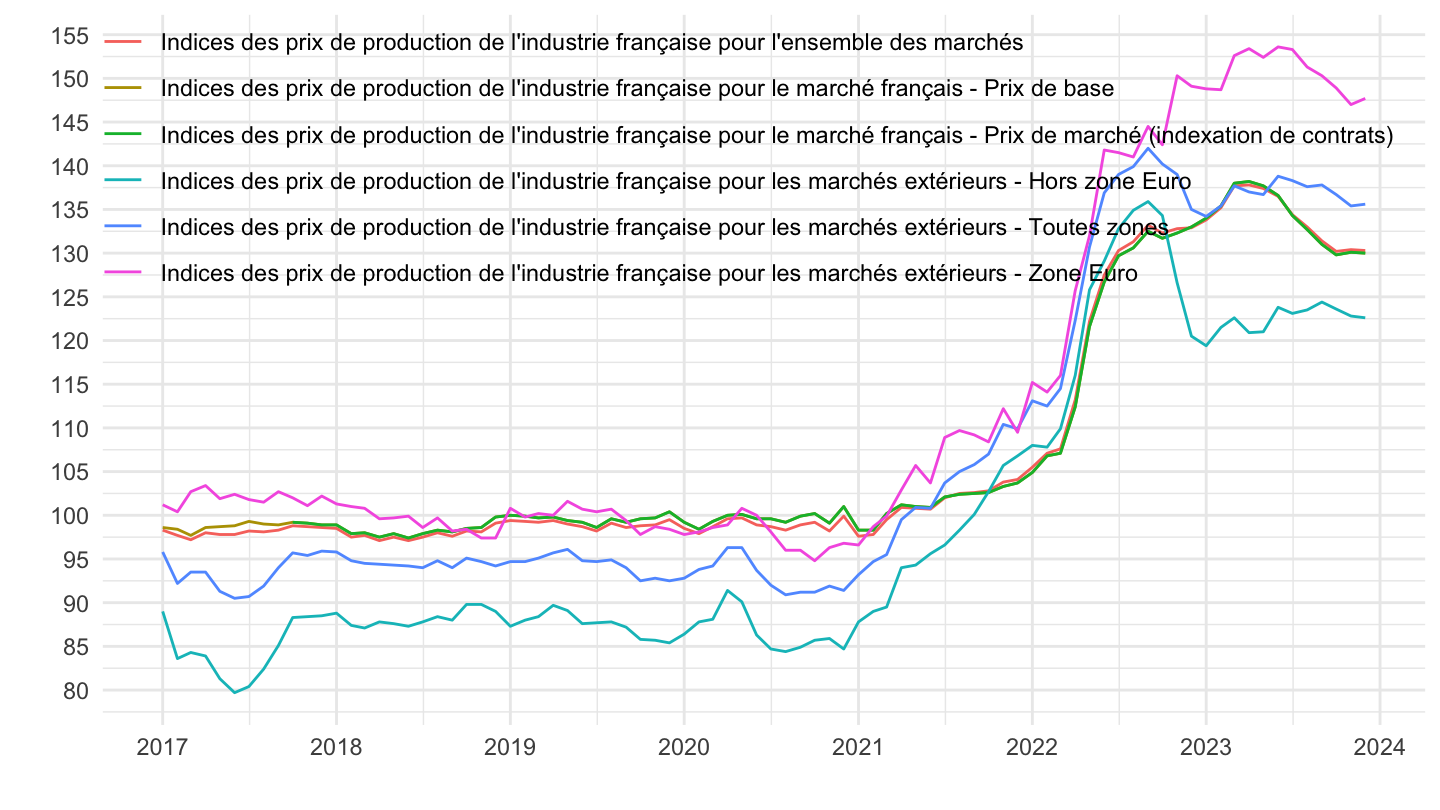
Prix d’importation
Tous
Code
`IPPI-2015` %>%
  filter(!(INDICATEUR %in% c("ENS_IPP", "EXT_IPP", "EXT_ZE_IPP", "EXT_HZE_IPP", "FR_PB_IPP", "FR_PM_IPP")),
         PRODUIT_IPPI == "CPF_10-12",
         PRODUIT_DETAILLE_IPPI == "SO") %>%
  left_join(INDICATEUR, by = "INDICATEUR") %>%
  month_to_date %>%
  ggplot + geom_line(aes(x = date, y = OBS_VALUE, color = Indicateur)) +
  theme_minimal() + xlab("") + ylab("") +
  theme(legend.position = c(0.5, 0.8),
        legend.title = element_blank()) +
  scale_y_continuous(breaks = seq(-100, 500, 5)) +
  scale_x_date(breaks = seq(1920, 2050, 2) %>% paste0("-01-01") %>% as.Date,
               labels = date_format("%Y"))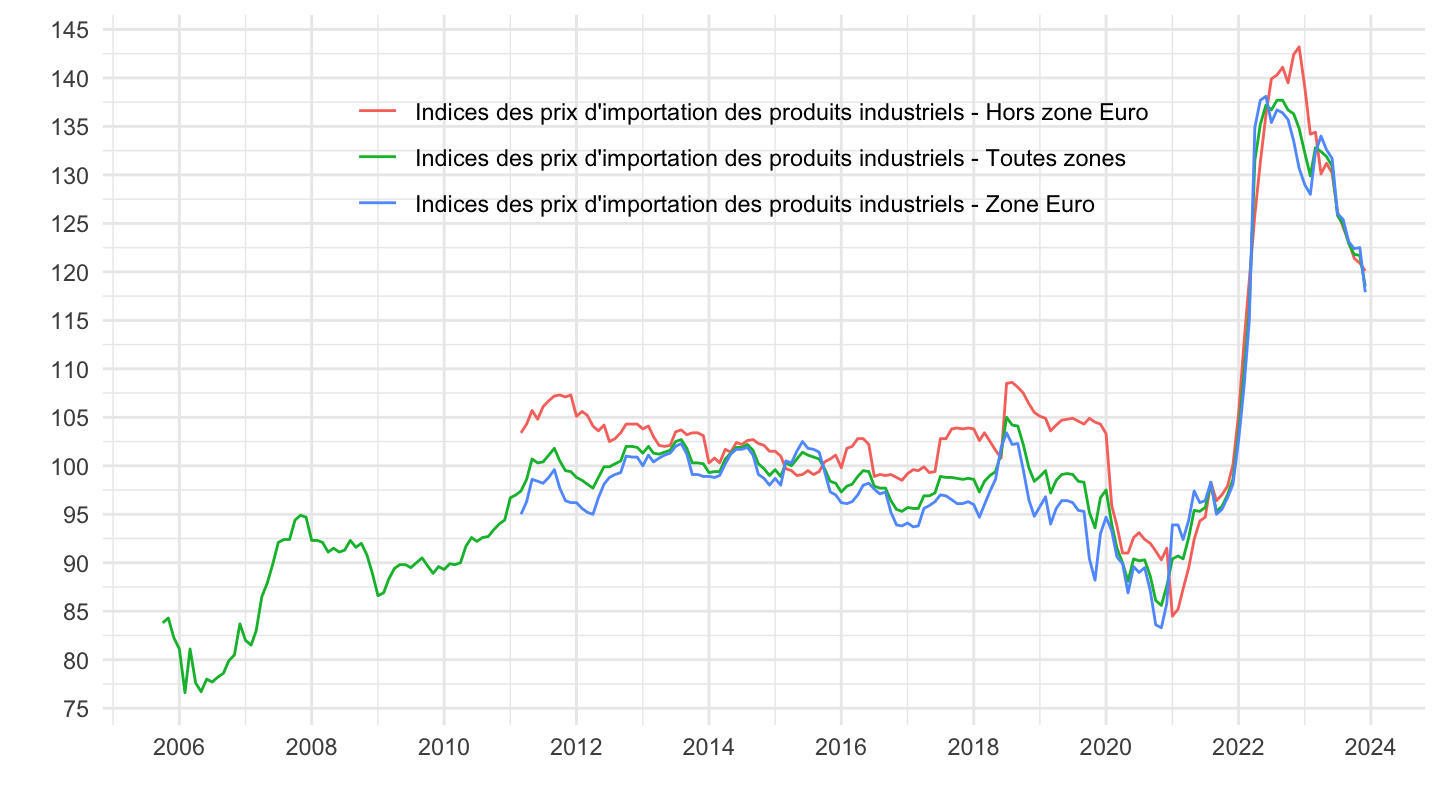
2017-
Code
`IPPI-2015` %>%
  filter(!(INDICATEUR %in% c("ENS_IPP", "EXT_IPP", "EXT_ZE_IPP", "EXT_HZE_IPP", "FR_PB_IPP", "FR_PM_IPP")),
         PRODUIT_IPPI == "CPF_10-12",
         PRODUIT_DETAILLE_IPPI == "SO") %>%
  left_join(INDICATEUR, by = "INDICATEUR") %>%
  month_to_date %>%
  filter(date >= as.Date("2017-01-01")) %>%
  ggplot + geom_line(aes(x = date, y = OBS_VALUE, color = Indicateur)) +
  theme_minimal() + xlab("") + ylab("") +
  theme(legend.position = c(0.5, 0.8),
        legend.title = element_blank()) +
  scale_y_continuous(breaks = seq(-100, 500, 5)) +
  scale_x_date(breaks = seq(1920, 2050, 1) %>% paste0("-01-01") %>% as.Date,
               labels = date_format("%Y"))
Energie
2017-
Code
`IPPI-2015` %>%
  filter(!(INDICATEUR %in% c("ENS_IPP", "EXT_IPP", "EXT_ZE_IPP", "EXT_HZE_IPP", "FR_PB_IPP", "FR_PM_IPP")),
         PRODUIT_IPPI == "MIG_NRG",
         PRODUIT_DETAILLE_IPPI == "SO") %>%
  left_join(INDICATEUR, by = "INDICATEUR") %>%
  month_to_date %>%
  filter(date >= as.Date("2017-01-01")) %>%
  ggplot + geom_line(aes(x = date, y = OBS_VALUE, color = Indicateur)) +
  theme_minimal() + xlab("") + ylab("") +
  theme(legend.position = c(0.5, 0.8),
        legend.title = element_blank()) +
  scale_y_continuous(breaks = seq(-100, 500, 5)) +
  scale_x_date(breaks = seq(1920, 2050, 1) %>% paste0("-01-01") %>% as.Date,
               labels = date_format("%Y"))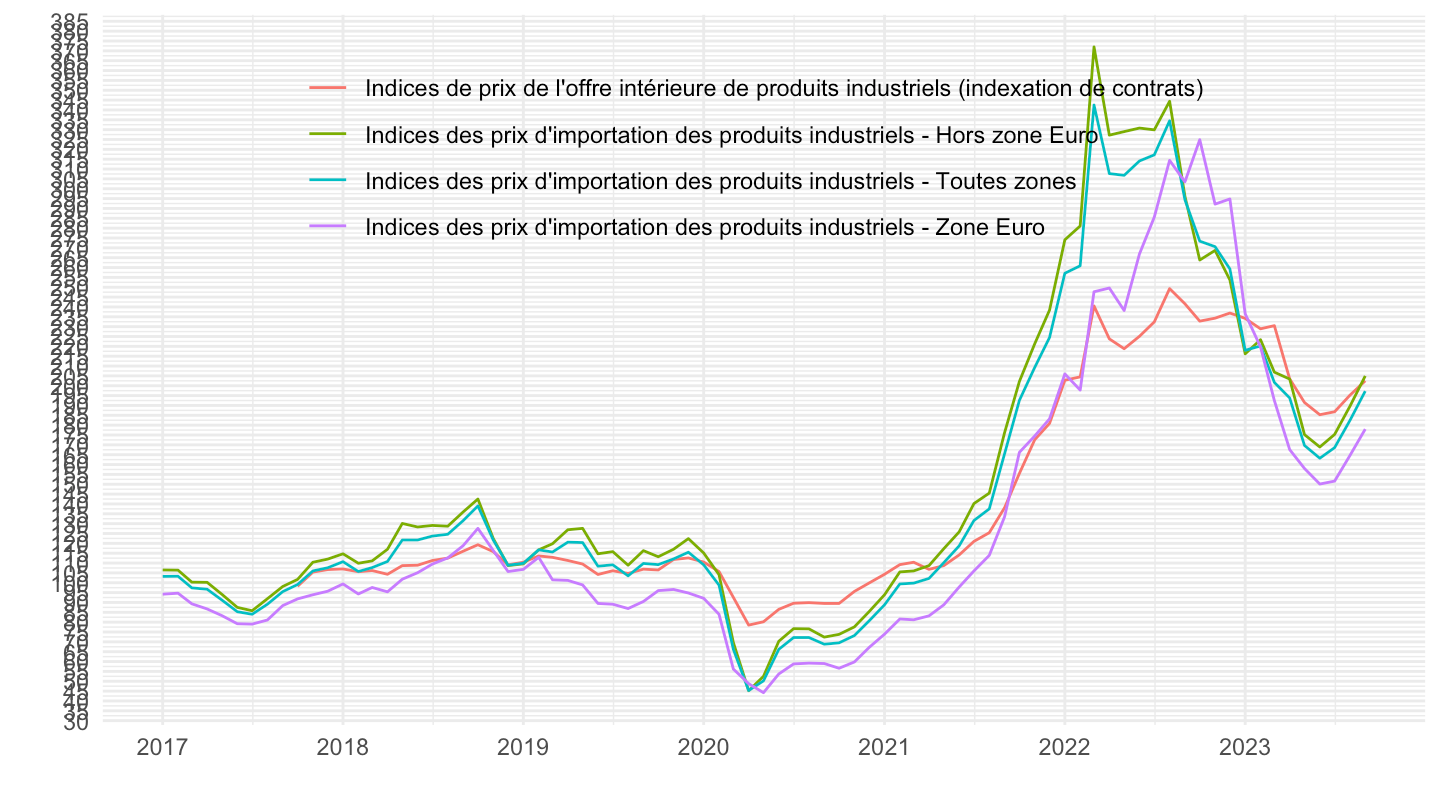
MDD, 1er prix, MN
MDD VS marques nationales
2 years
Code
Sys.setlocale("LC_TIME", "fr_CA.UTF-8")# [1] "fr_CA.UTF-8"Code
`IPPI-2015` %>%
  filter(PRODUIT_DETAILLE_IPPI %in% c("105158", "105157", "101309", "101307", "107204", "107203")) %>%
  left_join(PRODUIT_DETAILLE_IPPI, by = "PRODUIT_DETAILLE_IPPI") %>%
  mutate(produit = case_when(PRODUIT_DETAILLE_IPPI %in% c("105158", "105157") ~ "Pâtes molles",
                             PRODUIT_DETAILLE_IPPI %in% c("101309", "101307") ~ "Jambons cuits supérieurs",
                             PRODUIT_DETAILLE_IPPI %in% c("107204", "107203") ~ "Biscuits et gâteaux de conservation"),
         qualite = case_when(PRODUIT_DETAILLE_IPPI %in% c("105157", "101309", "107204") ~ "Marques Nationales",
                             PRODUIT_DETAILLE_IPPI %in% c("105158", "101307", "107203") ~ "Marques de Distributeur (MDD)")) %>%
  month_to_date %>%
  group_by(Produit_detaille_ippi) %>%
  filter(date >= max(date)-years(2)) %>%
  arrange(date) %>%
  mutate(OBS_VALUE = 100*OBS_VALUE/OBS_VALUE[1]) %>%
  ggplot + geom_line(aes(x = date, y = OBS_VALUE, color = produit, linetype = qualite)) +
  theme_minimal() + xlab("") + ylab("") +
  theme(legend.position = c(0.2, 0.75),
        legend.title = element_blank(),
        axis.text.x = element_text(angle = 45, vjust = 0.5, hjust=1)) +
  scale_y_continuous(breaks = seq(-100, 500, 5)) +
  scale_x_date(breaks = "1 month",
               labels = date_format("%b %Y"))
2 years
Code
Sys.setlocale("LC_TIME", "fr_CA.UTF-8")# [1] "fr_CA.UTF-8"Code
graphique6 <- `IPPI-2015` %>%
  filter(PRODUIT_DETAILLE_IPPI %in% c("105158", "105157", "101309", "101307", "107204", "107203")) %>%
  left_join(PRODUIT_DETAILLE_IPPI, by = "PRODUIT_DETAILLE_IPPI") %>%
  mutate(produit = case_when(PRODUIT_DETAILLE_IPPI %in% c("105158", "105157") ~ "Pâtes molles",
                             PRODUIT_DETAILLE_IPPI %in% c("101309", "101307") ~ "Jambons cuits supérieurs",
                             PRODUIT_DETAILLE_IPPI %in% c("107204", "107203") ~ "Biscuits et gâteaux de conservation"),
         qualite = case_when(PRODUIT_DETAILLE_IPPI %in% c("105157", "101309", "107204") ~ "Marques Nationales (MN)",
                             PRODUIT_DETAILLE_IPPI %in% c("105158", "101307", "107203") ~ "Marques de Distributeur (MDD)")) %>%
  month_to_date %>%
  group_by(Produit_detaille_ippi) %>%
  filter(date >= max(date)-years(2)) %>%
  arrange(date) %>%
  mutate(OBS_VALUE = 100*OBS_VALUE/OBS_VALUE[1]) %>%
  mutate(produit = factor(produit, levels = c("Pâtes molles", "Biscuits et gâteaux de conservation", "Jambons cuits supérieurs"))) %>%
  ungroup %>%
  select(qualite, produit, date, OBS_VALUE) %>%
  arrange(produit, qualite, date)

write.csv(graphique6, file = "~/Desktop/graphique6.csv")

graphique6 %>%
  ggplot + geom_line(aes(x = date, y = OBS_VALUE, color = qualite), size = 1) +
  theme_minimal() + xlab("") + ylab("Indice 100 = Octobre 2021") +
  theme(legend.position = "bottom",
        legend.title = element_blank(),
        legend.margin=margin(t=-3),
        axis.text.x = element_text(angle = 45, vjust = 0.5, hjust=1)) +
  scale_y_continuous(breaks = seq(-100, 500, 5)) +
  scale_x_date(breaks = seq.Date(from = as.Date("2021-10-01"), to = Sys.Date(), by = "3 months"),
               labels = date_format("%b %Y")) +
  scale_color_manual(values = c("#005DA4", "#F59C00")) +
  facet_wrap(~ produit)
2 years - inverted
Code
Sys.setlocale("LC_TIME", "fr_CA.UTF-8")# [1] "fr_CA.UTF-8"Code
`IPPI-2015` %>%
  filter(PRODUIT_DETAILLE_IPPI %in% c("105158", "105157", "101309", "101307", "107204", "107203")) %>%
  left_join(PRODUIT_DETAILLE_IPPI, by = "PRODUIT_DETAILLE_IPPI") %>%
  mutate(produit = case_when(PRODUIT_DETAILLE_IPPI %in% c("105158", "105157") ~ "Pâtes molles",
                             PRODUIT_DETAILLE_IPPI %in% c("101309", "101307") ~ "Jambons cuits supérieurs",
                             PRODUIT_DETAILLE_IPPI %in% c("107204", "107203") ~ "Biscuits et gâteaux de conservation"),
         qualite = case_when(PRODUIT_DETAILLE_IPPI %in% c("105157", "101309", "107204") ~ "Marques Nationales (MN)",
                             PRODUIT_DETAILLE_IPPI %in% c("105158", "101307", "107203") ~ "Marques de Distributeur (MDD)")) %>%
  month_to_date %>%
  group_by(Produit_detaille_ippi) %>%
  filter(date >= max(date)-years(2)) %>%
  arrange(date) %>%
  mutate(OBS_VALUE = OBS_VALUE/OBS_VALUE[1]-1) %>%
  mutate(produit = factor(produit, levels = c("Jambons cuits supérieurs", "Biscuits et gâteaux de conservation", "Pâtes molles"))) %>%
  ungroup %>%
  select(qualite, produit, date, OBS_VALUE) %>%
  arrange(produit, qualite, date) %>%
  ggplot + geom_line(aes(x = date, y = OBS_VALUE, color = qualite), size = 1) +
  theme_minimal() + xlab("") + ylab("Inflation vs. Novembre 2021") +
  theme(legend.position = "bottom",
        legend.title = element_blank(),
        legend.margin=margin(t=-3),
        axis.text.x = element_text(angle = 45, vjust = 0.5, hjust=1)) +
  scale_y_continuous(breaks = 0.01*seq(0, 100, 5),
                     labels = percent_format(pre = "+")) +
  scale_x_date(breaks = seq.Date(from = as.Date("2021-11-01"), to = Sys.Date(), by = "3 months"),
               labels = date_format("%b %Y")) +
  scale_color_manual(values = c("#005DA4", "#F59C00")) +
  facet_wrap(~ produit)
Aout 2021
Code
Sys.setlocale("LC_TIME", "fr_CA.UTF-8")# [1] "fr_CA.UTF-8"Code
`IPPI-2015` %>%
  filter(PRODUIT_DETAILLE_IPPI %in% c("105158", "105157", "101309", "101307", "107204", "107203")) %>%
  left_join(PRODUIT_DETAILLE_IPPI, by = "PRODUIT_DETAILLE_IPPI") %>%
  mutate(produit = case_when(PRODUIT_DETAILLE_IPPI %in% c("105158", "105157") ~ "Pâtes molles",
                             PRODUIT_DETAILLE_IPPI %in% c("101309", "101307") ~ "Jambons cuits supérieurs",
                             PRODUIT_DETAILLE_IPPI %in% c("107204", "107203") ~ "Biscuits et gâteaux de conservation"),
         qualite = case_when(PRODUIT_DETAILLE_IPPI %in% c("105157", "101309", "107204") ~ "Marques Nationales",
                             PRODUIT_DETAILLE_IPPI %in% c("105158", "101307", "107203") ~ "Marques de Distributeur (MDD)")) %>%
  month_to_date %>%
  group_by(Produit_detaille_ippi) %>%
  filter(date >= as.Date("2021-08-01")) %>%
  arrange(date) %>%
  mutate(OBS_VALUE = 100*OBS_VALUE/OBS_VALUE[1]) %>%
  ggplot + geom_line(aes(x = date, y = OBS_VALUE, color = produit, linetype = qualite)) +
  theme_minimal() + xlab("") + ylab("Base 100 = Août 2021") +
  theme(legend.position = c(0.2, 0.75),
        legend.title = element_blank(),
        axis.text.x = element_text(angle = 45, vjust = 0.5, hjust=1)) +
  scale_y_continuous(breaks = seq(-100, 500, 5)) +
  scale_x_date(breaks = "1 month",
               labels = date_format("%b %Y"))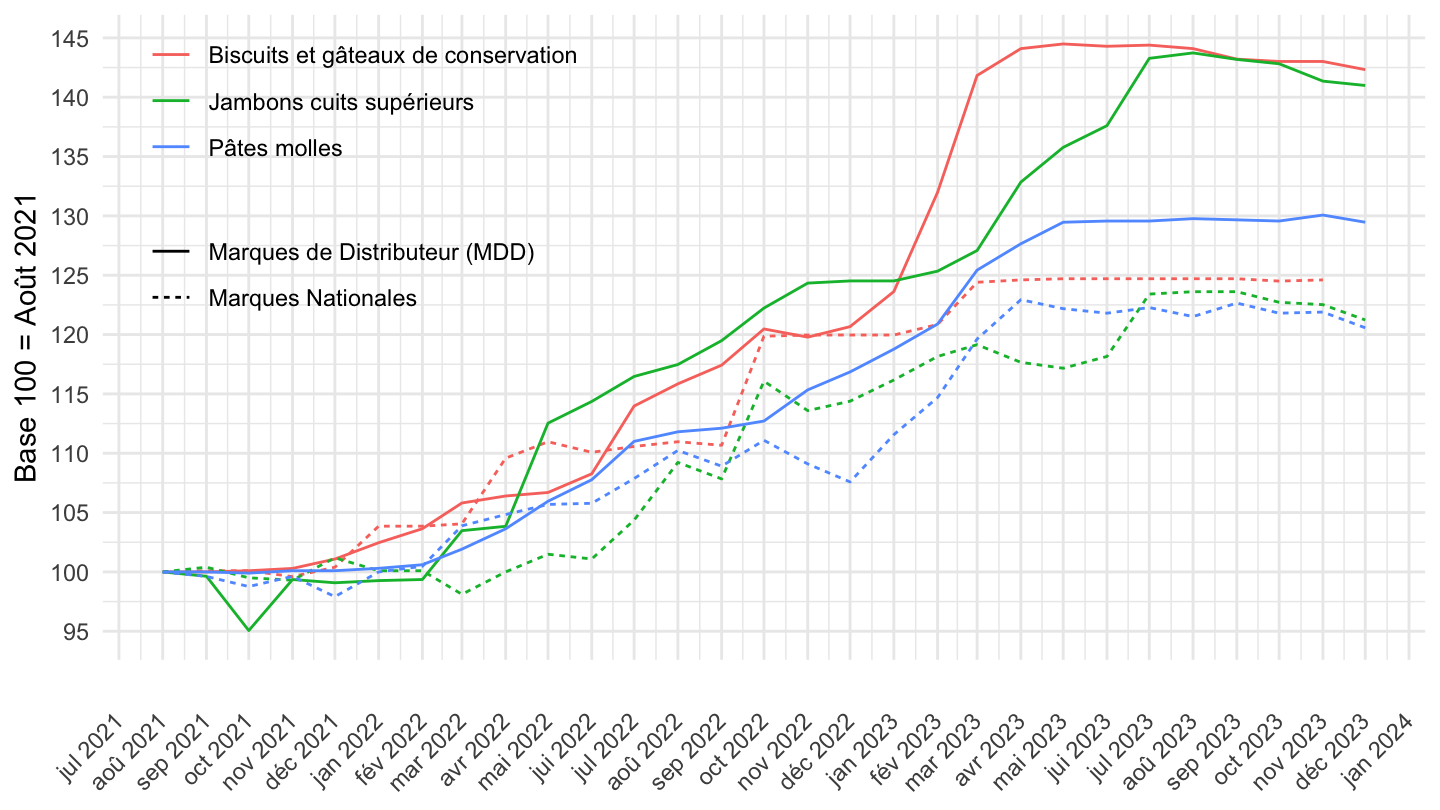
Pâtes: MN vs. MDD et 1er prix
Tous
Code
`IPPI-2015` %>%
  filter(PRODUIT_DETAILLE_IPPI %in% c("105128", "105157", "105158")) %>%
  left_join(PRODUIT_DETAILLE_IPPI, by = "PRODUIT_DETAILLE_IPPI") %>%
  month_to_date %>%
  #filter(date >= as.Date("2017-01-01")) %>%
  ggplot + geom_line(aes(x = date, y = OBS_VALUE, color = Produit_detaille_ippi)) +
  theme_minimal() + xlab("") + ylab("") +
  theme(legend.position = c(0.3, 0.8),
        legend.title = element_blank()) +
  scale_y_continuous(breaks = seq(-100, 500, 5)) +
  scale_x_date(breaks = seq(1920, 2050, 1) %>% paste0("-01-01") %>% as.Date,
               labels = date_format("%Y"))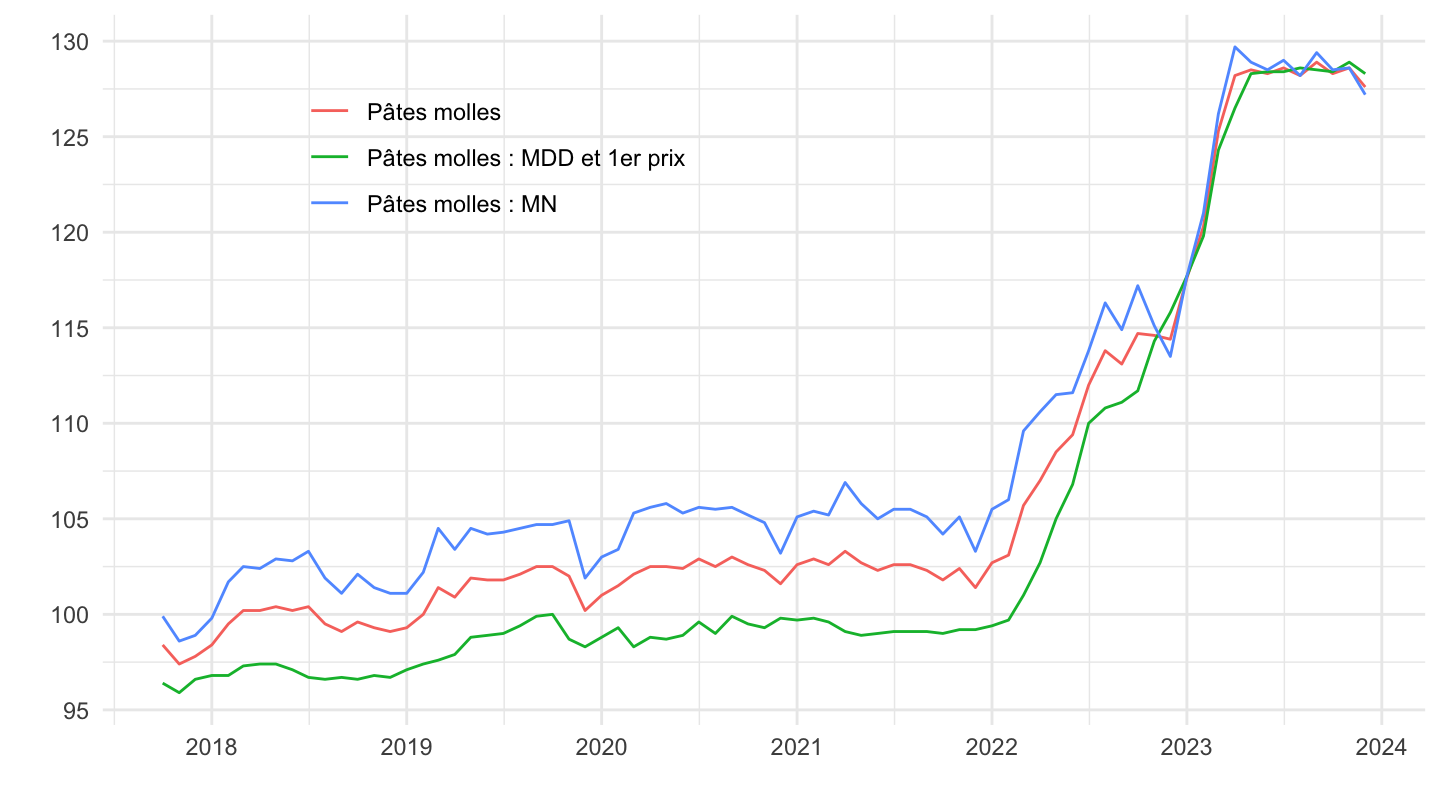
2 years
Code
`IPPI-2015` %>%
  filter(PRODUIT_DETAILLE_IPPI %in% c("105128", "105157", "105158")) %>%
  left_join(PRODUIT_DETAILLE_IPPI, by = "PRODUIT_DETAILLE_IPPI") %>%
  month_to_date %>%
  filter(date >= max(date)-years(2)) %>%
  group_by(Produit_detaille_ippi) %>%
  arrange(date) %>%
  mutate(OBS_VALUE = 100*OBS_VALUE/OBS_VALUE[1]) %>%
  ggplot + geom_line(aes(x = date, y = OBS_VALUE, color = paste0(Produit_detaille_ippi, " (", PRODUIT_DETAILLE_IPPI, ")"))) +
  theme_minimal() + xlab("") + ylab("") +
  theme(legend.position = c(0.3, 0.8),
        legend.title = element_blank(),
        axis.text.x = element_text(angle = 45, vjust = 0.5, hjust=1)) +
  scale_y_continuous(breaks = seq(-100, 500, 5)) +
  scale_x_date(breaks = "1 month",
               labels = date_format("%b %Y"))
2022-
Code
`IPPI-2015` %>%
  filter(PRODUIT_DETAILLE_IPPI %in% c("105128", "105157", "105158")) %>%
  left_join(PRODUIT_DETAILLE_IPPI, by = "PRODUIT_DETAILLE_IPPI") %>%
  month_to_date %>%
  filter(date >= as.Date("2022-01-01")) %>%
  group_by(Produit_detaille_ippi) %>%
  arrange(date) %>%
  mutate(OBS_VALUE = 100*OBS_VALUE/OBS_VALUE[1]) %>%
  ggplot + geom_line(aes(x = date, y = OBS_VALUE, color = Produit_detaille_ippi)) +
  theme_minimal() + xlab("") + ylab("") +
  theme(legend.position = c(0.3, 0.8),
        legend.title = element_blank(),
        axis.text.x = element_text(angle = 45, vjust = 0.5, hjust=1)) +
  scale_y_continuous(breaks = seq(-100, 500, 5)) +
  scale_x_date(breaks = "1 month",
               labels = date_format("%b %Y"))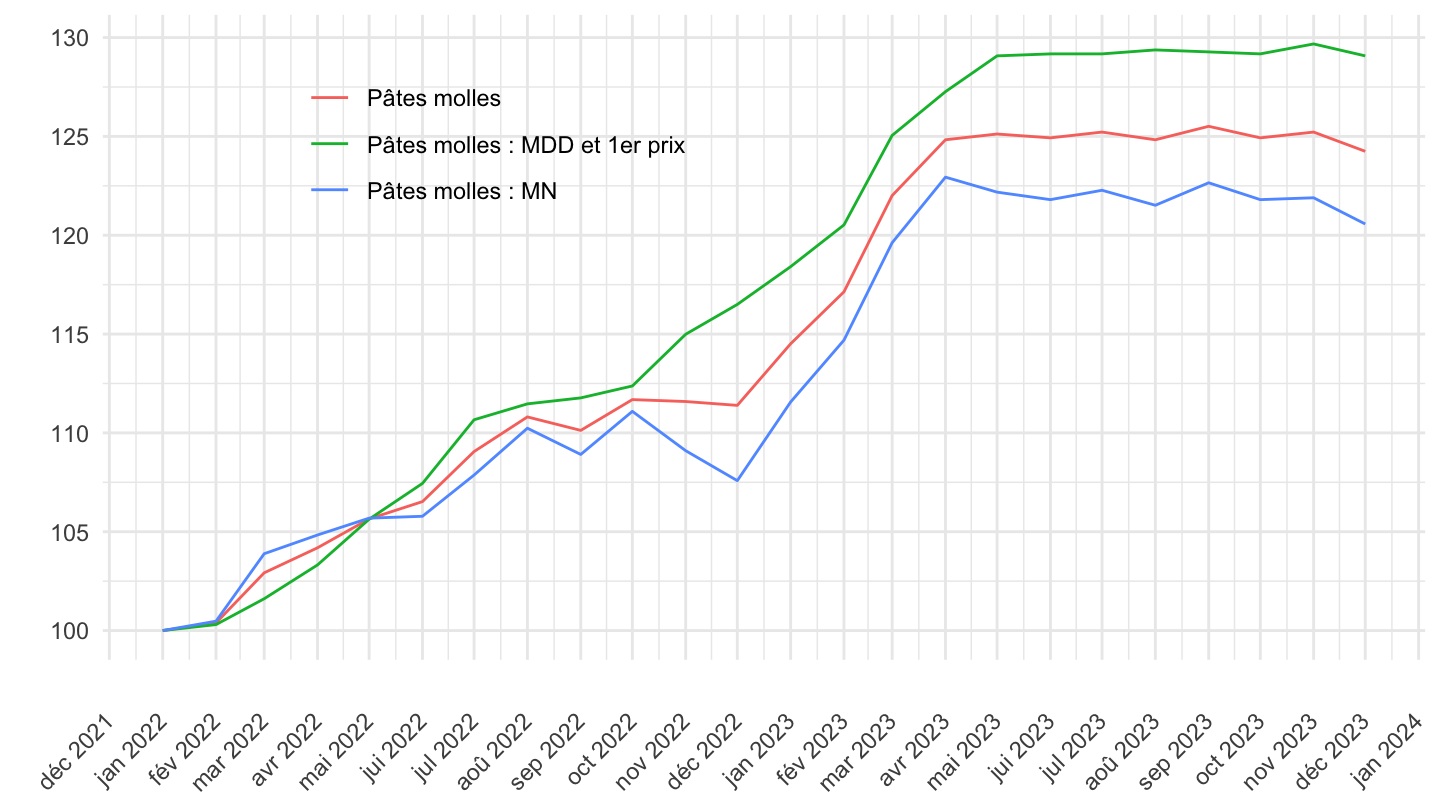
Jambons cuits supérieurs
2 years
Code
`IPPI-2015` %>%
  filter(PRODUIT_DETAILLE_IPPI %in% c("101307", "101309", "101310", "101311")) %>%
  left_join(PRODUIT_DETAILLE_IPPI, by = "PRODUIT_DETAILLE_IPPI") %>%
  month_to_date %>%
  filter(date >= max(date)-years(2)) %>%
  group_by(Produit_detaille_ippi) %>%
  arrange(date) %>%
  mutate(OBS_VALUE = 100*OBS_VALUE/OBS_VALUE[1]) %>%
  ggplot + geom_line(aes(x = date, y = OBS_VALUE, color = paste0(Produit_detaille_ippi, " (", PRODUIT_DETAILLE_IPPI, ")"))) +
  theme_minimal() + xlab("") + ylab("") +
  theme(legend.position = c(0.3, 0.8),
        legend.title = element_blank(),
        axis.text.x = element_text(angle = 45, vjust = 0.5, hjust=1)) +
  scale_y_continuous(breaks = seq(-100, 500, 5)) +
  scale_x_date(breaks = "1 month",
               labels = date_format("%b %Y"))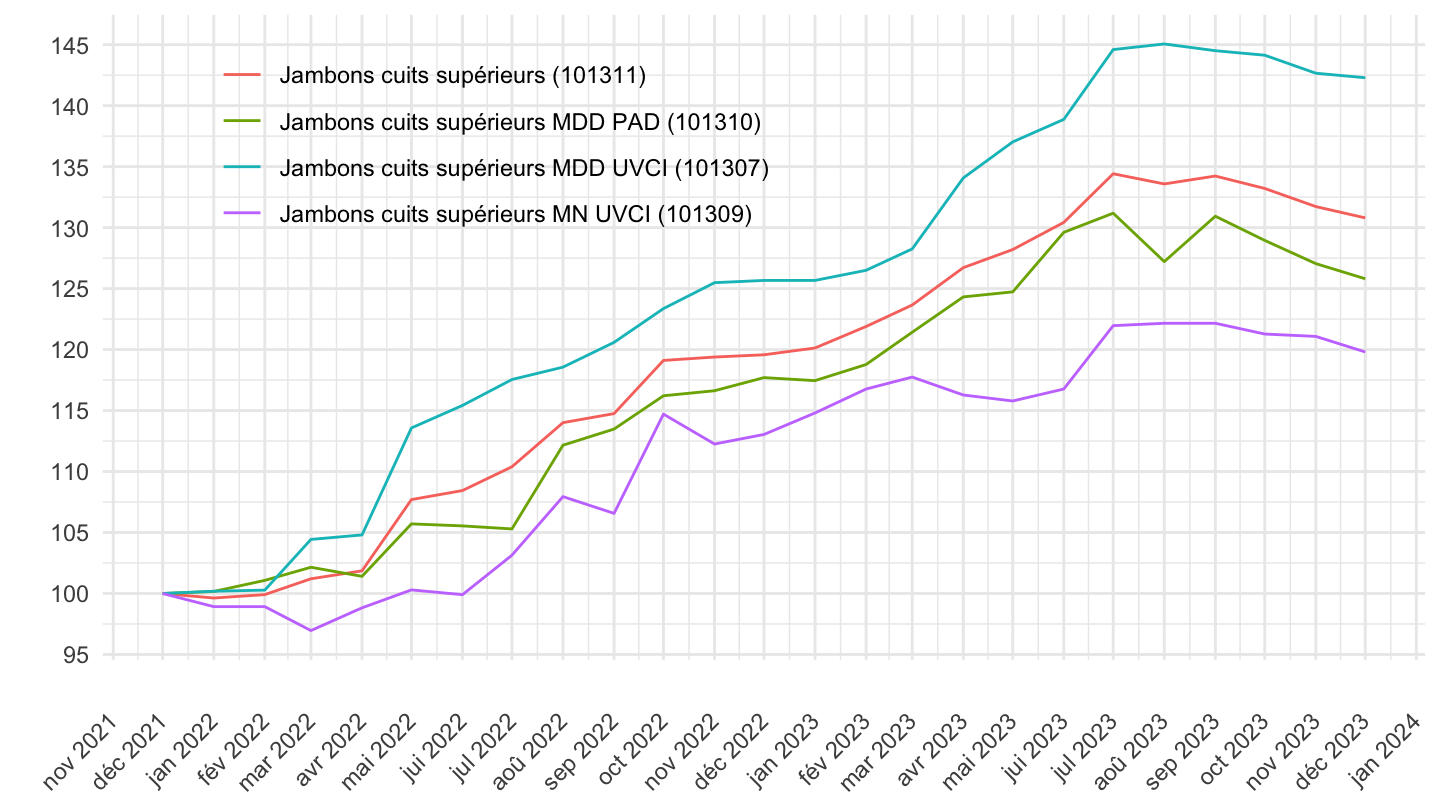
2022-
Code
`IPPI-2015` %>%
  filter(PRODUIT_DETAILLE_IPPI %in% c("101307", "101309", "101310", "101311")) %>%
  left_join(PRODUIT_DETAILLE_IPPI, by = "PRODUIT_DETAILLE_IPPI") %>%
  month_to_date %>%
  filter(date >= as.Date("2022-01-01")) %>%
  group_by(Produit_detaille_ippi) %>%
  arrange(date) %>%
  mutate(OBS_VALUE = 100*OBS_VALUE/OBS_VALUE[1]) %>%
  ggplot + geom_line(aes(x = date, y = OBS_VALUE, color = paste0(Produit_detaille_ippi, " (", PRODUIT_DETAILLE_IPPI, ")"))) +
  theme_minimal() + xlab("") + ylab("") +
  theme(legend.position = c(0.3, 0.8),
        legend.title = element_blank(),
        axis.text.x = element_text(angle = 45, vjust = 0.5, hjust=1)) +
  scale_y_continuous(breaks = seq(-100, 500, 5)) +
  scale_x_date(breaks = "1 month",
               labels = date_format("%b %Y"))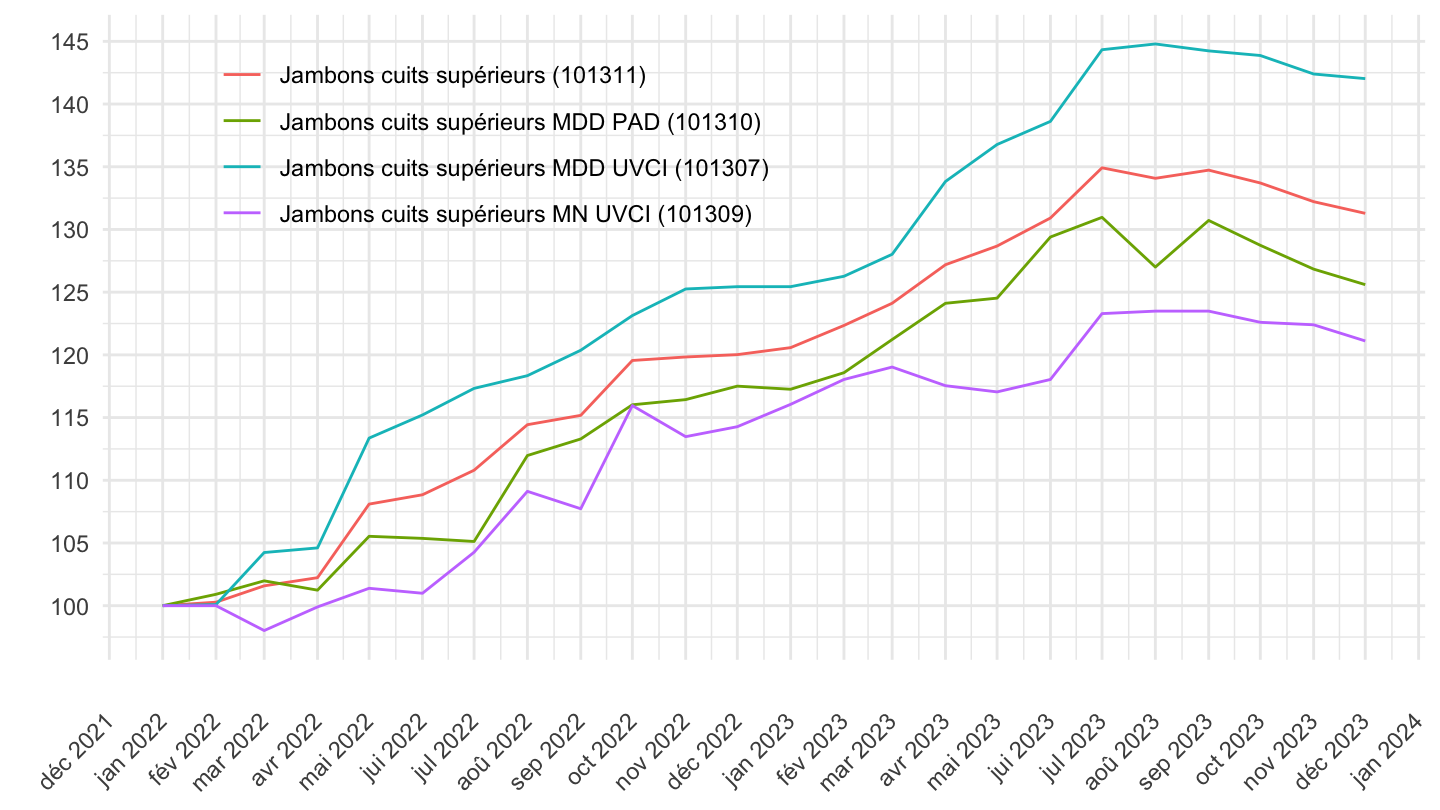
Yaourts et laits fermentés
2 years
Code
`IPPI-2015` %>%
  filter(PRODUIT_DETAILLE_IPPI %in% c("105110", "105121")) %>%
  left_join(PRODUIT_DETAILLE_IPPI, by = "PRODUIT_DETAILLE_IPPI") %>%
  month_to_date %>%
  filter(date >= max(date)-years(2)) %>%
  group_by(Produit_detaille_ippi) %>%
  arrange(date) %>%
  mutate(OBS_VALUE = 100*OBS_VALUE/OBS_VALUE[1]) %>%
  ggplot + geom_line(aes(x = date, y = OBS_VALUE, color = paste0(Produit_detaille_ippi, " (", PRODUIT_DETAILLE_IPPI, ")"))) +
  theme_minimal() + xlab("") + ylab("") +
  theme(legend.position = c(0.3, 0.8),
        legend.title = element_blank(),
        axis.text.x = element_text(angle = 45, vjust = 0.5, hjust=1)) +
  scale_y_continuous(breaks = seq(-100, 500, 5)) +
  scale_x_date(breaks = "1 month",
               labels = date_format("%b %Y"))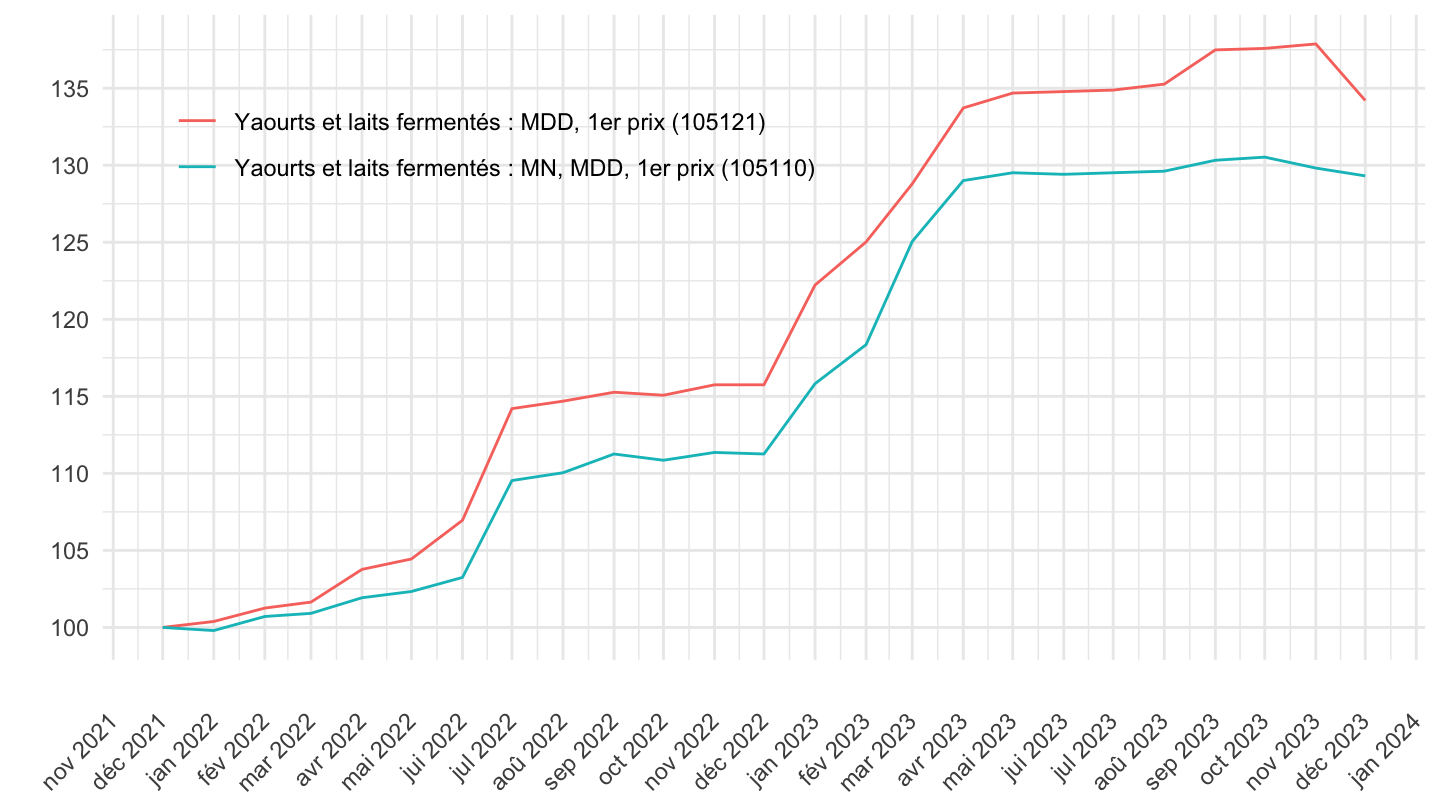
2022-
Code
`IPPI-2015` %>%
  filter(PRODUIT_DETAILLE_IPPI %in% c("105110", "105121")) %>%
  left_join(PRODUIT_DETAILLE_IPPI, by = "PRODUIT_DETAILLE_IPPI") %>%
  month_to_date %>%
  filter(date >= as.Date("2022-01-01")) %>%
  group_by(Produit_detaille_ippi) %>%
  arrange(date) %>%
  mutate(OBS_VALUE = 100*OBS_VALUE/OBS_VALUE[1]) %>%
  ggplot + geom_line(aes(x = date, y = OBS_VALUE, color = paste0(Produit_detaille_ippi, " (", PRODUIT_DETAILLE_IPPI, ")"))) +
  theme_minimal() + xlab("") + ylab("") +
  theme(legend.position = c(0.3, 0.8),
        legend.title = element_blank(),
        axis.text.x = element_text(angle = 45, vjust = 0.5, hjust=1)) +
  scale_y_continuous(breaks = seq(-100, 500, 5)) +
  scale_x_date(breaks = "1 month",
               labels = date_format("%b %Y"))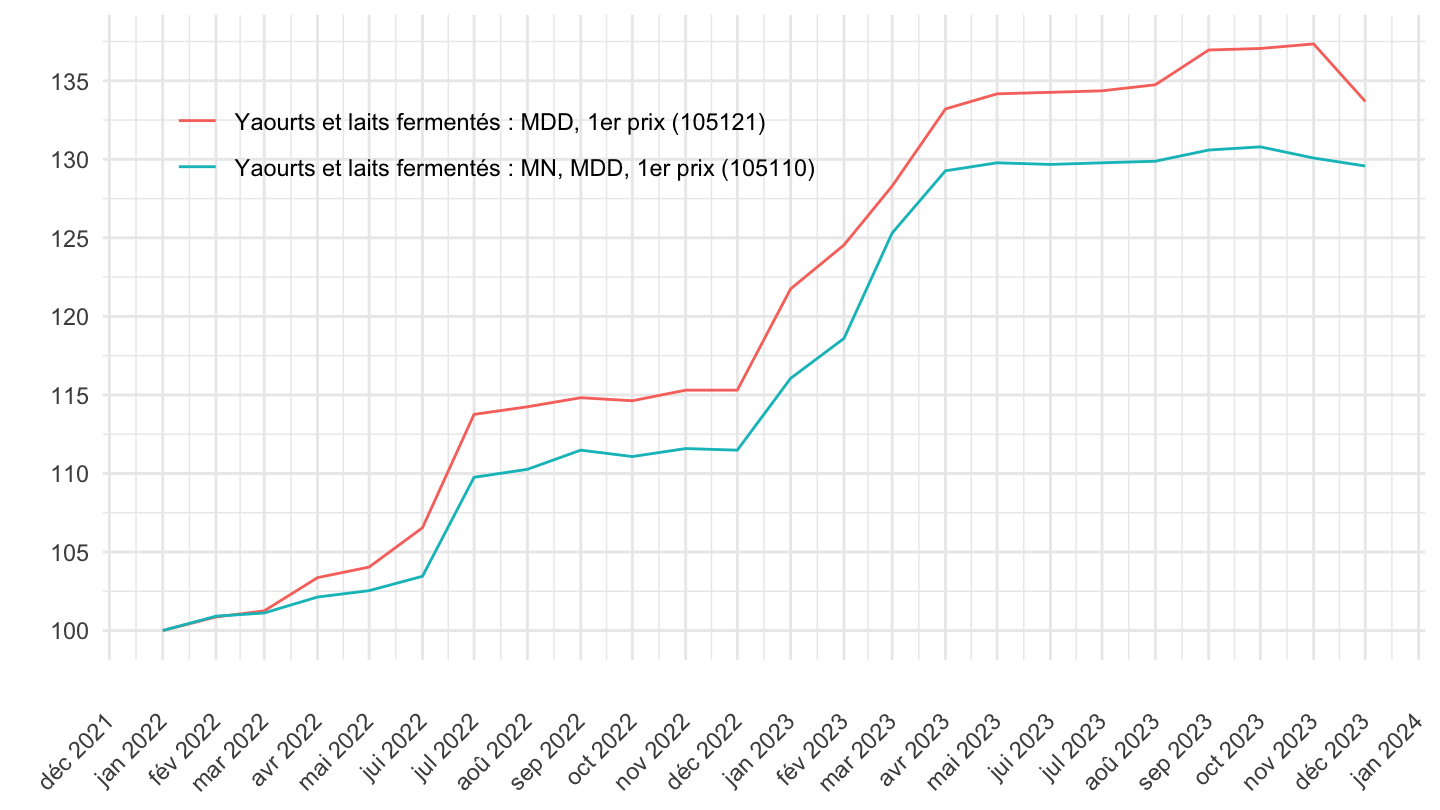
Beurre conditionné
2 years
Code
`IPPI-2015` %>%
  filter(PRODUIT_DETAILLE_IPPI %in% c("105122", "105123", "105124")) %>%
  left_join(PRODUIT_DETAILLE_IPPI, by = "PRODUIT_DETAILLE_IPPI") %>%
  month_to_date %>%
  filter(date >= max(date)-years(2)) %>%
  group_by(Produit_detaille_ippi) %>%
  arrange(date) %>%
  mutate(OBS_VALUE = 100*OBS_VALUE/OBS_VALUE[1]) %>%
  ggplot + geom_line(aes(x = date, y = OBS_VALUE, color = paste0(Produit_detaille_ippi, " (", PRODUIT_DETAILLE_IPPI, ")"))) +
  theme_minimal() + xlab("") + ylab("") +
  theme(legend.position = c(0.2, 0.8),
        legend.title = element_blank(),
        axis.text.x = element_text(angle = 45, vjust = 0.5, hjust=1)) +
  scale_y_continuous(breaks = seq(-100, 500, 5)) +
  scale_x_date(breaks = "1 month",
               labels = date_format("%b %Y"))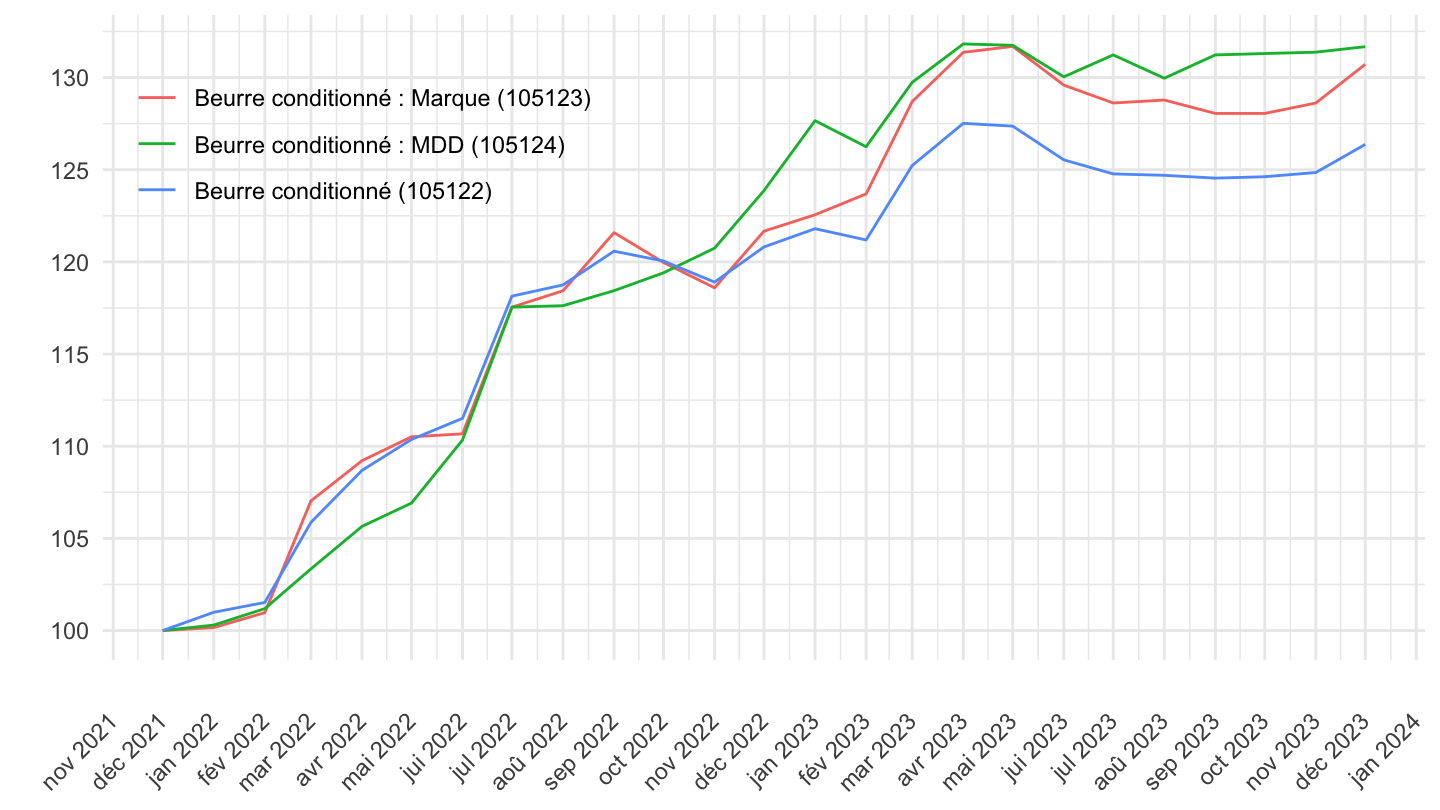
2022-
Code
`IPPI-2015` %>%
  filter(PRODUIT_DETAILLE_IPPI %in% c("105122", "105123", "105124")) %>%
  left_join(PRODUIT_DETAILLE_IPPI, by = "PRODUIT_DETAILLE_IPPI") %>%
  month_to_date %>%
  filter(date >= as.Date("2022-01-01")) %>%
  group_by(Produit_detaille_ippi) %>%
  arrange(date) %>%
  mutate(OBS_VALUE = 100*OBS_VALUE/OBS_VALUE[1]) %>%
  ggplot + geom_line(aes(x = date, y = OBS_VALUE, color = paste0(Produit_detaille_ippi, " (", PRODUIT_DETAILLE_IPPI, ")"))) +
  theme_minimal() + xlab("") + ylab("") +
  theme(legend.position = c(0.2, 0.8),
        legend.title = element_blank(),
        axis.text.x = element_text(angle = 45, vjust = 0.5, hjust=1)) +
  scale_y_continuous(breaks = seq(-100, 500, 5)) +
  scale_x_date(breaks = "1 month",
               labels = date_format("%b %Y"))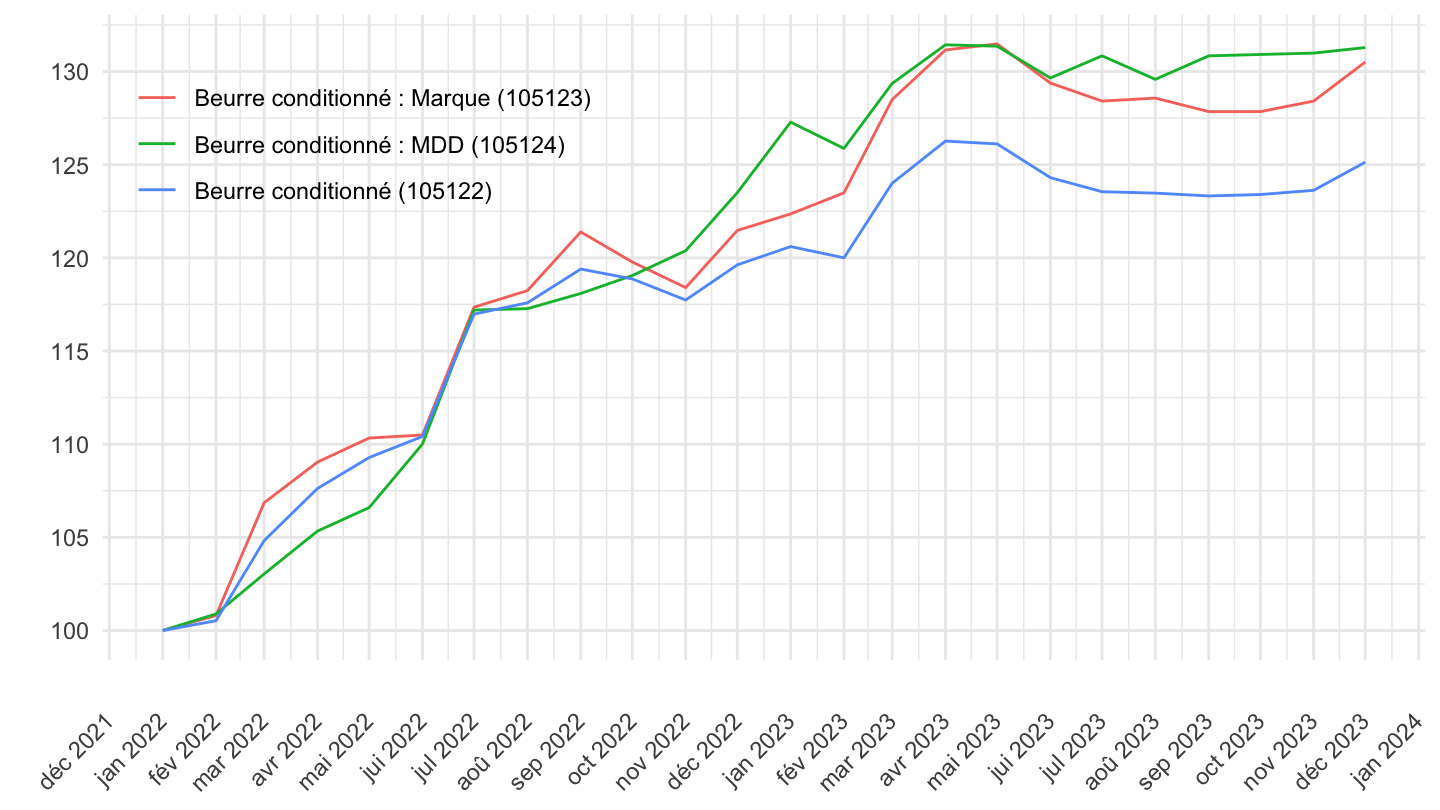
Biscuits et gâteaux de conservation
2 years
Code
`IPPI-2015` %>%
  filter(PRODUIT_DETAILLE_IPPI %in% c("107203", "107204")) %>%
  left_join(PRODUIT_DETAILLE_IPPI, by = "PRODUIT_DETAILLE_IPPI") %>%
  month_to_date %>%
  filter(date >= max(date)-years(2)) %>%
  group_by(Produit_detaille_ippi) %>%
  arrange(date) %>%
  mutate(OBS_VALUE = 100*OBS_VALUE/OBS_VALUE[1]) %>%
  ggplot + geom_line(aes(x = date, y = OBS_VALUE, color = paste0(Produit_detaille_ippi, " (", PRODUIT_DETAILLE_IPPI, ")"))) +
  theme_minimal() + xlab("") + ylab("") +
  theme(legend.position = c(0.35, 0.8),
        legend.title = element_blank(),
        axis.text.x = element_text(angle = 45, vjust = 0.5, hjust=1)) +
  scale_y_continuous(breaks = seq(-100, 500, 5)) +
  scale_x_date(breaks = "1 month",
               labels = date_format("%b %Y"))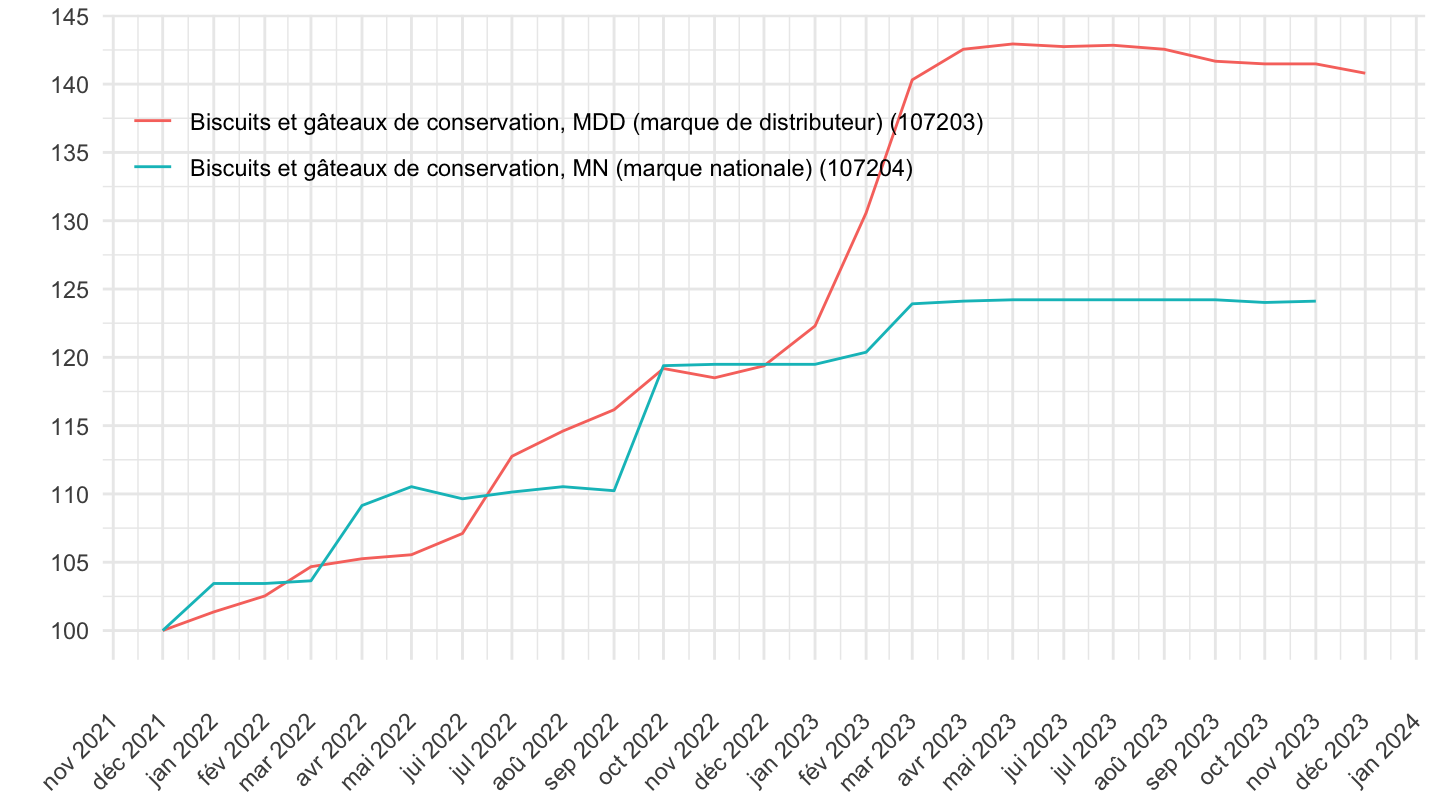
2022-
Code
`IPPI-2015` %>%
  filter(PRODUIT_DETAILLE_IPPI %in% c("107203", "107204")) %>%
  left_join(PRODUIT_DETAILLE_IPPI, by = "PRODUIT_DETAILLE_IPPI") %>%
  month_to_date %>%
  filter(date >= as.Date("2022-01-01")) %>%
  group_by(Produit_detaille_ippi) %>%
  arrange(date) %>%
  mutate(OBS_VALUE = 100*OBS_VALUE/OBS_VALUE[1]) %>%
  ggplot + geom_line(aes(x = date, y = OBS_VALUE, color = paste0(Produit_detaille_ippi, " (", PRODUIT_DETAILLE_IPPI, ")"))) +
  theme_minimal() + xlab("") + ylab("") +
  theme(legend.position = c(0.35, 0.8),
        legend.title = element_blank(),
        axis.text.x = element_text(angle = 45, vjust = 0.5, hjust=1)) +
  scale_y_continuous(breaks = seq(-100, 500, 5)) +
  scale_x_date(breaks = "1 month",
               labels = date_format("%b %Y"))