| source | dataset | Title | .html | .rData |
|---|---|---|---|---|
| notaires | HistoriquedesprixaumappartementsanciensParispararrdt | Prix au m² des appartements anciens sous-jacents aux indices Notaires-INSEE | 2026-07-04 | 2026-07-04 |
| notaires | dep | Prix au m^2 par département | 2026-07-04 | 2026-07-04 |
Prix au m² des appartements anciens sous-jacents aux indices Notaires-INSEE
Data - Notaires
Info
Données sur l’immobilier
| source | dataset | Title | .html | .rData |
|---|---|---|---|---|
| acpr | as151 | Enquête annuelle du SGACPR sur le financement de l'habitat 2022 | 2025-08-24 | 2024-04-05 |
| acpr | as160 | Enquête annuelle du SGACPR sur le financement de l'habitat 2023 | 2025-08-24 | 2024-09-26 |
| acpr | as174 | Enquête annuelle du SGACPR sur le financement de l'habitat 2024 | 2025-09-29 | 2025-09-29 |
| bdf | BSI1 | NA | NA | NA |
| bdf | CPP | Prix immobilier commercial | 2026-07-04 | 2024-07-01 |
| bdf | FM | NA | NA | NA |
| bdf | MIR | NA | NA | NA |
| bdf | MIR1 | NA | NA | NA |
| bdf | RPP | Prix de l'immobilier | 2026-07-04 | 2026-07-04 |
| bdf | immobilier | NA | NA | NA |
| cgedd | nombre-vente-maison-appartement-ancien | Nombre de ventes de logements anciens cumulé sur 12 mois | 2026-04-11 | 2026-01-12 |
| insee | CONSTRUCTION-LOGEMENTS | Construction de logements | 2026-07-04 | 2026-07-04 |
| insee | ENQ-CONJ-ART-BAT | Conjoncture dans l'artisanat du bâtiment | 2026-07-04 | 2026-07-04 |
| insee | ENQ-CONJ-IND-BAT | Conjoncture dans l'industrie du bâtiment - ENQ-CONJ-IND-BAT | 2026-07-04 | 2026-07-04 |
| insee | ENQ-CONJ-PROMO-IMMO | Conjoncture dans la promotion immobilière | 2026-07-04 | 2026-07-04 |
| insee | ENQ-CONJ-TP | Conjoncture dans les travaux publics | 2026-07-04 | 2026-07-04 |
| insee | ILC-ILAT-ICC | Indices pour la révision d’un bail commercial ou professionnel | 2026-07-04 | 2026-07-04 |
| insee | INDICES_LOYERS | Indices des loyers d'habitation (ILH) | 2026-07-04 | 2026-07-04 |
| insee | IPLA-IPLNA-2015 | Indices des prix des logements neufs et Indices Notaires-Insee des prix des logements anciens | 2026-07-04 | 2026-07-04 |
| insee | IRL | Indice pour la révision d’un loyer d’habitation | 2026-01-08 | 2026-07-04 |
| insee | PARC-LOGEMENTS | Estimations annuelles du parc de logements (EAPL) | 2026-07-04 | 2023-12-03 |
| insee | SERIES_LOYERS | Variation des loyers | 2026-07-04 | 2026-07-04 |
| insee | t_dpe_val | Dépenses de consommation des ménages pré-engagées | 2026-07-04 | 2026-02-27 |
| notaires | arrdt | NA | NA | NA |
| notaires | dep | Prix au m^2 par département | 2026-07-04 | 2026-07-04 |
| olap | loyers | NA | NA | NA |
Data on housing
| source | dataset | Title | .html | .rData |
|---|---|---|---|---|
| bdf | RPP | Prix de l'immobilier | 2026-07-04 | 2026-07-04 |
| bis | LONG_PP | Residential property prices - detailed series | 2026-06-19 | 2024-05-10 |
| bis | SELECTED_PP | Property prices, selected series | 2026-06-19 | 2026-06-20 |
| ecb | RPP | NA | NA | NA |
| eurostat | ei_hppi_q | House price index (2015 = 100) - quarterly data | 2026-06-20 | 2026-04-26 |
| eurostat | hbs_str_t223 | Mean consumption expenditure by income quintile | 2025-10-11 | 2026-04-26 |
| eurostat | prc_hicp_midx | HICP (2015 = 100) - monthly data (index) | 2026-06-21 | 2026-04-26 |
| eurostat | prc_hpi_q | House price index (2015 = 100) - quarterly data | 2026-06-21 | 2026-04-26 |
| fred | housing | House Prices | 2026-07-04 | 2026-07-04 |
| insee | IPLA-IPLNA-2015 | Indices des prix des logements neufs et Indices Notaires-Insee des prix des logements anciens | 2026-07-04 | 2026-07-04 |
| oecd | SNA_TABLE5 | Final consumption expenditure of households | 2026-06-21 | 2023-10-19 |
| oecd | housing | NA | NA | NA |
LAST_COMPILE
| LAST_COMPILE |
|---|
| 2026-07-04 |
Last
Code
HistoriquedesprixaumappartementsanciensParispararrdt %>%
  group_by(date) %>%
  summarise(Nobs = n()) %>%
  arrange(desc(date)) %>%
  head(1) %>%
print_table_conditional()| date | Nobs |
|---|---|
| 2025-07-01 | 21 |
Exemples
2008-
Code
HistoriquedesprixaumappartementsanciensParispararrdt %>%
  filter(date %in% c(as.Date("2008-01-01"), max(date))) %>%
  spread(date, value) %>%
  #setNames(c("Arrondissement", "2021T3", "2023T2")) %>%
  mutate(`Croissance (%)` = round(100*(.[[3]]/.[[2]]-1), 1),
         `Croissance (€)` = round(.[[3]]-.[[2]])) %>%
  arrange(-`Croissance (%)`) %>%
  {if (is_html_output()) datatable(., filter = 'top', rownames = F) else .}
2009Q2-
Code
HistoriquedesprixaumappartementsanciensParispararrdt %>%
  filter(date %in% c(as.Date("2009-04-01"), max(date))) %>%
  mutate(date = paste0("Prix m2 ", date)) %>%
  spread(date, value) %>%
  #setNames(c("Arrondissement", "2021T3", "2023T2")) %>%
  mutate(`Croissance (%)` = round(100*(.[[3]]/.[[2]]-1), 1),
         `Croissance (€)` = round(.[[3]]-.[[2]])) %>%
  arrange(-`Croissance (%)`) %>%
  rename(arrdt = Location) %>%
  {if (is_html_output()) datatable(., filter = 'top', rownames = F) else .}
2008-2020
Code
HistoriquedesprixaumappartementsanciensParispararrdt %>%
  filter(date %in% c(as.Date("2008-01-01"), as.Date("2020-01-01"))) %>%
  spread(date, value) %>%
  #setNames(c("Arrondissement", "2021T3", "2023T2")) %>%
  mutate(`Croissance (%)` = round(100*(.[[3]]/.[[2]]-1), 1),
         `Croissance (€)` = round(.[[3]]-.[[2]])) %>%
  arrange(-`Croissance (%)`) %>%
  {if (is_html_output()) datatable(., filter = 'top', rownames = F) else .}
2022T2-2023T2
Code
HistoriquedesprixaumappartementsanciensParispararrdt %>%
  filter(date %in% c(as.Date("2022-04-01"), as.Date("2023-04-01"))) %>%
  spread(date, value) %>%
  #setNames(c("Arrondissement", "2021T3", "2023T2")) %>%
  mutate(`Croissance (%)` = round(100*(.[[3]]/.[[2]]-1), 1),
         `Croissance (€)` = round(.[[3]]-.[[2]])) %>%
  arrange(-`Croissance (%)`) %>%
  {if (is_html_output()) datatable(., filter = 'top', rownames = F) else .}
2021T3-2023T2
Code
HistoriquedesprixaumappartementsanciensParispararrdt %>%
  filter(date %in% c(as.Date("2021-07-01"), as.Date("2023-04-01"))) %>%
  spread(date, value) %>%
  #setNames(c("Arrondissement", "2021T3", "2023T2")) %>%
  mutate(`Croissance (%)` = round(100*(.[[3]]/.[[2]]-1), 1),
         `Croissance (€)` = round(.[[3]]-.[[2]])) %>%
  arrange(-`Croissance (%)`) %>%
  {if (is_html_output()) datatable(., filter = 'top', rownames = F) else .}
100 = 2008
Code
HistoriquedesprixaumappartementsanciensParispararrdt %>%
  filter(Location %in% c("Centre", "6e", "10e")) %>%
  group_by(Location) %>%
  mutate(value = 100*value/value[date == as.Date("2008-01-01")]) %>%
  ggplot + geom_line(aes(x = date, y = value, color = Location)) +

  theme_minimal()  +
  scale_x_date(breaks = as.Date(paste0(seq(1960, 2050, 2), "-01-01")),
               labels = date_format("%Y")) +
  theme(legend.position = c(0.25, 0.85),
        legend.title = element_blank()) +
  xlab("") + ylab("Indice des prix au mètre carré (2008 = 100") +
  scale_y_log10(breaks = seq(0, 7000, 10))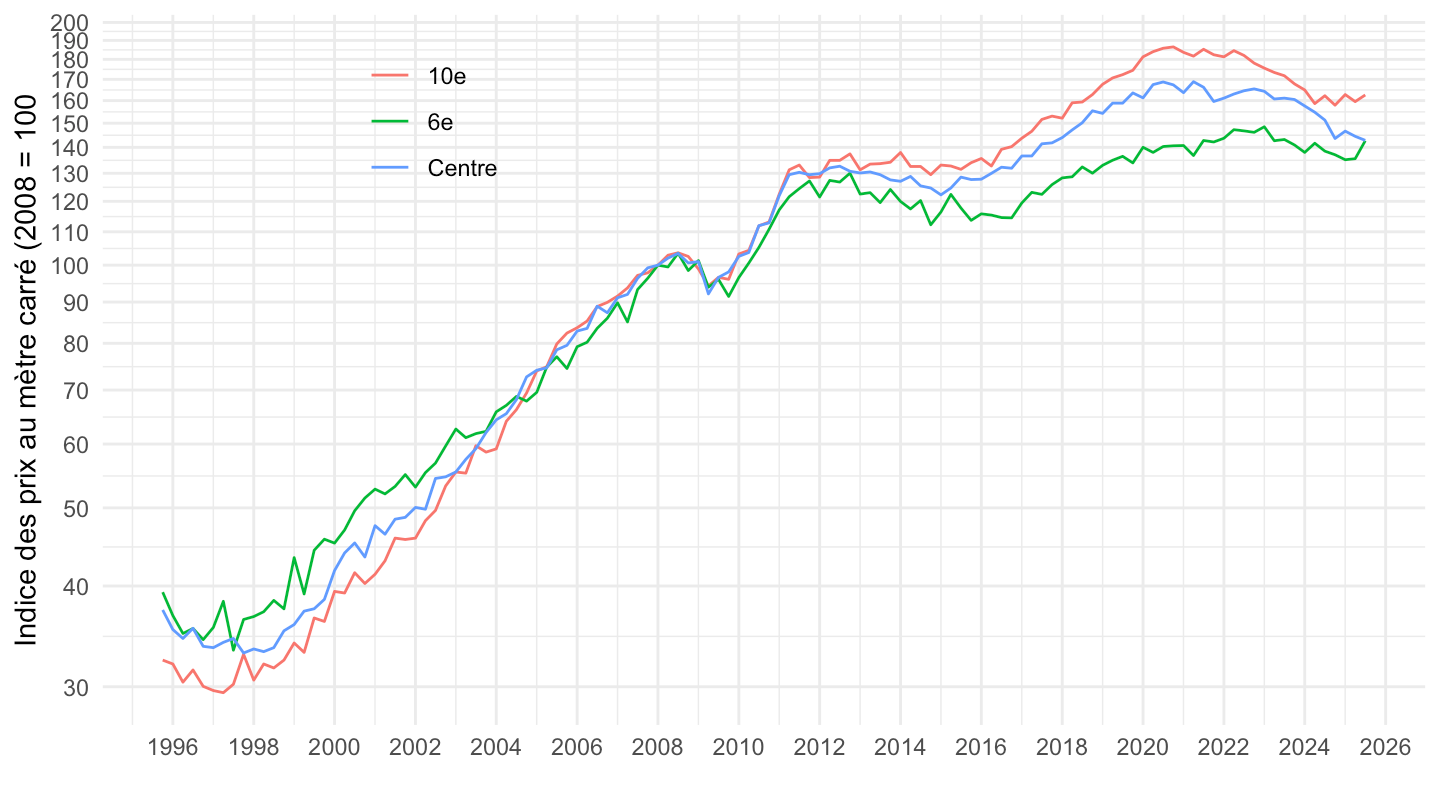
Carte arrondissements
Code
i_g("bib/france/arrondissements-paris-2.jpg")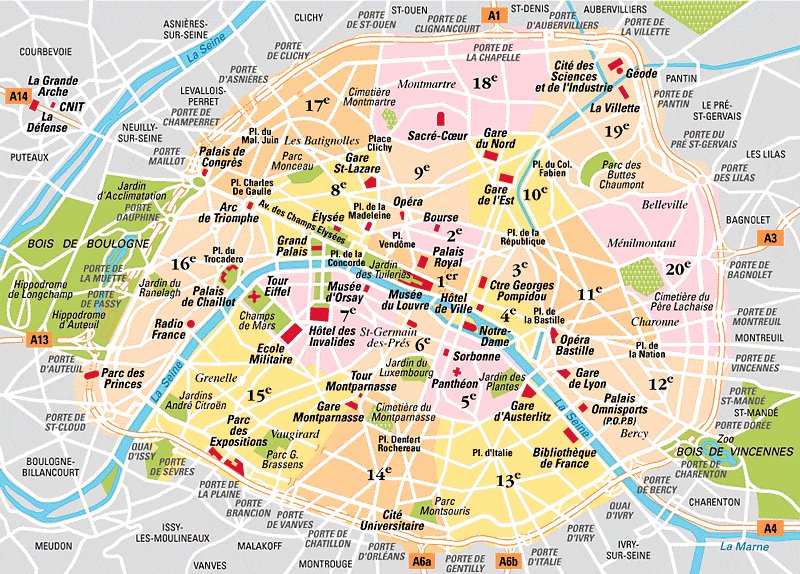
Prix mètre carré
13ème, 14ème, 15ème arrondissement
All
Code
HistoriquedesprixaumappartementsanciensParispararrdt %>%
  filter(Location %in% c("13e", "14e", "15e")) %>%
  group_by(Location) %>%
  ggplot + geom_line(aes(x = date, y = value, color = gsub("e", "ème arrondissement", Location))) +

  theme_minimal()  +
  scale_x_date(breaks = as.Date(paste0(seq(1960, 2050, 2), "-01-01")),
               labels = date_format("%Y")) +
  theme(legend.position = c(0.25, 0.85),
        legend.title = element_blank()) +
  xlab("") + ylab("Prix au mètre carré") +
  scale_y_log10(breaks = seq(0, 17000, 1000),
                labels = dollar_format(p = "", su = "€", a = 1))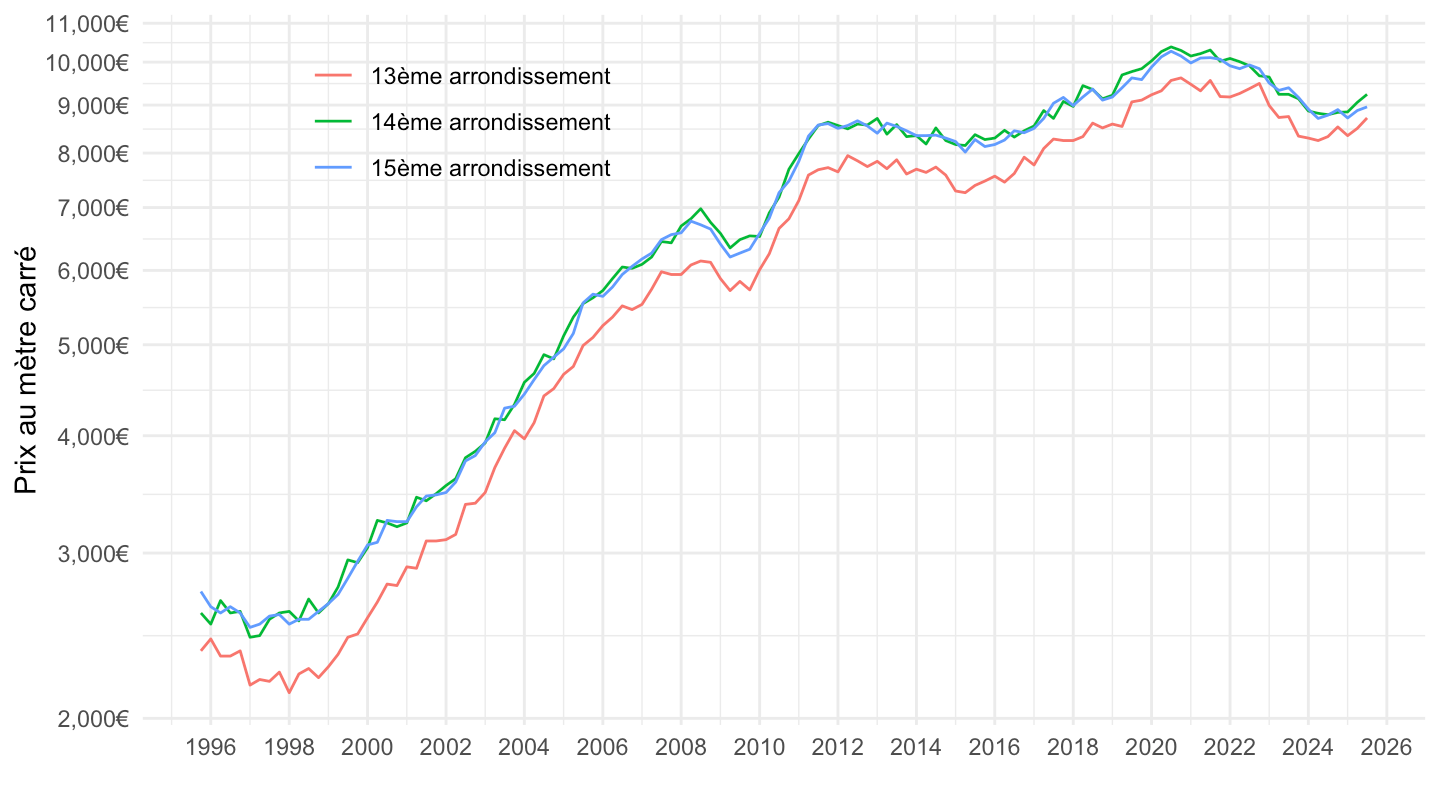
2014-
Code
HistoriquedesprixaumappartementsanciensParispararrdt %>%
  filter(Location %in% c("13e", "14e", "15e")) %>%
  group_by(Location) %>%
  filter(date >= as.Date("2014-01-01")) %>%
  ggplot + geom_line(aes(x = date, y = value, color = gsub("e", "ème arrondissement", Location))) +

  theme_minimal()  +
  scale_x_date(breaks = as.Date(paste0(seq(1960, 2050, 1), "-01-01")),
               labels = date_format("%Y")) +
  theme(legend.position = c(0.25, 0.85),
        legend.title = element_blank()) +
  xlab("") + ylab("Prix au mètre carré") +
  scale_y_log10(breaks = seq(0, 17000, 1000),
                labels = dollar_format(p = "", su = "€", a = 1))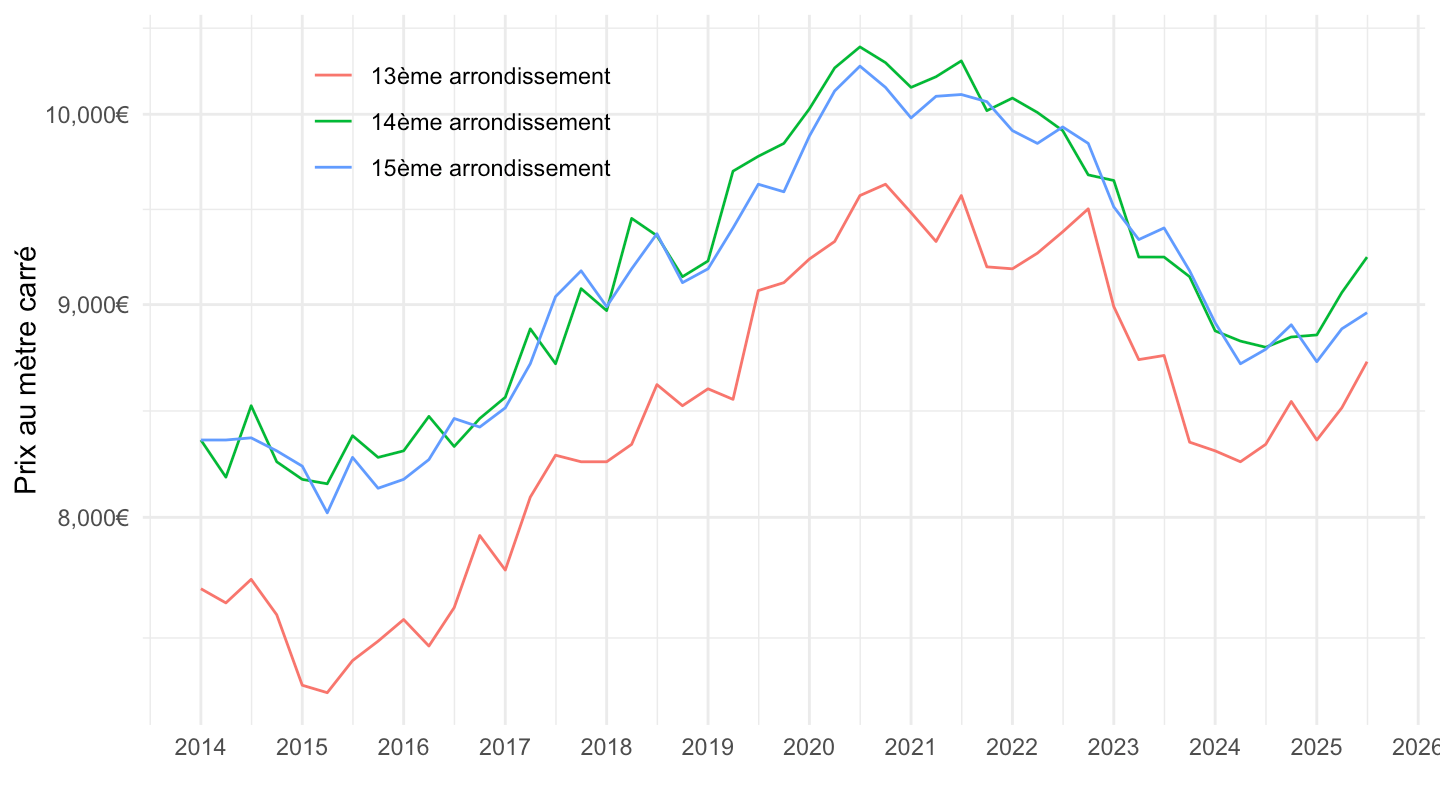
2017-
Code
HistoriquedesprixaumappartementsanciensParispararrdt %>%
  filter(Location %in% c("13e", "14e", "15e")) %>%
  group_by(Location) %>%
  filter(date >= as.Date("2017-01-01")) %>%
  ggplot + geom_line(aes(x = date, y = value, color = gsub("e", "ème arrondissement", Location))) +

  theme_minimal()  +
  scale_x_date(breaks = as.Date(paste0(seq(1960, 2050, 1), "-01-01")),
               labels = date_format("%Y")) +
  theme(legend.position = c(0.15, 0.85),
        legend.title = element_blank()) +
  xlab("") + ylab("Prix au mètre carré") +
  scale_y_log10(breaks = seq(0, 17000, 200),
                labels = dollar_format(p = "", su = "€", a = 1))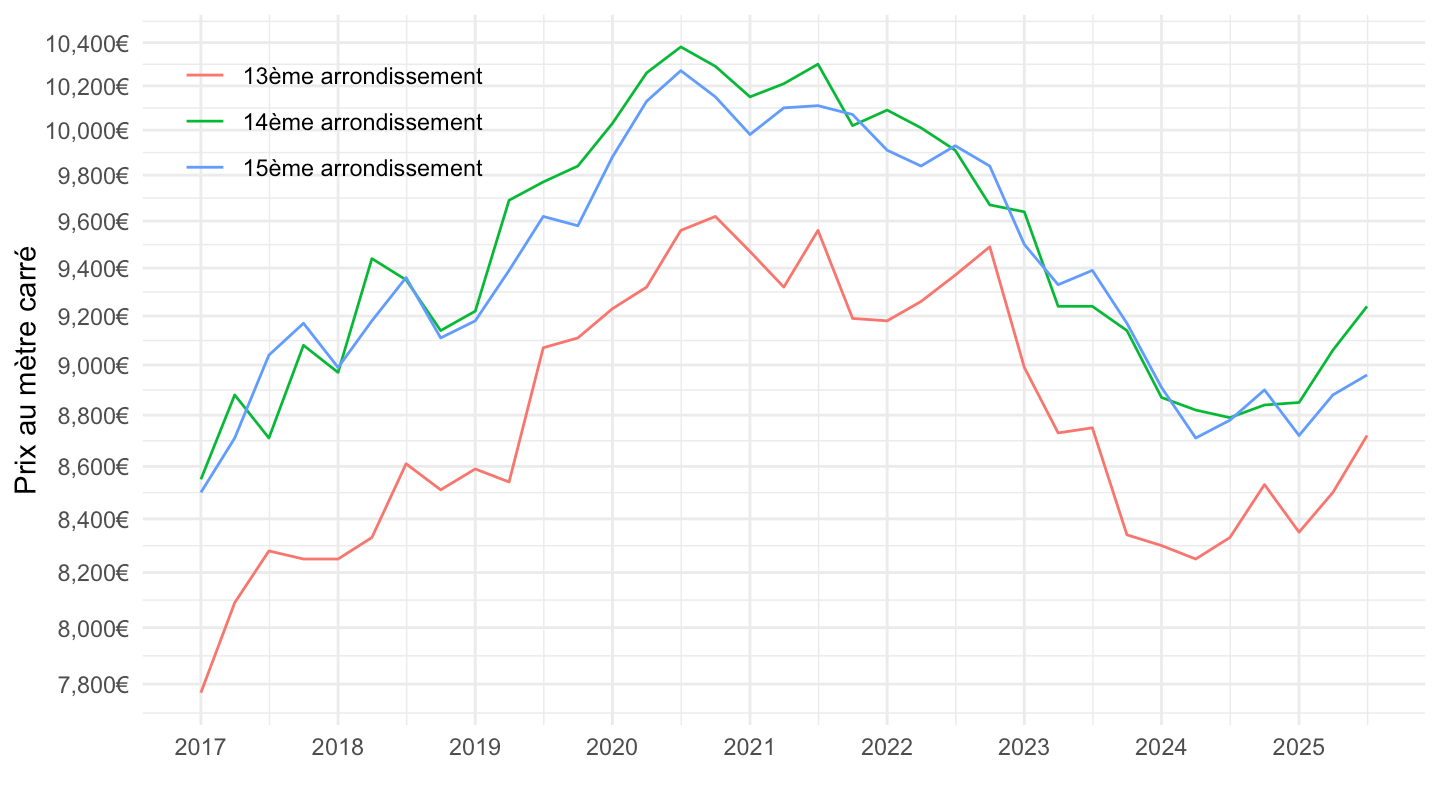
2018-
Code
HistoriquedesprixaumappartementsanciensParispararrdt %>%
  filter(Location %in% c("13e", "14e", "15e")) %>%
  group_by(Location) %>%
  filter(date >= as.Date("2018-01-01")) %>%
  ggplot + geom_line(aes(x = date, y = value, color = gsub("e", "ème arrondissement", Location))) +

  theme_minimal()  +
  scale_x_date(breaks = as.Date(paste0(seq(1960, 2050, 1), "-01-01")),
               labels = date_format("%Y")) +
  theme(legend.position = c(0.15, 0.85),
        legend.title = element_blank()) +
  xlab("") + ylab("Prix au mètre carré") +
  scale_y_log10(breaks = seq(0, 17000, 200),
                labels = dollar_format(p = "", su = "€", a = 1))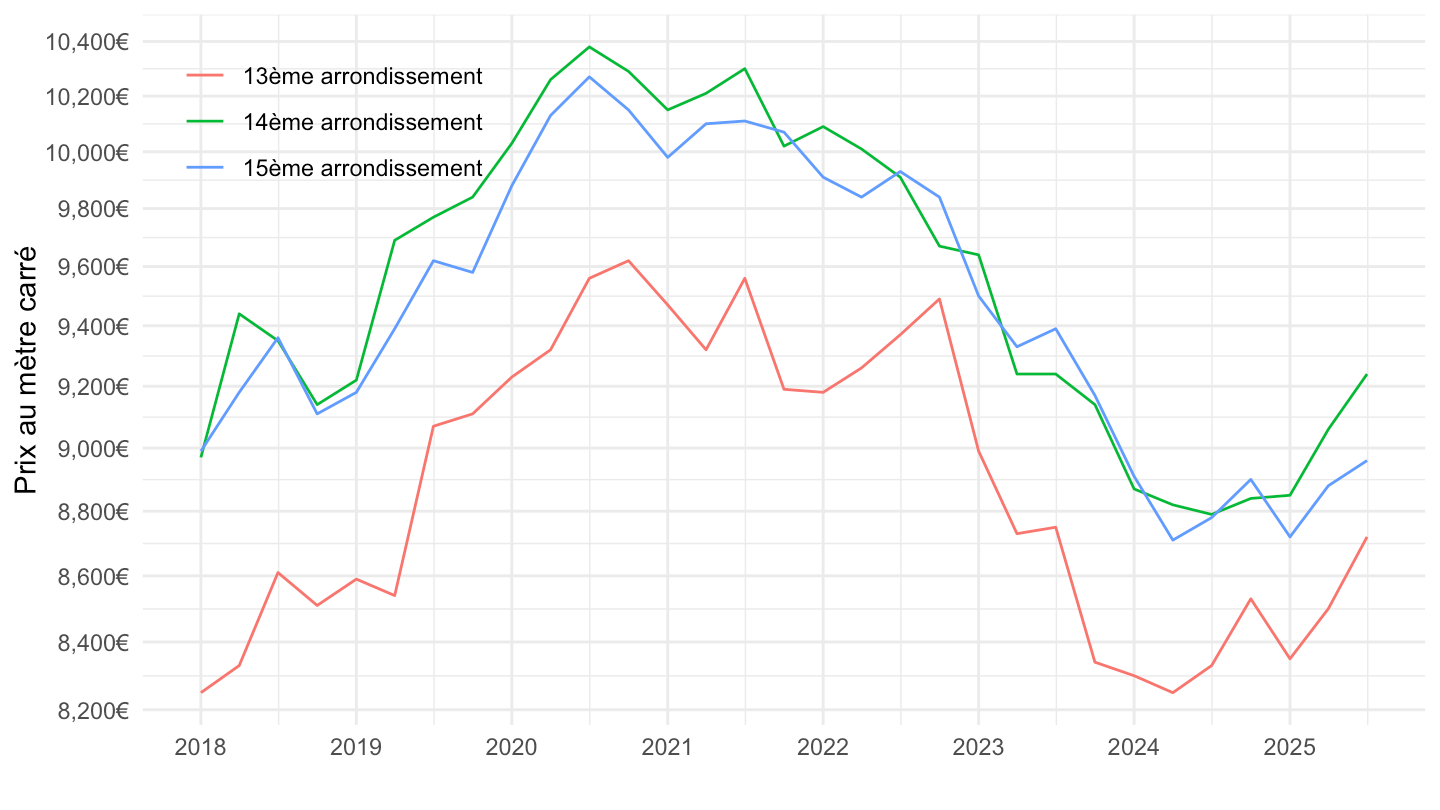
16ème, 6ème, 7ème arrondissement
Value
Code
HistoriquedesprixaumappartementsanciensParispararrdt %>%
  filter(Location %in% c("16e", "6e", "7e")) %>%
  group_by(Location) %>%
  ggplot + geom_line(aes(x = date, y = value, color = gsub("e", "ème arrondissement", Location))) +

  theme_minimal()  +
  scale_x_date(breaks = as.Date(paste0(seq(1960, 2050, 2), "-01-01")),
               labels = date_format("%Y")) +
  theme(legend.position = c(0.25, 0.85),
        legend.title = element_blank()) +
  xlab("") + ylab("Prix au mètre carré") +
  scale_y_log10(breaks = seq(0, 17000, 1000),
                labels = dollar_format(p = "", su = "€", a = 1))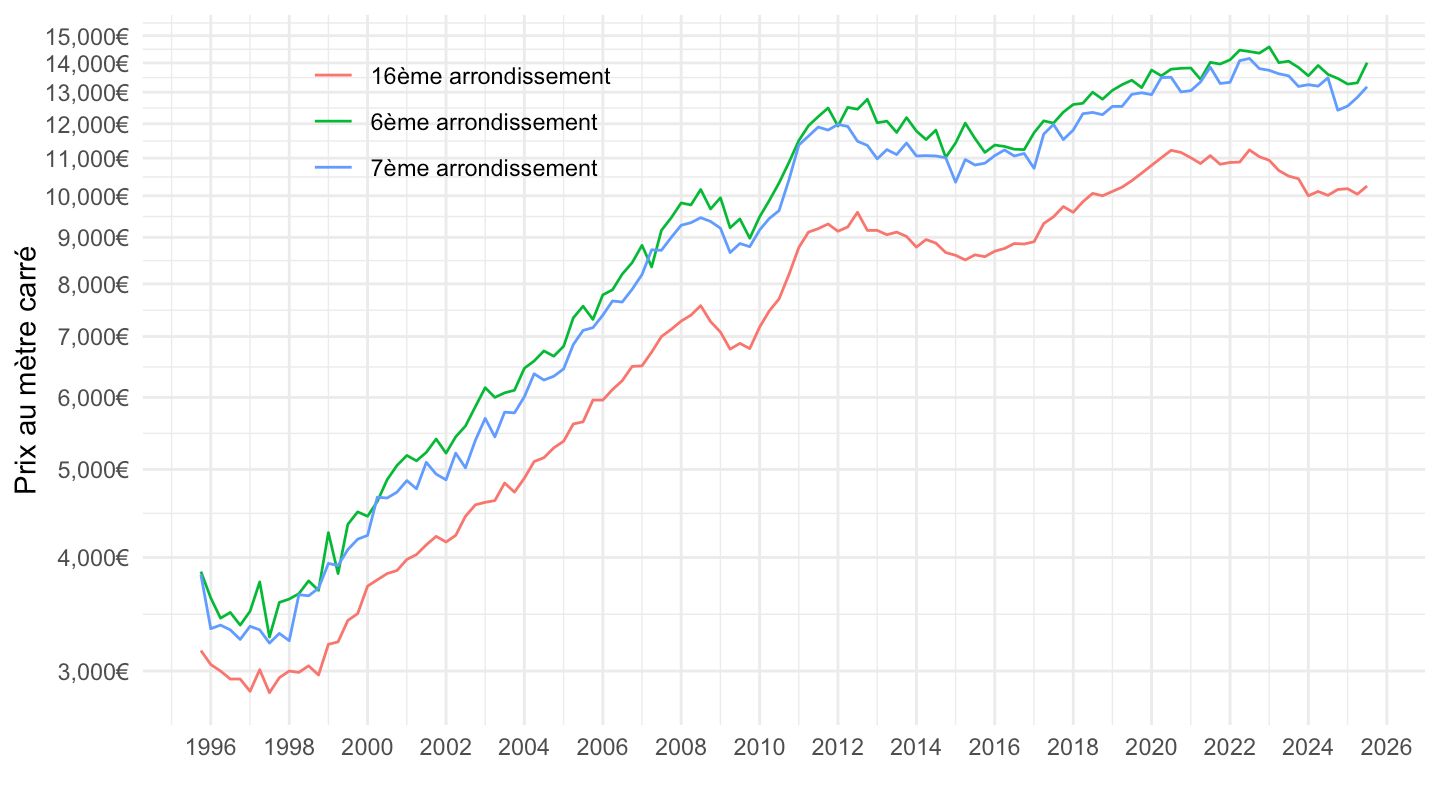
100 = 2008
Code
HistoriquedesprixaumappartementsanciensParispararrdt %>%
  filter(Location %in% c("16e", "6e", "7e")) %>%
  group_by(Location) %>%
  mutate(value = 100*value/value[date == as.Date("2008-01-01")]) %>%
  ggplot + geom_line(aes(x = date, y = value, color = gsub("e", "ème arrondissement", Location))) +

  theme_minimal()  +
  scale_x_date(breaks = as.Date(paste0(seq(1960, 2050, 2), "-01-01")),
               labels = date_format("%Y")) +
  theme(legend.position = c(0.25, 0.85),
        legend.title = element_blank()) +
  xlab("") + ylab("Indice des prix au mètre carré (2008 = 100)") +
  scale_y_log10(breaks = seq(0, 7000, 10))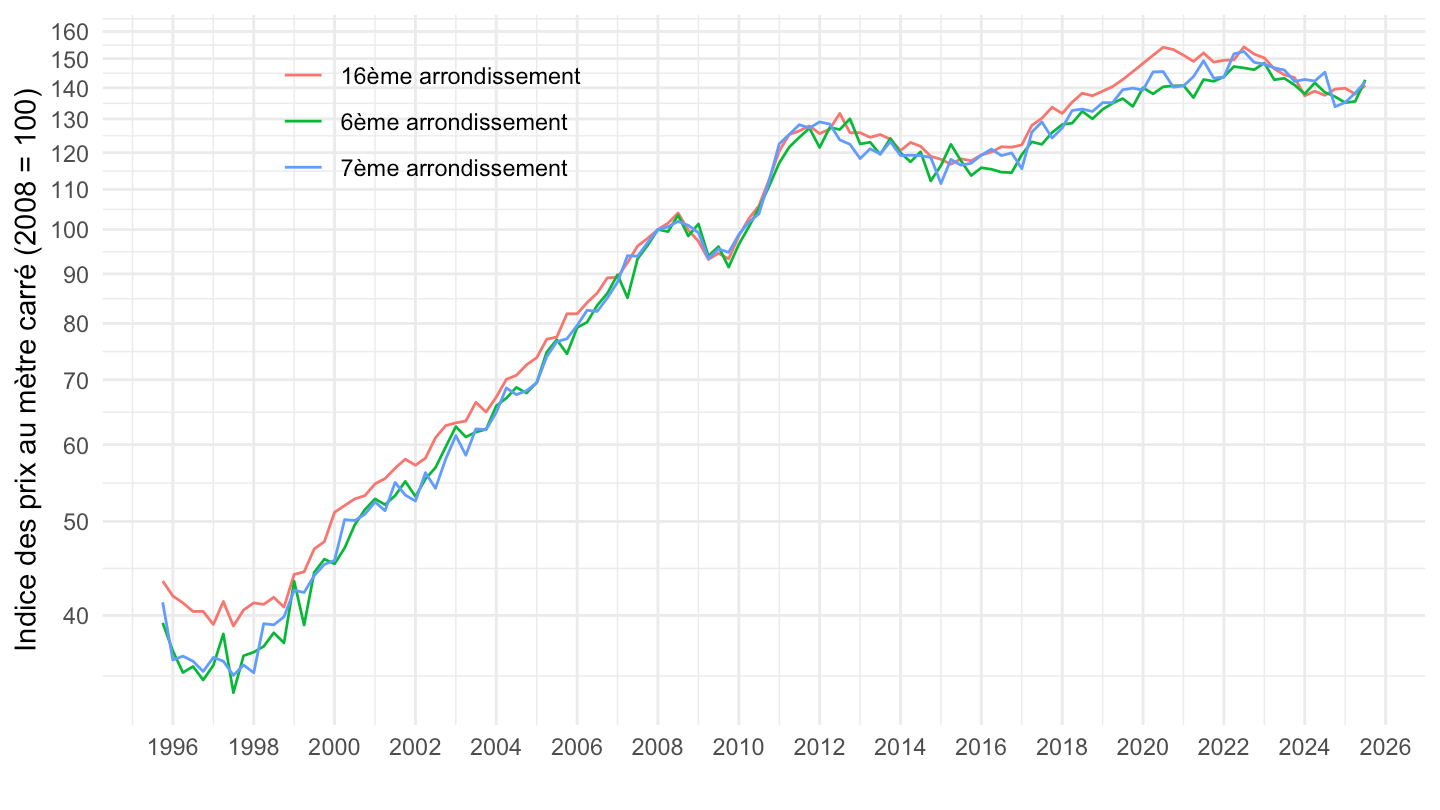
6ème, 5ème, 14ème arrondissement
Value
Code
HistoriquedesprixaumappartementsanciensParispararrdt %>%
  filter(Location %in% c("6e", "5e", "14e")) %>%
  group_by(Location) %>%
  ggplot + geom_line(aes(x = date, y = value, color = gsub("e", "ème arrondissement", Location))) +

  theme_minimal()  +
  scale_x_date(breaks = as.Date(paste0(seq(1960, 2050, 2), "-01-01")),
               labels = date_format("%Y")) +
  theme(legend.position = c(0.25, 0.85),
        legend.title = element_blank()) +
  xlab("") + ylab("Prix au mètre carré") +
  scale_y_log10(breaks = seq(0, 17000, 1000),
                labels = dollar_format(p = "", su = "€", a = 1))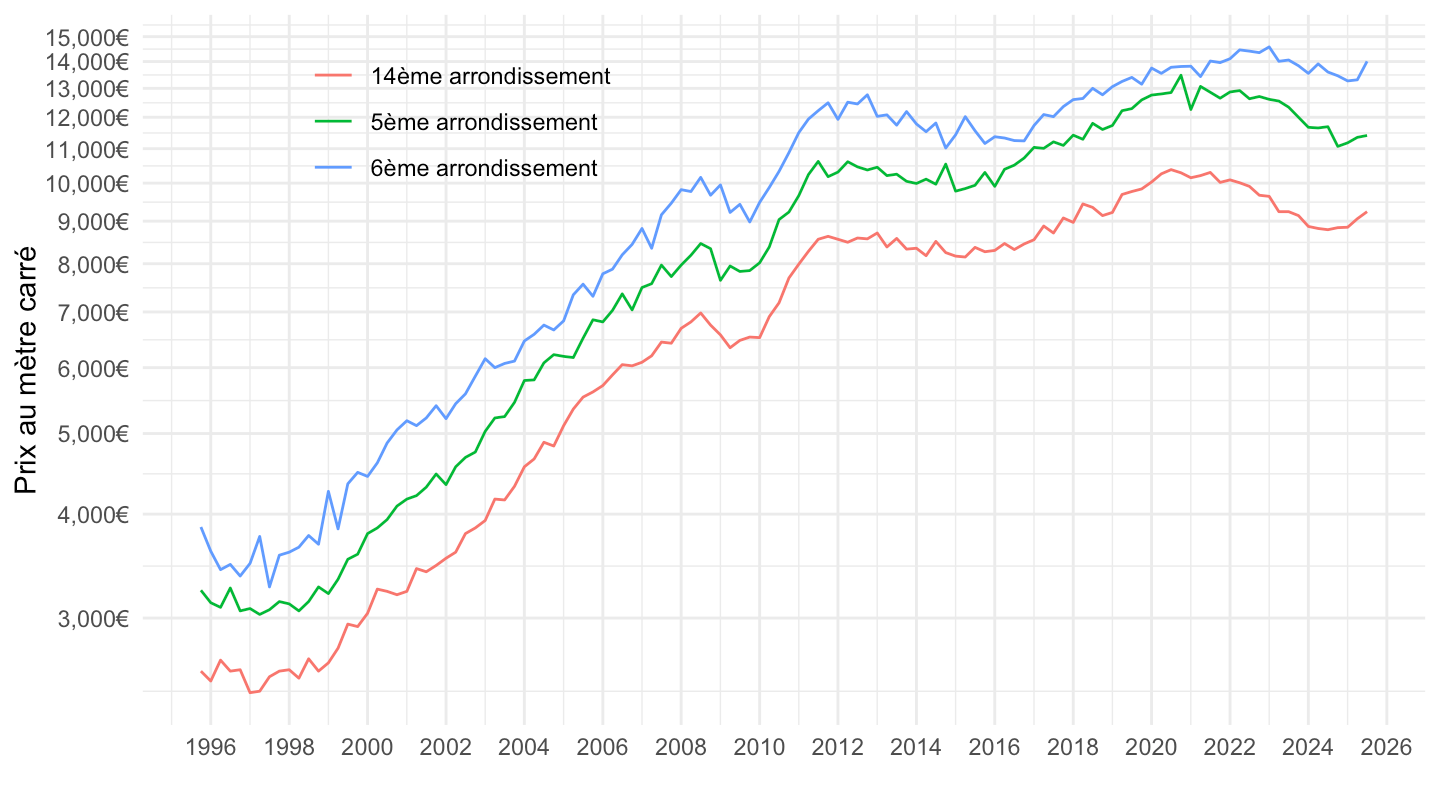
100 = 2008
Code
HistoriquedesprixaumappartementsanciensParispararrdt %>%
  filter(Location %in% c("6e", "5e", "14e")) %>%
  group_by(Location) %>%
  mutate(value = 100*value/value[date == as.Date("2008-01-01")]) %>%
  ggplot + geom_line(aes(x = date, y = value, color = gsub("e", "ème arrondissement", Location))) +

  theme_minimal()  +
  scale_x_date(breaks = as.Date(paste0(seq(1960, 2050, 2), "-01-01")),
               labels = date_format("%Y")) +
  theme(legend.position = c(0.25, 0.85),
        legend.title = element_blank()) +
  xlab("") + ylab("Indice des prix au mètre carré (2008 = 100)") +
  scale_y_log10(breaks = seq(0, 7000, 10))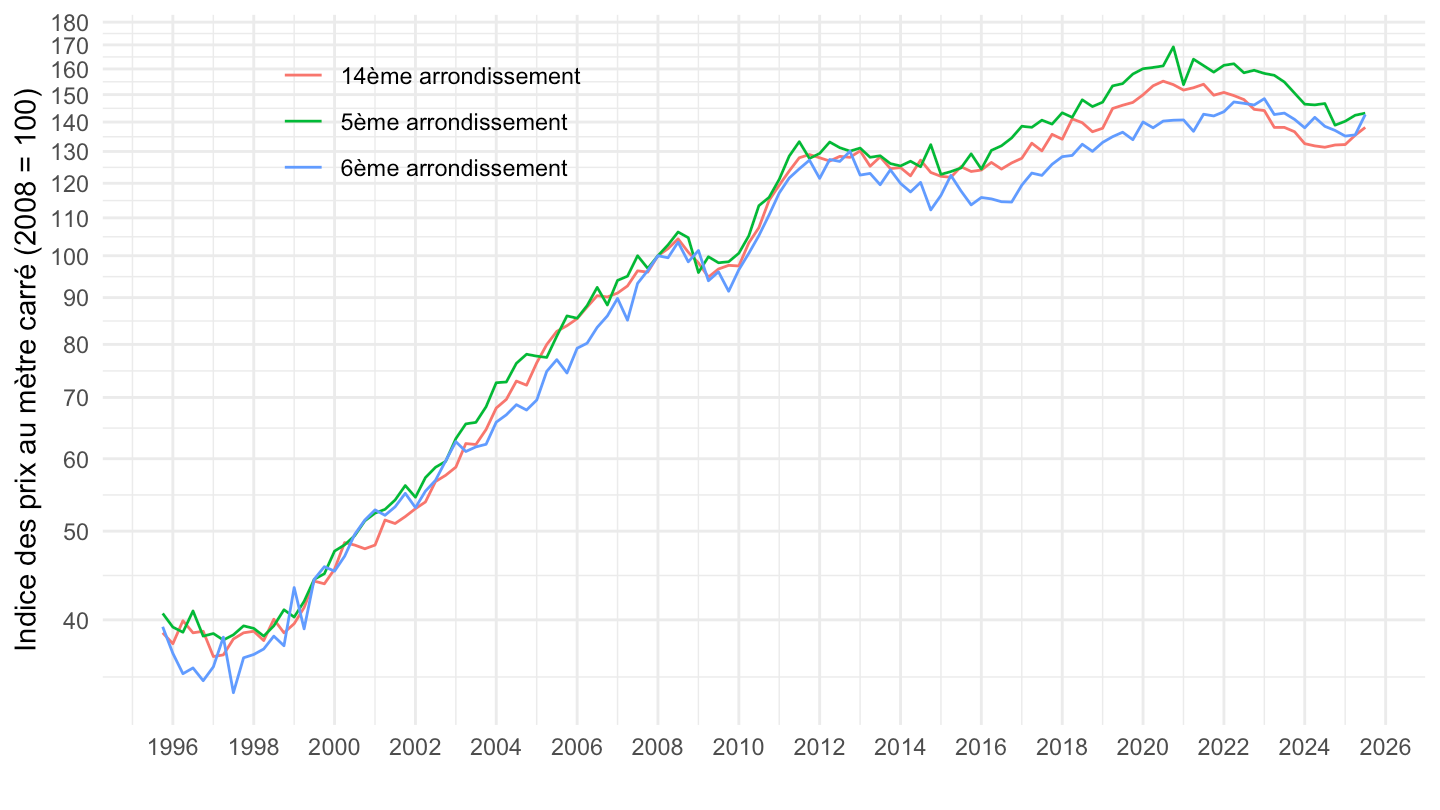
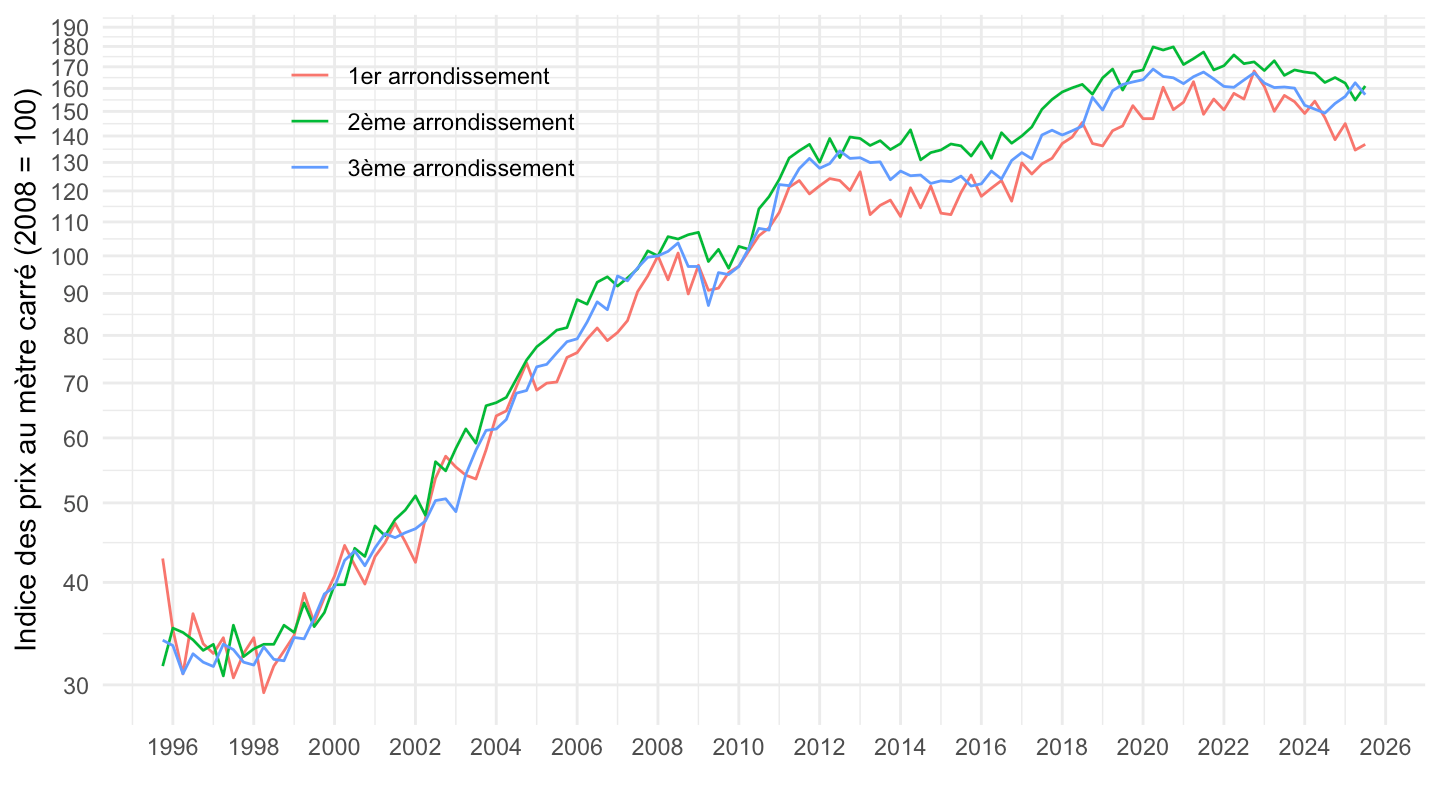
1er, 2ème, 3ème arrondissement
Value
Code
HistoriquedesprixaumappartementsanciensParispararrdt %>%
  filter(Location %in% c("1er", "2e", "3e")) %>%
  mutate(Location = case_when(Location == "1er" ~ "1er arrondissement",
                              Location == "2e" ~ "2ème arrondissement",
                              Location == "3e" ~ "3ème arrondissement")) %>%
  group_by(Location) %>%
  ggplot + geom_line(aes(x = date, y = value, color = Location)) +

  theme_minimal()  +
  scale_x_date(breaks = as.Date(paste0(seq(1960, 2050, 2), "-01-01")),
               labels = date_format("%Y")) +
  theme(legend.position = c(0.25, 0.85),
        legend.title = element_blank()) +
  xlab("") + ylab("Prix au mètre carré") +
  scale_y_log10(breaks = seq(0, 17000, 1000),
                labels = dollar_format(p = "", su = "€", a = 1))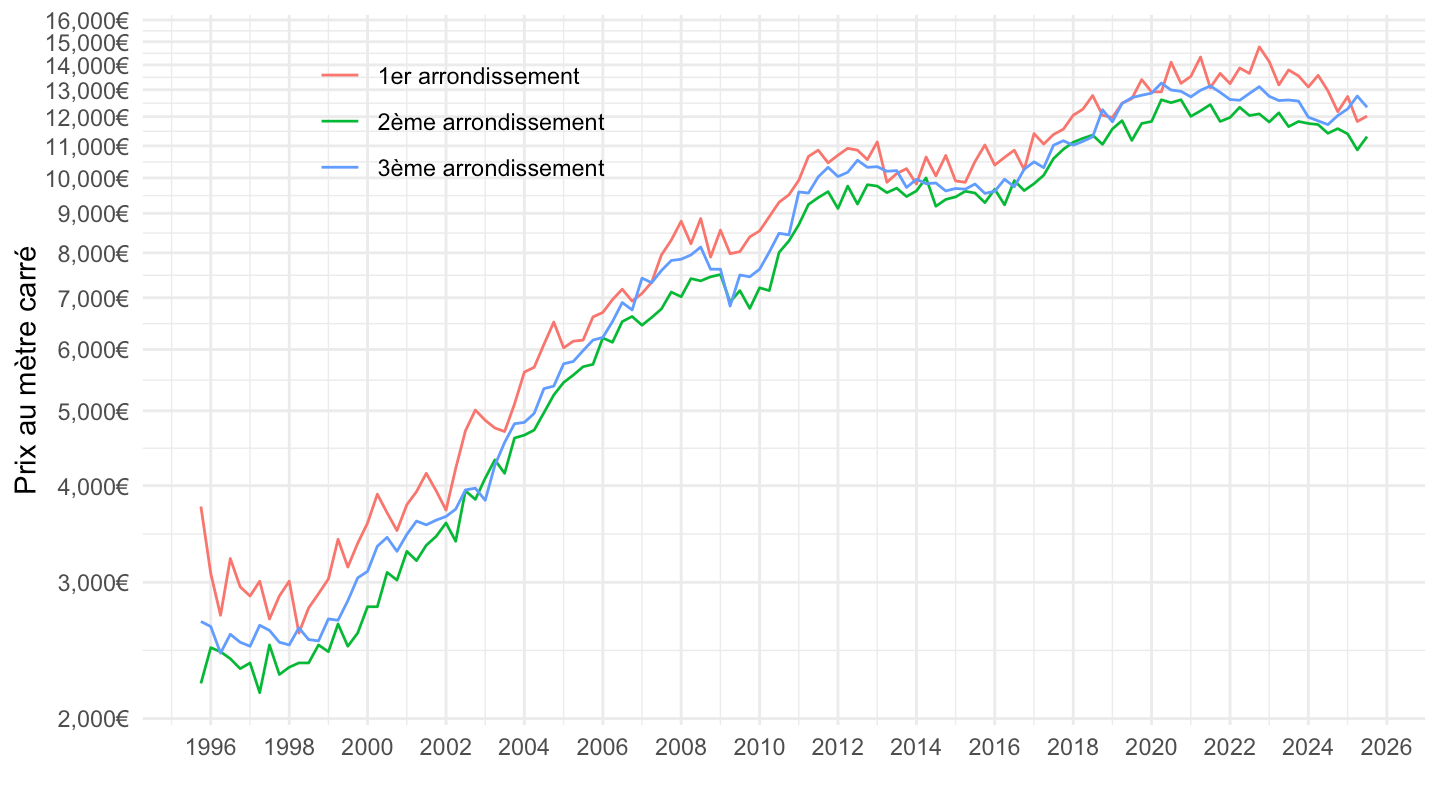
100 = 2008
Code
HistoriquedesprixaumappartementsanciensParispararrdt %>%
  filter(Location %in% c("1er", "2e", "3e")) %>%
  mutate(Location = case_when(Location == "1er" ~ "1er arrondissement",
                              Location == "2e" ~ "2ème arrondissement",
                              Location == "3e" ~ "3ème arrondissement")) %>%
  group_by(Location) %>%
  mutate(value = 100*value/value[date == as.Date("2008-01-01")]) %>%
  ggplot + geom_line(aes(x = date, y = value, color = Location)) +

  theme_minimal()  +
  scale_x_date(breaks = as.Date(paste0(seq(1960, 2050, 2), "-01-01")),
               labels = date_format("%Y")) +
  theme(legend.position = c(0.25, 0.85),
        legend.title = element_blank()) +
  xlab("") + ylab("Indice des prix au mètre carré (2008 = 100)") +
  scale_y_log10(breaks = seq(0, 7000, 10))