
Last observation: août 2026 (N = 1157) · Q2 2026 (N = 421)
First observation: janv. 1970 (N = 7) · Q4 1977 (N = 21)
Last data update: 07 oct. 2026, 22:51
Last compile: 19 oct. 2026, 00:05
ig_b("insee", "ip1967", "table2")
ig_b("insee", "ip1967", "table2")
ig_b("bdf", "ER-2023_web", "T1")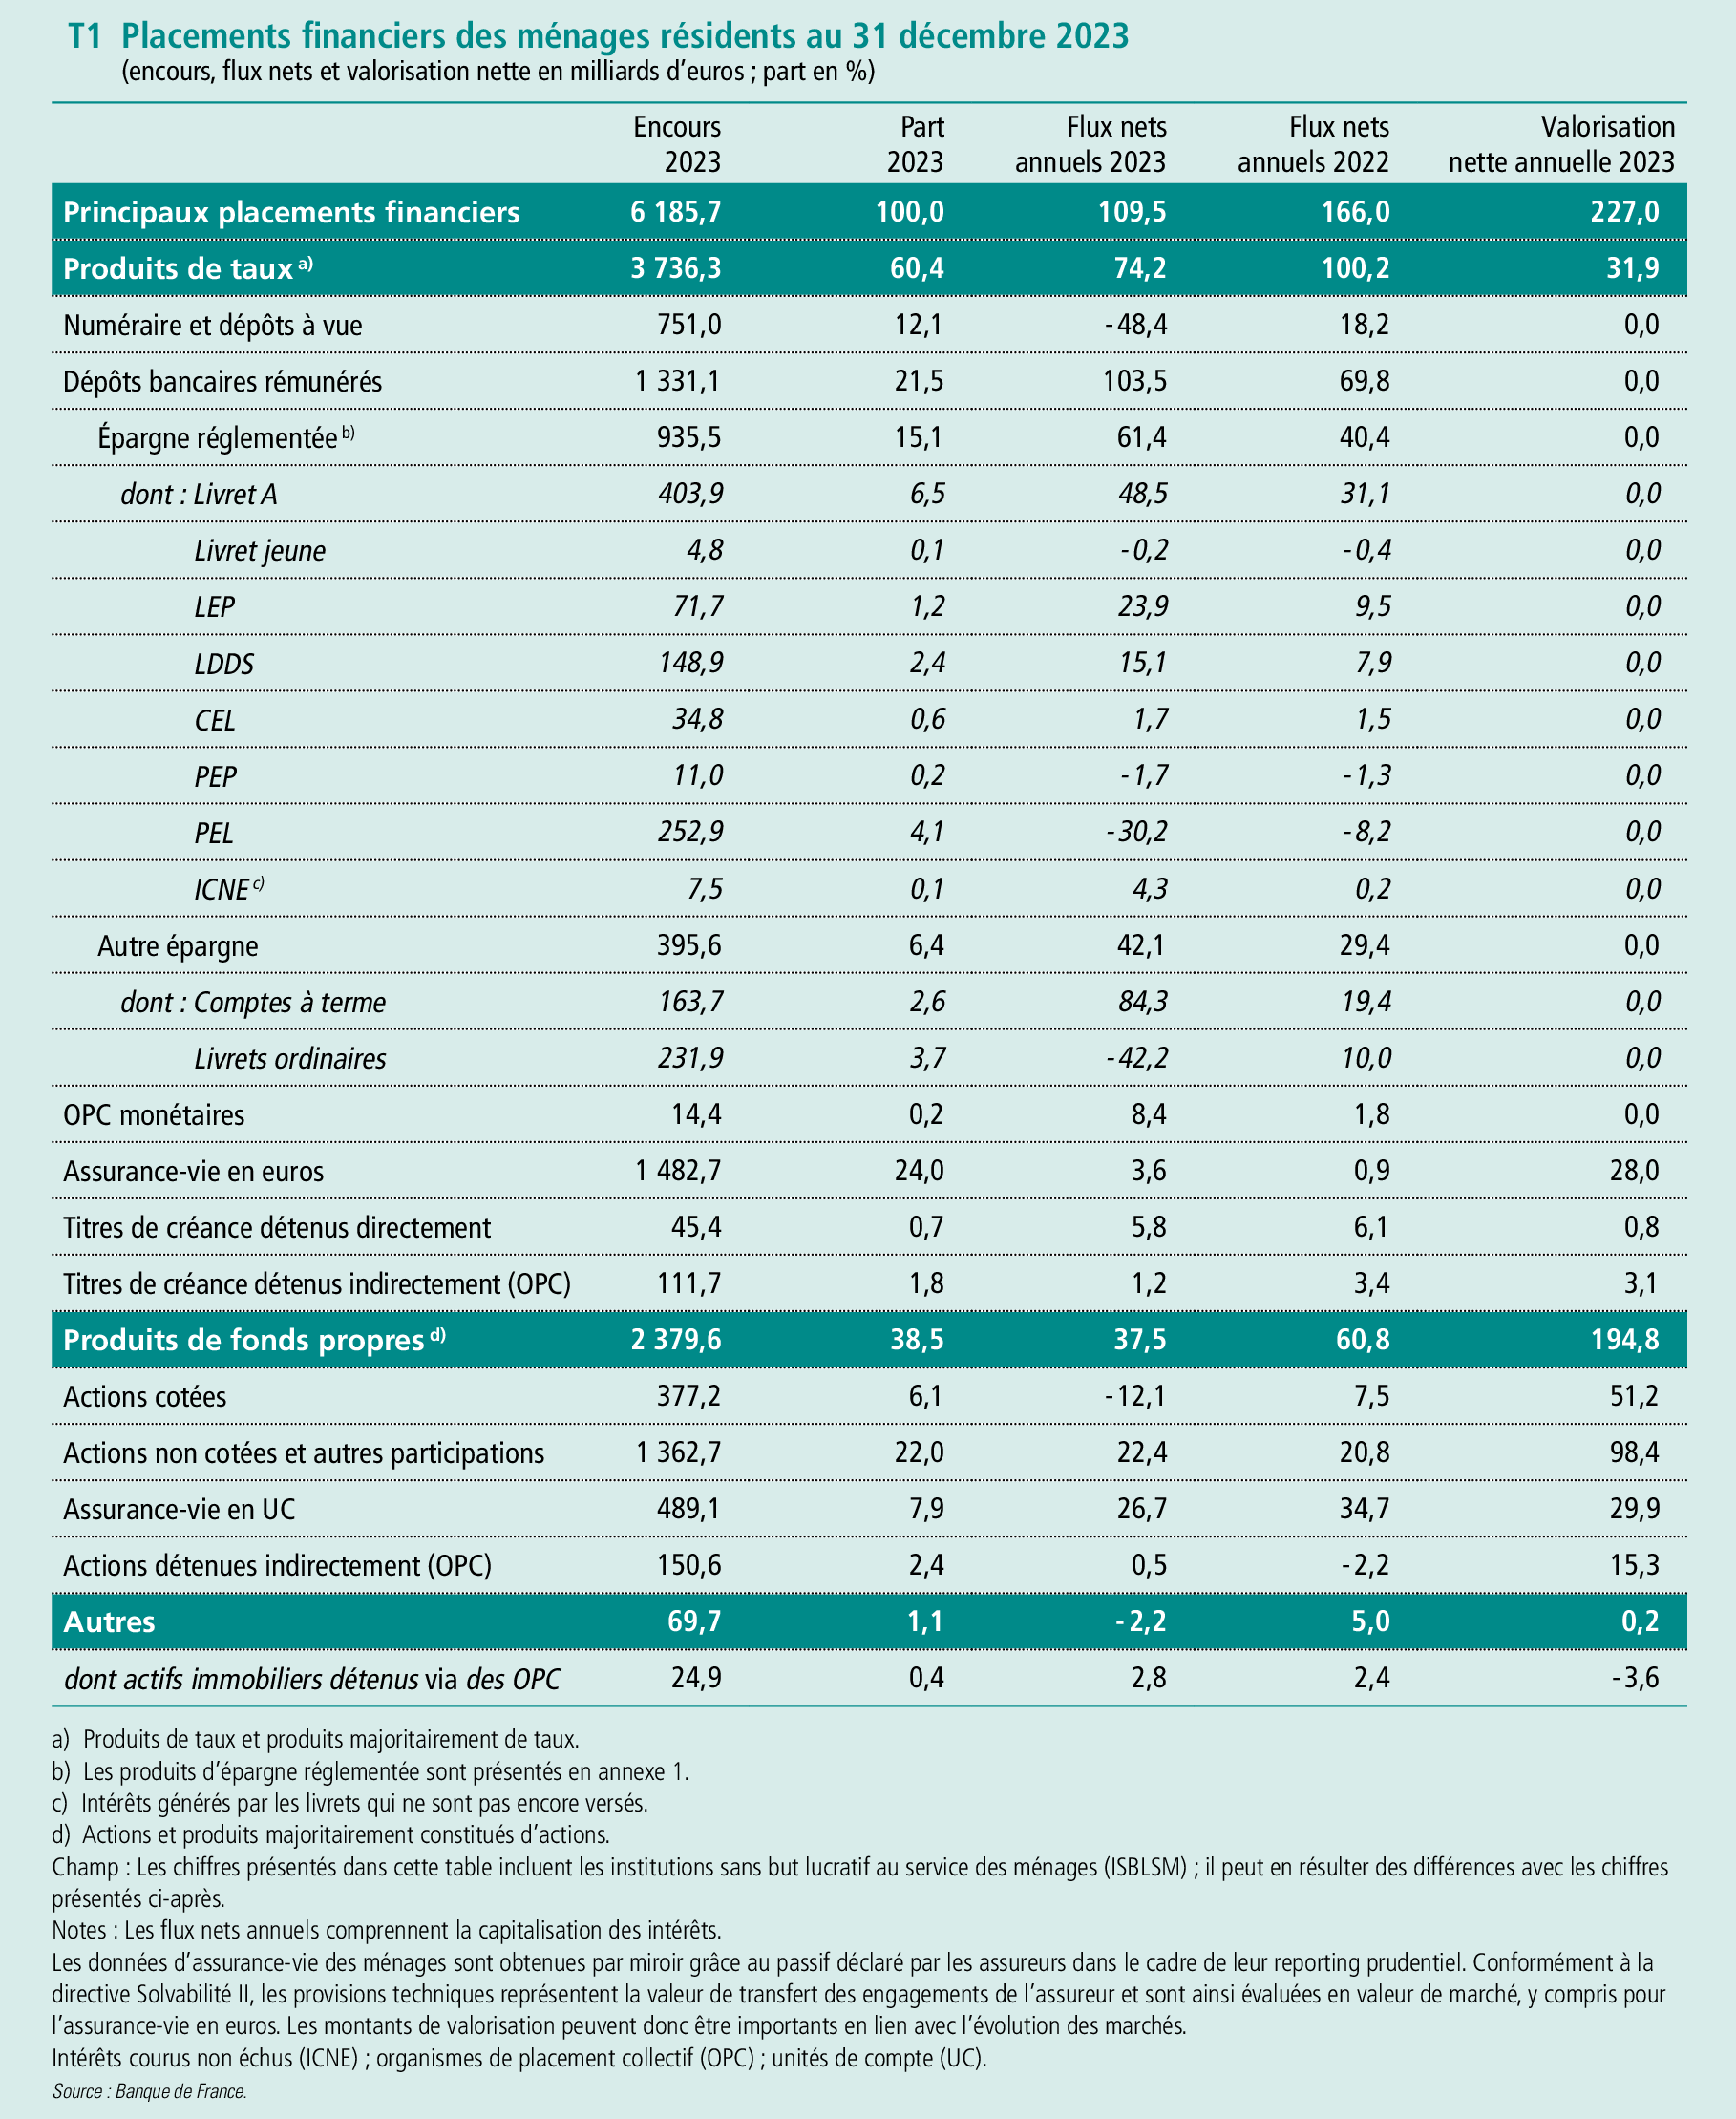
ig_b("bdf", "er-2022_rapport_web", "T1")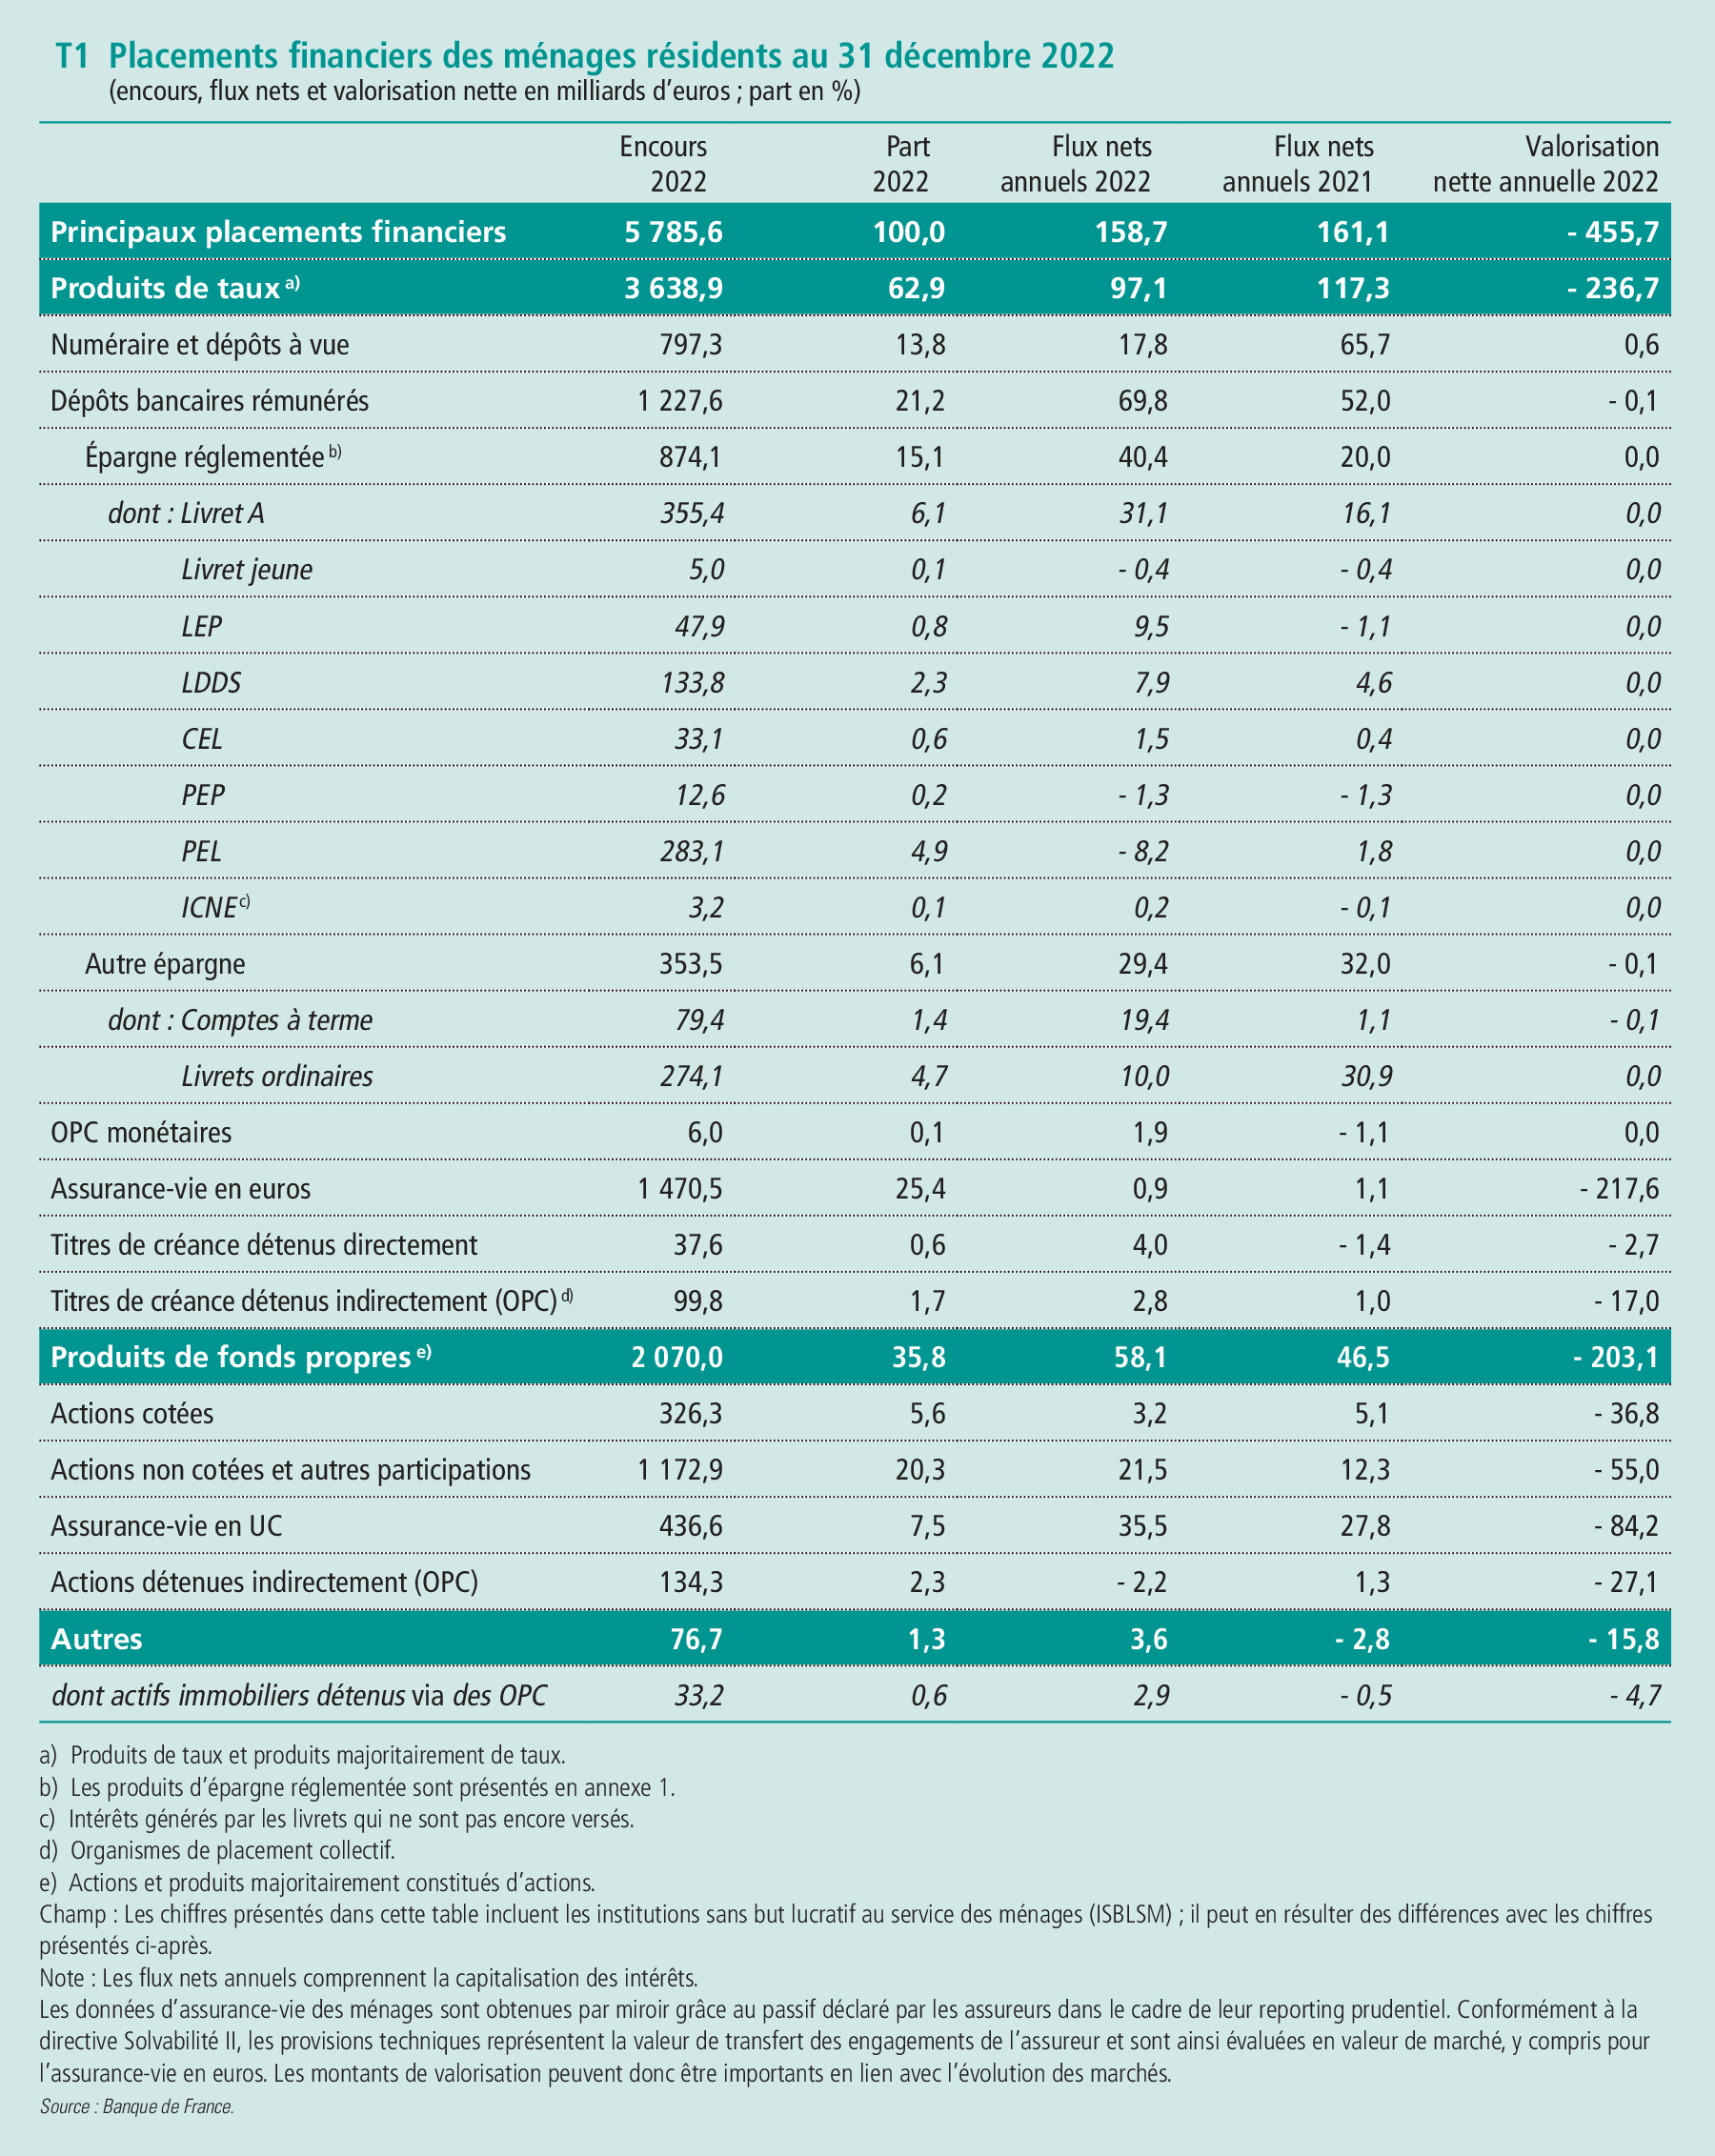
ig_b("bdf", "er-2022_rapport_web", "G1")
BSI1 |>
  filter(variable == "BSI1.M.FR.N.A.L23FRLP.A.1.U6.2251.Z01.E") |>
  arrange(desc(date)) |>

  ggplot() + theme_minimal() + xlab("") + ylab("Livret d'Epargne Populaire") +
  geom_line(aes(x = date, y = value / 1000)) +
  scale_x_date(breaks = as.Date(paste0(seq(1960, 2100, 2), "-01-01")),
               labels = date_format("%Y")) +
  theme(legend.position = c(0.4, 0.9),
        legend.title = element_blank(),
        legend.direction = "vertical") +
  scale_y_continuous(breaks = seq(0, 100, 5),
                labels = dollar_format(suffix = " Mds€", prefix = "",  accuracy = 1)) +
  geom_label(data = . %>% filter(date == as.Date("2023-12-31")),
             aes(x = date, y = value/1000, label = round(value/1000, digits = 1)))
BSI1 |>
  filter(variable %in% c("BSI1.M.FR.N.A.L23FRLA.A.1.U6.2250.Z01.E",
                         "BSI1.M.FR.N.A.L23FRAB.A.1.U6.2250.Z01.E",
                         "BSI1.M.FR.N.A.L22FRPL.A.1.U6.2251.Z01.E")) |>

  ggplot() + theme_minimal() + xlab("") + ylab("Livret A , Livret Bleu") +
  geom_line(aes(x = date, y = value / 1000, color = Variable)) +
  scale_x_date(breaks = as.Date(paste0(seq(1960, 2100, 2), "-01-01")),
               labels = date_format("%Y")) +
  theme(legend.position = c(0.4, 0.9),
        legend.title = element_blank(),
        legend.direction = "vertical") +
  scale_y_continuous(breaks = seq(0, 1000, 20),
                labels = dollar_format(suffix = " Mds€", prefix = "",  accuracy = 1)) +
  geom_label(data = . %>% filter(date == as.Date("2023-12-31")),
             aes(x = date, y = value/1000, color = Variable, label = round(value/1000, digits = 1)))
BSI1 |>
  filter(variable %in% c("BSI1.M.FR.N.A.L23FRAB.A.1.U6.2250.Z01.E",
                         "BSI1.M.FR.N.A.L22FRPL.A.1.U6.2251.Z01.E",
                         "BSI1.M.FR.N.A.L21.A.1.U6.2250.Z01.E")) |>

  ggplot() + theme_minimal() + xlab("") + ylab("Livret A , Livret Bleu") +
  geom_line(aes(x = date, y = value / 1000, color = Variable)) +
  scale_x_date(breaks = as.Date(paste0(seq(1960, 2100, 2), "-01-01")),
               labels = date_format("%Y")) +
  theme(legend.position = c(0.4, 0.9),
        legend.title = element_blank(),
        legend.direction = "vertical") +
  scale_y_continuous(breaks = seq(0, 1000, 20),
                labels = dollar_format(suffix = " Mds€", prefix = "",  accuracy = 1)) +
  geom_label(data = . %>% filter(date == as.Date("2023-12-31")),
             aes(x = date, y = value/1000, color = Variable, label = round(value/1000, digits = 1)))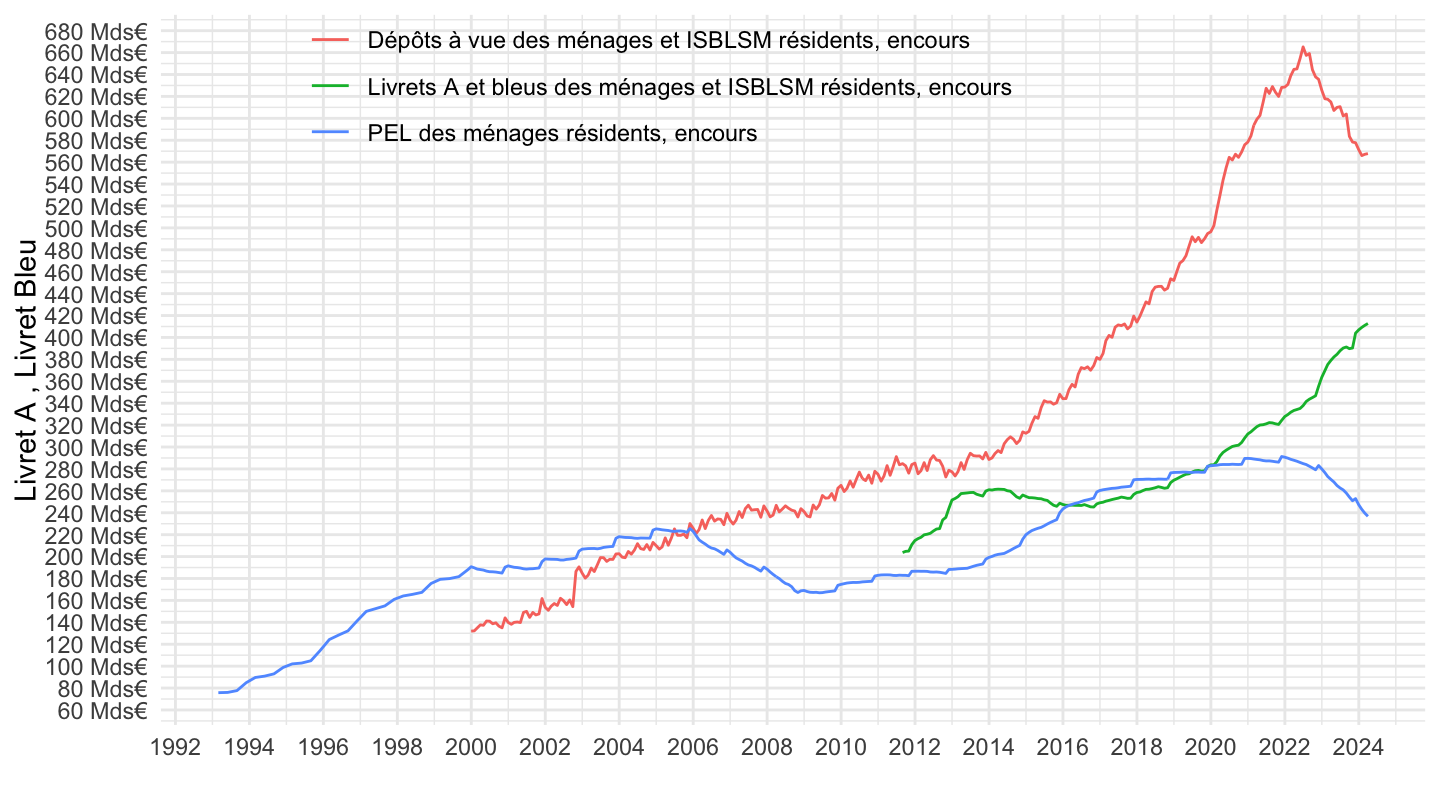
BSI1 |>
  filter(variable %in% c("BSI1.M.FR.N.A.L23FRAB.A.1.U6.2250.Z01.E",
                         "BSI1.M.FR.N.A.L22FRPL.A.1.U6.2251.Z01.E")) |>

  ggplot() + theme_minimal() + xlab("") + ylab("Livret A , Livret Bleu") +
  geom_line(aes(x = date, y = value / 1000, color = Variable)) +
  scale_x_date(breaks = as.Date(paste0(seq(1960, 2100, 2), "-01-01")),
               labels = date_format("%Y")) +
  theme(legend.position = c(0.4, 0.9),
        legend.title = element_blank(),
        legend.direction = "vertical") +
  scale_y_continuous(breaks = seq(0, 1000, 20),
                labels = dollar_format(suffix = " Mds€", prefix = "",  accuracy = 1)) +
  geom_label(data = . %>% filter(date == as.Date("2023-12-31")),
             aes(x = date, y = value/1000, color = Variable, label = round(value/1000, digits = 1)))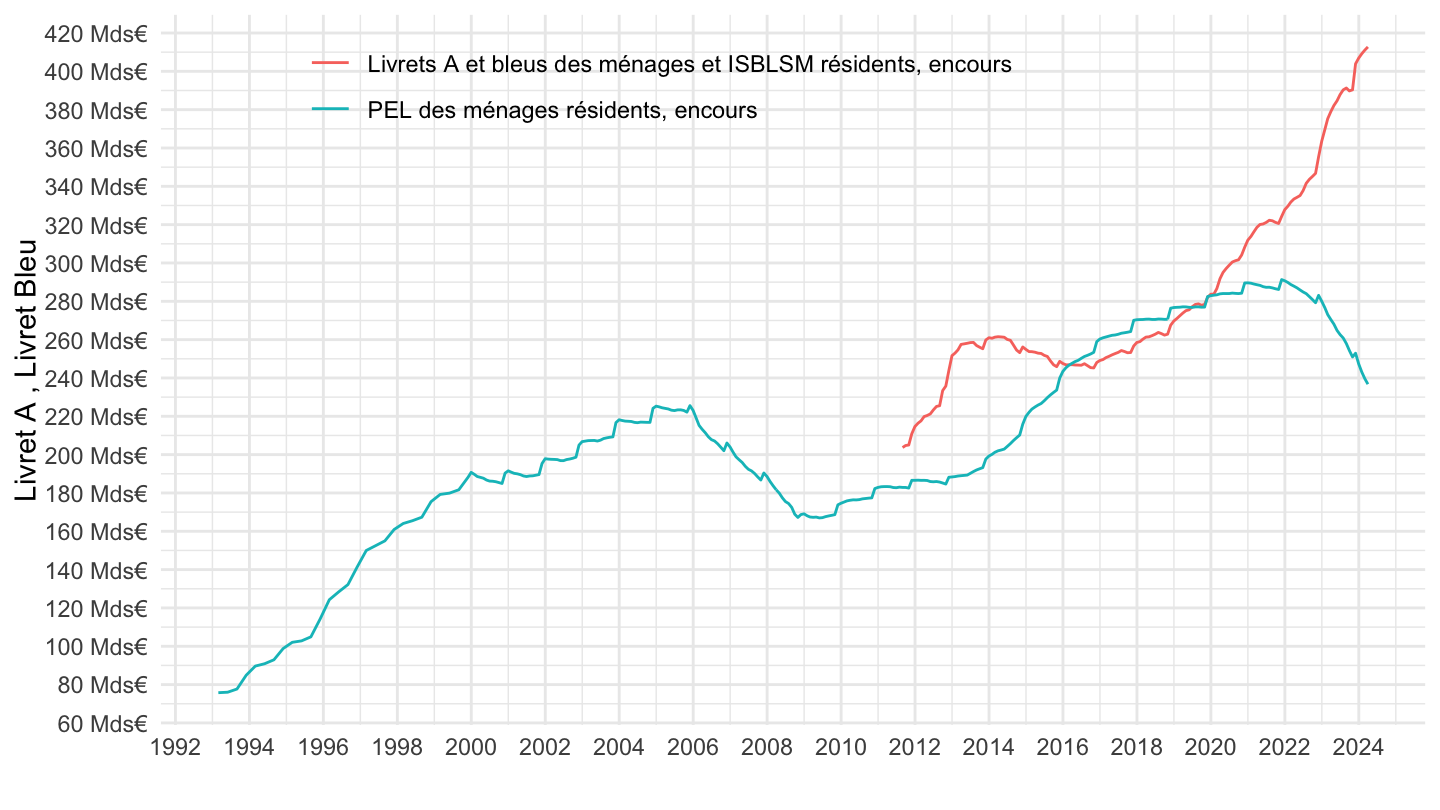
BSI1 |>
  filter(variable %in% c("BSI1.M.FR.N.A.L23FRAB.A.1.U6.2250.Z01.E",
                         "BSI1.M.FR.N.A.L22FRPL.A.1.U6.2251.Z01.E")) |>

  filter(date >= as.Date("2011-12-31")) |>
  ggplot() + theme_minimal() + xlab("") + ylab("Livret A , Livret Bleu") +
  geom_line(aes(x = date, y = value / 1000, color = Variable)) +
  scale_x_date(breaks = as.Date(paste0(seq(1960, 2100, 1), "-01-01")),
               labels = date_format("%Y")) +
  theme(legend.position = c(0.4, 0.9),
        legend.title = element_blank(),
        legend.direction = "vertical") +
  scale_y_continuous(breaks = seq(0, 1000, 20),
                labels = dollar_format(suffix = " Mds€", prefix = "",  accuracy = 1)) +
  geom_label(data = . %>% filter(date == as.Date("2023-12-31")),
             aes(x = date, y = value/1000, color = Variable, label = round(value/1000, digits = 1)))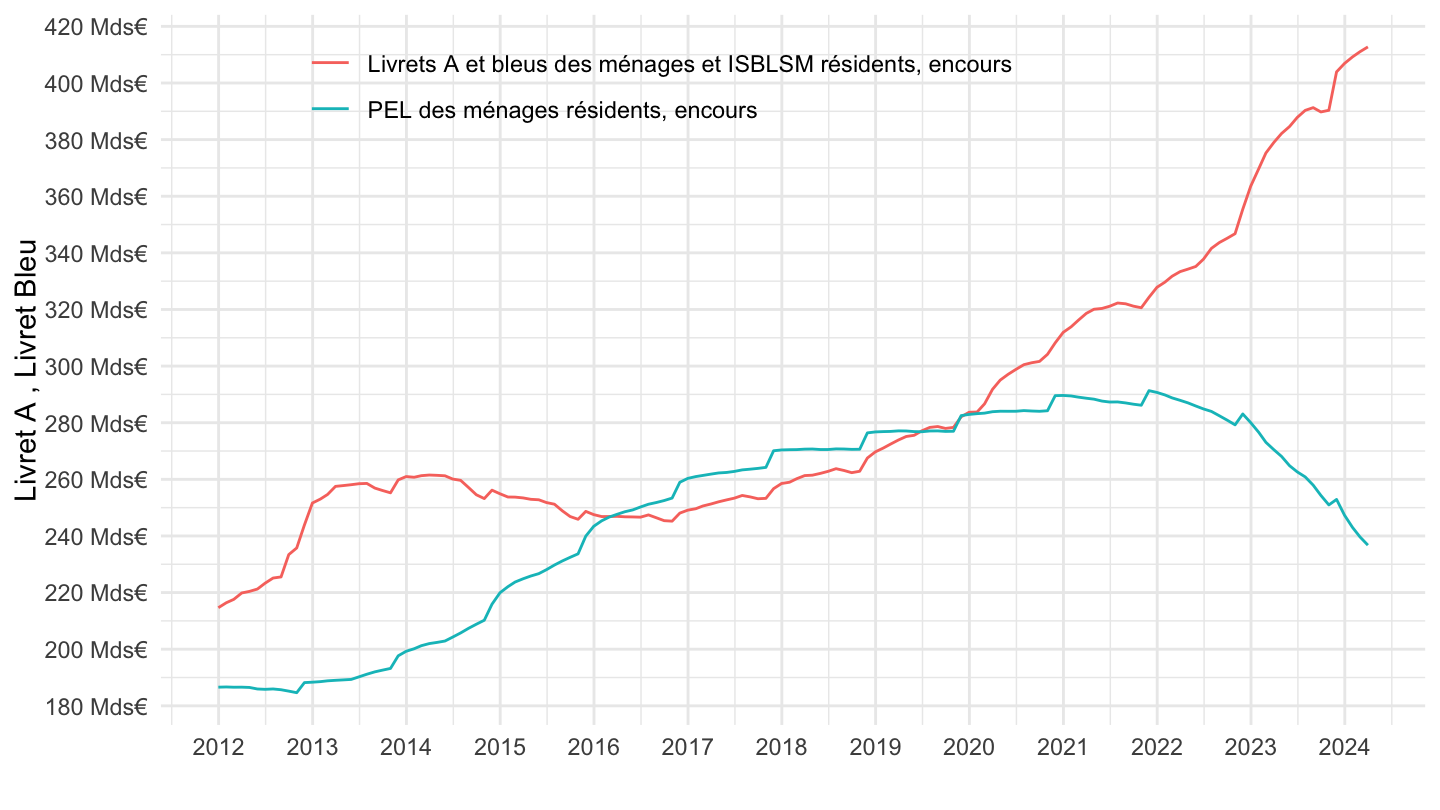
BSI1 |>
  filter(variable %in% c("BSI1.M.FR.N.A.L23FRAB.A.1.U6.2250.Z01.E",
                         "BSI1.M.FR.N.A.L22FRPL.A.1.U6.2251.Z01.E",
                         "BSI1.M.FR.N.A.L23FRLD.A.1.U6.2251.Z01.E",
                         "BSI1.M.FR.N.A.L23FRLO.A.1.U6.2250.Z01.E",
                         "BSI1.M.FR.N.A.L22FRCT.A.1.U6.2250.Z01.E")) |>

  arrange(date) |>
  ggplot() + theme_minimal() + xlab("") + ylab("Livret A , Livret Bleu, LDDS") +
  geom_line(aes(x = date, y = value / 1000, color = Variable)) +
  scale_x_date(breaks = as.Date(paste0(seq(1960, 2100, 2), "-01-01")),
               labels = date_format("%Y")) +
  theme(legend.position = c(0.4, 0.8),
        legend.title = element_blank(),
        legend.direction = "vertical") +
  scale_y_continuous(breaks = seq(0, 1000, 20),
                labels = dollar_format(suffix = " Mds€", prefix = "",  accuracy = 1)) +
  geom_label(data = . %>% filter(date == as.Date("2023-12-31")),
             aes(x = date, y = value/1000, color = Variable, label = round(value/1000, digits = 1)))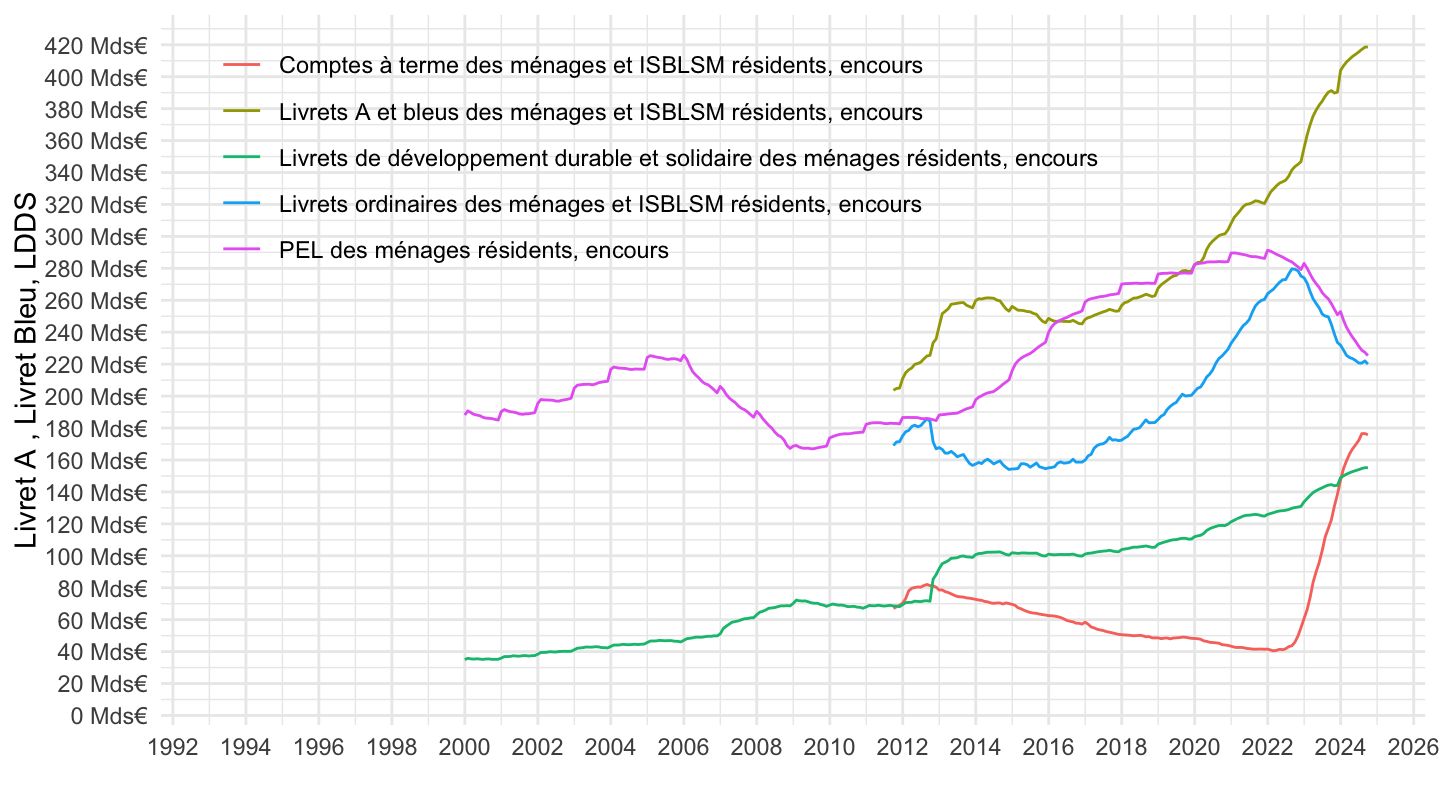
BSI1 |>
  filter(variable %in% c("BSI1.M.FR.N.A.L23FRAB.A.1.U6.2250.Z01.E",
                         "BSI1.M.FR.N.A.L22FRPL.A.1.U6.2251.Z01.E",
                         "BSI1.M.FR.N.A.L23FRLD.A.1.U6.2251.Z01.E",
                         "BSI1.M.FR.N.A.L23FRLO.A.1.U6.2250.Z01.E",
                         "BSI1.M.FR.N.A.L22FRCT.A.1.U6.2250.Z01.E")) |>

  filter(date >= as.Date("2011-12-31")) |>
  ggplot() + theme_minimal() + xlab("") + ylab("Livret A , Livret Bleu, LDDS") +
  geom_line(aes(x = date, y = value / 1000, color = Variable)) +
  scale_x_date(breaks = as.Date(paste0(seq(1960, 2100, 1), "-01-01")),
               labels = date_format("%Y")) +
  theme(legend.position = c(0.4, 0.8),
        legend.title = element_blank(),
        legend.direction = "vertical") +
  scale_y_continuous(breaks = seq(0, 1000, 20),
                labels = dollar_format(suffix = " Mds€", prefix = "",  accuracy = 1)) +
  geom_label(data = . %>% filter(date == as.Date("2023-12-31")),
             aes(x = date, y = value/1000, color = Variable, label = round(value/1000, digits = 1)))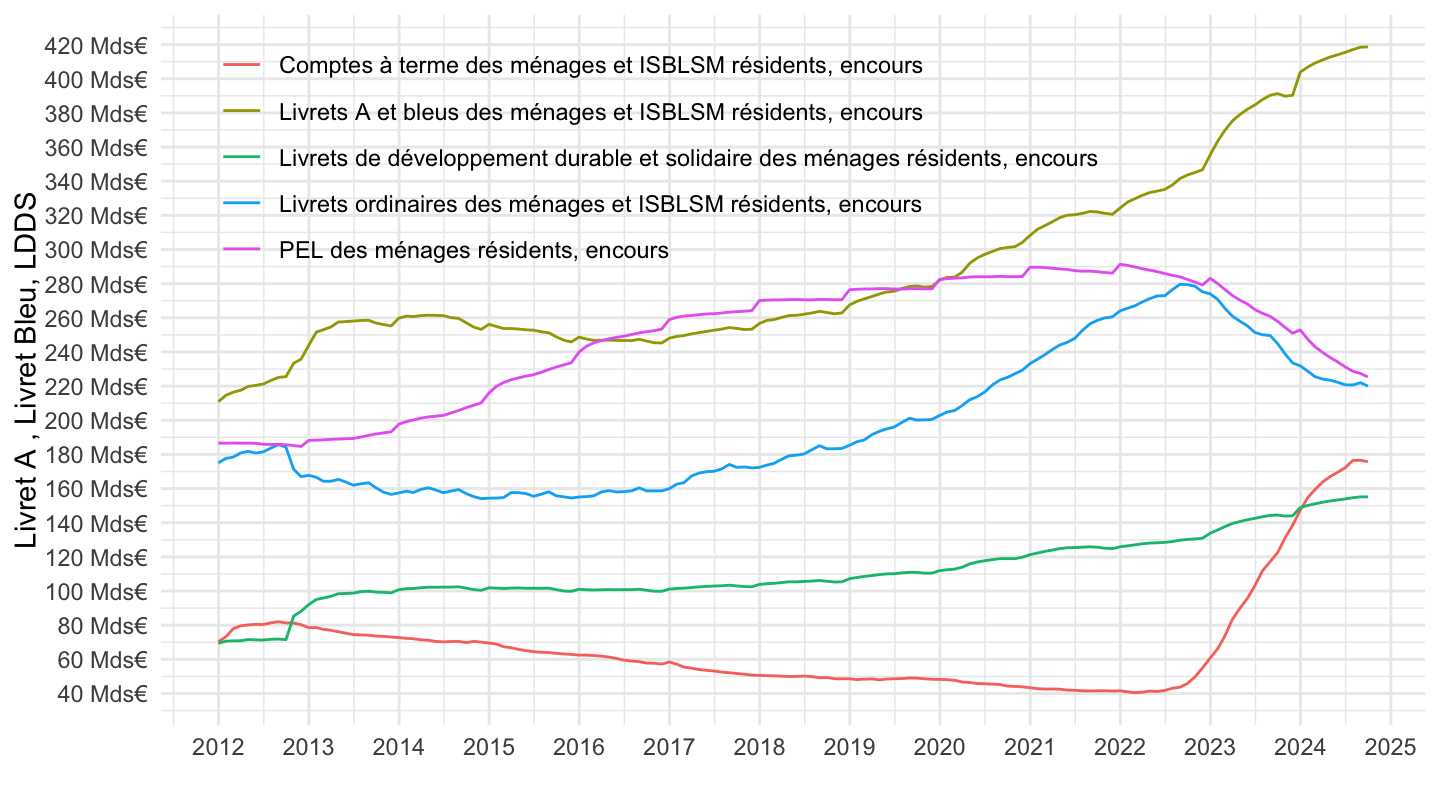
BSI1 |>
  filter(variable %in% c("BSI1.M.FR.N.A.L20.A.1.U6.2250.Z01.E",
                         "BSI1.M.FR.N.A.L21.A.1.U6.2250.Z01.E",
                         "BSI1.M.FR.N.A.L22.A.1.U6.2250.Z01.E",
                         "BSI1.M.FR.N.A.L23.A.1.U6.2250.Z01.E")) |>

  arrange(date) |>
  filter(date >=as.Date("2012-01-01")) |>
  ggplot() + theme_minimal() + xlab("") + ylab("Livret A , Livret Bleu, LDDS") +
  geom_line(aes(x = date, y = value / 1000, color = Variable)) +
  scale_x_date(breaks = as.Date(paste0(seq(1960, 2100, 2), "-01-01")),
               labels = date_format("%Y")) +
  theme(legend.position = c(0.4, 0.9),
        legend.title = element_blank(),
        legend.direction = "vertical") +
  scale_y_continuous(breaks = seq(0, 10000, 100),
                labels = dollar_format(suffix = " Mds€", prefix = "",  accuracy = 1)) +
  geom_label(data = . %>% filter(date == as.Date("2023-12-31")),
             aes(x = date, y = value/1000, color = Variable, label = round(value/1000, digits = 1)))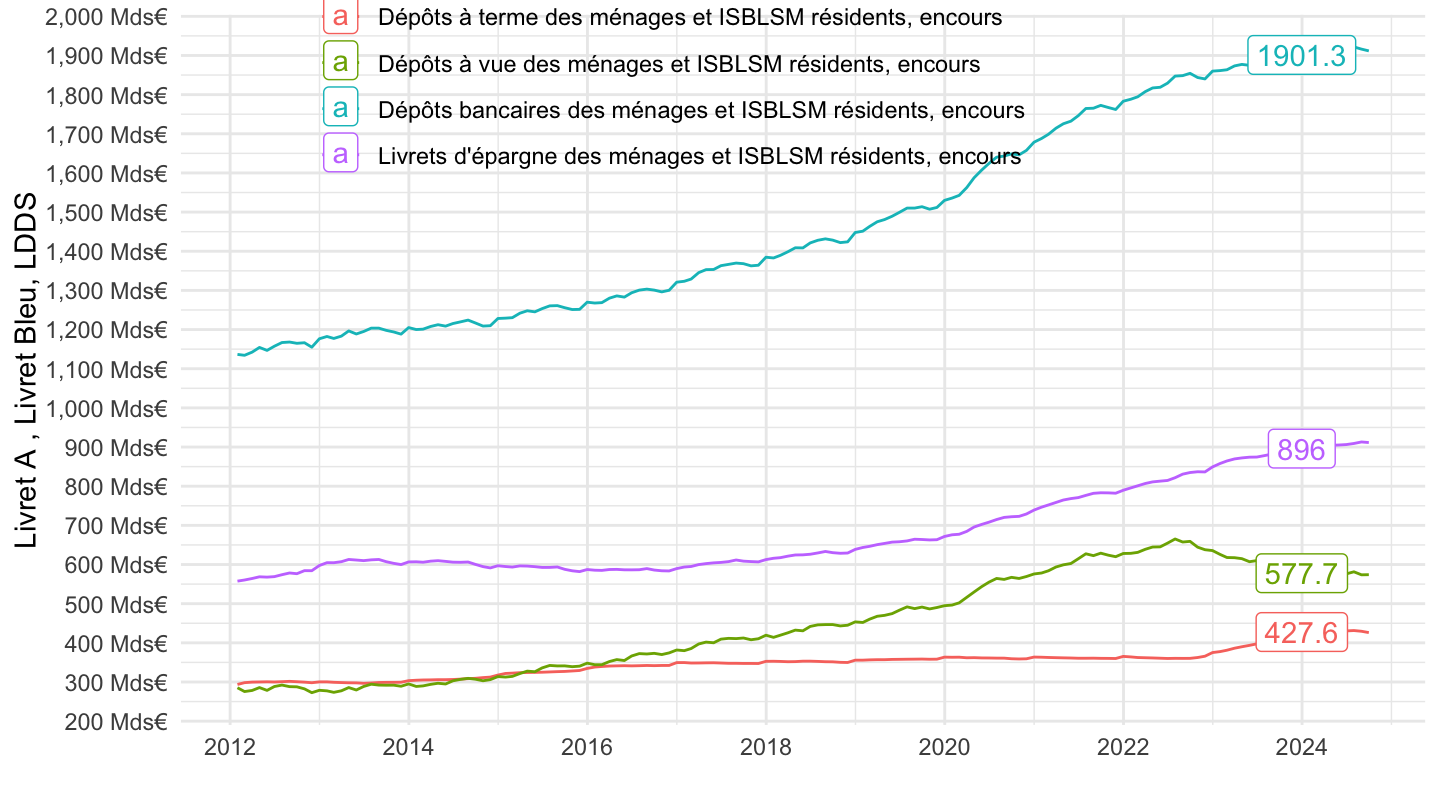
BSI1 |>
  filter(variable %in% c("BSI1.M.FR.N.A.L23FRAB.A.1.U6.2250.Z01.E",
                         "BSI1.M.FR.N.A.L22FRPL.A.1.U6.2251.Z01.E",
                         "BSI1.M.FR.N.A.L23FRLD.A.1.U6.2251.Z01.E",
                         "BSI1.M.FR.N.A.L23FRLO.A.1.U6.2250.Z01.E")) |>

  arrange(date) |>
  ggplot() + theme_minimal() + xlab("") + ylab("Livret A , Livret Bleu, LDDS") +
  geom_line(aes(x = date, y = value / 1000, color = Variable)) +
  scale_x_date(breaks = as.Date(paste0(seq(1960, 2100, 2), "-01-01")),
               labels = date_format("%Y")) +
  theme(legend.position = c(0.4, 0.9),
        legend.title = element_blank(),
        legend.direction = "vertical") +
  scale_y_continuous(breaks = seq(0, 1000, 20),
                labels = dollar_format(suffix = " Mds€", prefix = "",  accuracy = 1)) +
  geom_label(data = . %>% filter(date == as.Date("2023-12-31")),
             aes(x = date, y = value/1000, color = Variable, label = round(value/1000, digits = 1)))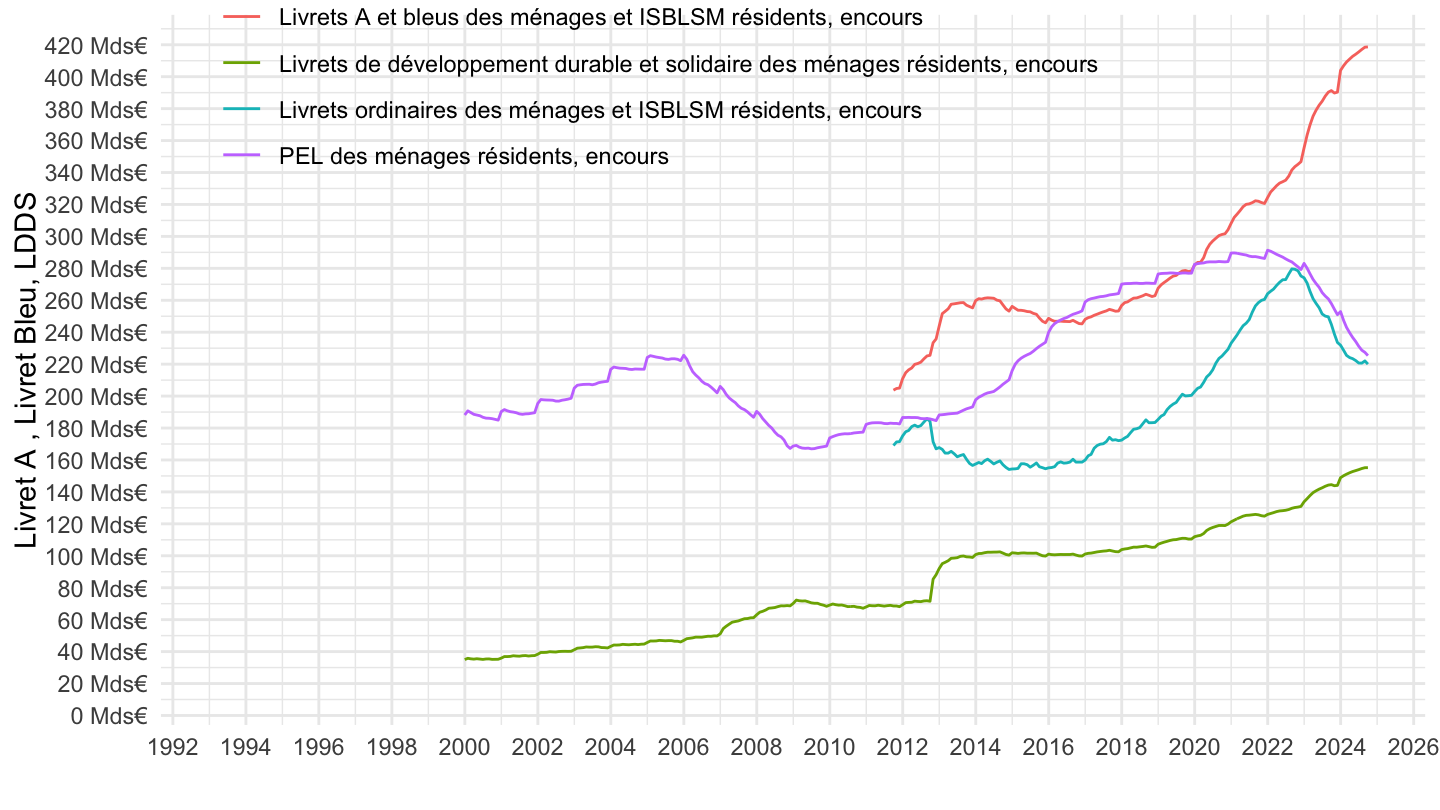
BSI1 |>
  filter(variable %in% c("BSI1.M.FR.N.A.L23FRAB.A.1.U6.2250.Z01.E",
                         "BSI1.M.FR.N.A.L22FRPL.A.1.U6.2251.Z01.E",
                         "BSI1.M.FR.N.A.L23FRLD.A.1.U6.2251.Z01.E",
                         "BSI1.M.FR.N.A.L23FRLO.A.1.U6.2250.Z01.E")) |>

  filter(date >= as.Date("1999-12-31")) |>
  ggplot() + theme_minimal() + xlab("") + ylab("Livret A , Livret Bleu, LDDS") +
  geom_line(aes(x = date, y = value / 1000, color = Variable)) +
  scale_x_date(breaks = as.Date(paste0(seq(1960, 2100, 5), "-01-01")),
               labels = date_format("%Y")) +
  theme(legend.position = c(0.4, 0.9),
        legend.title = element_blank(),
        legend.direction = "vertical") +
  scale_y_continuous(breaks = seq(0, 1000, 20),
                labels = dollar_format(suffix = " Mds€", prefix = "",  accuracy = 1)) +
  geom_label(data = . %>% filter(date == as.Date("2023-12-31")),
             aes(x = date, y = value/1000, color = Variable, label = round(value/1000, digits = 1)))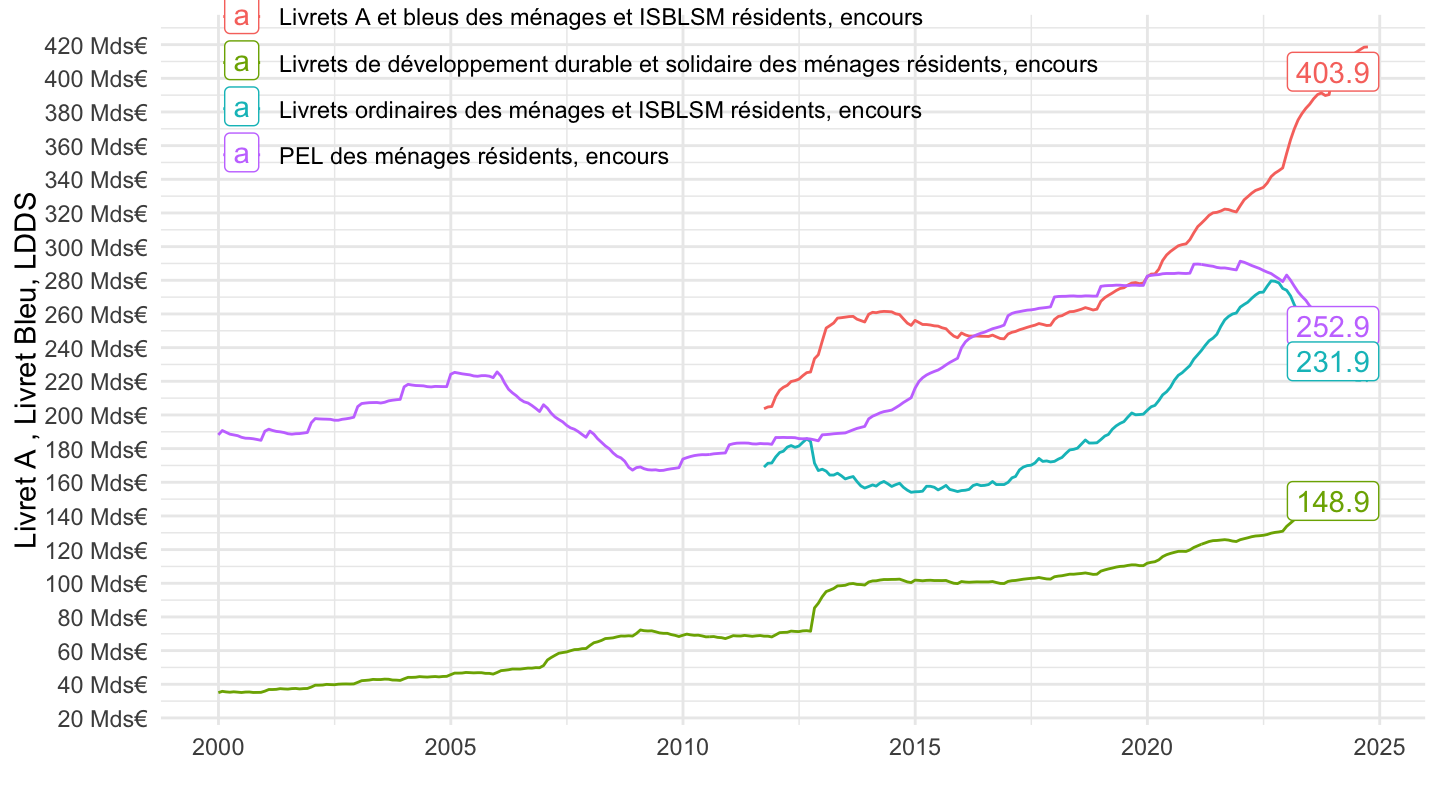
BSI1 |>
  filter(variable %in% c("BSI1.M.FR.N.A.L23FRAB.A.1.U6.2250.Z01.E",
                         "BSI1.M.FR.N.A.L22FRPL.A.1.U6.2251.Z01.E",
                         "BSI1.M.FR.N.A.L23FRLD.A.1.U6.2251.Z01.E",
                         "BSI1.M.FR.N.A.L23FRLO.A.1.U6.2250.Z01.E")) |>

  filter(date >= as.Date("2011-12-31")) |>
  ggplot() + theme_minimal() + xlab("") + ylab("Livret A , Livret Bleu, LDDS") +
  geom_line(aes(x = date, y = value / 1000, color = Variable)) +
  scale_x_date(breaks = as.Date(paste0(seq(1960, 2100, 1), "-01-01")),
               labels = date_format("%Y")) +
  theme(legend.position = c(0.4, 0.9),
        legend.title = element_blank(),
        legend.direction = "vertical") +
  scale_y_continuous(breaks = seq(0, 1000, 20),
                labels = dollar_format(suffix = " Mds€", prefix = "",  accuracy = 1)) +
  geom_label(data = . %>% filter(date == as.Date("2023-12-31")),
             aes(x = date, y = value/1000, color = Variable, label = round(value/1000, digits = 1)))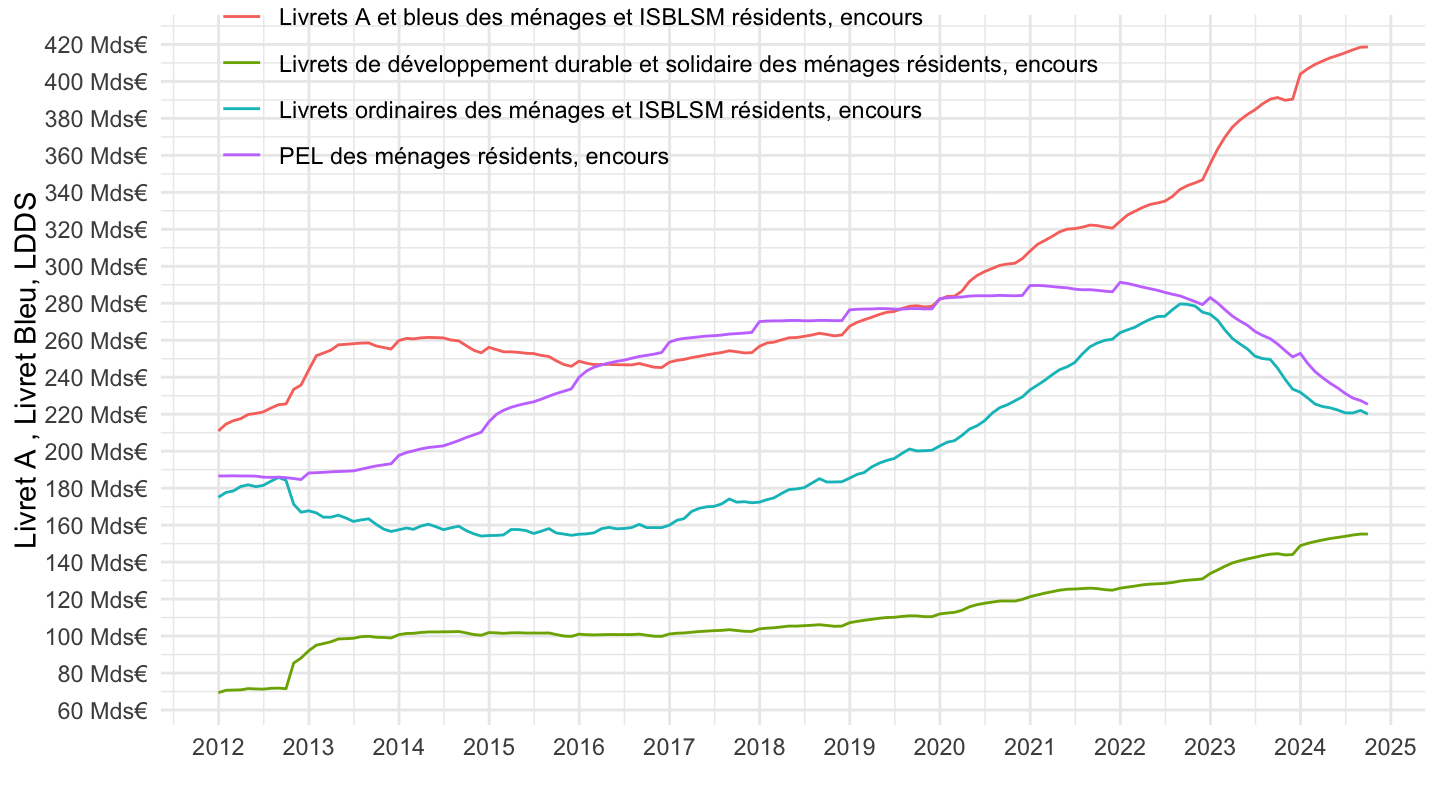
BSI1 |>
  filter(variable %in% c("BSI1.M.FR.N.A.L23FRAB.A.1.U6.2250.Z01.E",
                         "BSI1.M.FR.N.A.L22FRPL.A.1.U6.2251.Z01.E",
                         "BSI1.M.FR.N.A.L23FRLD.A.1.U6.2251.Z01.E")) |>

  arrange(date) |>
  ggplot() + theme_minimal() + xlab("") + ylab("Livret A , Livret Bleu, LDDS") +
  geom_line(aes(x = date, y = value / 1000, color = Variable)) +
  scale_x_date(breaks = as.Date(paste0(seq(1960, 2100, 2), "-01-01")),
               labels = date_format("%Y")) +
  theme(legend.position = c(0.4, 0.9),
        legend.title = element_blank(),
        legend.direction = "vertical") +
  scale_y_continuous(breaks = seq(0, 1000, 20),
                labels = dollar_format(suffix = " Mds€", prefix = "",  accuracy = 1)) +
  geom_label(data = . %>% filter(date == as.Date("2023-12-31")),
             aes(x = date, y = value/1000, color = Variable, label = round(value/1000, digits = 1)))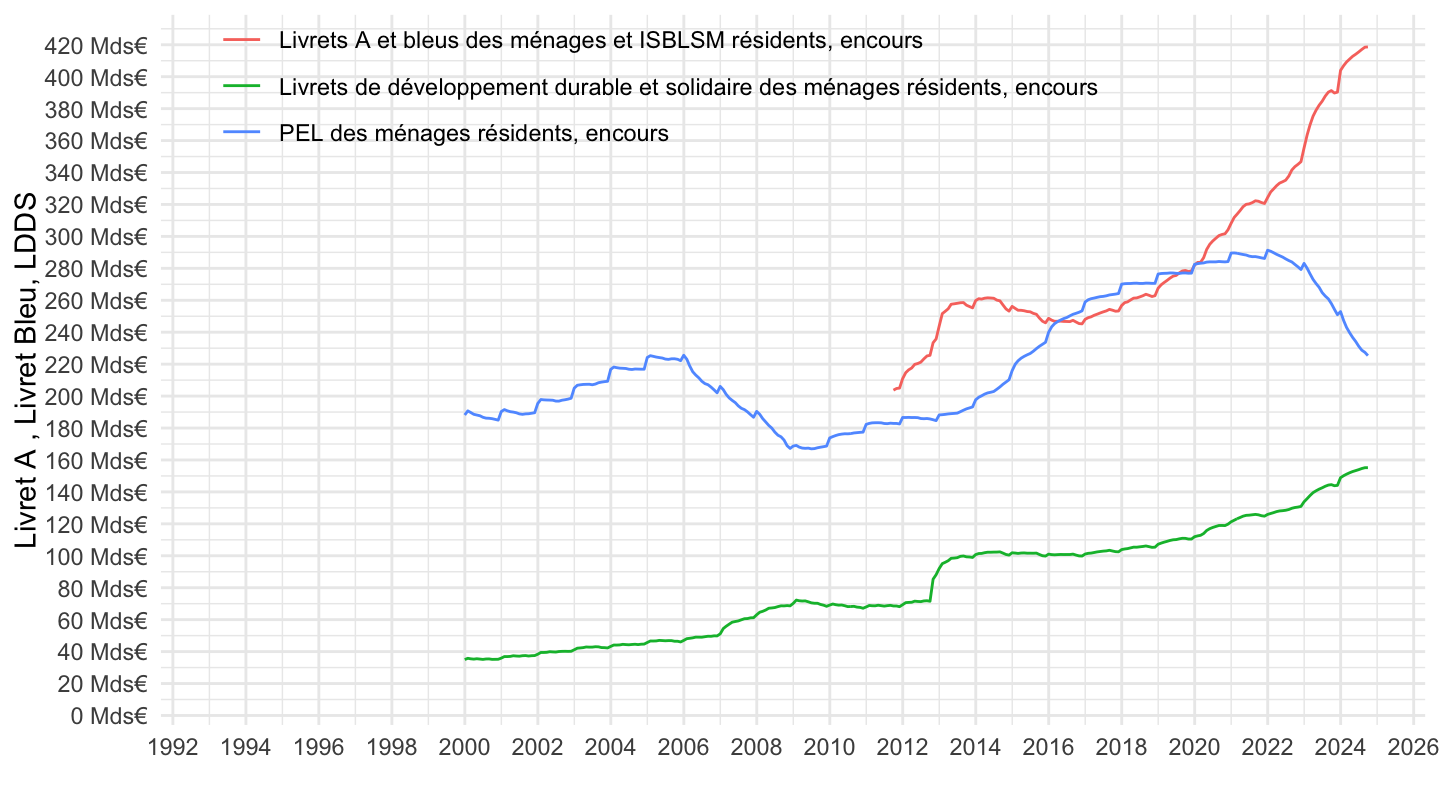
BSI1 |>
  filter(variable %in% c("BSI1.M.FR.N.A.L23FRAB.A.1.U6.2250.Z01.E",
                         "BSI1.M.FR.N.A.L22FRPL.A.1.U6.2251.Z01.E",
                         "BSI1.M.FR.N.A.L23FRLD.A.1.U6.2251.Z01.E")) |>

  filter(date >= as.Date("1999-12-31")) |>
  ggplot() + theme_minimal() + xlab("") + ylab("Livret A , Livret Bleu, LDDS") +
  geom_line(aes(x = date, y = value / 1000, color = Variable)) +
  scale_x_date(breaks = as.Date(paste0(seq(1960, 2100, 5), "-01-01")),
               labels = date_format("%Y")) +
  theme(legend.position = c(0.4, 0.9),
        legend.title = element_blank(),
        legend.direction = "vertical") +
  scale_y_continuous(breaks = seq(0, 1000, 20),
                labels = dollar_format(suffix = " Mds€", prefix = "",  accuracy = 1)) +
  geom_label(data = . %>% filter(date == as.Date("2023-12-31")),
             aes(x = date, y = value/1000, color = Variable, label = round(value/1000, digits = 1)))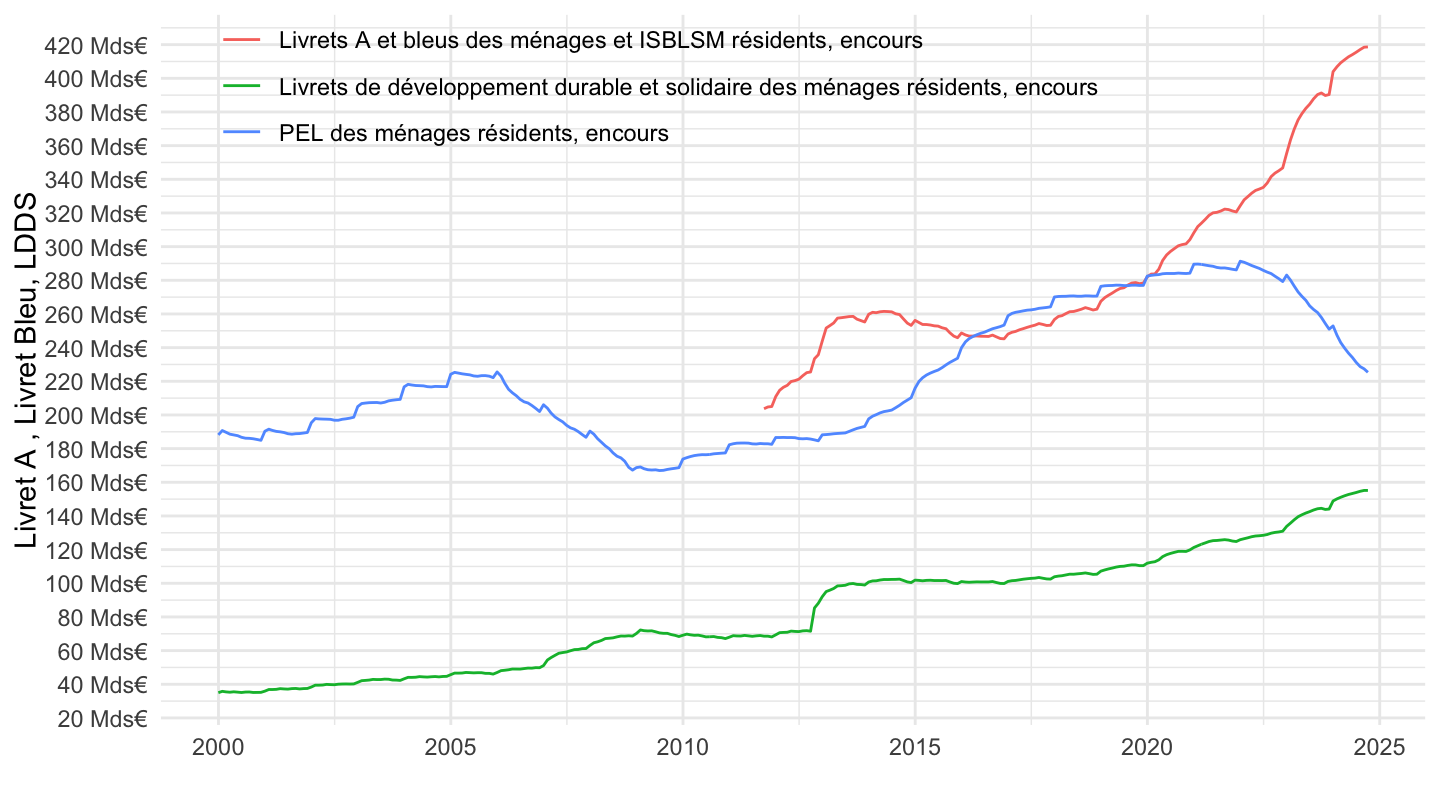
BSI1 |>
  filter(variable %in% c("BSI1.M.FR.N.A.L23FRAB.A.1.U6.2250.Z01.E",
                         "BSI1.M.FR.N.A.L22FRPL.A.1.U6.2251.Z01.E",
                         "BSI1.M.FR.N.A.L23FRLD.A.1.U6.2251.Z01.E")) |>

  filter(date >= as.Date("2011-12-31")) |>
  ggplot() + theme_minimal() + xlab("") + ylab("Livret A , Livret Bleu, LDDS") +
  geom_line(aes(x = date, y = value / 1000, color = Variable)) +
  scale_x_date(breaks = as.Date(paste0(seq(1960, 2100, 1), "-01-01")),
               labels = date_format("%Y")) +
  theme(legend.position = c(0.4, 0.9),
        legend.title = element_blank(),
        legend.direction = "vertical") +
  scale_y_continuous(breaks = seq(0, 1000, 20),
                labels = dollar_format(suffix = " Mds€", prefix = "",  accuracy = 1)) +
  geom_label(data = . %>% filter(date == as.Date("2023-12-31")),
             aes(x = date, y = value/1000, color = Variable, label = round(value/1000, digits = 1)))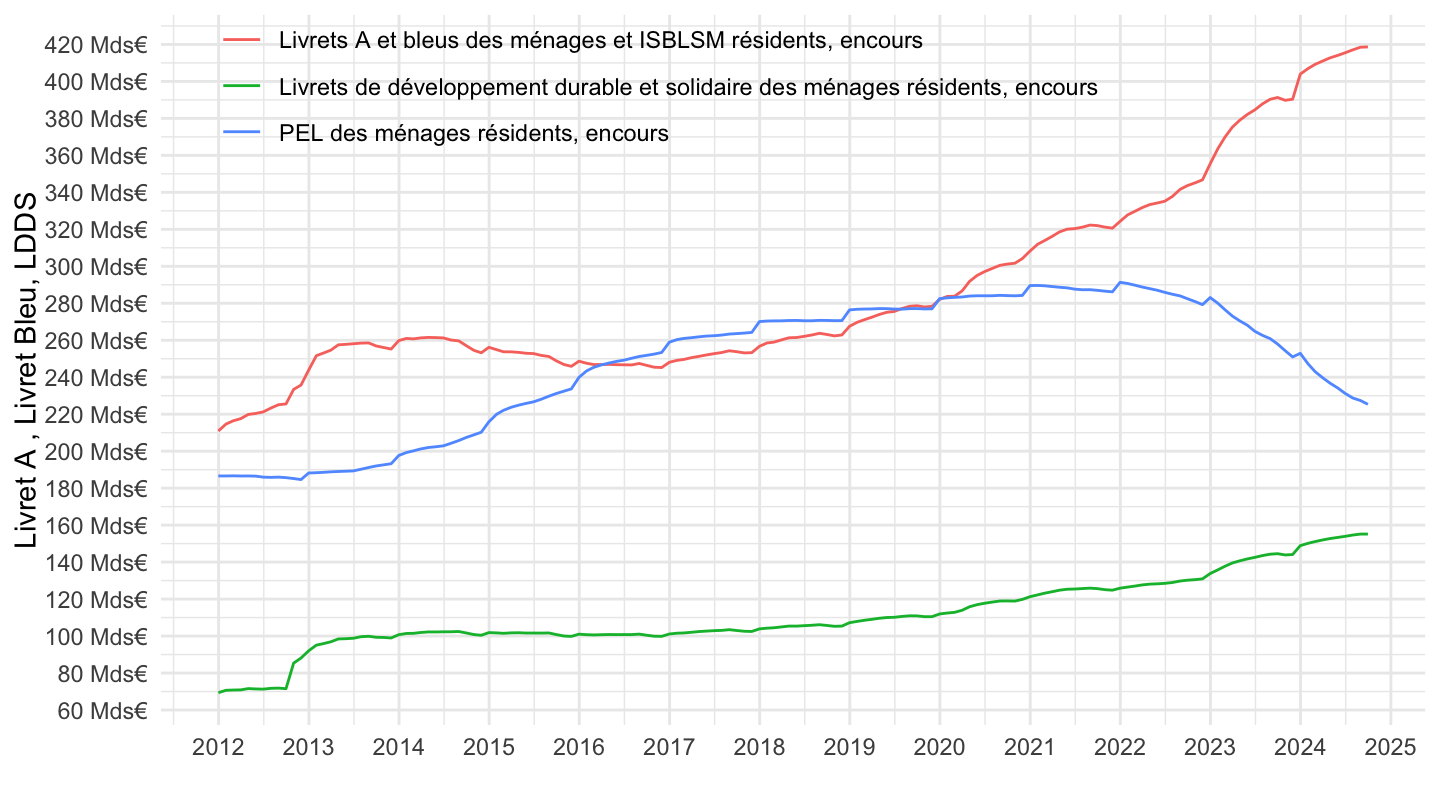
BSI1 |>

  filter(BS_ITEM %in% c("L22FRPL")) |>
  ggplot() + theme_minimal() + xlab("") + ylab("Livret A , Livret Bleu") +
  geom_line(aes(x = date, y = value / 1000, color = Variable)) +
  scale_x_date(breaks = as.Date(paste0(seq(1960, 2100, 2), "-01-01")),
               labels = date_format("%Y")) +
  theme(legend.position = c(0.5, 0.6),
        legend.title = element_blank(),
        legend.direction = "vertical") +
  scale_y_continuous(breaks = seq(0, 1000, 20),
                labels = dollar_format(suffix = " Mds€", prefix = "",  accuracy = 1)) +
  geom_label(data = . %>% filter(date == as.Date("2023-12-31")),
             aes(x = date, y = value/1000, color = Variable, label = round(value/1000, digits = 1)))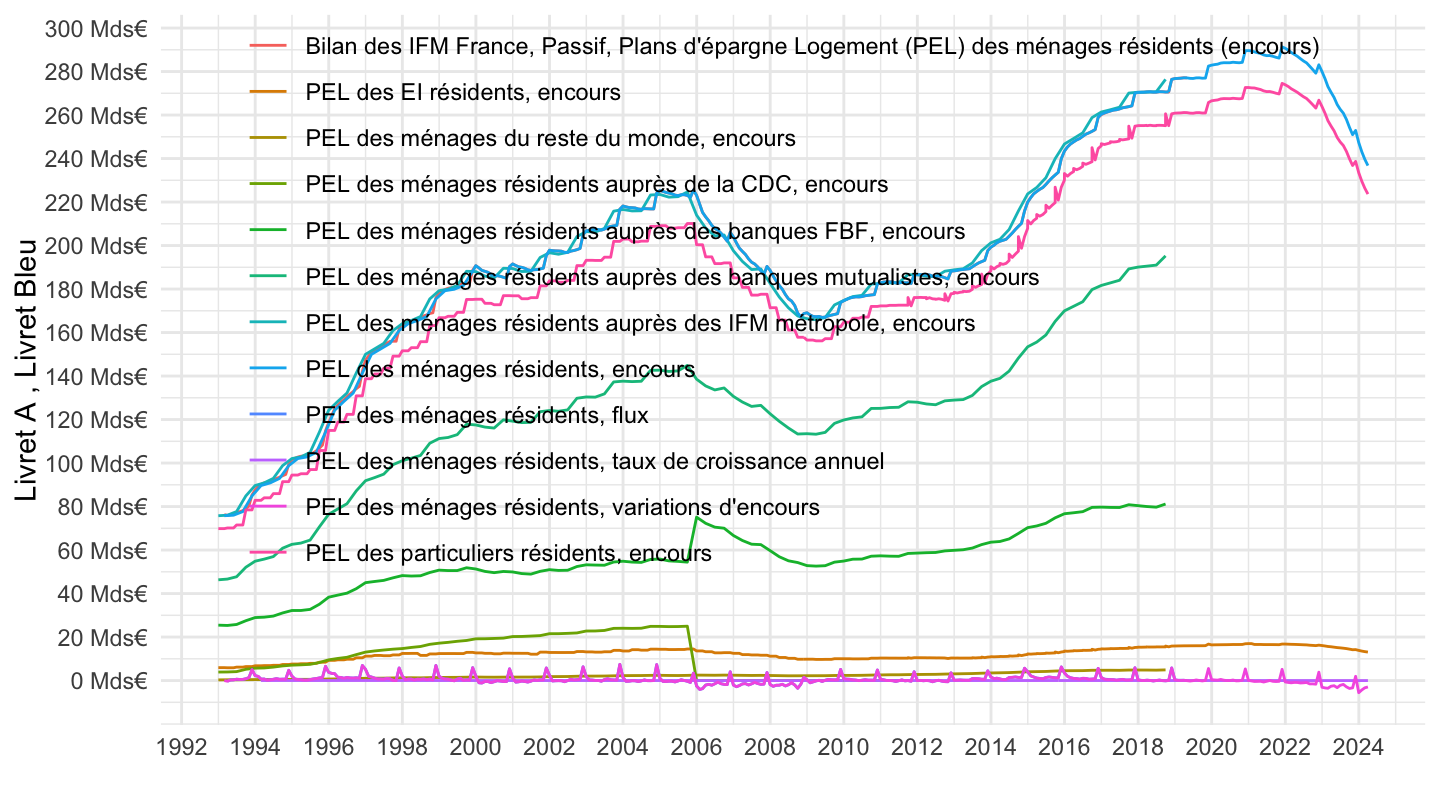
BSI1 |>

  filter(BS_ITEM %in% c("L21"),
         variable == "BSI1.M.FR.N.A.L21.A.1.U6.2300.Z01.E") |>
  ggplot() + theme_minimal() + xlab("") + ylab("Dépôts à vue") +
  geom_line(aes(x = date, y = value / 1000, color = Variable)) +
  scale_x_date(breaks = as.Date(paste0(seq(1960, 2100, 2), "-01-01")),
               labels = date_format("%Y")) +
  theme(legend.position = c(0.5, 0.6),
        legend.title = element_blank(),
        legend.direction = "vertical") +
  scale_y_log10(breaks = seq(100, 3000, 100),
                labels = dollar_format(suffix = " Mds€", prefix = "",  accuracy = 1))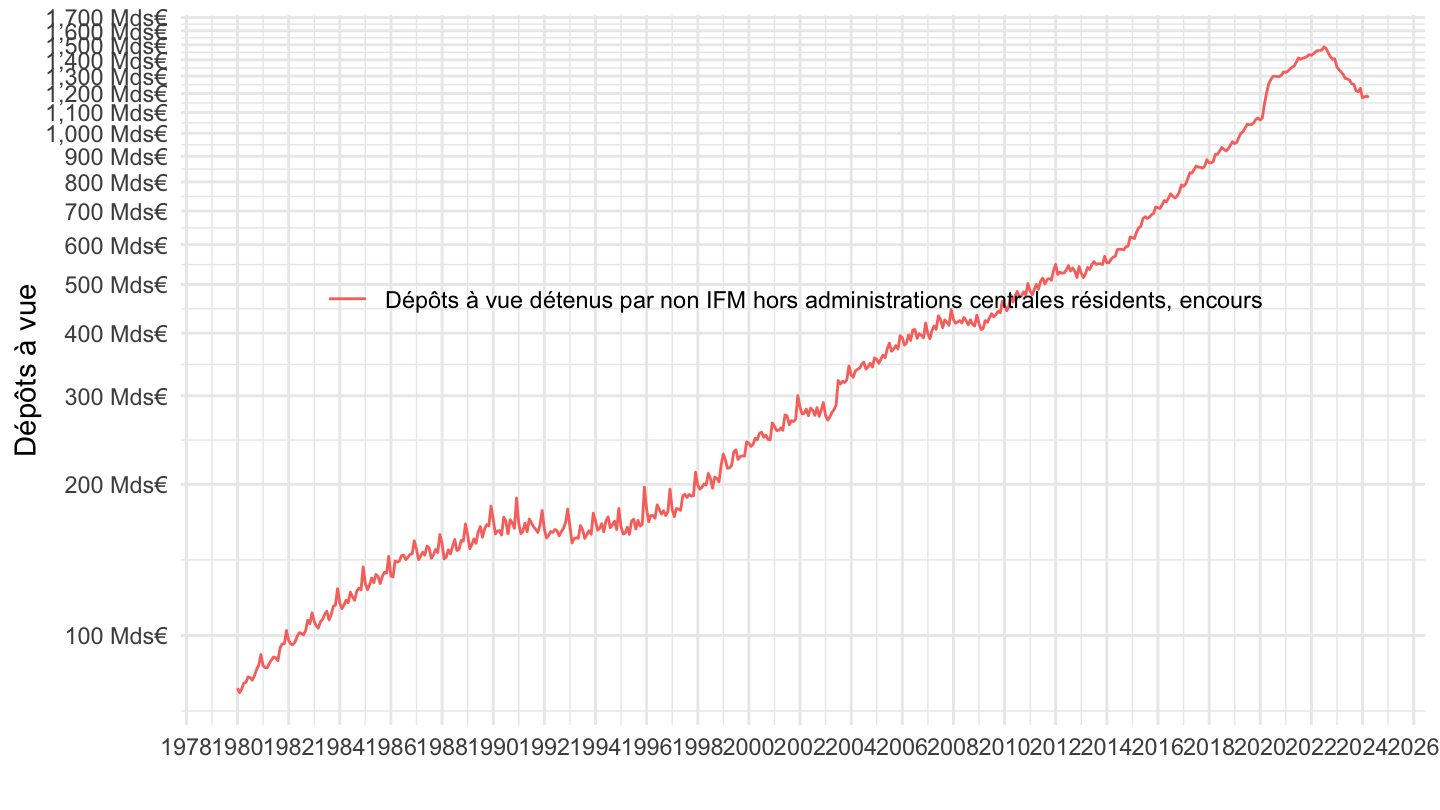
BSI1 |>

  filter(BS_ITEM %in% c("L21"),
         variable == "BSI1.M.FR.N.A.L21.A.1.U6.2250.Z01.E") |>
  ggplot() + theme_minimal() + xlab("") + ylab("Dépôts à vue") +
  geom_line(aes(x = date, y = value / 1000, color = Variable)) +
  scale_x_date(breaks = as.Date(paste0(seq(1960, 2100, 2), "-01-01")),
               labels = date_format("%Y")) +
  theme(legend.position = c(0.5, 0.6),
        legend.title = element_blank(),
        legend.direction = "vertical") +
  scale_y_log10(breaks = seq(100, 3000, 100),
                labels = dollar_format(suffix = " Mds€", prefix = "",  accuracy = 1)) +
  geom_label(data = . %>% filter(date == as.Date("2023-12-31")),
             aes(x = date, y = value/1000, color = Variable, label = round(value/1000, digits = 1)))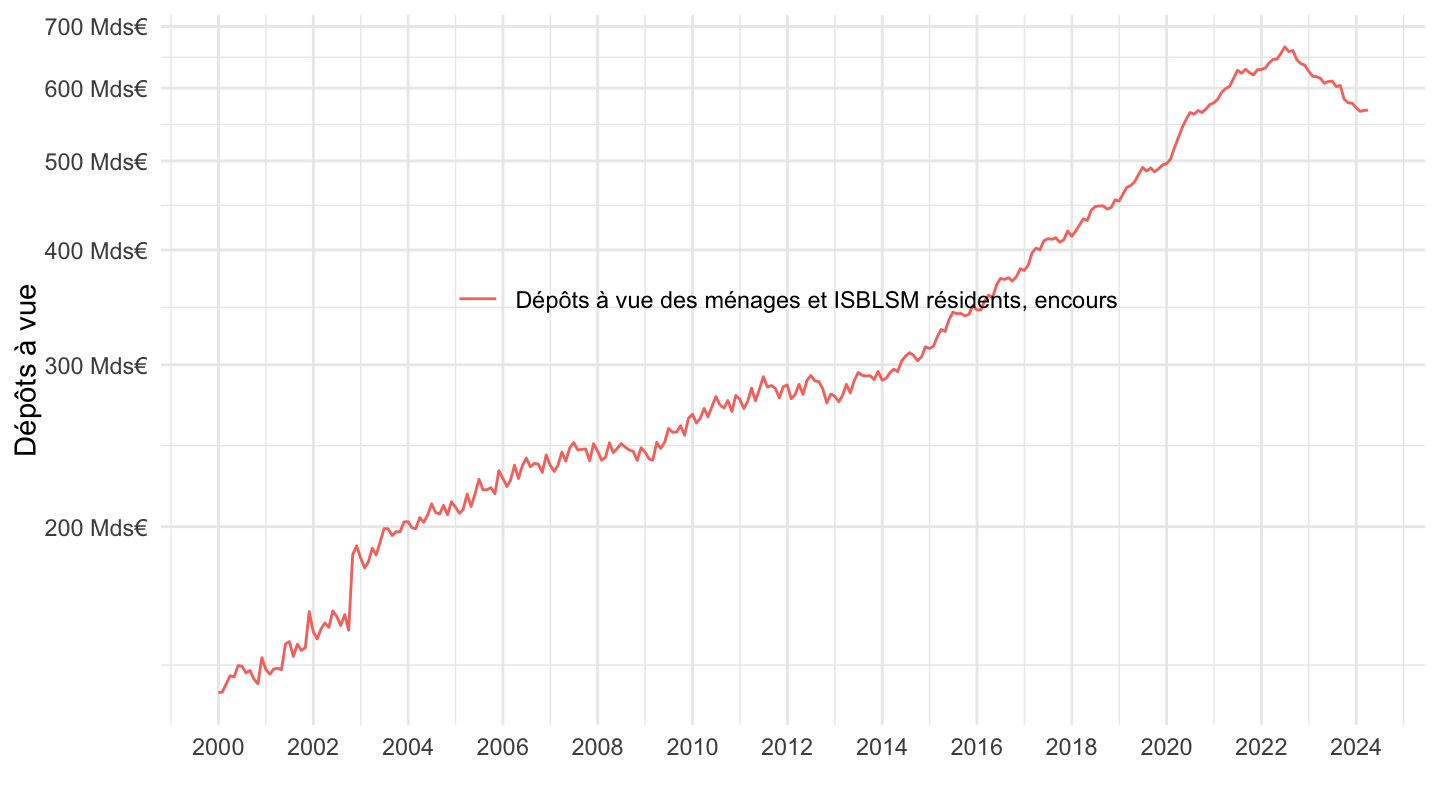
BSI1 |>

  filter(variable %in% c("BSI1.M.FR.N.A.L20.A.1.U6.2250.Z01.E",
                         "BSI1.M.FR.N.A.L20.A.1.U6.2254FR.Z01.E",
                         "BSI1.M.FR.N.A.L21.A.1.U6.2300.Z01.E")) |>
  ggplot() + theme_minimal() + xlab("") + ylab("Dépôts à vue") +
  geom_line(aes(x = date, y = value / 1000, color = Variable)) +
  scale_x_date(breaks = as.Date(paste0(seq(1960, 2100, 5), "-01-01")),
               labels = date_format("%Y")) +
  theme(legend.position = c(0.5, 0.6),
        legend.title = element_blank(),
        legend.direction = "vertical") +
  scale_y_log10(breaks = seq(100, 3000, 100),
                labels = dollar_format(suffix = " Mds€", prefix = "",  accuracy = 1)) +
  geom_label(data = . %>% filter(date == as.Date("2023-12-31")),
             aes(x = date, y = value/1000, color = Variable, label = round(value/1000, digits = 1)))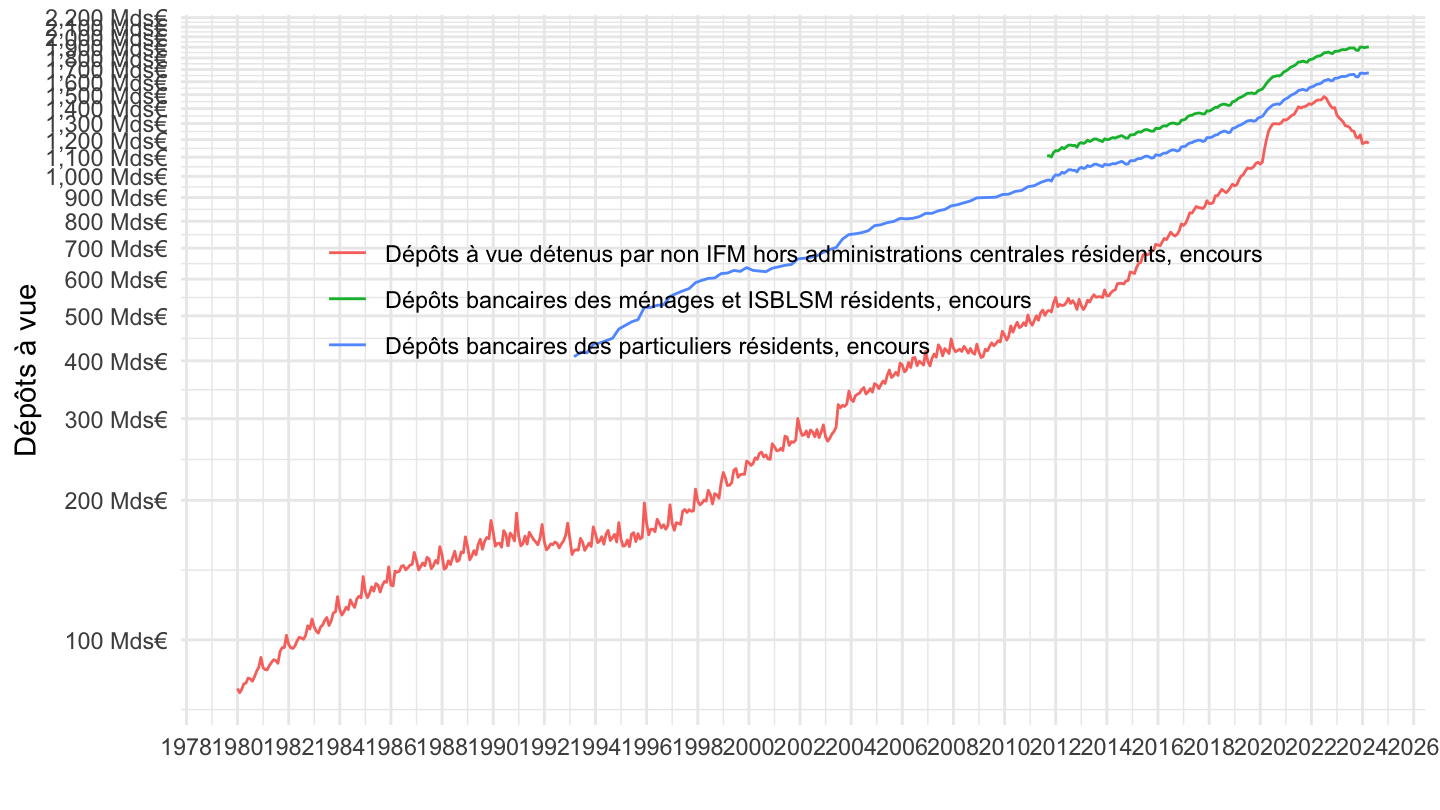
BSI1 |>

  filter(variable %in% c("BSI1.M.FR.N.A.L20.A.1.U6.2250.Z01.E",
                         "BSI1.M.FR.N.A.L20.A.1.U6.2254FR.Z01.E",
                         "BSI1.M.FR.N.A.L21.A.1.U6.2300.Z01.E"),
         date >= as.Date("2011-12-31")) |>
  ggplot() + theme_minimal() + xlab("") + ylab("Dépôts, Dépôts à vue") +
  geom_line(aes(x = date, y = value / 1000, color = Variable)) +
  scale_x_date(breaks = as.Date(paste0(seq(1960, 2100, 2), "-01-01")),
               labels = date_format("%Y")) +
  theme(legend.position = c(0.4, 0.9),
        legend.title = element_blank(),
        legend.direction = "vertical") +
  scale_y_log10(breaks = seq(100, 3000, 100),
                labels = dollar_format(suffix = " Mds€", prefix = "",  accuracy = 1)) +
  geom_label(data = . %>% filter(date == as.Date("2023-12-31")),
             aes(x = date, y = value/1000, color = Variable, label = round(value/1000, digits = 1)))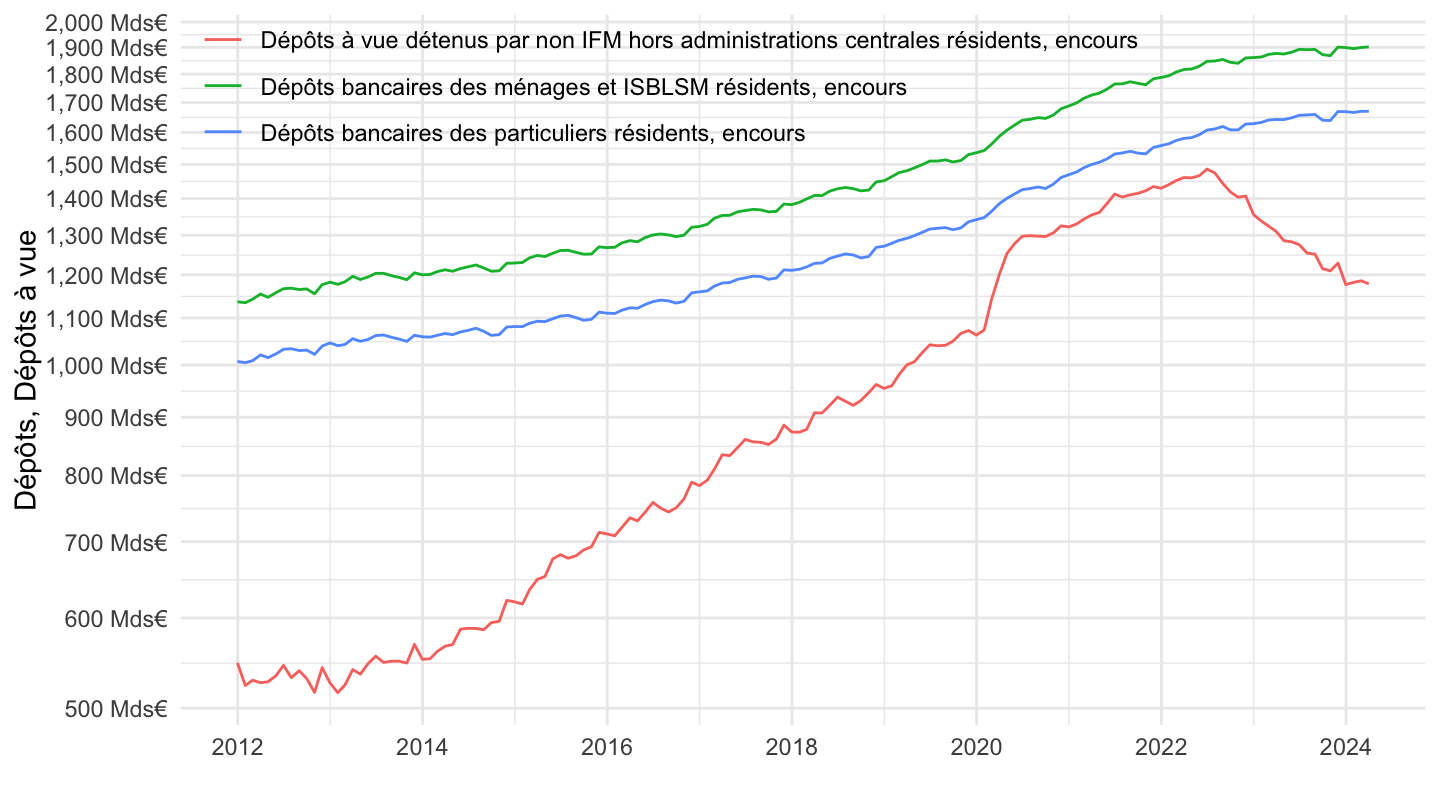
2240: crédits entrerpises
data_ombeline <- BSI1 |>
  group_by(variable) |>
  summarise(max_date = max(date),
            min_date = min(date)) |>
  left_join(BSI1_var, by = "variable") |>
  filter(BS_COUNT_SECTOR == "2240") |>
arrange(desc(max_date))BSI1 |>
filter(grepl("BSI1.M.FR.N.R.A220Z.A.1.U6.2250.Z01.E", variable) |
grepl("BSI1.M.FR.N.R.A220Z.A.1.U6.2254FR.Z01.E", variable) |
grepl("BSI1.M.FR.N.2.A22.A.1.U6.2251.Z01.E", variable)) |>
ggplot() + theme_minimal() + xlab("") + ylab("") +
geom_line(aes(x = date, y = value / 1000, color = Variable)) +
scale_x_date(breaks = as.Date(paste0(seq(1960, 2100, 2), "-01-01")),
labels = date_format("%Y")) +
theme(legend.position = c(0.4, 0.9),
legend.title = element_blank(),
legend.direction = "vertical") +
scale_y_continuous(breaks = seq(-10000, 10000, 100),
labels = dollar_format(suffix = " Mds€", prefix = "", accuracy = 1)) +
geom_label(data = . %>% filter(date == as.Date("2023-12-31")),
aes(x = date, y = value/1000, color = Variable, label = round(value/1000, digits = 1)))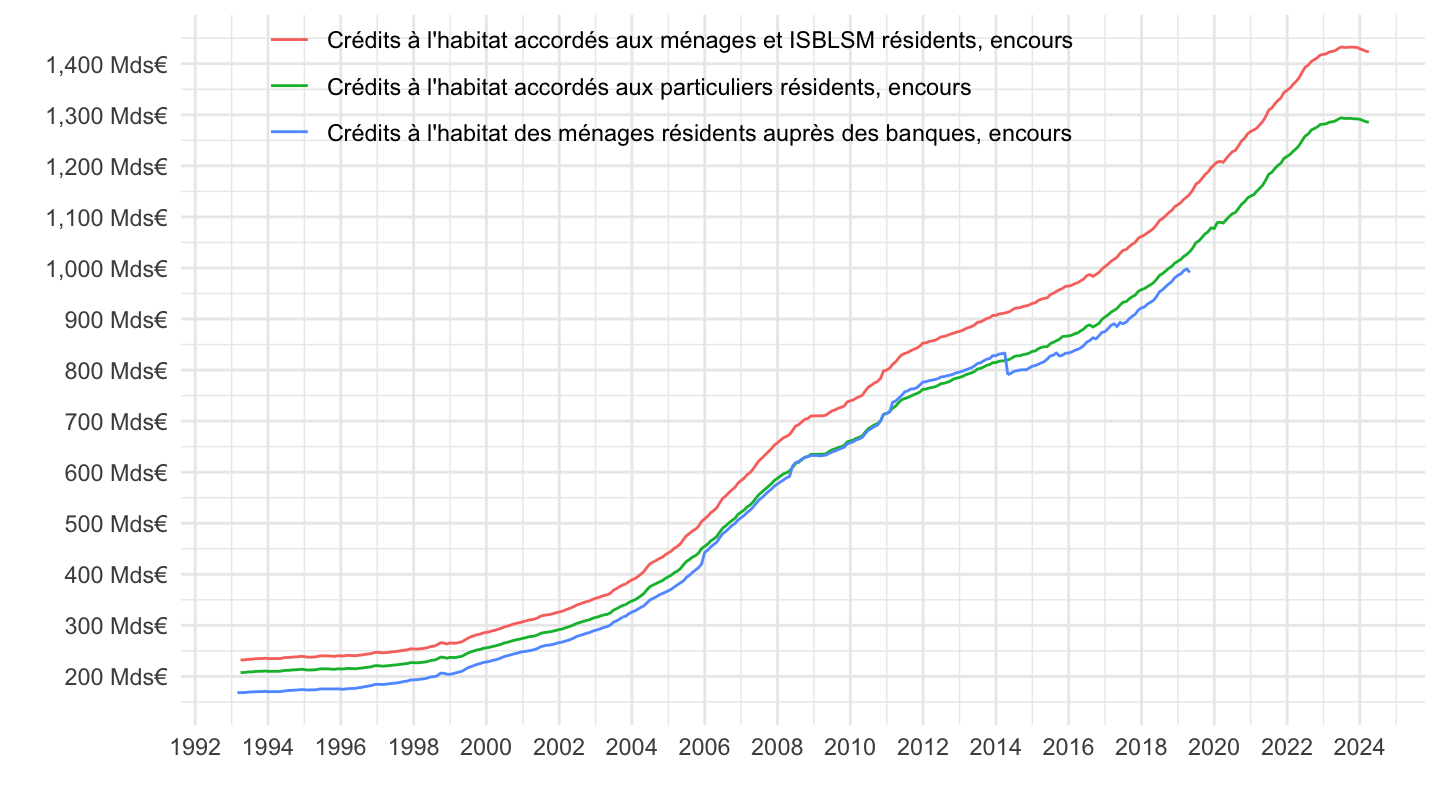
BSI1 |>
  filter(grepl("BSI1.M.FR.N.R.A220Z.A.1.U6.2250.Z01.E", variable) |
           grepl("BSI1.M.FR.N.R.A220Z.A.1.U6.2254FR.Z01.E", variable) |
           grepl("BSI1.M.FR.N.2.A22.A.1.U6.2251.Z01.E", variable)) |>

  ggplot() + theme_minimal() + xlab("") + ylab("") +
  geom_line(aes(x = date, y = value / 1000, color = Variable)) +

  scale_x_date(breaks = as.Date(paste0(seq(1960, 2100, 2), "-01-01")),
               labels = date_format("%Y")) +
  theme(legend.position = c(0.4, 0.9),
        legend.title = element_blank(),
        legend.direction = "vertical") +
  scale_y_log10(breaks = seq(-10000, 10000, 100),
                labels = dollar_format(suffix = " Mds€", prefix = "",  accuracy = 1)) +
  geom_label(data = . %>% filter(date == as.Date("2023-12-31")),
             aes(x = date, y = value/1000, color = Variable, label = round(value/1000, digits = 1)))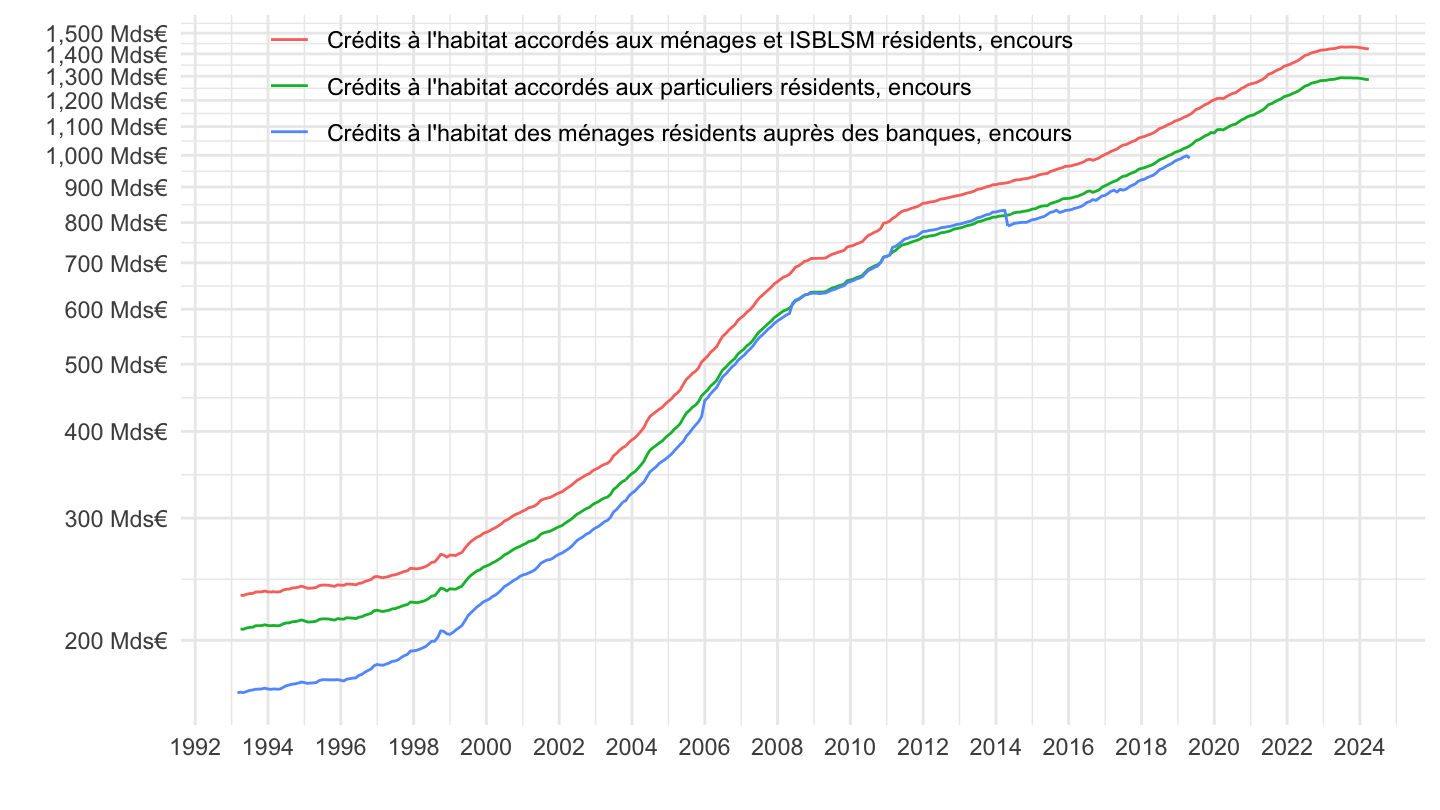
BSI1 |>
  filter(grepl("BSI1.M.FR.N.R.A210Z.A.1.U6.2254FR.Z01.E", variable) |
           grepl("BSI1.M.FR.N.R.A210Z.A.1.U6.2250.Z01.E", variable)) |>

  ggplot() + theme_minimal() + xlab("") + ylab("") +
  geom_line(aes(x = date, y = value / 1000, color = Variable)) +

  scale_x_date(breaks = as.Date(paste0(seq(1960, 2100, 2), "-01-01")),
               labels = date_format("%Y")) +
  theme(legend.position = c(0.5, 0.9),
        legend.title = element_blank(),
        legend.direction = "vertical") +
  scale_y_continuous(breaks = seq(-10000, 10000, 10),
                labels = dollar_format(suffix = " Mds€", prefix = "",  accuracy = 1)) +
  geom_label(data = . %>% filter(date == as.Date("2023-12-31")),
             aes(x = date, y = value/1000, color = Variable, label = round(value/1000, digits = 1)))
BSI1 |>
  filter(grepl("BSI1.M.FR.N.R.A210Z.A.1.U6.2254FR.Z01.E", variable) |
           grepl("BSI1.M.FR.N.R.A210Z.A.1.U6.2250.Z01.E", variable)) |>

  ggplot() + theme_minimal() + xlab("") + ylab("") +
  geom_line(aes(x = date, y = value / 1000, color = Variable)) +

  scale_x_date(breaks = as.Date(paste0(seq(1960, 2100, 2), "-01-01")),
               labels = date_format("%Y")) +
  theme(legend.position = c(0.5, 0.9),
        legend.title = element_blank(),
        legend.direction = "vertical") +
  scale_y_log10(breaks = seq(-10000, 10000, 10),
                labels = dollar_format(suffix = " Mds€", prefix = "",  accuracy = 1)) +
  geom_label(data = . %>% filter(date == as.Date("2023-12-31")),
             aes(x = date, y = value/1000, color = Variable, label = round(value/1000, digits = 1)))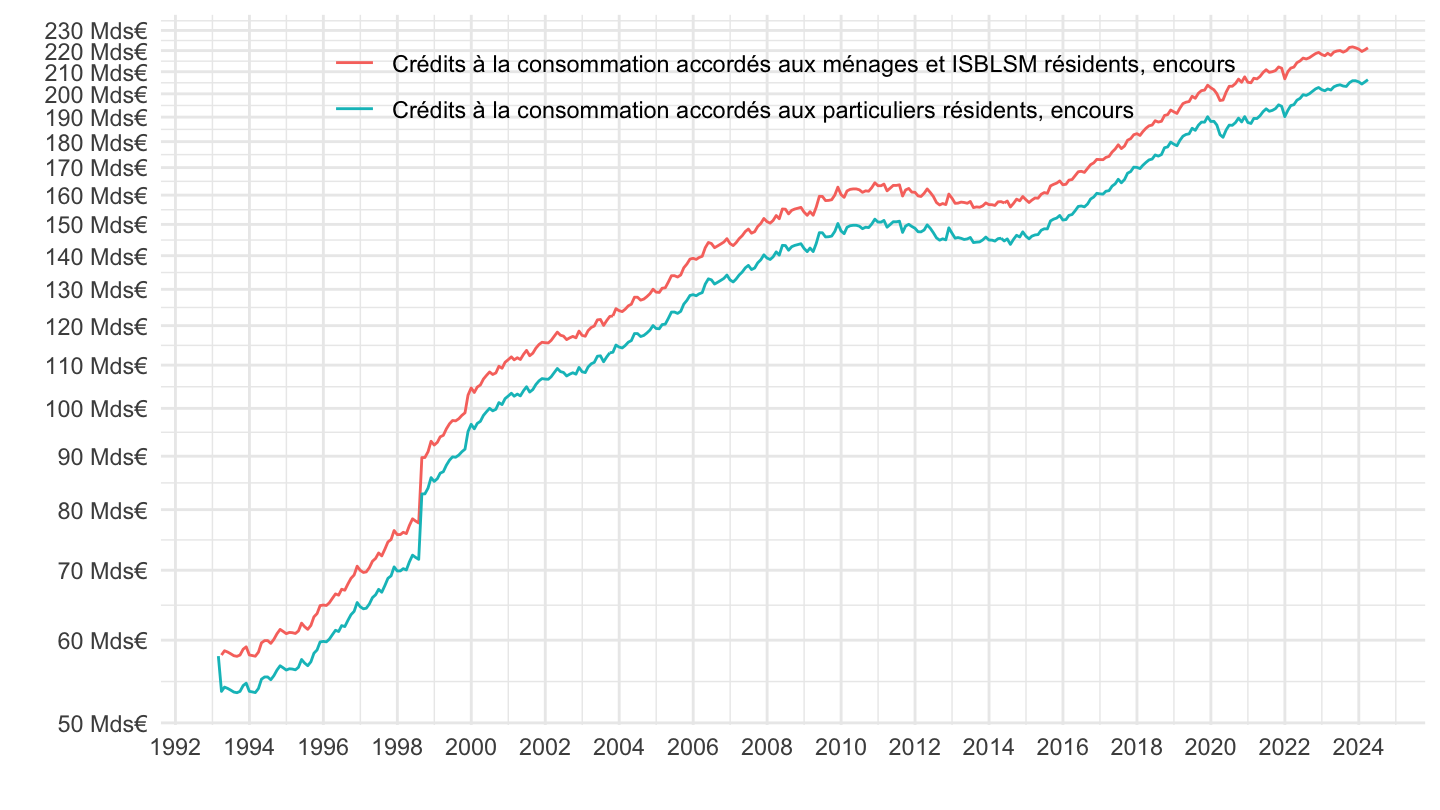
| source | dataset | Title | Updated |
|---|---|---|---|



