Code
loyers %>%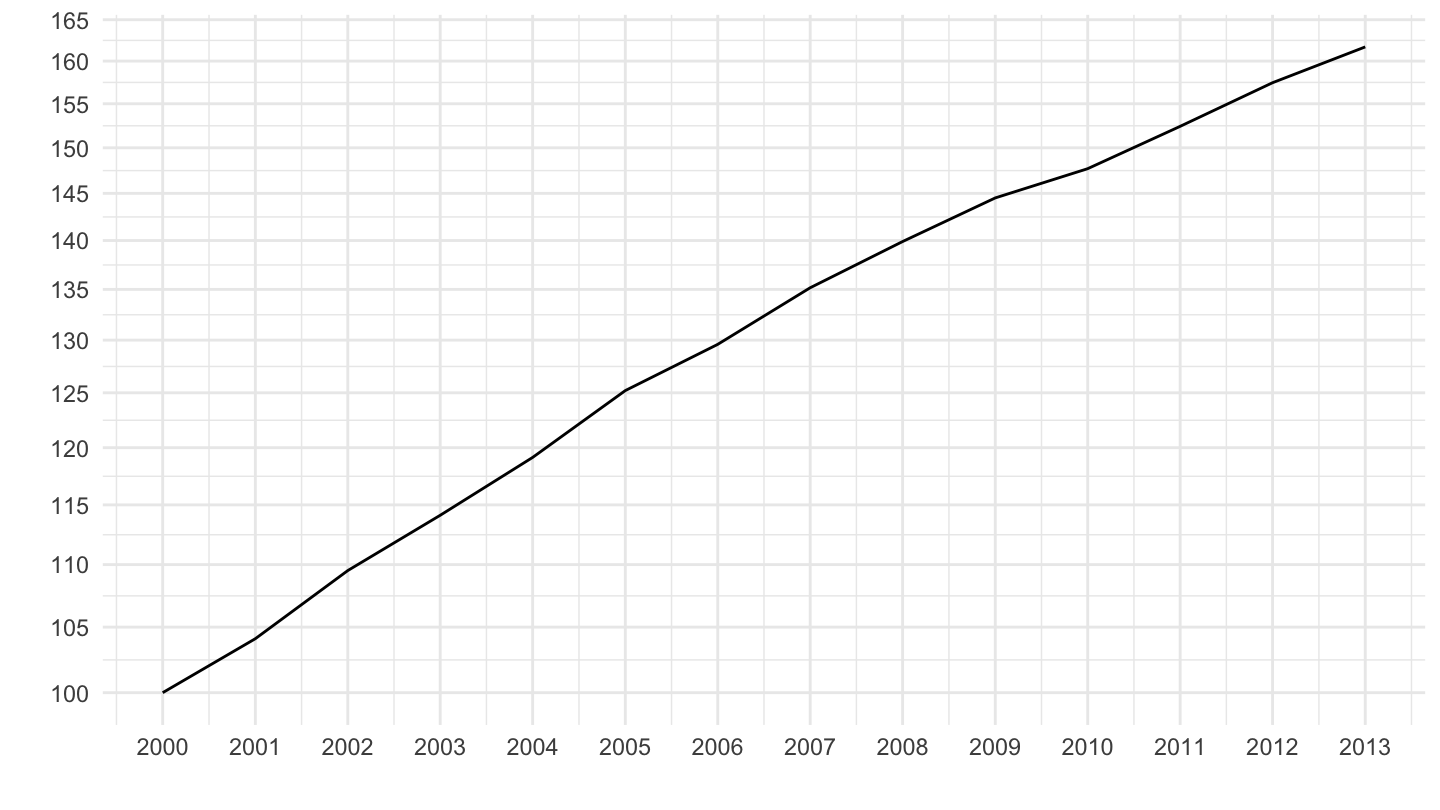
print_table_conditional()| year | inflation_loyers | cumprod |
|---|---|---|
| 2001 | 4.1 | 104.1000 |
| 2002 | 5.2 | 109.5132 |
| 2003 | 4.2 | 114.1128 |
| 2004 | 4.4 | 119.1337 |
| 2005 | 5.1 | 125.2095 |
| 2006 | 3.5 | 129.5919 |
| 2007 | 4.3 | 135.1643 |
| 2008 | 3.5 | 139.8951 |
| 2009 | 3.3 | 144.5116 |
| 2010 | 2.2 | 147.6909 |
| 2011 | 3.2 | 152.4170 |
| 2012 | 3.3 | 157.4467 |
| 2013 | 2.7 | 161.6978 |