Residential property prices - detailed series
Data - BIS
Info
Data on housing
| source | dataset | Title | .html | .rData |
|---|---|---|---|---|
| bis | LONG_PP | Residential property prices - detailed series | 2026-01-07 | 2024-05-10 |
| bdf | RPP | Prix de l'immobilier | 2026-01-10 | 2026-01-10 |
| bis | SELECTED_PP | Property prices, selected series | 2026-01-07 | 2026-01-07 |
| ecb | RPP | Residential Property Price Index Statistics | 2026-01-11 | 2026-01-11 |
| eurostat | ei_hppi_q | House price index (2015 = 100) - quarterly data | 2026-01-09 | 2026-01-09 |
| eurostat | hbs_str_t223 | Mean consumption expenditure by income quintile | 2025-10-11 | 2026-01-09 |
| eurostat | prc_hicp_midx | HICP (2015 = 100) - monthly data (index) | 2025-12-22 | 2026-01-09 |
| eurostat | prc_hpi_q | House price index (2015 = 100) - quarterly data | 2026-01-10 | 2026-01-07 |
| fred | housing | House Prices | 2026-01-11 | 2026-01-07 |
| insee | IPLA-IPLNA-2015 | Indices des prix des logements neufs et Indices Notaires-Insee des prix des logements anciens | 2026-01-11 | 2026-01-10 |
| oecd | SNA_TABLE5 | Final consumption expenditure of households | 2026-01-11 | 2023-10-19 |
| oecd | housing | NA | NA | NA |
LAST_COMPILE
| LAST_COMPILE |
|---|
| 2026-01-11 |
Last
| date | Nobs |
|---|---|
| 2018-10-01 | 6 |
| 2018-07-01 | 22 |
iso3c, Reference area
Code
LONG_PP %>%
  arrange(iso3c, FREQ, date) %>%
  group_by(iso3c, FREQ, `Reference area`) %>%
  summarise(Nobs = n(),
            start = first(date),
            end = last(date)) %>%
  arrange(-Nobs) %>%
  mutate(Flag = gsub(" ", "-", str_to_lower(`Reference area`)),
         Flag = paste0('<img src="../../icon/flag/vsmall/', Flag, '.png" alt="Flag">')) %>%
  select(Flag, everything()) %>%
  {if (is_html_output()) datatable(., filter = 'top', rownames = F, escape = F) else .}
FREQ, Frequency
Code
LONG_PP %>%
  group_by(FREQ, Frequency) %>%
  summarise(Nobs = n()) %>%
  arrange(-Nobs) %>%
{if (is_html_output()) print_table(.) else .}| FREQ | Frequency | Nobs |
|---|---|---|
| Q | Quarterly | 4526 |
1970-2020
France, Italy, Spain
Code
LONG_PP %>%
  filter(iso3c %in% c("FRA", "ITA", "ESP"),
         FREQ == "Q",
         date >= as.Date("1970-01-01")) %>%
  left_join(colors, by = c("Reference area" = "country")) %>%
  ggplot(.) + theme_minimal() + xlab("") + ylab("House Prices (Index)") +
  geom_line(aes(x = date, y = value, color = color)) +
  scale_x_date(breaks = seq(1900, 2100, 5) %>% paste0("-01-01") %>% as.Date,
               labels = date_format("%Y")) +
  scale_y_log10(breaks = c(seq(0, 600, 50), seq(0, 50, 10), seq(0, 5, 1)),
                     labels = dollar_format(accuracy = 1, prefix = "")) +
  scale_color_identity() + add_3flags +
  theme(legend.position = c(0.8, 0.2),
        legend.title = element_blank())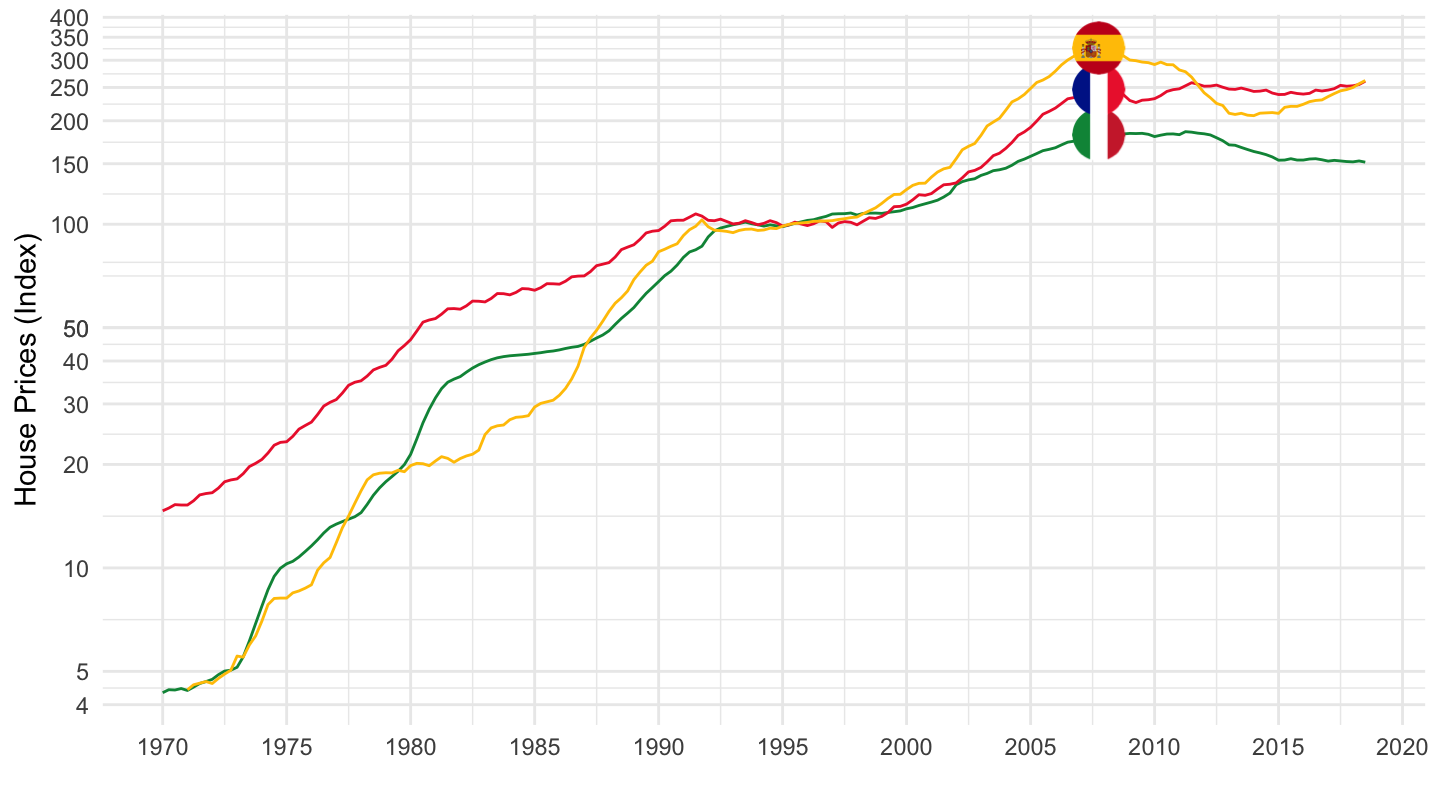
Denmark, Sweden, Japan
Code
LONG_PP %>%
  filter(iso3c %in% c("DNK", "SWE", "JPN"),
         FREQ == "Q",
         date >= as.Date("1970-01-01")) %>%
  left_join(colors, by = c("Reference area" = "country")) %>%
  ggplot(.) + theme_minimal() + xlab("") + ylab("House Prices (Index)") +
  geom_line(aes(x = date, y = value, color = color)) +
  scale_x_date(breaks = seq(1900, 2100, 5) %>% paste0("-01-01") %>% as.Date,
               labels = date_format("%Y")) +
  scale_y_log10(breaks = c(seq(0, 600, 50), seq(0, 50, 10), seq(0, 5, 1)),
                     labels = dollar_format(accuracy = 1, prefix = "")) +
  scale_color_identity() + add_3flags +
  theme(legend.position = c(0.8, 0.2),
        legend.title = element_blank())
Australia, Great Britain, South Africa
Code
LONG_PP %>%
  filter(iso3c %in% c("AUS", "GBR", "ZAF"),
         FREQ == "Q",
         date >= as.Date("1970-01-01")) %>%
  left_join(colors, by = c("Reference area" = "country")) %>%
  ggplot(.) + theme_minimal() + xlab("") + ylab("House Prices (Index)") +
  geom_line(aes(x = date, y = value, color = color)) +
  scale_x_date(breaks = seq(1900, 2100, 5) %>% paste0("-01-01") %>% as.Date,
               labels = date_format("%Y")) +
  scale_y_log10(breaks = c(seq(0, 600, 50), seq(0, 50, 10), seq(0, 5, 1)),
                     labels = dollar_format(accuracy = 1, prefix = "")) +
  scale_color_identity() + add_3flags +
  theme(legend.position = c(0.8, 0.2),
        legend.title = element_blank())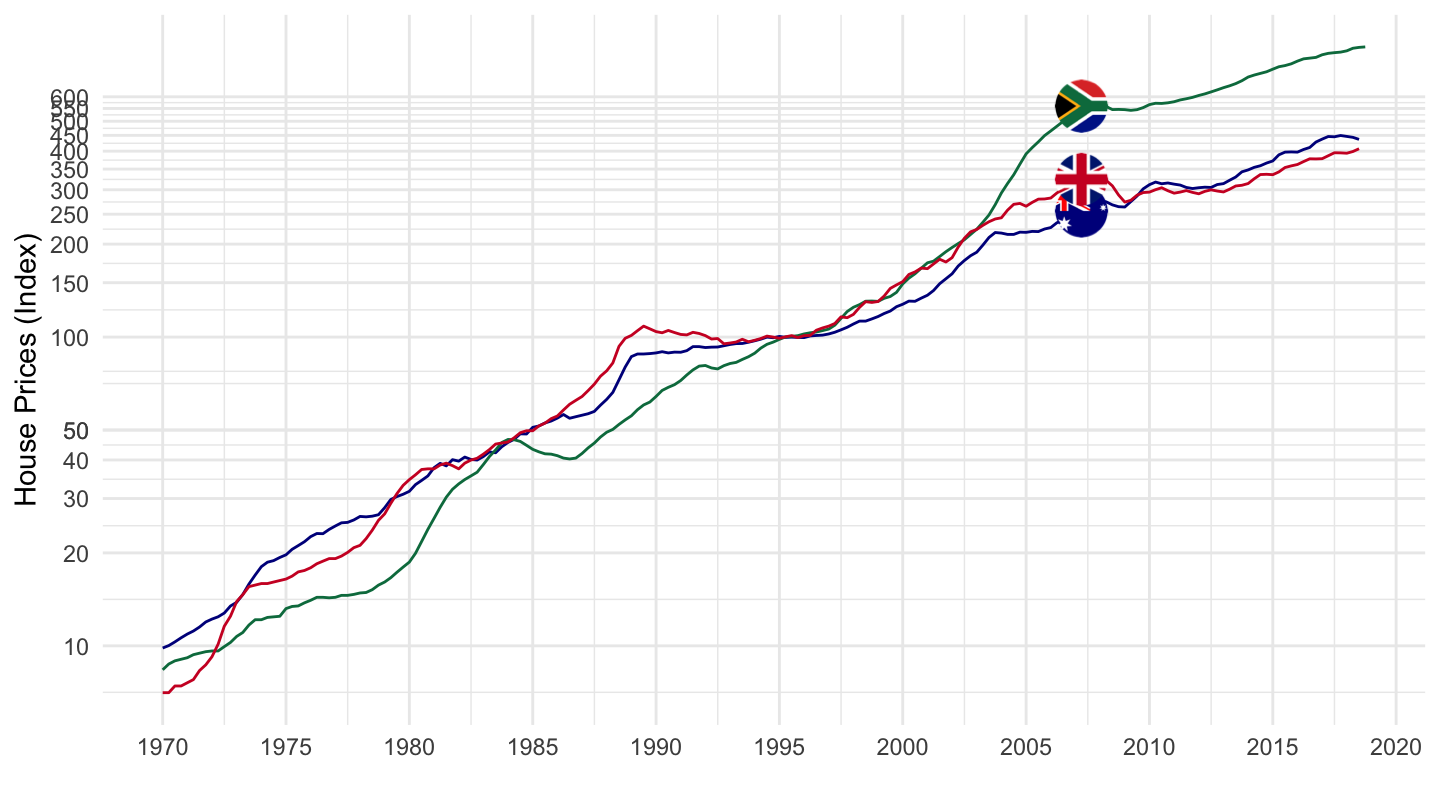
All
Japan, UK, US
Code
LONG_PP %>%
  filter(iso3c %in% c("JPN", "GBR", "USA"),
         FREQ == "Q") %>%
  left_join(colors, by = c("Reference area" = "country")) %>%
  ggplot(.) + theme_minimal() + xlab("") + ylab("House Prices (Index)") +
  geom_line(aes(x = date, y = value, color = color)) +
  scale_x_date(breaks = seq(1900, 2100, 5) %>% paste0("-01-01") %>% as.Date,
               labels = date_format("%Y")) +
  scale_y_log10(breaks = c(seq(0, 600, 50), seq(0, 50, 10), seq(0, 5, 1)),
                     labels = dollar_format(accuracy = 1, prefix = "")) +
  scale_color_identity() + add_3flags +
  theme(legend.position = c(0.8, 0.2),
        legend.title = element_blank())
Italy, Japan, South Africa
Code
LONG_PP %>%
  filter(iso3c %in% c("ITA", "JPN", "ZAF"),
         FREQ == "Q") %>%
  left_join(colors, by = c("Reference area" = "country")) %>%
  ggplot(.) + theme_minimal() + xlab("") + ylab("House Prices (Index)") +
  geom_line(aes(x = date, y = value, color = color)) +
  scale_x_date(breaks = seq(1900, 2100, 5) %>% paste0("-01-01") %>% as.Date,
               labels = date_format("%Y")) +
  scale_y_log10(breaks = c(seq(0, 600, 50), seq(0, 50, 10), seq(0, 5, 1)),
                     labels = dollar_format(accuracy = 1, prefix = "")) +
  scale_color_identity() + add_3flags +
  theme(legend.position = c(0.8, 0.2),
        legend.title = element_blank())
Japan
1955-2020
(ref:HP-1955-2020) Japan House Prices (1955-2020)
Code
LONG_PP %>%
  filter(iso3c == "JPN") %>%
  ggplot(.) +
  geom_line(aes(x = date, y = value)) +
  ylab("House Price Index") + xlab("") +
  scale_y_continuous(breaks =  seq(0, 200, 10)) +
  scale_x_date(breaks = seq(1800, 2100, 10) %>% paste0("-01-01") %>% as.Date(),
               labels = date_format("%Y")) +
  theme_minimal() +
  geom_vline(xintercept = as.Date("1990-10-29"), linetype = "dashed", color = viridis(3)[2])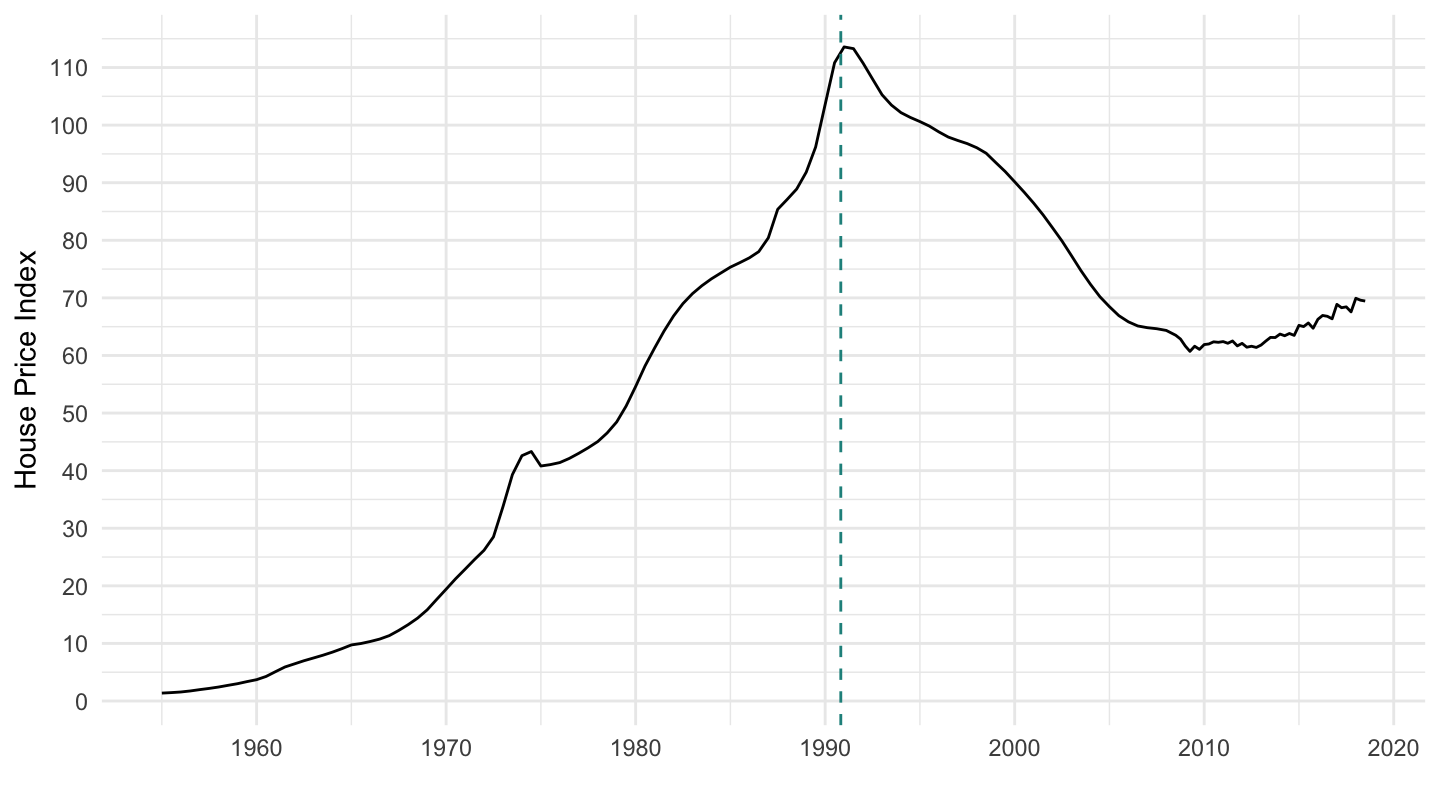
1980-2020
(ref:HP-1980-1995) Japan House Prices (1980-1995)
Code
LONG_PP %>%
  filter(iso3c == "JPN",
         date >= as.Date("1980-01-01"),
         date <= as.Date("1995-01-01")) %>%
  ggplot(.) +
  geom_line(aes(x = date, y = value)) +
  ylab("House Price Index") + xlab("") +
  scale_y_continuous(breaks =  seq(0, 200, 10)) +
  scale_x_date(breaks = seq(1800, 2100, 1) %>% paste0("-01-01") %>% as.Date(),
               labels = date_format("%Y")) +
  theme_minimal() +
  geom_vline(xintercept = as.Date("1929-10-29"), linetype = "dashed", color = "red")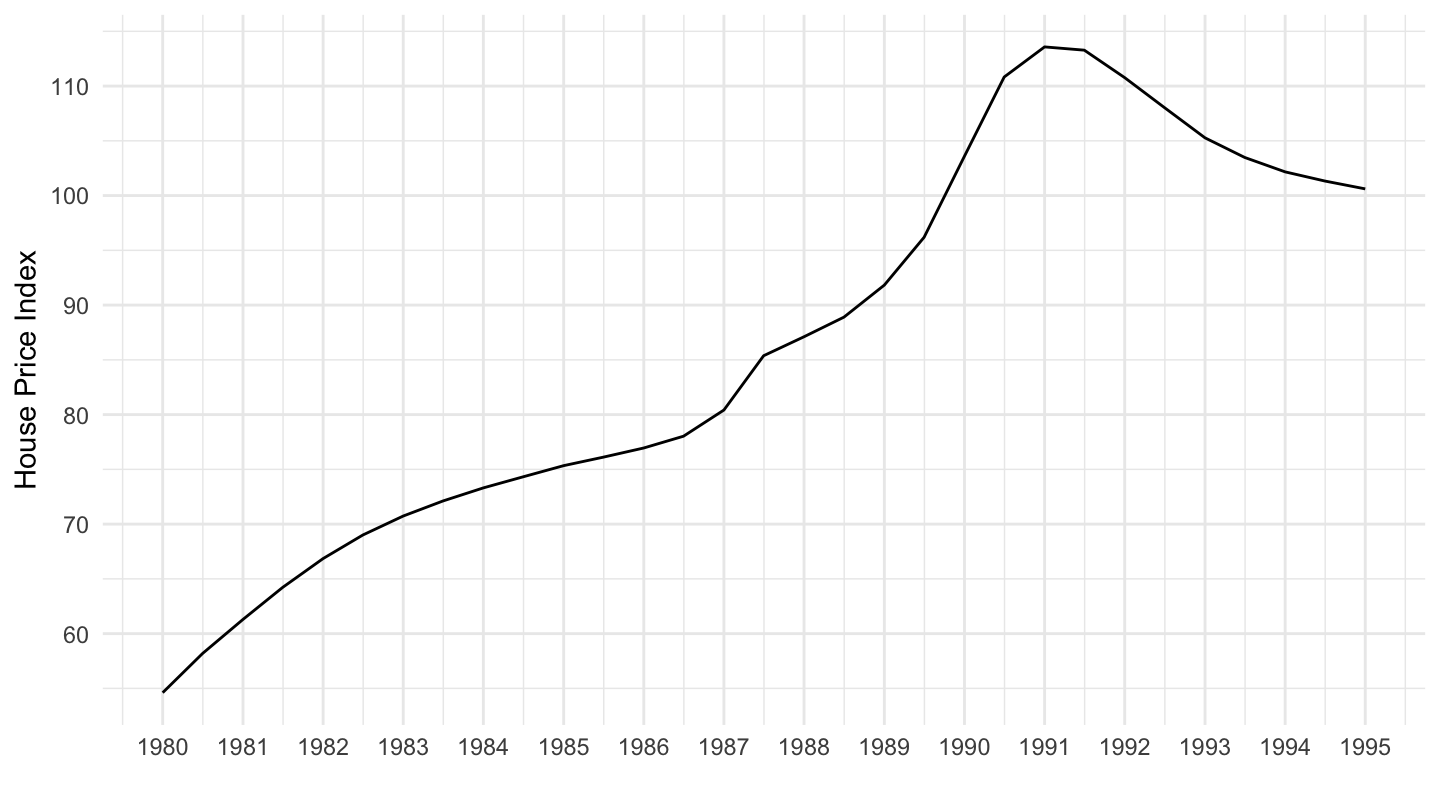
Australia
1955-2020
Code
LONG_PP %>%
  filter(iso3c == "AUS") %>%
  ggplot(.) + theme_minimal() + ylab("House Price Index") + xlab("") +
  geom_line(aes(x = date, y = value)) +
  scale_y_log10(breaks =  seq(0, 500, 50)) +
  scale_x_date(breaks = seq(1800, 2100, 10) %>% paste0("-01-01") %>% as.Date(),
               labels = date_format("%Y"))
2000-
Code
LONG_PP %>%
  filter(iso3c == "AUS",
         date >= as.Date("2000-01-01")) %>%
  ggplot(.) + theme_minimal() + ylab("House Price Index") + xlab("") +
  geom_line(aes(x = date, y = value)) +
  scale_y_log10(breaks =  seq(0, 500, 50)) +
  scale_x_date(breaks = seq(1800, 2100, 2) %>% paste0("-01-01") %>% as.Date(),
               labels = date_format("%Y"))
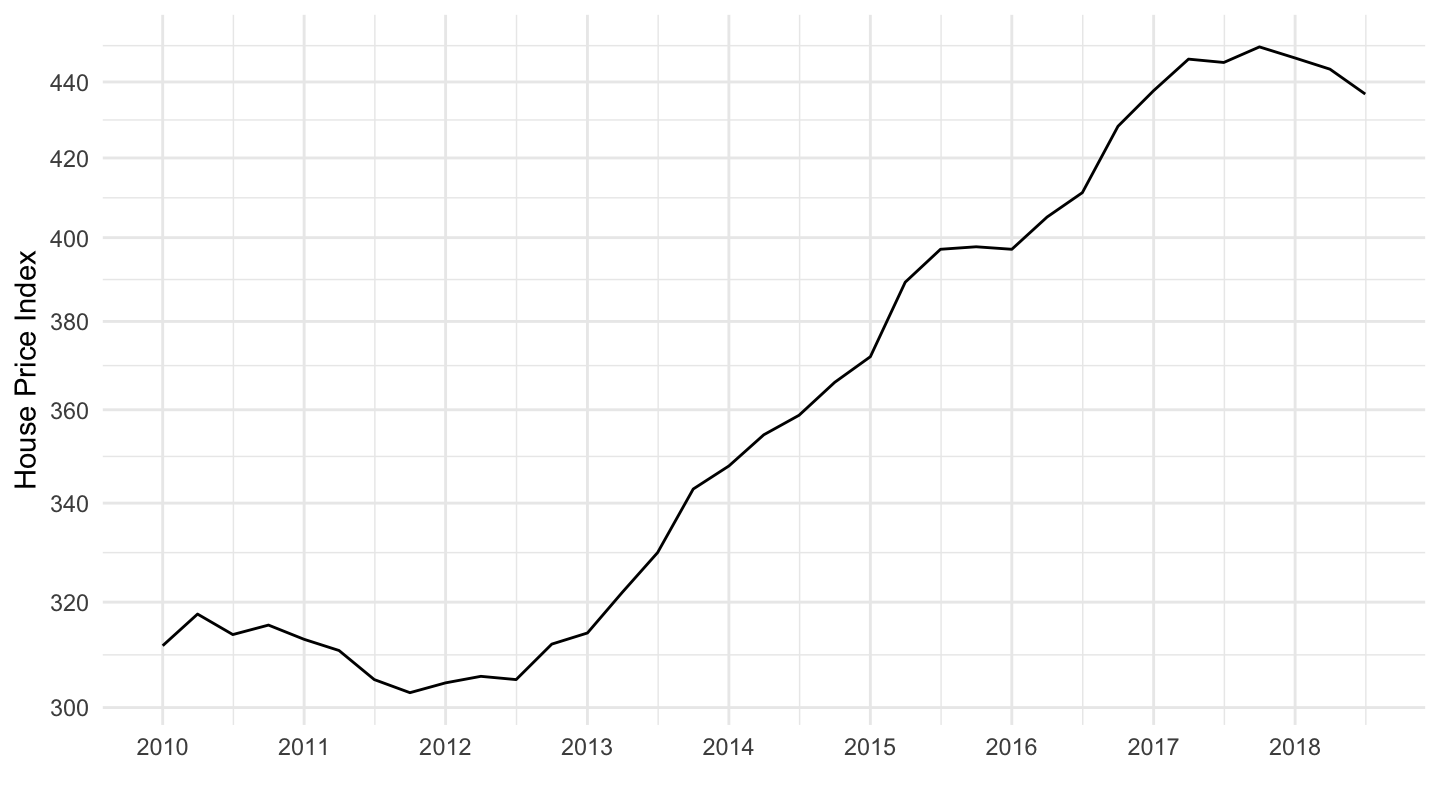
2010-
Code
LONG_PP %>%
  filter(iso3c == "AUS",
         date >= as.Date("2010-01-01")) %>%
  ggplot(.) + theme_minimal() + ylab("House Price Index") + xlab("") +
  geom_line(aes(x = date, y = value)) +
  scale_y_log10(breaks =  seq(0, 500, 20)) +
  scale_x_date(breaks = seq(1800, 2100, 1) %>% paste0("-01-01") %>% as.Date(),
               labels = date_format("%Y"))