| source | dataset | Title | .html | .rData |
|---|---|---|---|---|
| oecd | SNA_TABLE5 | Final consumption expenditure of households | 2026-07-23 | 2023-10-19 |
| oecd | SNA_TABLE1 | Gross domestic product (GDP) | 2026-07-23 | 2025-05-24 |
Final consumption expenditure of households
Data - OECD
Info
Data on housing
| source | dataset | Title | .html | .rData |
|---|---|---|---|---|
| bdf | RPP | Prix de l'immobilier | 2026-07-22 | 2026-07-22 |
| bis | LONG_PP | Residential property prices - detailed series | 2026-07-22 | 2024-05-10 |
| bis | SELECTED_PP | Property prices, selected series | 2026-07-22 | 2026-07-22 |
| ecb | RPP | Residential Property Price Index Statistics | 2026-07-23 | 2026-07-23 |
| eurostat | ei_hppi_q | House price index (2015 = 100) - quarterly data | 2026-07-23 | 2026-07-23 |
| eurostat | hbs_str_t223 | Mean consumption expenditure by income quintile | 2025-10-11 | 2026-07-23 |
| eurostat | prc_hicp_midx | HICP (2015 = 100) - monthly data (index) | 2026-07-23 | 2026-07-23 |
| eurostat | prc_hpi_q | House price index (2015 = 100) - quarterly data | 2026-07-23 | 2026-07-23 |
| fred | housing | House Prices | 2026-07-22 | 2026-07-22 |
| insee | IPLA-IPLNA-2015 | Indices des prix des logements neufs et Indices Notaires-Insee des prix des logements anciens | 2026-07-23 | 2026-07-23 |
| oecd | SNA_TABLE5 | Final consumption expenditure of households | 2026-07-23 | 2023-10-19 |
| oecd | housing | NA | NA | NA |
LAST_COMPILE
| LAST_COMPILE |
|---|
| 2026-07-24 |
Last
| obsTime | Nobs |
|---|---|
| 2022 | 8179 |
| 2021 | 10750 |
Layout - By country
- OECD Website. html
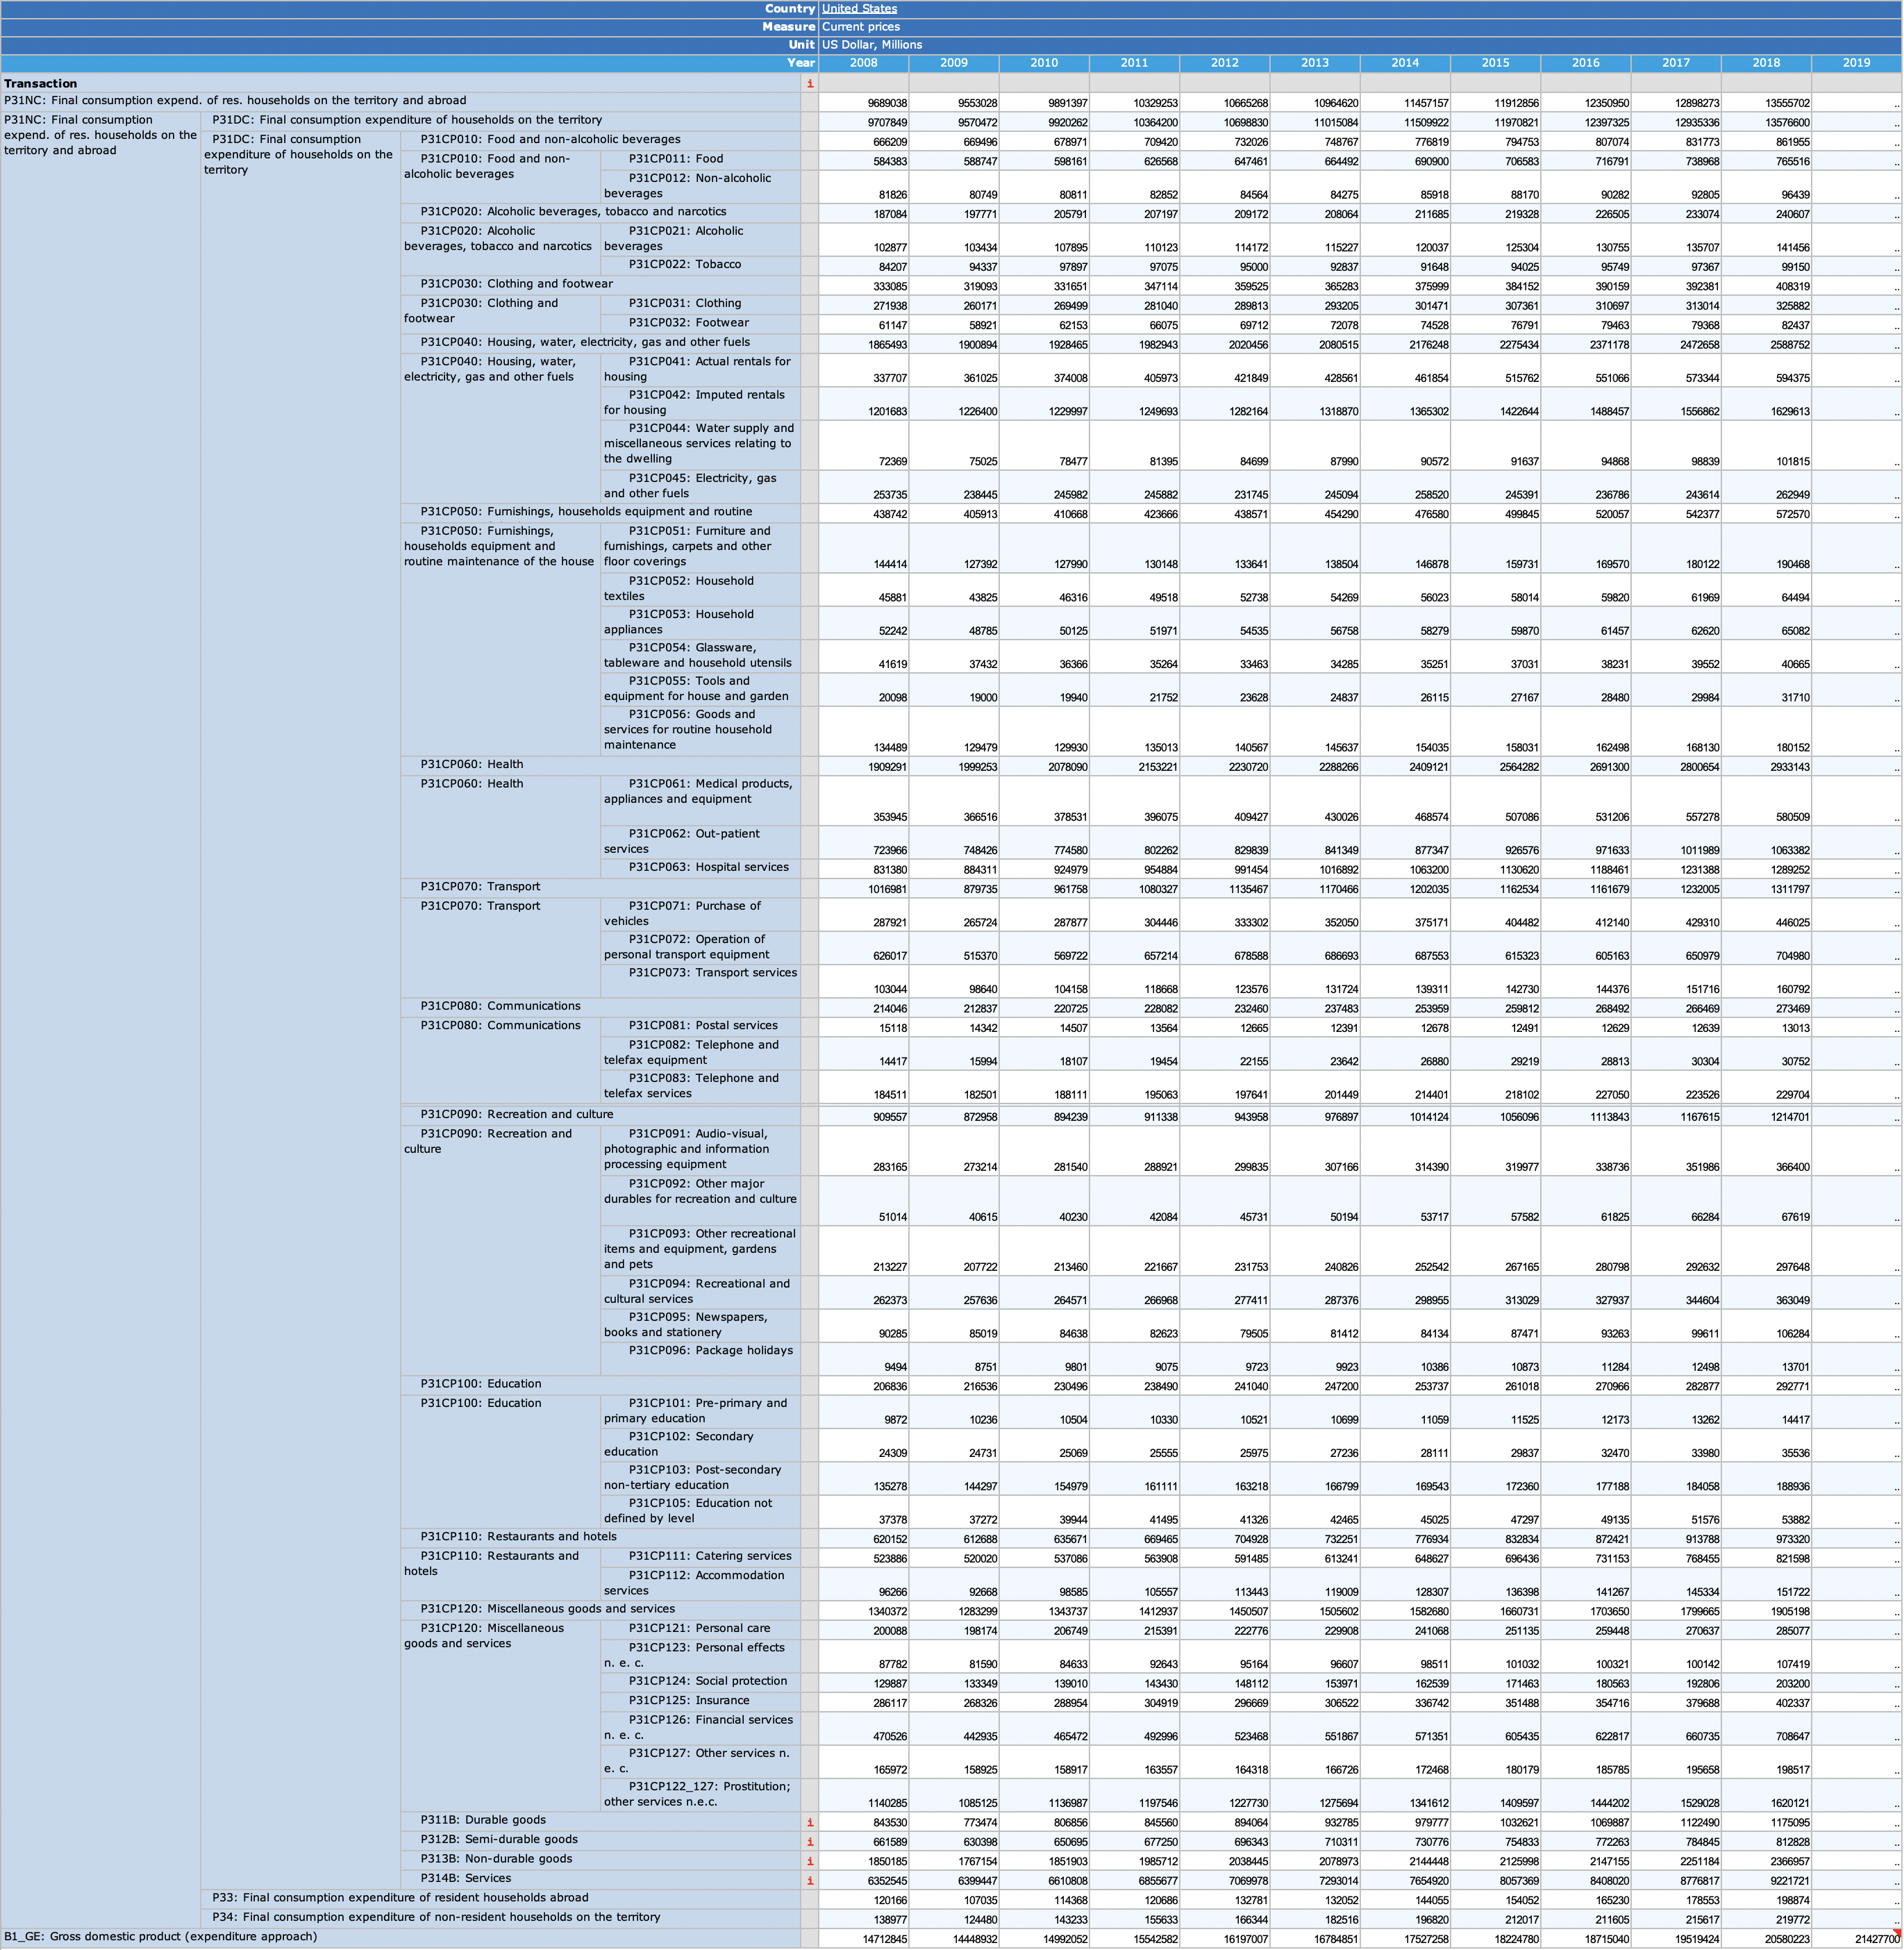
United States
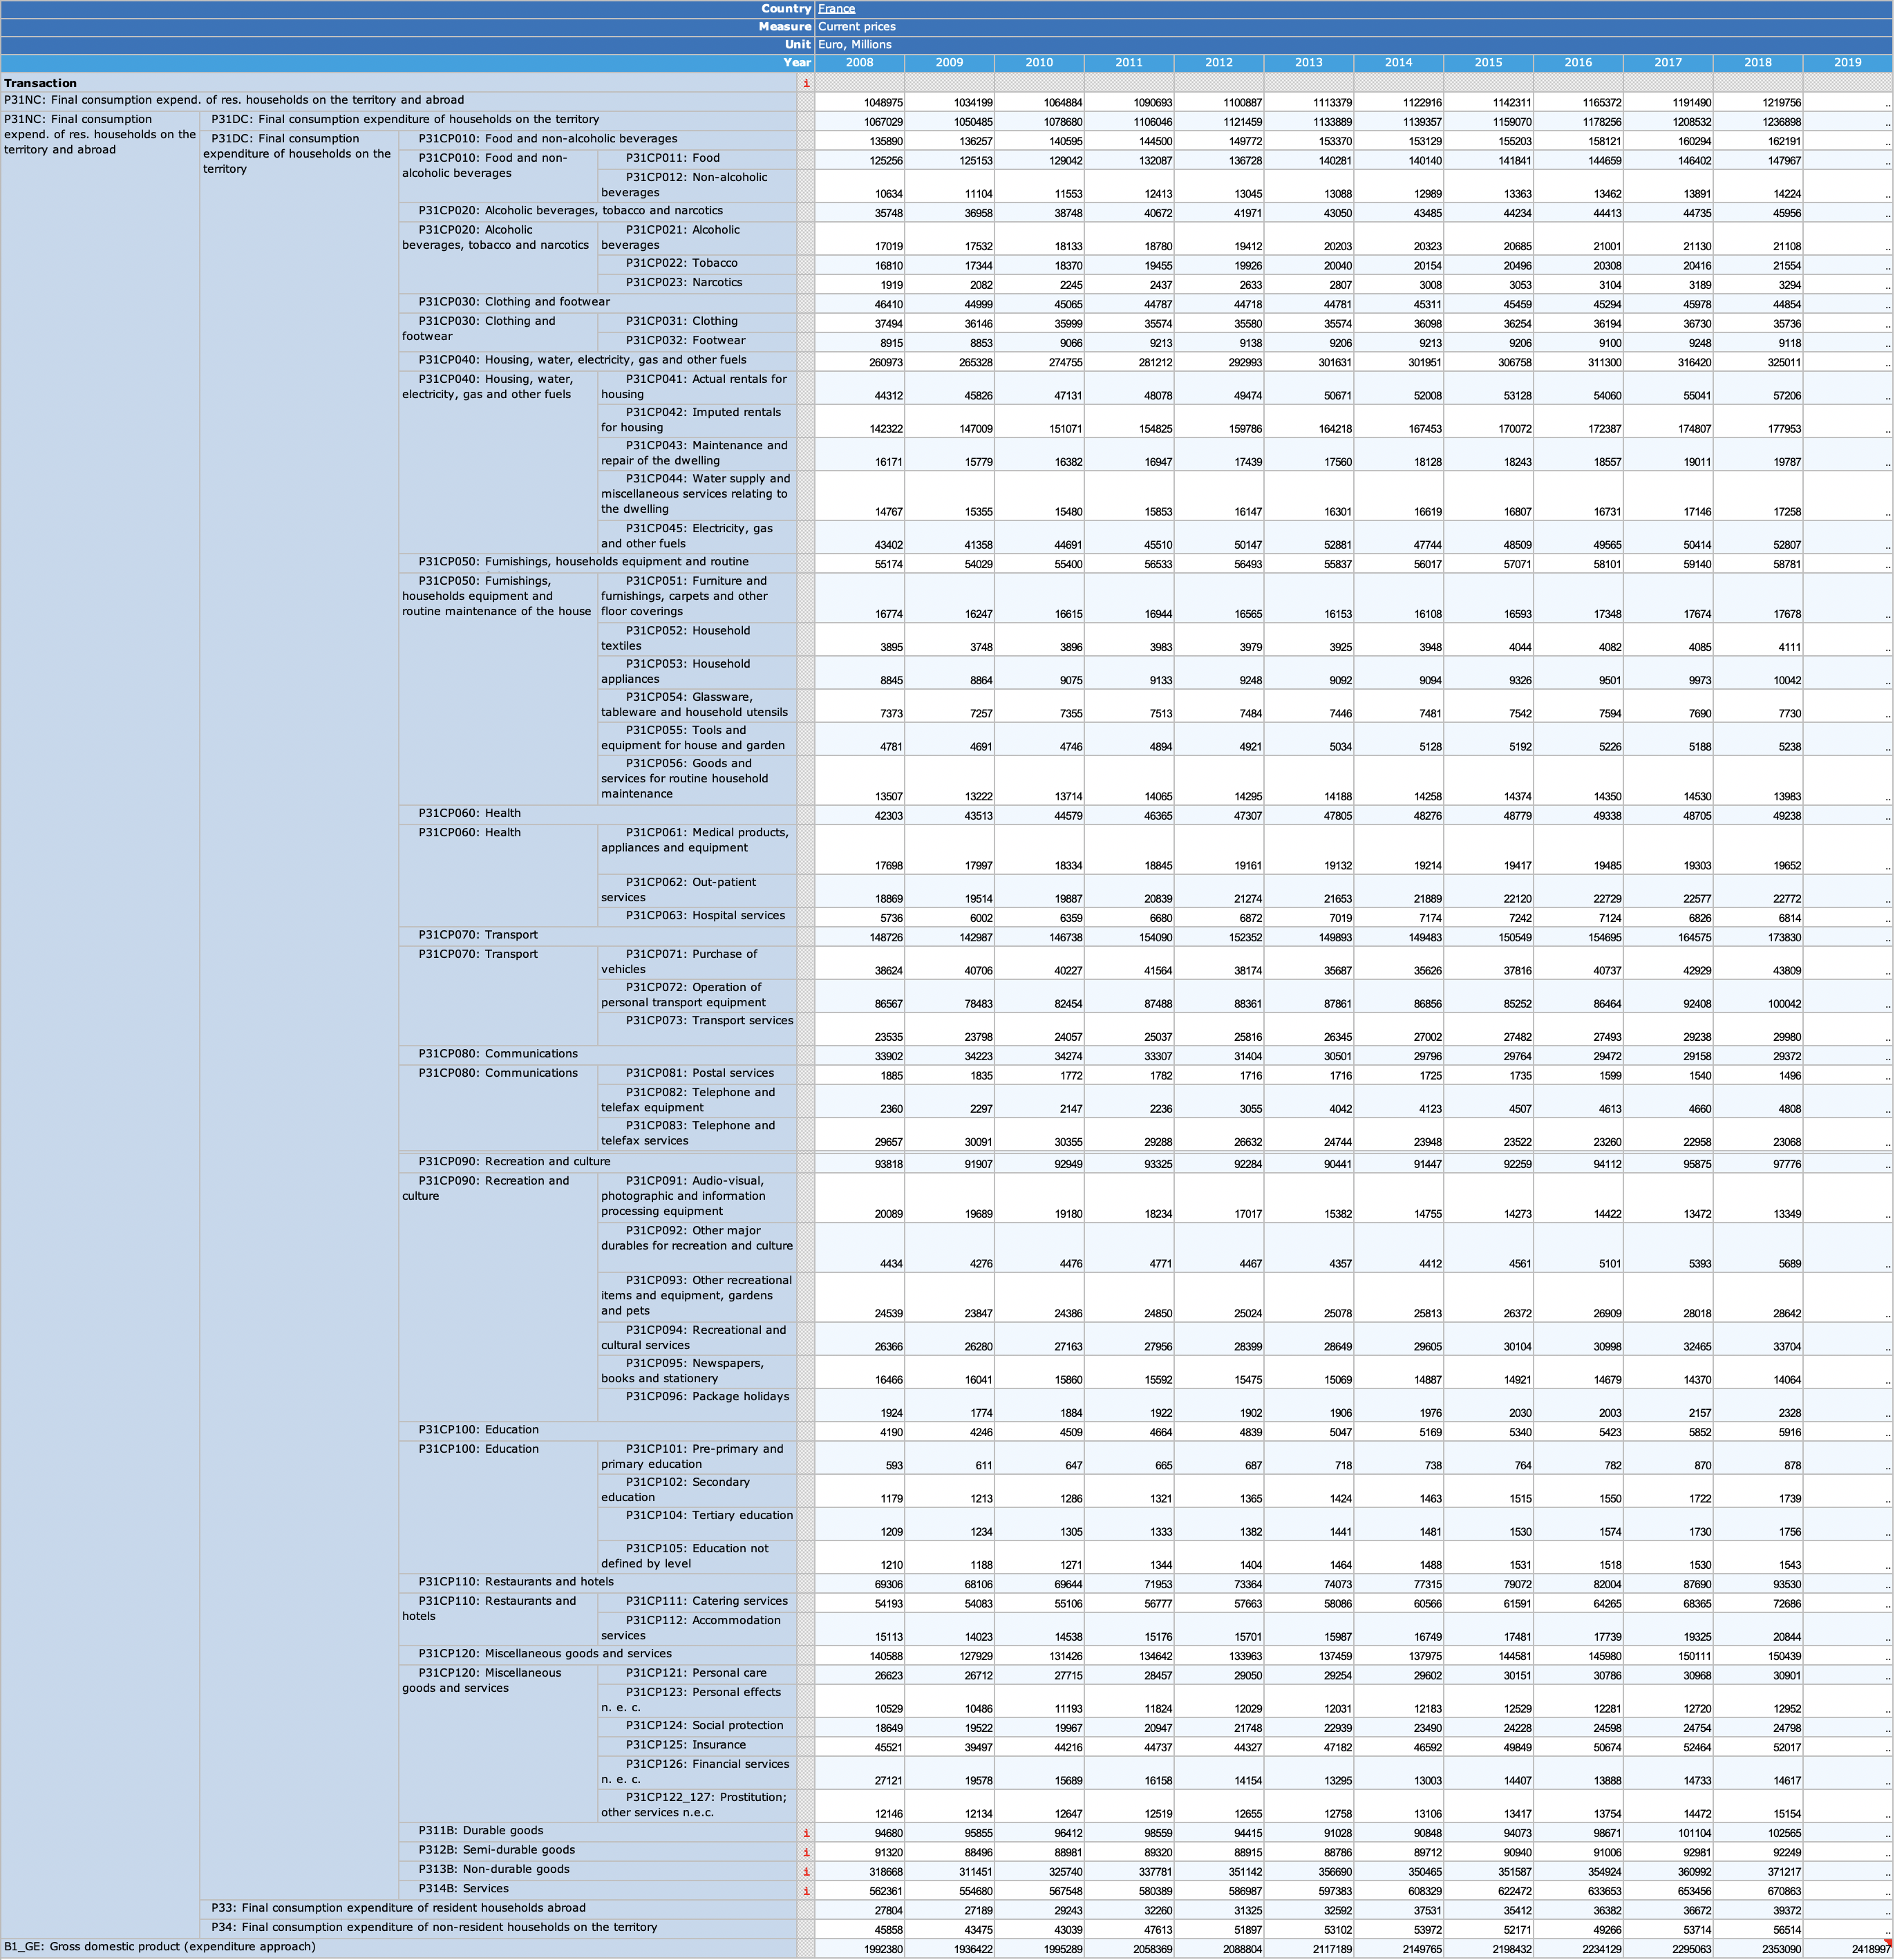
France
Nobs - TRANSACT, MEASURE
Code
SNA_TABLE5 %>%
  left_join(SNA_TABLE5_var$TRANSACT, by = "TRANSACT") %>%
  group_by(TRANSACT, Transact, MEASURE) %>%
  summarise(Nobs = n()) %>%
  arrange(-Nobs) %>%
  print_table_conditional()
TRANSACT
Code
SNA_TABLE5 %>%
  left_join(SNA_TABLE5_var$TRANSACT, by = "TRANSACT") %>%
  group_by(TRANSACT, Transact) %>%
  summarise(Nobs = n()) %>%
  arrange(-Nobs) %>%
  print_table_conditional()
MEASURE
Code
SNA_TABLE5 %>%
  left_join(SNA_TABLE5_var$MEASURE, by = "MEASURE") %>%
  group_by(MEASURE, Measure) %>%
  summarise(Nobs = n()) %>%
  arrange(-Nobs) %>%
print_table_conditional()| MEASURE | Measure | Nobs |
|---|---|---|
| C | Current prices | 81801 |
| V | Constant prices, national base year | 77900 |
| VOB | Constant prices, OECD base year | 75339 |
| DOB | Deflator | 72609 |
| VP | Constant prices, previous year prices | 60375 |
| VPVOB | Constant prices, constant PPPs, OECD base year | 28 |
obsTime
Code
SNA_TABLE5 %>%
  group_by(obsTime) %>%
  summarise(Nobs = n()) %>%
  arrange(desc(obsTime)) %>%
  print_table_conditional()
France, Germany, United Kingdom, United States
% of GDP
Code
SNA_TABLE5 %>%
  filter(LOCATION %in% c("FRA", "DEU", "USA", "GBR"),
         obsTime == "2017",
         MEASURE == "C") %>%
  left_join(SNA_TABLE5_var$TRANSACT, by = "TRANSACT") %>%
  left_join(SNA_TABLE5_var$LOCATION, by = "LOCATION") %>%
  select(Location, TRANSACT, Transact, obsValue) %>%
  mutate(Location = gsub(" ", "-", str_to_lower(gsub(" ", "-", Location))),
         Location = paste0('<img src="../../icon/flag/vsmall/', Location, '.png" alt="Flag">')) %>%
  spread(Location, obsValue) %>%
  mutate_at(vars(-1, -2), funs(round(100*./.[TRANSACT == "B1_GE"], 1))) %>%
  {if (is_html_output()) datatable(., filter = 'top', rownames = F, escape = F) else .}
% of Consumption
Code
SNA_TABLE5 %>%
  filter(LOCATION %in% c("FRA", "DEU", "USA", "GBR"),
         obsTime == "2017",
         MEASURE == "C") %>%
  left_join(SNA_TABLE5_var$TRANSACT, by = "TRANSACT") %>%
  left_join(SNA_TABLE5_var$LOCATION, by = "LOCATION") %>%
  select(Location, TRANSACT, Transact, obsValue) %>%
  mutate(Location = gsub(" ", "-", str_to_lower(gsub(" ", "-", Location))),
         Location = paste0('<img src="../../icon/flag/vsmall/', Location, '.png" alt="Flag">')) %>%
  spread(Location, obsValue) %>%
  mutate_at(vars(-1, -2), funs(round(100*./.[TRANSACT == "P31DC"], 1))) %>%
  {if (is_html_output()) datatable(., filter = 'top', rownames = F, escape = F) else .}
Housing
% of Consumption, % of GDP
Code
SNA_TABLE5 %>%
  filter(TRANSACT %in% c("P31DC", "P31CP040"),
         obsTime == "2017",
         MEASURE == "C") %>%
  arrange(LOCATION, TRANSACT) %>%
  select(LOCATION, TRANSACT, obsValue) %>%
  spread(TRANSACT, obsValue) %>%
  left_join(SNA_TABLE1 %>%
              filter(TRANSACT == "B1_GE",
                     MEASURE == "C",
                     obsTime == "2017") %>%
              select(LOCATION, B1_GE = obsValue),
            by = c("LOCATION")) %>%
  left_join(SNA_TABLE5_var$LOCATION, by = "LOCATION") %>%
  mutate(Flag = gsub(" ", "-", str_to_lower(gsub(" ", "-", Location))),
         Flag = paste0('<img src="../../icon/flag/vsmall/', Flag, '.png" alt="Flag">')) %>%
  transmute(Flag,
            LOCATION,
            Location,
            `Housing (% of Consumption)` = (100*P31CP040 / P31DC) %>% round(digits = 1),
            `Housing (% of GDP)` = (100*P31CP040 / B1_GE) %>% round(digits = 1)) %>%
  arrange(-`Housing (% of Consumption)`) %>%
  {if (is_html_output()) datatable(., filter = 'top', rownames = F, escape = F) else .}
% of Consumption
Code
SNA_TABLE5 %>%
  filter(TRANSACT %in% c("P31DC", "P31CP040", "P31CP041", "P31CP042"),
         obsTime == "2018",
         MEASURE == "C") %>%
  arrange(LOCATION, TRANSACT) %>%
  select(LOCATION, TRANSACT, obsValue) %>%
  spread(TRANSACT, obsValue) %>%
  left_join(SNA_TABLE5_var$LOCATION, by = "LOCATION") %>%
  mutate(Flag = gsub(" ", "-", str_to_lower(gsub(" ", "-", Location))),
         Flag = paste0('<img src="../../icon/flag/vsmall/', Flag, '.png" alt="Flag">')) %>%
  transmute(Flag,
            LOCATION,
            Location,
            `Housing` = (100*P31CP040 / P31DC) %>% round(digits = 1),
            `Rents (Actual)` = (100*P31CP041 / P31DC) %>% round(digits = 1),
            `Rents (Implicit)` = (100*P31CP042 / P31DC) %>% round(digits = 1)) %>%
  arrange(-Housing) %>%
  {if (is_html_output()) datatable(., filter = 'top', rownames = F, escape = F) else .}
Food, Health, Housing, Restaurant
Code
SNA_TABLE5 %>%
  filter(TRANSACT %in% c("P31CP010", "P31DC", "P31CP040", "P31CP060", "P31CP110"),
         obsTime == "2017",
         MEASURE == "C") %>%
  arrange(LOCATION, TRANSACT) %>%
  left_join(SNA_TABLE5_var$LOCATION, by = "LOCATION") %>%
  mutate(Flag = gsub(" ", "-", str_to_lower(gsub(" ", "-", Location))),
         Flag = paste0('<img src="../../icon/flag/vsmall/', Flag, '.png" alt="Flag">')) %>%
  select(Flag, Location, TRANSACT, obsValue) %>%
  spread(TRANSACT, obsValue) %>%
  group_by(Flag, Location) %>%
  summarise(`Food` = (100*P31CP010 / P31DC) %>% round(digits = 1),
            `Housing` = (100*P31CP040 / P31DC) %>% round(digits = 1),
            `Health` = (100*P31CP060 / P31DC) %>% round(digits = 1),
            `Restaurant` = (100*P31CP110 / P31DC) %>% round(digits = 1)) %>%
  na.omit %>%
  {if (is_html_output()) datatable(., filter = 'top', rownames = F, escape = F) else .}
Implicit / real Rents
Table 1
Code
library(gt)
library(gtExtras)
#devtools::install_github("rstudio/gt")
countrypops_new <- countrypops %>%
  select(LOCATION = country_code_3, LOCATION_2digit = country_code_2) %>%
  unique
table1 <- SNA_TABLE5 %>%
  filter(TRANSACT %in% c("P31CP042", "P31DC", "P31CP041"),
         MEASURE == "C",
         obsTime == "2019") %>%
  left_join(SNA_TABLE5_var$LOCATION, by = "LOCATION") %>%
  left_join(SNA_TABLE5_var$TRANSACT, by = "TRANSACT") %>%
  group_by(LOCATION) %>%
  mutate(values = 100*obsValue /obsValue[TRANSACT == "P31DC"]) %>%
  filter(TRANSACT != "P31DC") %>%
  mutate(Location = case_when(LOCATION == "EA19" ~ "Euro Area (19)",
                              LOCATION == "EA27" ~ "Europe (27)",
                              T ~ Location)) %>%
  left_join(countrypops_new, by = "LOCATION") %>%
  mutate(LOCATION_2digit = case_when(LOCATION == "EA19" ~ "EU",
                                     LOCATION == "EA27" ~ "EU",
                              T ~ LOCATION_2digit)) %>%
  ungroup %>%
  select(Location, LOCATION_2digit, Transact, values) %>%
  spread(Transact, values) %>%
  transmute(LOCATION_2digit, Location,
            `Actual rents` = `Actual rentals for housing`,
            `Imputed rents` = `Imputed rentals for housing`,
            `All rents` = `Actual rentals for housing` + `Imputed rentals for housing`) %>%
  gt() %>%
  fmt_number(columns = 3:5 , locale = "fr", decimals = 1, pattern = "{x}%") |>
  cols_align(align = "center", columns = 3:5) |>
  fmt_flag(columns = LOCATION_2digit, height = "1.5em") %>%
  cols_width(3:5 ~ px(50)) |>
  gt_theme_538()


gtsave(table1, filename = "SNA_TABLE5_files/figure-html/table1.png")
i_g("data/oecd/SNA_TABLE5_files/figure-html/table1.png")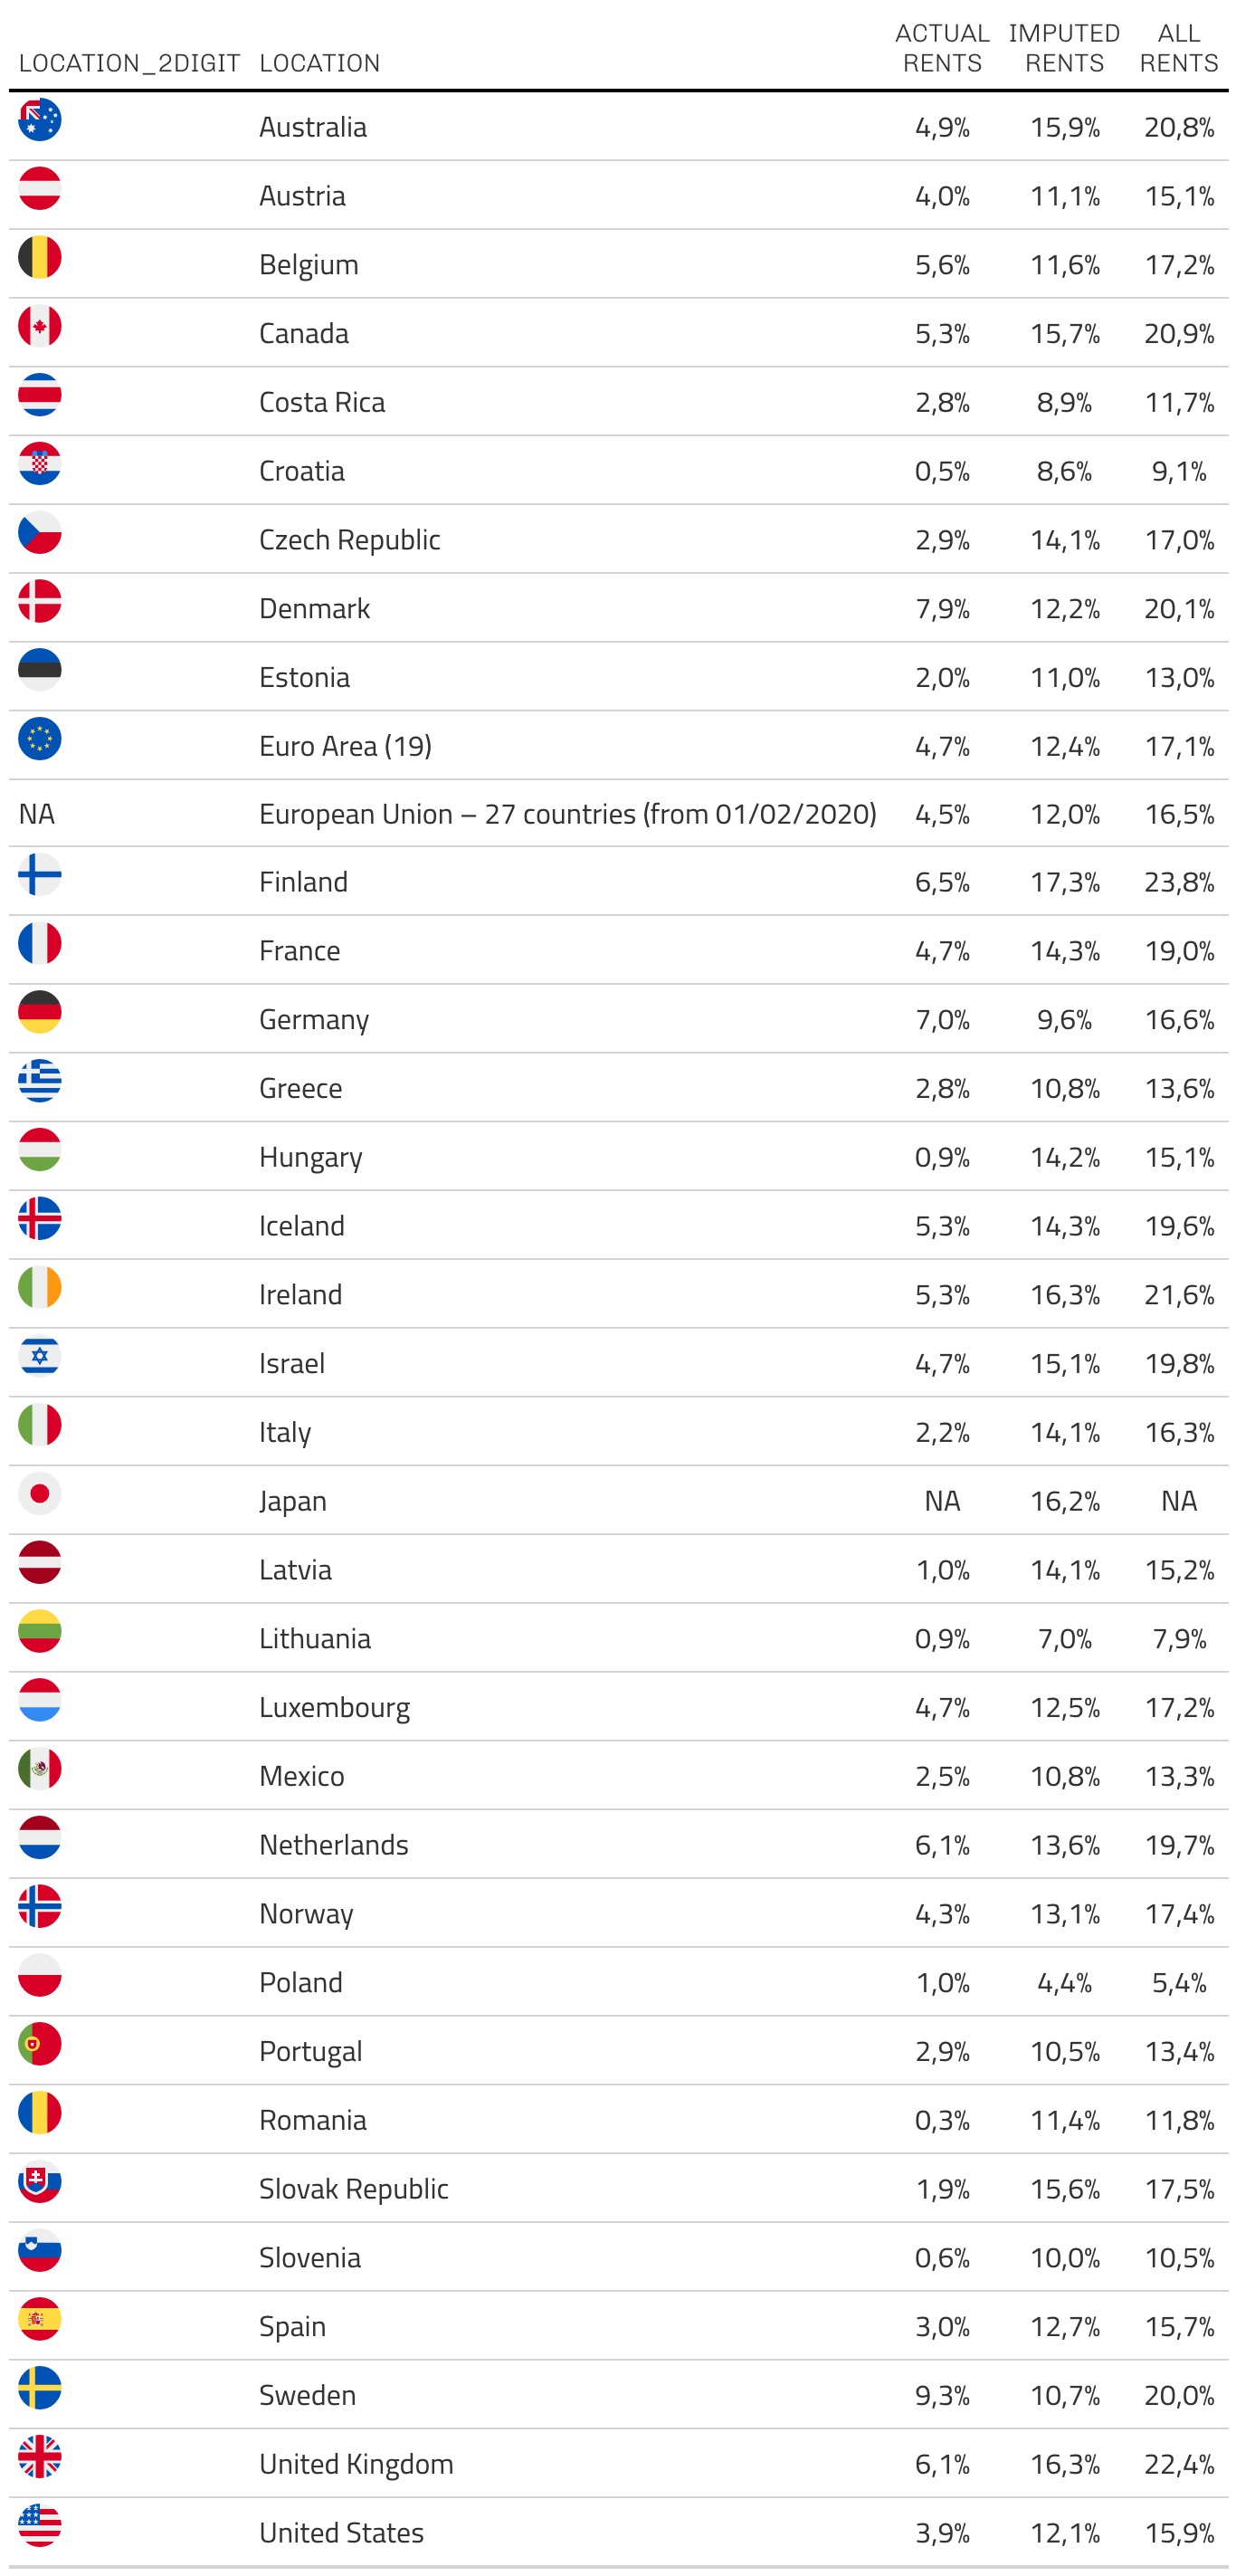
France, Germany, US
Code
SNA_TABLE5 %>%
  filter(TRANSACT %in% c("P31CP042", "P31DC", "P31CP041"),
         MEASURE == "C",
         LOCATION %in% c("FRA", "DEU", "USA")) %>%
  left_join(SNA_TABLE5_var$LOCATION, by = "LOCATION") %>%
  left_join(SNA_TABLE5_var$TRANSACT, by = "TRANSACT") %>%
  year_to_date %>%
  group_by(date, LOCATION) %>%
  mutate(obsValue = obsValue /obsValue[TRANSACT == "P31DC"]) %>%
  filter(TRANSACT != "P31DC") %>%
  left_join(colors, by = c("Location" = "country")) %>%
  ggplot(.) + geom_line(aes(x = date, y = obsValue, color = color, linetype = Transact)) +
  scale_color_identity() + add_6flags + theme_minimal() +
  scale_x_date(breaks = seq(1920, 2025, 10) %>% paste0("-01-01") %>% as.Date,
               labels = date_format("%Y")) +
  scale_y_continuous(breaks = 0.01*seq(-7, 26, 1),
                     labels = scales::percent_format(accuracy = 1)) +
  theme(legend.position = c(0.2, 0.9),
        legend.title = element_blank()) +
  ylab("Rentals (% of Consumption)") + xlab("")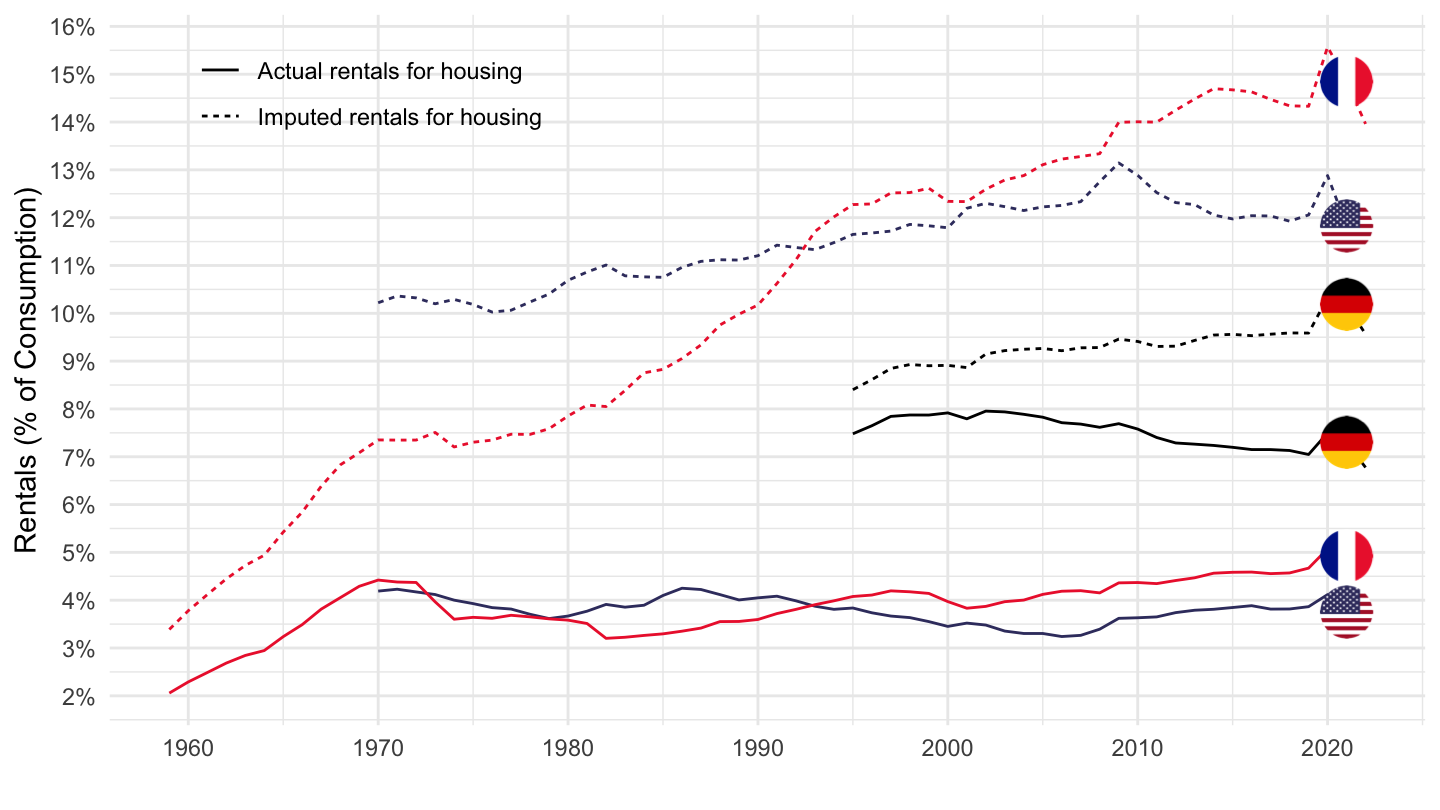
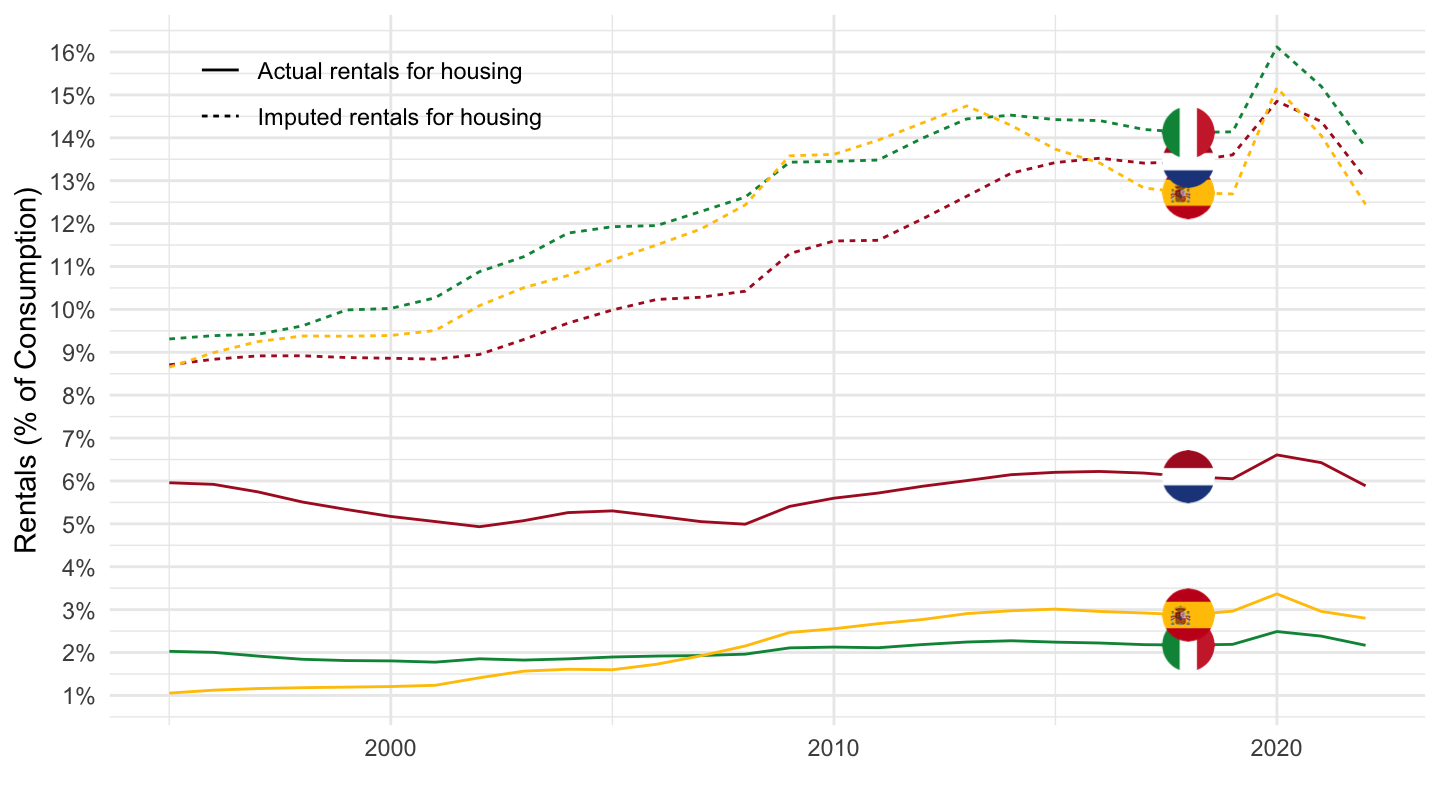
Italy, Spain, Netherlands
Code
SNA_TABLE5 %>%
  filter(TRANSACT %in% c("P31CP042", "P31DC", "P31CP041"),
         MEASURE == "C",
         LOCATION %in% c("ITA", "ESP", "NLD")) %>%
  left_join(SNA_TABLE5_var$LOCATION, by = "LOCATION") %>%
  left_join(SNA_TABLE5_var$TRANSACT, by = "TRANSACT") %>%
  year_to_date %>%
  group_by(date, LOCATION) %>%
  mutate(obsValue = obsValue /obsValue[TRANSACT == "P31DC"]) %>%
  filter(TRANSACT != "P31DC") %>%
  left_join(colors, by = c("Location" = "country")) %>%
  ggplot(.) + geom_line(aes(x = date, y = obsValue, color = color, linetype = Transact)) +
  scale_color_identity() + add_6flags + theme_minimal() +
  scale_x_date(breaks = seq(1920, 2025, 10) %>% paste0("-01-01") %>% as.Date,
               labels = date_format("%Y")) +
  scale_y_continuous(breaks = 0.01*seq(-7, 26, 1),
                     labels = scales::percent_format(accuracy = 1)) +
  theme(legend.position = c(0.2, 0.9),
        legend.title = element_blank()) +
  ylab("Rentals (% of Consumption)") + xlab("")