
Last observation: Q3 2026 (N = 90) · sept. 2026 (N = 115)
First observation: janv. 1975 (N = 48) · Q1 1975 (N = 18)
Last data update: 09 oct. 2026, 22:36
Last compile: 10 oct. 2026, 01:01
`ENQ-CONJ-IND-BAT` |>
  filter(INDICATEUR == "ECB_DREC_ENT",
         CORRECTION == "BRUT") |>

  quarter_to_date() |>
  arrange(desc(date)) |>
  mutate(OBS_VALUE = OBS_VALUE / 100) |>
  ggplot() + theme_minimal() + xlab("") + ylab("Difficultés de recrutement (%)") +
  geom_line(aes(x = date, y = OBS_VALUE, color = ACTIVITE_ECB)) +
  scale_x_date(breaks = seq(1960, 2100,5) |> paste0("-01-01") |> as.Date(),
               labels = date_format("%Y")) +
  theme(legend.position = c(0.15, 0.9),
        legend.title = element_blank()) +
  scale_y_continuous(breaks = 0.01*seq(-500, 200, 5),
                     labels = percent_format(accuracy = 1))
`ENQ-CONJ-IND-BAT` |>
  filter(INDICATEUR == "ECB_DREC_ENT",
         CORRECTION == "CVS") |>

  quarter_to_date() |>
  arrange(desc(date)) |>
  mutate(OBS_VALUE = OBS_VALUE / 100) |>
  ggplot() + theme_minimal() + xlab("") + ylab("Difficultés de recrutement (%)") +
  geom_line(aes(x = date, y = OBS_VALUE, color = ACTIVITE_ECB)) +
  scale_x_date(breaks = seq(1960, 2100,5) |> paste0("-01-01") |> as.Date(),
               labels = date_format("%Y")) +
  theme(legend.position = c(0.15, 0.9),
        legend.title = element_blank()) +
  scale_y_continuous(breaks = 0.01*seq(-500, 200, 5),
                     labels = percent_format(accuracy = 1))
`ENQ-CONJ-IND-BAT` |>
  filter(INDICATEUR %in% c("ECB_DMAN", "ECB_DQUA", "ECB_DSPE", "ECB_DTEC")) |>

  quarter_to_date() |>
  mutate(OBS_VALUE = OBS_VALUE / 100) |>
  ggplot() + theme_minimal() + xlab("") + ylab("Difficultés de recrutement (%)") +
  geom_line(aes(x = date, y = OBS_VALUE, color = INDICATEUR)) +
  scale_x_date(breaks = seq(1960, 2100,5) |> paste0("-01-01") |> as.Date(),
               labels = date_format("%Y")) +
  theme(legend.position = c(0.65, 0.9),
        legend.title = element_blank()) +
  scale_y_continuous(breaks = 0.01*seq(-500, 200, 5),
                     labels = percent_format(accuracy = 1))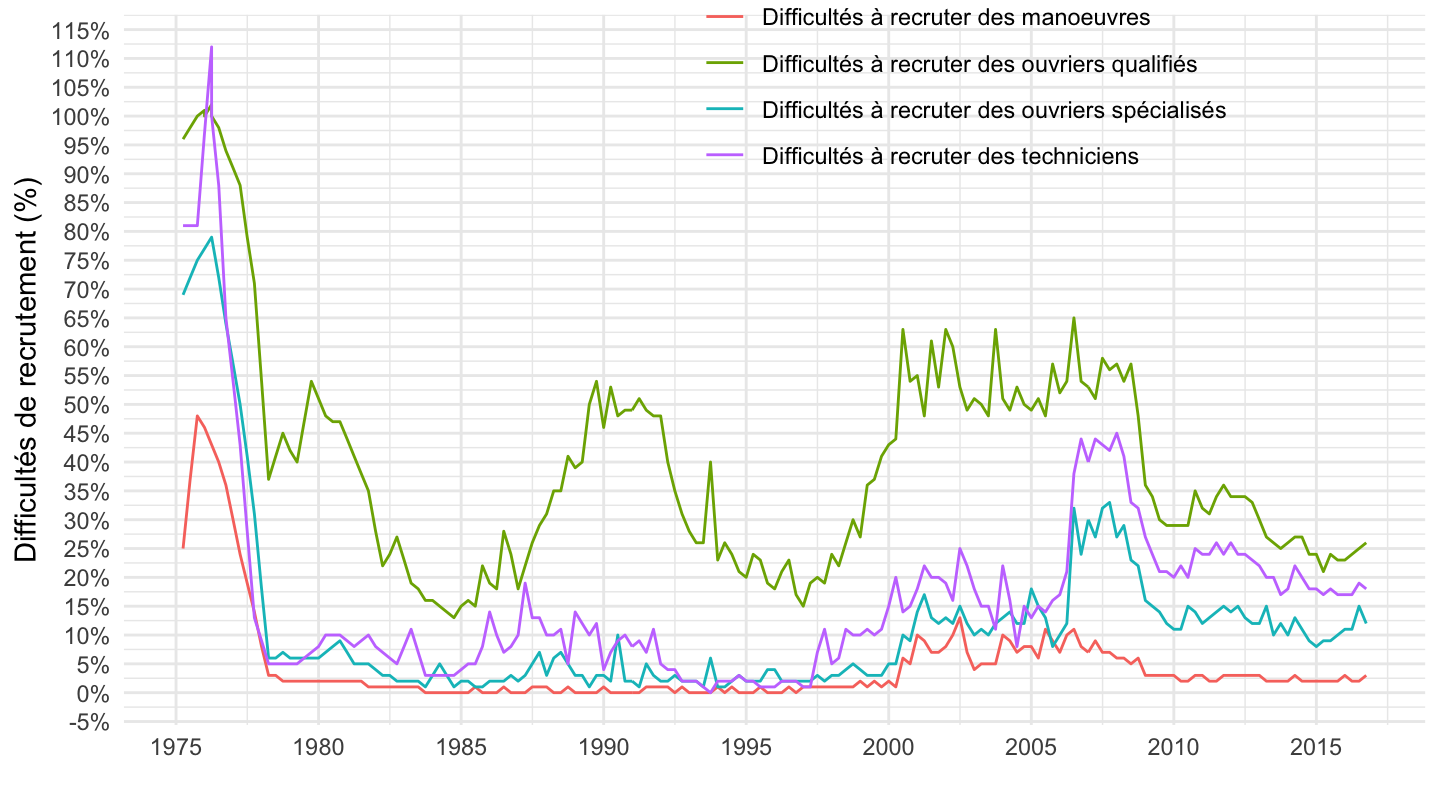
| source | dataset | Title | Updated |
|---|---|---|---|


