Last observation: 2024 (N = 76)
First observation: 2001 (N = 68)
Last data update: 01 août 2026, 21:10
Last compile: 09 oct. 2026, 21:42
ig_b("acpr", "ACPR_production_2022")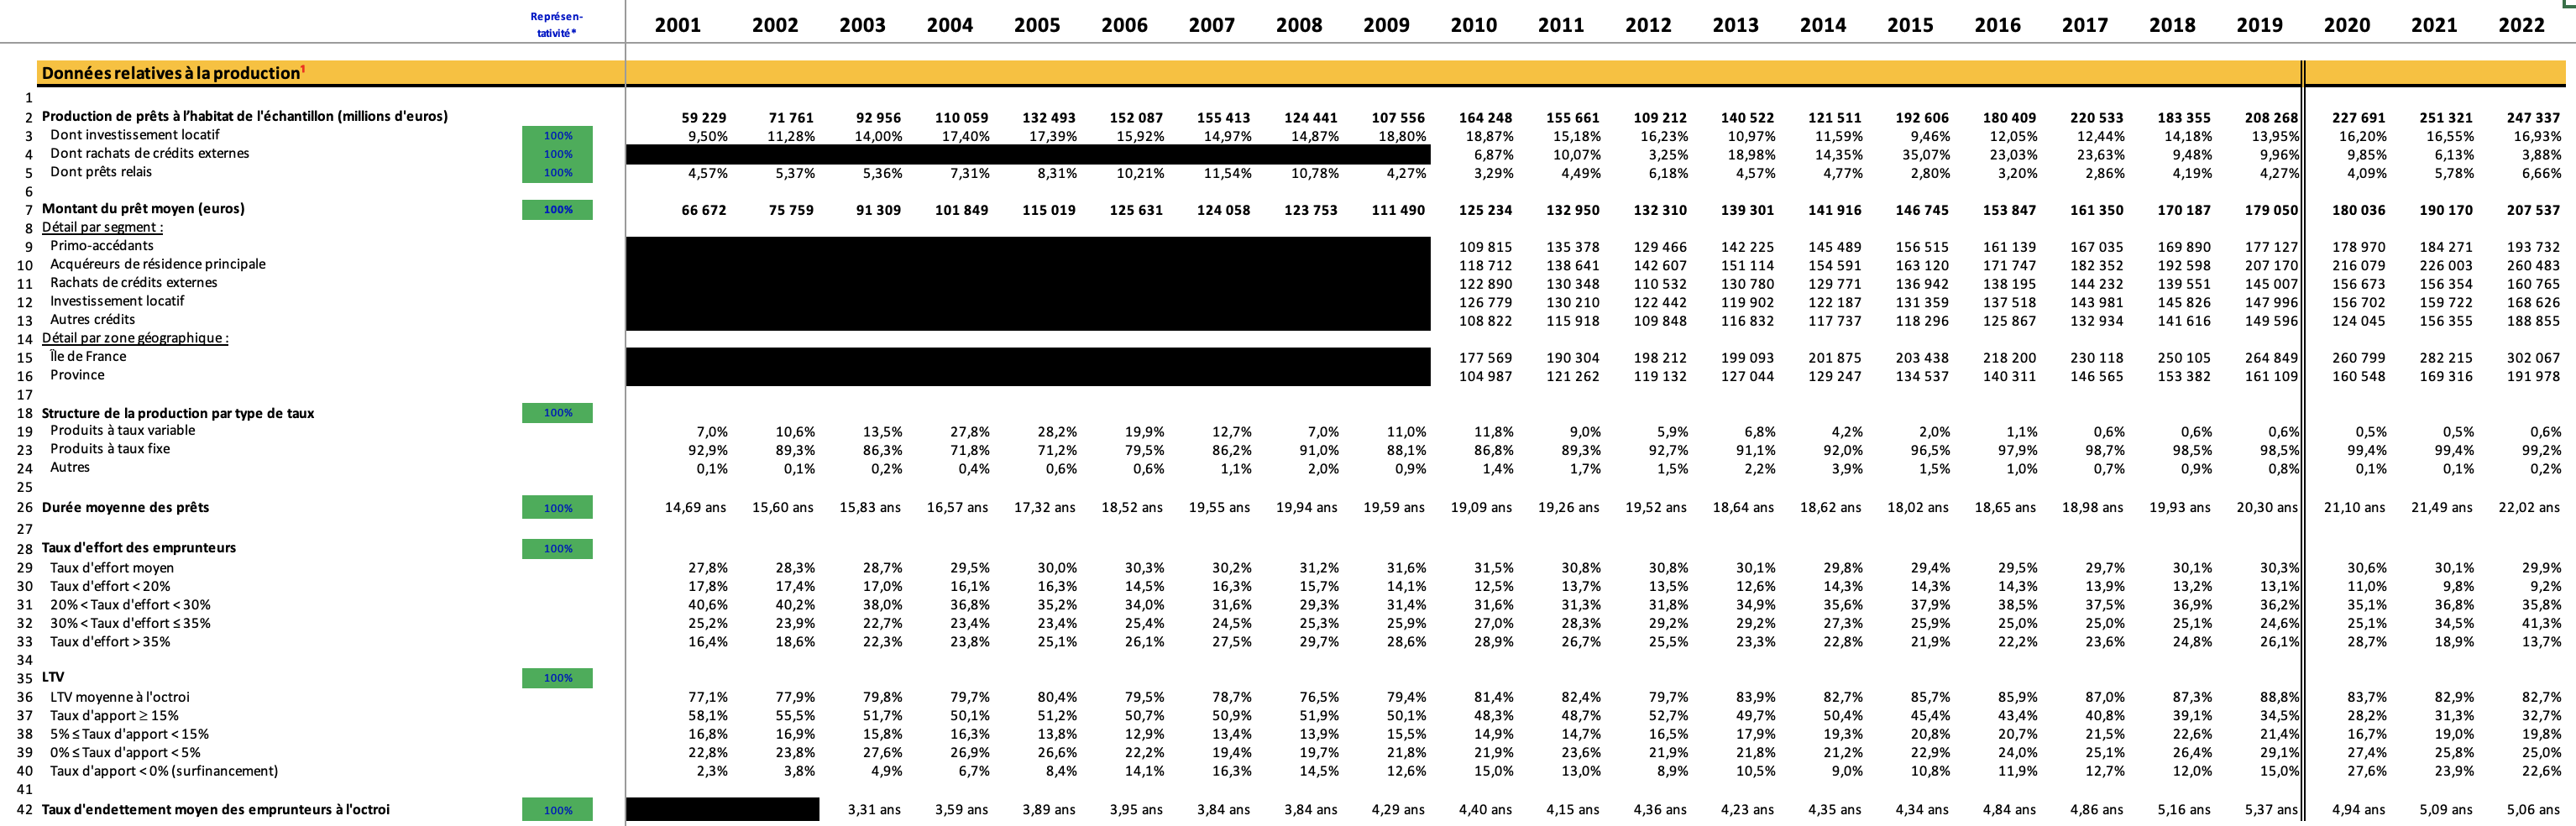
ig_b("acpr", "ACPR_encours_2022")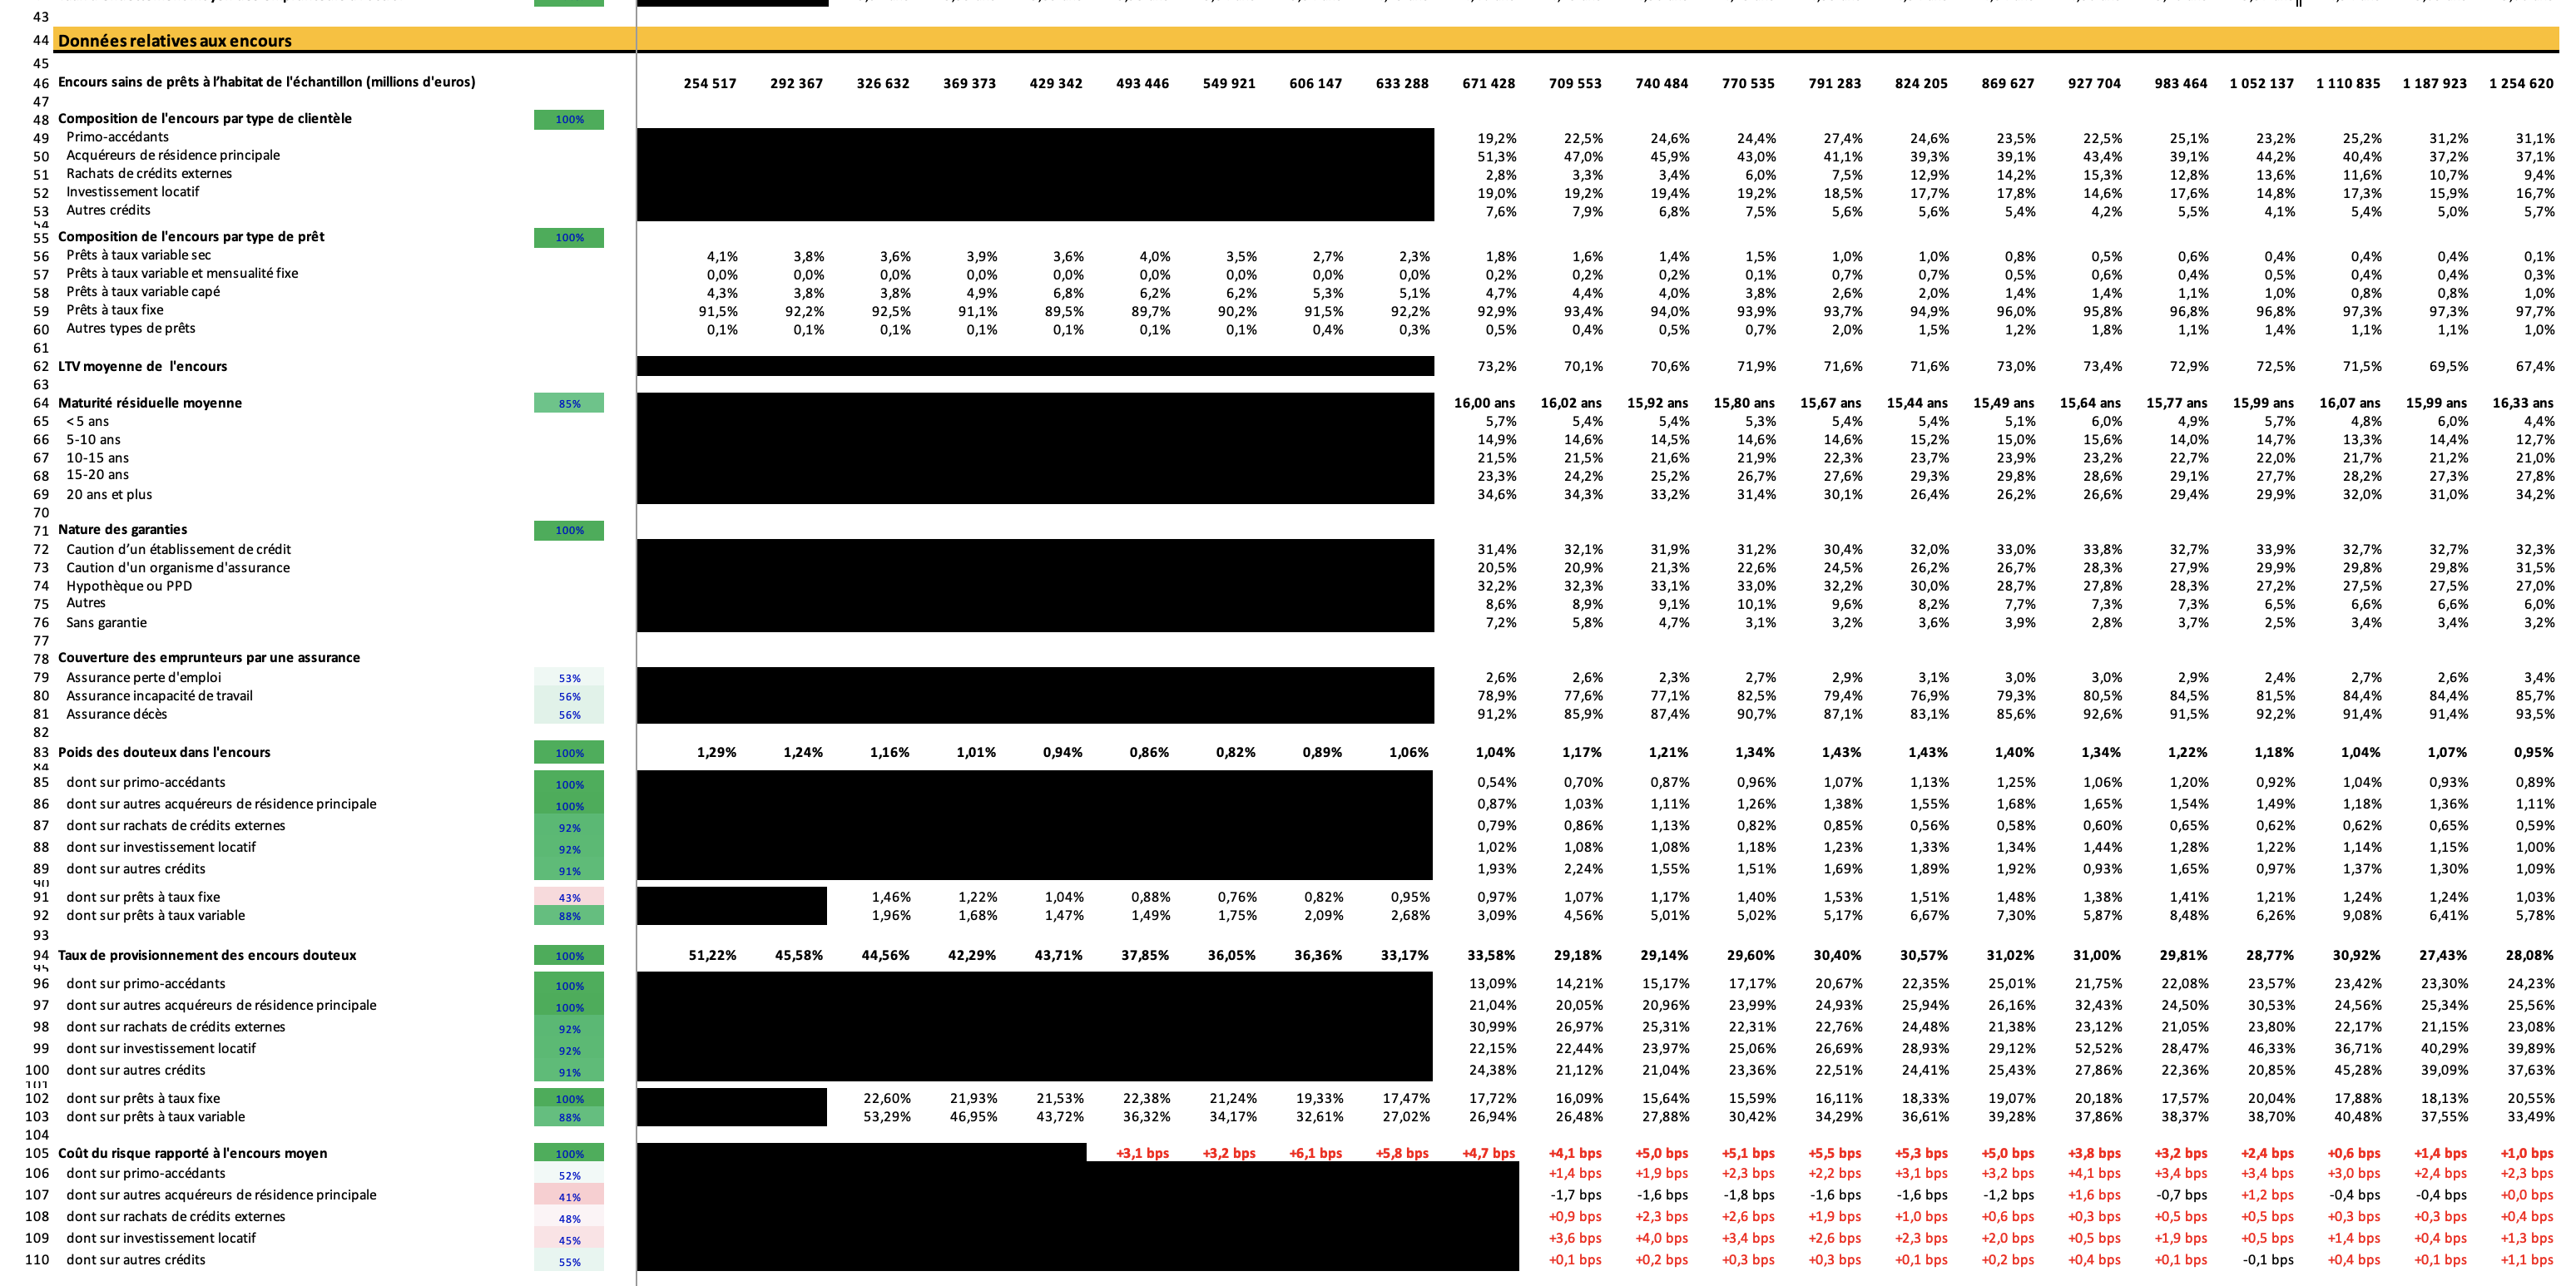
as174 |>
  group_by(Variable, Line) |>
  summarise(Nobs = n()) |>
  arrange(Line) |>
print_table_conditional()as174 |>
group_by(date) |>
summarise(Nobs = n()) |>
arrange(desc(date)) |>
print_table_conditional()| date | Nobs |
|---|---|
| 2024-12-31 | 76 |
| 2023-12-31 | 76 |
| 2022-12-31 | 76 |
| 2021-12-31 | 76 |
| 2020-12-31 | 76 |
| 2019-12-31 | 76 |
| 2018-12-31 | 76 |
| 2017-12-31 | 76 |
| 2016-12-31 | 76 |
| 2015-12-31 | 76 |
| 2014-12-31 | 76 |
| 2013-12-31 | 76 |
| 2012-12-31 | 76 |
| 2011-12-31 | 76 |
| 2010-12-31 | 76 |
| 2009-12-31 | 68 |
| 2008-12-31 | 68 |
| 2007-12-31 | 68 |
| 2006-12-31 | 68 |
| 2005-12-31 | 68 |
| 2004-12-31 | 68 |
| 2003-12-31 | 68 |
| 2002-12-31 | 68 |
| 2001-12-31 | 68 |
as174 |>
  mutate(year = year(date)) |>
  select(-date) |>
  filter(year %in% c("2001", "2010", "2016", "2022")) |>
  spread(year, value) |>
print_table_conditional()as174 |>
mutate(year = year(date)) |>
select(-date) |>
filter(year %in% c("2022")) |>
spread(year, value) |>
print_table_conditional()as174 |>
filter(Line %in% c(7, 12)) |>
filter(value >0) |>
ggplot() + geom_line(aes(x = date, y = value, color = Variable)) +
xlab("") + ylab("") + theme_minimal() +
scale_x_date(breaks = seq(1920, 2100, 2) |> paste0("-01-01") |> as.Date(),
labels = date_format("%Y")) +
scale_y_continuous(breaks = 1000*seq(0, 500, 20),
labels = dollar_format(acc = 1, pre = "")) +
theme(legend.position = c(0.35, 0.9),
legend.title = element_blank())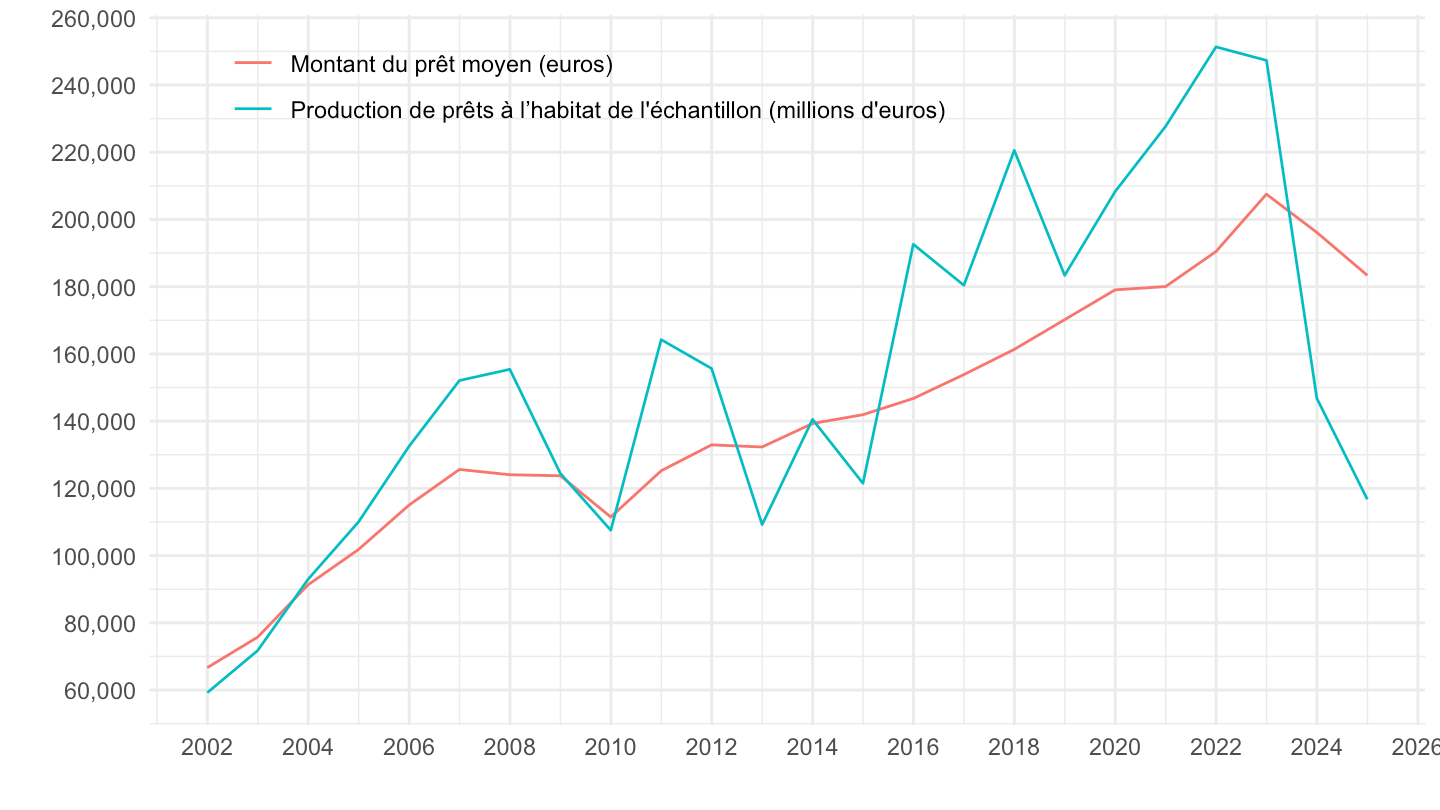
as174 |>
  filter(Line %in% 8:10) |>
  filter(value >0) |>
  ggplot() + geom_line(aes(x = date, y = value, color = Variable)) +
  xlab("") + ylab("") + theme_minimal() +
  scale_x_date(breaks = seq(1920, 2100, 2) |> paste0("-01-01") |> as.Date(),
               labels = date_format("%Y")) +
  scale_y_continuous(breaks = 0.01*seq(0, 100, 2),
                     labels = scales::percent_format(accuracy = 1)) +
  theme(legend.position = c(0.3, 0.8),
        legend.title = element_blank())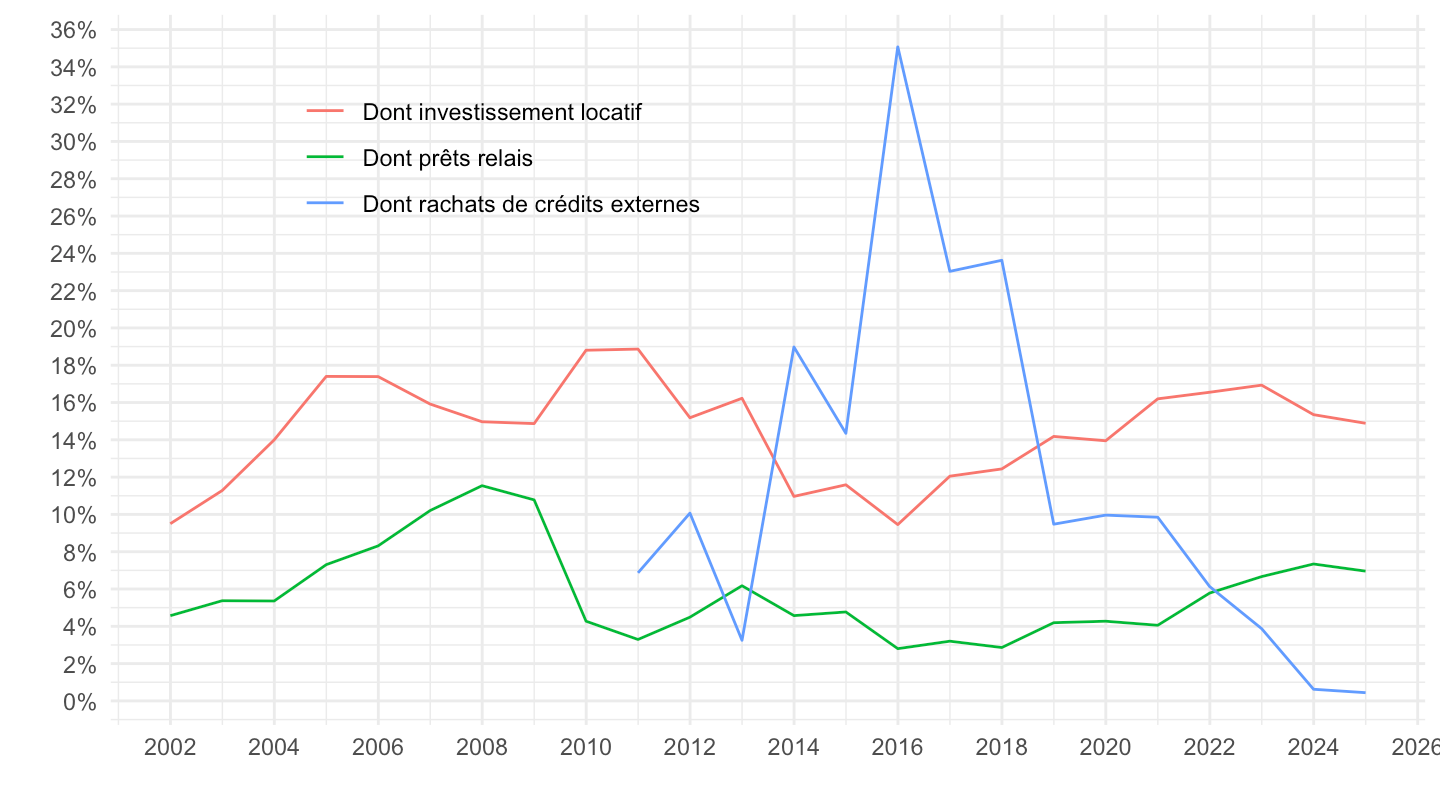
as174 |>

  filter(Line %in% 14:18) |>
  filter(value >0) |>
  ggplot() + geom_line(aes(x = date, y = value, color = Variable)) +
  xlab("") + ylab("") + theme_minimal() +
  scale_x_date(breaks = seq(1920, 2100, 1) |> paste0("-01-01") |> as.Date(),
               labels = date_format("%Y")) +
  scale_y_continuous(breaks = 1000*seq(0, 500, 20),
                     labels = dollar_format(acc = 1, pre = "", su = "€")) +
  theme(legend.position = c(0.3, 0.8),
        legend.title = element_blank())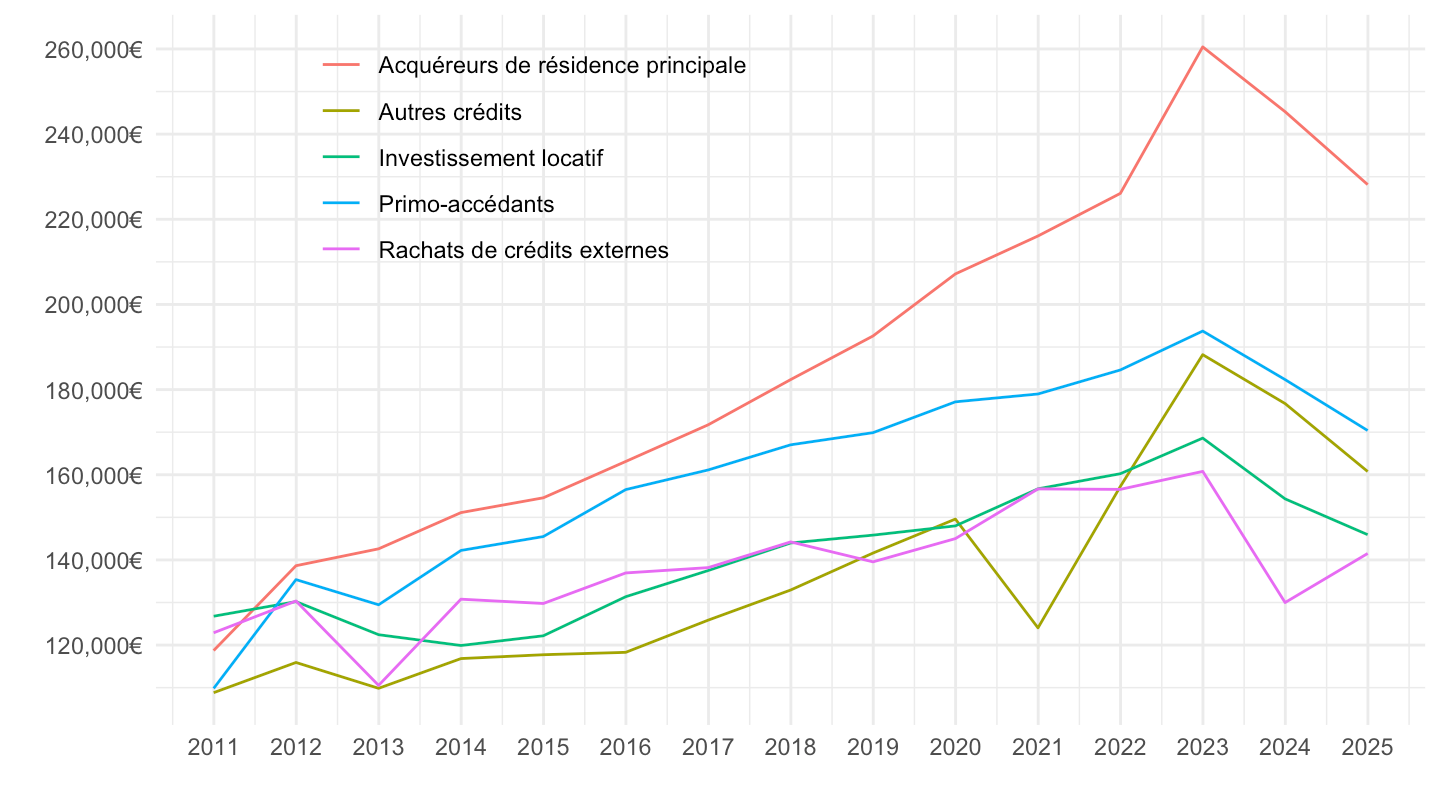
as174 |>

  filter(Line == 31) |>
  ggplot() + geom_line(aes(x = date, y = value)) +
  xlab("") + ylab("Durée moyenne des prêts") + theme_minimal() +
  scale_x_date(breaks = seq(1920, 2100, 2) |> paste0("-01-01") |> as.Date(),
               labels = date_format("%Y")) +
  scale_y_continuous(breaks = seq(0, 100, 1),
                     labels = dollar_format(a = 1, su = " ans", pre = ""))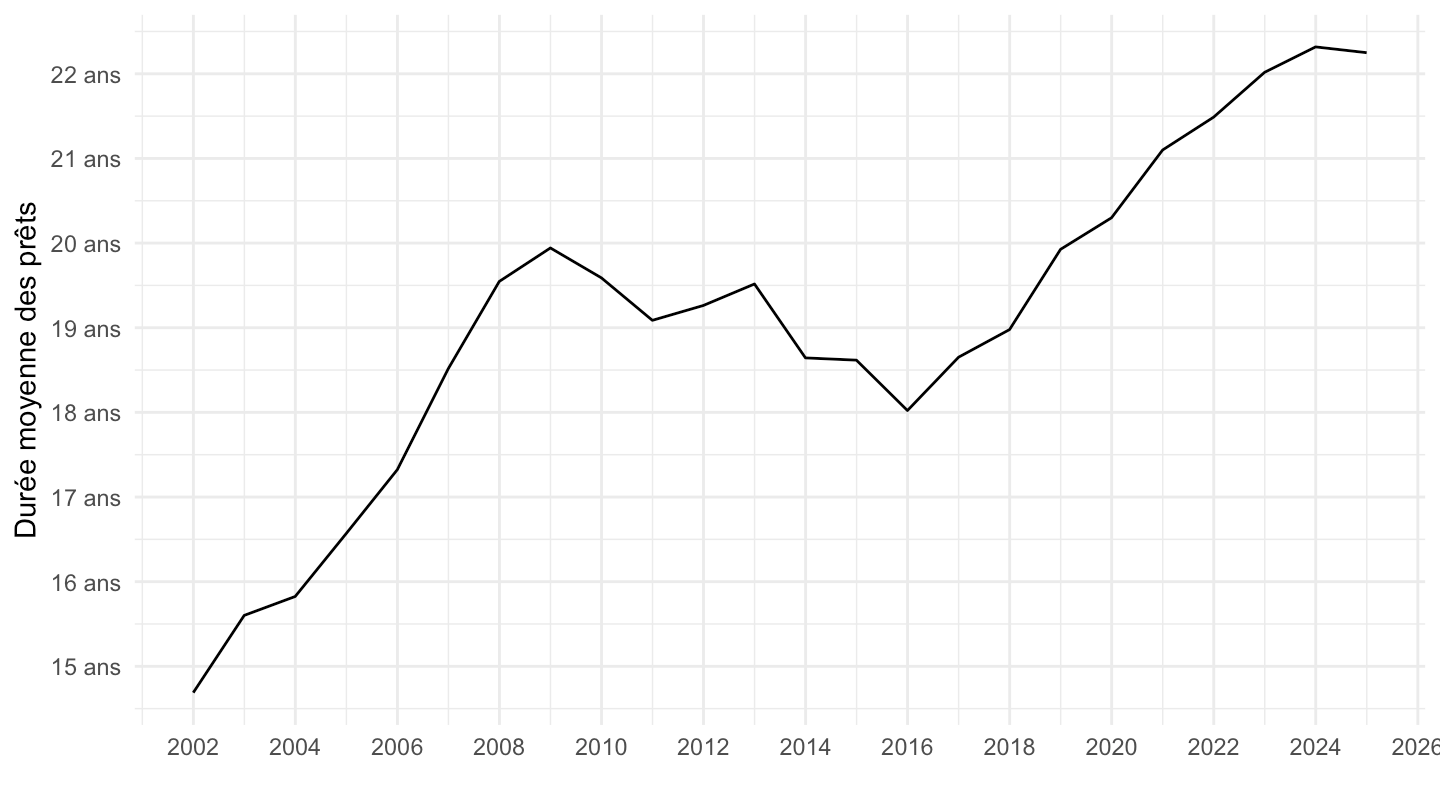
as174 |>

  filter(Line %in% c(24, 28)) |>
  filter(value >0) |>
  ggplot() + geom_line(aes(x = date, y = value, color = Variable)) +
  xlab("") + ylab("") + theme_minimal() +
  scale_x_date(breaks = seq(1920, 2100, 2) |> paste0("-01-01") |> as.Date(),
               labels = date_format("%Y")) +
  scale_y_continuous(breaks = 0.01*seq(0, 100, 10),
                     labels = scales::percent_format(accuracy = 1)) +
  theme(legend.position = c(0.8, 0.6),
        legend.title = element_blank())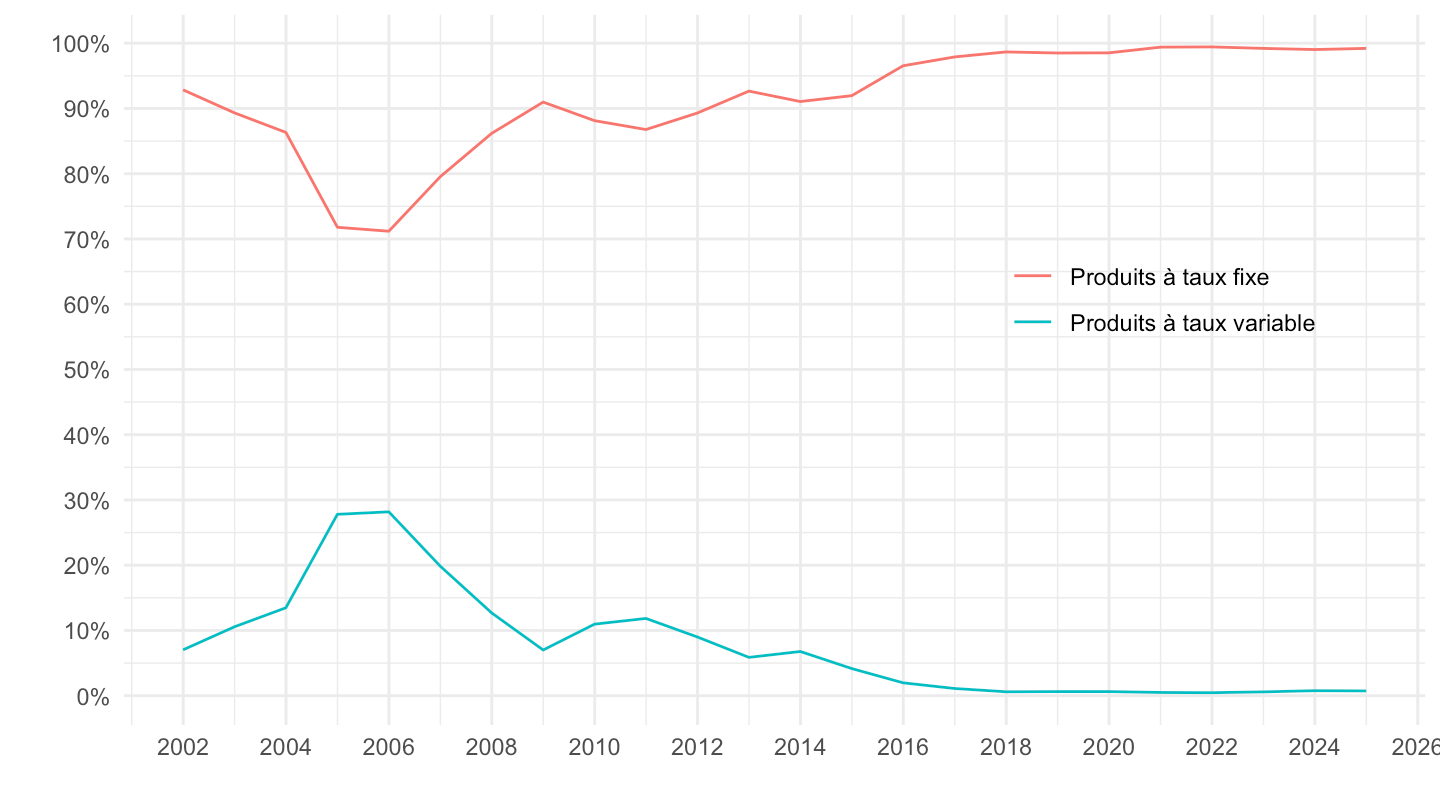
as174 |>

  filter(Line == 47) |>
  filter(value >0) |>
  ggplot() + geom_line(aes(x = date, y = value)) +

  xlab("") + ylab("Taux d'endettement moyen des emprunteurs à l'octroi") + theme_minimal() +
  scale_x_date(breaks = seq(1920, 2100, 2) |> paste0("-01-01") |> as.Date(),
               labels = date_format("%Y")) +
  scale_y_continuous(breaks = seq(0, 100, .2),
                     labels = dollar_format(a = .1, su = " ans", pre = ""))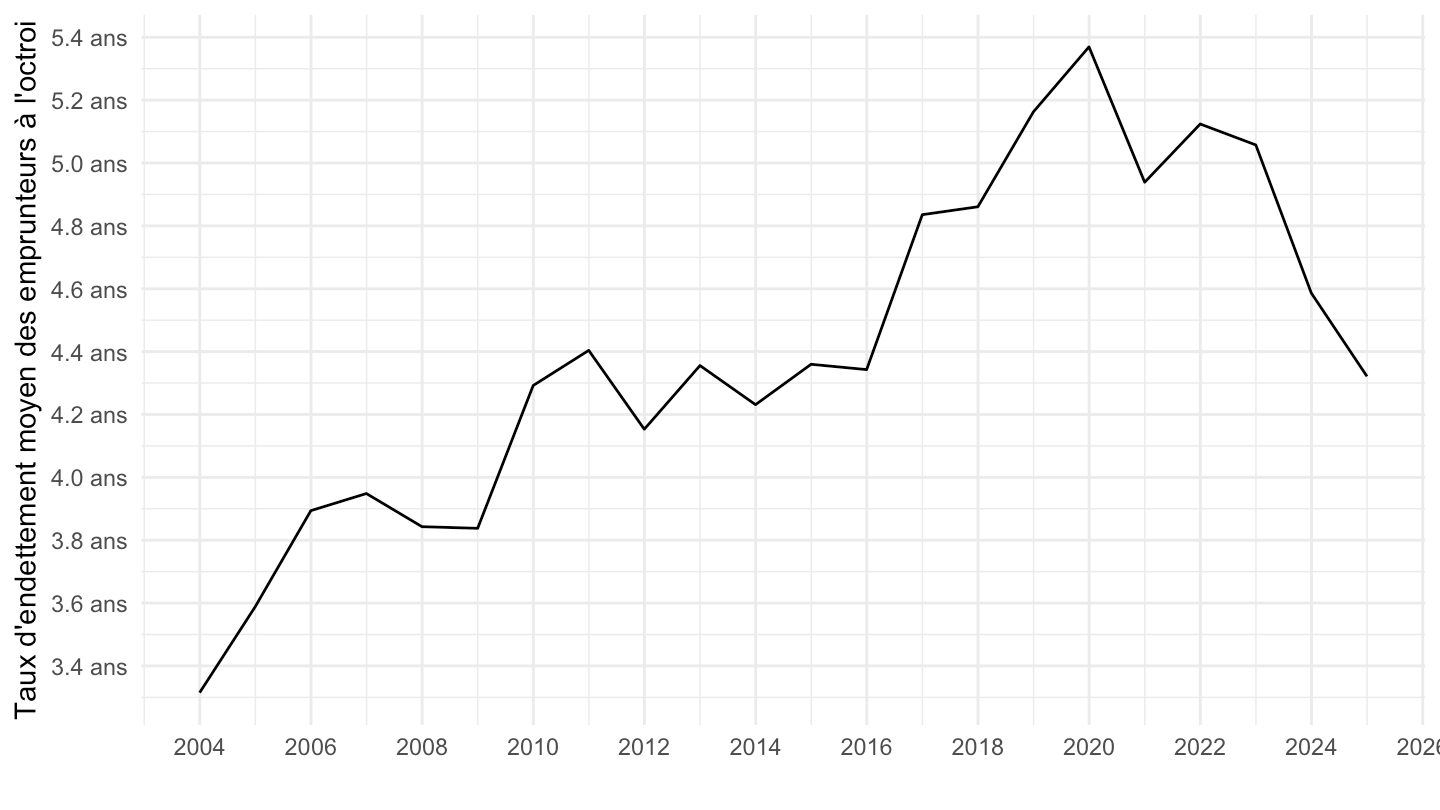
as174 |>

  filter(Line == 41) |>
  ggplot() + geom_line(aes(x = date, y = value)) +
  xlab("") + ylab("Taux d'effort moyen (%)") + theme_minimal() +
  scale_x_date(breaks = seq(1920, 2100, 2) |> paste0("-01-01") |> as.Date(),
               labels = date_format("%Y")) +
  scale_y_continuous(breaks = 0.01*seq(0, 100, 1),
                     labels = percent_format(a = 1))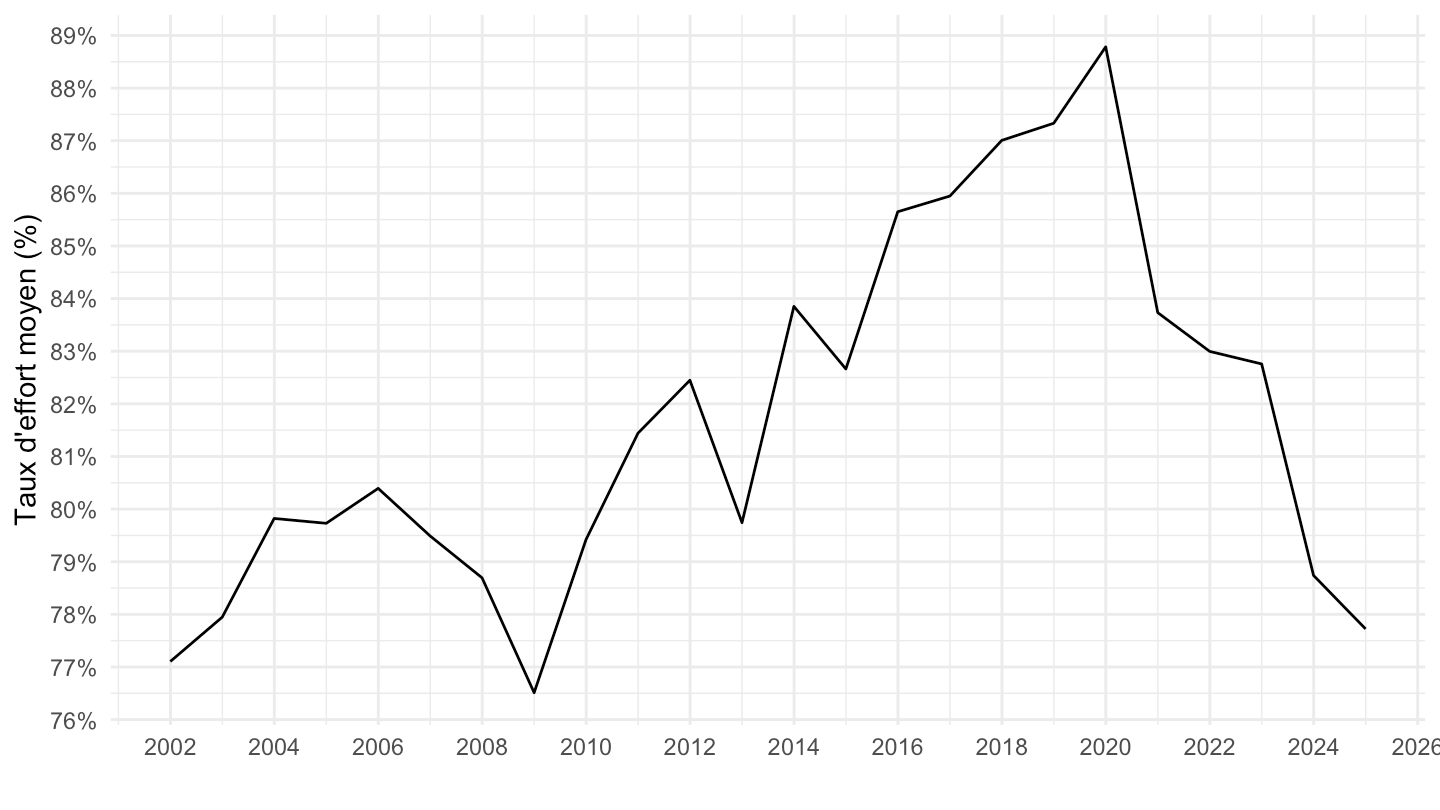
as174 |>

  filter(Line %in% 42:45) |>
  ggplot() + geom_line(aes(x = date, y = value, color = Variable)) +
  theme_minimal() + xlab("") + ylab("Taux d'apport (%)") +

  scale_y_continuous(breaks = 0.01*seq(0, 100, 5),
                     labels = scales::percent_format(accuracy = 1)) +
  scale_x_date(breaks = seq(1920, 2100, 2) |> paste0("-01-01") |> as.Date(),
               labels = date_format("%Y")) +
  theme(legend.position = c(0.8, 0.9),
        legend.title = element_blank())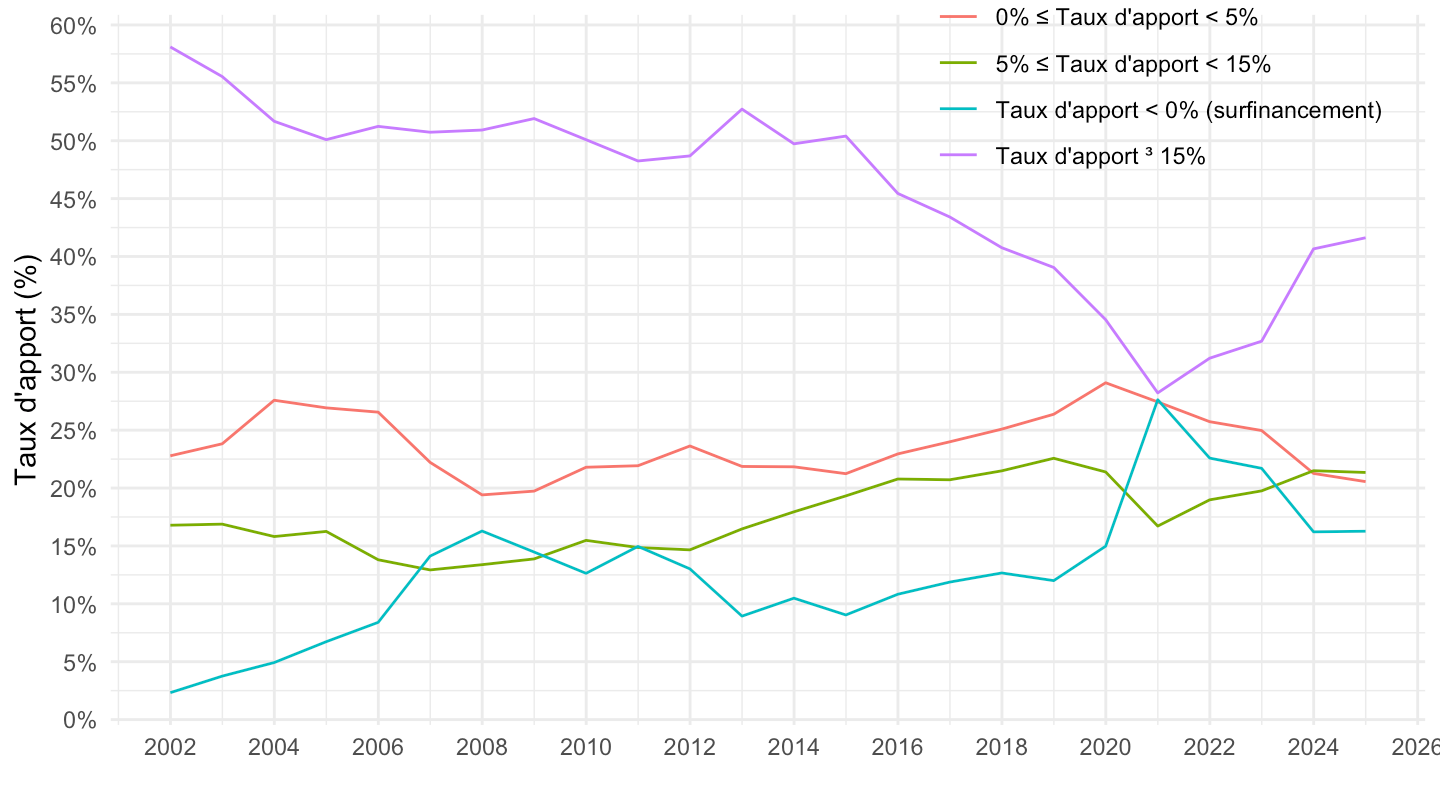
as174 |>

  filter(Line %in% 42:45) |>
  ggplot() + geom_line(aes(x = date, y = value, color = paste0(Line))) +
  annotate("text", x = as.Date("2006-12-31"), y = 0.55, label= "Apport > 15% ", color = viridis(5)[1]) +
  annotate("text", x = as.Date("2016-12-31"), y = 0.17, label= "5% < Apport < 15%", color = viridis(5)[2]) +
  annotate("text", x = as.Date("2015-12-31"), y = 0.27, label= "0% < Apport < 5%", color = viridis(5)[3]) +
  annotate("text", x = as.Date("2017-12-31"), y = 0.08, label= "Apport < 0% ", color = viridis(5)[4]) +
  theme_minimal() + xlab("") + ylab("Part des emprunteurs (%)") +

  scale_y_continuous(breaks = 0.01*seq(0, 100, 5),
                     labels = scales::percent_format(accuracy = 1)) +
  scale_x_date(breaks = seq(1920, 2100, 2) |> paste0("-01-01") |> as.Date(),
               labels = date_format("%Y")) +
  theme(legend.position = "none")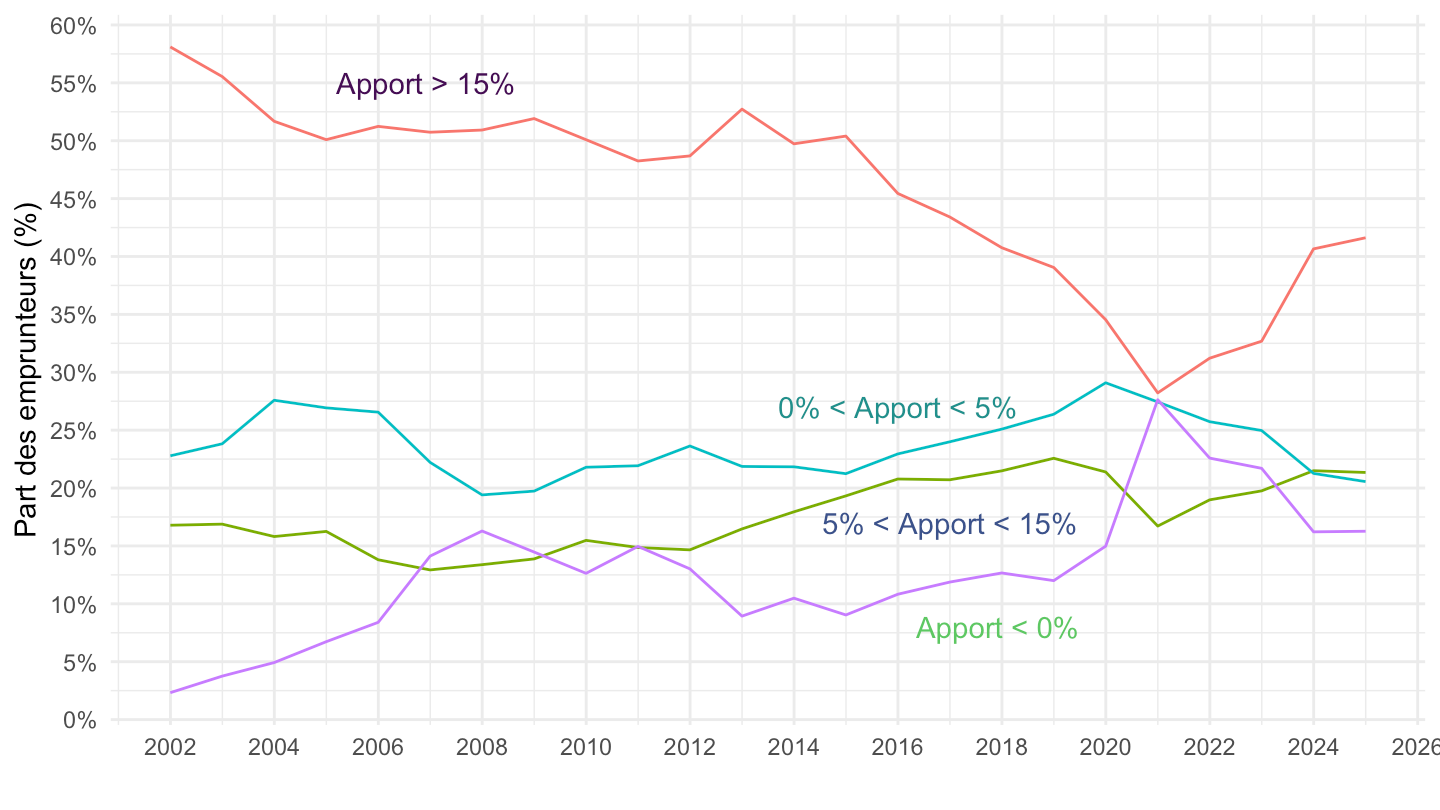
as174 |>

  filter(Line == 34) |>
  ggplot() + geom_line(aes(x = date, y = value)) +

  xlab("") + ylab("Taux d'effort moyen (%)") + theme_minimal() +
  scale_x_date(breaks = seq(1920, 2100, 2) |> paste0("-01-01") |> as.Date(),
               labels = date_format("%Y")) +
  scale_y_continuous(breaks = 0.01*seq(0, 100, 1),
                     labels = percent_format(a = 1))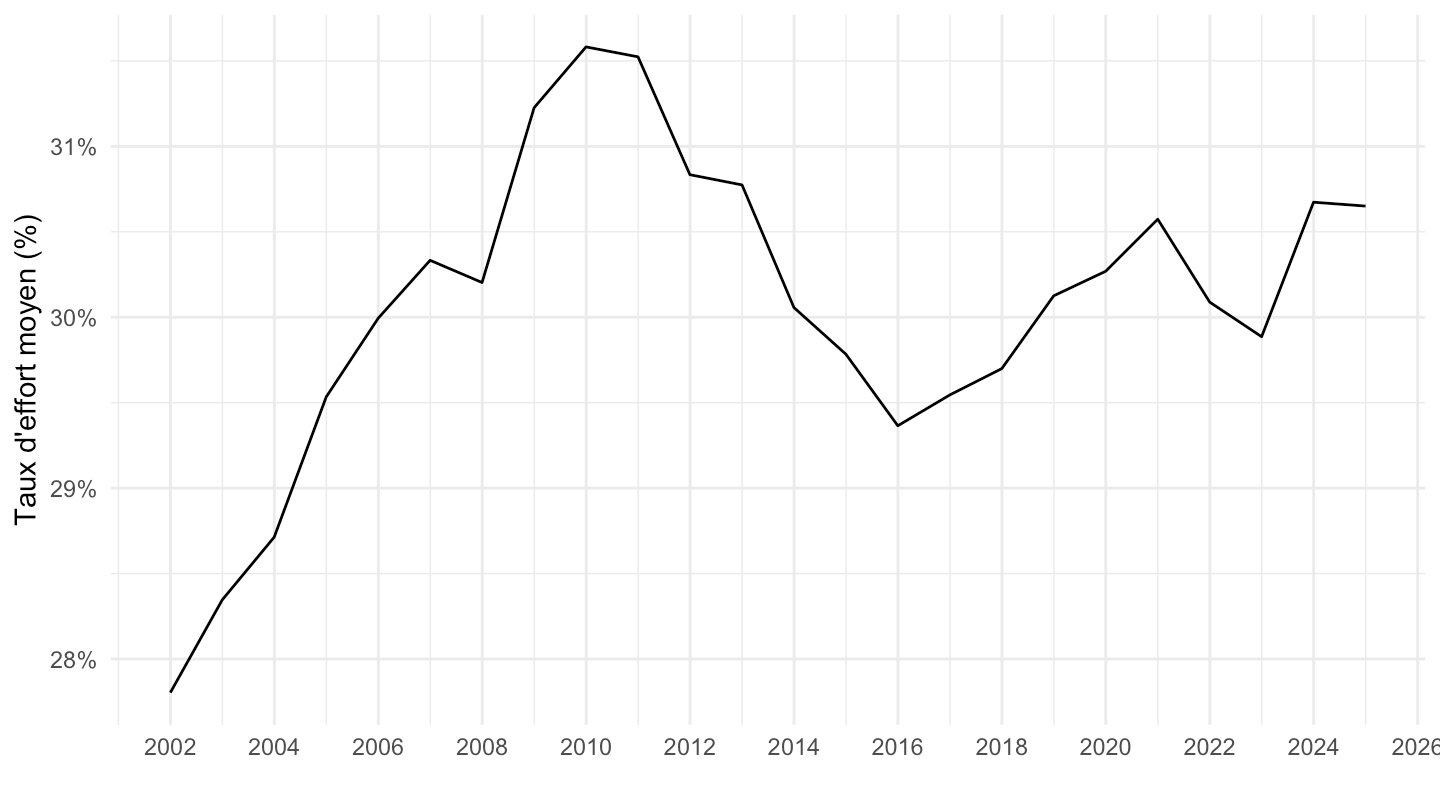
as174 |>

  filter(Line %in% c(35:38)) |>
  mutate(Variable = factor(Variable,
                           levels=c("Taux d'effort < 20%",
                                    "20% < Taux d'effort < 30%",
                                    "30% < Taux d'effort ≤ 35%",
                                    "Taux d'effort > 35%"))) |>
  ggplot() + geom_line(aes(x = date, y = value, color = Variable)) +
  theme_minimal() + xlab("") + ylab("Part des emprunteurs (%)") +

  scale_y_continuous(breaks = 0.01*seq(0, 100, 5),
                     labels = scales::percent_format(accuracy = 1)) +
  scale_x_date(breaks = seq(1920, 2100, 2) |> paste0("-01-01") |> as.Date(),
               labels = date_format("%Y")) +
  theme(legend.position = c(0.5, 0.9),
        legend.title = element_blank())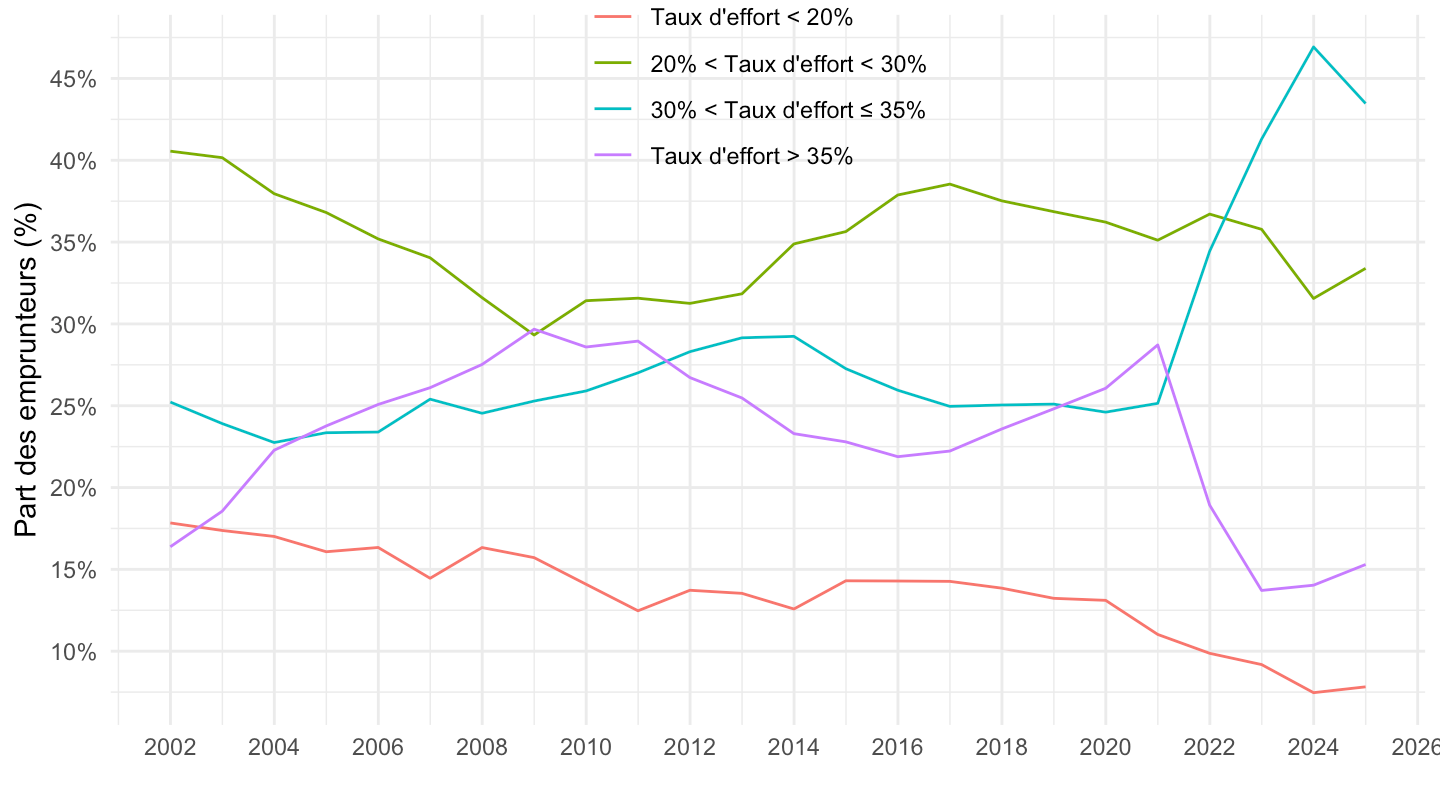
as174 |>

  filter(Line %in% c(35:38)) |>
  mutate(Variable = factor(Variable,
                           levels=c("Taux d'effort < 20%",
                                    "20% < Taux d'effort < 30%",
                                    "30% < Taux d'effort ≤ 35%",
                                    "Taux d'effort > 35%"))) |>
  ggplot() + geom_line(aes(x = date, y = value, color = Variable)) +
  theme_minimal() + xlab("") + ylab("Part des emprunteurs (%)") +

  scale_y_continuous(breaks = 0.01*seq(0, 100, 5),
                     labels = scales::percent_format(accuracy = 1)) +
  scale_x_date(breaks = seq(1920, 2100, 2) |> paste0("-01-01") |> as.Date(),
               labels = date_format("%Y")) +
  theme(legend.position = c(0.5, 0.9),
        legend.title = element_blank())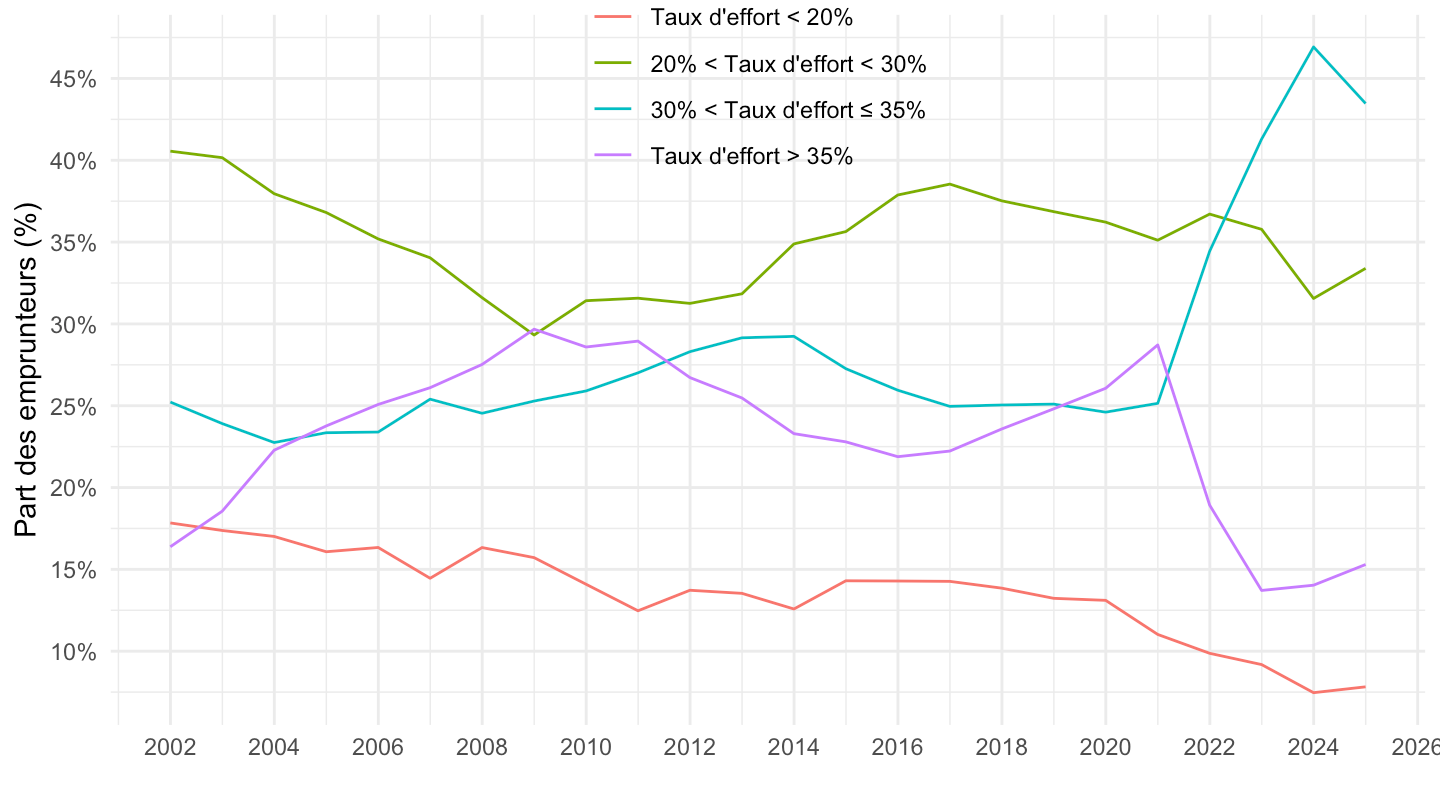
as174 |>

  filter(Line %in% c(96, 97, 88)) |>
  filter(value >0) |>
  ggplot() + geom_line(aes(x = date, y = value, color = Variable)) +
  xlab("") + ylab("") + theme_minimal() +
  scale_x_date(breaks = seq(1920, 2100, 2) |> paste0("-01-01") |> as.Date(),
               labels = date_format("%Y")) +
  scale_y_continuous(breaks = 0.01*seq(0, 100, 1),
                     labels = scales::percent_format(accuracy = 1)) +
  theme(legend.position = c(0.2, 0.9),
        legend.title = element_blank())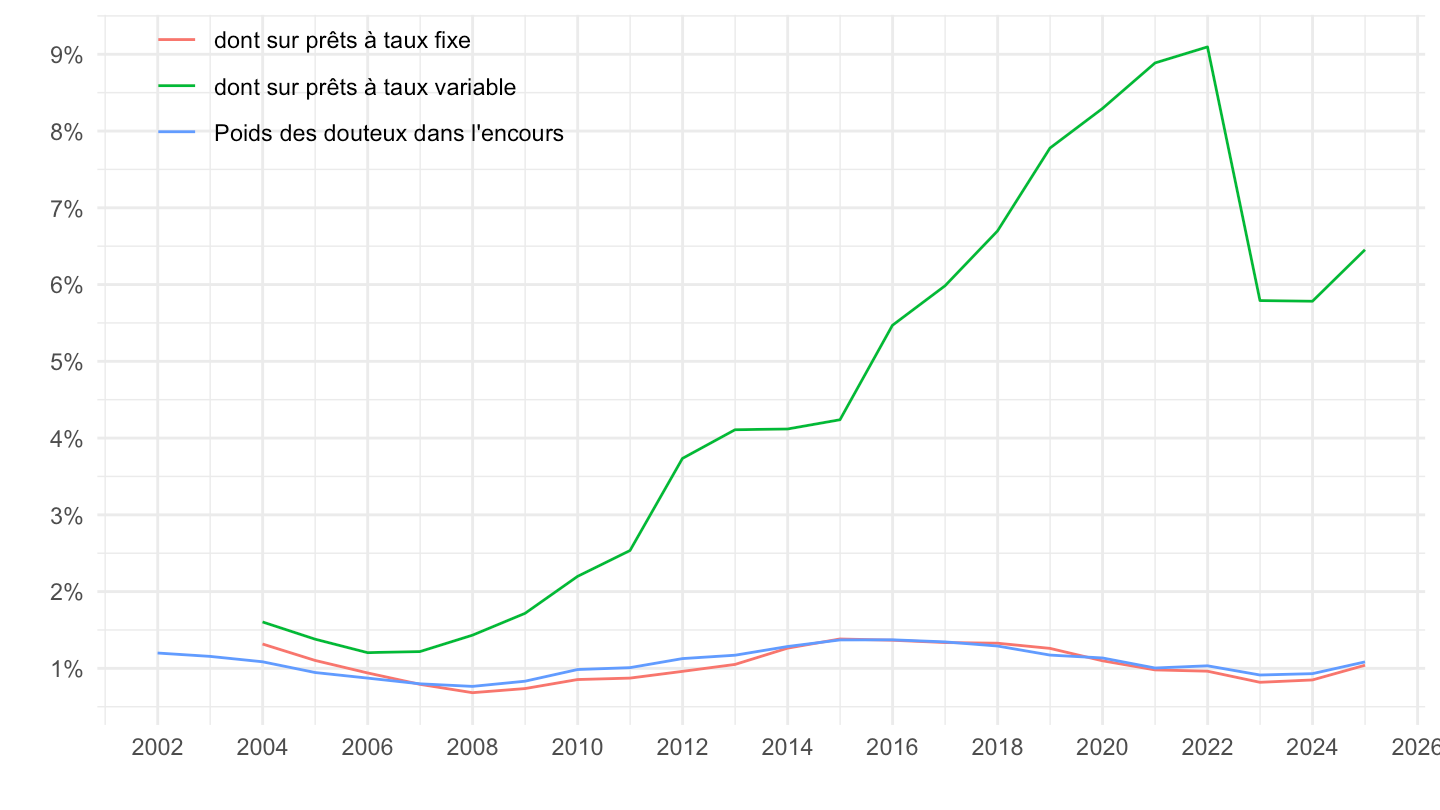
as174 |>

  filter(date >= as.Date("2010-01-01")) |>
  filter(Line %in% c(31, 69)) |>
  ggplot() + geom_line(aes(x = date, y = value, color = Variable)) +
  xlab("") + ylab("Durée moyenne des prêts, maturité résiduelle") + theme_minimal() +
  scale_x_date(breaks = seq(1920, 2100, 2) |> paste0("-01-01") |> as.Date(),
               labels = date_format("%Y")) +
  scale_y_continuous(breaks = seq(0, 100, 1),
                     labels = dollar_format(a = 1, su = " ans", pre = "")) +
  theme(legend.position = c(0.3, 0.9),
        legend.title = element_blank())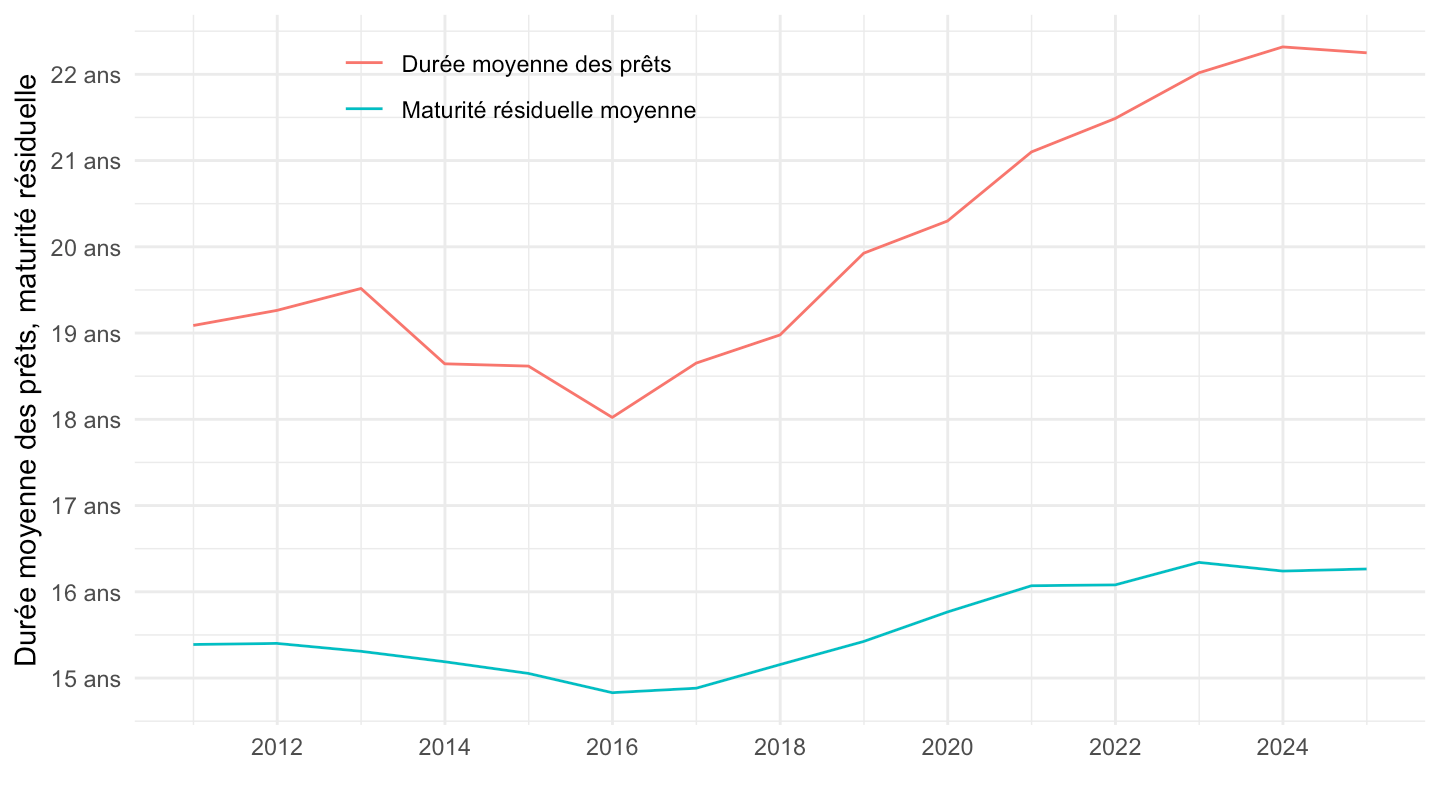
as174 |>

  filter(date >= as.Date("2010-01-01")) |>
  filter(Line %in% c(41,67)) |>
  ggplot() + geom_line(aes(x = date, y = value, color = Variable)) +
  xlab("") + ylab("LTV") + theme_minimal() +
  scale_x_date(breaks = seq(1920, 2100, 2) |> paste0("-01-01") |> as.Date(),
               labels = date_format("%Y")) +
  scale_y_continuous(breaks = 0.01*seq(0, 100, 1),
                     labels = percent_format(a = 1)) +
  theme(legend.position = c(0.3, 0.9),
        legend.title = element_blank())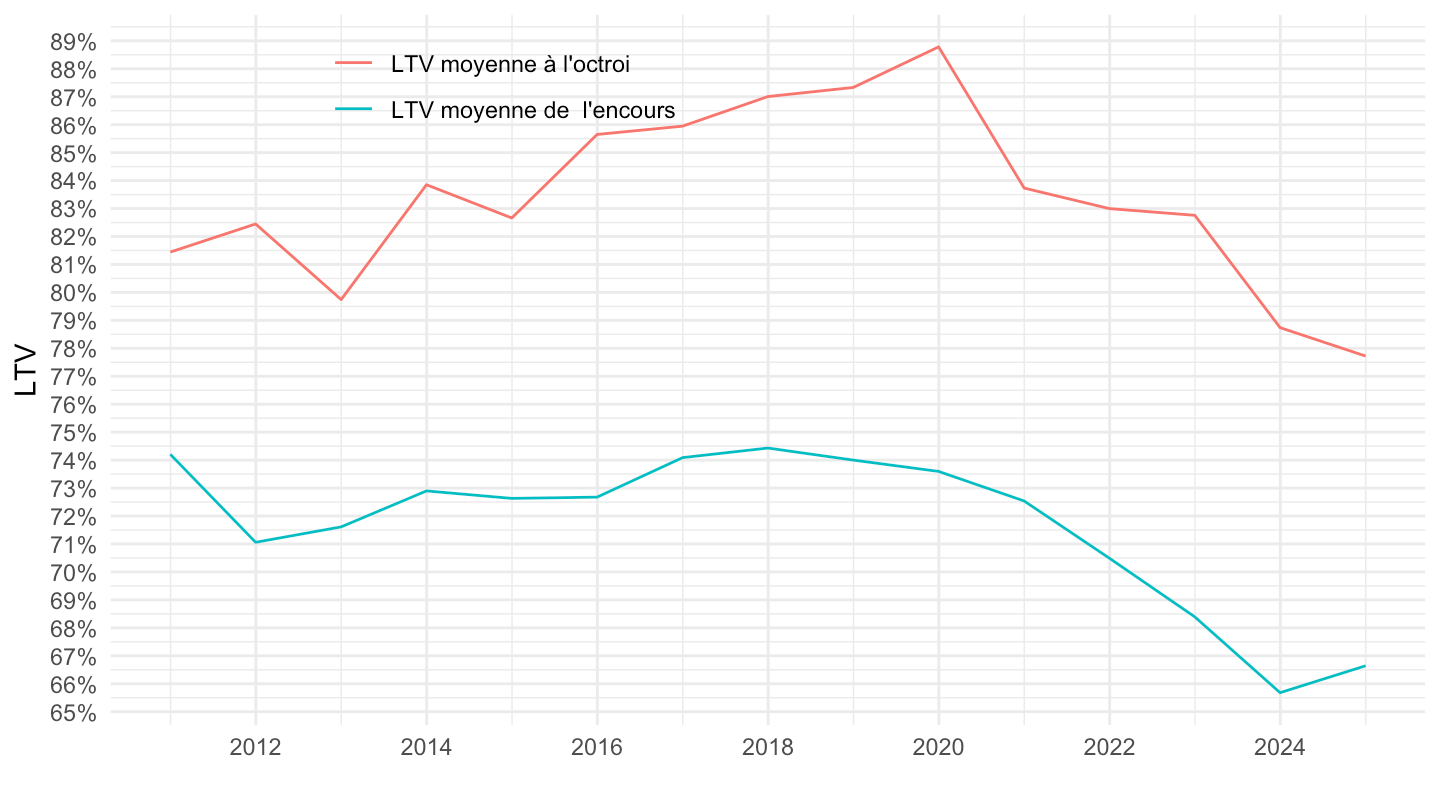
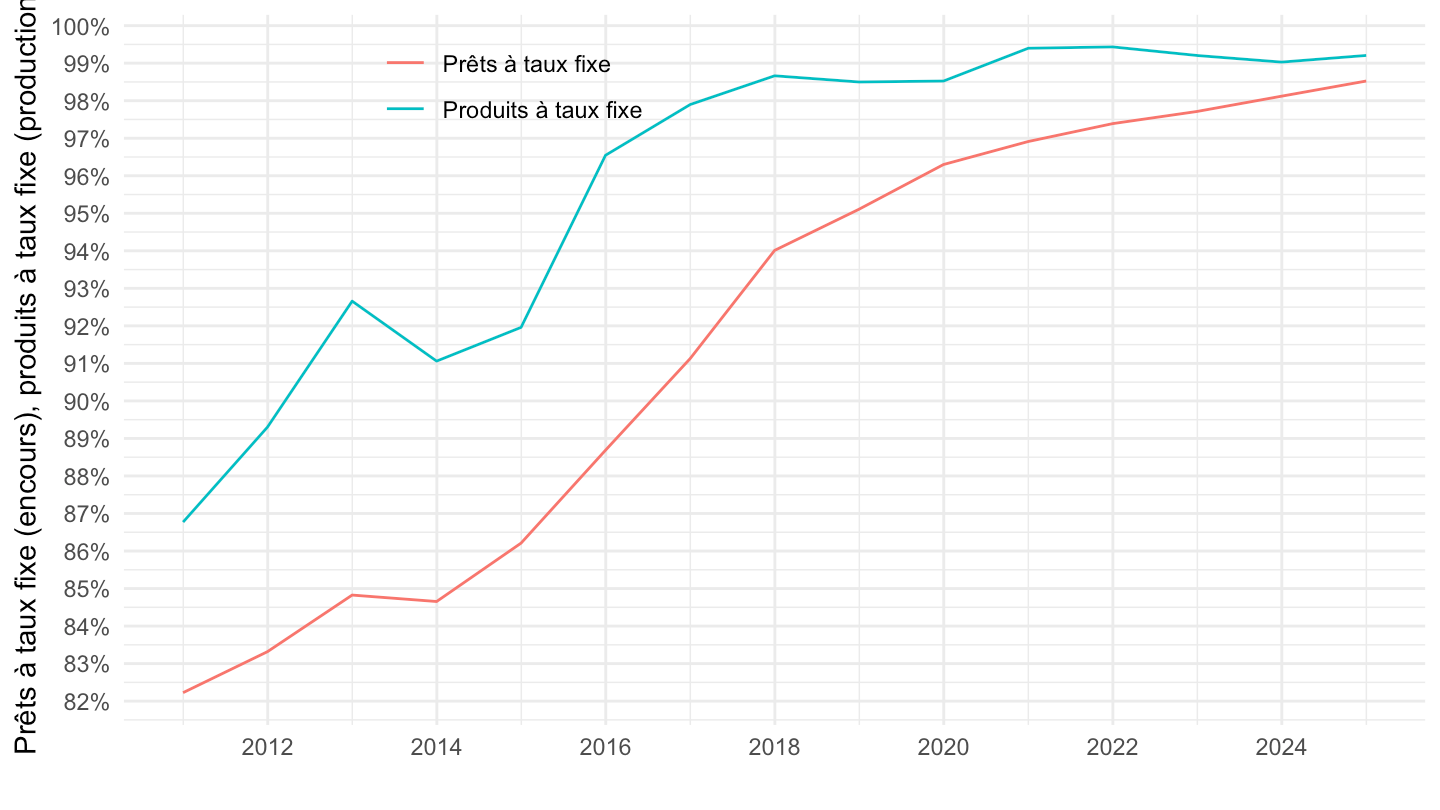
as174 |>

  filter(date >= as.Date("2010-01-01")) |>
  filter(Line %in% c(28,64)) |>
  ggplot() + geom_line(aes(x = date, y = value, color = Variable)) +
  xlab("") + ylab("Prêts à taux fixe (encours), produits à taux fixe (production)") + theme_minimal() +
  scale_x_date(breaks = seq(1920, 2100, 2) |> paste0("-01-01") |> as.Date(),
               labels = date_format("%Y")) +
  scale_y_continuous(breaks = 0.01*seq(0, 100, 1),
                     labels = percent_format(a = 1)) +
  theme(legend.position = c(0.3, 0.9),
        legend.title = element_blank())