| source | dataset | Title | .html | .rData |
|---|---|---|---|---|
| bis | XRU_D | Exchange Rates, Daily | 2026-07-25 | 2026-07-25 |
| bdf | EXR | Exchange Rate | 2026-07-24 | 2026-07-24 |
| bis | EER | Real Effective Exchange Rates, Monthly | 2026-07-25 | 2026-07-25 |
| bis | EER_D | Real Effective Exchange Rates, Daily | 2026-07-25 | 2026-07-25 |
| bis | XRU | Exchange Rates | 2026-07-25 | 2026-07-25 |
| ecb | EXR | Exchange Rates | 2026-07-24 | 2026-07-24 |
| eurostat | ert_bil_eur_d | Euro/ECU exchange rates - daily data | 2026-07-23 | 2026-07-14 |
| eurostat | ert_h_eur_d | Former euro area national currencies vs. euro/ECU - daily data | 2026-07-23 | 2025-05-24 |
| fred | xrates | Exchange Rates | 2026-07-24 | 2026-07-24 |
| gfd | xrates | Exchange Rates | 2026-04-04 | 2021-01-08 |
| oecd | REFSERIES_MSIT | Exchange rates | 2024-09-15 | 2025-05-24 |
| oecd | SNA_TABLE4 | PPPs and exchange rates | 2024-09-15 | 2025-05-24 |
| wdi | PA.NUS.FCRF | Official exchange rate (LCU per USD, period average) | 2026-07-25 | 2026-07-24 |
Exchange Rates, Daily - XRU_D
Data - BIS
Info
Data on xrates
Data on monetary policy
| source | dataset | Title | .html | .rData |
|---|---|---|---|---|
| bdf | FM | Marché financier, taux | 2026-07-24 | 2026-07-24 |
| bdf | MIR | Taux d'intérêt - Zone euro | 2026-07-24 | 2026-07-24 |
| bdf | MIR1 | Taux d'intérêt - France | 2026-07-24 | 2026-07-24 |
| bis | CBPOL | Policy Rates, Daily | 2026-07-25 | 2026-07-25 |
| ecb | BSI | Balance Sheet Items | 2026-07-24 | 2026-07-23 |
| ecb | BSI_PUB | Balance Sheet Items - Published series | 2026-07-24 | 2026-07-24 |
| ecb | FM | Financial market data | 2026-07-24 | 2026-07-24 |
| ecb | ILM | Internal Liquidity Management | 2026-07-24 | 2026-07-24 |
| ecb | ILM_PUB | Internal Liquidity Management - Published series | 2026-07-24 | 2026-07-24 |
| ecb | MIR | MFI Interest Rate Statistics | 2026-07-24 | 2026-07-24 |
| ecb | RAI | Risk Assessment Indicators | 2026-07-24 | 2026-07-24 |
| ecb | SUP | Supervisory Banking Statistics | 2026-07-24 | 2026-07-24 |
| ecb | YC | Financial market data - yield curve | 2026-07-24 | 2026-07-23 |
| ecb | YC_PUB | Financial market data - yield curve - Published series | 2026-07-24 | 2026-07-24 |
| ecb | liq_daily | Daily Liquidity | 2026-07-24 | 2026-07-24 |
| eurostat | ei_mfir_m | Interest rates - monthly data | 2026-07-23 | 2026-07-23 |
| eurostat | irt_st_m | Money market interest rates - monthly data | 2026-07-24 | 2026-07-23 |
| fred | r | Interest Rates | 2026-07-24 | 2026-07-24 |
| oecd | MEI | Main Economic Indicators | 2026-07-24 | 2025-07-24 |
| oecd | MEI_FIN | Monthly Monetary and Financial Statistics (MEI) | 2024-09-15 | 2025-07-24 |
LAST_DOWNLOAD
| LAST_DOWNLOAD |
|---|
| NA |
LAST_COMPILE
| LAST_COMPILE |
|---|
| 2026-07-26 |
Last
| date | Nobs |
|---|---|
| 2024-04-16 | 63 |
REF_AREA
Code
XRU_D %>%
  left_join(REF_AREA, by = "REF_AREA") %>%
  group_by(REF_AREA, Ref_area) %>%
  summarise(Nobs = n()) %>%
  arrange(-Nobs) %>%
  mutate(Flag = gsub(" ", "-", str_to_lower(Ref_area)),
         Flag = paste0('<img src="../../icon/flag/vsmall/', Flag, '.png" alt="Flag">')) %>%
  select(Flag, everything()) %>%
  {if (is_html_output()) datatable(., filter = 'top', rownames = F, escape = F) else .}
COLLECTION
Code
XRU_D %>%
  left_join(COLLECTION, by = "COLLECTION") %>%
  group_by(COLLECTION, Collection) %>%
  summarise(Nobs = n()) %>%
  arrange(-Nobs) %>%
{if (is_html_output()) print_table(.) else .}| COLLECTION | Collection | Nobs |
|---|---|---|
| A | Average of observations through period | 1016630 |
FREQ
Code
XRU_D %>%
  left_join(FREQ, by = "FREQ") %>%
  group_by(FREQ, Freq) %>%
  summarise(Nobs = n()) %>%
  arrange(-Nobs) %>%
{if (is_html_output()) print_table(.) else .}| FREQ | Freq | Nobs |
|---|---|---|
| D | Daily | 1016630 |
CURRENCY
Code
XRU_D %>%
  left_join(CURRENCY, by = "CURRENCY") %>%
  group_by(CURRENCY, Currency) %>%
  summarise(Nobs = n()) %>%
  arrange(-Nobs) %>%
  print_table_conditional()
Germany, France, Italy, Spain
All-
Code
XRU_D %>%
  filter(REF_AREA %in% c("DE", "FR", "IT", "ES")) %>%
  left_join(REF_AREA, by = "REF_AREA") %>%
  left_join(colors, by = c("Ref_area" = "country")) %>%
  mutate(OBS_VALUE = as.numeric(OBS_VALUE)) %>%
  ggplot(.) + geom_line(aes(x = date, y = OBS_VALUE, color = color)) +
  theme_minimal() + xlab("") + ylab("1 USD in National Currency") +
  scale_x_date(breaks = seq(1940, 2100, 5) %>% paste0("-01-01") %>% as.Date,
               labels = date_format("%Y")) +
  scale_y_log10(breaks = seq(0, 10, 0.2),
                     labels = dollar_format(accuracy = 0.1, prefix = "", suffix = "../$")) +
  scale_color_identity() + add_flags +
  theme(legend.position = c(0.8, 0.80),
        legend.title = element_blank())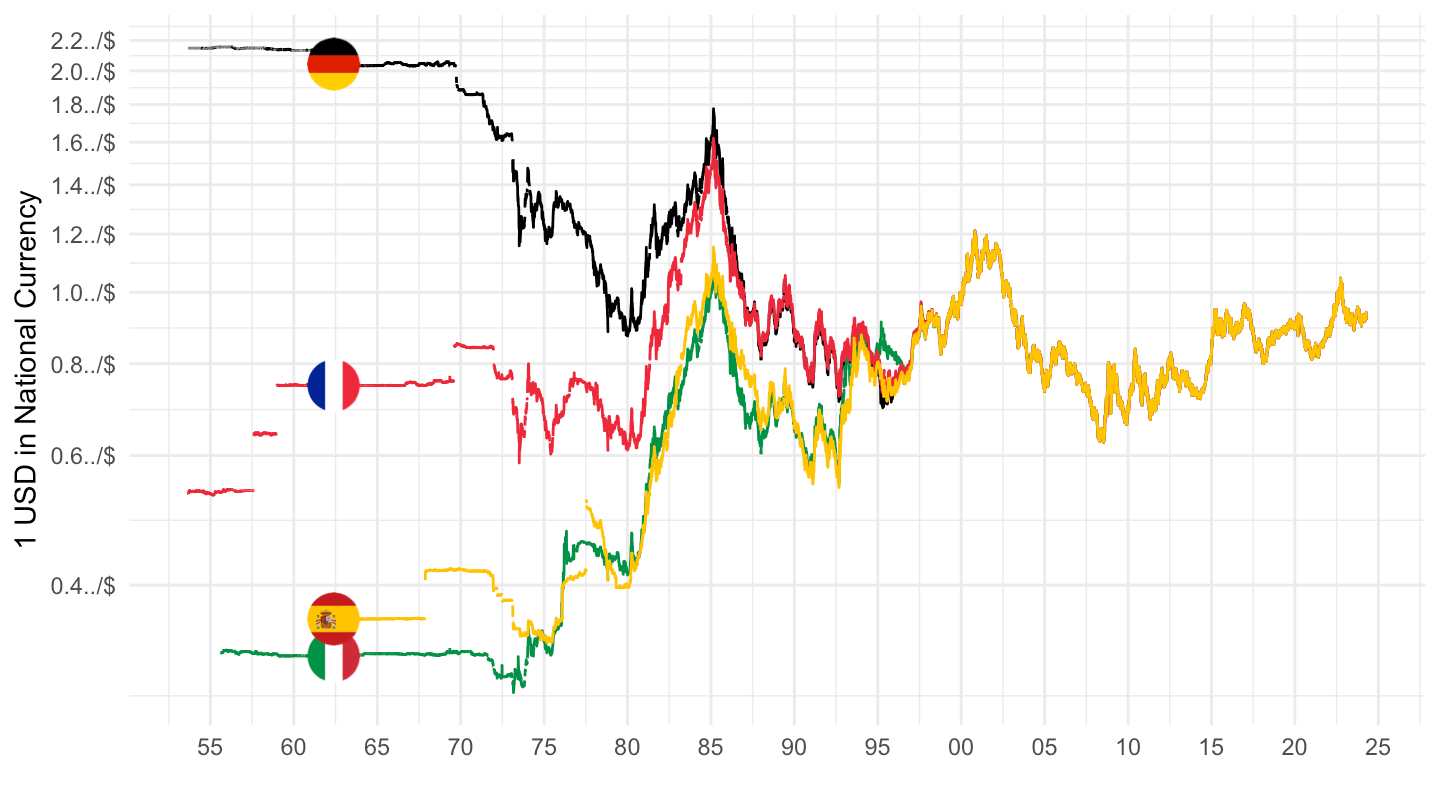
1970-
Code
XRU_D %>%
  filter(REF_AREA %in% c("DE", "FR", "IT", "ES")) %>%
  left_join(REF_AREA, by = "REF_AREA") %>%
  left_join(colors, by = c("Ref_area" = "country")) %>%
  mutate(OBS_VALUE = as.numeric(OBS_VALUE)) %>%
  filter(date >= as.Date("1970-01-01")) %>%
  ggplot(.) + geom_line(aes(x = date, y = OBS_VALUE, color = color)) +
  theme_minimal() + xlab("") + ylab("1 USD in National Currency") +
  scale_x_date(breaks = seq(1940, 2100, 5) %>% paste0("-01-01") %>% as.Date,
               labels = date_format("%Y")) +
  scale_y_log10(breaks = seq(0, 10, 0.2),
                     labels = dollar_format(accuracy = 0.1, prefix = "", suffix = "../$")) +
  scale_color_identity() + add_flags +
  theme(legend.position = c(0.8, 0.80),
        legend.title = element_blank())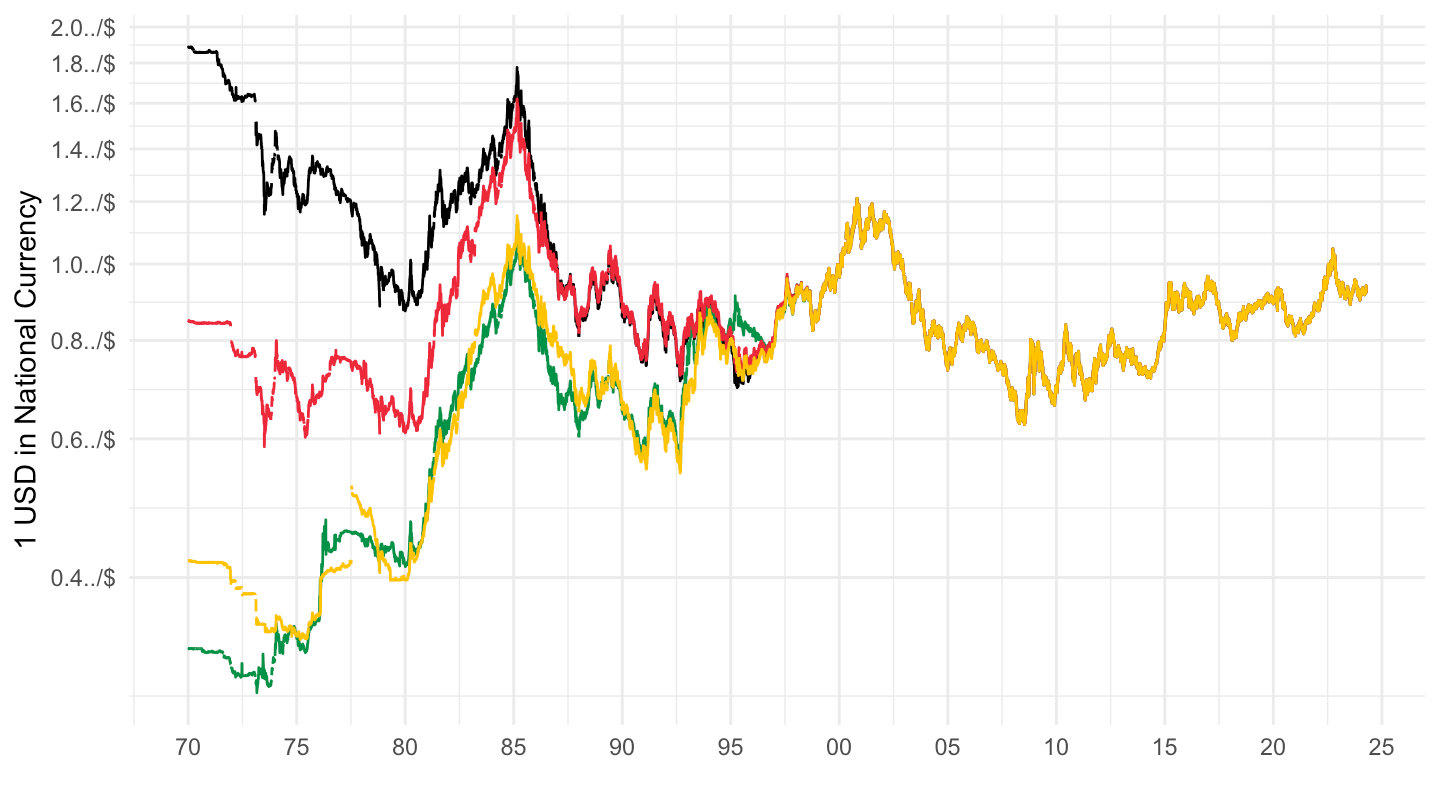
1980-
Code
XRU_D %>%
  filter(REF_AREA %in% c("DE", "FR", "IT", "ES")) %>%
  left_join(REF_AREA, by = "REF_AREA") %>%
  left_join(colors, by = c("Ref_area" = "country")) %>%
  mutate(OBS_VALUE = as.numeric(OBS_VALUE)) %>%
  filter(date >= as.Date("1980-01-01")) %>%
  ggplot(.) + geom_line(aes(x = date, y = OBS_VALUE, color = color)) +
  theme_minimal() + xlab("") + ylab("1 USD in National Currency") +
  scale_x_date(breaks = seq(1940, 2100, 5) %>% paste0("-01-01") %>% as.Date,
               labels = date_format("%Y")) +
  scale_y_log10(breaks = seq(0, 10, 0.2),
                     labels = dollar_format(accuracy = 0.1, prefix = "", suffix = "../$")) +
  scale_color_identity() + add_flags +
  theme(legend.position = c(0.8, 0.80),
        legend.title = element_blank())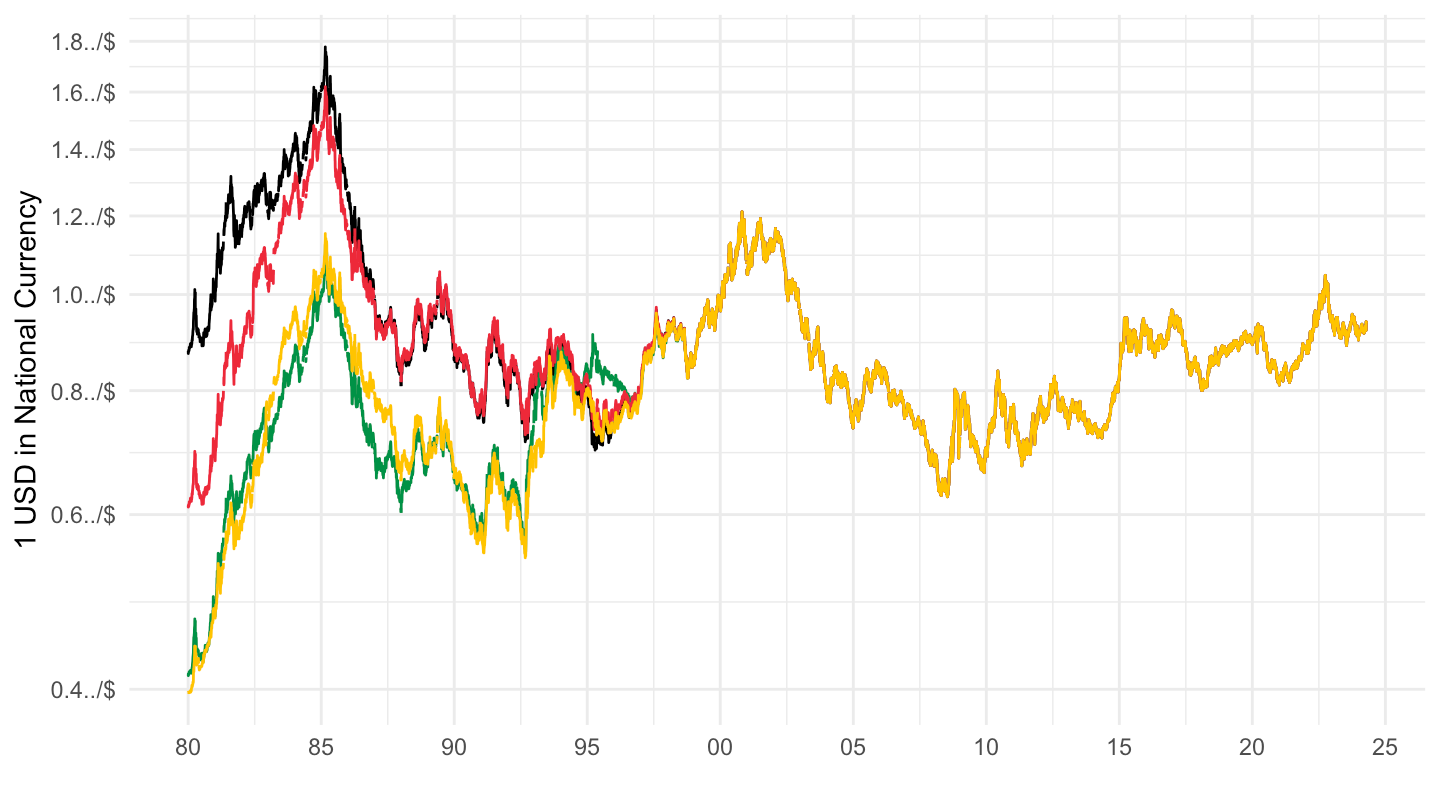
Russia
All
Code
XRU_D %>%
  filter(REF_AREA == "RU") %>%
  ggplot(.) + geom_line() + theme_minimal() +
  aes(x = date, y = OBS_VALUE) + xlab("") + ylab("") +
  scale_x_date(breaks = seq(1940, 2100, 2) %>% paste0("-01-01") %>% as.Date,
               labels = date_format("%Y")) +
  scale_y_log10(breaks = c(0.1, 0.2, 0.5, 1, 2, 5, 8, 10, 20, 50, 80, 100, 150),
                labels = dollar_format(a = .1, p = "", su = " RUB/$"))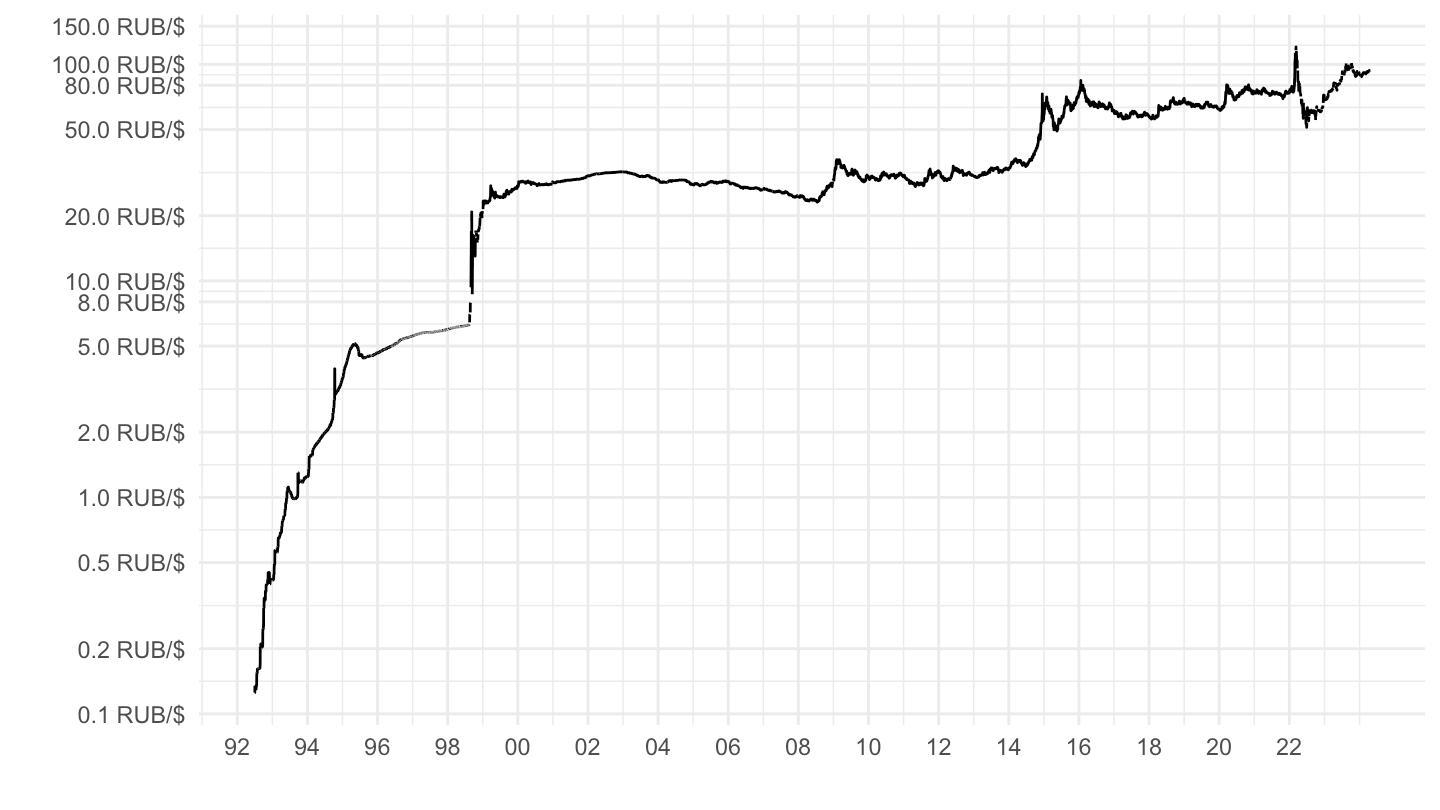
2000-
Code
XRU_D %>%
  filter(REF_AREA == "RU",
         date >= "2000-01-01") %>%
  ggplot(.) + geom_line() + theme_minimal() +
  aes(x = date, y = OBS_VALUE) + xlab("") + ylab("") +
  scale_x_date(breaks = seq(1940, 2100, 2) %>% paste0("-01-01") %>% as.Date,
               labels = date_format("%Y")) +
  scale_y_log10(breaks = seq(0, 600, 10),
                labels = dollar_format(a = 1, p = "", su = " RUB/$"))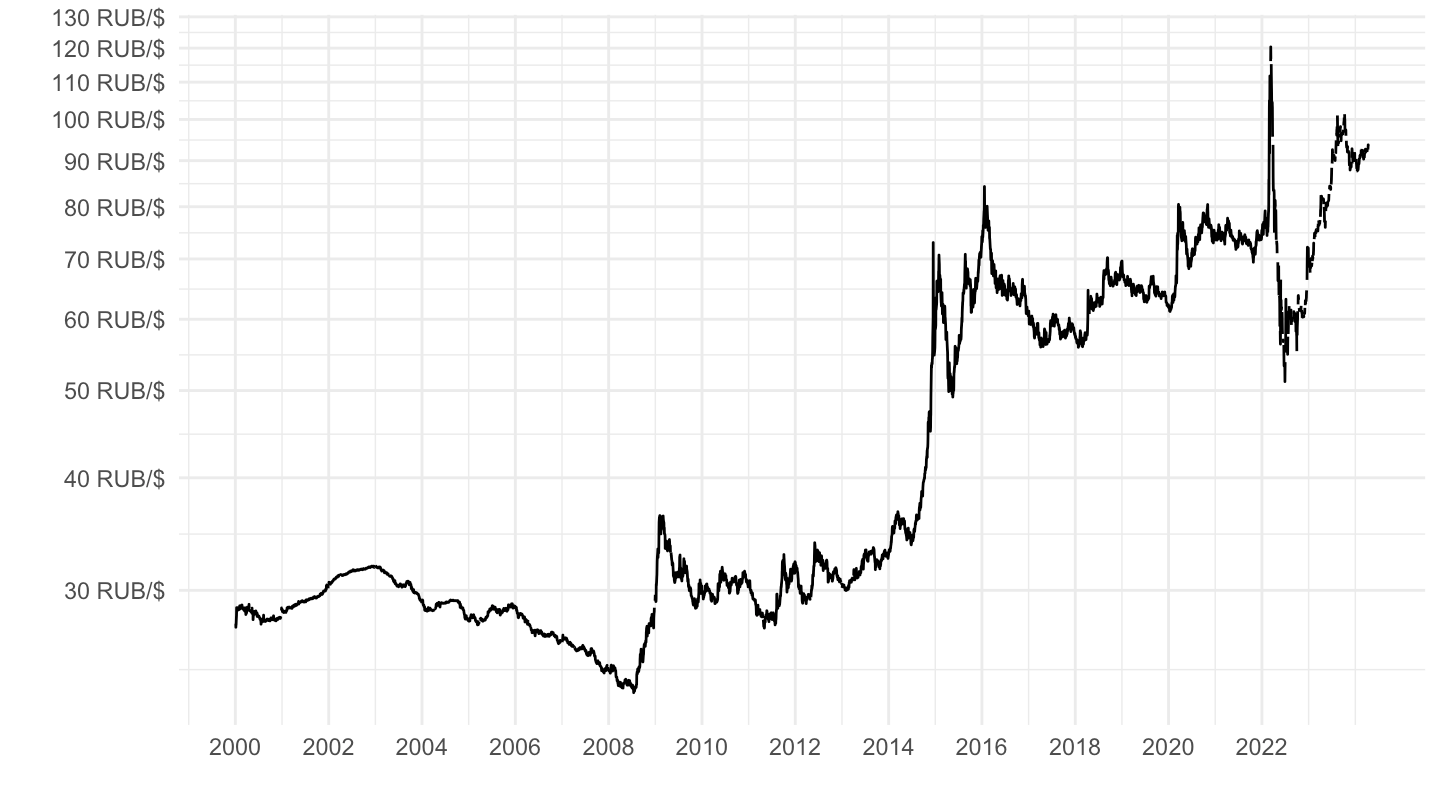
2010-
Code
XRU_D %>%
  filter(REF_AREA %in% c("RU"),
         date >= "2010-01-01") %>%
  ggplot(.) + geom_line() + theme_minimal() +
  aes(x = date, y = OBS_VALUE) + xlab("") + ylab("") +
  scale_x_date(breaks = seq(1940, 2100, 2) %>% paste0("-01-01") %>% as.Date,
               labels = date_format("%Y")) +
  scale_y_log10(breaks = seq(0, 600, 10),
                labels = dollar_format(a = 1, p = "", su = " RUB/$"))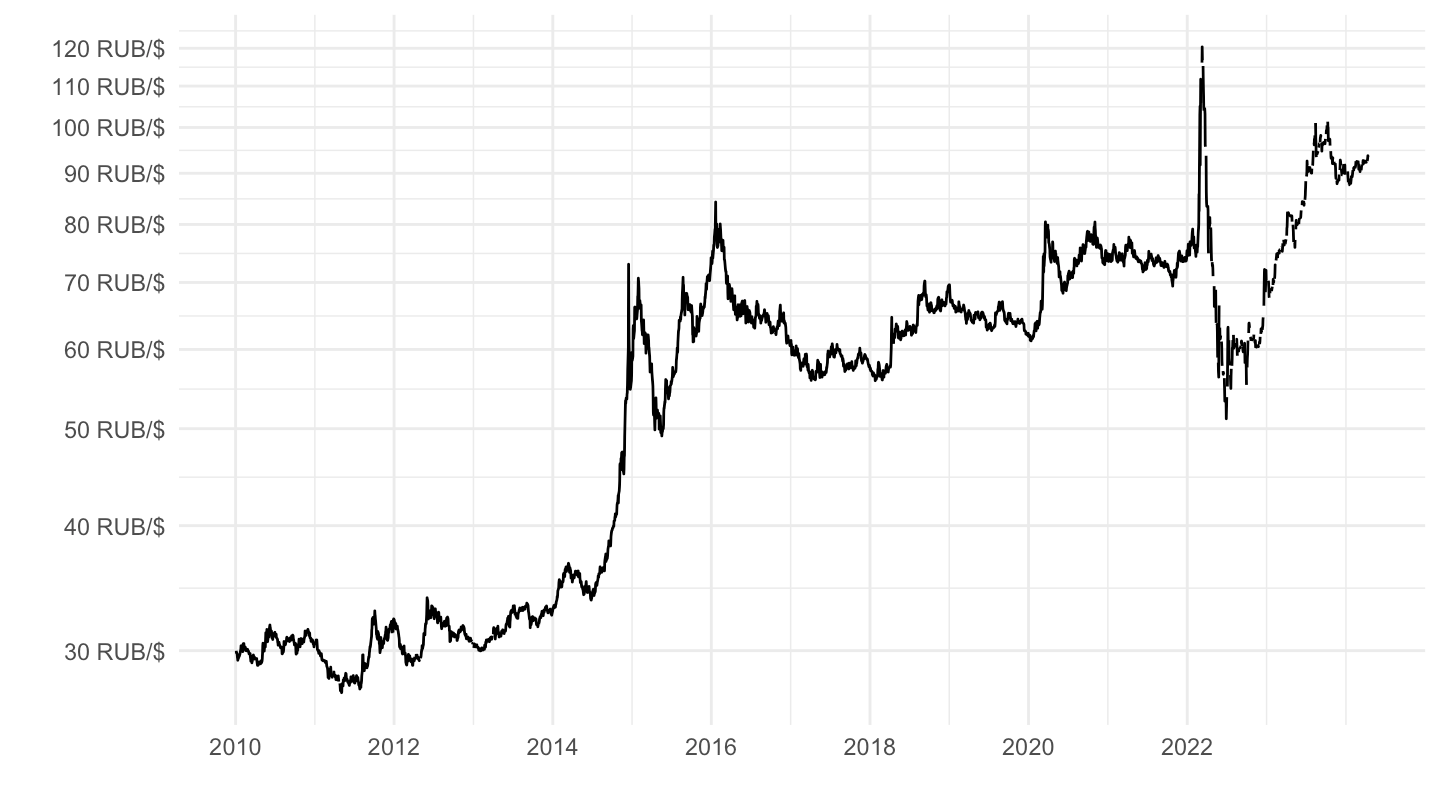
2016-
Code
XRU_D %>%
  filter(REF_AREA %in% c("RU"),
         date >= "2016-01-01") %>%
  ggplot(.) + geom_line() + theme_minimal() +
  aes(x = date, y = OBS_VALUE) + xlab("") + ylab("") +
  scale_x_date(breaks = "1 year",
               labels = date_format("%Y")) +
  scale_y_log10(breaks = seq(0, 600, 10),
                labels = dollar_format(a = 1, p = "", su = " RUB/$"))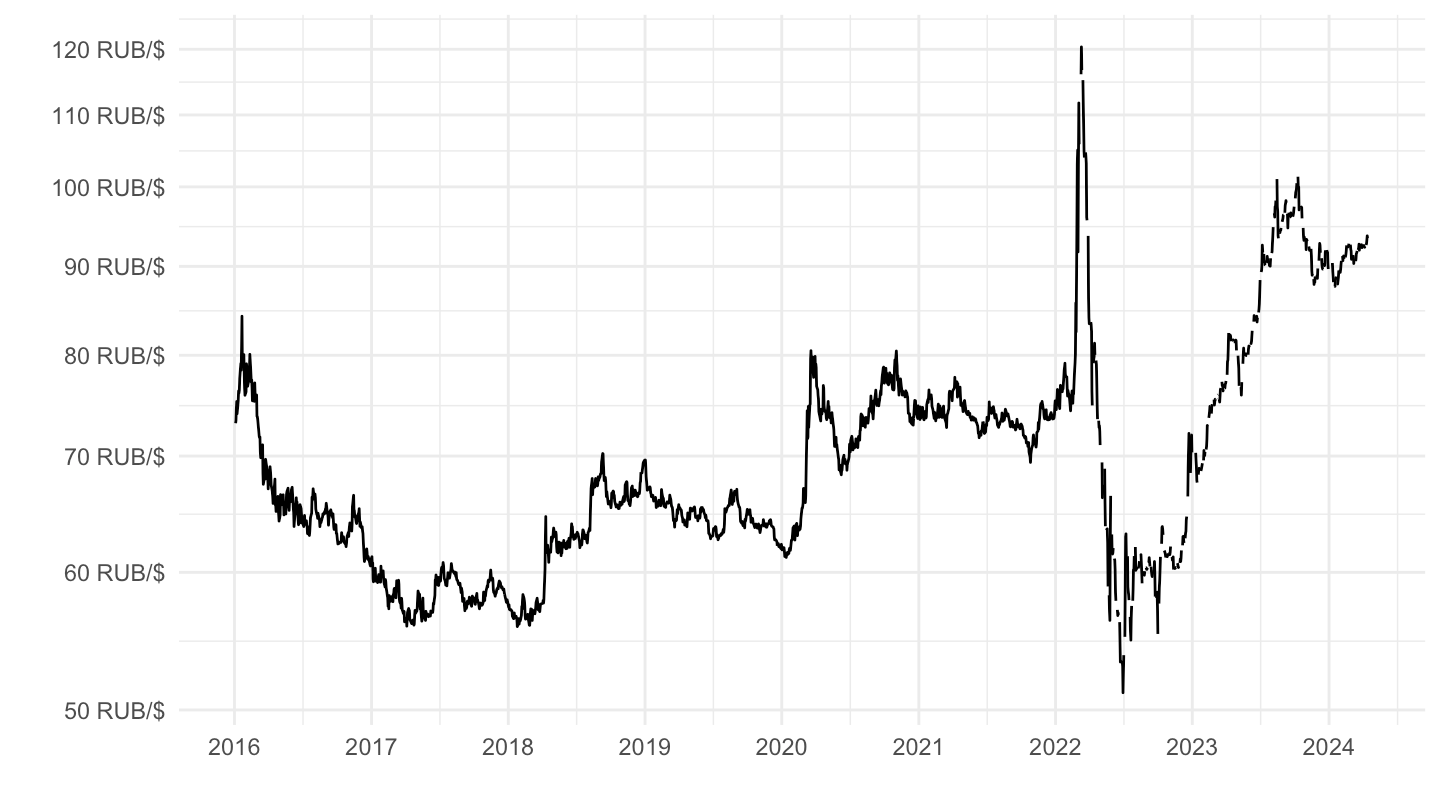
Japan
All
Code
XRU_D %>%
  filter(REF_AREA == "JP") %>%
  mutate(OBS_VALUE = as.numeric(OBS_VALUE)) %>%
  ggplot(.) + geom_line() + theme_minimal() +
  aes(x = date, y = OBS_VALUE) + xlab("") + ylab("") +
  scale_x_date(breaks = seq(1940, 2100, 5) %>% paste0("-01-01") %>% as.Date,
               labels = date_format("%Y")) +
  scale_y_log10(breaks = c(seq(0, 600, 50), seq(50, 150, 10)),
                labels = dollar_format(a = 1, p = "", su = " ¥/$"))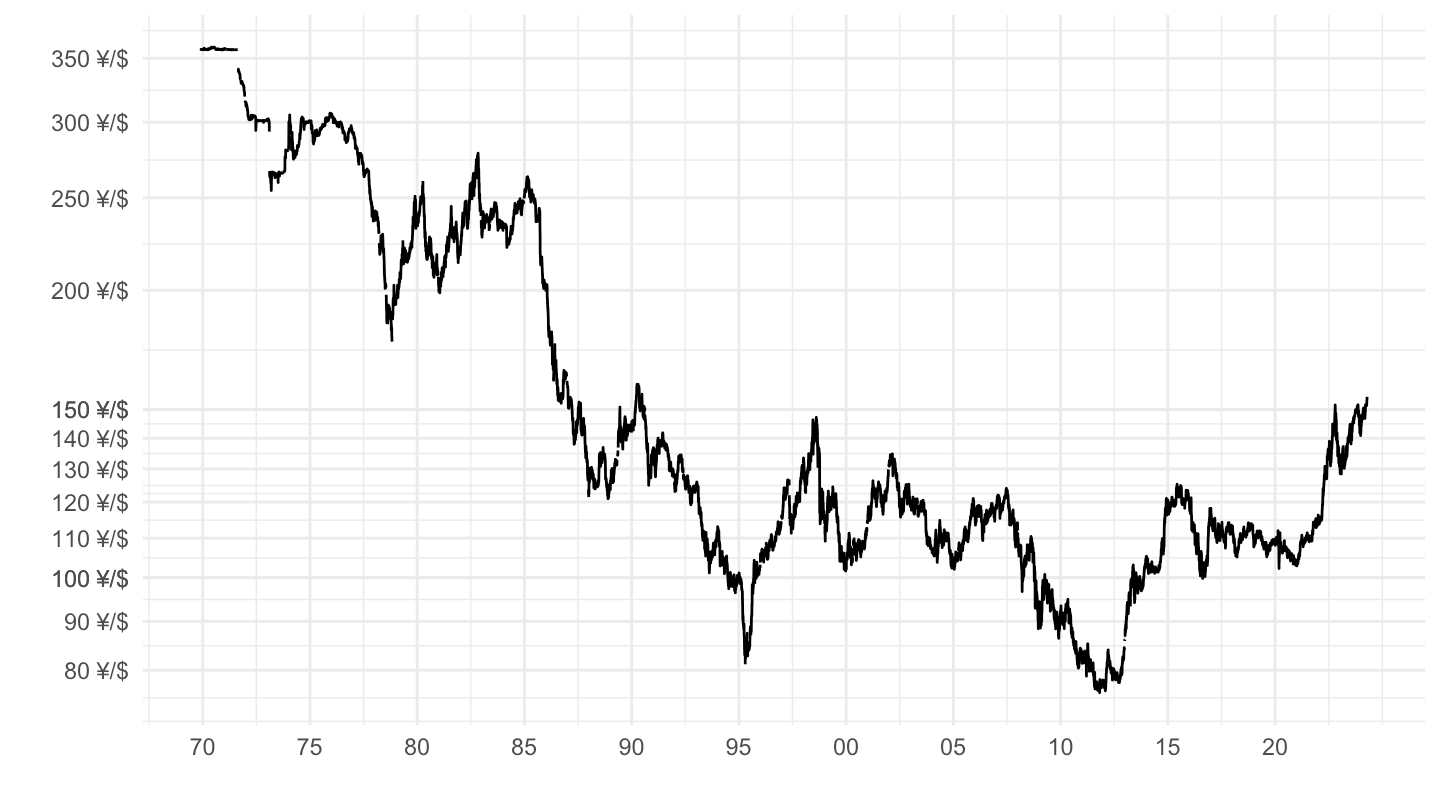
1985-
Code
XRU_D %>%
  filter(REF_AREA == "JP") %>%
  filter(date >= "1985-01-01") %>%
  mutate(OBS_VALUE = as.numeric(OBS_VALUE)) %>%
  ggplot(.) + geom_line() + theme_minimal() +
  aes(x = date, y = OBS_VALUE) + xlab("") + ylab("") +
  scale_x_date(breaks = seq(1940, 2100, 5) %>% paste0("-01-01") %>% as.Date,
               labels = date_format("%Y")) +
  scale_y_log10(breaks = c(seq(0, 600, 50), seq(50, 150, 10)),
                labels = dollar_format(a = 1, p = "", su = " ¥/$"))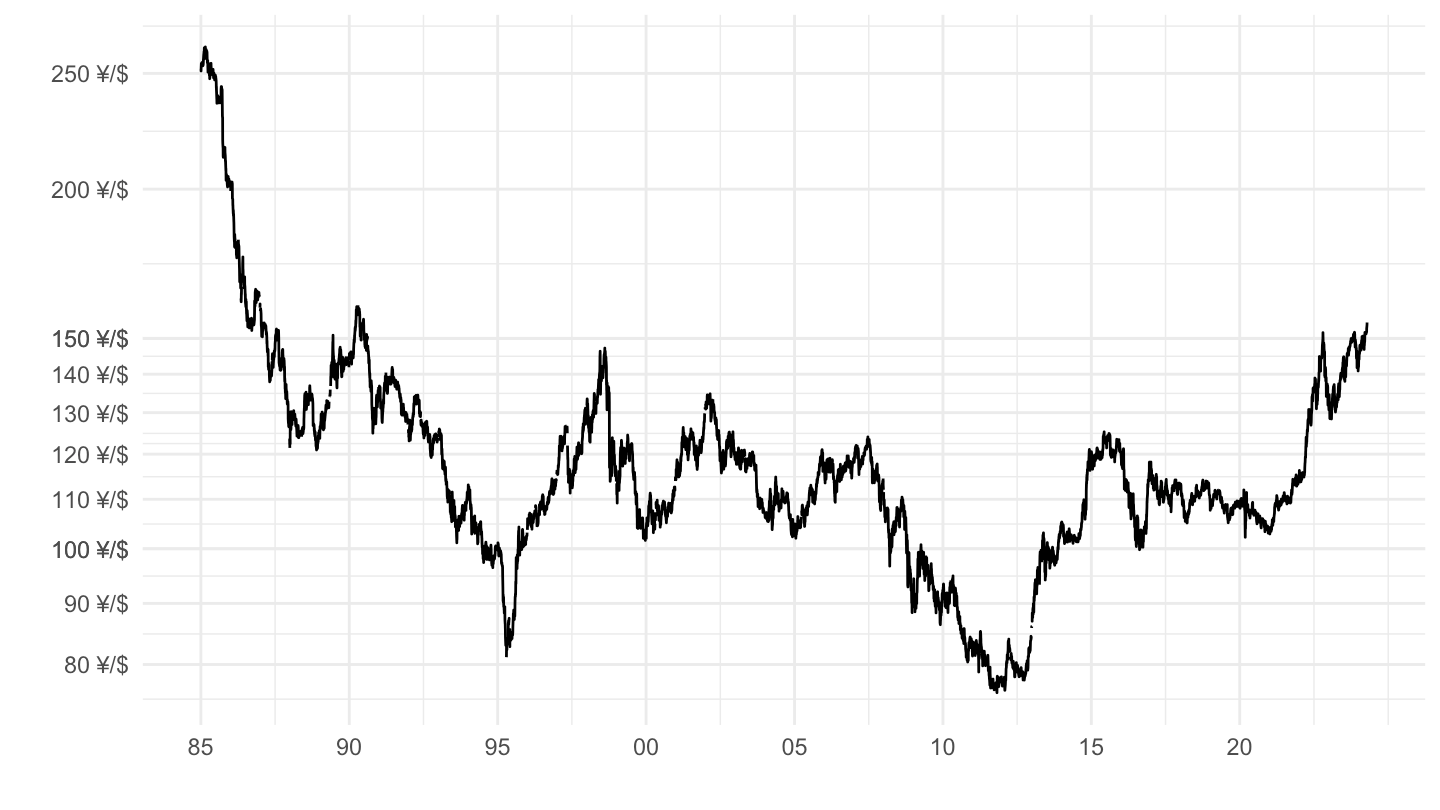
2000-
Code
XRU_D %>%
  filter(REF_AREA == "JP") %>%
  filter(date >= "2000-01-01") %>%
  mutate(OBS_VALUE = as.numeric(OBS_VALUE)) %>%
  ggplot(.) + geom_line() + theme_minimal() +
  aes(x = date, y = OBS_VALUE) + xlab("") + ylab("") +
  scale_x_date(breaks = seq(1940, 2100, 5) %>% paste0("-01-01") %>% as.Date,
               labels = date_format("%Y")) +
  scale_y_log10(breaks = c(seq(0, 600, 50), seq(50, 150, 10)),
                labels = dollar_format(a = 1, p = "", su = " ¥/$"))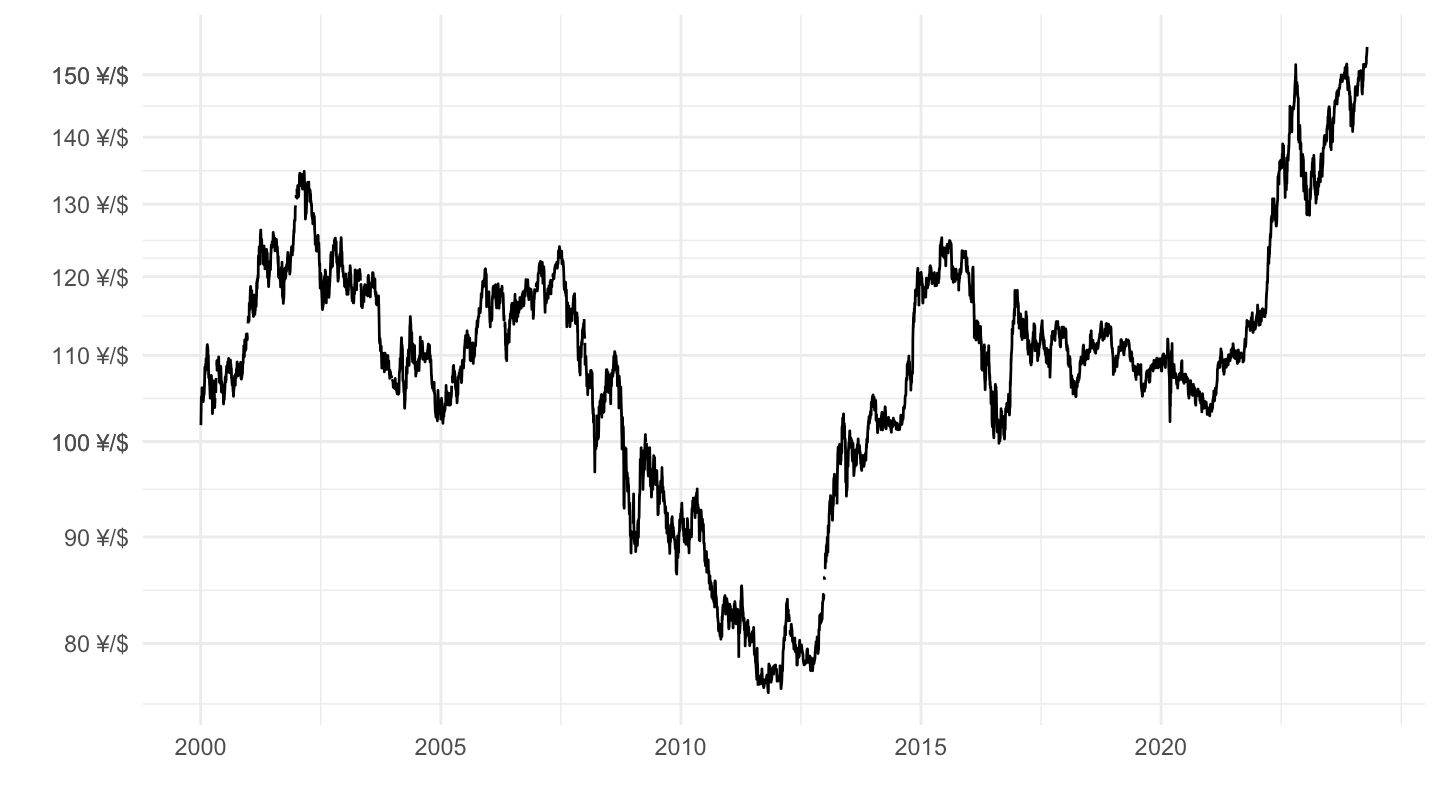
Switzerland
All
Code
XRU_D %>%
  filter(REF_AREA == "CH") %>%
  ggplot(.) + geom_line() + theme_minimal() +
  aes(x = date, y = OBS_VALUE) + xlab("") + ylab("") +
  scale_x_date(breaks = seq(1940, 2100, 5) %>% paste0("-01-01") %>% as.Date,
               labels = date_format("%Y")) +
  scale_y_log10(breaks = c(seq(0, 600, 1), seq(0.5, 1.5, 0.1)),
                labels = dollar_format(a = .1, p = "", su = " F/$"))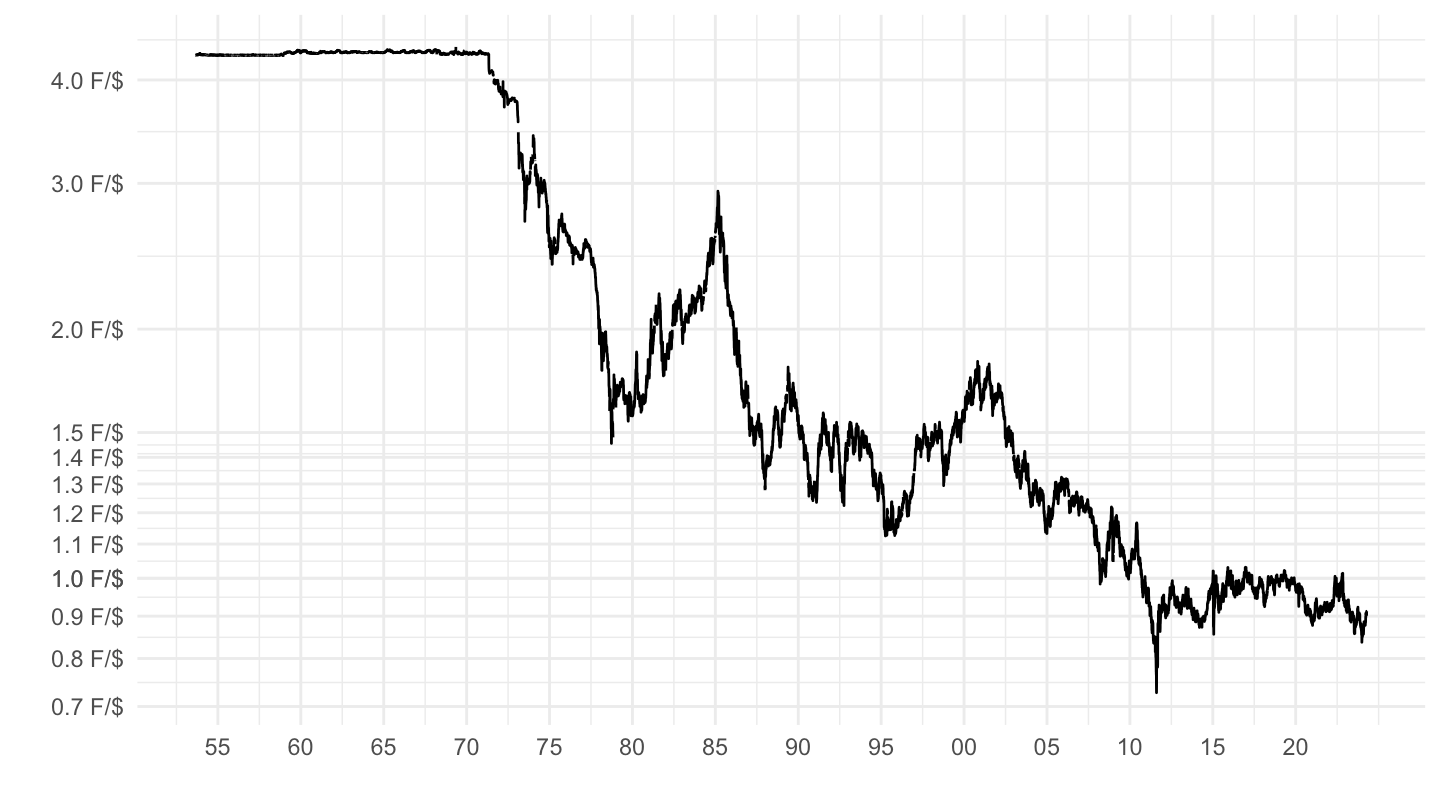
1990-
Code
XRU_D %>%
  filter(REF_AREA %in% c("CH"),
         COLLECTION == "A",
         date >= "1990-01-01") %>%
  ggplot(.) + geom_line() + theme_minimal() +
  aes(x = date, y = OBS_VALUE) + xlab("") + ylab("") +
  scale_x_date(breaks = seq(1940, 2100, 5) %>% paste0("-01-01") %>% as.Date,
               labels = date_format("%Y")) +
  scale_y_log10(breaks = c(seq(0, 600, 1), seq(0.5, 2.5, 0.1)),
                labels = dollar_format(a = .1, p = "", su = " F/$"))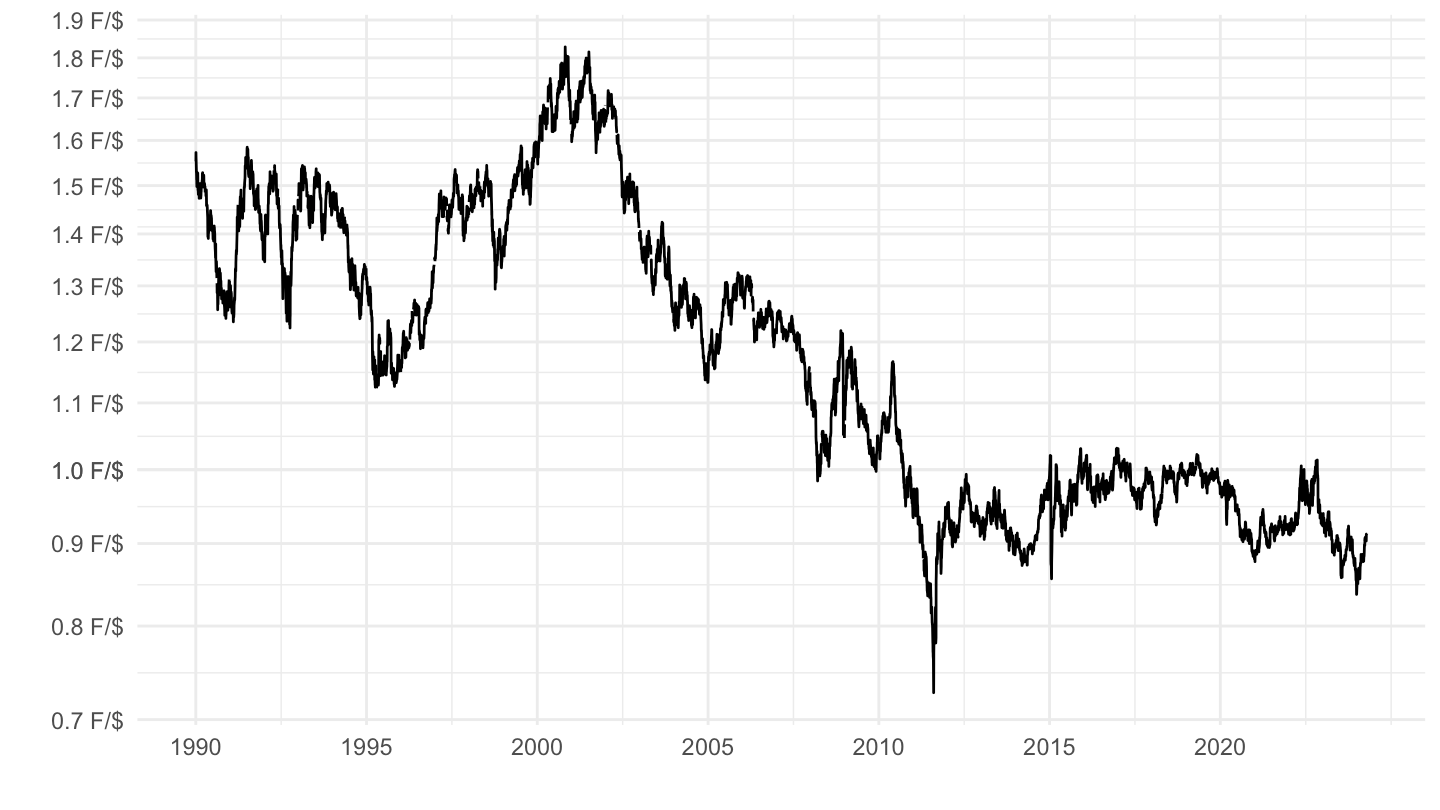
2000-
Code
XRU_D %>%
  filter(REF_AREA %in% c("CH"),
         COLLECTION == "A",
         date >= "2000-01-01") %>%
  ggplot(.) + geom_line() + theme_minimal() +
  aes(x = date, y = OBS_VALUE) + xlab("") + ylab("") +
  scale_x_date(breaks = seq(1940, 2100, 5) %>% paste0("-01-01") %>% as.Date,
               labels = date_format("%Y")) +
  scale_y_log10(breaks = c(seq(0, 600, 1), seq(0.5, 2.5, 0.1)),
                labels = dollar_format(a = .1, p = "", su = " F/$"))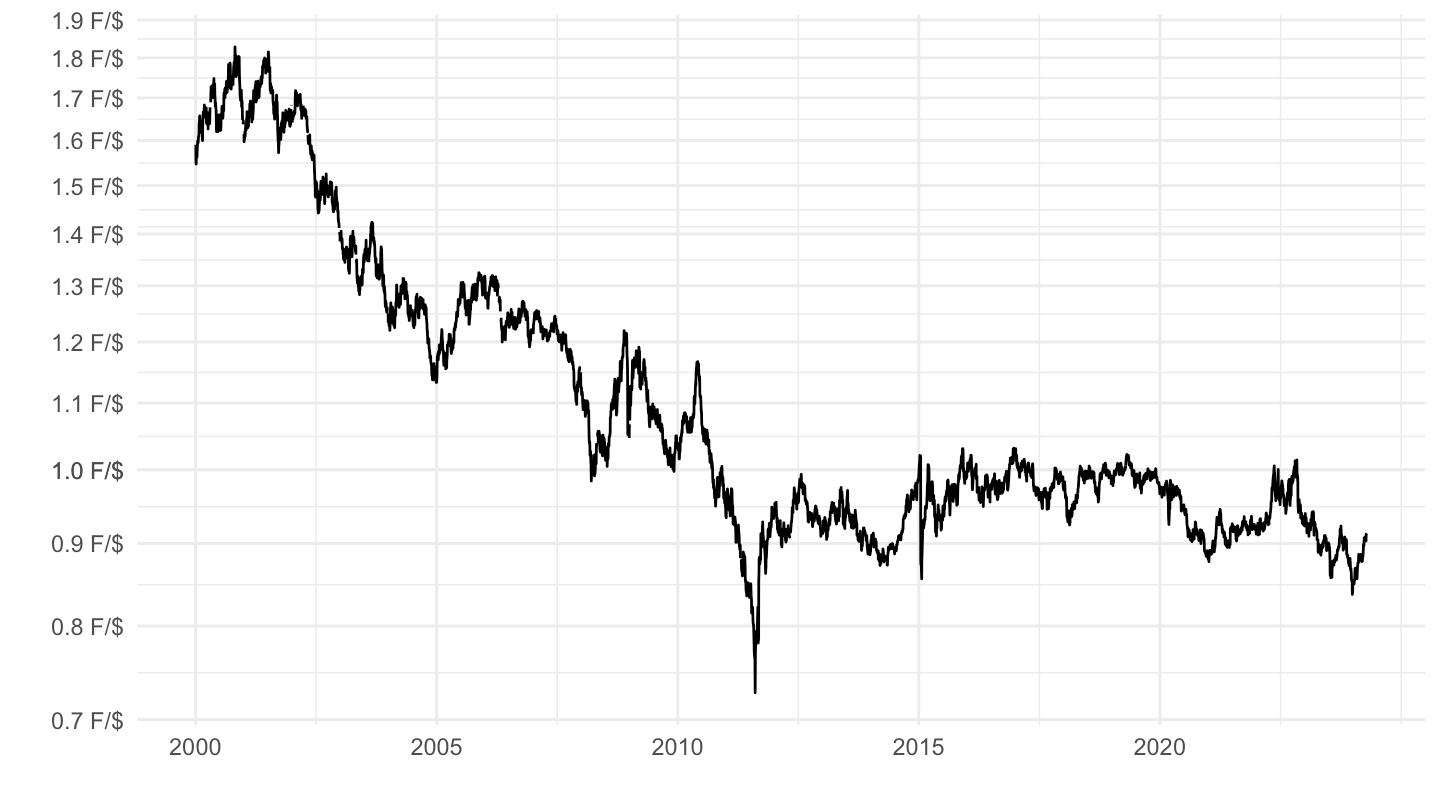
2010-
Code
XRU_D %>%
  filter(REF_AREA %in% c("CH"),
         COLLECTION == "A",
         date >= "2010-01-01") %>%
  ggplot(.) + geom_line() + theme_minimal() +
  aes(x = date, y = OBS_VALUE) + xlab("") + ylab("") +
  scale_x_date(breaks = seq(1940, 2100, 2) %>% paste0("-01-01") %>% as.Date,
               labels = date_format("%Y")) +
  scale_y_log10(breaks = c(seq(0, 600, 1), seq(0.5, 2.5, 0.1)),
                labels = dollar_format(a = .1, p = "", su = " F/$"))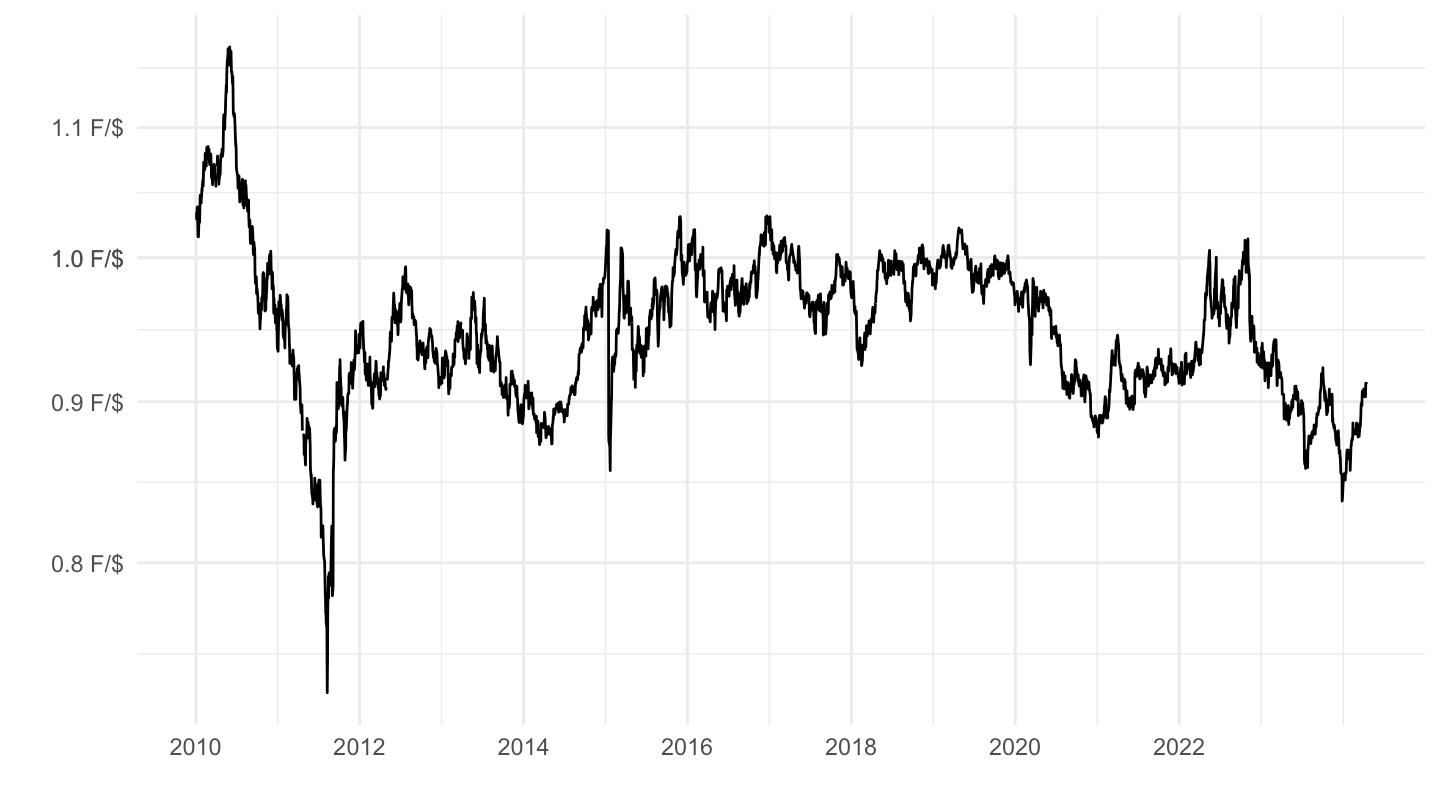
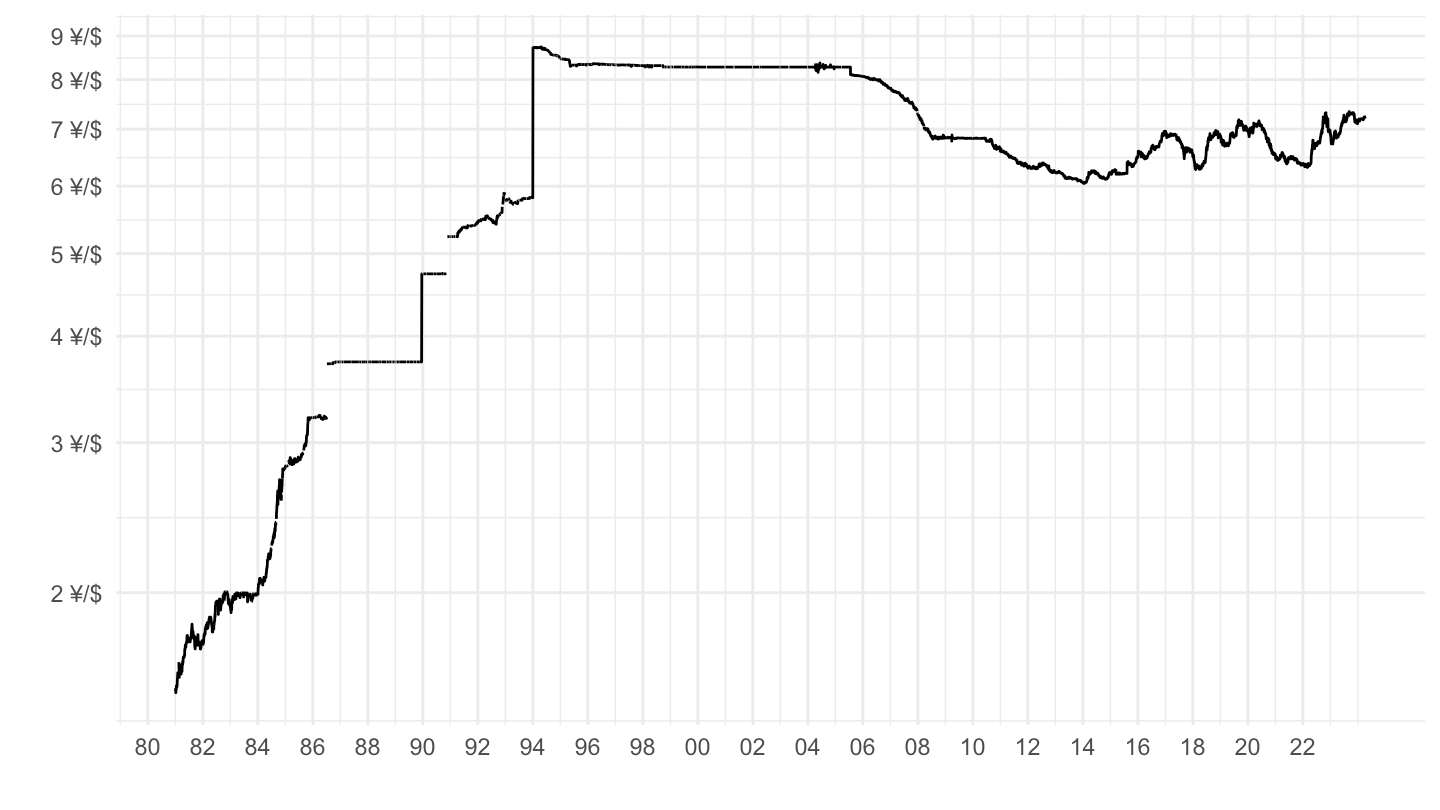
China
Code
XRU_D %>%
  filter(REF_AREA == "CN") %>%
  mutate(OBS_VALUE = as.numeric(OBS_VALUE)) %>%
  ggplot(.) + geom_line() + theme_minimal() +
  aes(x = date, y = OBS_VALUE) + xlab("") + ylab("") +
  scale_x_date(breaks = seq(1940, 2100, 2) %>% paste0("-01-01") %>% as.Date,
               labels = date_format("%Y")) +
  scale_y_log10(breaks = seq(0, 20, 1),
                labels = dollar_format(a = 1, p = "", su = " ¥/$"))