| source | dataset | .html | .RData |
|---|---|---|---|
| wdi | PA.NUS.FCRF | 2025-03-09 | 2025-05-24 |
Official exchange rate (LCU per USD, period average)
Data - WDI
Info
Data on xrates
| source | dataset | .html | .RData |
|---|---|---|---|
| bdf | EXR | 2025-03-09 | 2025-01-05 |
| bis | EER | 2025-05-24 | 2025-05-24 |
| bis | EER_D | 2024-11-18 | 2024-05-10 |
| bis | XRU | 2025-05-24 | 2025-05-24 |
| bis | XRU_D | 2025-05-24 | 2025-05-24 |
| ecb | EXR | 2025-05-24 | 2025-05-24 |
| eurostat | ert_bil_eur_d | 2025-05-24 | 2025-05-24 |
| eurostat | ert_h_eur_d | 2025-05-24 | 2025-05-24 |
| fred | xrates | 2025-04-20 | 2025-05-24 |
| gfd | xrates | 2024-06-20 | 2021-01-08 |
| oecd | REFSERIES_MSIT | 2024-09-15 | 2025-03-09 |
| oecd | SNA_TABLE4 | 2024-09-15 | 2025-03-09 |
| wdi | PA.NUS.FCRF | 2025-03-09 | 2025-05-24 |
LAST_COMPILE
| LAST_COMPILE |
|---|
| 2025-05-24 |
Last
| year | Nobs |
|---|---|
| 2024 | 182 |
Nobs - Javascript
Code
PA.NUS.FCRF %>%
  left_join(iso2c, by = "iso2c") %>%
  group_by(iso2c, Iso2c) %>%
  rename(value = `PA.NUS.FCRF`) %>%
  mutate(value = round(value, 2)) %>%
  summarise(Nobs = n(),
            `Year 1` = first(year),
            `ER 1` = first(value),
            `Year 2` = last(year),
            `ER 2` = last(value),
            `Mean` = mean(value)) %>%
  arrange(`ER 2`) %>%
  {if (is_html_output()) datatable(., filter = 'top', rownames = F) else .}
Venezuela
Code
PA.NUS.FCRF %>%
  filter(iso2c %in% c("VE")) %>%
  left_join(iso2c, by = "iso2c") %>%
  year_to_date %>%
  ggplot(.) + theme_minimal() + scale_color_manual(values = viridis(4)[1:3]) + xlab("") + ylab("LCU per USD") +
  geom_line(aes(x = date, y = PA.NUS.FCRF, color = Iso2c, linetype = Iso2c)) +
  theme(legend.title = element_blank(),
        legend.position = c(0.5, 0.9),
        legend.direction = "horizontal") +
  scale_x_date(breaks = seq(1950, 2100, 5) %>% paste0("-01-01") %>% as.Date,
               labels = date_format("%Y")) +
  scale_y_log10()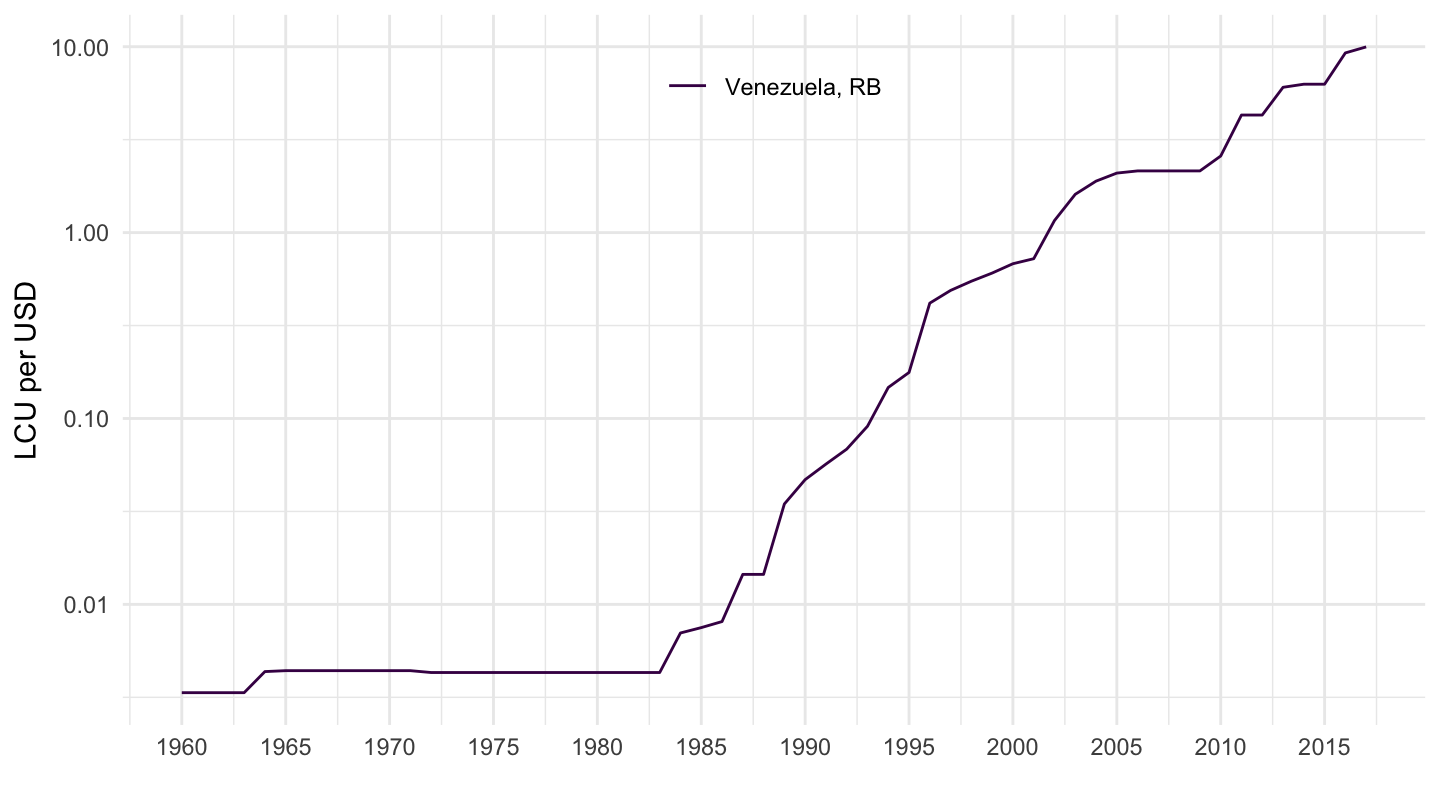
Sri Lanka, Nigeria, Pakistan
All
Code
PA.NUS.FCRF %>%
  filter(iso2c %in% c("LK", "NG", "PK", "GH")) %>%
  left_join(iso2c, by = "iso2c") %>%
  year_to_date %>%
  left_join(colors, by = c("Iso2c" = "country")) %>%
  mutate(value = PA.NUS.FCRF,
         color = ifelse(iso2c == "GH", color2, color)) %>%
  group_by(iso2c) %>%
  mutate(value = value/value[1]) %>%
  ggplot(.) + geom_line(aes(x = date, y = value, color = color)) +
  xlab("") + ylab("LCU per USD") +
  theme_minimal() + scale_color_identity() + add_4flags +
  theme(legend.title = element_blank(),
        legend.position = c(0.5, 0.9),
        legend.direction = "horizontal") +
  scale_x_date(breaks = seq(1950, 2100, 5) %>% paste0("-01-01") %>% as.Date,
               labels = date_format("%Y")) +
  scale_y_log10(breaks = 10^seq(0, 10, 1))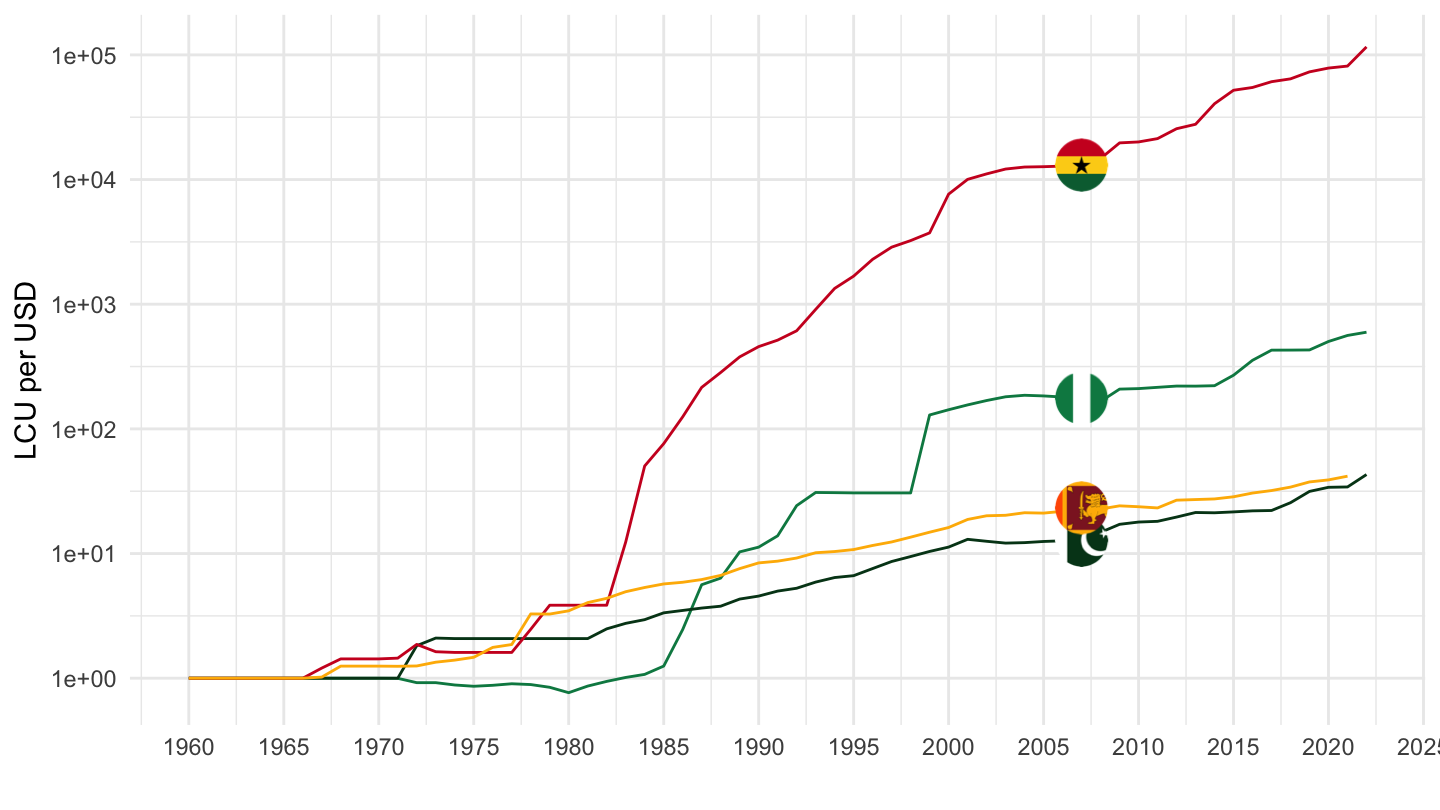
1995-
Code
PA.NUS.FCRF %>%
  filter(iso2c %in% c("LK", "NG", "PK", "GH")) %>%
  left_join(iso2c, by = "iso2c") %>%
  year_to_date %>%
  left_join(colors, by = c("Iso2c" = "country")) %>%
  mutate(value = PA.NUS.FCRF,
         color = ifelse(iso2c == "GH", color2, color)) %>%
  filter(date >= as.Date("1995-01-01")) %>%
  group_by(iso2c) %>%
  mutate(value = value/value[1]) %>%
  ggplot(.) + geom_line(aes(x = date, y = value, color = color)) +
  xlab("") + ylab("Exchange Rate (1995 = 1)") +
  theme_minimal() + scale_color_identity() + add_4flags +
  theme(legend.title = element_blank(),
        legend.position = c(0.5, 0.9),
        legend.direction = "horizontal") +
  scale_x_date(breaks = seq(1950, 2100, 5) %>% paste0("-01-01") %>% as.Date,
               labels = date_format("%Y")) +
  scale_y_log10(breaks = c(1, 2, 5, 10, 20, 50))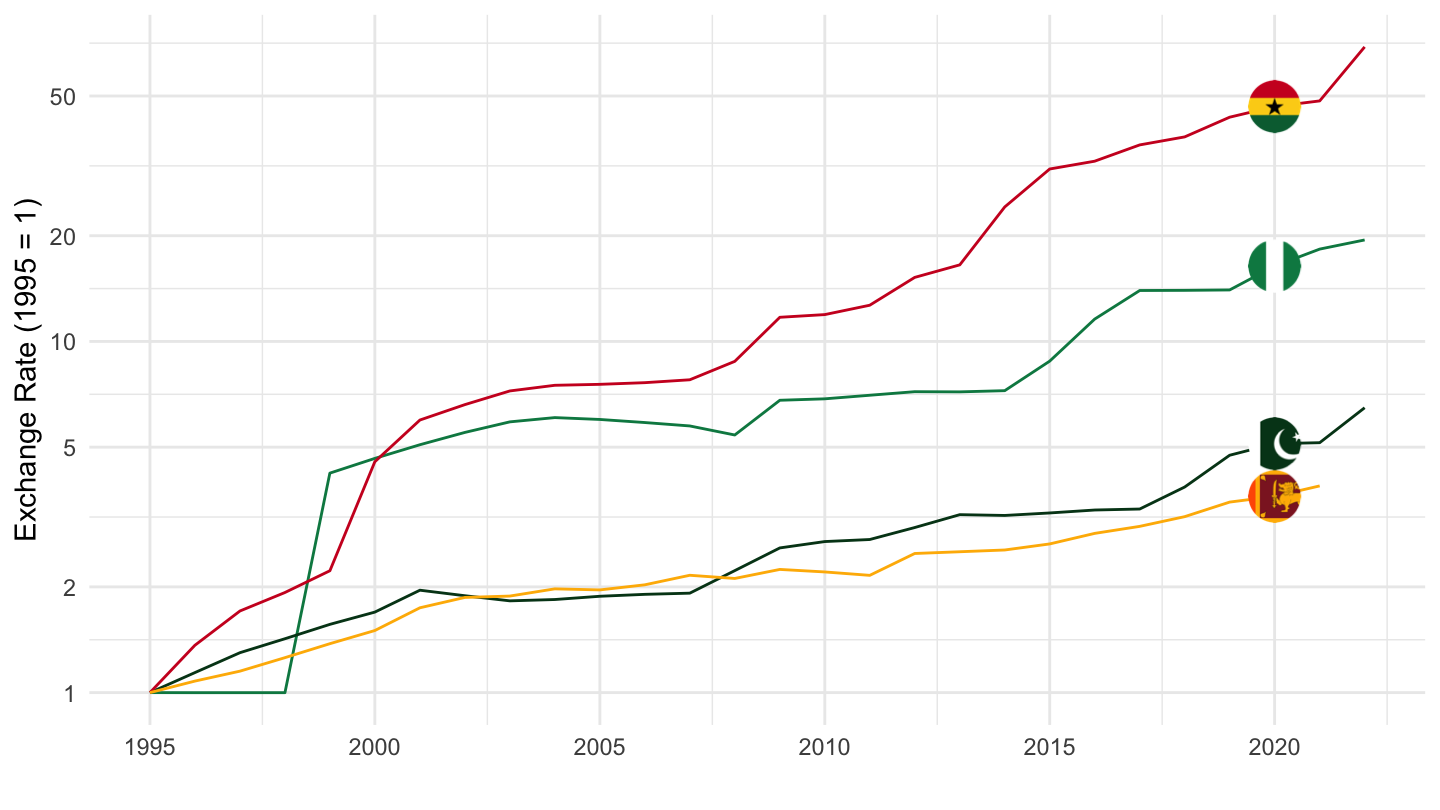
France, Germany
All
Code
PA.NUS.FCRF %>%
  filter(iso2c %in% c("FR", "DE")) %>%
  left_join(iso2c, by = "iso2c") %>%
  year_to_date %>%
  left_join(colors, by = c("Iso2c" = "country")) %>%
  mutate(value = PA.NUS.FCRF) %>%
  ggplot(.) + geom_line(aes(x = date, y = value, color = color)) +
  xlab("") + ylab("LCU per USD") +
  theme_minimal() + scale_color_identity() + add_2flags +
  theme(legend.title = element_blank(),
        legend.position = c(0.5, 0.9),
        legend.direction = "horizontal") +
  scale_x_date(breaks = seq(1950, 2100, 5) %>% paste0("-01-01") %>% as.Date,
               labels = date_format("%Y")) +
  scale_y_log10(breaks = seq(1, 9, 1))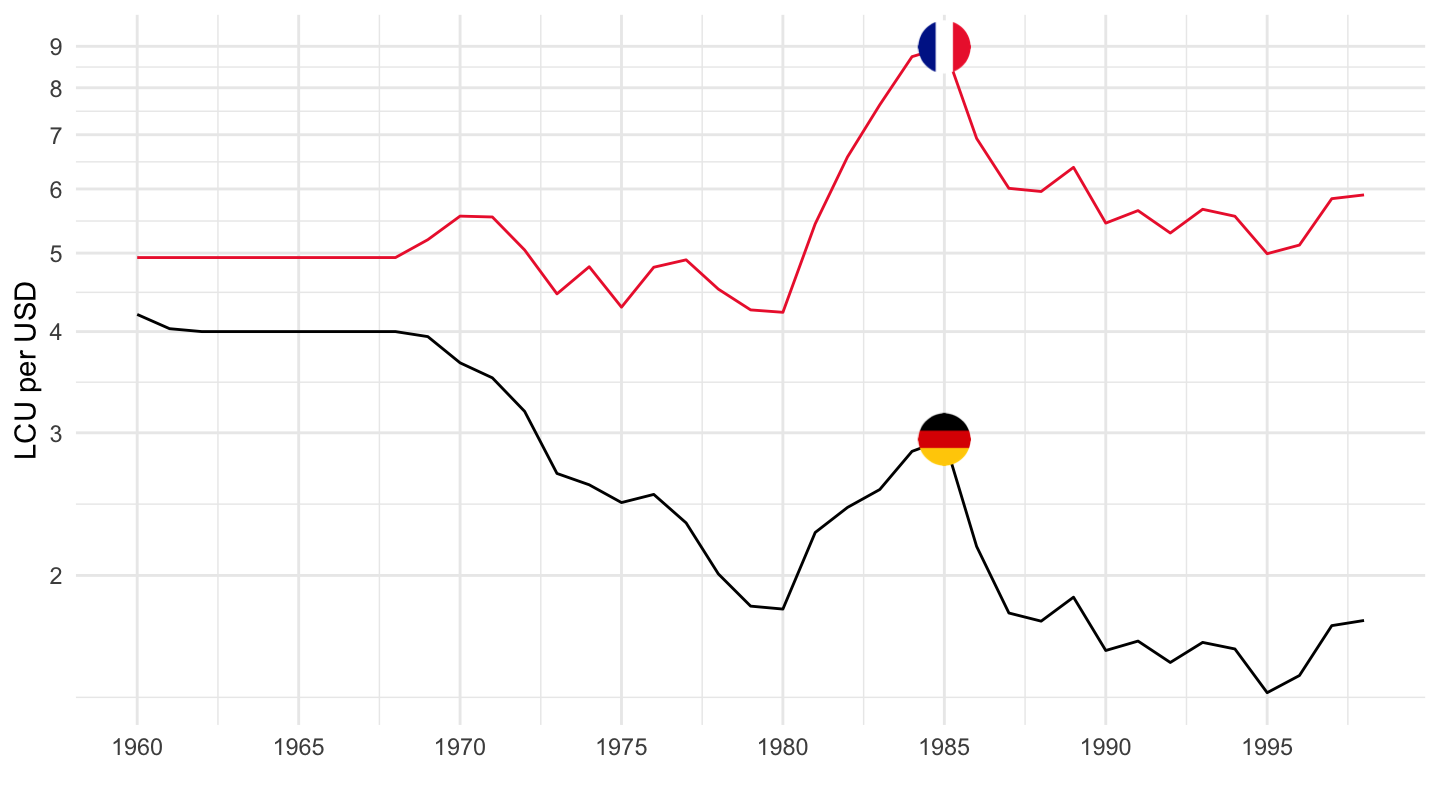
2000-
Code
PA.NUS.FCRF %>%
  filter(iso2c %in% c("FR", "US")) %>%
  left_join(iso2c, by = "iso2c") %>%
  year_to_date %>%
  filter(date >= as.Date("2000-01-01")) %>%
  left_join(colors, by = c("Iso2c" = "country")) %>%
  mutate(value = PA.NUS.FCRF) %>%
  ggplot(.) + geom_line(aes(x = date, y = value, color = color)) +
  xlab("") + ylab("LCU per USD") +
  theme_minimal() + scale_color_identity() + add_2flags +
  theme(legend.title = element_blank(),
        legend.position = c(0.5, 0.9),
        legend.direction = "horizontal") +
  scale_x_date(breaks = seq(1950, 2100, 2) %>% paste0("-01-01") %>% as.Date,
               labels = date_format("%Y")) +
  scale_y_log10(breaks = seq(.1, 9, .05))
2008-
Code
PA.NUS.FCRF %>%
  filter(iso2c %in% c("FR", "US")) %>%
  left_join(iso2c, by = "iso2c") %>%
  year_to_date %>%
  filter(date >= as.Date("2008-01-01")) %>%
  left_join(colors, by = c("Iso2c" = "country")) %>%
  mutate(value = PA.NUS.FCRF) %>%
  ggplot(.) + geom_line(aes(x = date, y = value, color = color)) +
  xlab("") + ylab("LCU per USD") +
  theme_minimal() + scale_color_identity() + add_2flags +
  theme(legend.title = element_blank(),
        legend.position = c(0.5, 0.9),
        legend.direction = "horizontal") +
  scale_x_date(breaks = seq(1950, 2100, 2) %>% paste0("-01-01") %>% as.Date,
               labels = date_format("%Y")) +
  scale_y_log10(breaks = seq(.1, 9, .05))
France, Germany, Italy, Spain, Greece
Code
PA.NUS.FCRF %>%
  filter(iso2c %in% c("FR", "DE", "IT", "ES", "GR")) %>%
  left_join(iso2c, by = "iso2c") %>%
  year_to_date %>%
  left_join(colors, by = c("Iso2c" = "country")) %>%
  mutate(value = PA.NUS.FCRF) %>%
  ggplot(.) + geom_line(aes(x = date, y = value, color = color)) +
  xlab("") + ylab("LCU per USD") +
  theme_minimal() + scale_color_identity() + add_5flags +
  theme(legend.title = element_blank(),
        legend.position = c(0.5, 0.9),
        legend.direction = "horizontal") +
  scale_x_date(breaks = seq(1950, 2100, 5) %>% paste0("-01-01") %>% as.Date,
               labels = date_format("%Y")) +
  scale_y_log10(breaks = c(1, 2, 5, 8, 10, 20, 50, 80, 100, 200, 500, 800, 1000, 2000))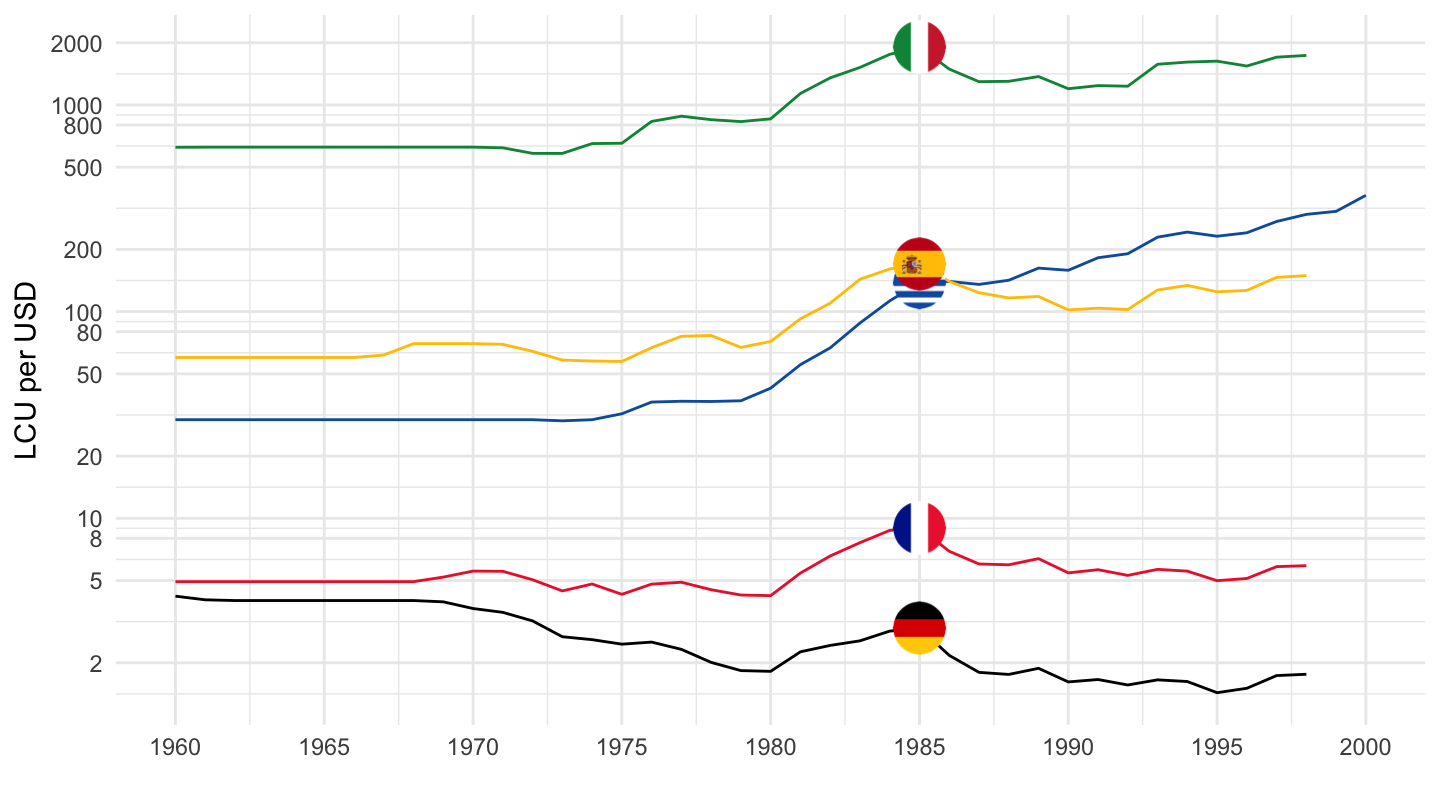
France
Code
PA.NUS.FCRF %>%
  filter(iso2c %in% c("FR")) %>%
  left_join(iso2c, by = "iso2c") %>%
  year_to_date %>%
  ggplot(.) + theme_minimal() + scale_color_manual(values = viridis(4)[1:3]) + xlab("") + ylab("LCU per USD") +
  geom_line(aes(x = date, y = PA.NUS.FCRF, color = Iso2c, linetype = Iso2c)) +
  theme(legend.title = element_blank(),
        legend.position = c(0.5, 0.9),
        legend.direction = "horizontal") +
  scale_x_date(breaks = seq(1950, 2100, 5) %>% paste0("-01-01") %>% as.Date,
               labels = date_format("%Y")) +
  scale_y_log10(breaks = seq(1, 9, 1))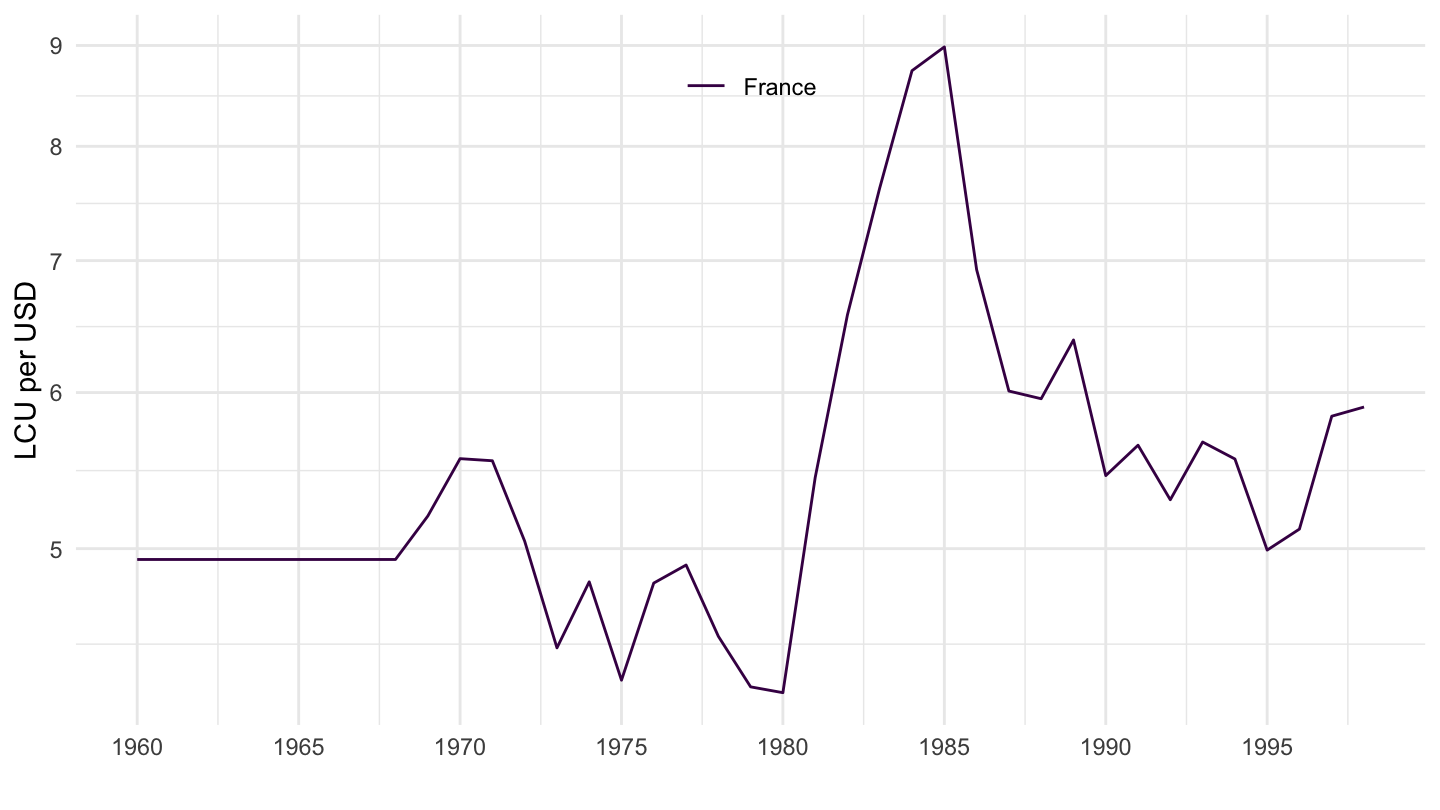
Zambia
Code
PA.NUS.FCRF %>%
  filter(iso2c %in% c("ZM")) %>%
  left_join(iso2c, by = "iso2c") %>%
  year_to_date %>%
  ggplot(.) + theme_minimal() + scale_color_manual(values = viridis(4)[1:3]) + xlab("") + ylab("LCU per USD") +
  geom_line(aes(x = date, y = PA.NUS.FCRF, color = Iso2c, linetype = Iso2c)) +
  theme(legend.title = element_blank(),
        legend.position = c(0.5, 0.9),
        legend.direction = "horizontal") +
  scale_x_date(breaks = seq(1950, 2100, 5) %>% paste0("-01-01") %>% as.Date,
               labels = date_format("%Y")) +
  scale_y_log10()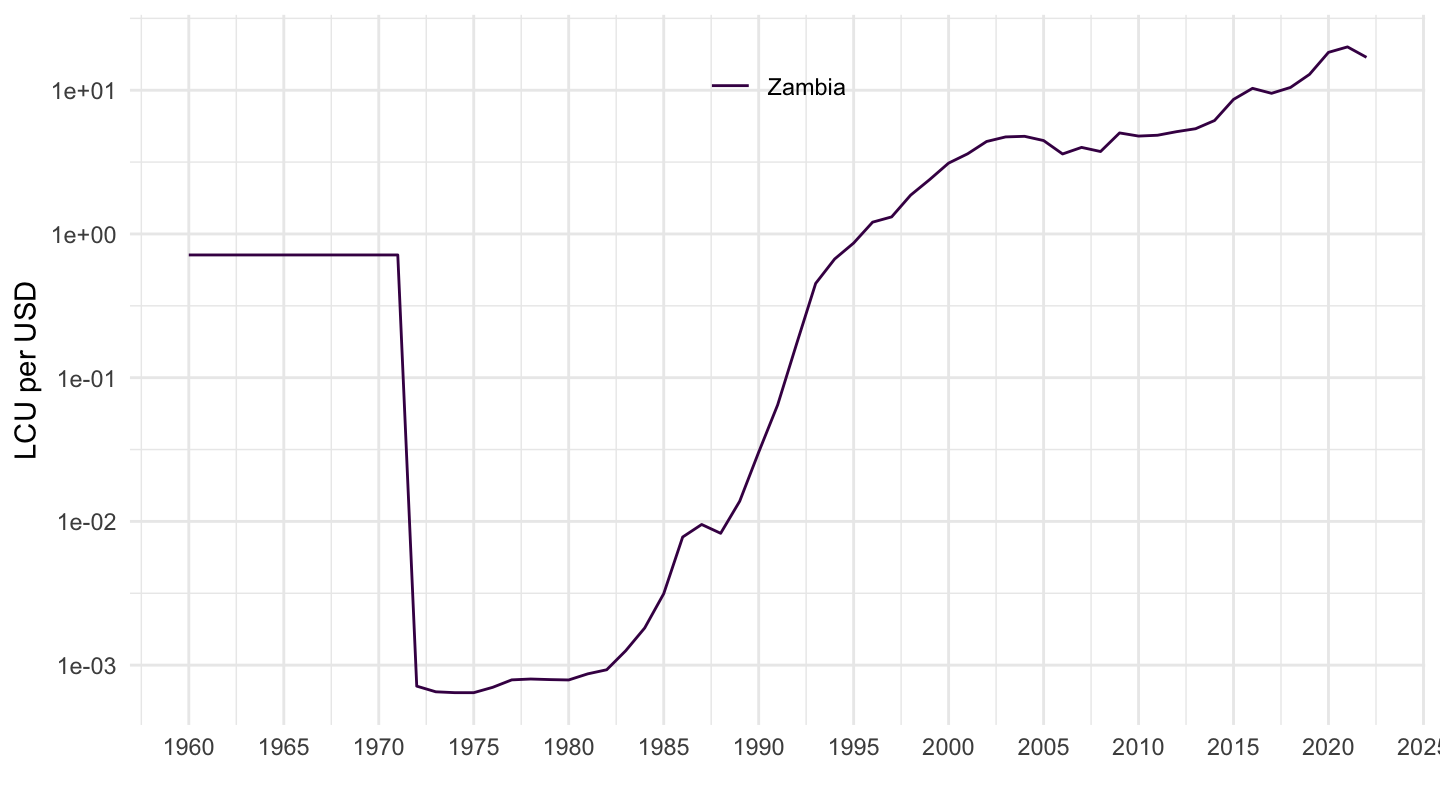
Argentina
1963-2019
Code
PA.NUS.FCRF %>%
  filter(iso2c %in% c("AR")) %>%
  left_join(iso2c, by = "iso2c") %>%
  year_to_date %>%
  ggplot(.) + theme_minimal() + xlab("") + ylab("LCU per USD") +
  scale_color_manual(values = viridis(4)[1:3]) +
  geom_line(aes(x = date, y = PA.NUS.FCRF, color = Iso2c)) +
  theme(legend.title = element_blank(),
        legend.position = c(0.8, 0.3)) +
  scale_x_date(breaks = seq(1950, 2100, 5) %>% paste0("-01-01") %>% as.Date,
               labels = date_format("%Y")) +
  scale_y_log10()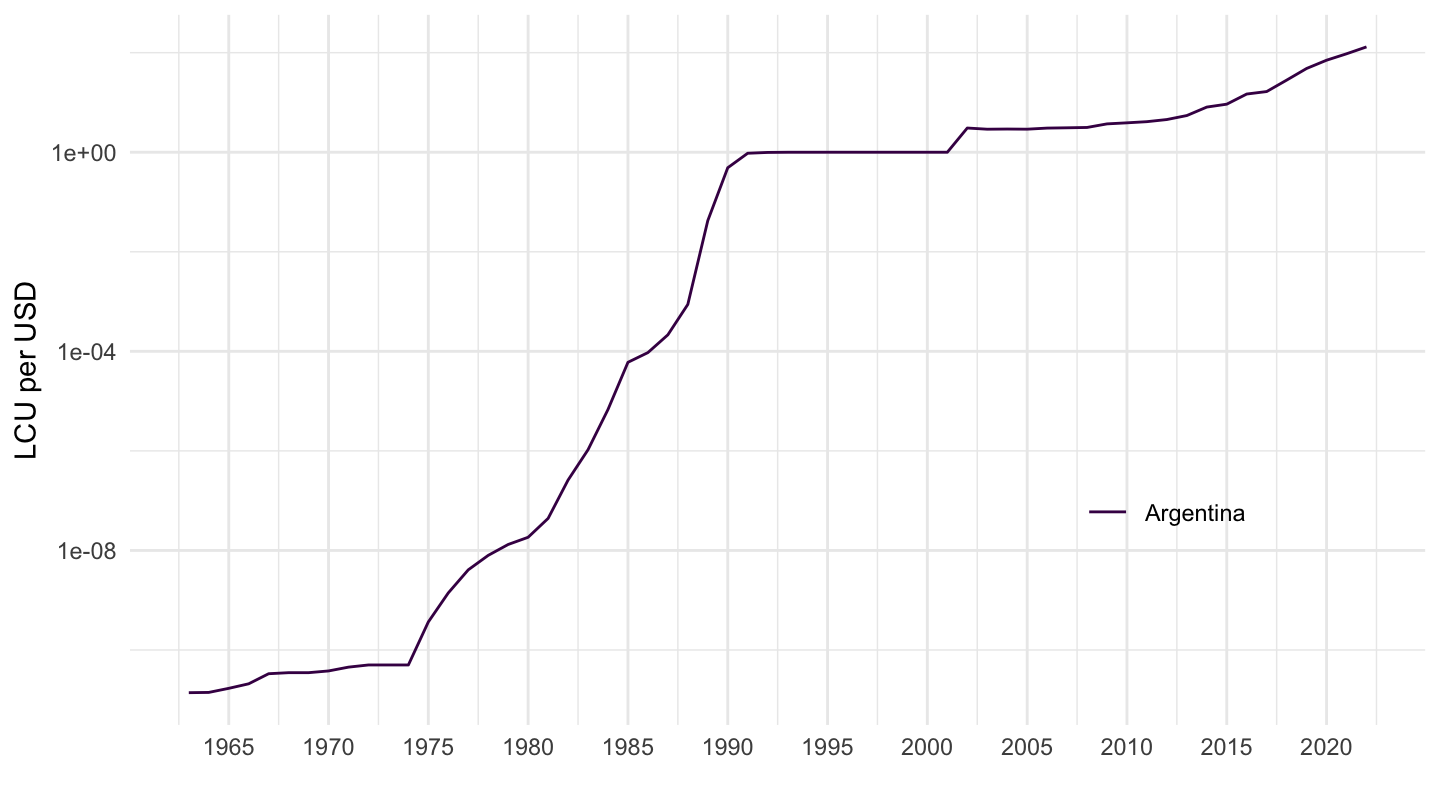
1990-2019
Code
PA.NUS.FCRF %>%
  filter(iso2c %in% c("AR")) %>%
  left_join(iso2c, by = "iso2c") %>%
  year_to_date %>%
  filter(date >= as.Date("1990-01-01")) %>%
  ggplot(.) + theme_minimal() + xlab("") + ylab("LCU per USD") +
  scale_color_manual(values = viridis(4)[1:3]) +
  geom_line(aes(x = date, y = PA.NUS.FCRF, color = Iso2c)) +
  theme(legend.title = element_blank(),
        legend.position = c(0.8, 0.3)) +
  scale_x_date(breaks = seq(1950, 2100, 5) %>% paste0("-01-01") %>% as.Date,
               labels = date_format("%Y")) +
  scale_y_log10(breaks = c(1, 2, 3, 5, 8, 10, 20, 30, 50))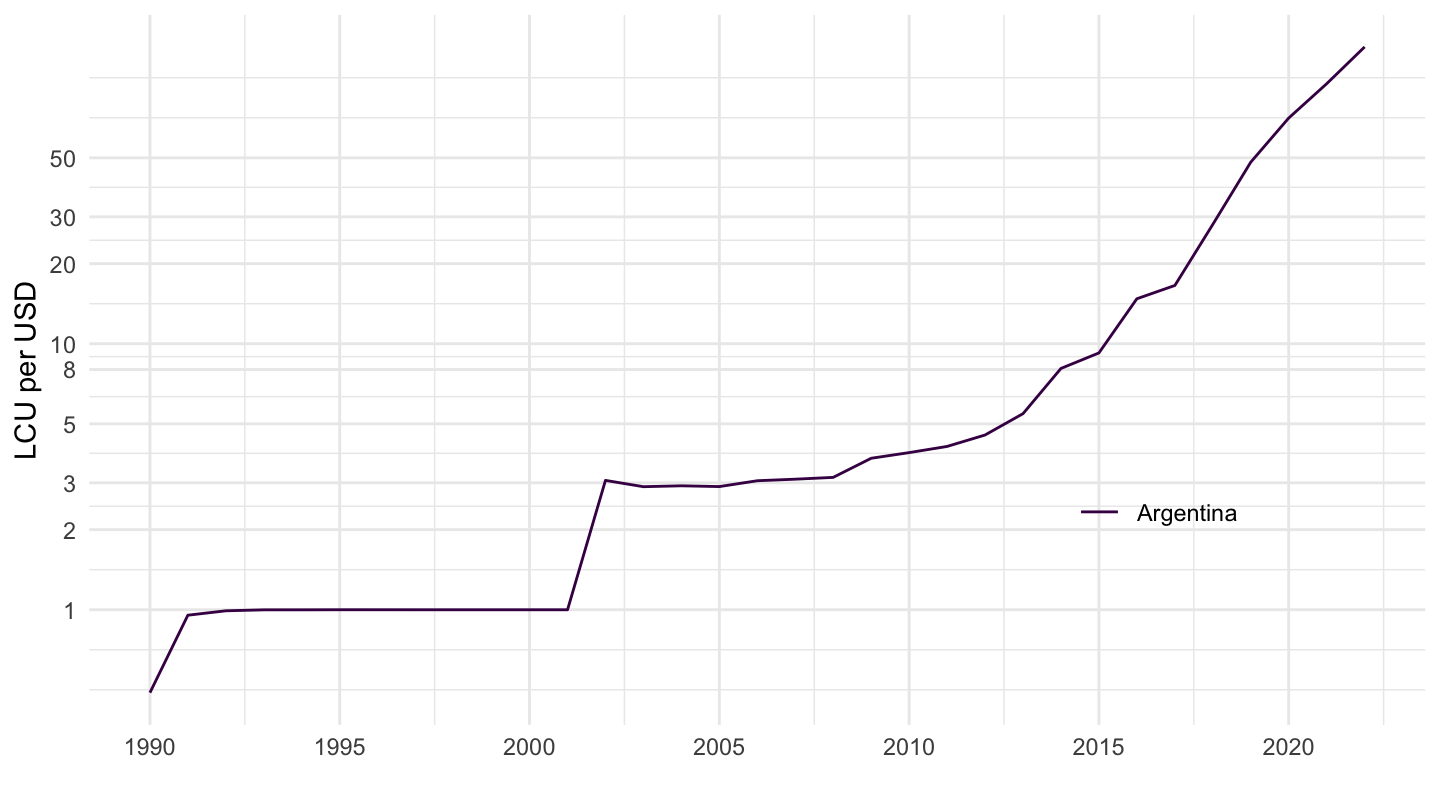
Singapore
Code
PA.NUS.FCRF %>%
  filter(iso2c %in% c("SG")) %>%
  left_join(iso2c, by = "iso2c") %>%
  year_to_date %>%
  ggplot(.) + theme_minimal() + scale_color_manual(values = viridis(4)[1:3]) + xlab("") + ylab("LCU per USD") +
  geom_line(aes(x = date, y = PA.NUS.FCRF, color = Iso2c, linetype = Iso2c)) +
  theme(legend.title = element_blank(),
        legend.position = c(0.5, 0.9),
        legend.direction = "horizontal") +
  scale_x_date(breaks = seq(1950, 2100, 5) %>% paste0("-01-01") %>% as.Date,
               labels = date_format("%Y")) +
  scale_y_log10()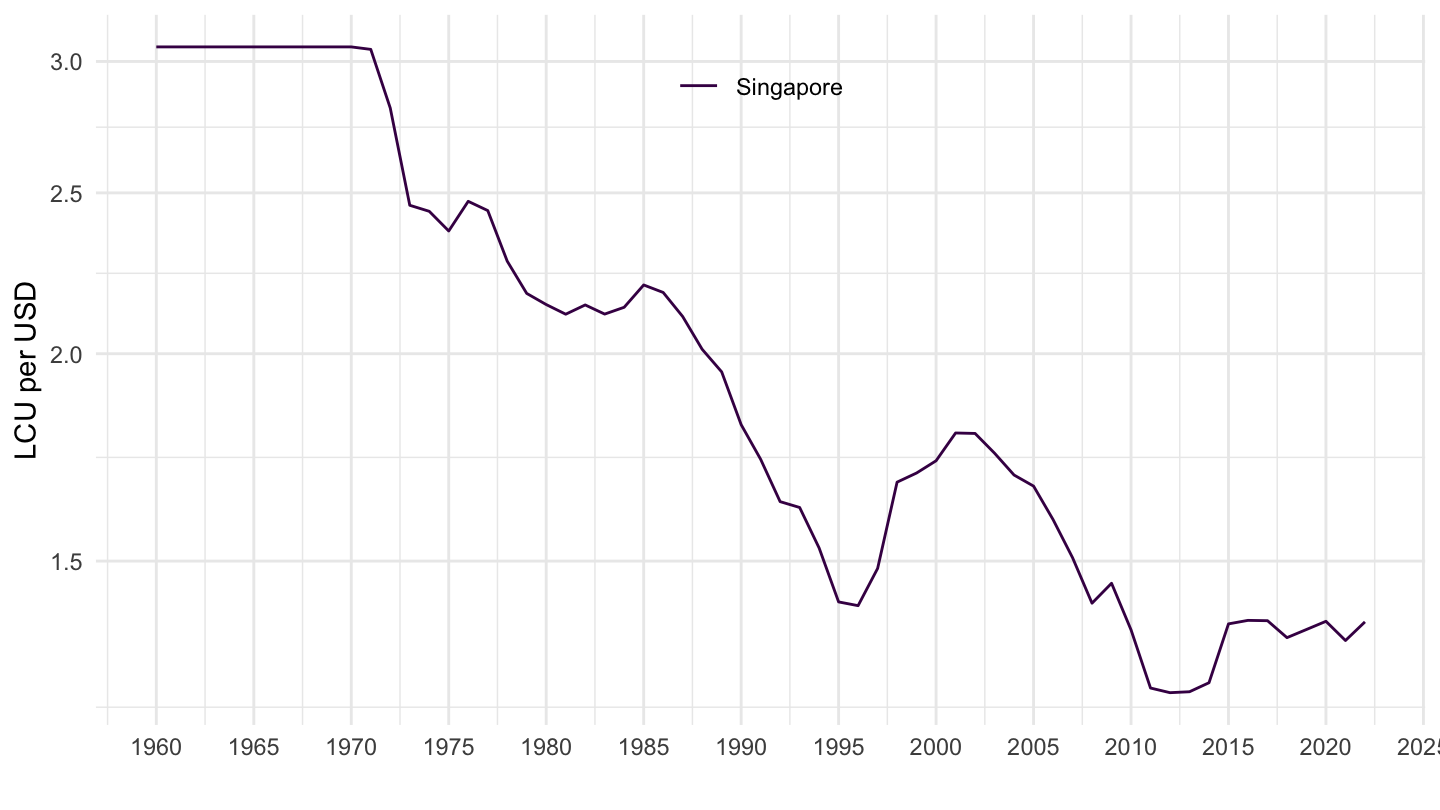
Japan
All
Code
PA.NUS.FCRF %>%
  filter(iso2c %in% c("JP")) %>%
  left_join(iso2c, by = "iso2c") %>%
  year_to_date %>%
  ggplot(.) + theme_minimal() + scale_color_manual(values = viridis(4)[1:3]) + xlab("") + ylab("LCU per USD") +
  geom_line(aes(x = date, y = PA.NUS.FCRF, color = Iso2c, linetype = Iso2c)) +
  theme(legend.title = element_blank(),
        legend.position = c(0.5, 0.9),
        legend.direction = "horizontal") +
  scale_x_date(breaks = seq(1950, 2100, 5) %>% paste0("-01-01") %>% as.Date,
               labels = date_format("%Y")) +
  scale_y_log10()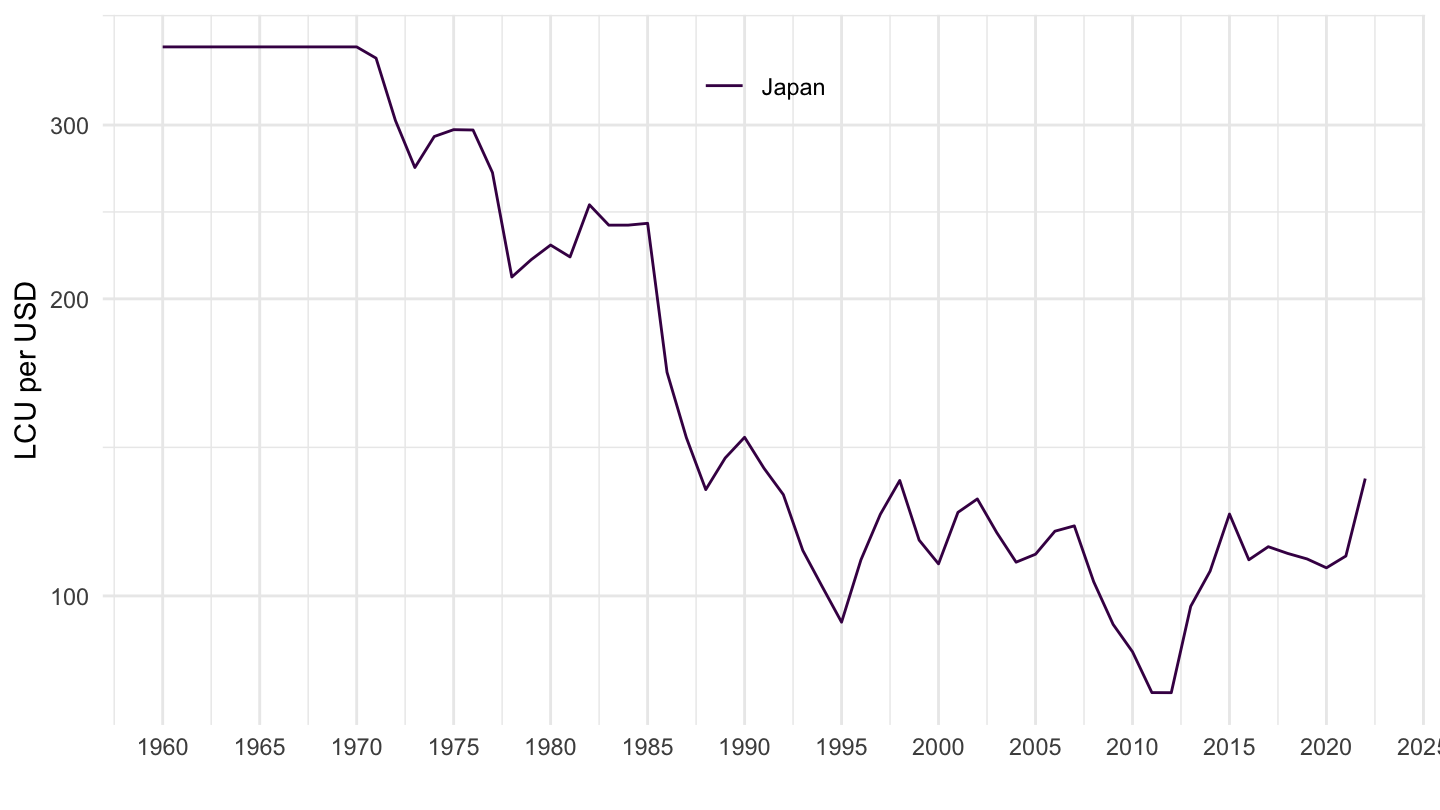
After 2000
Code
PA.NUS.FCRF %>%
  filter(iso2c %in% c("JP")) %>%
  left_join(iso2c, by = "iso2c") %>%
  year_to_date %>%
  filter(date >= as.Date("2000-01-01")) %>%
  ggplot(.) + theme_minimal() + scale_color_manual(values = viridis(4)[1:3]) + xlab("") + ylab("LCU per USD") +
  geom_line(aes(x = date, y = PA.NUS.FCRF, color = Iso2c, linetype = Iso2c)) +
  theme(legend.title = element_blank(),
        legend.position = c(0.5, 0.9),
        legend.direction = "horizontal") +
  scale_x_date(breaks = seq(1950, 2100, 1) %>% paste0("-01-01") %>% as.Date,
               labels = date_format("%Y")) +
  scale_y_log10(breaks = seq(10, 200, 10))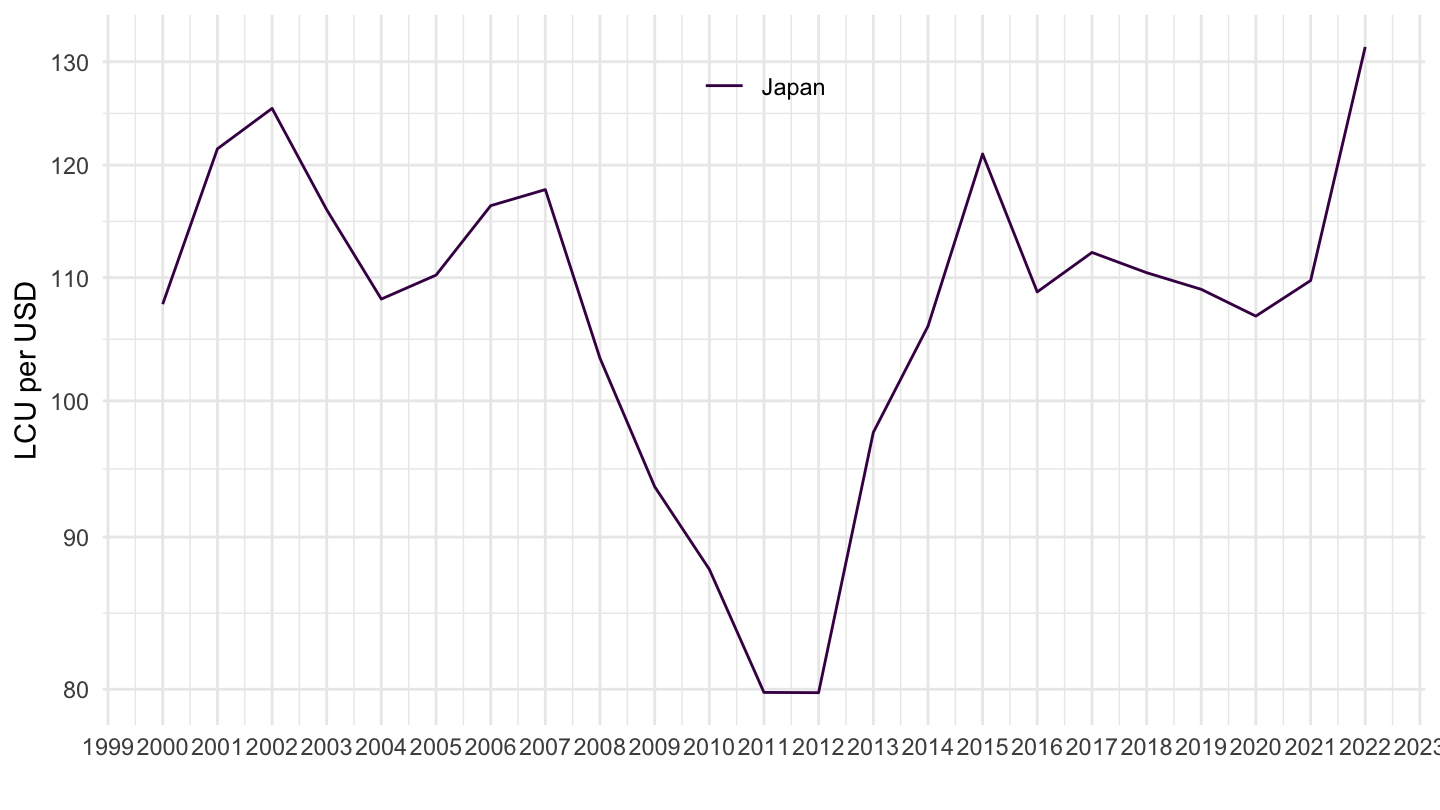
Costa Rica
Code
PA.NUS.FCRF %>%
  filter(iso2c %in% c("CR")) %>%
  left_join(iso2c, by = "iso2c") %>%
  year_to_date %>%
  ggplot(.) + theme_minimal() + scale_color_manual(values = viridis(4)[1:3]) + xlab("") + ylab("LCU per USD") +
  geom_line(aes(x = date, y = PA.NUS.FCRF, color = Iso2c, linetype = Iso2c)) +
  theme(legend.title = element_blank(),
        legend.position = c(0.5, 0.9),
        legend.direction = "horizontal") +
  scale_x_date(breaks = seq(1950, 2100, 5) %>% paste0("-01-01") %>% as.Date,
               labels = date_format("%Y")) +
  scale_y_log10()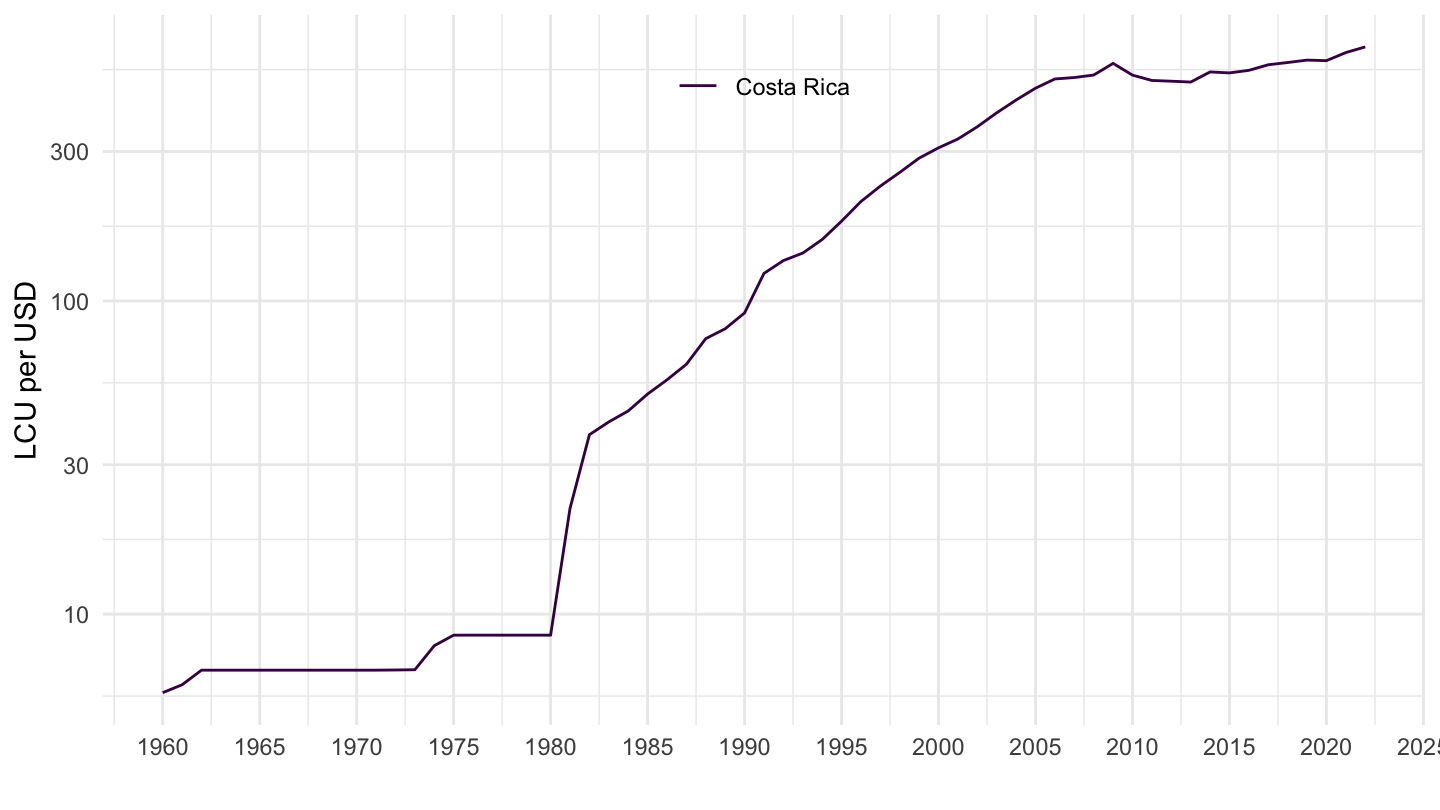
Zimbabwe
Code
PA.NUS.FCRF %>%
  filter(iso2c %in% c("ZW")) %>%
  left_join(iso2c, by = "iso2c") %>%
  year_to_date %>%
  ggplot(.) + theme_minimal() + scale_color_manual(values = viridis(4)[1:3]) + xlab("") + ylab("LCU per USD") +
  geom_line(aes(x = date, y = PA.NUS.FCRF, color = Iso2c, linetype = Iso2c)) +
  theme(legend.title = element_blank(),
        legend.position = c(0.5, 0.9),
        legend.direction = "horizontal") +
  scale_x_date(breaks = seq(1950, 2100, 5) %>% paste0("-01-01") %>% as.Date,
               labels = date_format("%Y")) +
  scale_y_log10()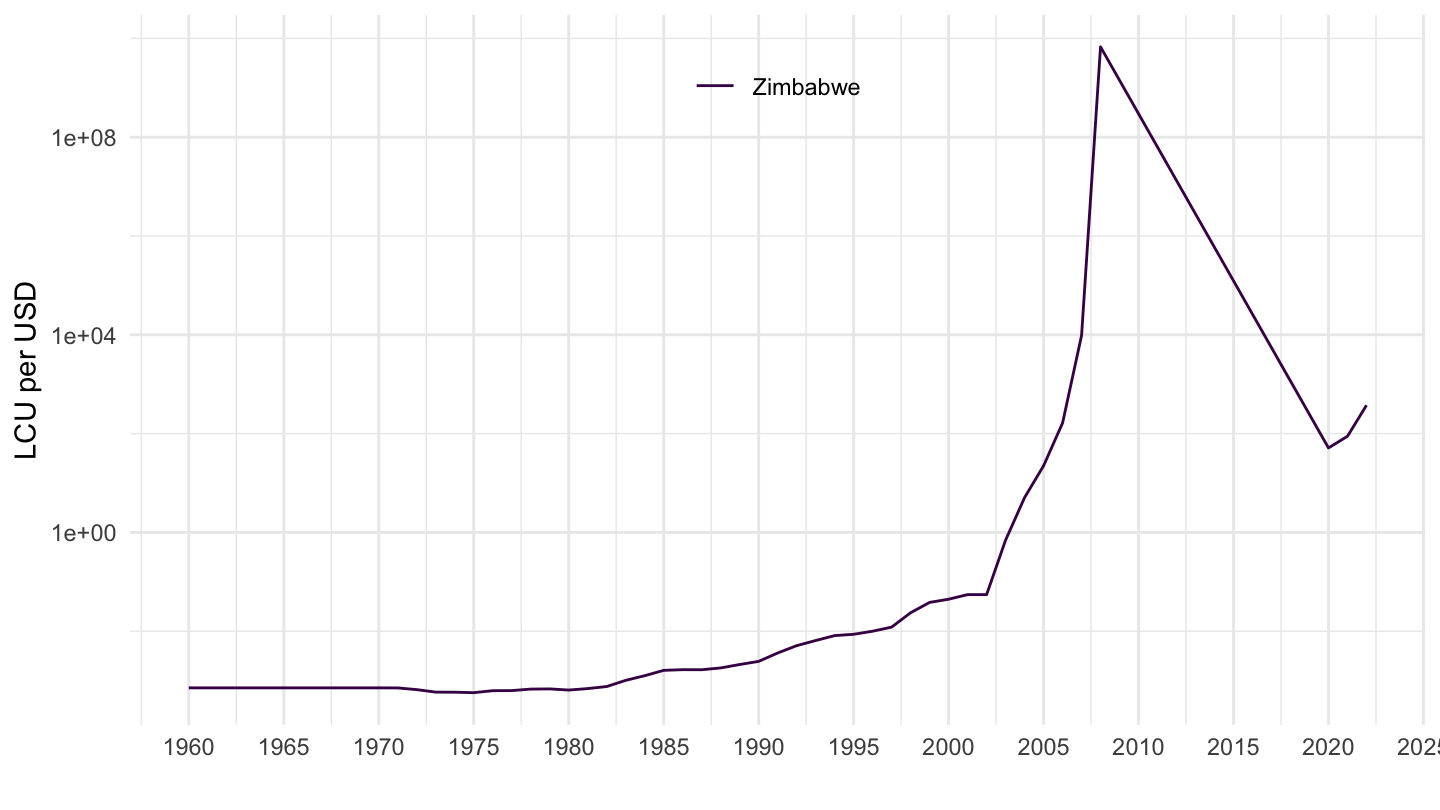
Vietnam, Somalia, Iran
Code
PA.NUS.FCRF %>%
  filter(iso2c %in% c("VN", "SO", "IR")) %>%
  left_join(iso2c, by = "iso2c") %>%
  year_to_date %>%
  ggplot(.) + theme_minimal() + scale_color_manual(values = viridis(4)[1:3]) + xlab("") + ylab("LCU per USD") +
  geom_line(aes(x = date, y = PA.NUS.FCRF, color = Iso2c, linetype = Iso2c)) +
  theme(legend.title = element_blank(),
        legend.position = c(0.8, 0.3)) +
  scale_x_date(breaks = seq(1950, 2100, 5) %>% paste0("-01-01") %>% as.Date,
               labels = date_format("%Y")) +
  scale_y_log10()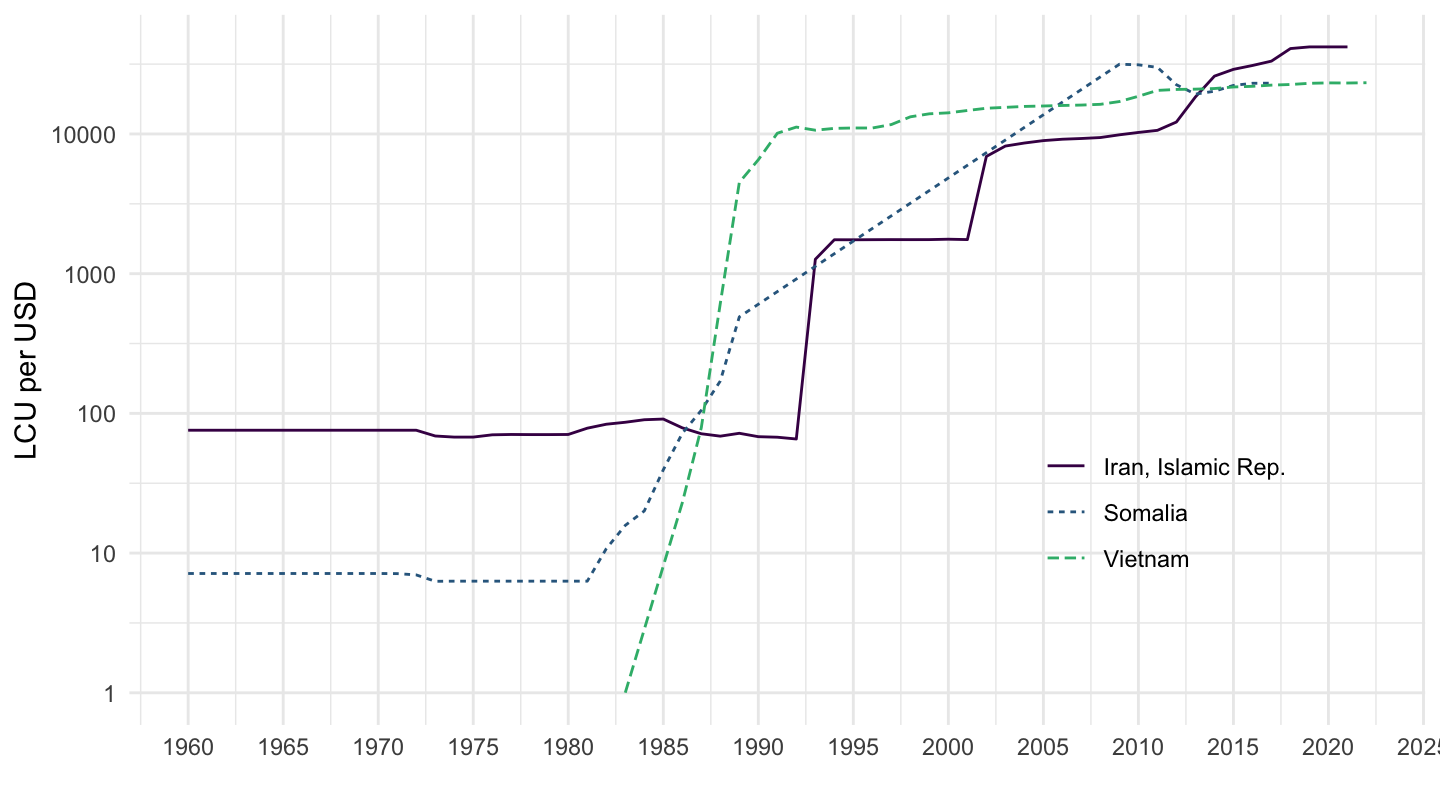
Lebanon
All
Code
PA.NUS.FCRF %>%
  filter(iso2c %in% c("LB")) %>%
  left_join(iso2c, by = "iso2c") %>%
  year_to_date %>%
  ggplot(.) + theme_minimal() + scale_color_manual(values = viridis(4)[1:3]) + xlab("") + ylab("LCU per USD") +
  geom_line(aes(x = date, y = PA.NUS.FCRF, color = Iso2c, linetype = Iso2c)) +
  theme(legend.title = element_blank(),
        legend.position = c(0.8, 0.3)) +
  scale_x_date(breaks = seq(1950, 2100, 5) %>% paste0("-01-01") %>% as.Date,
               labels = date_format("%Y")) +
  scale_y_log10()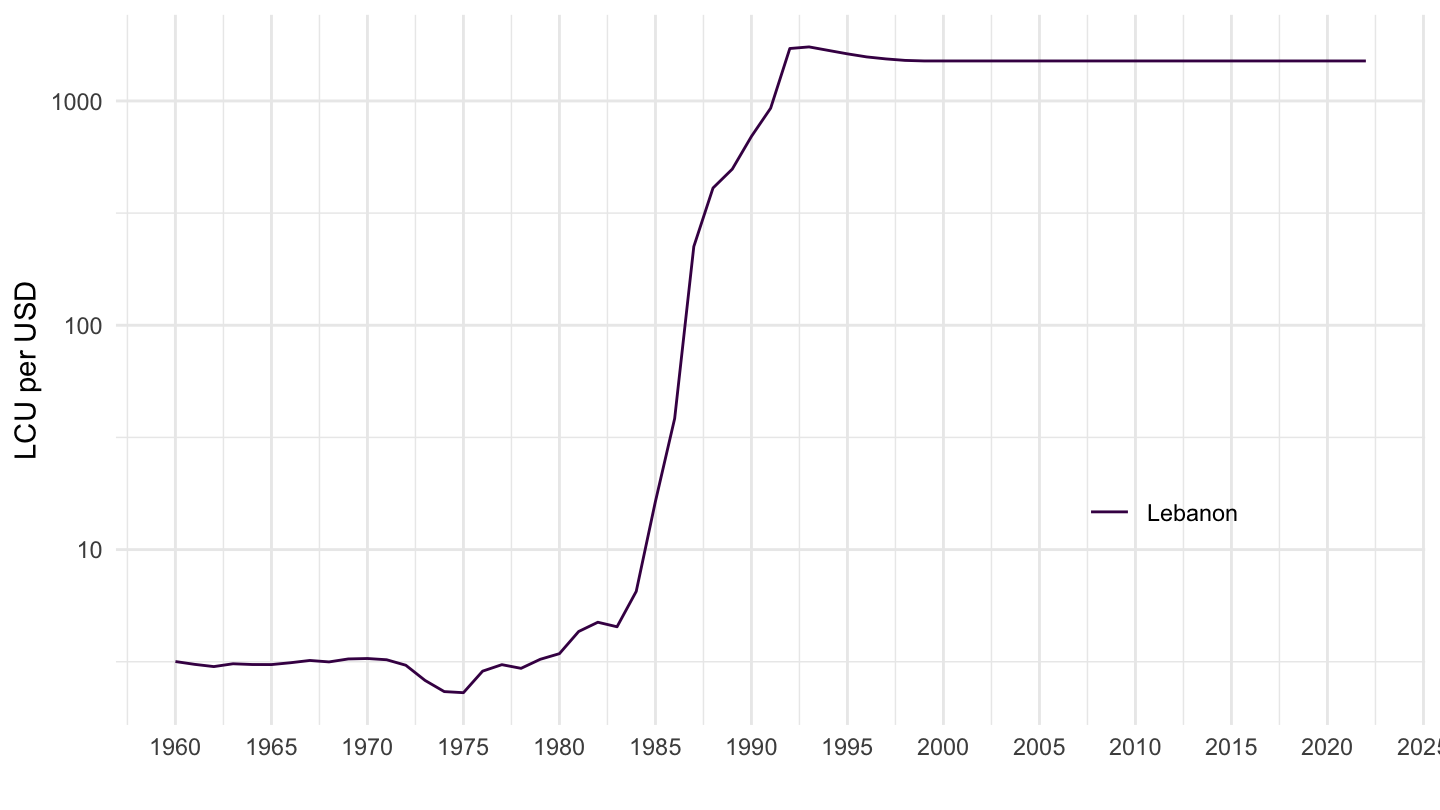
After 1998
Code
PA.NUS.FCRF %>%
  filter(iso2c %in% c("LB"),
         year >= 1998) %>%
  left_join(iso2c, by = "iso2c") %>%
  year_to_date %>%
  ggplot(.) + theme_minimal() + scale_color_manual(values = viridis(4)[1:3]) + xlab("") + ylab("LCU per USD") +
  geom_line(aes(x = date, y = PA.NUS.FCRF, color = Iso2c, linetype = Iso2c)) +
  theme(legend.title = element_blank(),
        legend.position = c(0.8, 0.3)) +
  scale_x_date(breaks = seq(1950, 2100, 1) %>% paste0("-01-01") %>% as.Date,
               labels = date_format("%Y")) +
  scale_y_log10()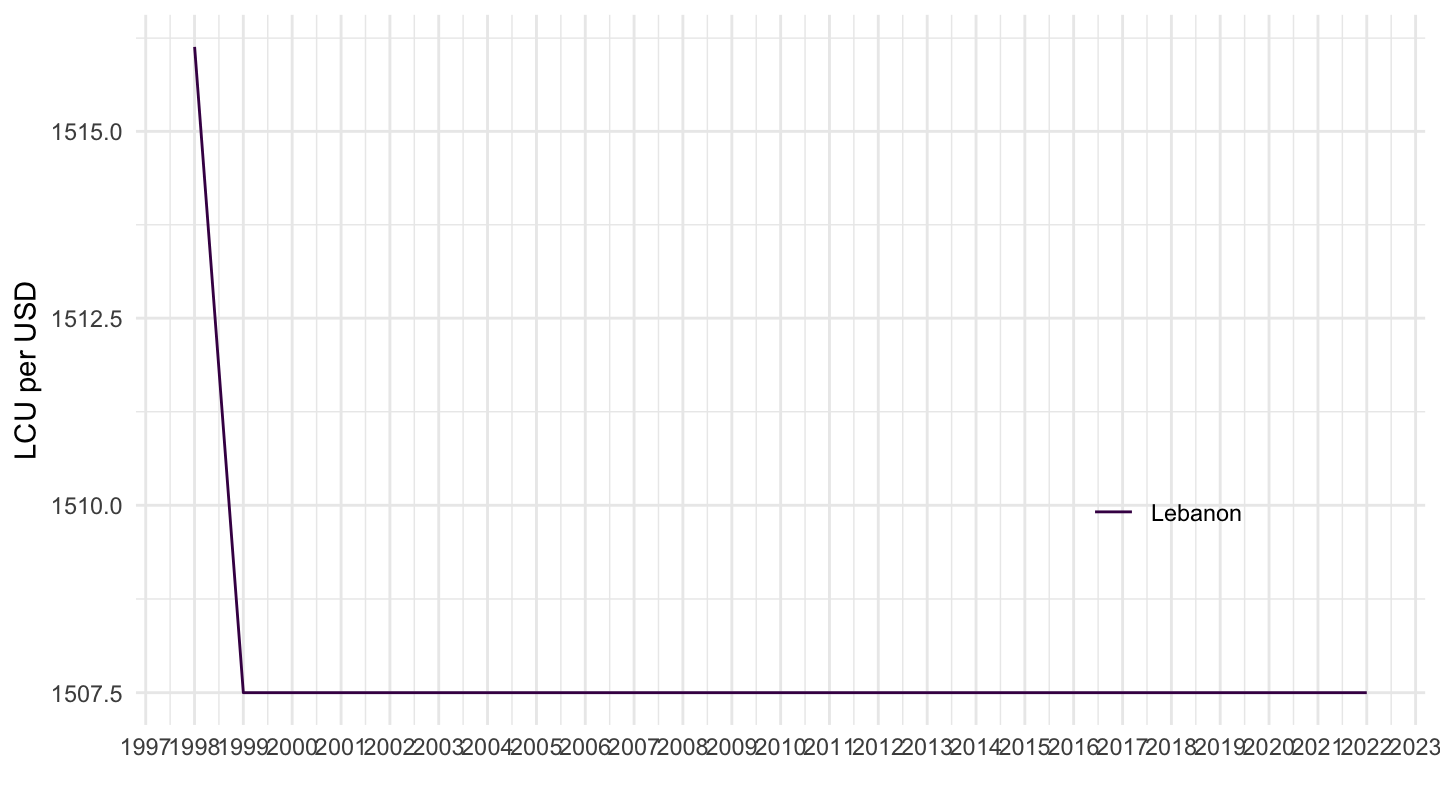
Barbados
Code
PA.NUS.FCRF %>%
  filter(iso2c %in% c("BB")) %>%
  left_join(iso2c, by = "iso2c") %>%
  year_to_date %>%
  ggplot(.) + theme_minimal() + scale_color_manual(values = viridis(4)[1:3]) + xlab("") + ylab("LCU per USD") +
  geom_line(aes(x = date, y = PA.NUS.FCRF, color = Iso2c, linetype = Iso2c)) +
  theme(legend.title = element_blank(),
        legend.position = c(0.8, 0.3)) +
  scale_x_date(breaks = seq(1950, 2100, 5) %>% paste0("-01-01") %>% as.Date,
               labels = date_format("%Y")) +
  scale_y_log10()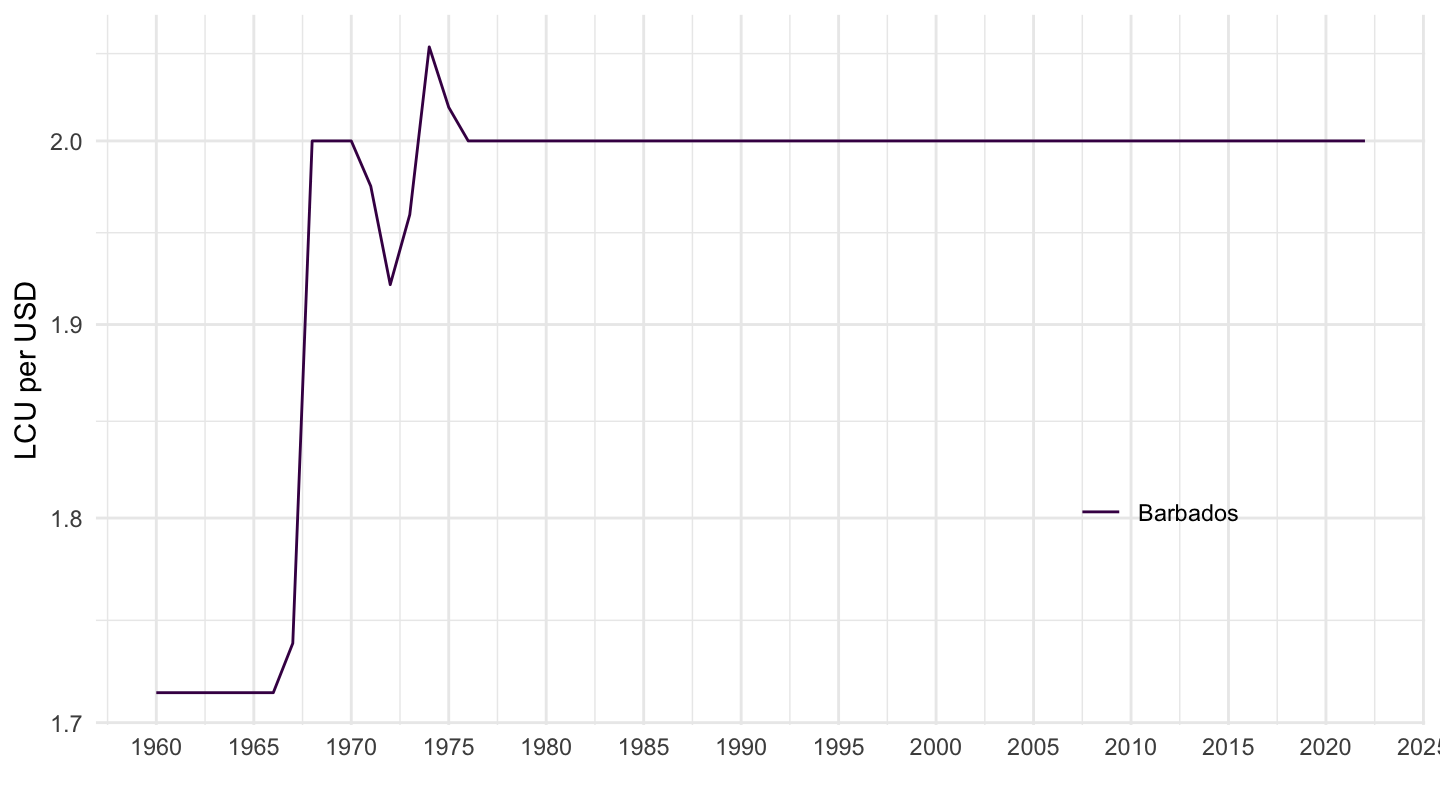
Spain, United Kingdom, United States
Code
PA.NUS.FCRF %>%
  filter(iso2c %in% c("US", "GB", "ES")) %>%
  left_join(iso2c, by = "iso2c") %>%
  year_to_date %>%
  ggplot(.) + theme_minimal() + scale_color_manual(values = viridis(4)[1:3]) + xlab("") + ylab("LCU per USD") +
  geom_line(aes(x = date, y = PA.NUS.FCRF, color = Iso2c, linetype = Iso2c)) +
  theme(legend.title = element_blank(),
        legend.position = c(0.8, 0.3)) +
  scale_x_date(breaks = seq(1950, 2100, 5) %>% paste0("-01-01") %>% as.Date,
               labels = date_format("%Y")) +
  scale_y_log10()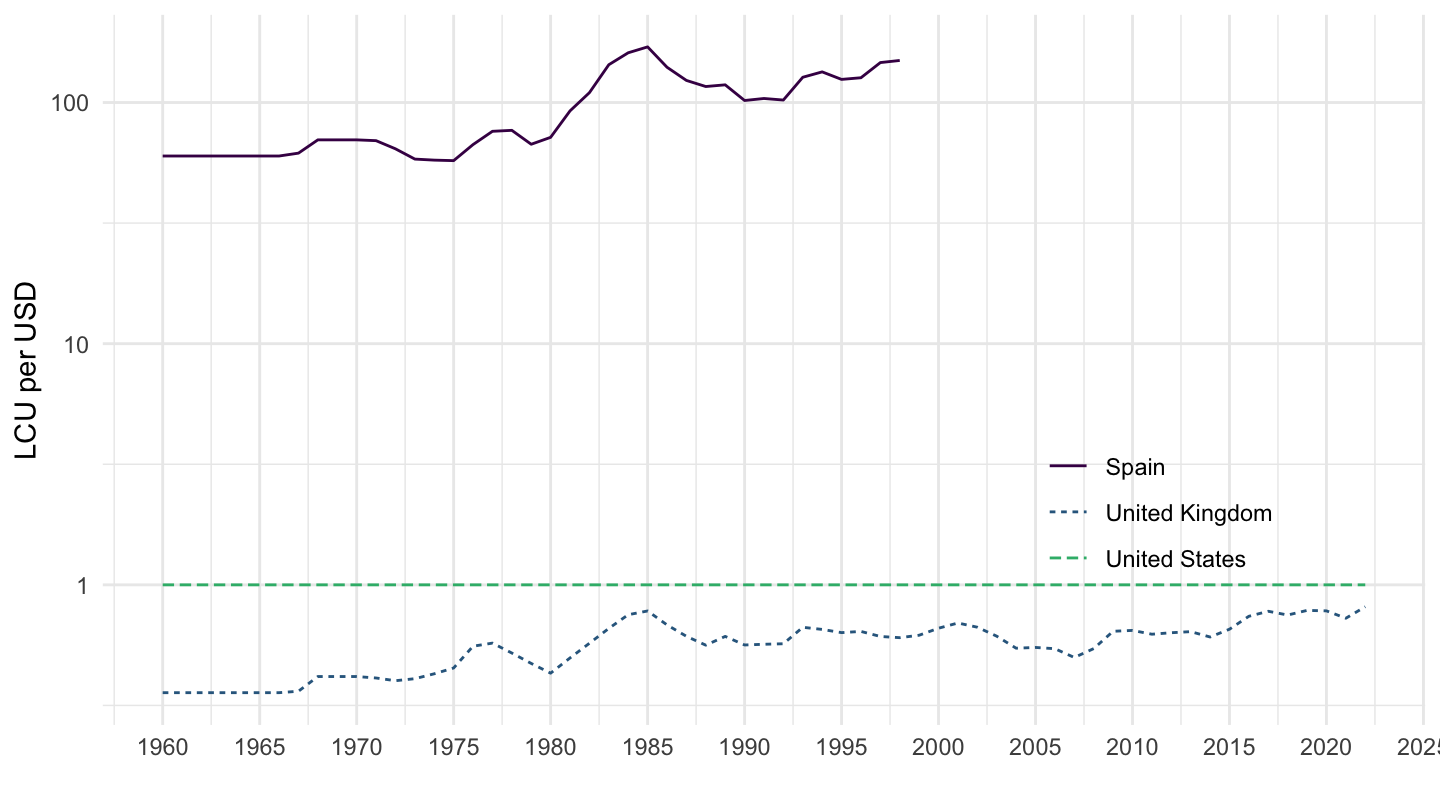
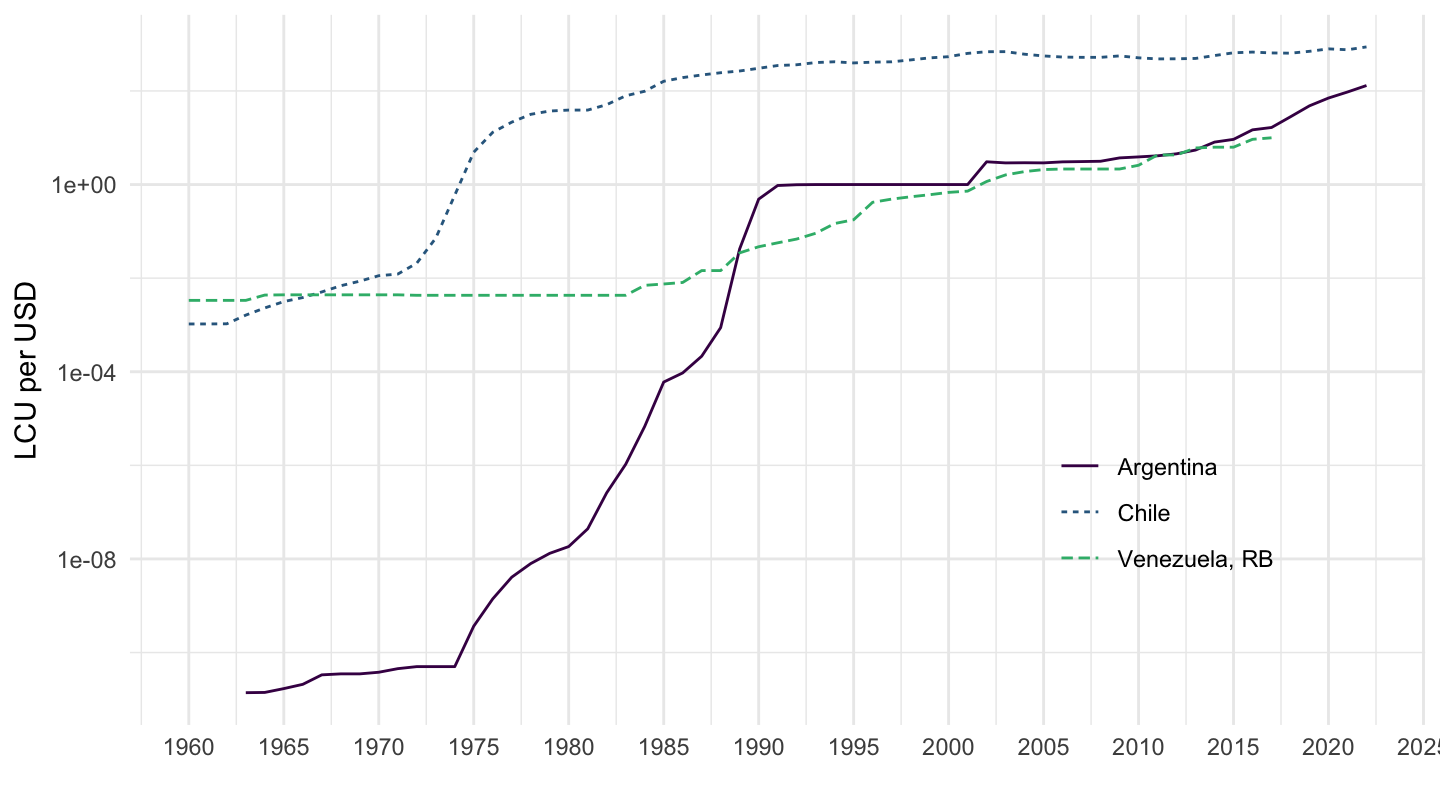
Argentina, Chile, Venezuela
Code
PA.NUS.FCRF %>%
  filter(iso2c %in% c("AR", "CL", "VE")) %>%
  left_join(iso2c, by = "iso2c") %>%
  year_to_date %>%
  ggplot(.) + theme_minimal() + scale_color_manual(values = viridis(4)[1:3]) + xlab("") + ylab("LCU per USD") +
  geom_line(aes(x = date, y = PA.NUS.FCRF, color = Iso2c, linetype = Iso2c)) +
  theme(legend.title = element_blank(),
        legend.position = c(0.8, 0.3)) +
  scale_x_date(breaks = seq(1950, 2100, 5) %>% paste0("-01-01") %>% as.Date,
               labels = date_format("%Y")) +
  scale_y_log10()