Last observation: 8 janv. 2021 (N = 39)
First observation: 31 janv. 1590 (N = 1)
Last data update: 19 oct. 2026, 23:49
Last compile: 19 oct. 2026, 23:51
xrates_info |>
  select(Ticker, Name, Country) |>
  right_join(xrates |>
               group_by(Ticker) |>
               summarise(Nobs = n()), by = "Ticker") |>
  arrange(-Nobs) %>%
{if (is_html_output()) datatable(., filter = 'top', rownames = F) else .}xrates_info |>
select(Ticker, Name, Country) |>
right_join(xrates |>
group_by(Ticker) |>
summarise(Nobs = n(),
start = first(year(date)),
end = last(year(date))), by = "Ticker") |>
arrange(-Nobs) %>%
{if (is_html_output()) datatable(., filter = 'top', rownames = F) else .}xrates |>
filter(Ticker == "USDBRL") |>
ggplot() + geom_line(aes(x = date, y = value)) +
theme_minimal() + ylab("Brazil Real per US Dollar") + xlab("") +
scale_x_date(breaks = seq(1800, 2100, 20) |> paste0("-01-01") |> as.Date(),
labels = date_format("%Y")) +
scale_y_log10(breaks = 10^seq(-20, 1, 1))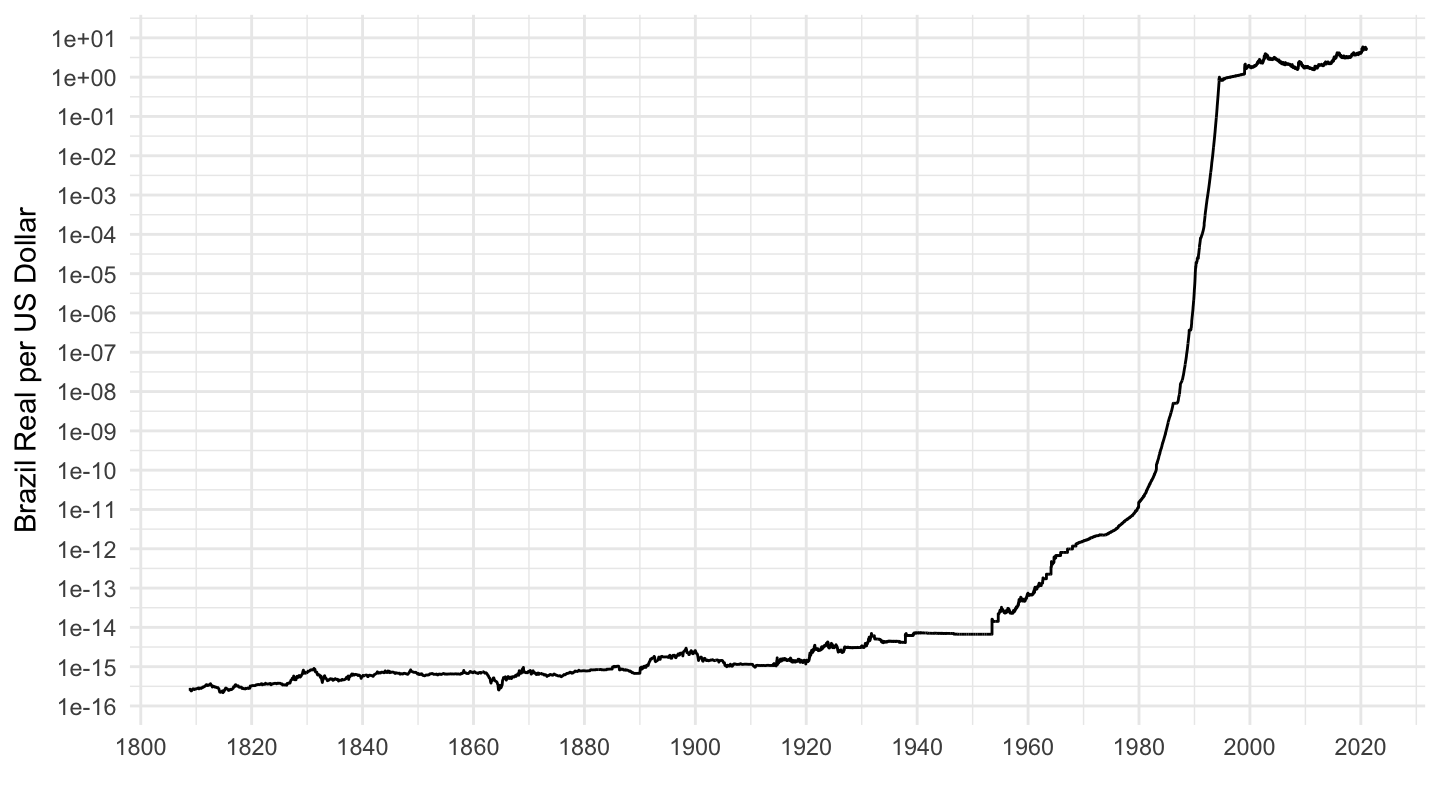
xrates |>
  filter(Ticker == "USDBRL",
         date >= as.Date("1940-01-01"),
         date <= as.Date("1970-01-01")) |>
  ggplot() + geom_line(aes(x = date, y = value)) +
  theme_minimal() + ylab("Brazil Real per US Dollar") + xlab("") +
  scale_x_date(breaks = seq(1800, 2100, 2) |> paste0("-01-01") |> as.Date(),
               labels = date_format("%Y")) +
  scale_y_log10(breaks = c(10^seq(-20, 1, 1), 2*10^seq(-20, 1, 1), 5*10^seq(-20, 1, 1)))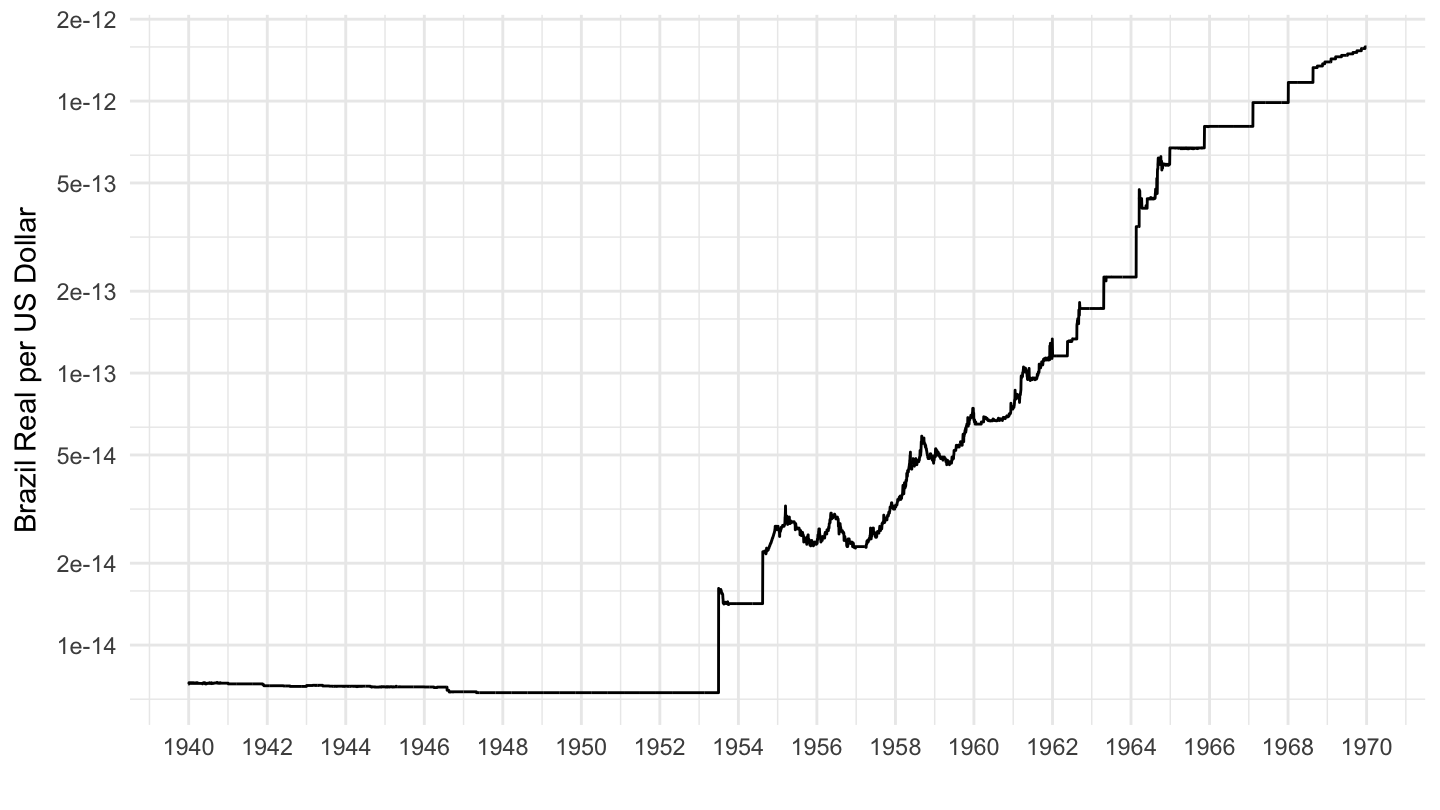
xrates |>
  filter(iso3c == "GBP",
         iso3c_c == "ITL") |>
  ggplot() + geom_line(aes(x = date, y = value)) + theme_minimal() +
  scale_x_date(breaks = as.Date(paste0(seq(1800, 2025, 20), "-01-01")),
               labels = date_format("%Y")) +
  scale_y_log10(breaks = c(10, 20, 50, 100, 200, 500, 1000, 2000, 5000)) +
  ylab("Italian Lira per British Pound") + xlab("")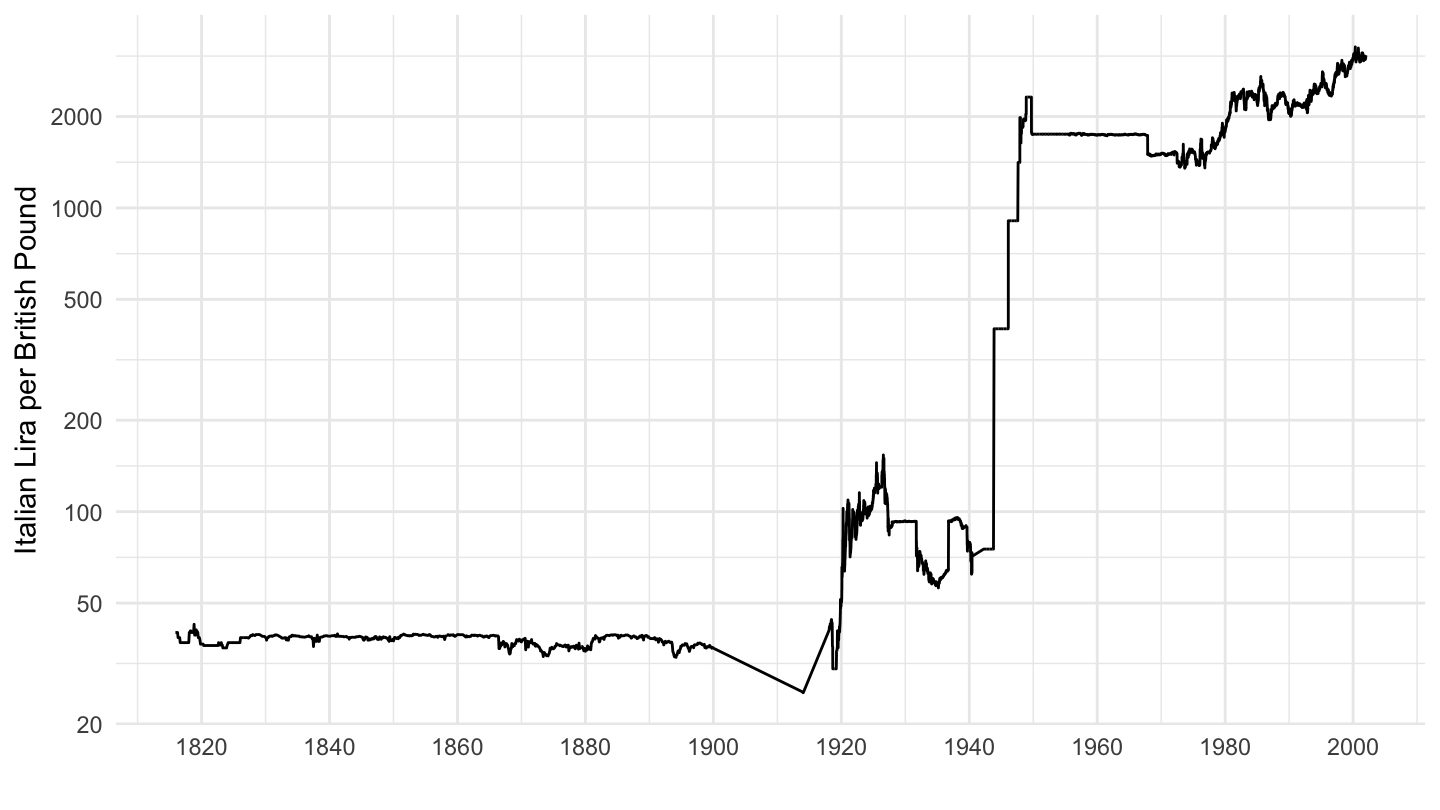
xrates |>
  filter(iso3c == "GBP",
         iso3c_c == "ITL") |>
  filter(date >= as.Date("1940-01-01"),
         date <= as.Date("1971-01-01")) |>
  ggplot() + geom_line(aes(x = date, y = value)) + theme_minimal() +
  scale_x_date(breaks = as.Date(paste0(seq(1800, 2025, 2), "-01-01")),
               labels = date_format("%Y")) +
  scale_y_log10(breaks = c(10, 20, 50, 100, 200, 500, 1000, 2000, 5000)) +
  ylab("Italian Lira per British Pound") + xlab("")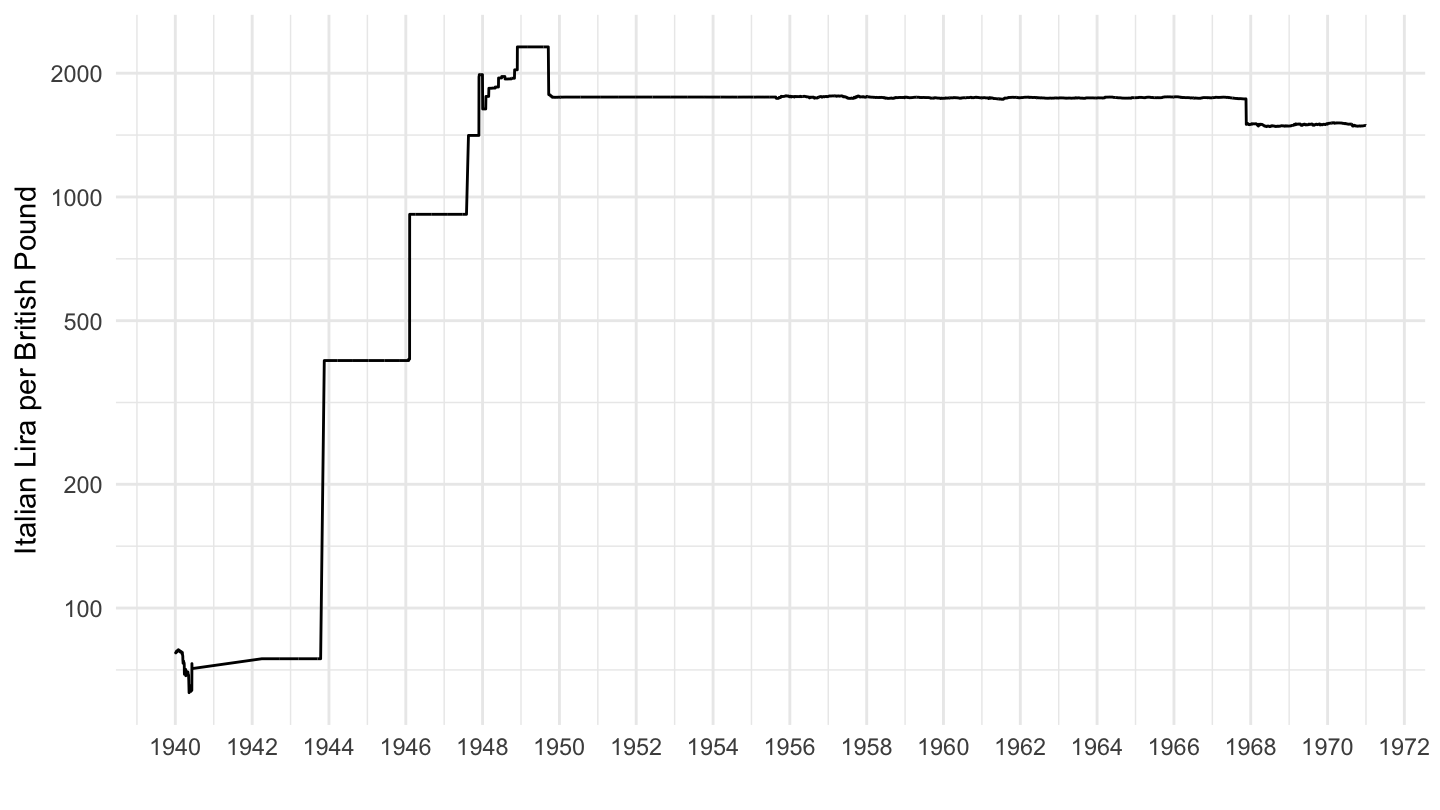
xrates |>
  bind_rows(cpi) |>
  filter(Ticker %in% c("GBPITL", "CPGBRM", "CPITAM"),
         date >= as.Date("1950-01-01")) |>
  select(Ticker, date, value) |>
  spread(Ticker, value) |>
  na.omit() |>
  mutate(GBPITL_real = GBPITL*CPGBRM/CPITAM,
         GBPITL_real = 100*GBPITL_real/GBPITL_real[1]) |>
  ggplot() + geom_line(aes(x = date, y = GBPITL_real)) + theme_minimal() +
  scale_x_date(breaks = as.Date(paste0(seq(1800, 2025, 5), "-01-01")),
               labels = date_format("%Y")) +
  scale_y_log10(breaks = seq(50, 200, 5)) +
  ylab("Italian Lira per British Pound") + xlab("")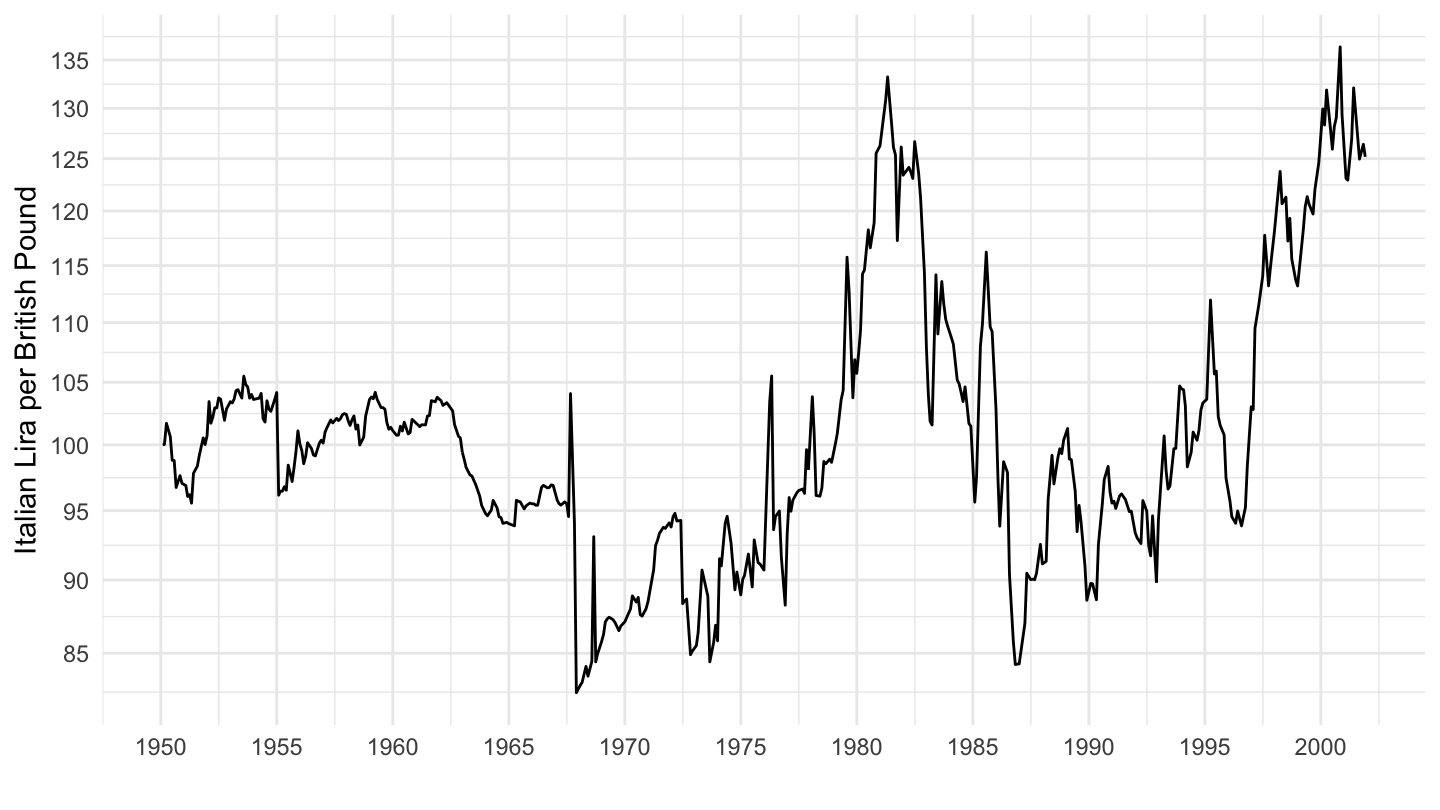
xrates |>
  bind_rows(cpi) |>
  filter(Ticker %in% c("USDGBP", "USDFRF", "USDDEM", "GBPITL", "CPGBRM", "CPITAM", "CPFRAM", "CPDEUM", "CPUSAM"),
         date >= as.Date("1950-01-01")) |>
  select(Ticker, date, value) |>
  spread(Ticker, value) |>
  na.omit() |>
  transmute(date,
            USDITL_real = USDGBP*GBPITL*CPUSAM/CPITAM,
            USDDEM_real = USDDEM*CPUSAM/CPDEUM,
            USDFRF_real = USDFRF*CPUSAM/CPFRAM) |>
  gather(variable, value, -date) |>
  group_by(variable) |>
  mutate(value = 100*value/value[1]) |>
  ggplot() + geom_line(aes(x = date, y = value, color = variable)) + theme_minimal() +
  scale_x_date(breaks = as.Date(paste0(seq(1800, 2025, 5), "-01-01")),
               labels = date_format("%Y")) +
  scale_y_log10(breaks = seq(50, 200, 5)) +
  ylab("Real Exchange Rate") + xlab("") +
  scale_color_manual(values = viridis(4)[1:3]) +
  theme(legend.position = c(0.2, 0.80),
        legend.title = element_blank())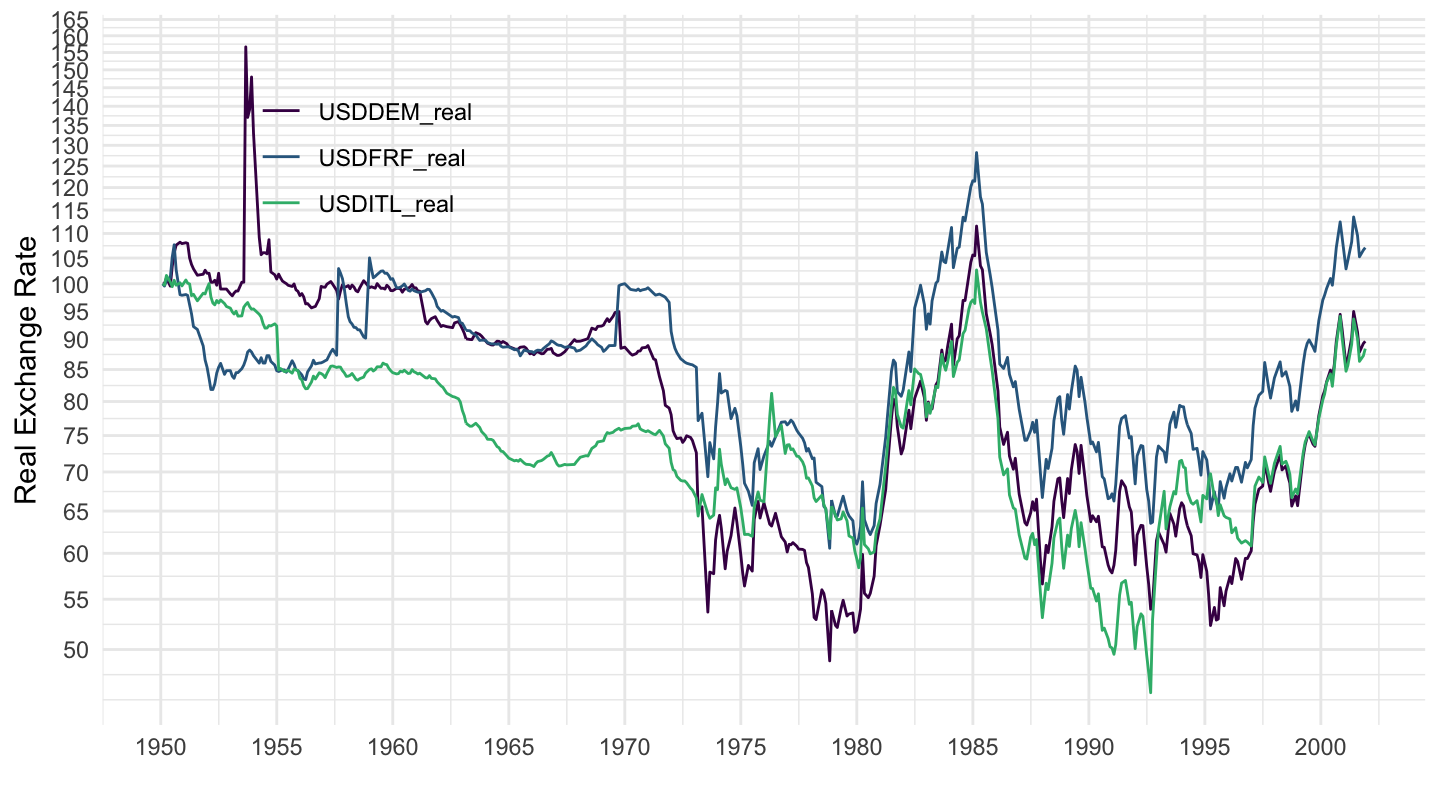
xrates |>
  bind_rows(cpi) |>
  filter(Ticker %in% c("USDGBP", "USDFRF", "USDDEM", "GBPITL", "CPGBRM", "CPITAM", "CPFRAM", "CPDEUM", "CPUSAM"),
         date >= as.Date("1950-01-01"),
         date <= as.Date("1975-01-01")) |>
  select(Ticker, date, value) |>
  spread(Ticker, value) |>
  na.omit() |>
  transmute(date,
            USDITL_real = USDGBP*GBPITL*CPUSAM/CPITAM,
            USDDEM_real = USDDEM*CPUSAM/CPDEUM,
            USDFRF_real = USDFRF*CPUSAM/CPFRAM) |>
  gather(variable, value, -date) |>
  group_by(variable) |>
  mutate(value = 100*value/value[1]) |>
  ggplot() + geom_line(aes(x = date, y = value, color = variable)) + theme_minimal() +
  scale_x_date(breaks = as.Date(paste0(seq(1800, 2025, 5), "-01-01")),
               labels = date_format("%Y")) +
  scale_y_log10(breaks = seq(50, 200, 5)) +
  ylab("Real Exchange Rate") + xlab("") +
  scale_color_manual(values = viridis(4)[1:3]) +
  theme(legend.position = c(0.2, 0.80),
        legend.title = element_blank())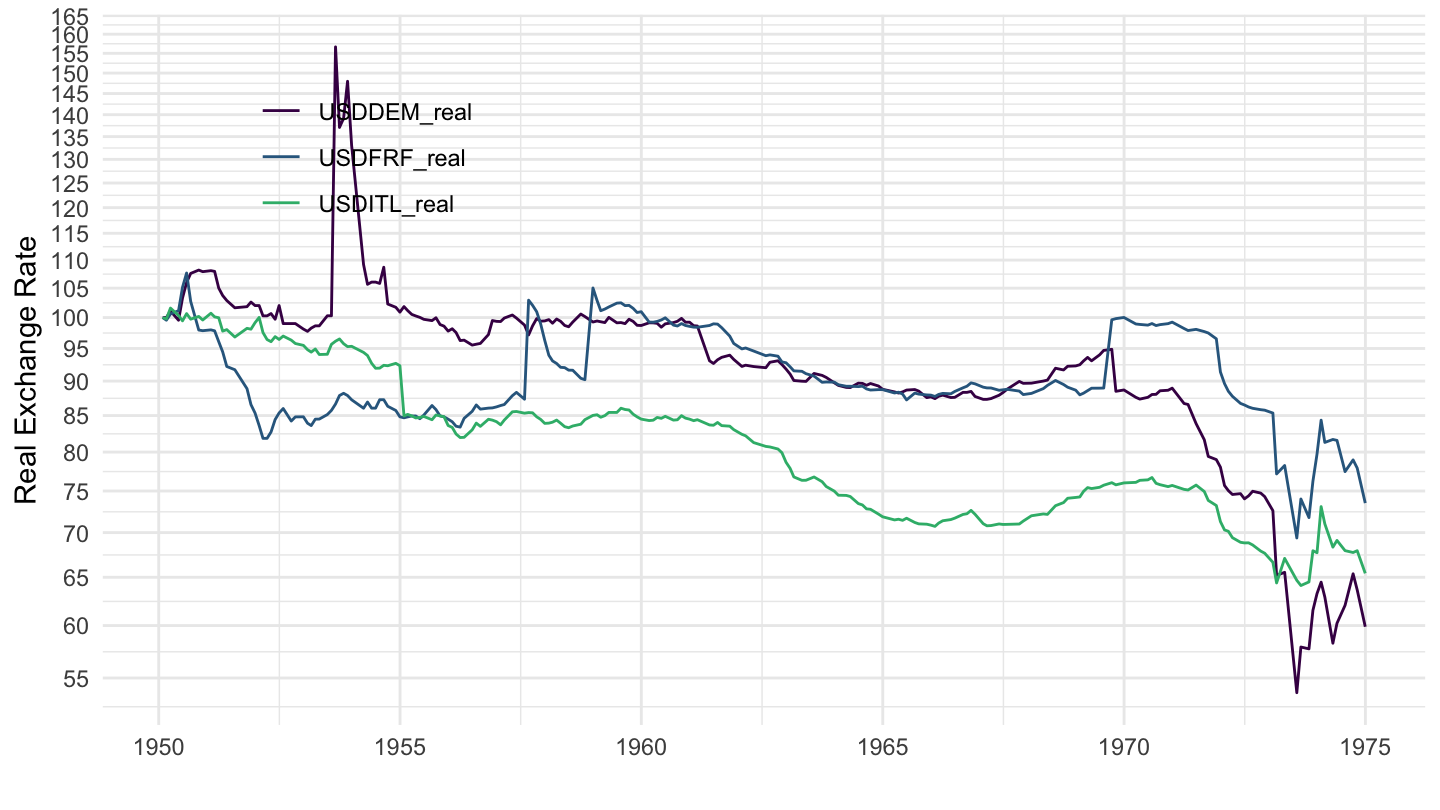
(ref:france-franc-1914-1927) Franc Exchange Rate (1914-1927)
xrates |>
  filter(iso3c == "USD",
         iso3c_c == "FRF",
         date >= as.Date("1914-01-01"),
         date <= as.Date("1927-01-01")) |>
  ggplot() + geom_line(aes(x = date, y = value)) + theme_minimal() +
  scale_x_date(breaks = as.Date(paste0(seq(1850, 2025, 1), "-01-01")),
               labels = date_format("%Y")) +
  scale_y_continuous(breaks = seq(0, 1, 0.01)) +
  ylab("") + xlab("")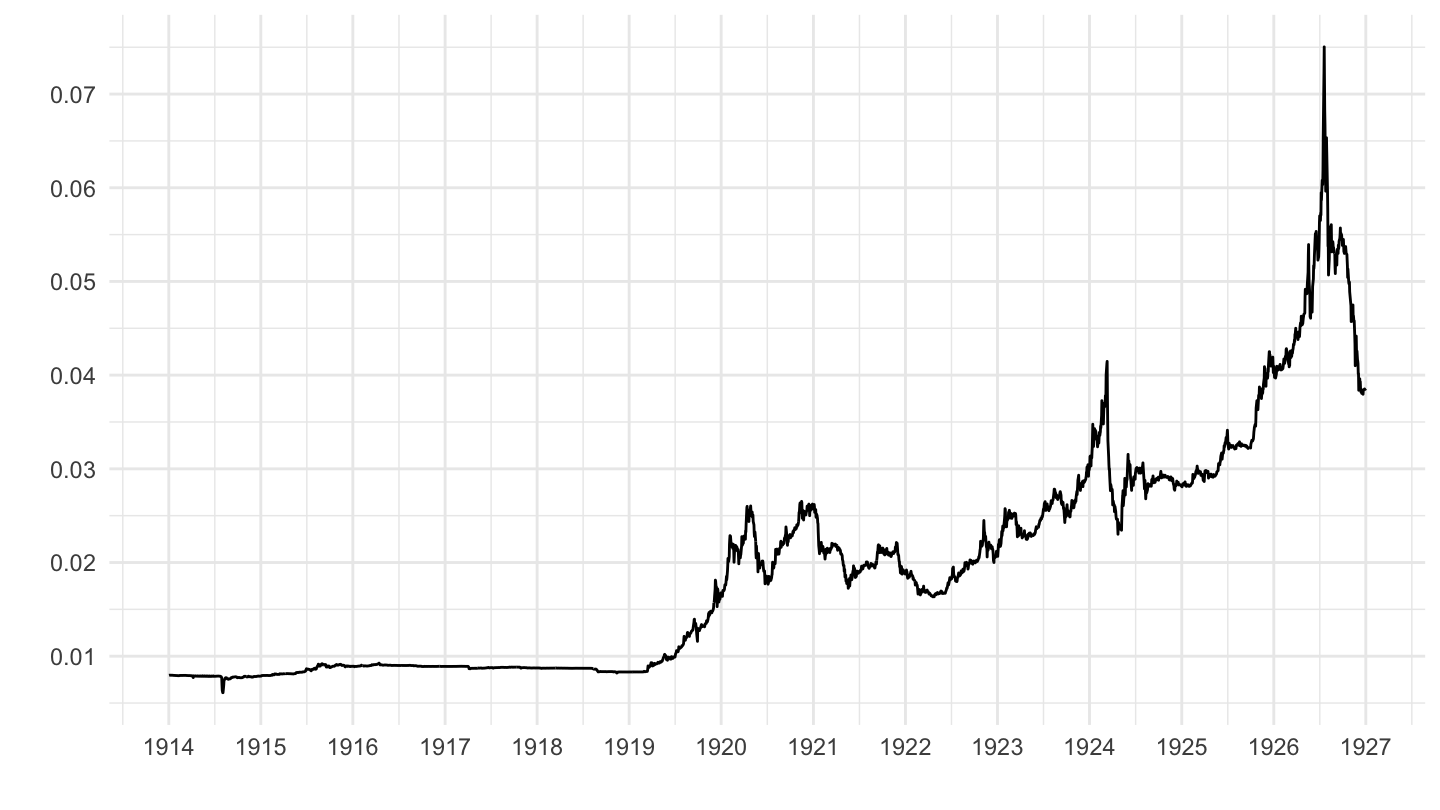
(ref:france-franc-1920-1960) Franc Exchange Rate (1920-1960)
xrates |>
  filter(iso3c == "USD",
         iso3c_c == "FRF",
         date >= as.Date("1920-01-01"),
         date <= as.Date("1960-01-01")) |>
  ggplot() + geom_line(aes(x = date, y = value)) + theme_minimal() +
  scale_x_date(breaks = as.Date(paste0(seq(1850, 2025, 5), "-01-01")),
               labels = date_format("%Y")) +
  scale_y_continuous(breaks = seq(0, 1, 0.1)) +
  ylab("") + xlab("")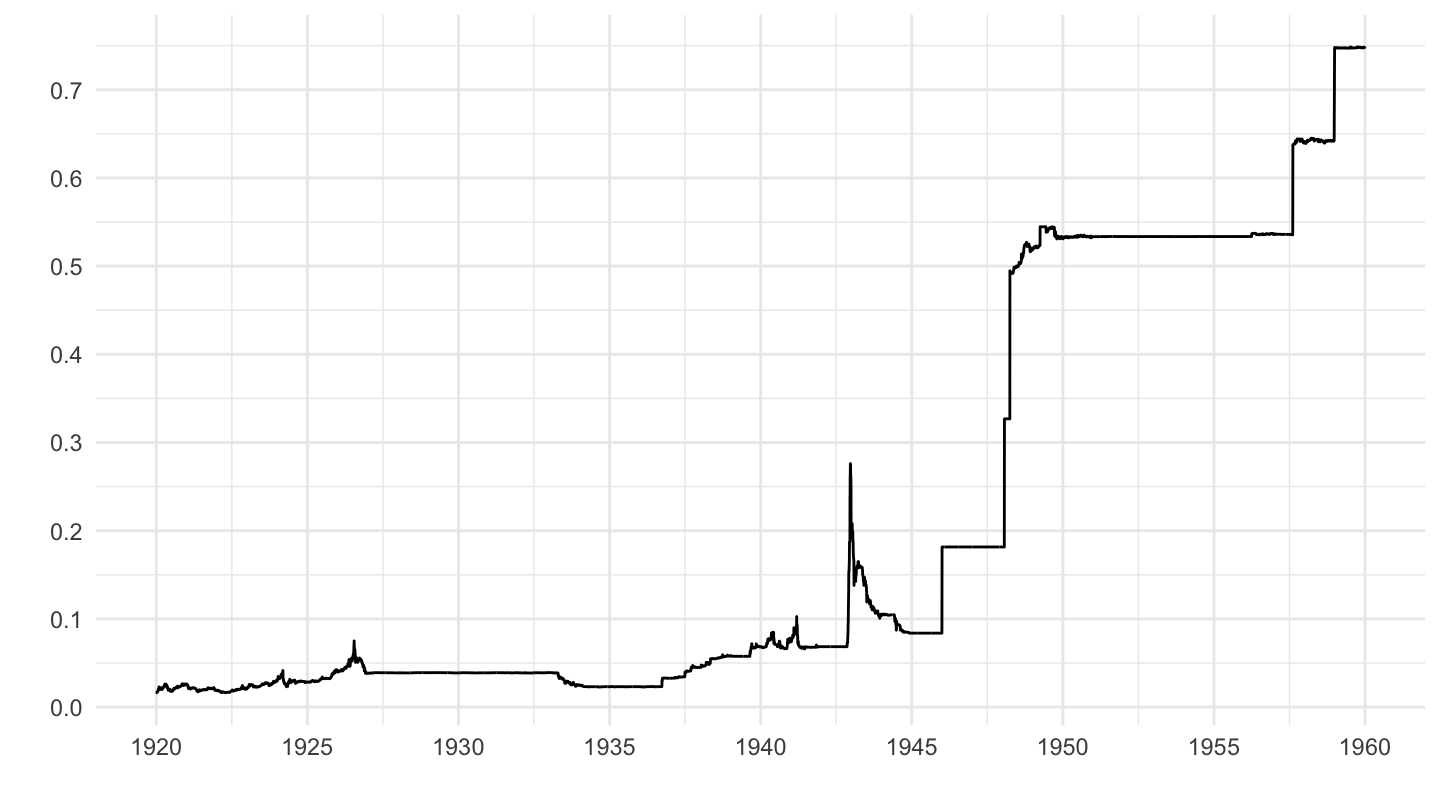
(ref:france-franc-1940-1973) Franc Exchange Rate (1940-1973)
xrates |>
  filter(iso3c == "USD",
         iso3c_c == "FRF",
         date >= as.Date("1940-01-01"),
         date <= as.Date("1973-01-01")) |>
  ggplot() + geom_line(aes(x = date, y = value)) + theme_minimal() +
  scale_x_date(breaks = as.Date(paste0(seq(1850, 2025, 5), "-01-01")),
               labels = date_format("%Y")) +
  scale_y_continuous(breaks = seq(0, 1, 0.1)) +
  ylab("") + xlab("")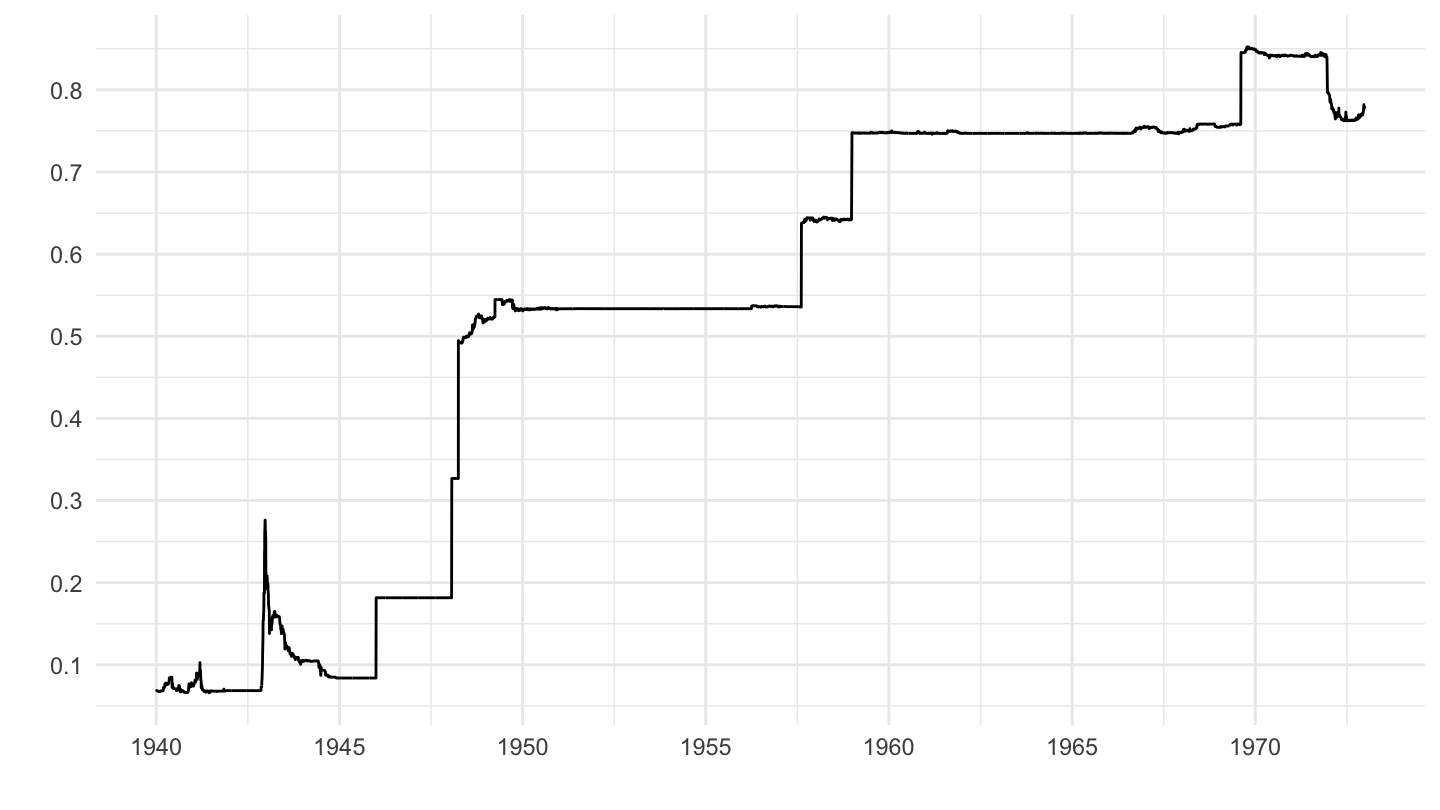
xrates |>
  filter(iso3c == "USD",
         iso3c_c == "FRF",
         date >= as.Date("1954-01-01"),
         date <= as.Date("1970-01-01")) |>
  ggplot() + geom_line(aes(x = date, y = value)) + theme_minimal() +
  scale_x_date(breaks = as.Date(paste0(seq(1850, 2025, 1), "-01-01")),
               labels = date_format("%Y")) +
  scale_y_log10(breaks = seq(0, 1, 0.05)) +
  ylab("1 USD en FRF") + xlab("")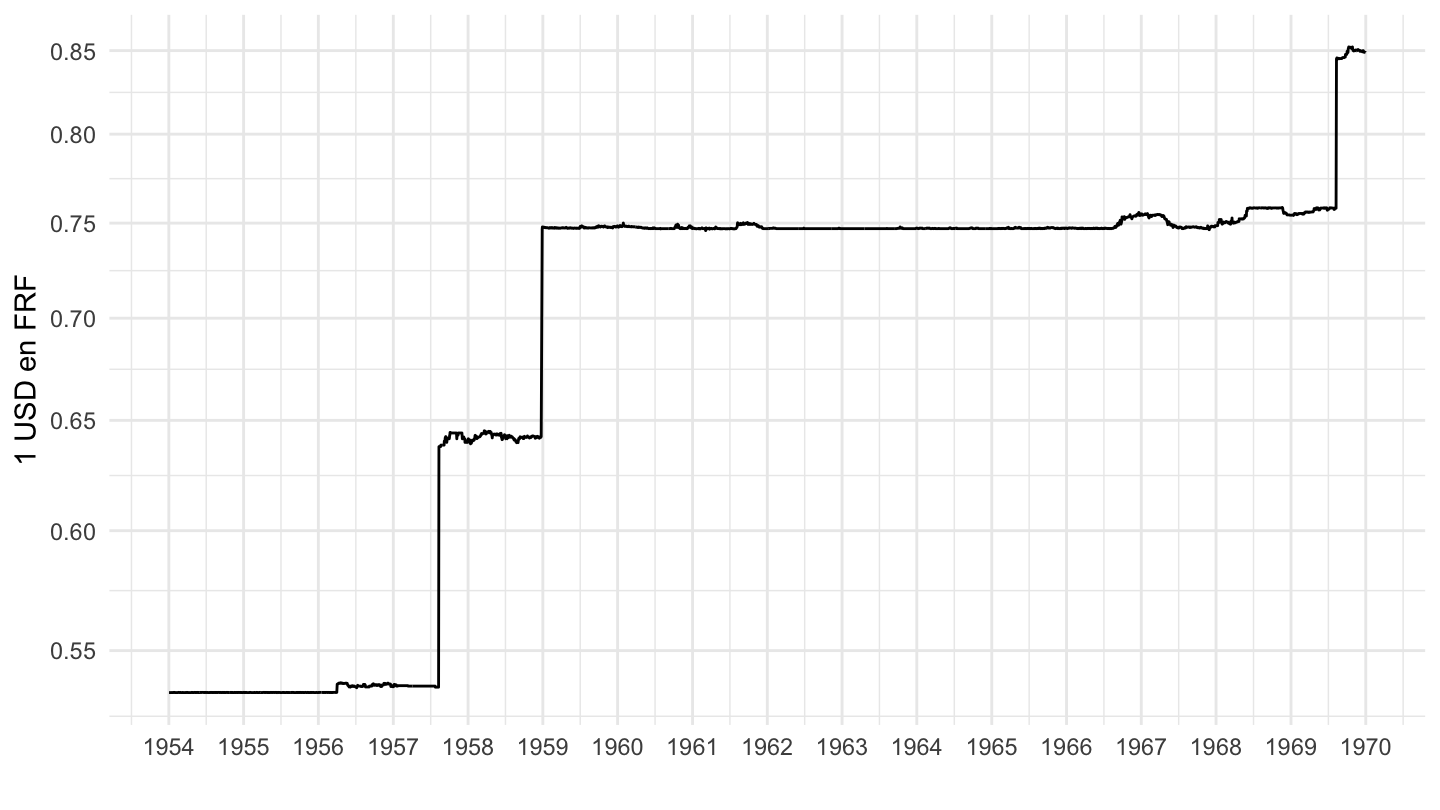
xrates |>
  filter(iso3c == "USD",
         iso3c_c == "FRF",
         date >= as.Date("1954-01-01"),
         date <= as.Date("1962-01-01")) |>
  ggplot() + geom_line(aes(x = date, y = value)) + theme_minimal() +
  scale_x_date(breaks = as.Date(paste0(seq(1850, 2025, 1), "-01-01")),
               labels = date_format("%Y")) +
  scale_y_reverse(breaks = seq(0, 1, 0.05)) +
  ylab("USD vs FRF") + xlab("")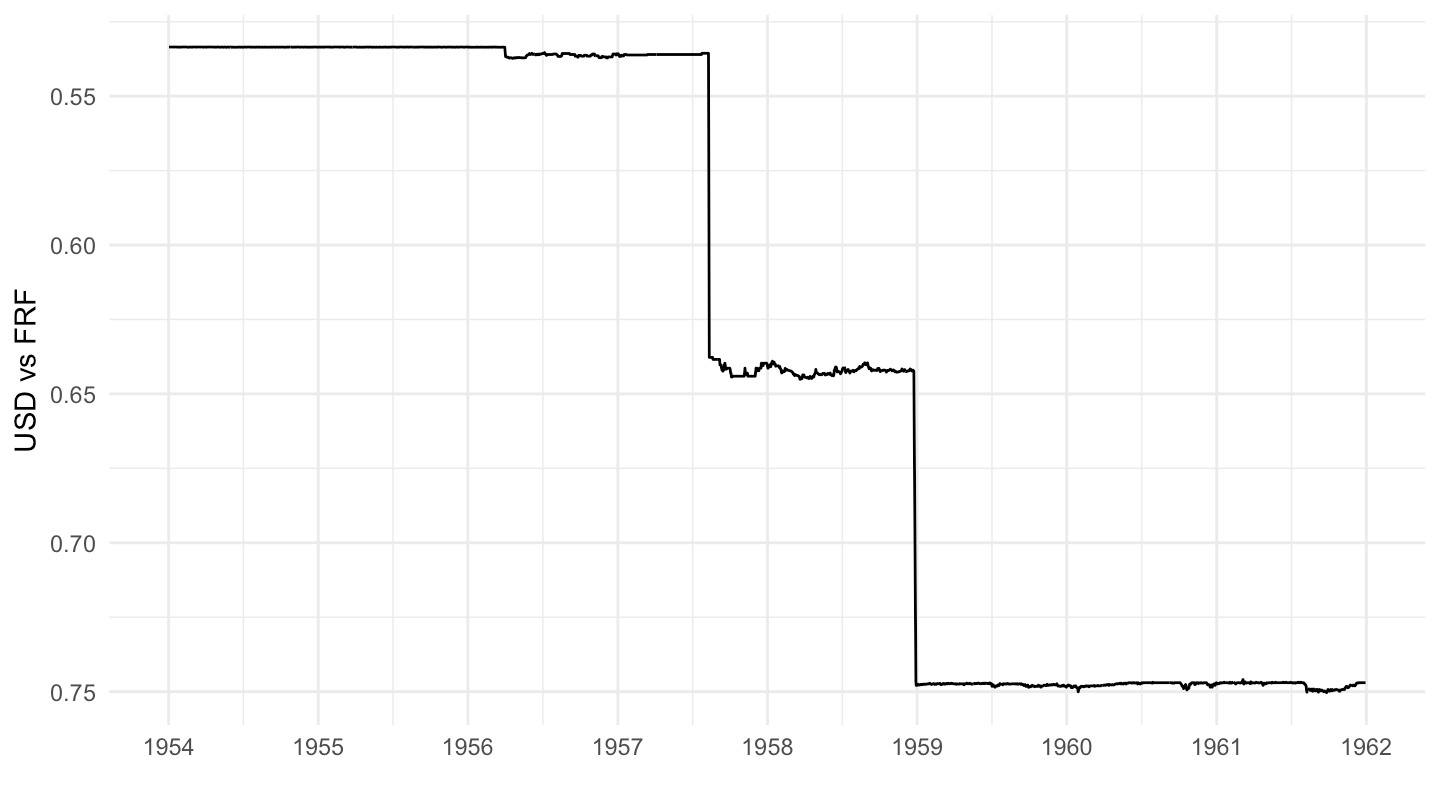
xrates |>
  filter(iso3c == "USD",
         iso3c_c == "FRF",
         date >= as.Date("1954-01-01"),
         date <= as.Date("1969-01-01")) |>
  ggplot() + geom_line(aes(x = date, y = value)) + theme_minimal() +
  scale_x_date(breaks = as.Date(paste0(seq(1850, 2025, 1), "-01-01")),
               labels = date_format("%Y")) +
  scale_y_reverse(breaks = seq(0, 1, 0.05)) +
  ylab("USD vs FRF") + xlab("")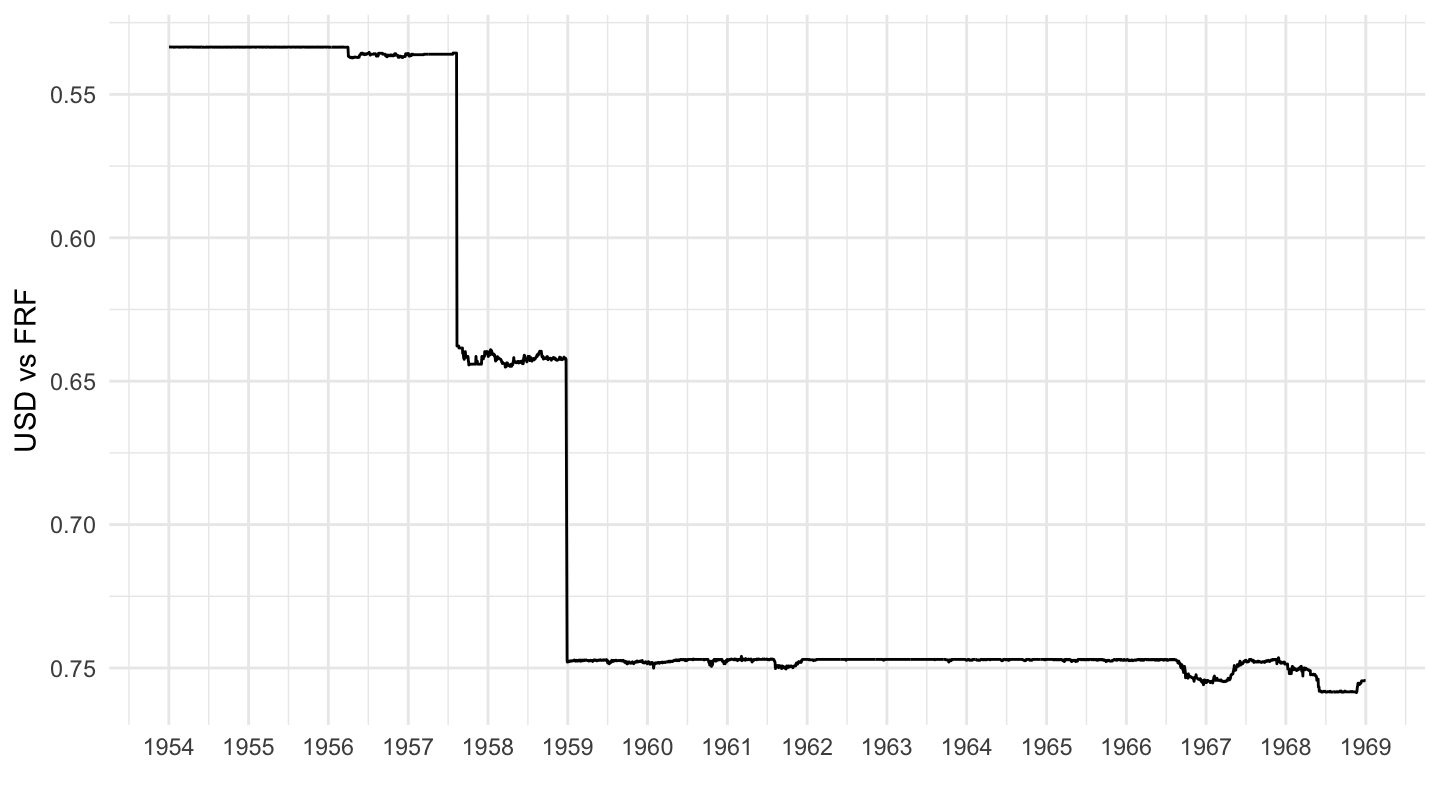
(ref:france-franc-1965-1971) Franc Exchange Rate (1965-1971)
xrates |>
  filter(iso3c == "USD",
         iso3c_c == "FRF",
         date >= as.Date("1968-01-01"),
         date <= as.Date("1971-01-01")) |>
  ggplot() + geom_line(aes(x = date, y = value)) + theme_minimal() +
  scale_x_date(breaks = as.Date(paste0(seq(1850, 2025, 1), "-01-01")),
               labels = date_format("%Y")) +
  scale_y_log10(breaks = seq(0, 1, 0.01)) +
  ylab("") + xlab("")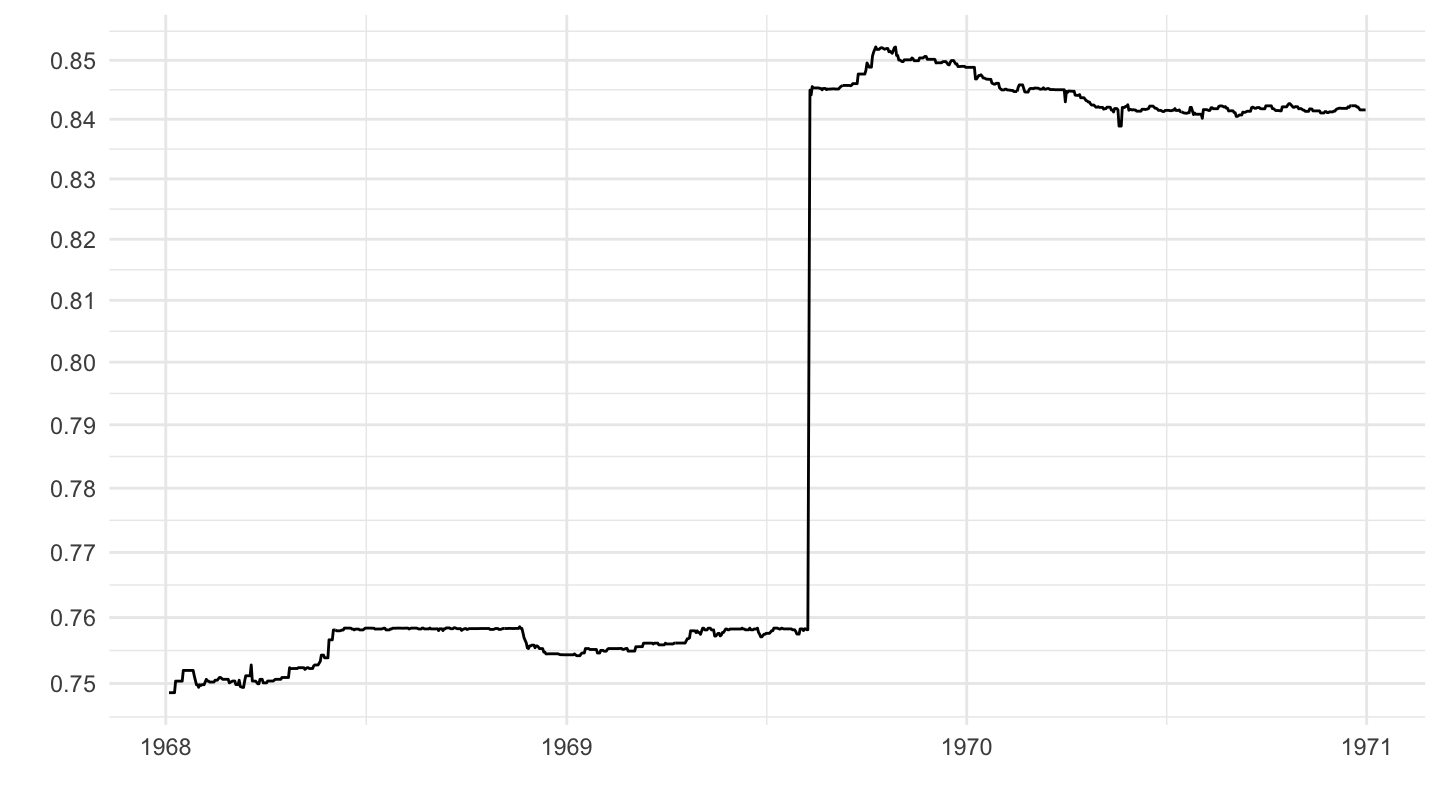
(ref:france-franc-1910-1940) Franc Exchange Rate (1910-1940)
xrates |>
  filter(iso3c == "USD",
         iso3c_c == "FRF",
         date >= as.Date("1910-01-01"),
         date <= as.Date("1940-01-01")) |>
  ggplot() + geom_line(aes(x = date, y = value)) + theme_minimal() +
  scale_x_date(breaks = as.Date(paste0(seq(1850, 2025, 5), "-01-01")),
               labels = date_format("%Y")) +
  scale_y_continuous(breaks = seq(0, 1, 0.01)) +
  ylab("") + xlab("")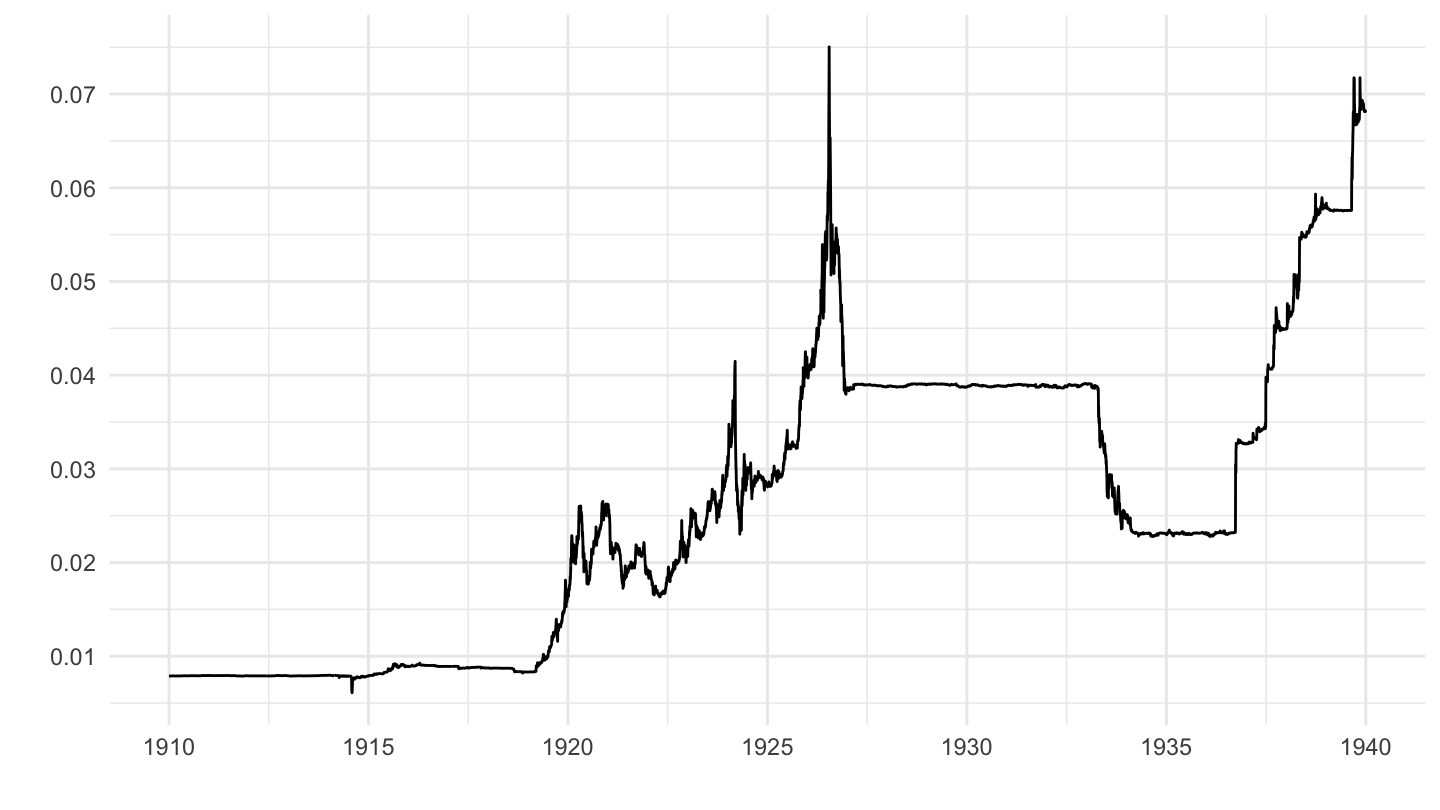
(ref:france-franc-1970-2020) Franc Exchange Rate (1970-2020)
xrates |>
  filter(iso3c == "USD",
         iso3c_c == "FRF",
         date >= as.Date("1970-01-01"),
         date <= as.Date("2020-01-01")) |>
  ggplot() + geom_line(aes(x = date, y = value)) + theme_minimal() +
  scale_x_date(breaks = as.Date(paste0(seq(1850, 2025, 5), "-01-01")),
               labels = date_format("%Y")) +
  scale_y_continuous(breaks = seq(0, 5, 0.1)) +
  ylab("") + xlab("")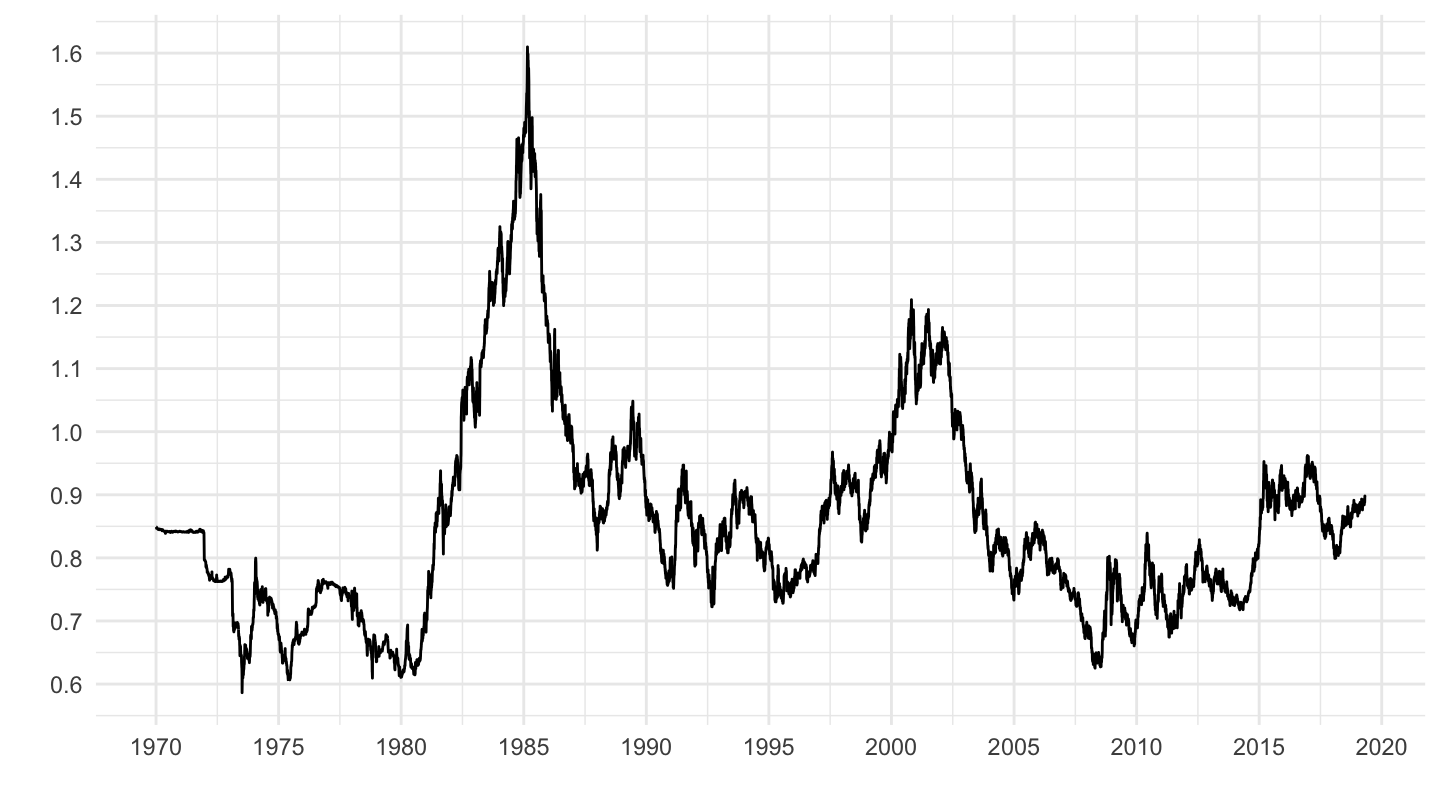
xrates |>
  filter(iso3c_c == "ARS",
         date <= as.Date("1950-01-01")) |>
  mutate(value = value/value[1]) |>
  ggplot() + geom_line(aes(x = date, y = value)) + theme_minimal() +
  scale_x_date(breaks = as.Date(paste0(seq(1700, 2025, 10), "-01-01")),
               labels = date_format("%Y")) +
  scale_y_log10(breaks = c(1, 2, 3, 5, 8, 10, 20, 30, 50, 80, 100)) +
  ylab("") + xlab("")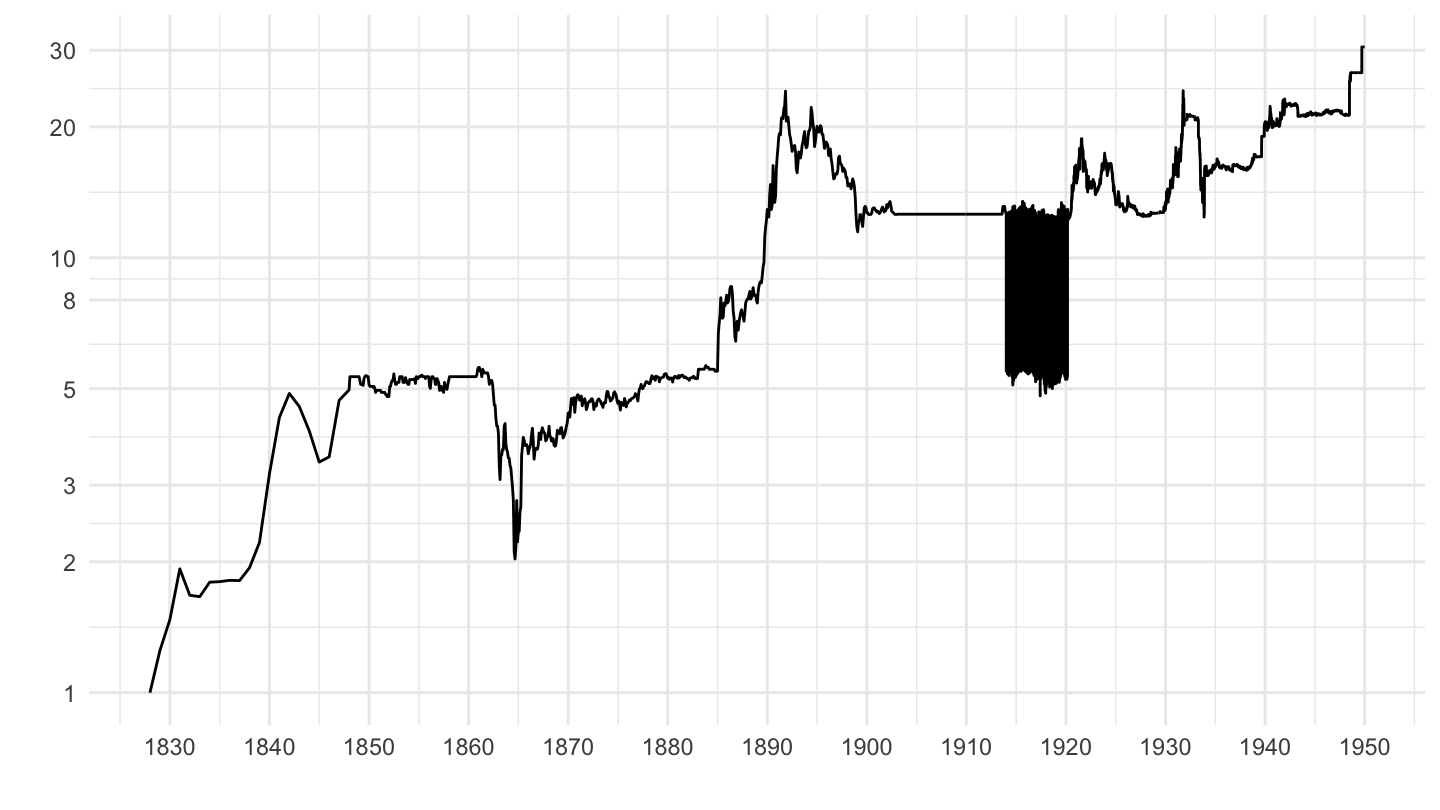
xrates |>
  filter(Ticker == "USDARS",
         date >= as.Date("1980-01-01"),
         date <= as.Date("1995-01-01")) |>
  ggplot() + geom_line(aes(x = date, y = value)) + theme_minimal() +
  scale_x_date(breaks = as.Date(paste0(seq(1850, 2025, 1), "-01-01")),
               labels = date_format("%Y")) +
  scale_y_continuous(breaks = seq(0, 500, 20)) +
  ylab("") + xlab("")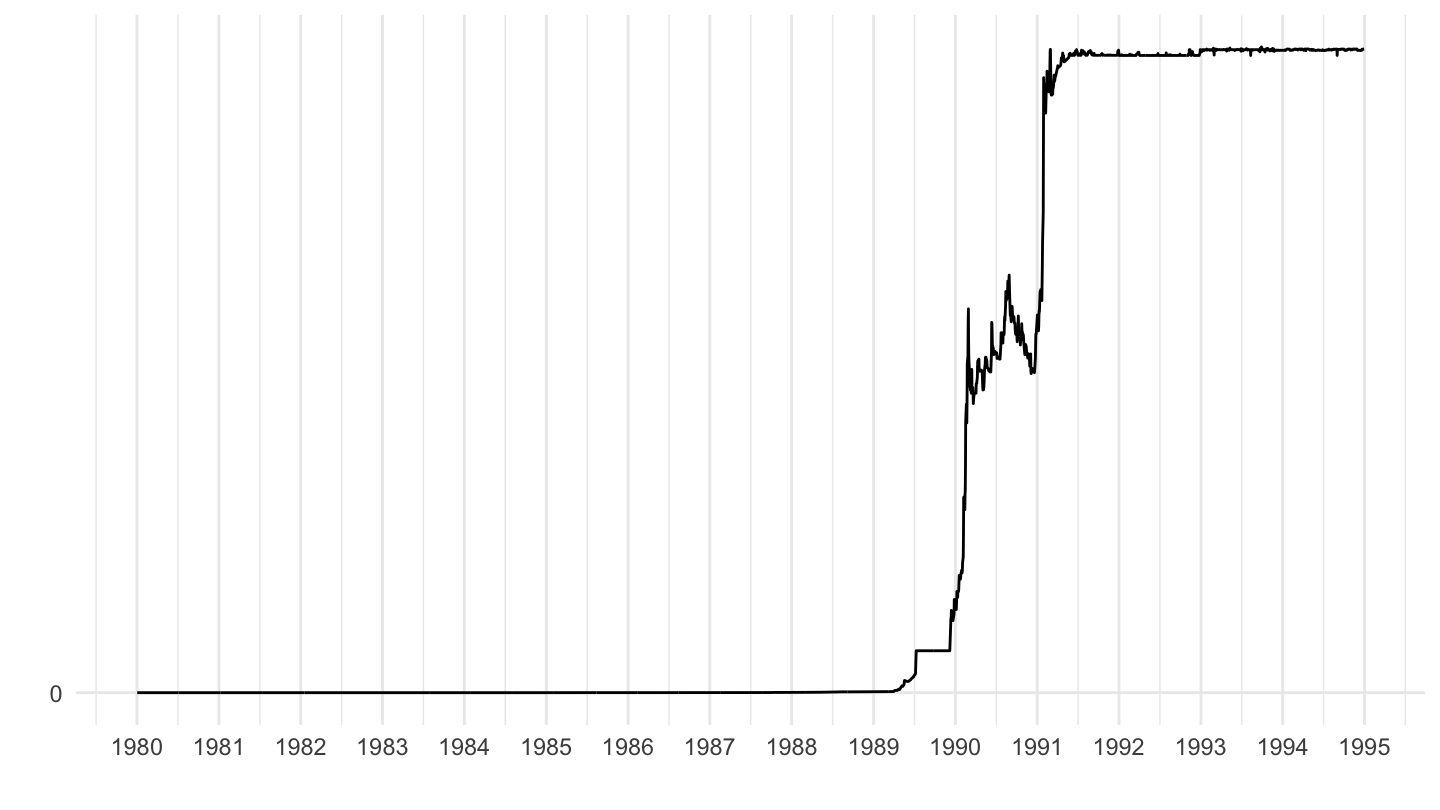
xrates |>
  filter(Ticker == "USDJPY",
         date >= as.Date("1980-01-01"),
         date <= as.Date("1995-01-01")) |>
  ggplot() + geom_line(aes(x = date, y = value)) + theme_minimal() +
  scale_x_date(breaks = as.Date(paste0(seq(1850, 2025, 1), "-01-01")),
               labels = date_format("%Y")) +
  scale_y_continuous(breaks = seq(0, 500, 20)) +
  ylab("") + xlab("")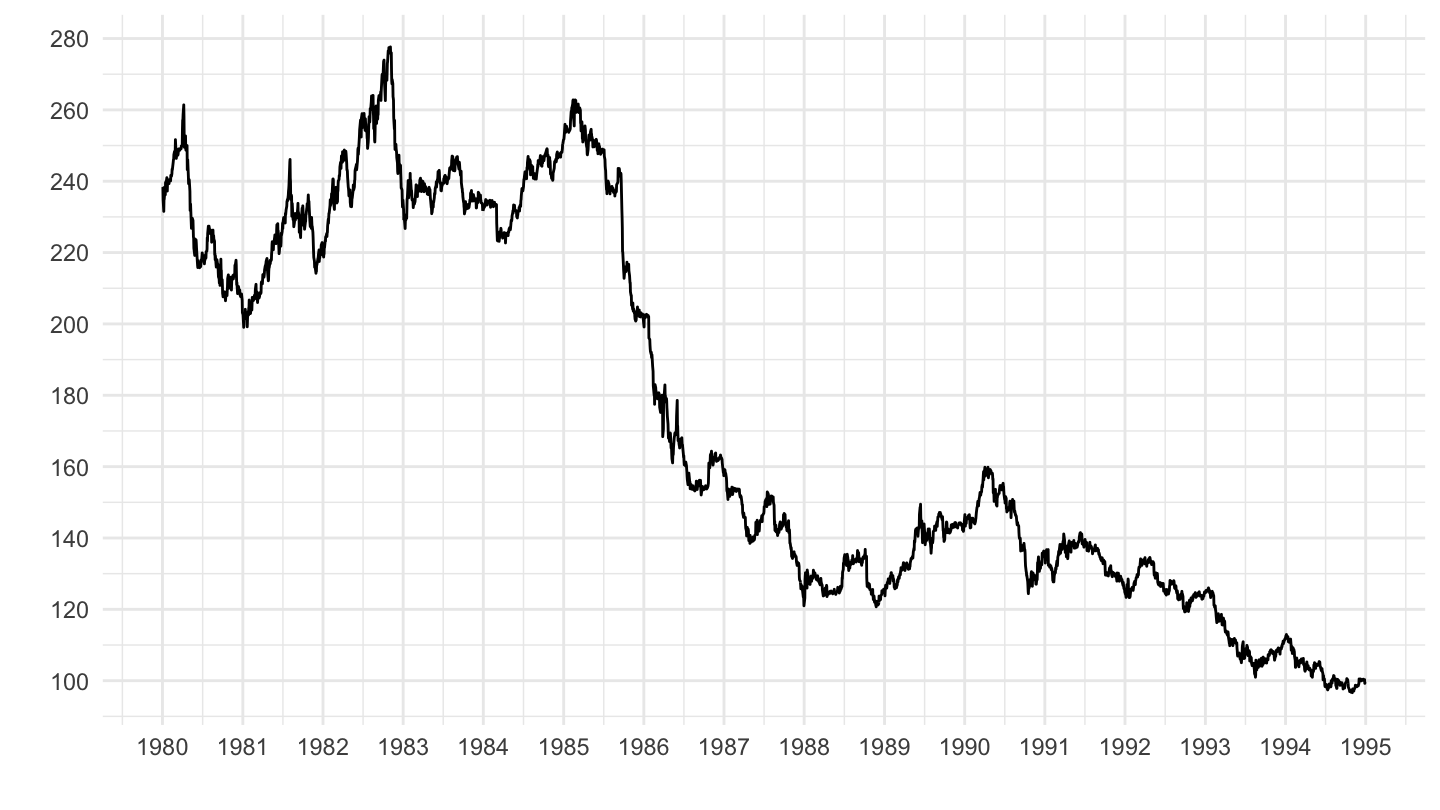
(ref:USDJPY-1995-2020) Japan Exchange Rate (1995-2020)
xrates |>
  filter(Ticker == "USDJPY",
         date >= as.Date("1995-01-01"),
         date <= as.Date("2020-01-01")) |>
  ggplot() + geom_line(aes(x = date, y = value)) + theme_minimal() +
  scale_x_date(breaks = as.Date(paste0(seq(1850, 2025, 1), "-01-01")),
               labels = date_format("%Y")) +
  scale_y_continuous(breaks = seq(0, 500, 10)) +
  ylab("") + xlab("")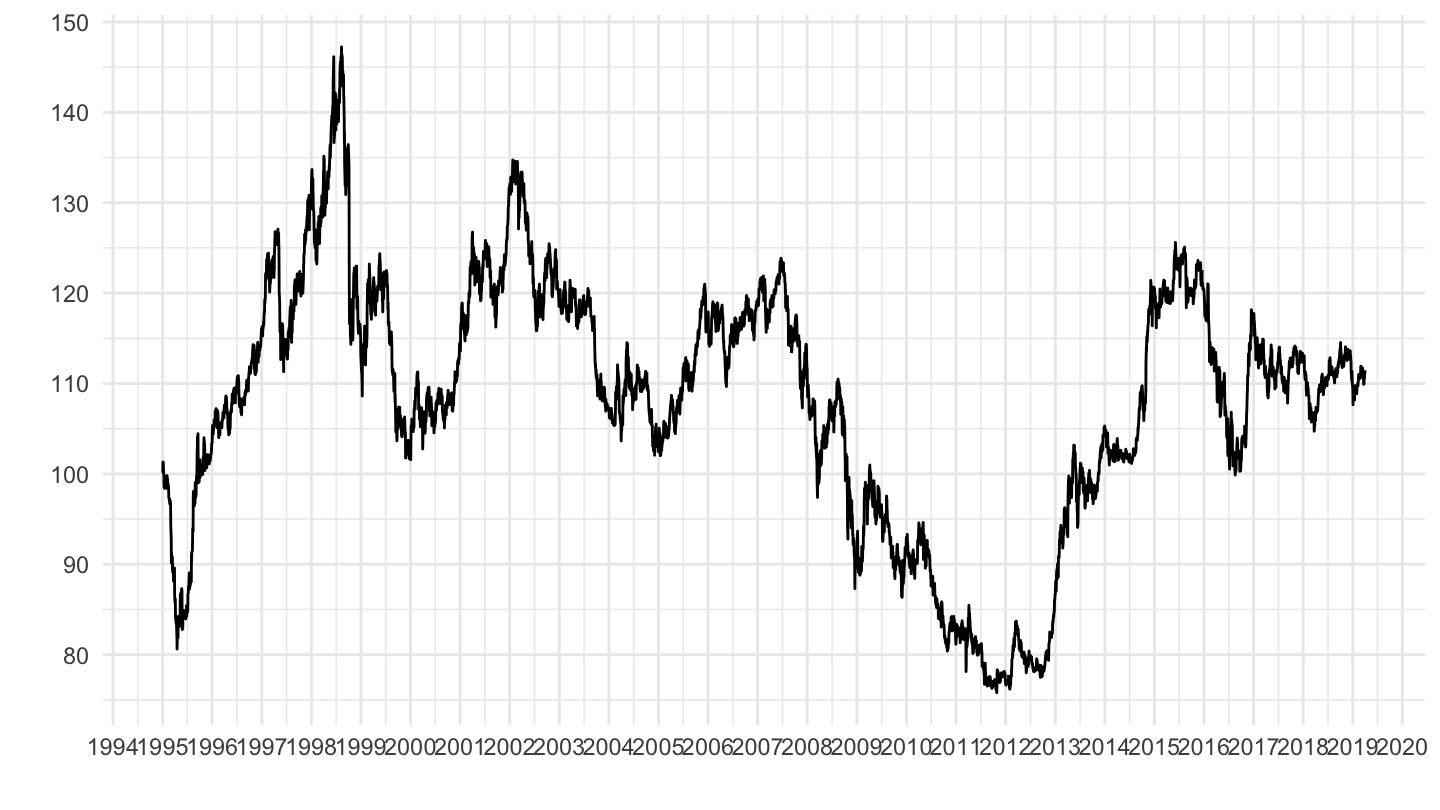
(ref:USDJPY-1914-1927) Japan Exchange Rate (1914-1927)
xrates |>
  filter(Ticker == "USDJPY",
         date >= as.Date("1914-01-01"),
         date <= as.Date("1927-01-01")) |>
  ggplot() + geom_line(aes(x = date, y = value)) + theme_minimal() +
  scale_x_date(breaks = as.Date(paste0(seq(1850, 2025, 1), "-01-01")),
               labels = date_format("%Y")) +
  scale_y_continuous(breaks = seq(1, 4, 0.1)) +
  ylab("") + xlab("")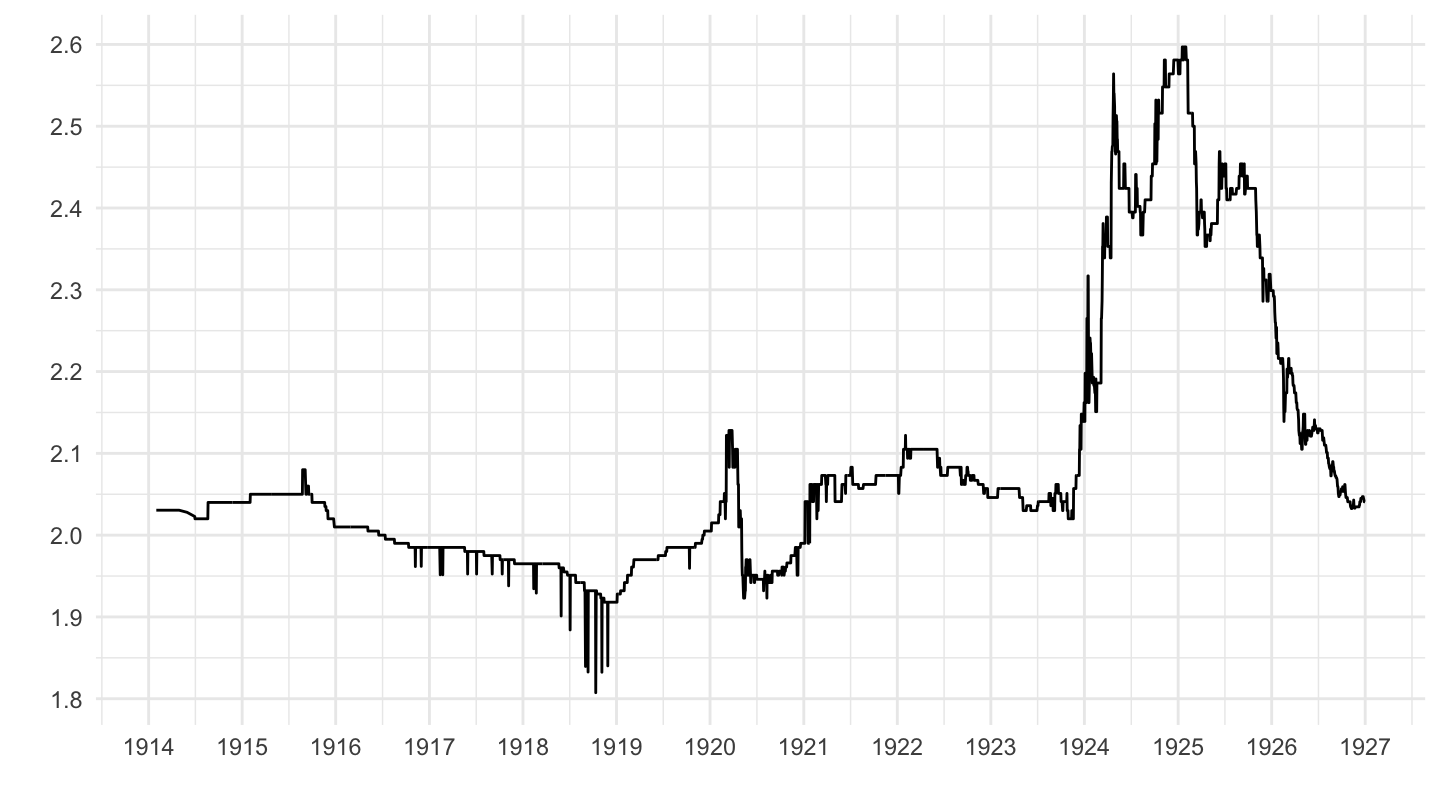
(ref:USDJPY-1910-1940) Japan Exchange Rate (1910-1940)
xrates |>
  filter(Ticker == "USDJPY",
         date >= as.Date("1910-01-01"),
         date <= as.Date("1940-01-01")) |>
  ggplot() + geom_line(aes(x = date, y = value)) + theme_minimal() +
  scale_x_date(breaks = as.Date(paste0(seq(1850, 2025, 5), "-01-01")),
               labels = date_format("%Y")) +
  scale_y_continuous(breaks = seq(0, 50, 0.5)) +
  ylab("") + xlab("")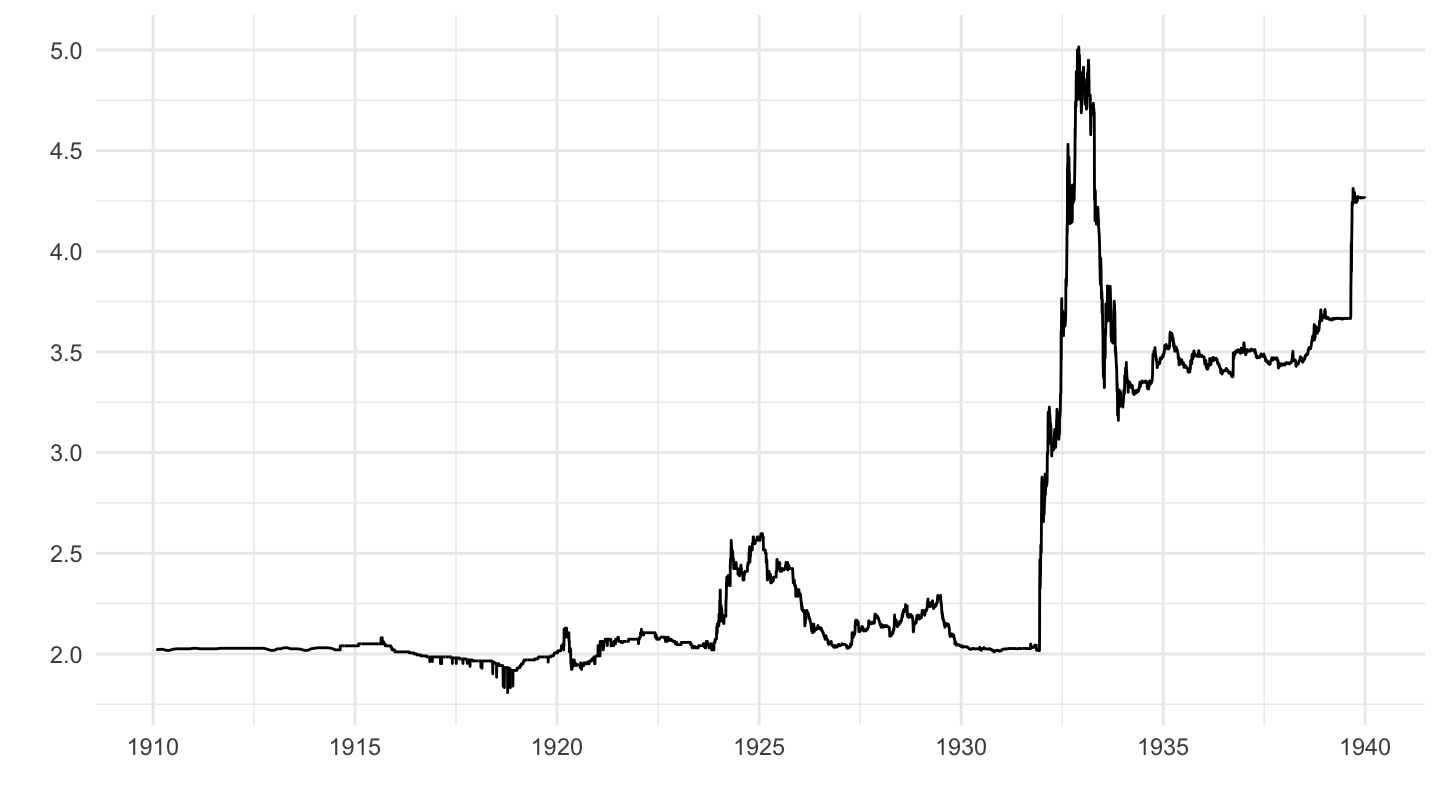
(ref:USDJPY-1940-1973) Japan Exchange Rate (1940-1973)
xrates |>
  filter(Ticker == "USDJPY",
         date >= as.Date("1940-01-01"),
         date <= as.Date("1973-01-01")) |>
  ggplot() + geom_line(aes(x = date, y = value)) + theme_minimal() +
  scale_x_date(breaks = as.Date(paste0(seq(1850, 2025, 5), "-01-01")),
               labels = date_format("%Y")) +
  scale_y_continuous(breaks = seq(0, 500, 50)) +
  ylab("") + xlab("")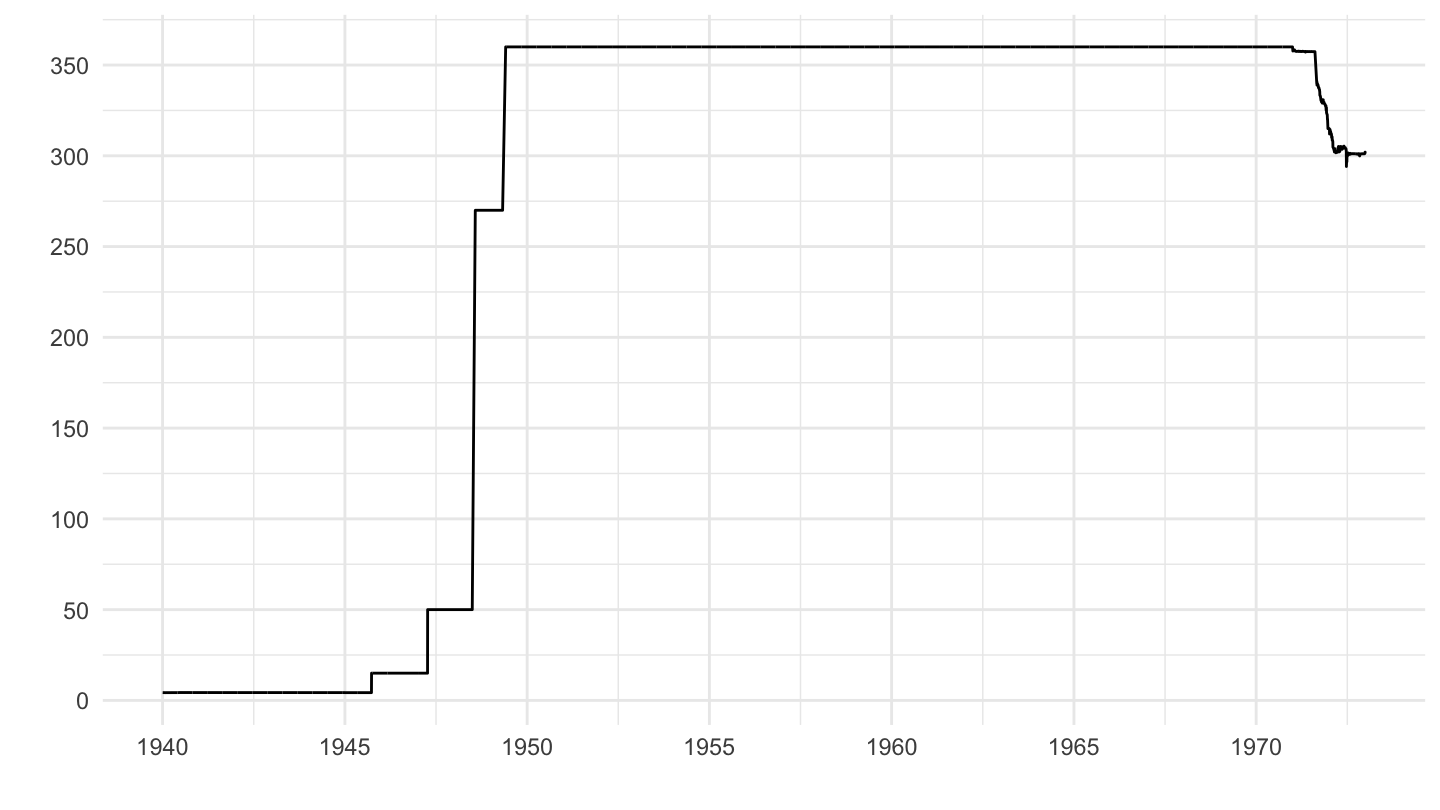
(ref:USDJPY-1970-2020) Japan Exchange Rate (1970-2020)
xrates |>
  filter(Ticker == "USDJPY",
         date >= as.Date("1970-01-01"),
         date <= as.Date("2020-01-01")) |>
  ggplot() + geom_line(aes(x = date, y = value)) + theme_minimal() +
  scale_x_date(breaks = as.Date(paste0(seq(1850, 2025, 5), "-01-01")),
               labels = date_format("%Y")) +
  scale_y_continuous(breaks = seq(0, 500, 50)) +
  ylab("") + xlab("")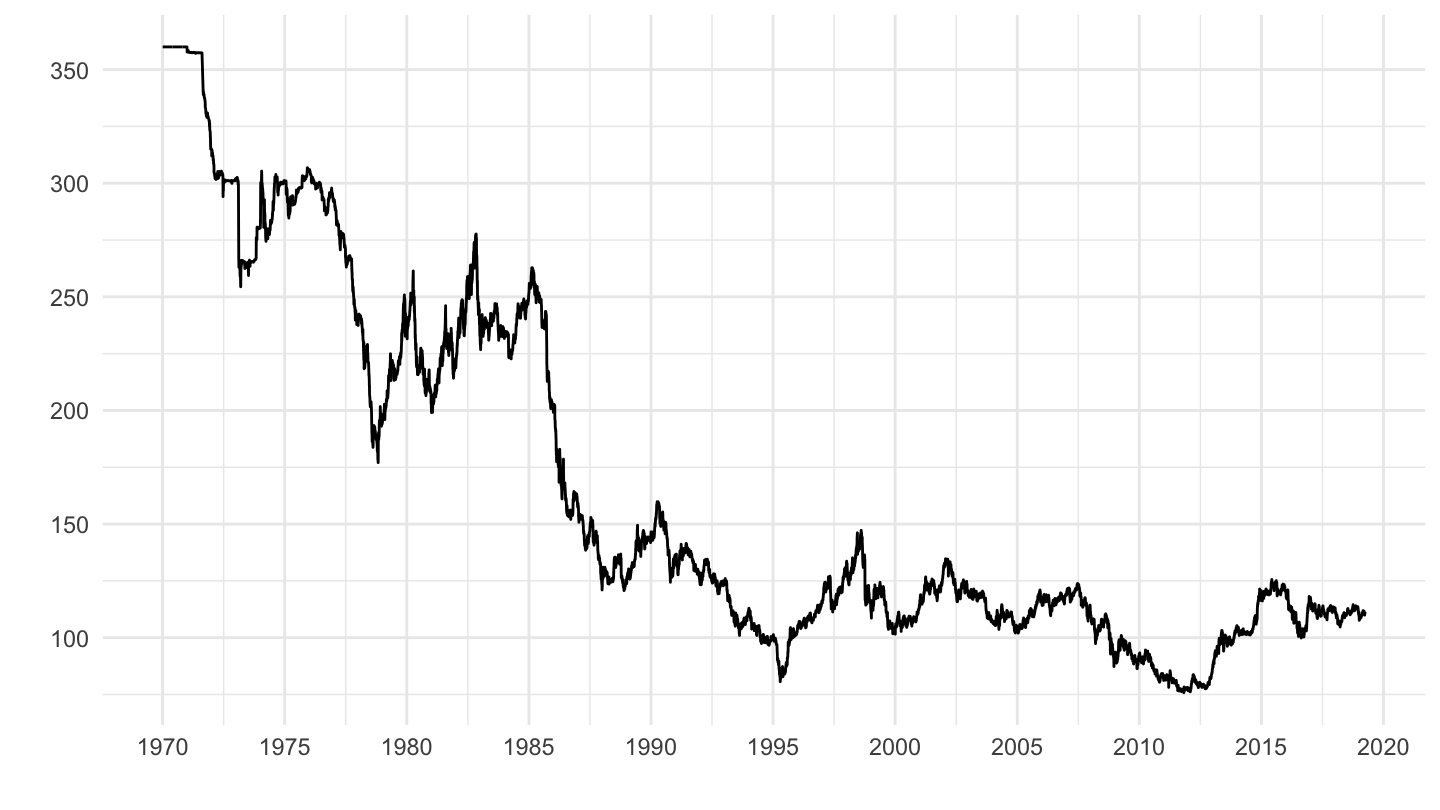
(ref:uk-pound-1790-1930) Dollar / Pound Exchange Rate
xrates |>
  filter(Ticker == "GBPUSD",
         date >= as.Date("1790-01-01"),
         date <= as.Date("1930-01-01")) |>
  ggplot() + geom_line(aes(x = date, y = value)) + theme_minimal() +
  scale_x_date(breaks = as.Date(paste0(seq(1800, 2025, 20), "-01-01")),
               labels = date_format("%Y")) +
  scale_y_continuous(breaks = seq(2, 15, 1)) +
  ylab("") + xlab("")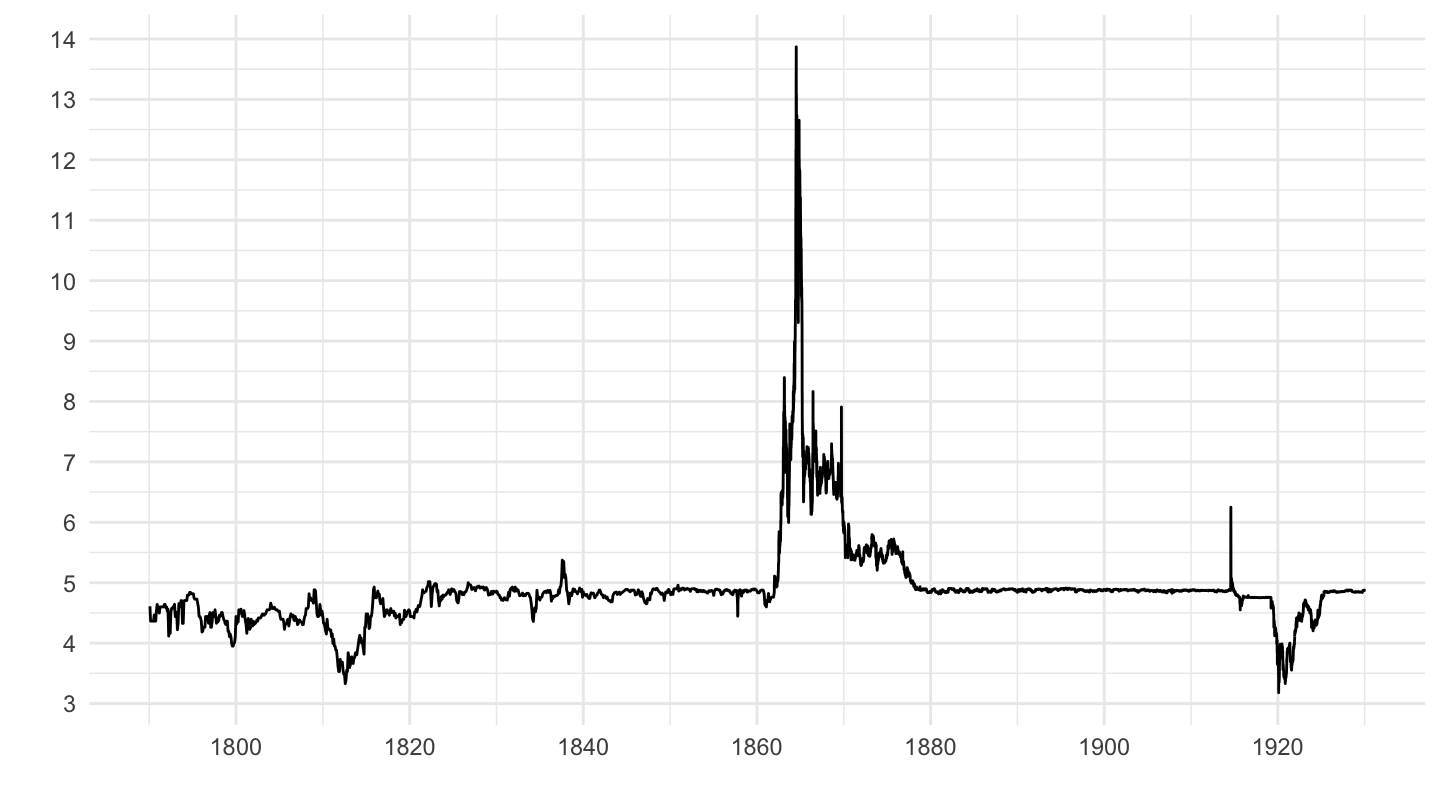
(ref:uk-pound-1860-1930) Dollar / Pound Exchange Rate
xrates |>
  filter(Ticker == "GBPUSD",
         date >= as.Date("1860-01-01"),
         date <= as.Date("1930-01-01")) |>
  ggplot() + geom_line(aes(x = date, y = value)) + theme_minimal() +
  scale_x_date(breaks = as.Date(paste0(seq(1850, 2025, 10), "-01-01")),
               labels = date_format("%Y")) +
  scale_y_continuous(breaks = seq(2, 15, 1)) +
  ylab("") + xlab("")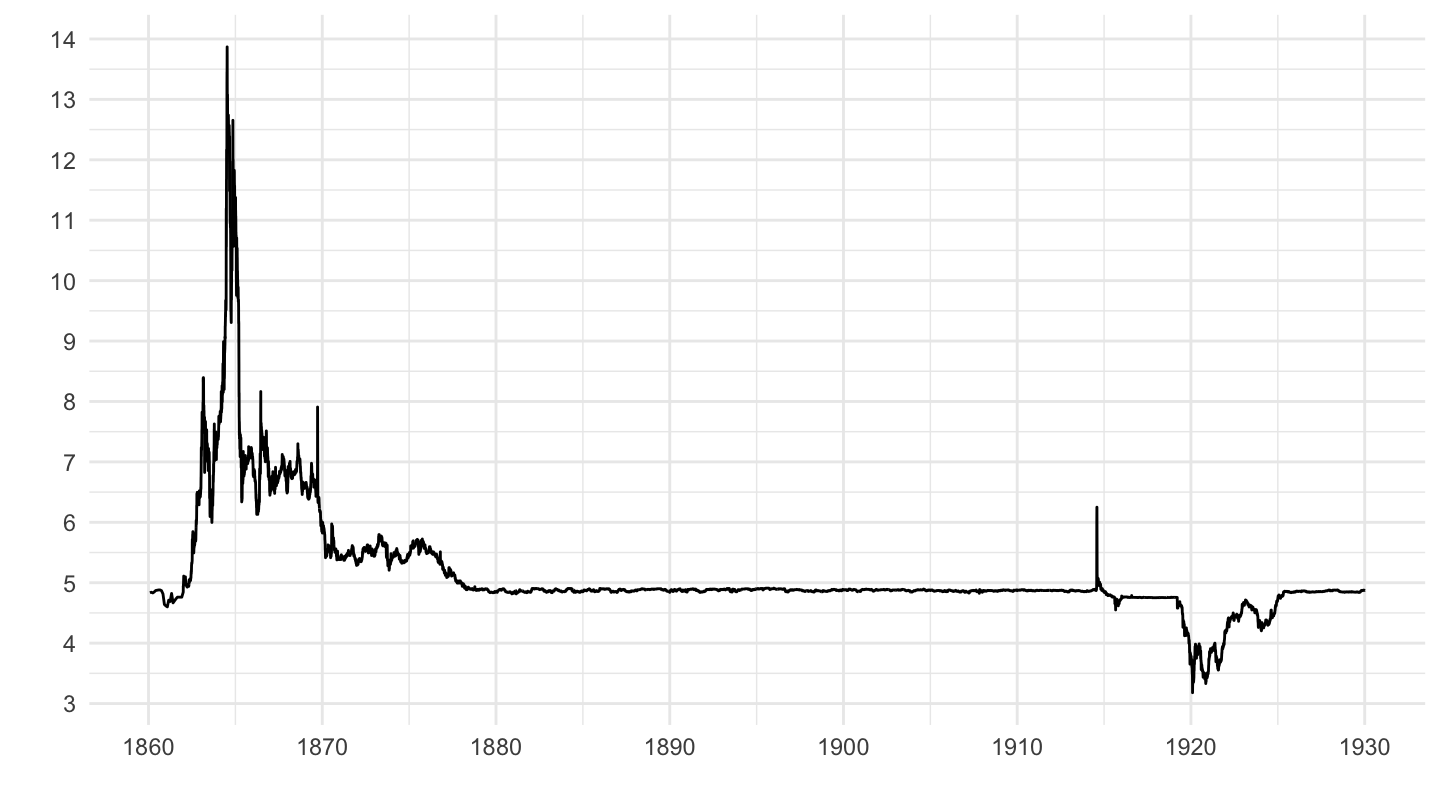
(ref:uk-pound-1910-1930) U.K. Dollar / Pound Exchange Rate (1910-1930)
xrates |>
  filter(Ticker == "GBPUSD",
         date >= as.Date("1910-01-01"),
         date <= as.Date("1930-01-01")) |>
  ggplot() + geom_line(aes(x = date, y = value)) + theme_minimal() +
  scale_x_date(breaks = as.Date(paste0(seq(1850, 2025, 1), "-01-01")),
               labels = date_format("%Y")) +
  scale_y_continuous(breaks = seq(2, 15, 0.5)) +
  ylab("") + xlab("")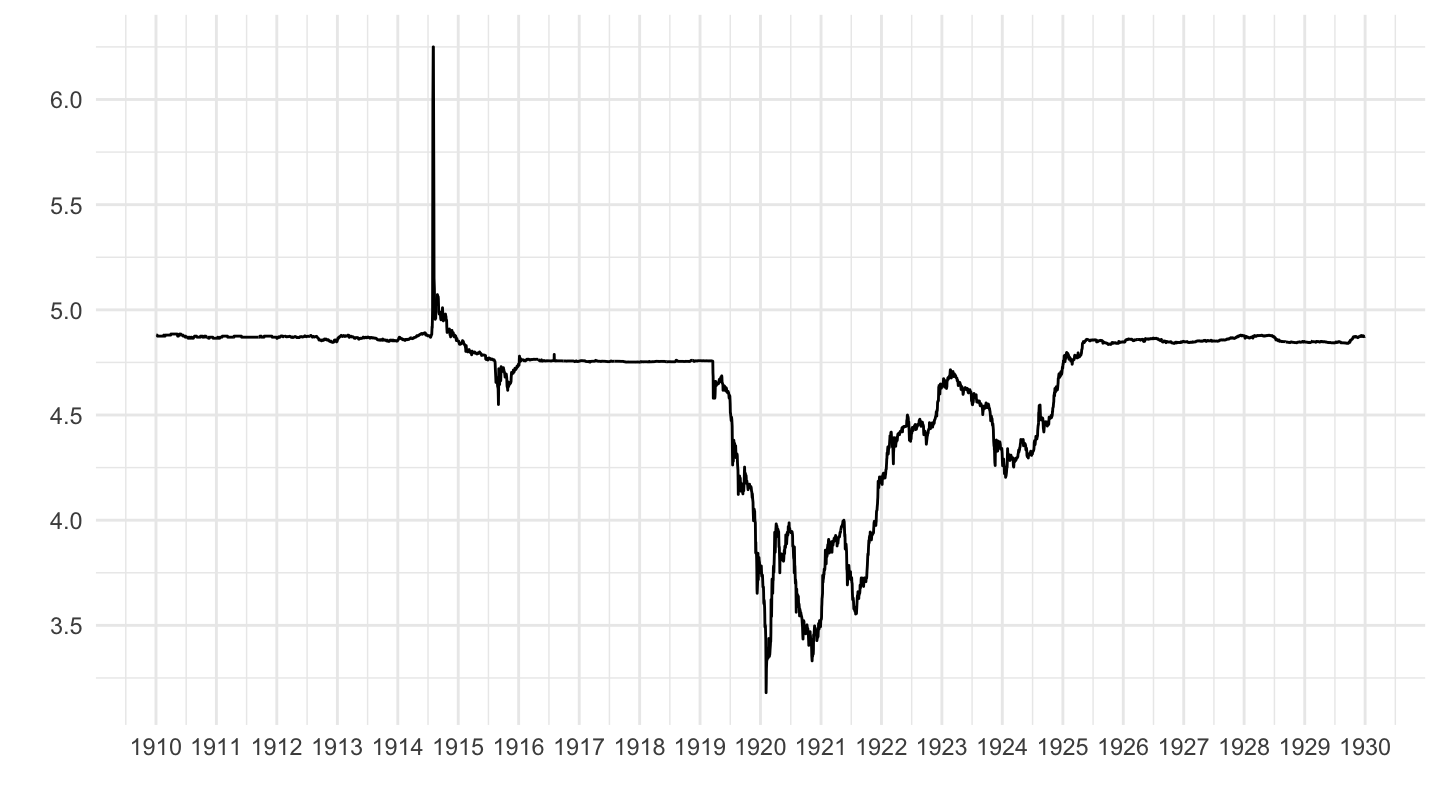
(ref:uk-pound-1919-1924) U.K. Dollar / Pound Exchange Rate (1919-1924)
xrates |>
  filter(Ticker == "GBPUSD",
         date >= as.Date("1919-01-01"),
         date <= as.Date("1924-01-01")) |>
  ggplot() + geom_line(aes(x = date, y = value)) + theme_minimal() +
  scale_x_date(breaks = as.Date(paste0(seq(1850, 2025, 1), "-01-01")),
               labels = date_format("%Y")) +
  scale_y_continuous(breaks = seq(2, 15, 0.5)) +
  ylab("") + xlab("")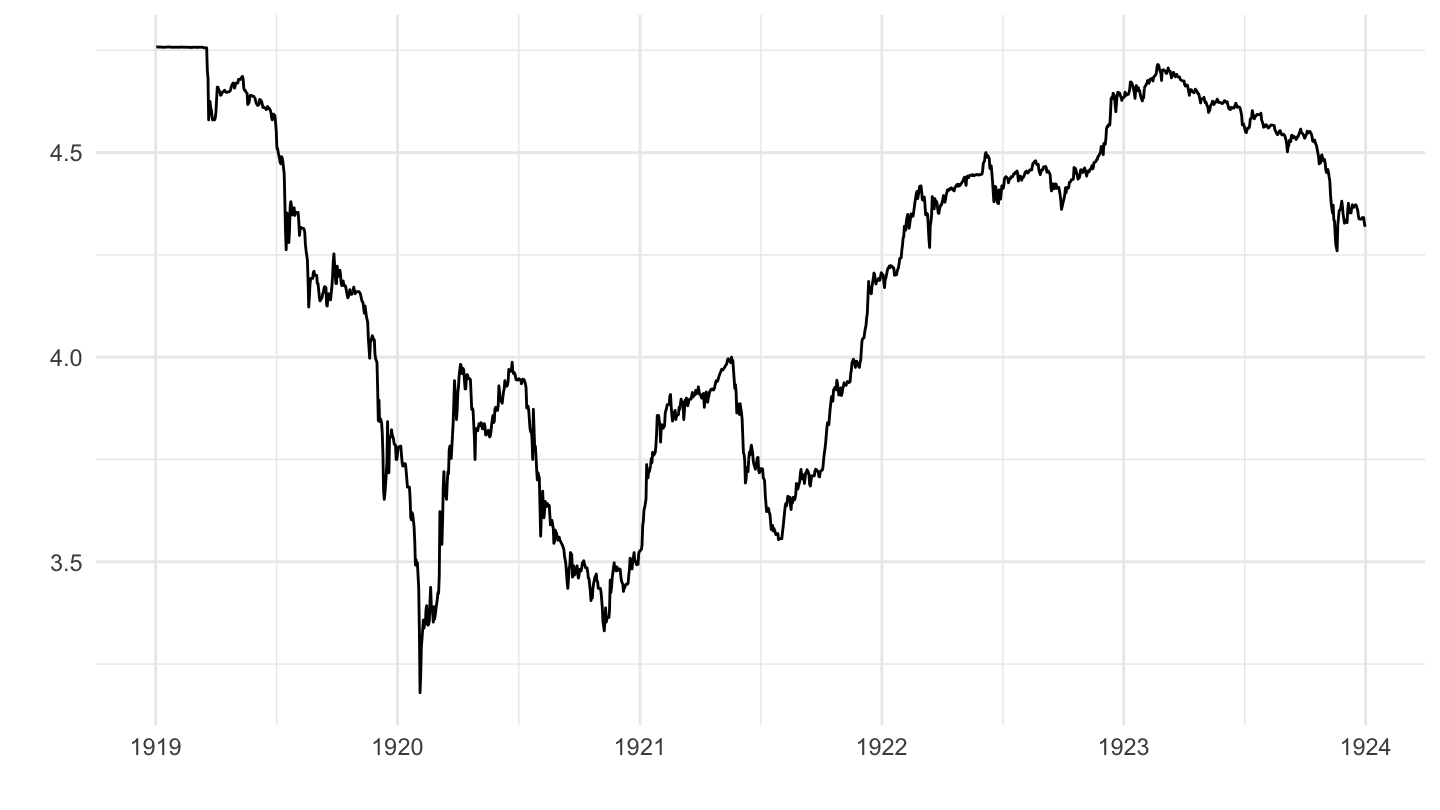
(ref:uk-pound-1914-1927) U.K. Dollar / Pound Exchange Rate (1914-1927)
xrates |>
  filter(Ticker == "GBPUSD",
         date >= as.Date("1914-01-01"),
         date <= as.Date("1927-01-01")) |>
  ggplot() + geom_line(aes(x = date, y = value)) + theme_minimal() +
  scale_x_date(breaks = as.Date(paste0(seq(1850, 2025, 1), "-01-01")),
               labels = date_format("%Y")) +
  scale_y_continuous(breaks = seq(2, 15, 0.5)) +
  ylab("") + xlab("")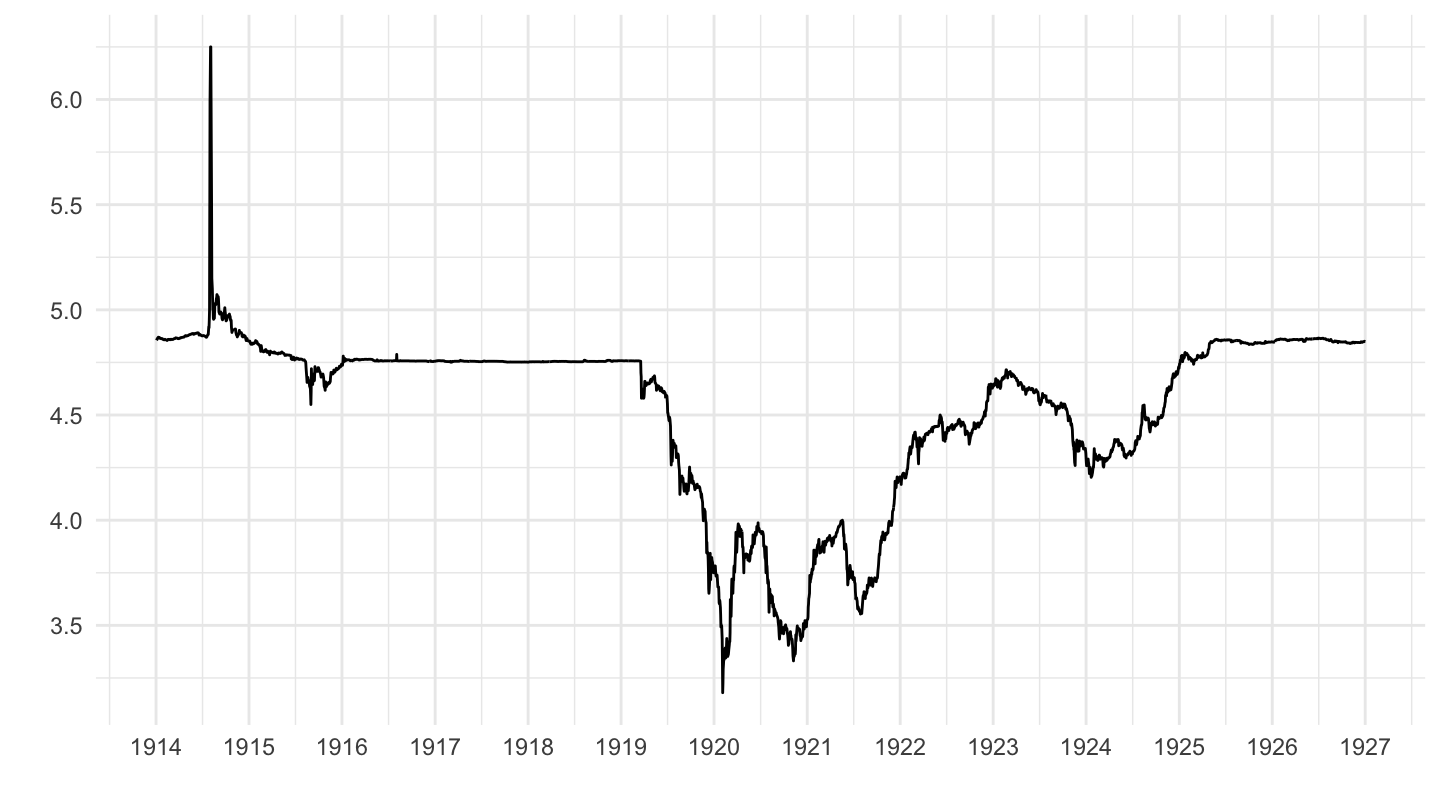
xrates |>
  filter(iso3c %in% c("GBP", "FRF", "USD"),
         iso3c_c %in% c("GBP", "USD", "FRF"),
         date >= as.Date("1910-01-01"),
         date <= as.Date("1925-01-01")) |>
  group_by(Ticker) |>
  ggplot() +
  geom_line(aes(x = date, y = value, color = Ticker, linetype = Ticker)) +
  theme_minimal() + xlab("") + ylab("Exchange Rate") +
  scale_x_date(breaks = seq(1600, 2100, 2) |> paste0("-01-01") |> as.Date(),
               labels = date_format("%Y")) +
  scale_y_log10(breaks = c(0.1*c(0.1, 0.2, 0.3, 0.5), c(0.1, 0.2, 0.3, 0.5), c(1, 2, 3, 5), seq(10, 100, 10)),
                     labels = dollar_format(accuracy = 0.01, prefix = "")) +
  scale_color_manual(values = viridis(5)[1:4]) +
  theme(legend.position = c(0.2, 0.6),
        legend.title = element_blank())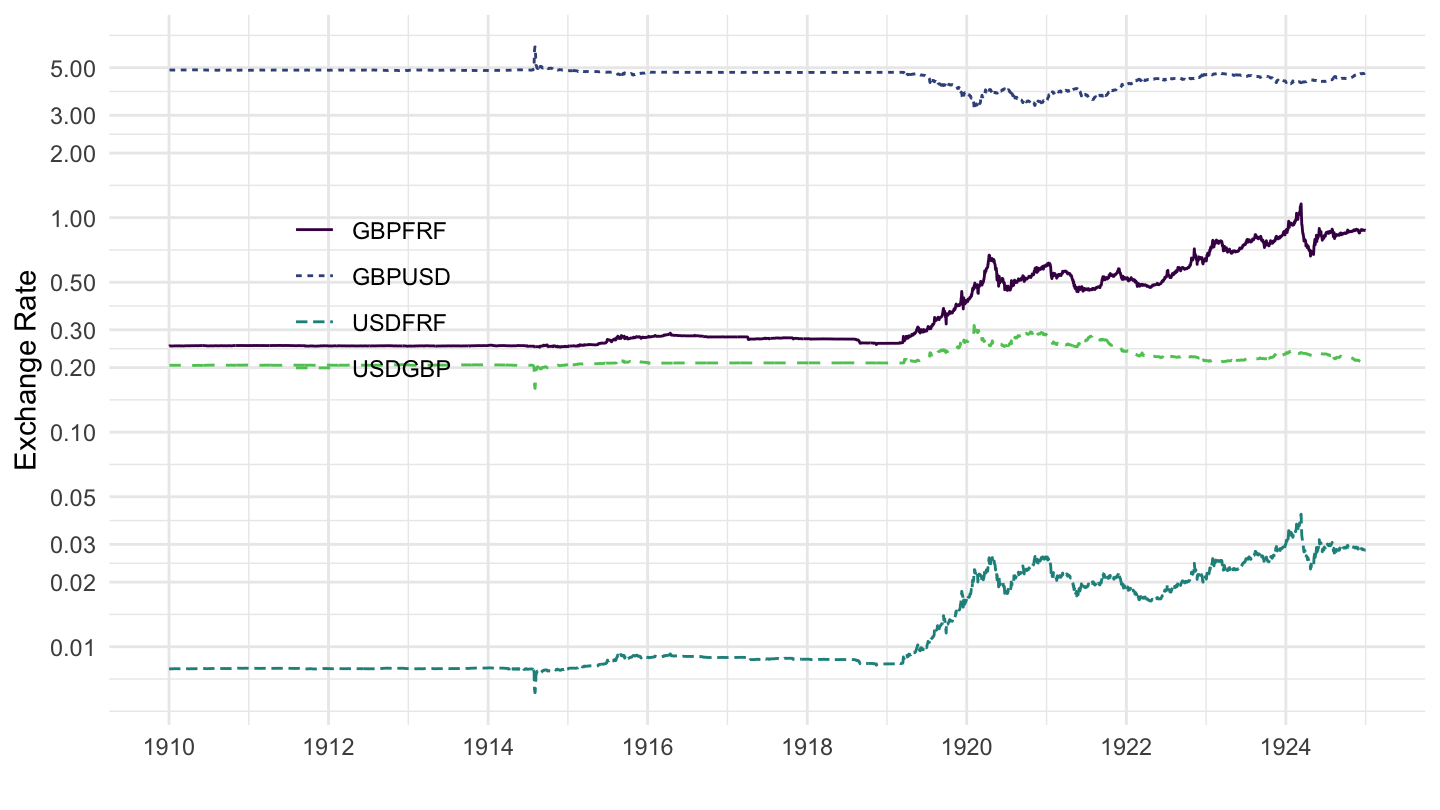
(ref:GBPUSD-USDFRF-1800-1925) France, Germany, United Kingdom Exchange Rates (1800-1925).
xrates |>
  filter(iso3c %in% c("GBP", "FRF", "USD"),
         iso3c_c %in% c("GBP", "USD", "FRF"),
         date >= as.Date("1800-01-01"),
         date <= as.Date("1925-01-01")) |>
  group_by(Ticker) |>
  ggplot() +
  geom_line(aes(x = date, y = value, color = Ticker, linetype = Ticker)) +
  theme_minimal() + xlab("") + ylab("Exchange Rate") +
  scale_x_date(breaks = seq(1600, 2100, 20) |> paste0("-01-01") |> as.Date(),
               labels = date_format("%Y")) +
  scale_y_log10(breaks = c(0.1*c(0.1, 0.2, 0.3, 0.5), c(0.1, 0.2, 0.3, 0.5), c(1, 2, 3, 5), seq(10, 100, 10)),
                     labels = dollar_format(accuracy = 0.01, prefix = "")) +
  scale_color_manual(values = viridis(5)[1:4]) +
  theme(legend.position = c(0.2, 0.6),
        legend.title = element_blank())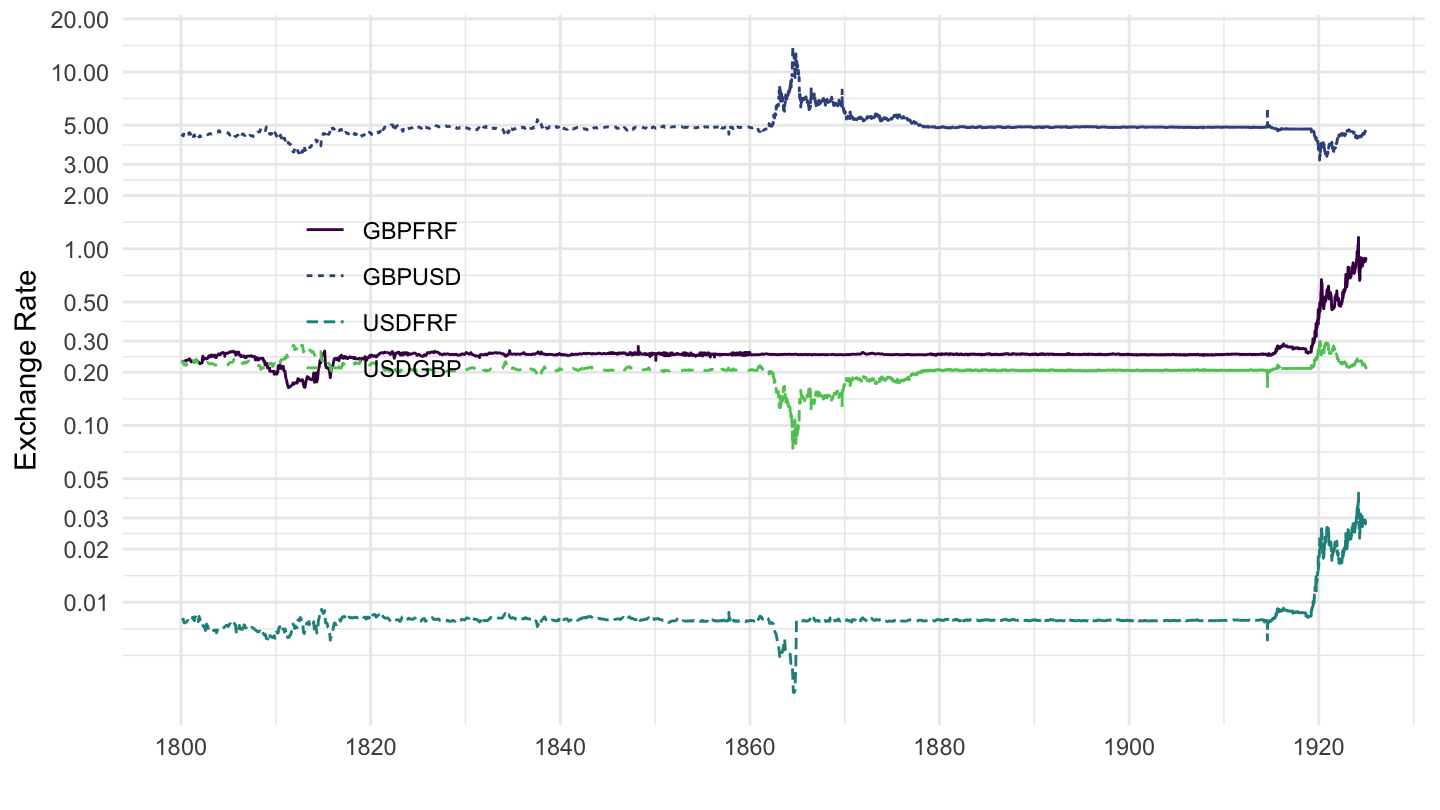
(ref:GBPUSD-USDFRF-1900-1940) France, Germany, United Kingdom Exchange Rates (1900-1940).
xrates |>
  filter(iso3c %in% c("GBP", "FRF", "USD"),
         iso3c_c %in% c("GBP", "USD", "FRF"),
         date >= as.Date("1900-01-01"),
         date <= as.Date("1940-01-01")) |>
  group_by(Ticker) |>
  ggplot() +
  geom_line(aes(x = date, y = value, color = Ticker, linetype = Ticker)) +
  theme_minimal() + xlab("") + ylab("Exchange Rate") +
  scale_x_date(breaks = seq(1600, 2100, 5) |> paste0("-01-01") |> as.Date(),
               labels = date_format("%Y")) +
  scale_y_log10(breaks = c(0.1*c(0.1, 0.2, 0.3, 0.5), c(0.1, 0.2, 0.3, 0.5), c(1, 2, 3, 5), seq(10, 100, 10)),
                     labels = dollar_format(accuracy = 0.01, prefix = "")) +
  scale_color_manual(values = viridis(5)[1:4]) +
  theme(legend.position = c(0.2, 0.6),
        legend.title = element_blank())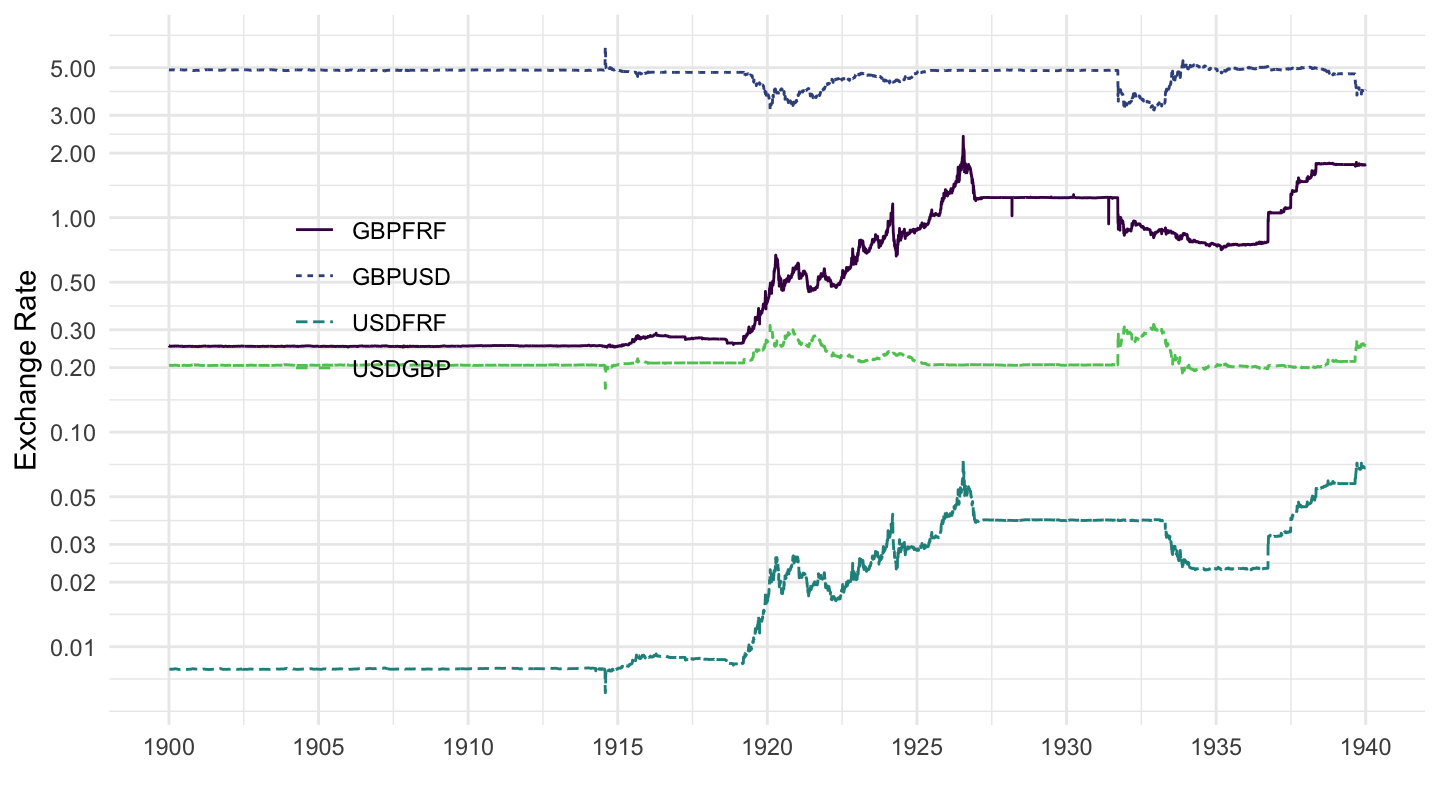
(ref:GBPUSD-USDFRF-1925-1970) France, Germany, United Kingdom Exchange Rates (1925-1970).
xrates |>
  filter(iso3c %in% c("GBP", "FRF", "USD"),
         iso3c_c %in% c("GBP", "USD", "FRF"),
         date >= as.Date("1925-01-01"),
         date <= as.Date("1970-01-01")) |>
  group_by(Ticker) |>
  ggplot() +
  geom_line(aes(x = date, y = value, color = Ticker, linetype = Ticker)) +
  theme_minimal() + xlab("") + ylab("Exchange Rate") +
  scale_x_date(breaks = seq(1925, 2100, 5) |> paste0("-01-01") |> as.Date(),
               labels = date_format("%Y")) +
  scale_y_log10(breaks = c(0.01, 0.02, 0.03, 0.05, 0.1, 0.2, 0.3, 0.5, 1, 2, 3, 5, 10, 20, 30, 50),
                     labels = dollar_format(accuracy = 0.01, prefix = "")) +
  scale_color_manual(values = viridis(5)[1:4]) +
  theme(legend.position = c(0.2, 0.80),
        legend.title = element_blank())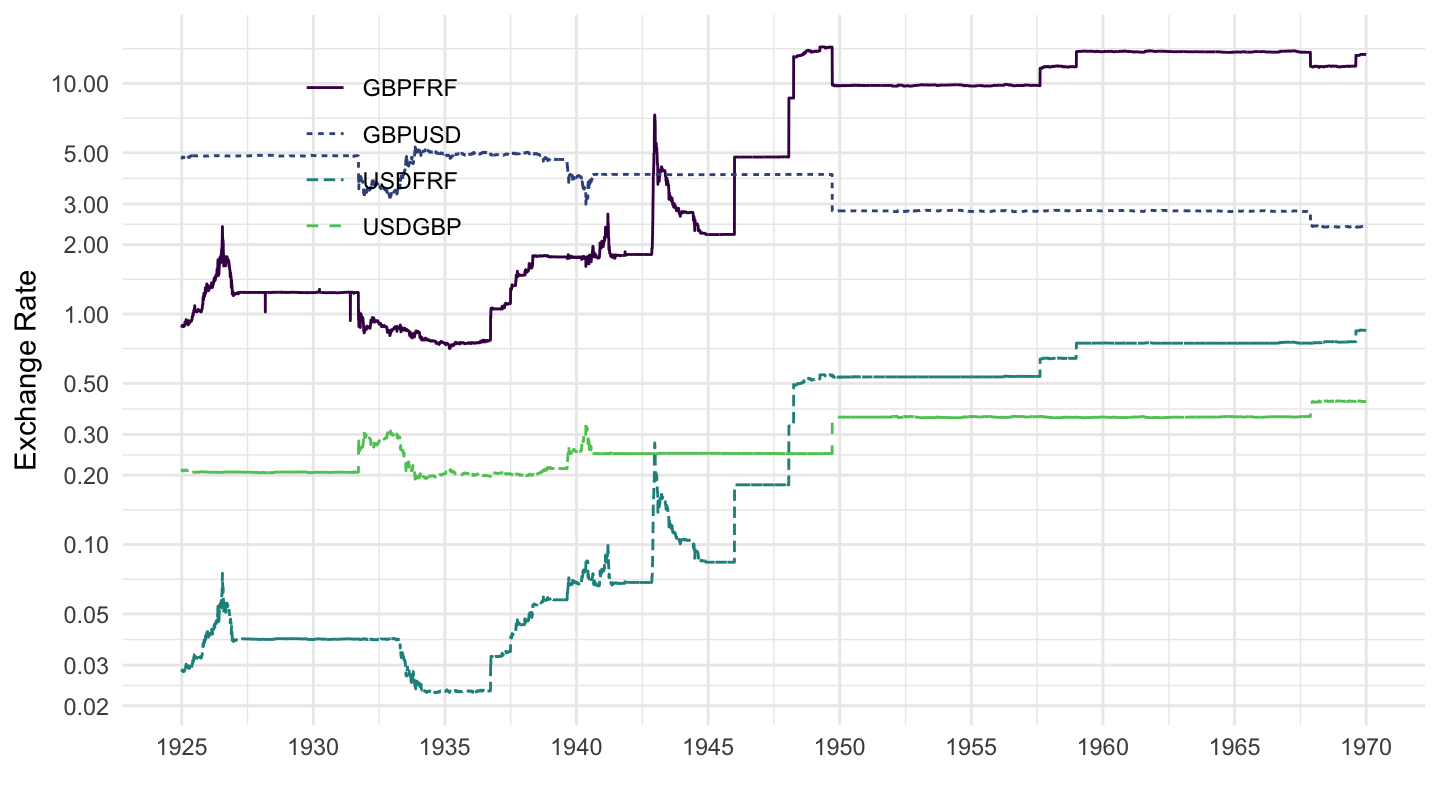
(ref:GBPUSD-USDFRF-1970-2020) France, Germany, United Kingdom Exchange Rates (1970-2020).
xrates |>
  filter(iso3c %in% c("GBP", "FRF", "USD"),
         iso3c_c %in% c("GBP", "USD", "FRF"),
         date >= as.Date("1970-01-01"),
         date <= as.Date("2020-01-01")) |>
  group_by(Ticker) |>
  ggplot() +
  geom_line(aes(x = date, y = value, color = Ticker, linetype = Ticker)) +
  theme_minimal() + xlab("") + ylab("Exchange Rate") +
  scale_x_date(breaks = seq(1925, 2100, 5) |> paste0("-01-01") |> as.Date(),
               labels = date_format("%Y")) +
  scale_y_log10(breaks = seq(0, 3, 0.1),
                labels = dollar_format(accuracy = 0.1, prefix = "")) +
  scale_color_manual(values = viridis(5)[1:4]) +
  theme(legend.position = c(0.8, 0.9),
        legend.title = element_blank())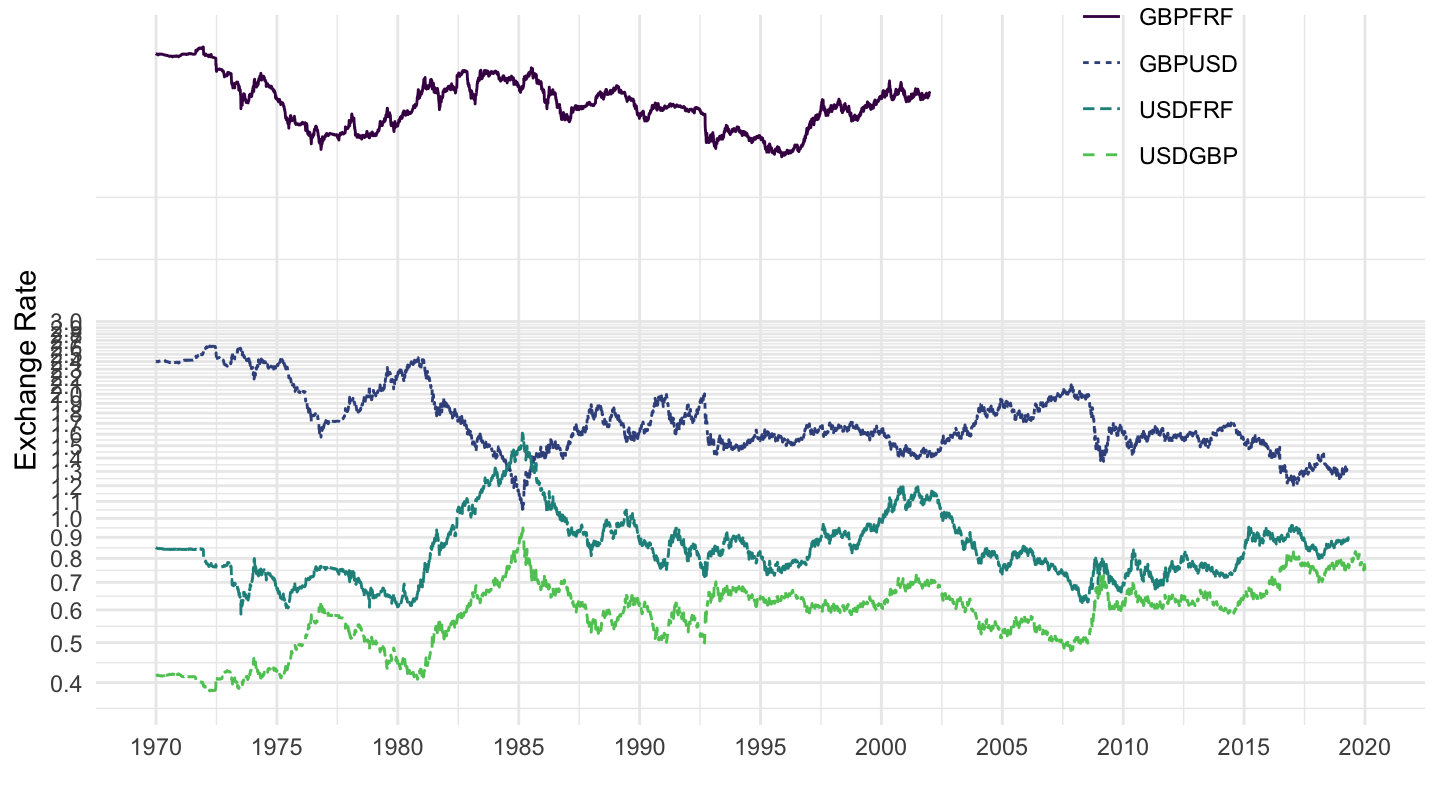
(ref:GBPUSD-USDFRF-1918-1940) France, Germany, United Kingdom Exchange Rates (1800-1970).
xrates |>
  filter(iso3c %in% c("GBP", "FRF", "USD"),
         iso3c_c %in% c("GBP", "USD", "FRF"),
         date >= as.Date("1918-01-01"),
         date <= as.Date("1940-01-01")) |>
  group_by(variable) |>
  ggplot() +
  geom_line(aes(x = date, y = value, color = Ticker, linetype = Ticker)) +
  theme_minimal() + xlab("") + ylab("Exchange Rate") +
  scale_x_date(breaks = seq(1600, 2100, 1) |> paste0("-01-01") |> as.Date(),
               labels = date_format("%Y")) +
  scale_y_log10(breaks = c(c(0.1, 0.2, 0.3, 0.5), c(1, 2, 3, 5), seq(10, 100, 10)),
                     labels = dollar_format(accuracy = 0.1, prefix = "")) +
  scale_color_manual(values = viridis(5)[1:4]) +
  theme(legend.position = c(0.2, 0.80),
        legend.title = element_blank())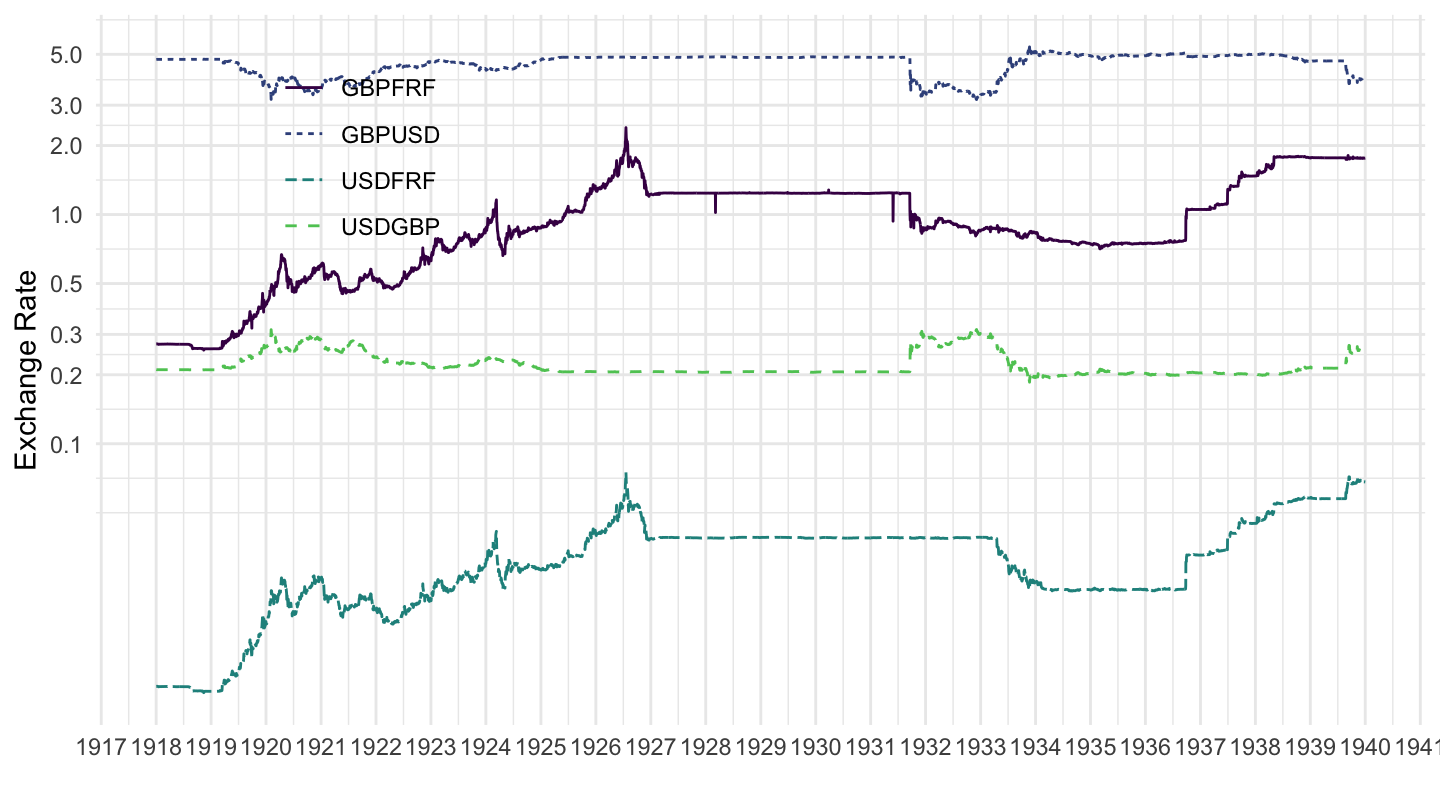
(ref:FRADEM-1900-1940) Weimar Hyperinflation Period (1900-1940).
xrates |>
  filter(iso3c %in% c("DEM", "FRF", "USD"),
         iso3c_c %in% c("DEM", "FRF", "USD"),
         date >= as.Date("1900-01-01"),
         date <= as.Date("1940-01-01")) |>
  select(Ticker, date, value) |>
  spread(Ticker, value) |>
  ggplot() +
  geom_line(aes(x = date, y = USDDEM/USDFRF)) +
  theme_minimal() + xlab("") + ylab("$1 in Deutsche Mark") +
  scale_x_date(breaks = seq(1600, 2100, 5) |> paste0("-01-01") |> as.Date(),
               labels = date_format("%Y")) +
  scale_y_log10(breaks = 10^seq(-20, 0, 1),
                  labels = dollar_format(accuracy = 0.0000000000001, prefix = "")) +
  scale_color_manual(values = viridis(5)[1:4]) +
  theme(legend.position = c(0.2, 0.6),
        legend.title = element_blank())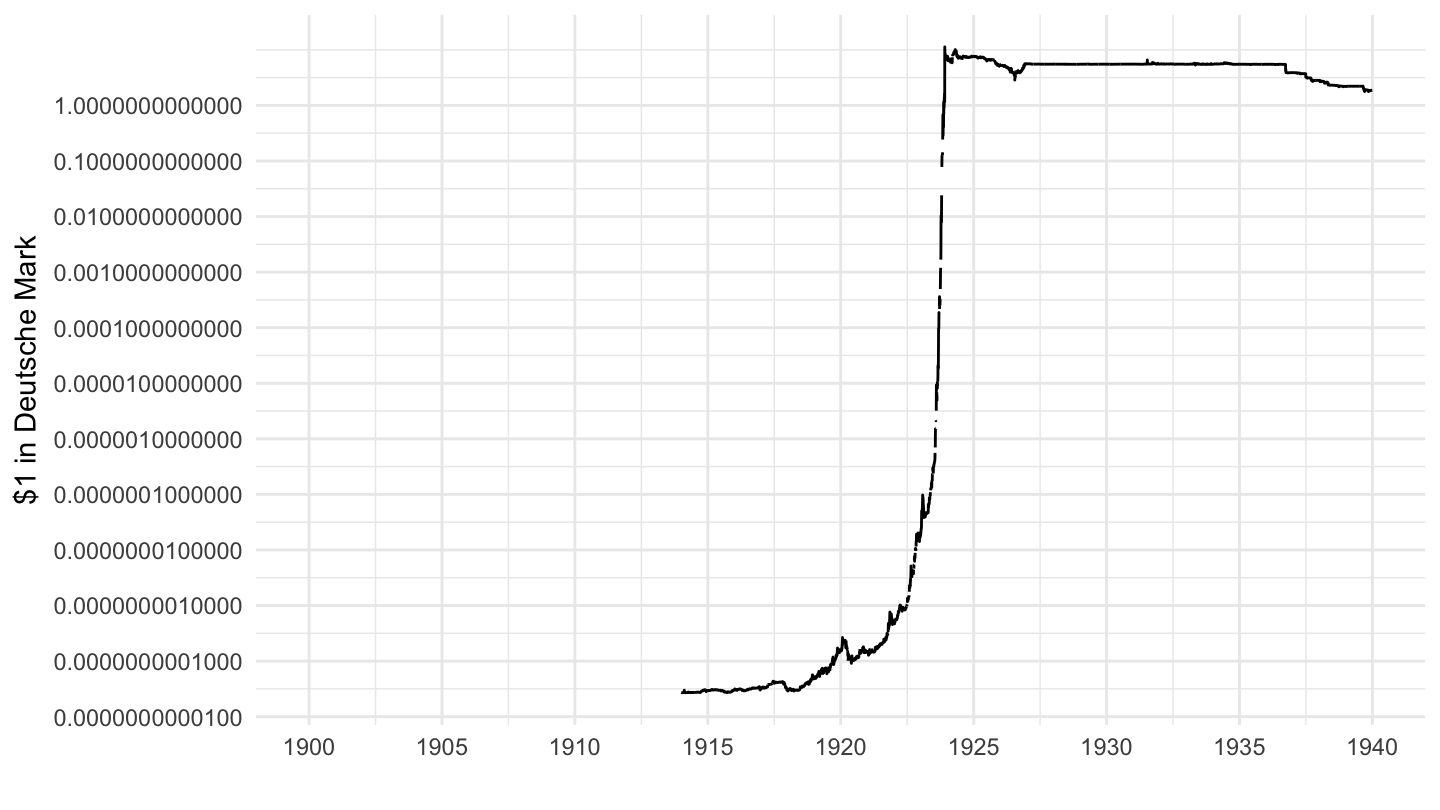
(ref:USDDEM-1900-1940) Weimar Hyperinflation Period (1900-1940).
xrates |>
  filter(iso3c %in% c("DEM", "USD"),
         iso3c_c %in% c("DEM", "USD"),
         date >= as.Date("1900-01-01"),
         date <= as.Date("1940-01-01")) |>
  group_by(Ticker) |>
  ggplot() +
  geom_line(aes(x = date, y = value)) +
  theme_minimal() + xlab("") + ylab("$1 in Deutsche Mark") +
  scale_x_date(breaks = seq(1600, 2100, 5) |> paste0("-01-01") |> as.Date(),
               labels = date_format("%Y")) +
  scale_y_log10(breaks = 10^seq(-20, 0, 1),
                  labels = dollar_format(accuracy = 0.0000000000001, prefix = "")) +
  scale_color_manual(values = viridis(5)[1:4]) +
  theme(legend.position = c(0.2, 0.6),
        legend.title = element_blank())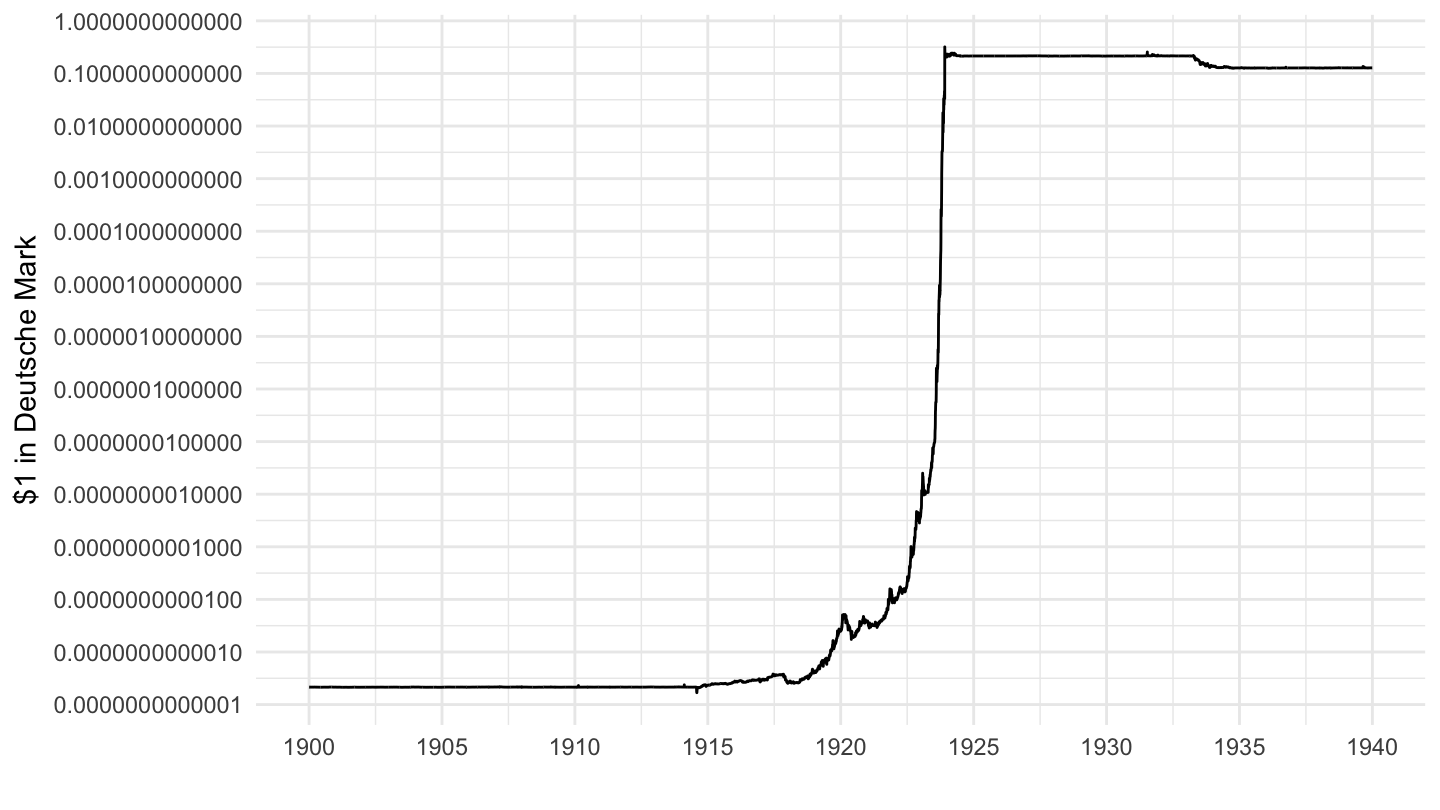
(ref:USDDEM-1900-1940) Weimar Hyperinflation Period (1900-1940).
xrates |>
  filter(iso3c %in% c("DEM", "USD"),
         iso3c_c %in% c("DEM", "USD"),
         date >= as.Date("1918-01-01"),
         date <= as.Date("1926-01-01")) |>
  group_by(Ticker) |>
  ggplot() +
  geom_line(aes(x = date, y = value)) +
  theme_minimal() + xlab("") + ylab("$1 in Deutsche Mark") +
  scale_x_date(breaks = seq(1600, 2100, 1) |> paste0("-01-01") |> as.Date(),
               labels = date_format("%Y")) +
  scale_y_log10(breaks = 10^seq(-20, 0, 1),
                  labels = dollar_format(accuracy = 0.0000000000001, prefix = "")) +
  scale_color_manual(values = viridis(5)[1:4]) +
  theme(legend.position = c(0.2, 0.6),
        legend.title = element_blank())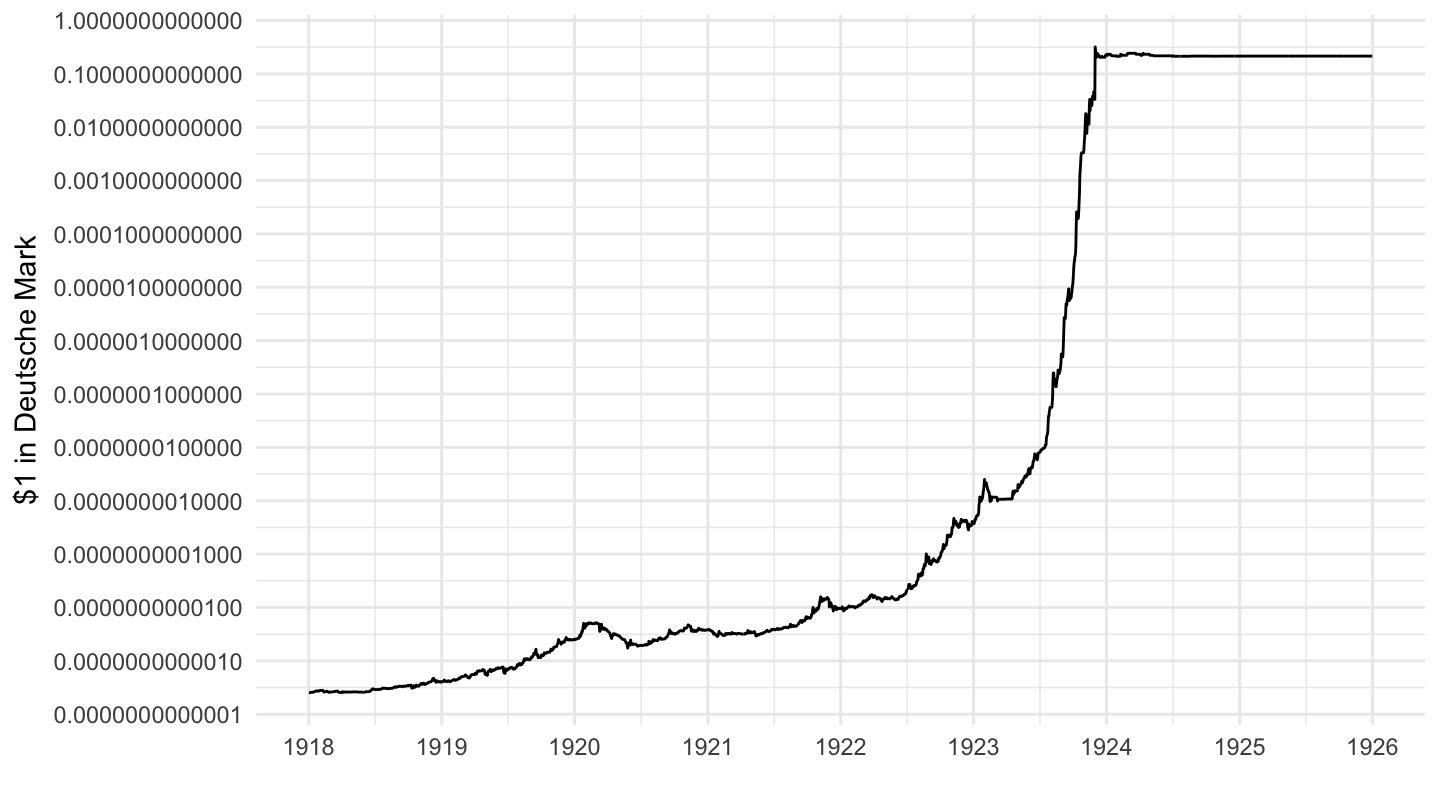
(ref:USDDEM-1928-1934) Devaluation of the Dollar vis-à-vis Germany.
xrates |>
  filter(iso3c %in% c("DEM", "USD"),
         iso3c_c %in% c("DEM", "USD"),
         date >= as.Date("1928-01-01"),
         date <= as.Date("1935-01-01")) |>
  group_by(Ticker) |>
  ggplot() +
  geom_line(aes(x = date, y = value)) +
  theme_minimal() + xlab("") + ylab("$1 in Deutsche Mark") +
  scale_x_date(breaks = seq(1600, 2100, 1) |> paste0("-01-01") |> as.Date(),
               labels = date_format("%Y")) +
  scale_y_log10(breaks = seq(0, 2, 0.01),
                  labels = dollar_format(accuracy = 0.01, prefix = "")) +
  scale_color_manual(values = viridis(5)[1:4]) +
  theme(legend.position = c(0.2, 0.6),
        legend.title = element_blank())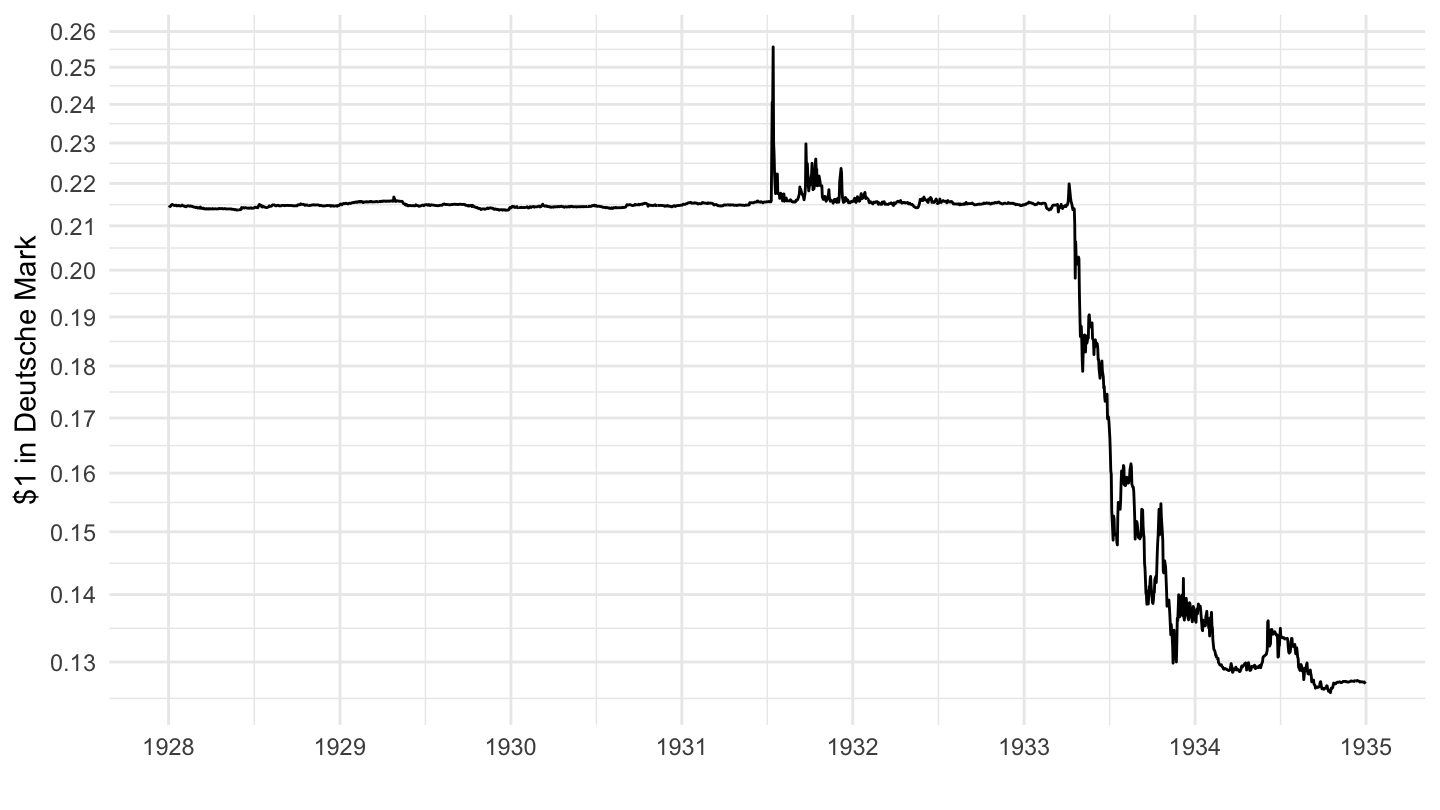
xrates |>
  filter(iso3c %in% c("DEM", "USD", "GBP"),
         iso3c_c %in% c("DEM", "USD", "FRF"),
         date >= as.Date("1929-01-01"),
         date <= as.Date("1937-01-01")) |>
  select(date, Ticker, value) |>
  spread(Ticker, value) |>
  transmute(date,
            `Deutschemark per US Dollar` = USDDEM,
            `Deutschemark per British Pound` = GBPUSD*USDDEM,
            `Deutschemark per French Franc` = USDDEM/USDFRF) |>
  gather(variable, value, -date) |>
  group_by(variable) |>
  mutate(value = 100*value/value[1]) |>
  ggplot() + theme_minimal() + xlab("") + ylab("Deutschemark Exchange Rate (Base 100 = 1929)") +
  geom_line(aes(x = date, y = value, color = variable)) +
  scale_color_manual(values = viridis(4)[1:3]) +
  scale_x_date(breaks = seq(1600, 2100, 1) |> paste0("-01-01") |> as.Date(),
               labels = date_format("%Y")) +
  scale_y_log10(breaks = seq(0, 200, 5),
                  labels = dollar_format(accuracy = 1, prefix = "")) +
  theme(legend.position = c(0.2, 0.15),
        legend.title = element_blank())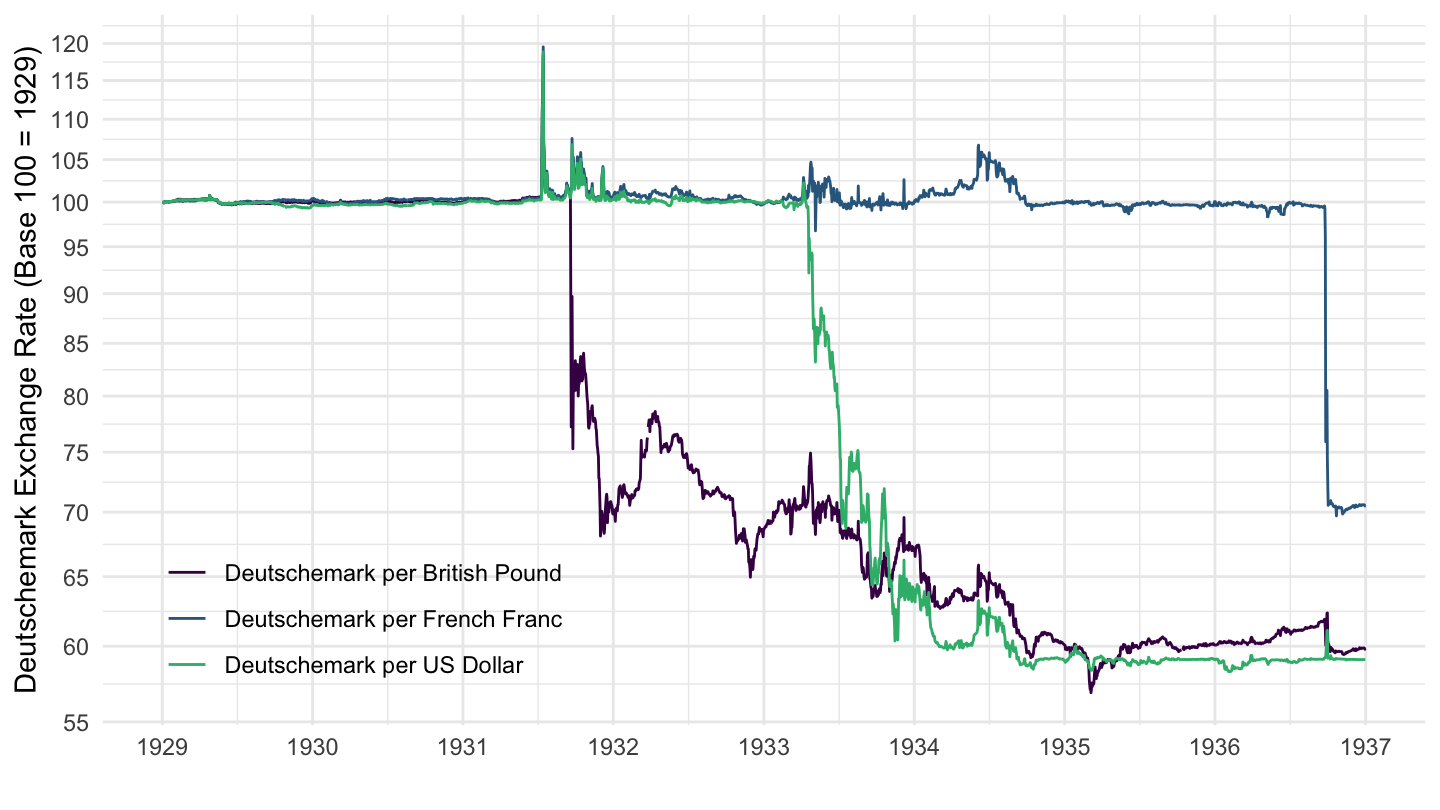
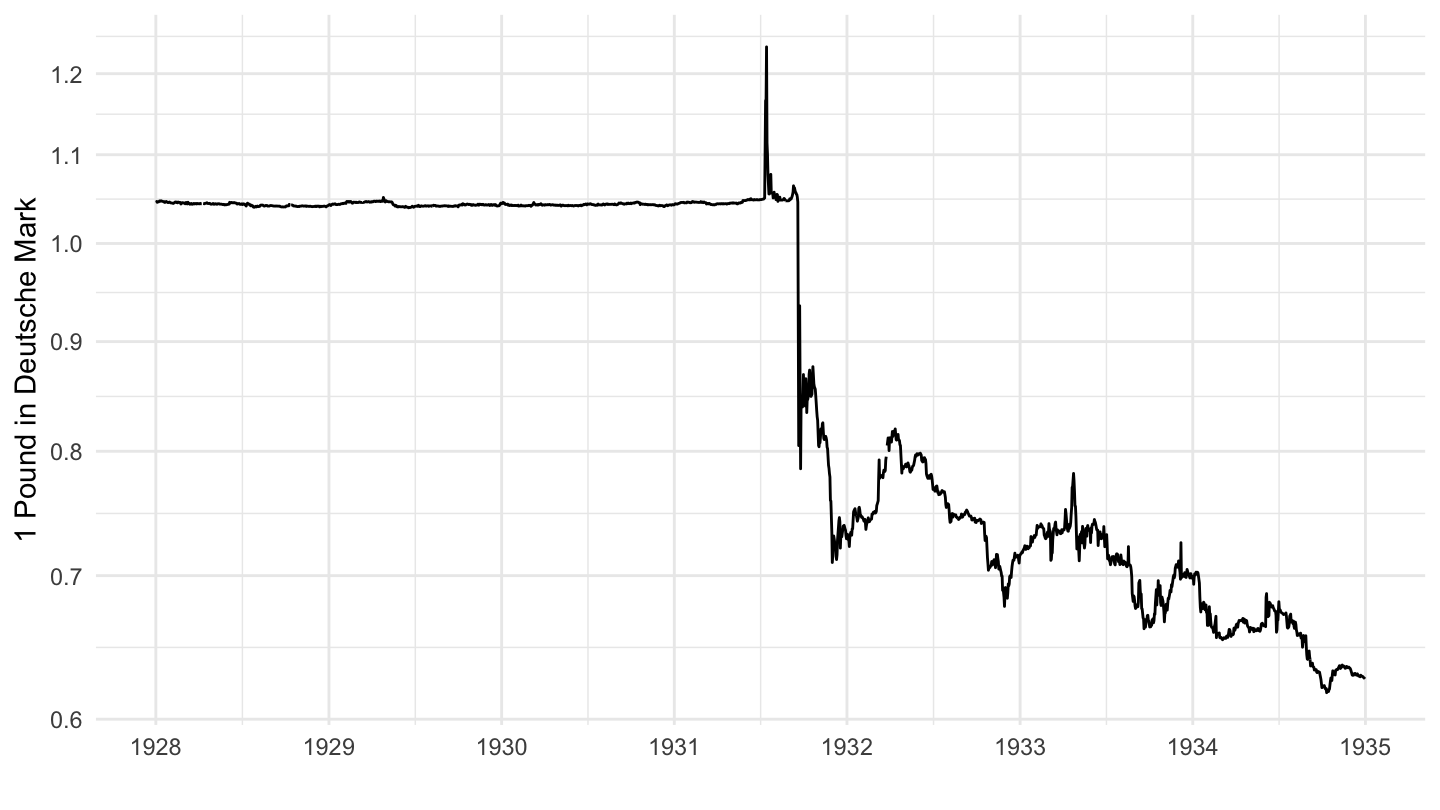
(ref:GBPDEM-1928-1934) Devaluation of the Pound vis-à-vis the Mark.
xrates |>
  filter(iso3c %in% c("DEM", "GBP", "USD"),
         iso3c_c %in% c("DEM", "GBP", "USD"),
         date >= as.Date("1928-01-01"),
         date <= as.Date("1935-01-01")) |>
  select(Ticker, date, value) |>
  spread(Ticker, value) |>
  ggplot() +
  geom_line(aes(x = date, y = USDDEM/USDGBP)) +
  theme_minimal() + xlab("") + ylab("1 Pound in Deutsche Mark") +
  scale_x_date(breaks = seq(1600, 2100, 1) |> paste0("-01-01") |> as.Date(),
               labels = date_format("%Y")) +
  scale_y_log10(breaks = seq(0, 2, 0.1),
                  labels = dollar_format(accuracy = 0.1, prefix = "")) +
  scale_color_manual(values = viridis(5)[1:4]) +
  theme(legend.position = c(0.2, 0.6),
        legend.title = element_blank())