| LAST_COMPILE |
|---|
| 2026-07-24 |
Exchange Rates
Data - ECB
Info
LAST_COMPILE
Last
| TIME_PERIOD | FREQ | Nobs |
|---|---|---|
| 2026-S1 | H | 29 |
| 2026-Q2 | Q | 632 |
| 2026-07-23 | D | 248 |
| 2026-06 | M | 698 |
| 2025 | A | 1277 |
FREQ
Code
EXR %>%
  group_by(FREQ) %>%
  summarise(Nobs = n()) %>%
  arrange(-Nobs) %>%
print_table_conditional()| FREQ | Nobs |
|---|---|
| D | 2942826 |
| M | 348577 |
| Q | 188537 |
| A | 40799 |
| H | 2040 |
COLLECTION
Code
EXR %>%
  group_by(COLLECTION) %>%
  summarise(Nobs = n()) %>%
  arrange(-Nobs) %>%
print_table_conditional()| COLLECTION | Nobs |
|---|---|
| A | 3506051 |
| E | 16728 |
OBS_STATUS
Code
EXR %>%
  group_by(OBS_STATUS) %>%
  summarise(Nobs = n()) %>%
  arrange(-Nobs) %>%
print_table_conditional()| OBS_STATUS | Nobs |
|---|---|
| A | 2688773 |
| M | 811050 |
| P | 20539 |
| H | 2417 |
Last
Code
EXR %>%
  filter(TIME_PERIOD == last_time) %>%
  select_if(function(col) length(unique(col)) > 1) %>%
  select(KEY, CURRENCY, CURRENCY_DENOM, OBS_VALUE) %>%
  print_table_conditional()
Swiss Franc, Dollar, Pound
All
Code
EXR %>%
  filter(FREQ == "D",
         CURRENCY %in% c("USD", "CHF", "GBP")) %>%
  month_to_date %>%
  ggplot(.) + geom_line(aes(x = date, y = OBS_VALUE, color = TITLE)) +
  theme_minimal() + xlab("") + ylab("") +
  scale_x_date(breaks = seq(1960, 2100, 2) %>% paste0("-01-01") %>% as.Date,
               labels = date_format("%Y")) +
  scale_y_continuous(breaks = seq(0.1, 3, 0.1),
                     labels = dollar_format(accuracy = .1, prefix = "", suffix = "/€")) +

  theme(legend.position = c(0.8, 0.80),
        legend.title = element_blank()) +
  geom_label(data = . %>% filter(max(date) == date),
             aes(x = date, y = OBS_VALUE, label = round(OBS_VALUE, 3), color = TITLE),
             show.legend = F)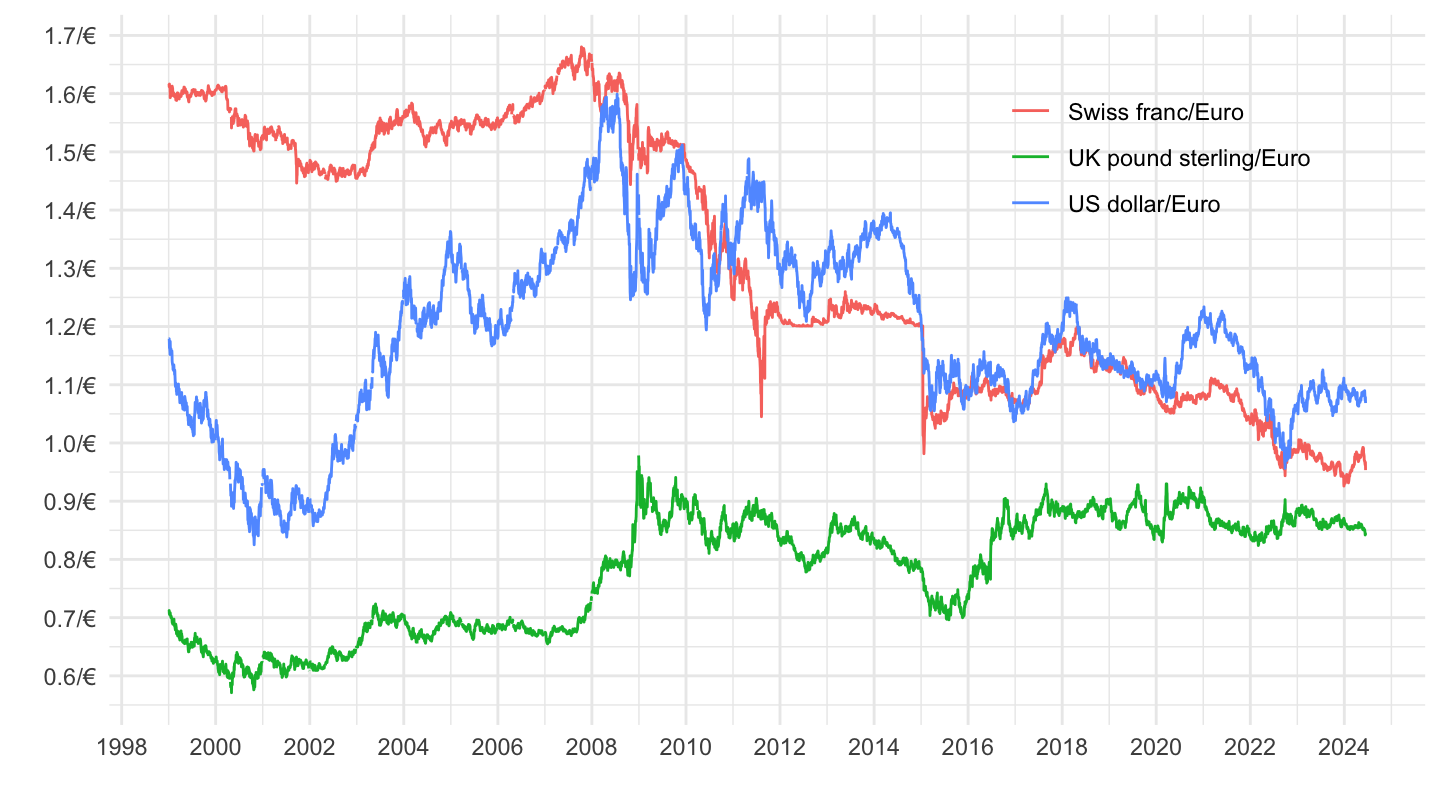
2008-
Code
EXR %>%
  filter(FREQ == "D",
         CURRENCY %in% c("USD", "CHF", "GBP")) %>%
  month_to_date %>%
  filter(date >= as.Date("2008-01-01")) %>%
  ggplot(.) + geom_line(aes(x = date, y = OBS_VALUE, color = TITLE)) +
  theme_minimal() + xlab("") + ylab("") +
  scale_x_date(breaks = seq(1960, 2100, 2) %>% paste0("-01-01") %>% as.Date,
               labels = date_format("%Y")) +
  scale_y_continuous(breaks = seq(0.1, 3, 0.1),
                     labels = dollar_format(accuracy = .1, prefix = "", suffix = "/€")) +

  theme(legend.position = c(0.8, 0.80),
        legend.title = element_blank()) +
  geom_label(data = . %>% filter(max(date) == date),
             aes(x = date, y = OBS_VALUE, label = round(OBS_VALUE, 3), color = TITLE),
             show.legend = F)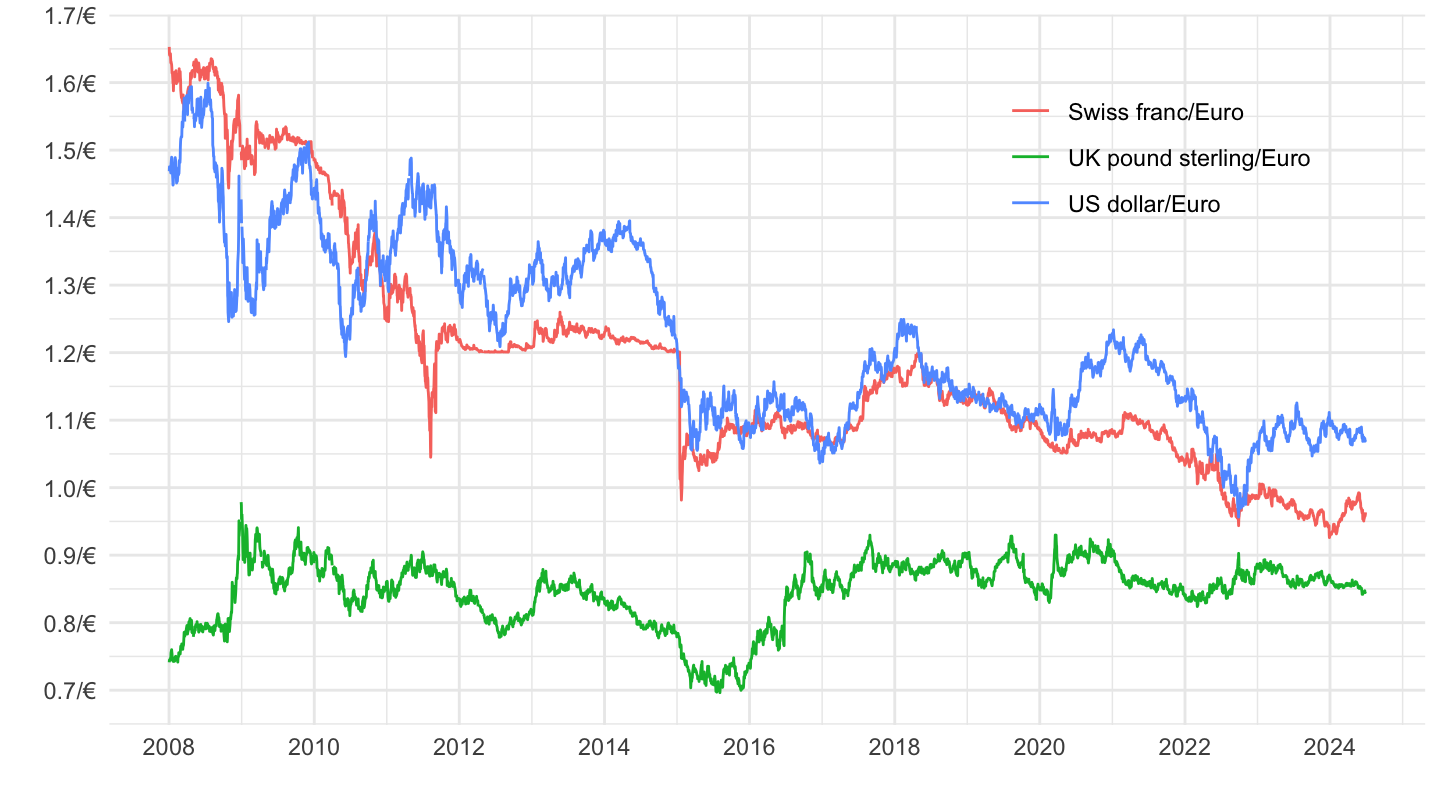
2021-
Code
EXR %>%
  filter(FREQ == "D",
         CURRENCY %in% c("USD", "CHF", "GBP")) %>%
  month_to_date %>%
  filter(date >= as.Date("2021-01-01")) %>%
  ggplot(.) + geom_line(aes(x = date, y = OBS_VALUE, color = TITLE)) +
  theme_minimal() + xlab("") + ylab("") +
  scale_x_date(breaks = "3 months",
               labels = date_format("%b %Y")) +
  scale_y_continuous(breaks = seq(0.1, 3, 0.05),
                     labels = dollar_format(accuracy = .1, prefix = "", suffix = "/€")) +

  theme(legend.position = c(0.8, 0.9),
        legend.title = element_blank(),
        axis.text.x = element_text(angle = 45, vjust = 1, hjust = 1)) +
  geom_label(data = . %>% filter(max(date) == date),
             aes(x = date, y = OBS_VALUE, label = round(OBS_VALUE, 3), color = TITLE),
             show.legend = F)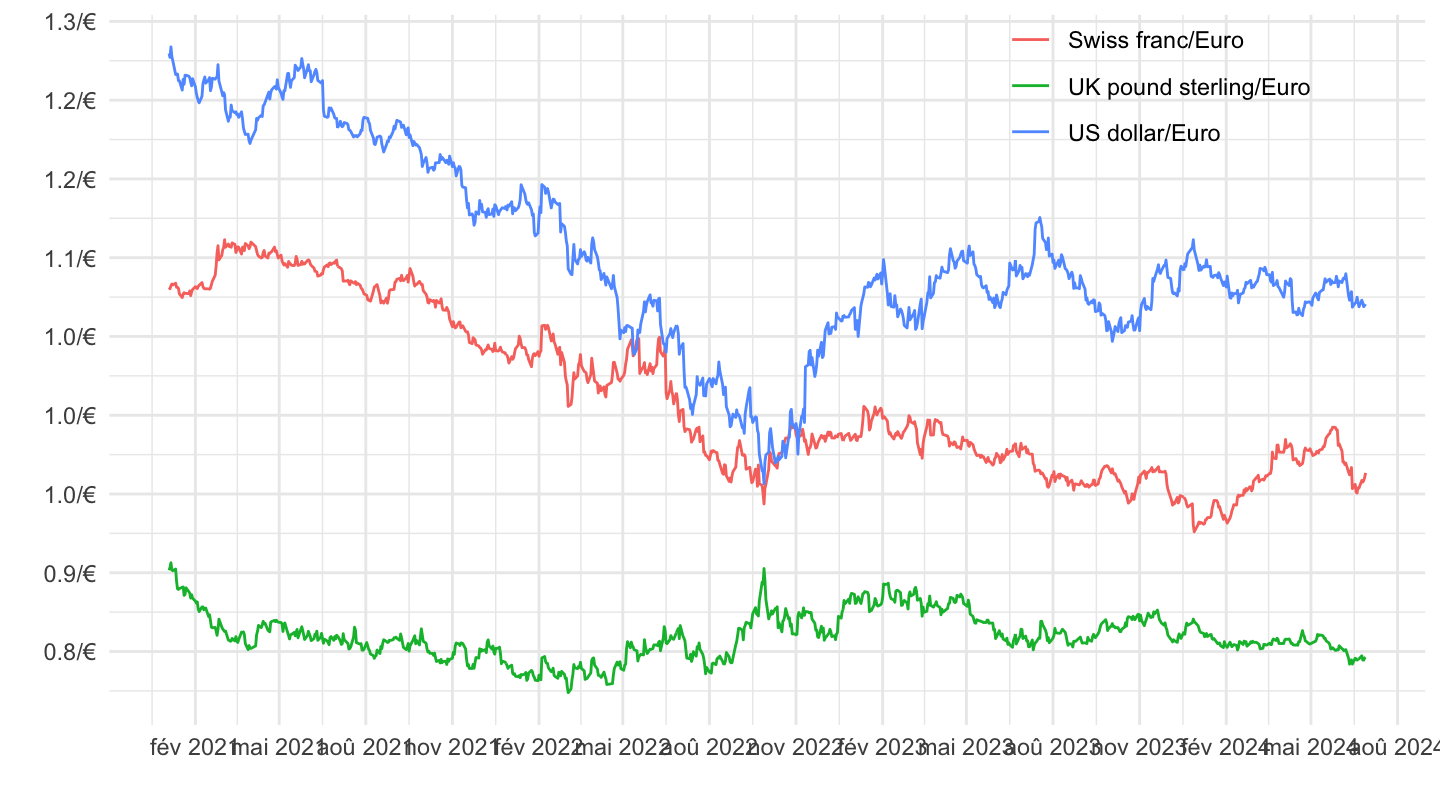
2 years before
Code
EXR %>%
  filter(FREQ == "D",
         CURRENCY %in% c("USD", "CHF", "GBP")) %>%
  month_to_date %>%
  filter(date >= Sys.Date() - years(2)) %>%
  ggplot(.) + geom_line(aes(x = date, y = OBS_VALUE, color = TITLE)) +
  theme_minimal() + xlab("") + ylab("") +
  scale_x_date(breaks = "2 months",
               labels = date_format("%b %Y")) +
  scale_y_continuous(breaks = seq(0.1, 3, 0.05),
                     labels = dollar_format(accuracy = .01, prefix = "", suffix = "/€")) +

  theme(legend.position = c(0.8, 0.9),
        legend.title = element_blank(),
        axis.text.x = element_text(angle = 45, vjust = 1, hjust = 1)) +
  geom_label(data = . %>% filter(max(date) == date),
             aes(x = date, y = OBS_VALUE, label = round(OBS_VALUE, 3), color = TITLE),
             show.legend = F)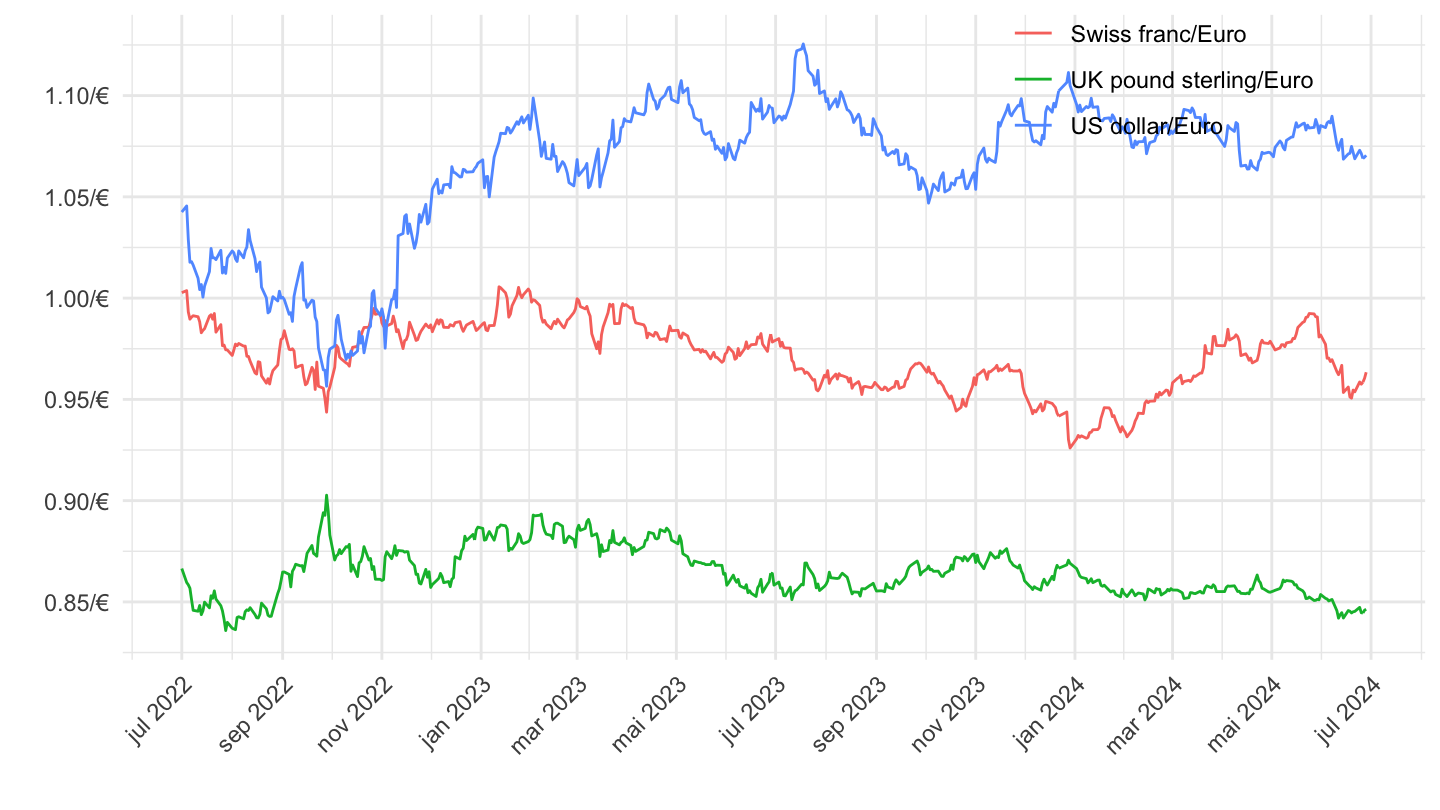
2022-
Code
EXR %>%
  filter(FREQ == "D",
         CURRENCY %in% c("USD", "CHF", "GBP")) %>%
  month_to_date %>%
  filter(date >= as.Date("2022-01-01")) %>%
  ggplot(.) + geom_line(aes(x = date, y = OBS_VALUE, color = TITLE)) +
  theme_minimal() + xlab("") + ylab("") +
  scale_x_date(breaks = "3 months",
               labels = date_format("%b %Y")) +
  scale_y_continuous(breaks = seq(0.1, 3, 0.05),
                     labels = dollar_format(accuracy = .1, prefix = "", suffix = "/€")) +

  theme(legend.position = c(0.8, 0.9),
        legend.title = element_blank(),
        axis.text.x = element_text(angle = 45, vjust = 1, hjust = 1)) +
  geom_label(data = . %>% filter(max(date) == date),
             aes(x = date, y = OBS_VALUE, label = round(OBS_VALUE, 3), color = TITLE),
             show.legend = F)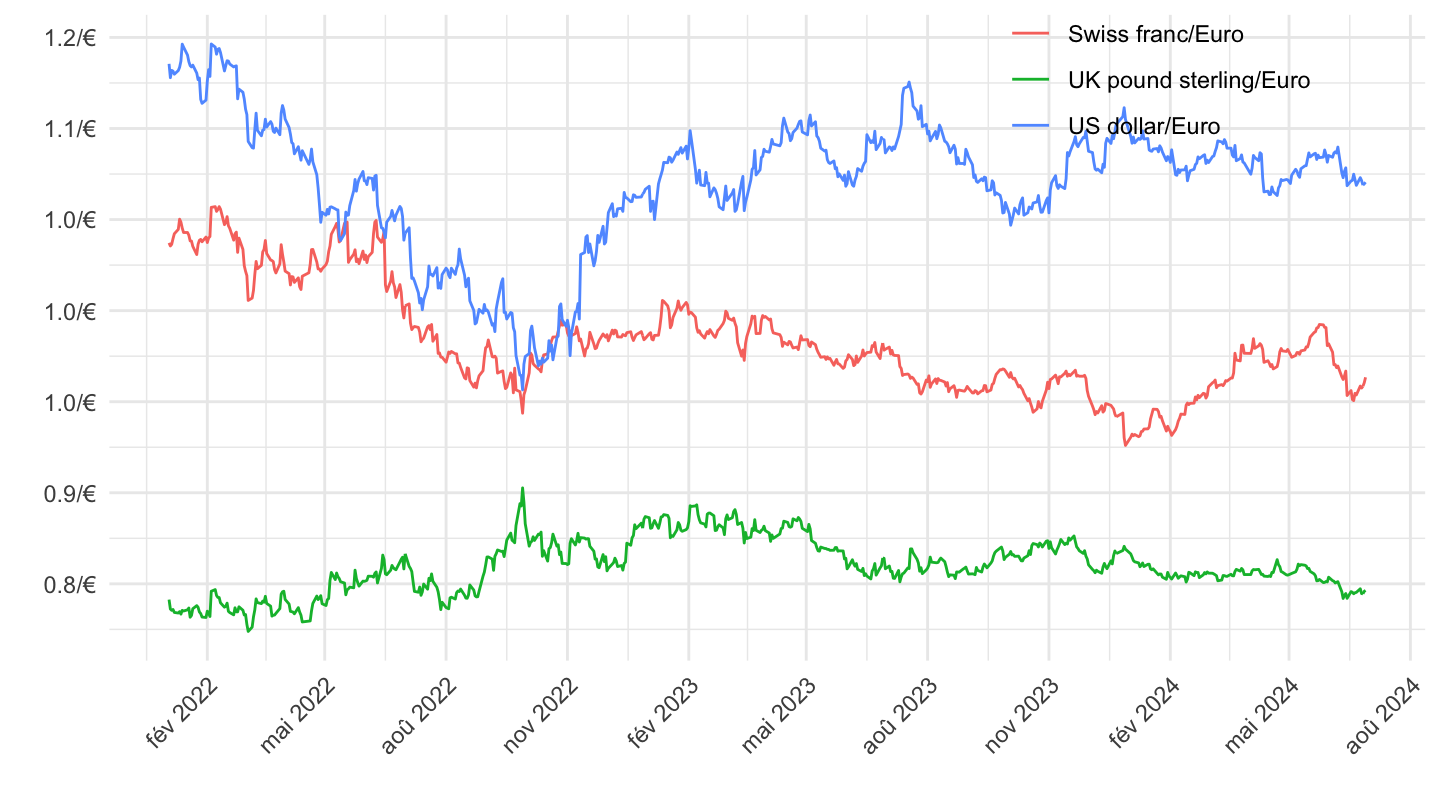
1 year-before
Code
EXR %>%
  filter(FREQ == "D",
         CURRENCY %in% c("USD", "CHF", "GBP")) %>%
  month_to_date %>%
  filter(date >= Sys.Date() - years(1)) %>%
  arrange(desc(date)) %>%
  ggplot(.) + geom_line(aes(x = date, y = OBS_VALUE, color = TITLE)) +
  theme_minimal() + xlab("") + ylab("") +
  scale_x_date(breaks = "1 month",
               labels = date_format("%b %Y")) +
  scale_y_log10(breaks = seq(0.1, 3, 0.04),
                     labels = dollar_format(accuracy = .01, prefix = "", suffix = "/€")) +

  theme(legend.position = c(0.15, 0.9),
        legend.title = element_blank(),
        axis.text.x = element_text(angle = 45, vjust = 1, hjust = 1)) +
  geom_label(data = . %>% filter(max(date) == date),
             aes(x = date, y = OBS_VALUE, label = round(OBS_VALUE, 3), color = TITLE),
             show.legend = F)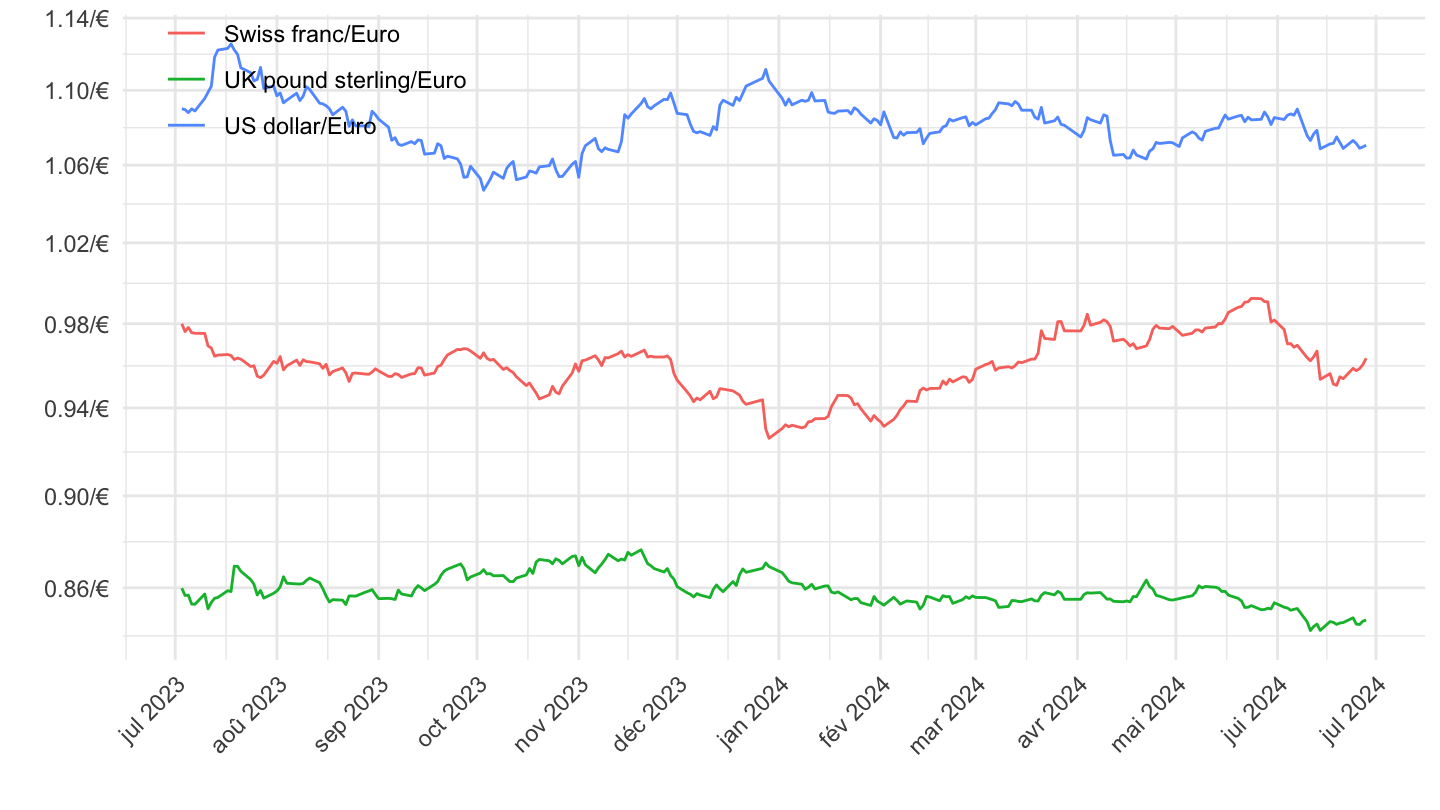
6 months
Code
EXR %>%
  filter(FREQ == "D",
         CURRENCY %in% c("USD", "CHF", "GBP")) %>%
  month_to_date %>%
  filter(date >= Sys.Date() - months(3)) %>%
  arrange(desc(date)) %>%
  ggplot(.) + geom_line(aes(x = date, y = OBS_VALUE, color = TITLE)) +
  theme_minimal() + xlab("") + ylab("") +
  scale_x_date(breaks = "7 days",
               labels = date_format("%d %b %Y")) +
  scale_y_log10(breaks = seq(0.1, 3, 0.04),
                     labels = dollar_format(accuracy = .01, prefix = "", suffix = "/€")) +

  theme(legend.position = c(0.15, 0.3),
        legend.title = element_blank(),
        axis.text.x = element_text(angle = 45, vjust = 1, hjust = 1)) +
  geom_text_repel(aes(x = date, y = OBS_VALUE, label = OBS_VALUE),
                  fontface ="plain", color = "black", size = 3)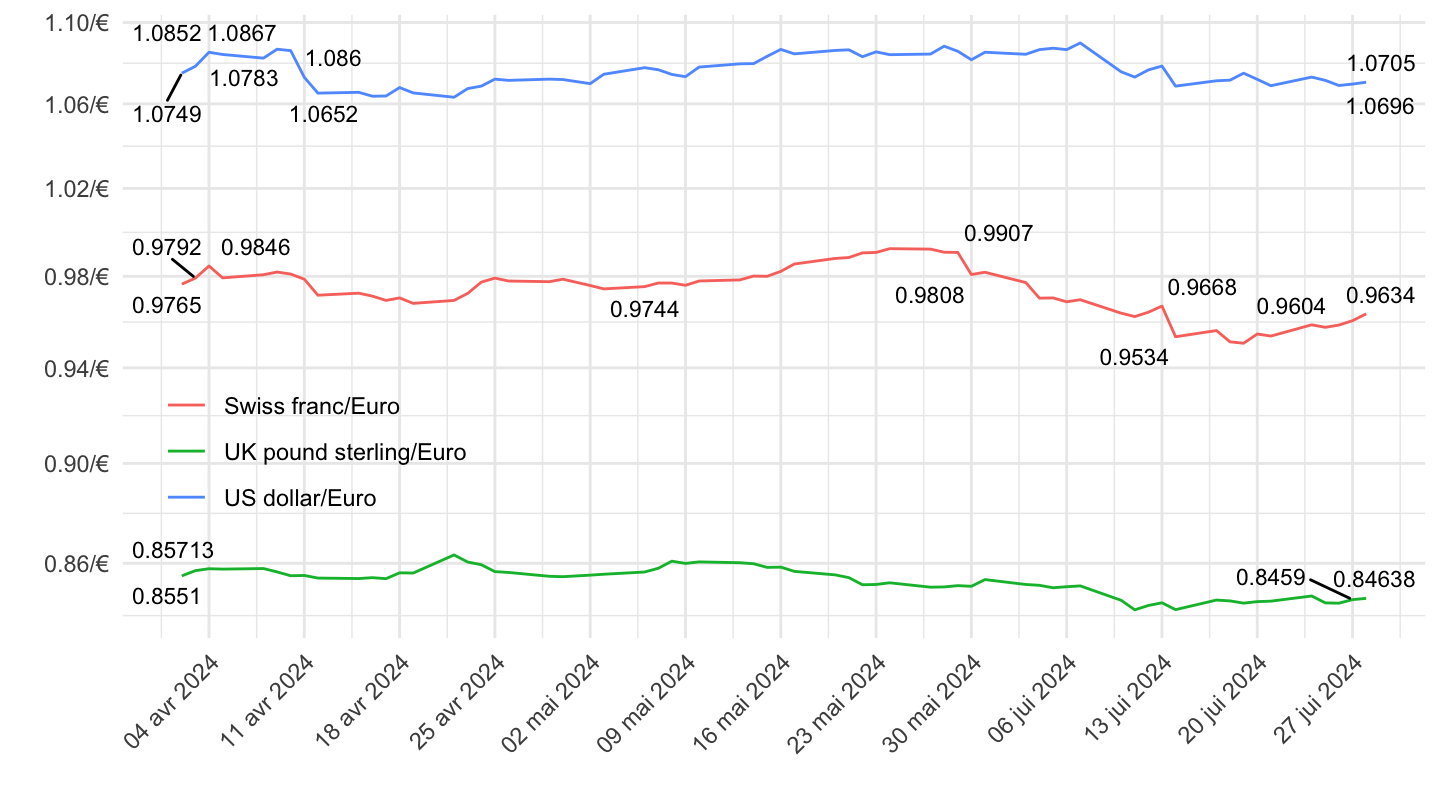
3 months
Code
EXR %>%
  filter(FREQ == "D",
         CURRENCY %in% c("USD", "CHF", "GBP")) %>%
  month_to_date %>%
  filter(date >= Sys.Date() - months(3)) %>%
  arrange(desc(date)) %>%
  ggplot(.) + geom_line(aes(x = date, y = OBS_VALUE, color = TITLE)) +
  theme_minimal() + xlab("") + ylab("") +
  scale_x_date(breaks = "3 days",
               labels = date_format("%d %b %Y")) +
  scale_y_log10(breaks = seq(0.1, 3, 0.04),
                     labels = dollar_format(accuracy = .01, prefix = "", suffix = "/€")) +

  theme(legend.position = c(0.15, 0.3),
        legend.title = element_blank(),
        axis.text.x = element_text(angle = 45, vjust = 1, hjust = 1)) +
  geom_text_repel(aes(x = date, y = OBS_VALUE, label = OBS_VALUE),
                  fontface ="plain", color = "black", size = 3)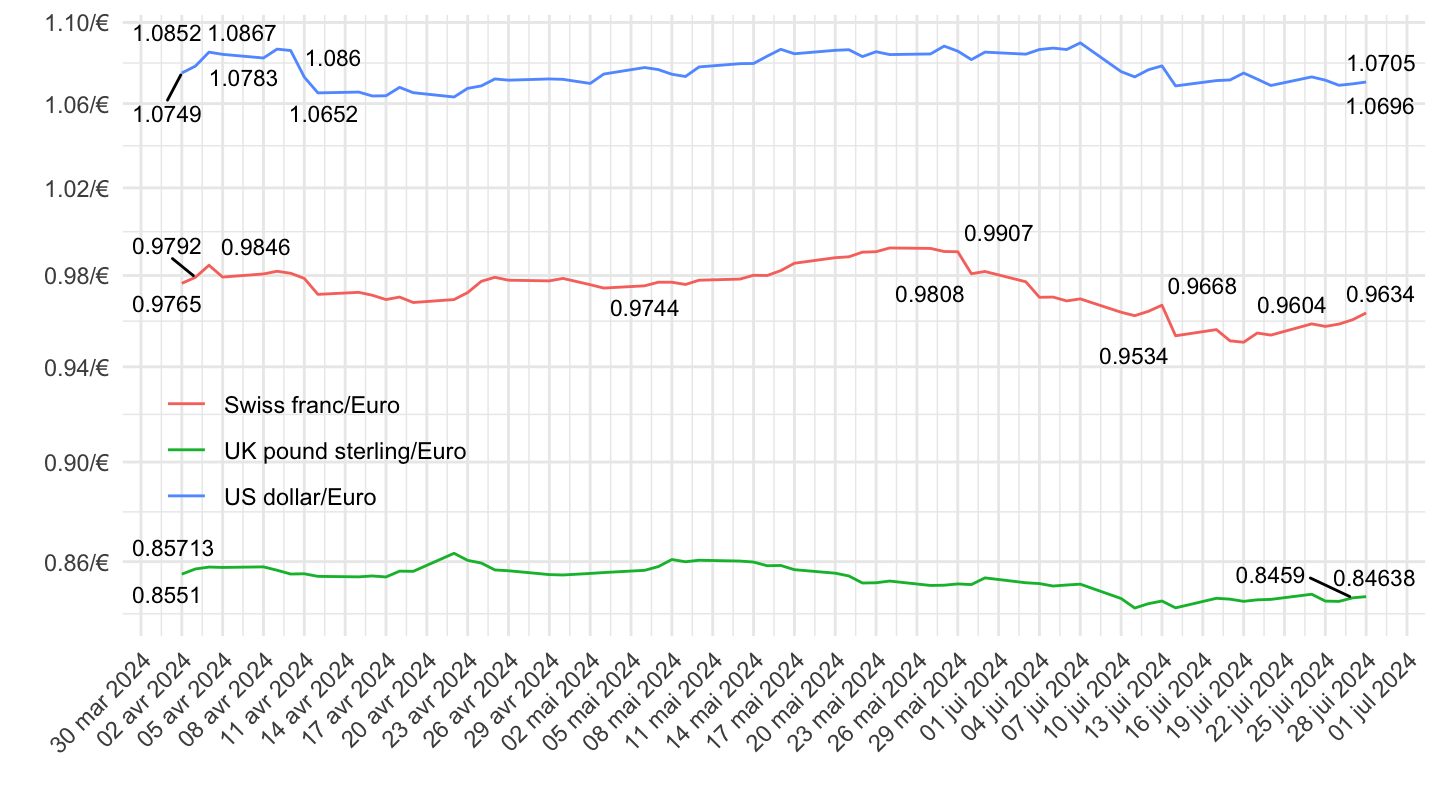
1 month
Code
EXR %>%
  filter(FREQ == "D",
         CURRENCY %in% c("USD", "CHF", "GBP")) %>%
  month_to_date %>%
  filter(date >= Sys.Date() - months(1)) %>%
  arrange(desc(date)) %>%
  ggplot(.) + geom_line(aes(x = date, y = OBS_VALUE, color = TITLE)) +
  theme_minimal() + xlab("") + ylab("") +
  scale_x_date(breaks = "1 day",
               labels = date_format("%d %b %Y")) +
  scale_y_log10(breaks = seq(0.1, 3, 0.04),
                     labels = dollar_format(accuracy = .01, prefix = "", suffix = "/€")) +

  theme(legend.position = c(0.15, 0.75),
        legend.title = element_blank(),
        axis.text.x = element_text(angle = 45, vjust = 1, hjust = 1)) +
  geom_text_repel(aes(x = date, y = OBS_VALUE, label = OBS_VALUE), fontface ="plain", color = "black", size = 3)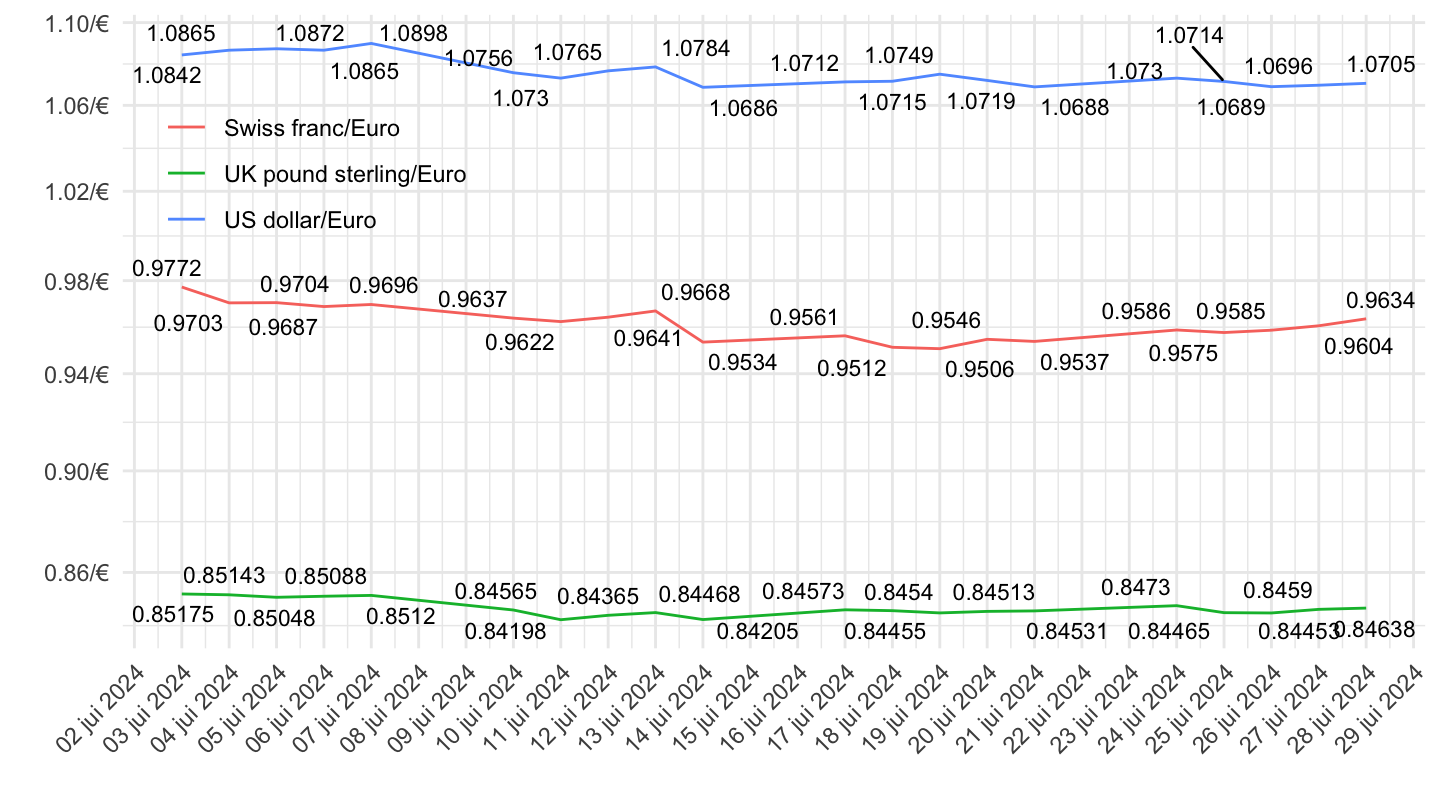
Swiss Franc, Dollar
All
Code
EXR %>%
  filter(FREQ == "D",
         CURRENCY %in% c("USD", "CHF")) %>%
  month_to_date %>%
  ggplot(.) + geom_line(aes(x = date, y = OBS_VALUE, color = TITLE)) +
  theme_minimal() + xlab("") + ylab("") +
  scale_x_date(breaks = seq(1960, 2100, 2) %>% paste0("-01-01") %>% as.Date,
               labels = date_format("%Y")) +
  scale_y_continuous(breaks = seq(0.1, 3, 0.1),
                     labels = dollar_format(accuracy = .1, prefix = "", suffix = "/€")) +
  theme(legend.position = c(0.8, 0.80),
        legend.title = element_blank()) +
  geom_label(data = . %>% filter(max(date) == date),
             aes(x = date, y = OBS_VALUE, label = round(OBS_VALUE, 3), color = TITLE),
             show.legend = F)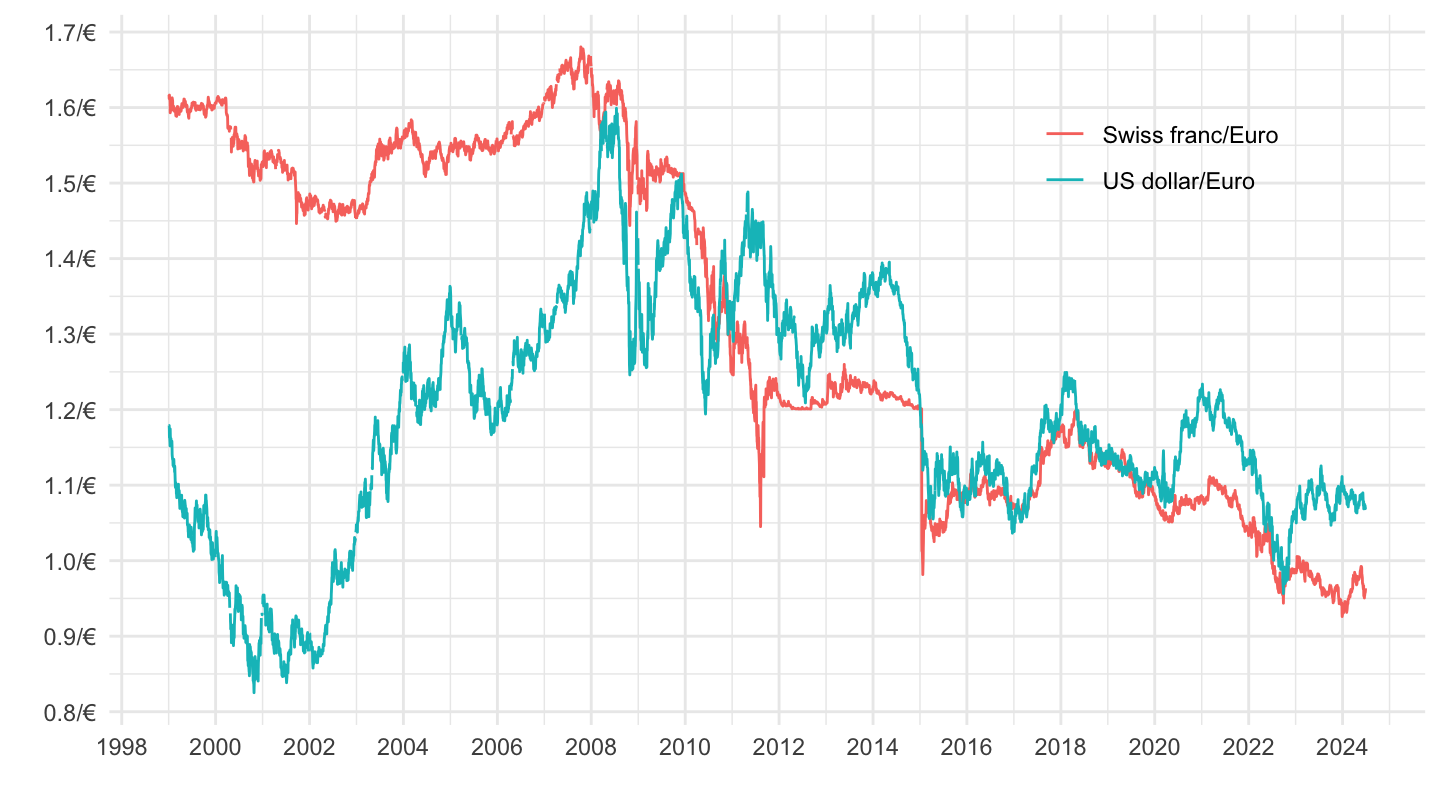
2008-
Code
EXR %>%
  filter(FREQ == "D",
         CURRENCY %in% c("USD", "CHF")) %>%
  month_to_date %>%
  filter(date >= as.Date("2008-01-01")) %>%
  ggplot(.) + geom_line(aes(x = date, y = OBS_VALUE, color = TITLE)) +
  theme_minimal() + xlab("") + ylab("") +
  scale_x_date(breaks = seq(1960, 2100, 2) %>% paste0("-01-01") %>% as.Date,
               labels = date_format("%Y")) +
  scale_y_continuous(breaks = seq(0.1, 3, 0.1),
                     labels = dollar_format(accuracy = .1, prefix = "", suffix = "/€")) +
  theme(legend.position = c(0.8, 0.80),
        legend.title = element_blank()) +
  geom_label(data = . %>% filter(max(date) == date),
             aes(x = date, y = OBS_VALUE, label = round(OBS_VALUE, 3), color = TITLE),
             show.legend = F)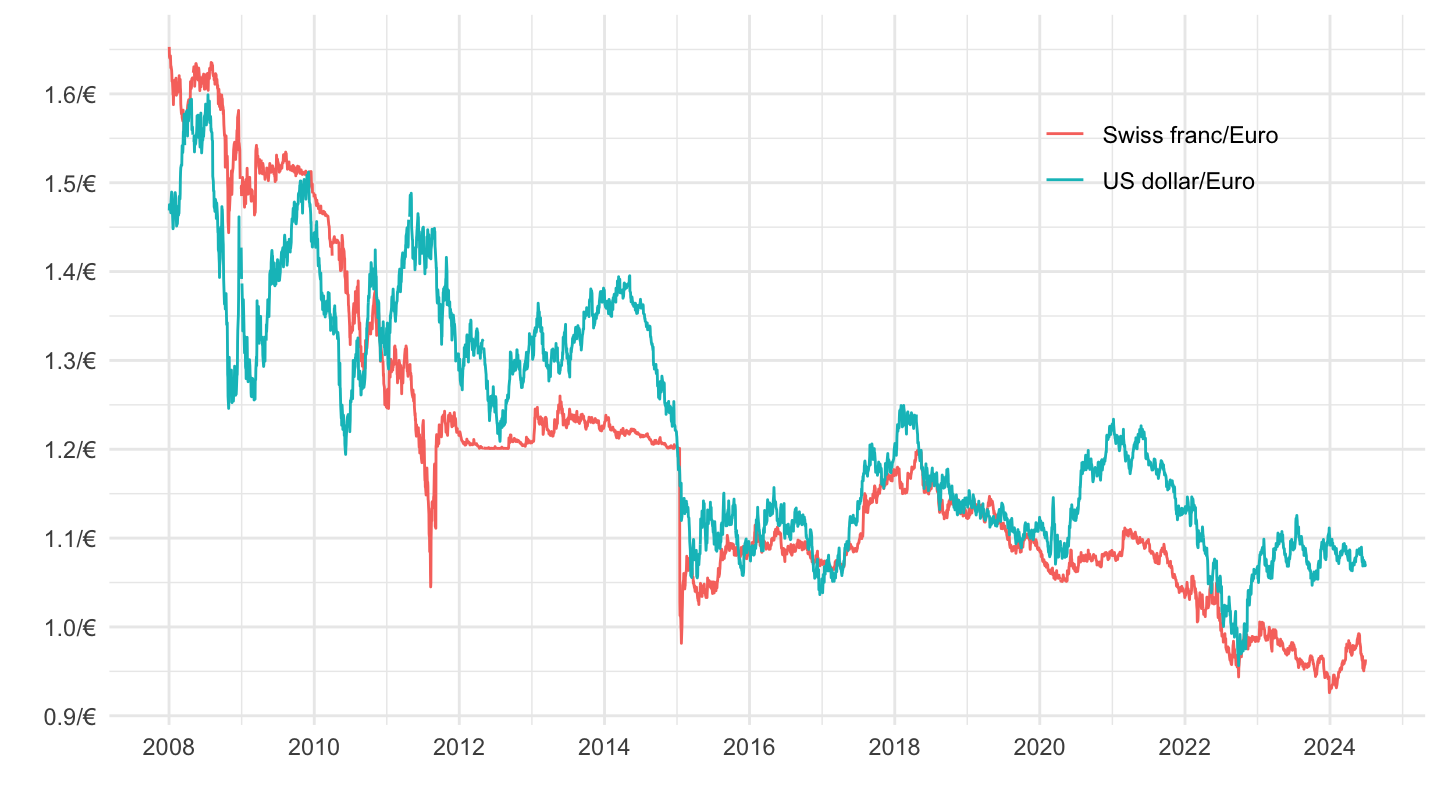
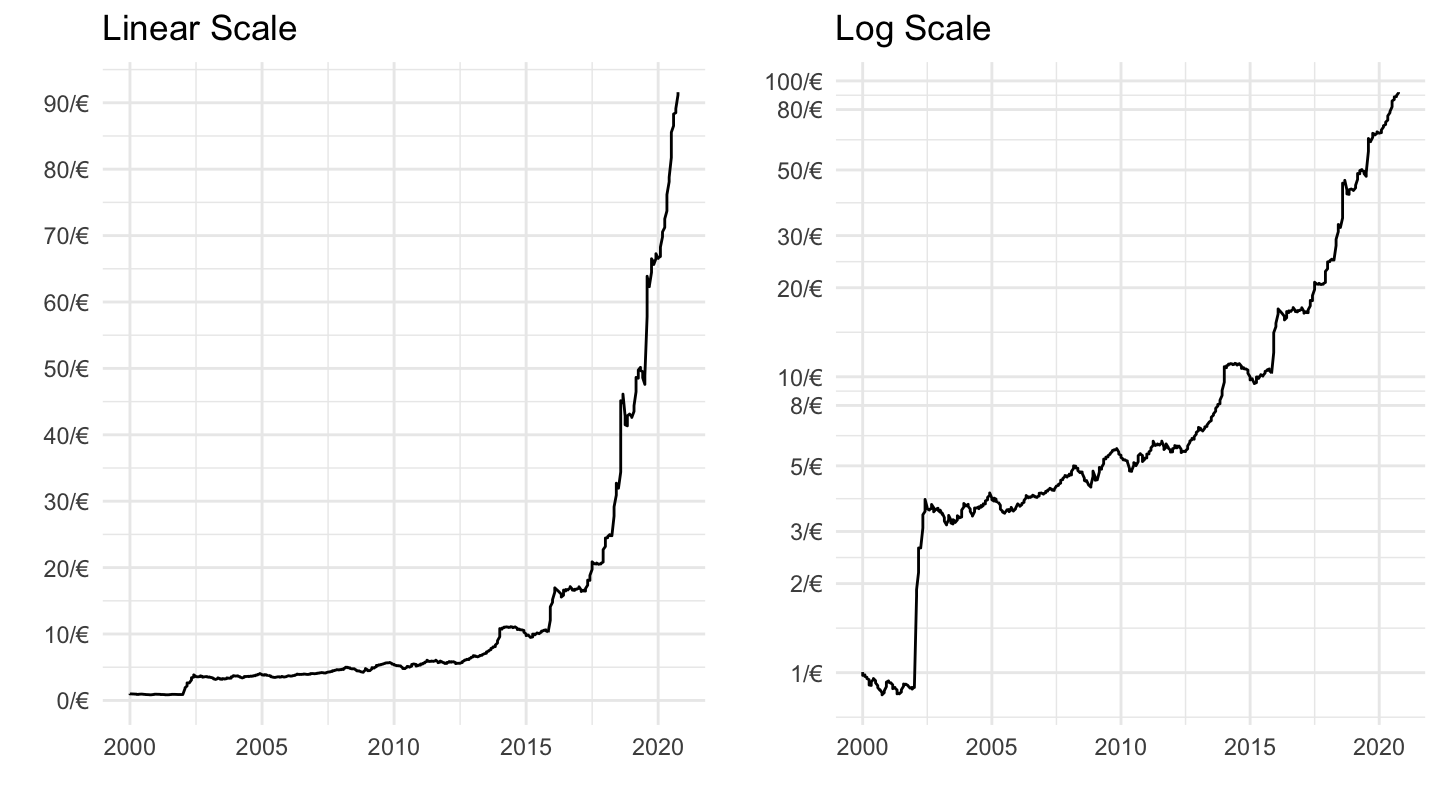
Argentine Peso : Euro
Linear
Code
plot_linear <- EXR %>%
  filter(FREQ == "M",
         CURRENCY == "ARS") %>%
  month_to_date %>%
  ggplot(.) + geom_line(aes(x = date, y = OBS_VALUE)) +
  theme_minimal() + xlab("") + ylab("") +
  scale_x_date(breaks = seq(1960, 2100, 5) %>% paste0("-01-01") %>% as.Date,
               labels = date_format("%Y")) +
  scale_y_continuous(breaks = seq(0, 100, 10),
                     labels = dollar_format(accuracy = 1, prefix = "", suffix = "/€")) +
  scale_color_manual(values = viridis(5)[1:4]) +
  theme(legend.position = c(0.8, 0.80),
        legend.title = element_blank())

plot_linear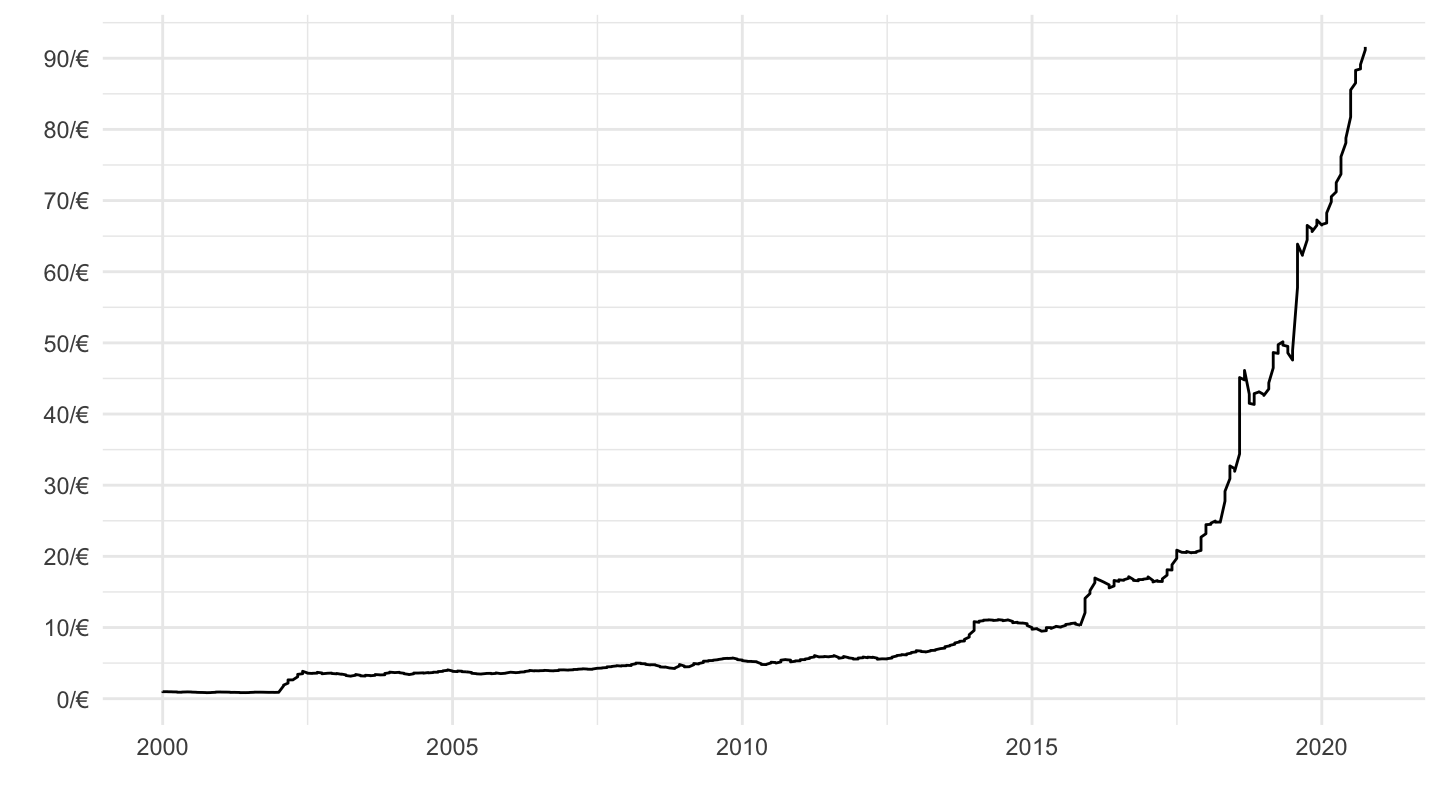
Log
Code
plot_log <- plot_linear +
  scale_y_log10(breaks = c(1, 2, 3, 5, 8, 10, 20, 30, 50, 80, 100),
                     labels = dollar_format(accuracy = 1, prefix = "", suffix = "/€"))

plot_log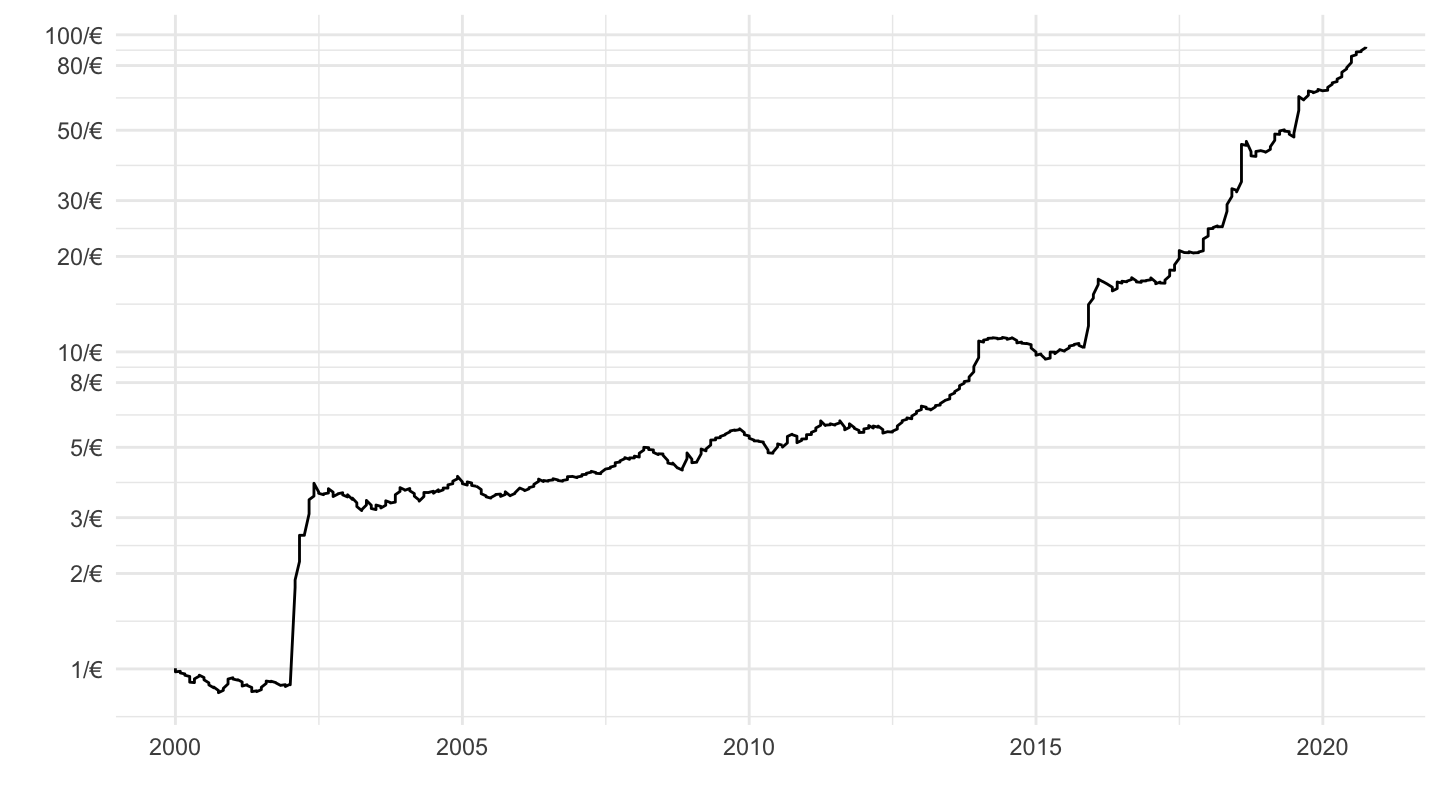
Bind
Code
ggarrange(plot_linear + ggtitle("Linear Scale"), plot_log + ggtitle("Log Scale"))