Real Effective Exchange Rates, Daily
Data - BIS
Info
Data on xrates
| source | dataset | .html | .RData |
|---|---|---|---|
| bdf | EXR | 2024-07-26 | 2024-06-18 |
| bis | EER | 2024-11-18 | 2024-11-18 |
| bis | EER_D | 2024-11-18 | 2024-05-10 |
| bis | XRU | 2024-11-18 | 2024-11-18 |
| bis | XRU_D | 2024-11-18 | 2024-11-18 |
| ecb | EXR | 2024-11-18 | 2024-11-18 |
| eurostat | ert_bil_eur_d | 2024-11-18 | 2024-11-18 |
| eurostat | ert_h_eur_d | 2024-11-18 | 2024-11-18 |
| fred | xrates | 2024-11-18 | 2024-11-18 |
| gfd | xrates | 2024-06-20 | 2021-01-08 |
| oecd | REFSERIES_MSIT | 2024-09-15 | 2024-11-18 |
| oecd | SNA_TABLE4 | 2024-09-15 | 2024-11-18 |
| wdi | PA.NUS.FCRF | 2024-11-18 | 2024-11-18 |
LAST_COMPILE
| LAST_COMPILE |
|---|
| 2024-11-18 |
Last
| date | Nobs |
|---|---|
| 2024-01-29 | 90 |
iso3c, iso2c, Reference area
Code
EER_D %>%
  arrange(iso3c, date) %>%
  group_by(iso3c, iso2c, `Reference area`) %>%
  summarise(Nobs = n(),
            start = first(date),
            end = last(date)) %>%
  arrange(-Nobs) %>%
  mutate(Flag = gsub(" ", "-", str_to_lower(`Reference area`)),
         Flag = paste0('<img src="../../icon/flag/vsmall/', Flag, '.png" alt="Flag">')) %>%
  select(Flag, everything()) %>%
  {if (is_html_output()) datatable(., filter = 'top', rownames = F, escape = F) else .}
EER_TYPE
Code
EER_D %>%
  group_by(EER_TYPE, Type) %>%
  summarise(Nobs = n()) %>%
  arrange(-Nobs) %>%
{if (is_html_output()) print_table(.) else .}| EER_TYPE | Type | Nobs |
|---|---|---|
| N | Nominal | 737738 |
EER_BASKET
Code
EER_D %>%
  group_by(EER_BASKET, Basket) %>%
  summarise(Nobs = n()) %>%
  arrange(-Nobs) %>%
  {if (is_html_output()) datatable(., filter = 'top', rownames = F) else .}
Real Exchange rates (Germany, France, United States)
Code
EER_D %>%
  filter(iso3c %in% c("DEU", "FRA", "ITA", "ESP"),
         EER_BASKET == "N",
         EER_TYPE == "N") %>%
  ggplot(.) +
  geom_line(aes(x = date, y = value, color = iso3c, linetype = iso3c)) +
  theme_minimal() + xlab("") + ylab("Exchange Rate ($1 = ? National Currency)") +
  scale_x_date(breaks = seq(1940, 2020, 5) %>% paste0("-01-01") %>% as.Date,
               labels = date_format("%Y")) +
  scale_y_log10(breaks = seq(0, 200, 10),
                labels = dollar_format(accuracy = 1, prefix = "")) +
  scale_color_manual(values = viridis(5)[1:4]) +
  theme(legend.position = c(0.7, 0.90),
        legend.title = element_blank(),
        legend.direction = "horizontal")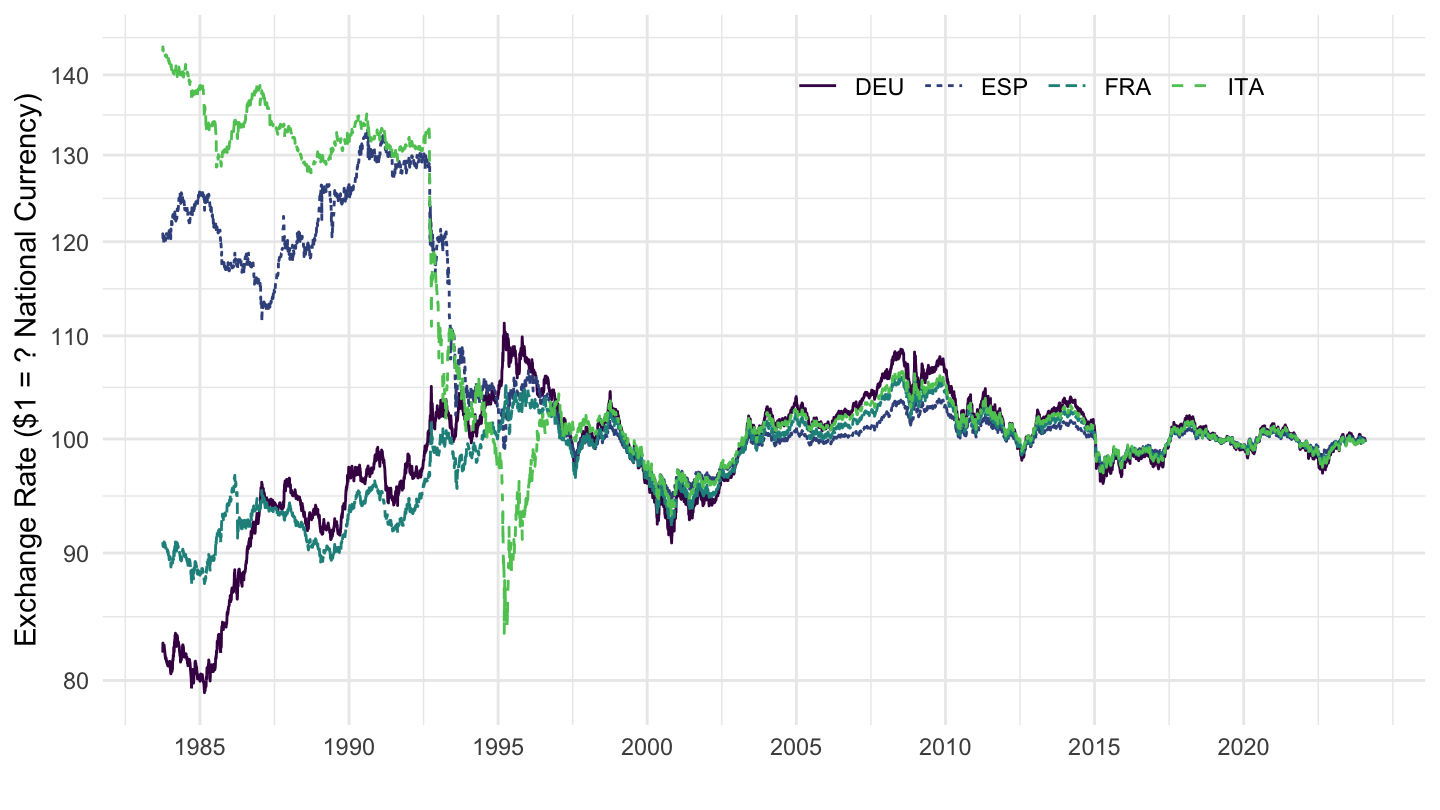
Exchange Rates
United States
Code
EER_D %>%
  filter(iso3c %in% c("USA")) %>%
  mutate(variable = paste0(Type, ", ", Basket)) %>%
  ggplot(.) + geom_line(aes(x = date, y = value, color = variable)) +
  theme_minimal() + xlab("") + ylab("Exchange Rate ($? = National Currency)") +
  scale_color_manual(values = viridis(5)[1:4]) +
  scale_x_date(breaks = seq(1940, 2020, 5) %>% paste0("-01-01") %>% as.Date,
               labels = date_format("%Y")) +
  scale_y_log10(breaks = seq(0, 600, 10),
                labels = dollar_format(accuracy = 1, prefix = "")) +
  theme(legend.position = c(0.7, 0.90),
        legend.title = element_blank())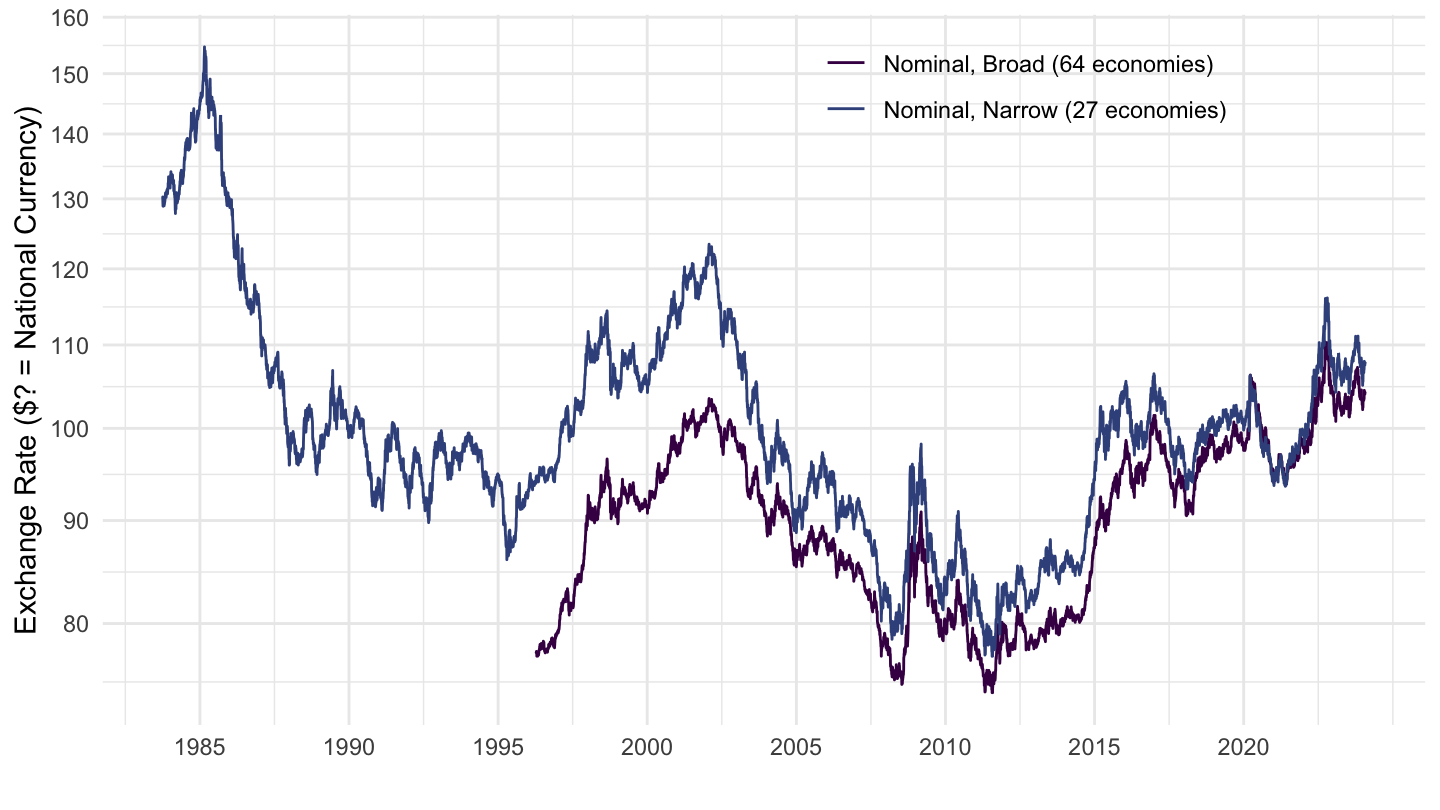
Japan
Code
EER_D %>%
  filter(iso3c %in% c("JPN")) %>%
  mutate(variable = paste0(Type, ", ", Basket)) %>%
  ggplot(.) + geom_line(aes(x = date, y = value, color = variable)) +
  theme_minimal() + xlab("") + ylab("") +
  scale_color_manual(values = viridis(5)[1:4]) +
  scale_x_date(breaks = seq(1940, 2020, 5) %>% paste0("-01-01") %>% as.Date,
               labels = date_format("%Y")) +
  scale_y_log10(breaks = seq(0, 600, 10),
                labels = dollar_format(accuracy = 1, prefix = "")) +
  theme(legend.position = c(0.7, 0.25),
        legend.title = element_blank())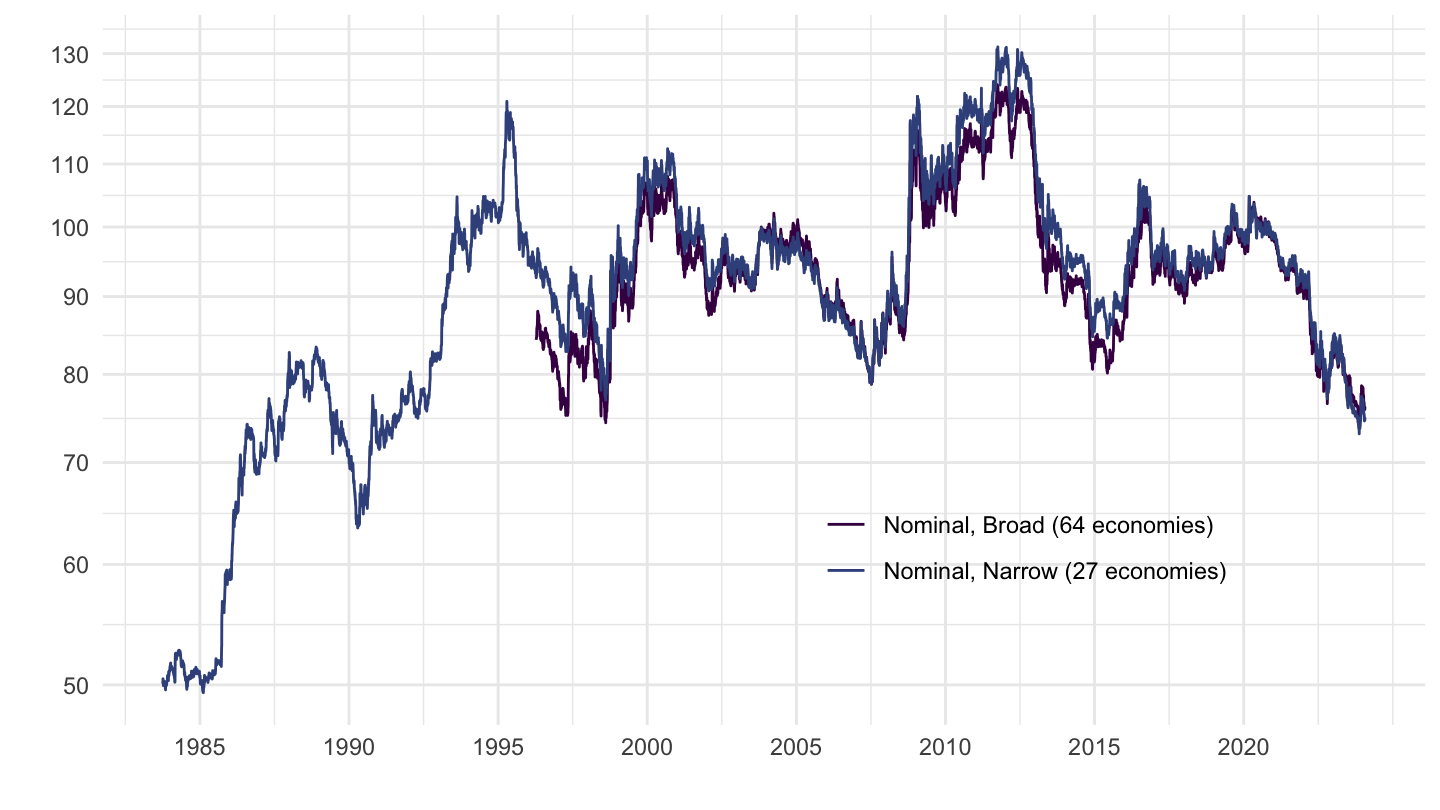
Europe
Code
EER_D %>%
  filter(iso2c %in% c("XM")) %>%
  mutate(variable = paste0(Type, ", ", Basket)) %>%
  ggplot(.) + geom_line(aes(x = date, y = value, color = variable)) +
  theme_minimal() + xlab("") + ylab("") +
  scale_color_manual(values = viridis(5)[1:4]) +
  scale_x_date(breaks = seq(1940, 2020, 5) %>% paste0("-01-01") %>% as.Date,
               labels = date_format("%Y")) +
  scale_y_log10(breaks = seq(0, 600, 10),
                labels = dollar_format(accuracy = 1, prefix = "")) +
  theme(legend.position = c(0.2, 0.15),
        legend.title = element_blank())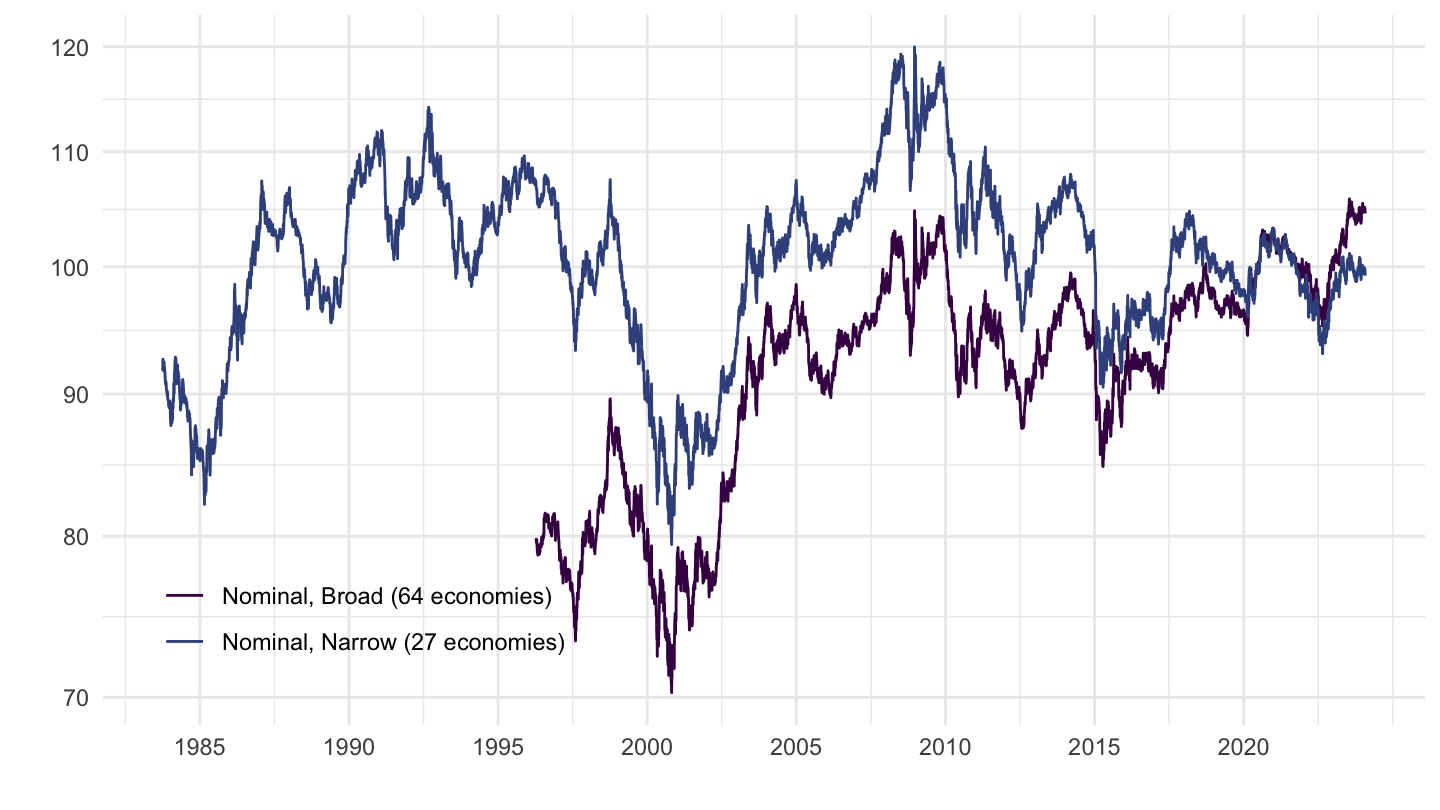
China
Code
EER_D %>%
  filter(iso3c %in% c("CHN")) %>%
  mutate(variable = paste0(Type, ", ", Basket)) %>%
  ggplot(.) + geom_line(aes(x = date, y = value, color = variable)) +
  theme_minimal() + xlab("") + ylab("") +
  scale_color_manual(values = viridis(5)[1:4]) +
  scale_x_date(breaks = seq(1940, 2020, 2) %>% paste0("-01-01") %>% as.Date,
               labels = date_format("%Y")) +
  scale_y_log10(breaks = seq(0, 600, 10),
                labels = dollar_format(accuracy = 1, prefix = "")) +
  theme(legend.position = c(0.2, 0.9),
        legend.title = element_blank())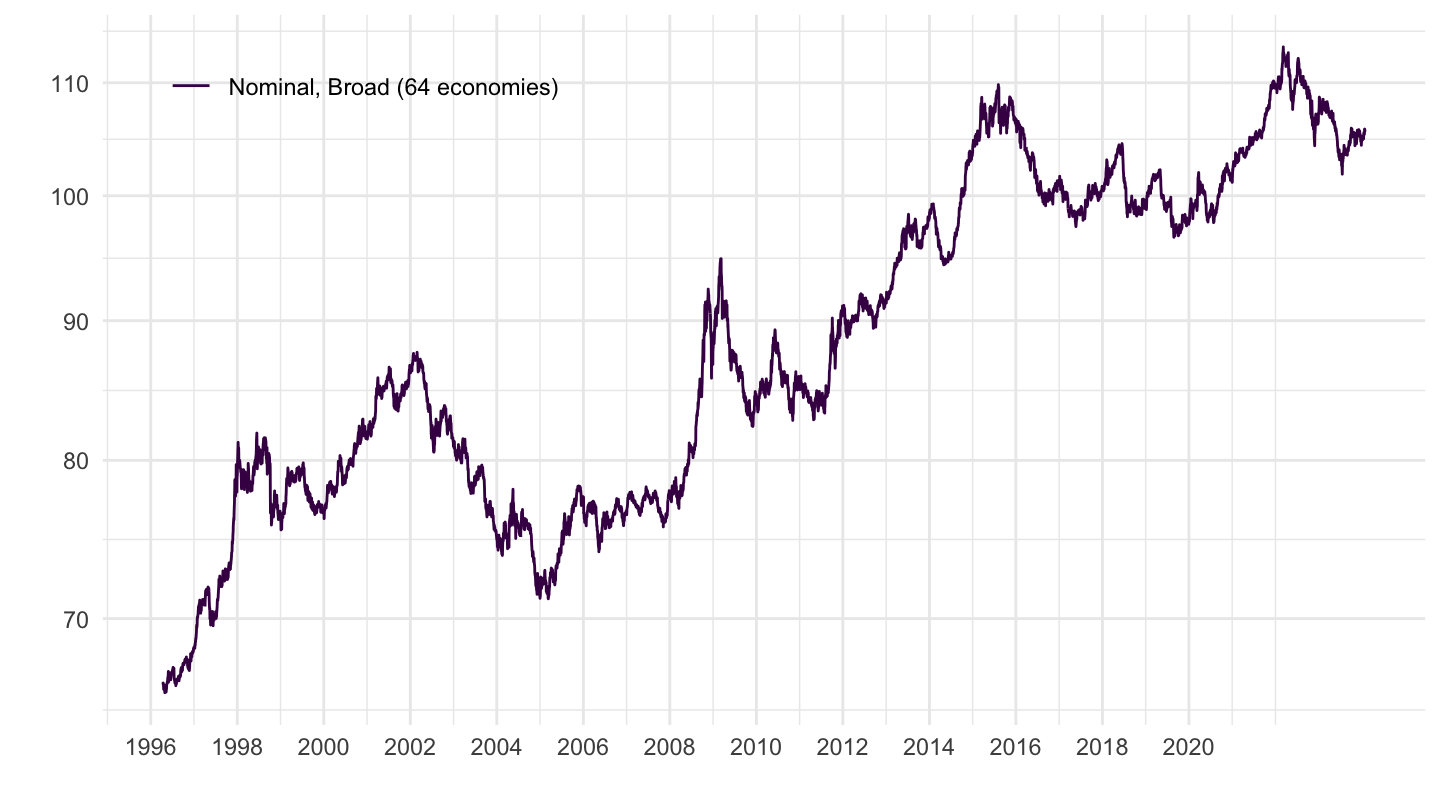
Denmark
Code
EER_D %>%
  filter(iso3c %in% c("DNK")) %>%
  mutate(variable = paste0(Type, ", ", Basket)) %>%
  ggplot(.) + geom_line(aes(x = date, y = value, color = variable)) +
  theme_minimal() + xlab("") + ylab("") +
  scale_color_manual(values = viridis(5)[1:4]) +
  scale_x_date(breaks = seq(1940, 2020, 5) %>% paste0("-01-01") %>% as.Date,
               labels = date_format("%Y")) +
  scale_y_log10(breaks = seq(0, 600, 10),
                labels = dollar_format(accuracy = 1, prefix = "")) +
  theme(legend.position = c(0.8, 0.2),
        legend.title = element_blank())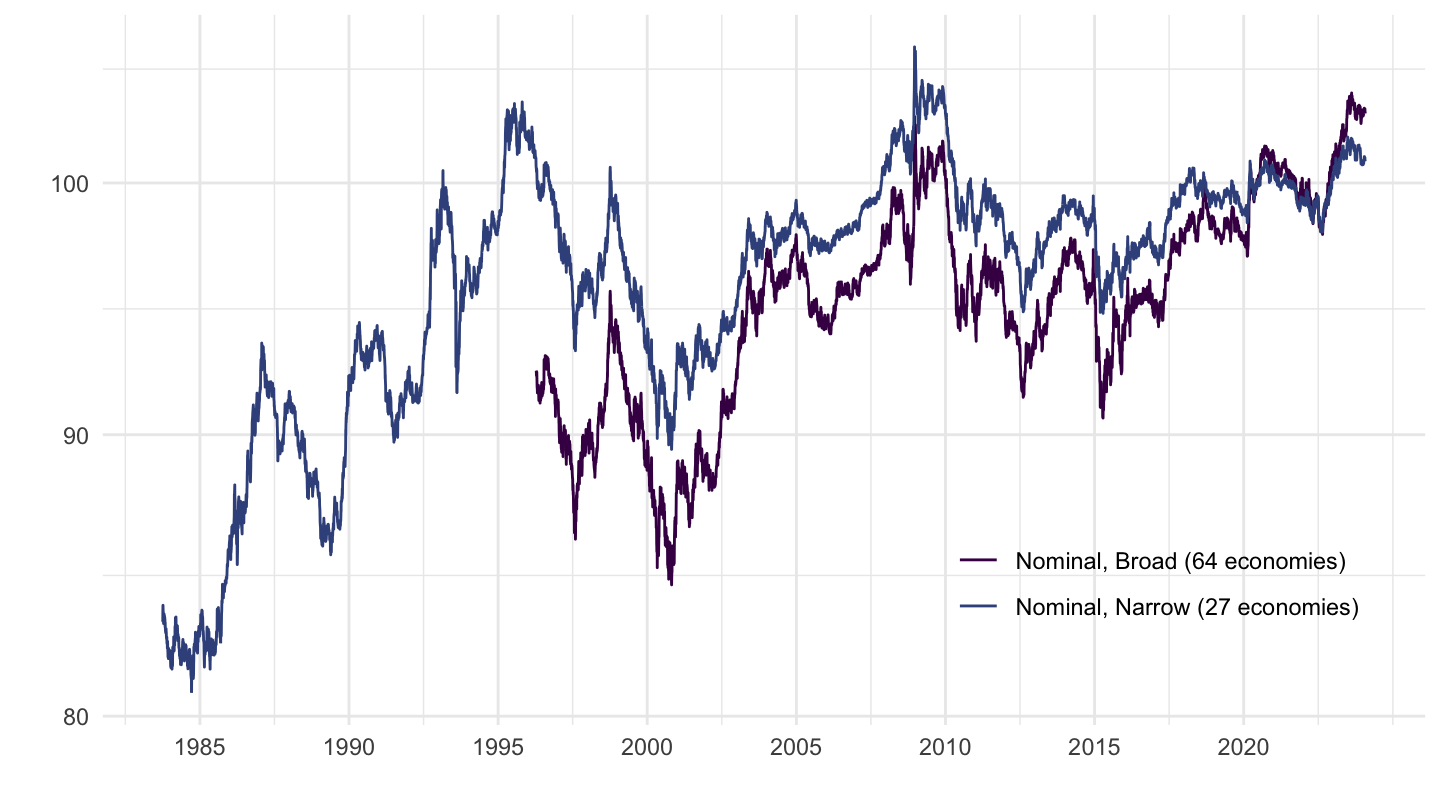
Switzerland
Code
EER_D %>%
  filter(iso3c %in% c("CHE")) %>%
  mutate(variable = paste0(Type, ", ", Basket)) %>%
  ggplot(.) + geom_line(aes(x = date, y = value, color = variable)) +
  theme_minimal() + xlab("") + ylab("") +
  scale_color_manual(values = viridis(5)[1:4]) +
  scale_x_date(breaks = seq(1940, 2020, 5) %>% paste0("-01-01") %>% as.Date,
               labels = date_format("%Y")) +
  scale_y_log10(breaks = seq(0, 600, 10),
                labels = dollar_format(accuracy = 1, prefix = "")) +
  theme(legend.position = c(0.8, 0.2),
        legend.title = element_blank())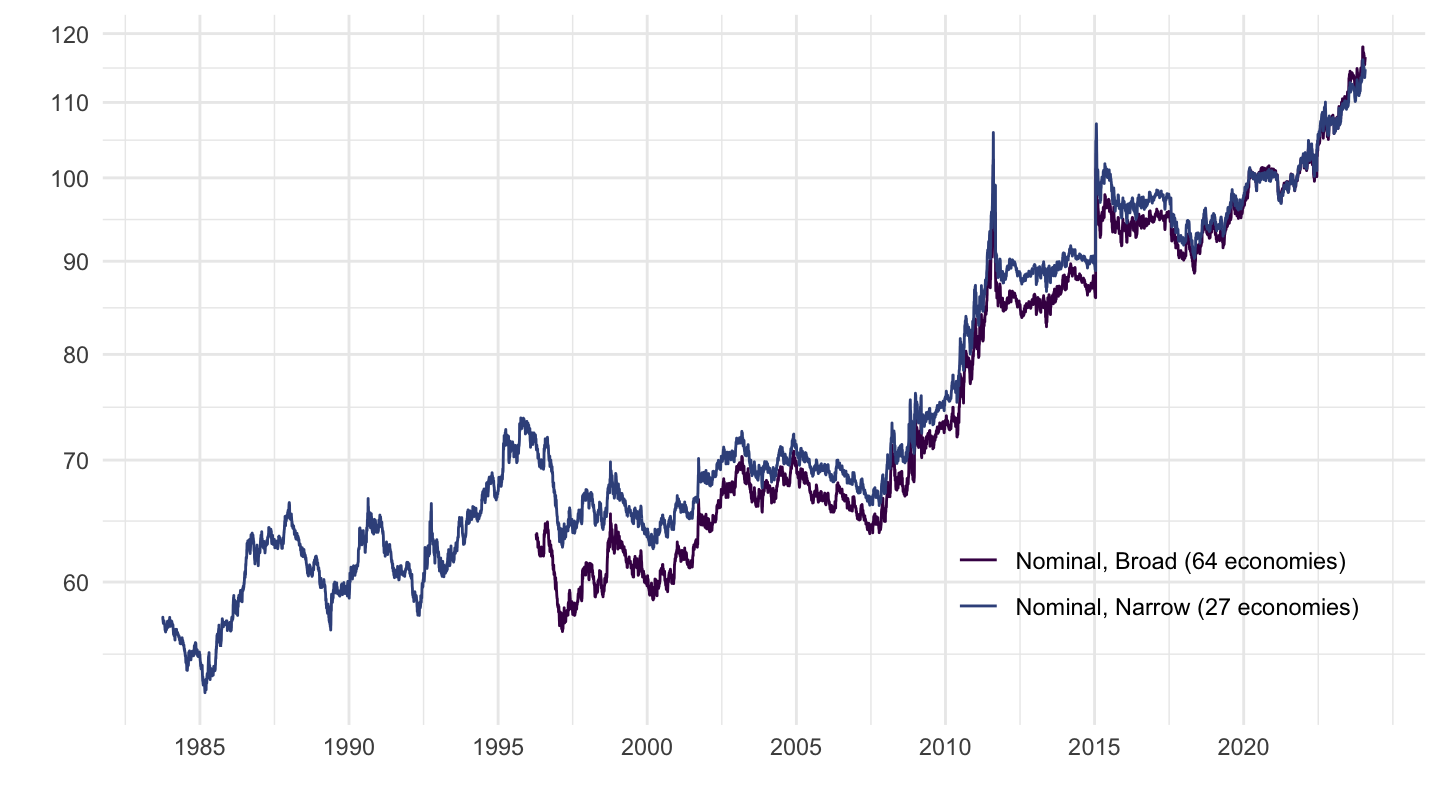
Germany
Code
EER_D %>%
  filter(iso3c %in% c("DEU")) %>%
  mutate(variable = paste0(Type, ", ", Basket)) %>%
  ggplot(.) + geom_line(aes(x = date, y = value, color = variable)) +
  theme_minimal() + xlab("") + ylab("") +
  scale_color_manual(values = viridis(5)[1:4]) +
  scale_x_date(breaks = seq(1940, 2020, 5) %>% paste0("-01-01") %>% as.Date,
               labels = date_format("%Y")) +
  scale_y_log10(breaks = seq(0, 600, 10),
                labels = dollar_format(accuracy = 1, prefix = "")) +
  theme(legend.position = c(0.8, 0.2),
        legend.title = element_blank())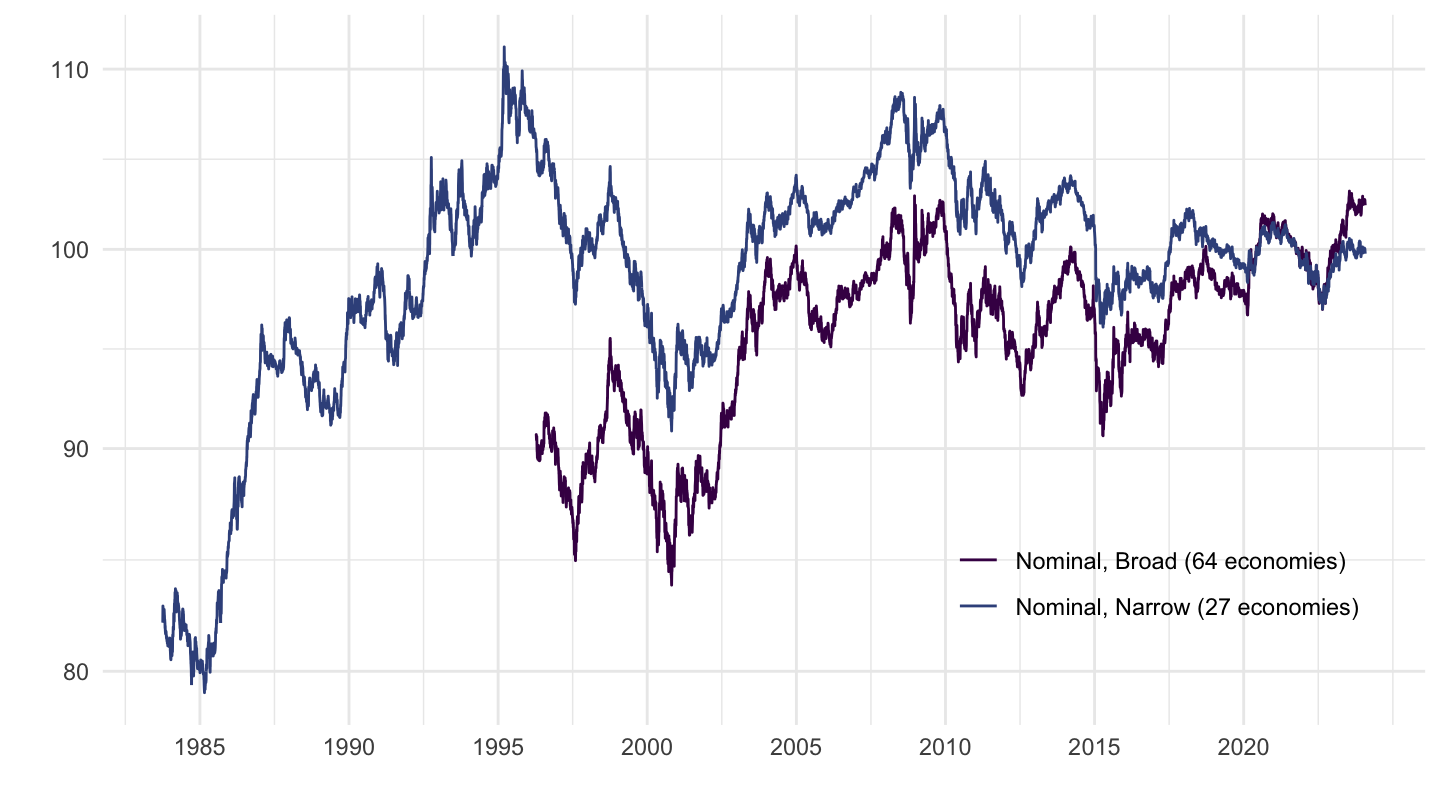
France
Code
EER_D %>%
  filter(iso3c %in% c("FRA")) %>%
  mutate(variable = paste0(Type, ", ", Basket)) %>%
  ggplot(.) +
  geom_line(aes(x = date, y = value, color = variable)) +
  theme_minimal() + xlab("") + ylab("") +
  scale_color_manual(values = viridis(5)[1:4]) +
  scale_x_date(breaks = seq(1940, 2020, 5) %>% paste0("-01-01") %>% as.Date,
               labels = date_format("%Y")) +
  scale_y_log10(breaks = seq(0, 600, 10),
                labels = dollar_format(accuracy = 1, prefix = "")) +
  theme(legend.position = c(0.8, 0.2),
        legend.title = element_blank())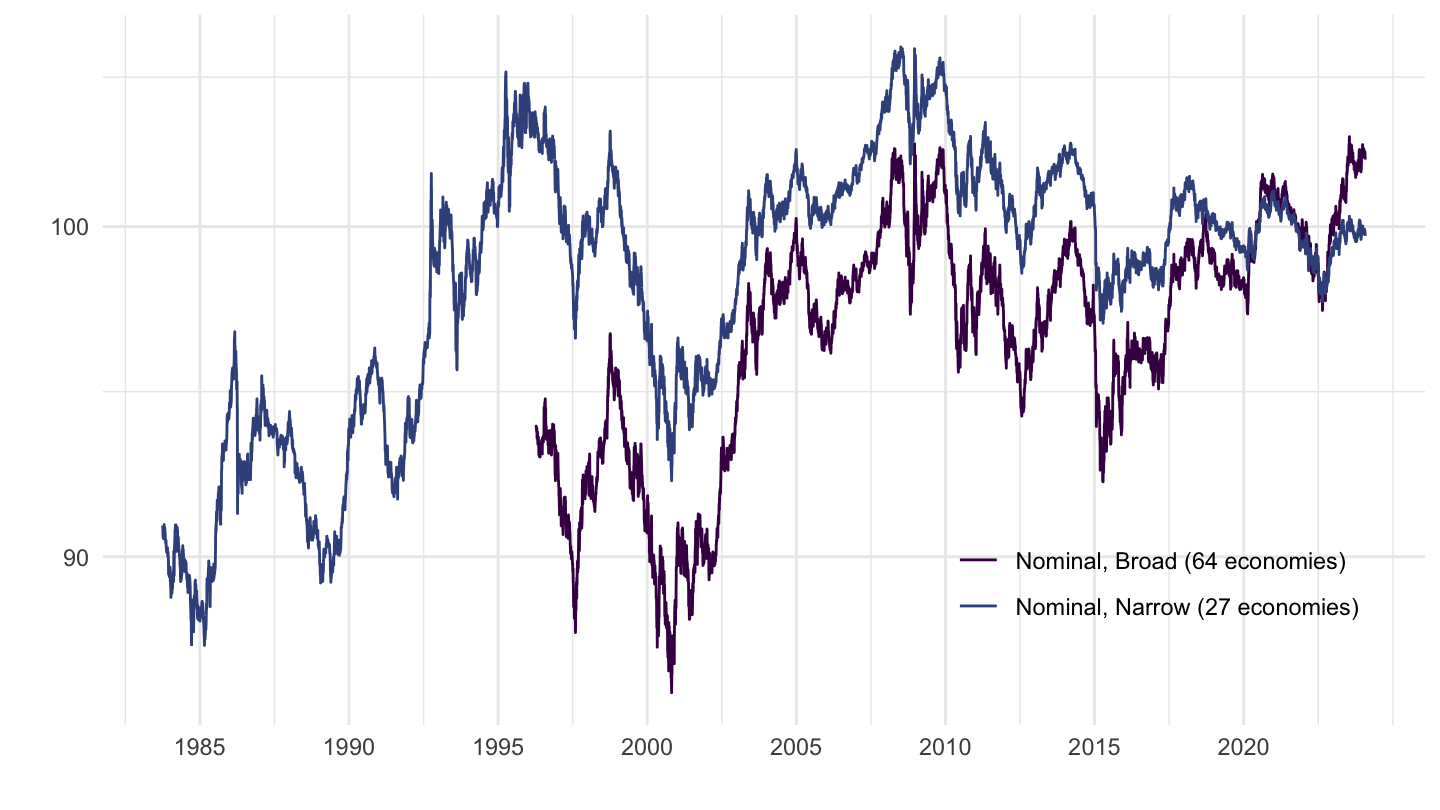
Italy
Code
EER_D %>%
  filter(iso3c %in% c("ITA")) %>%
  mutate(variable = paste0(Type, ", ", Basket)) %>%
  ggplot(.) +
  geom_line(aes(x = date, y = value, color = variable)) +
  theme_minimal() + xlab("") + ylab("") +
  scale_color_manual(values = viridis(5)[1:4]) +
  scale_x_date(breaks = seq(1940, 2020, 5) %>% paste0("-01-01") %>% as.Date,
               labels = date_format("%Y")) +
  scale_y_log10(breaks = seq(0, 600, 10),
                labels = dollar_format(accuracy = 1, prefix = "")) +
  theme(legend.position = c(0.8, 0.8),
        legend.title = element_blank())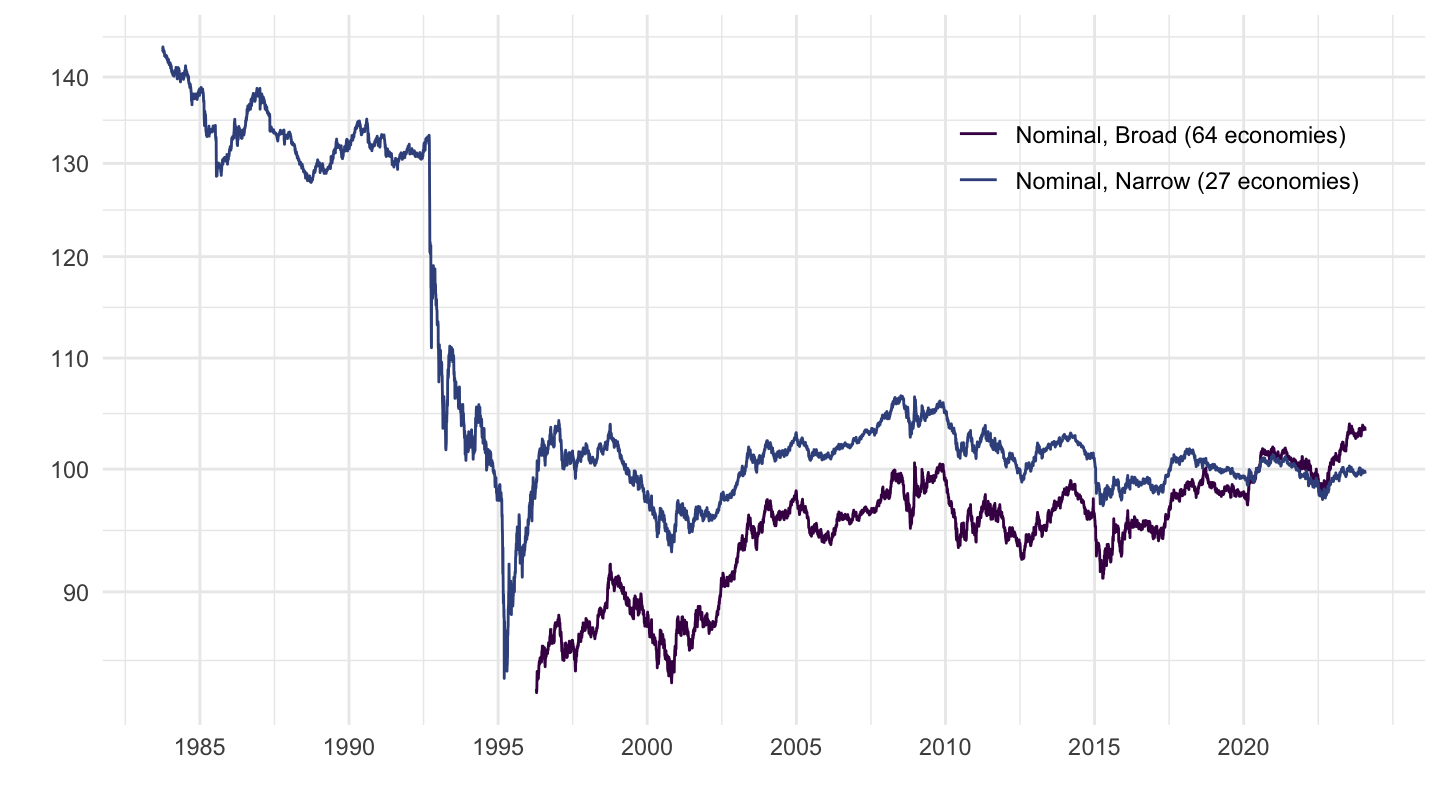
United Kingdom
Code
EER_D %>%
  filter(iso3c %in% c("GBR")) %>%
  mutate(variable = paste0(Type, ", ", Basket)) %>%
  ggplot(.) +
  geom_line(aes(x = date, y = value, color = variable)) +
  theme_minimal() + xlab("") + ylab("") +
  scale_color_manual(values = viridis(5)[1:4]) +
  scale_x_date(breaks = seq(1940, 2020, 5) %>% paste0("-01-01") %>% as.Date,
               labels = date_format("%Y")) +
  scale_y_log10(breaks = seq(0, 600, 10),
                labels = dollar_format(accuracy = 1, prefix = "")) +
  theme(legend.position = c(0.8, 0.8),
        legend.title = element_blank())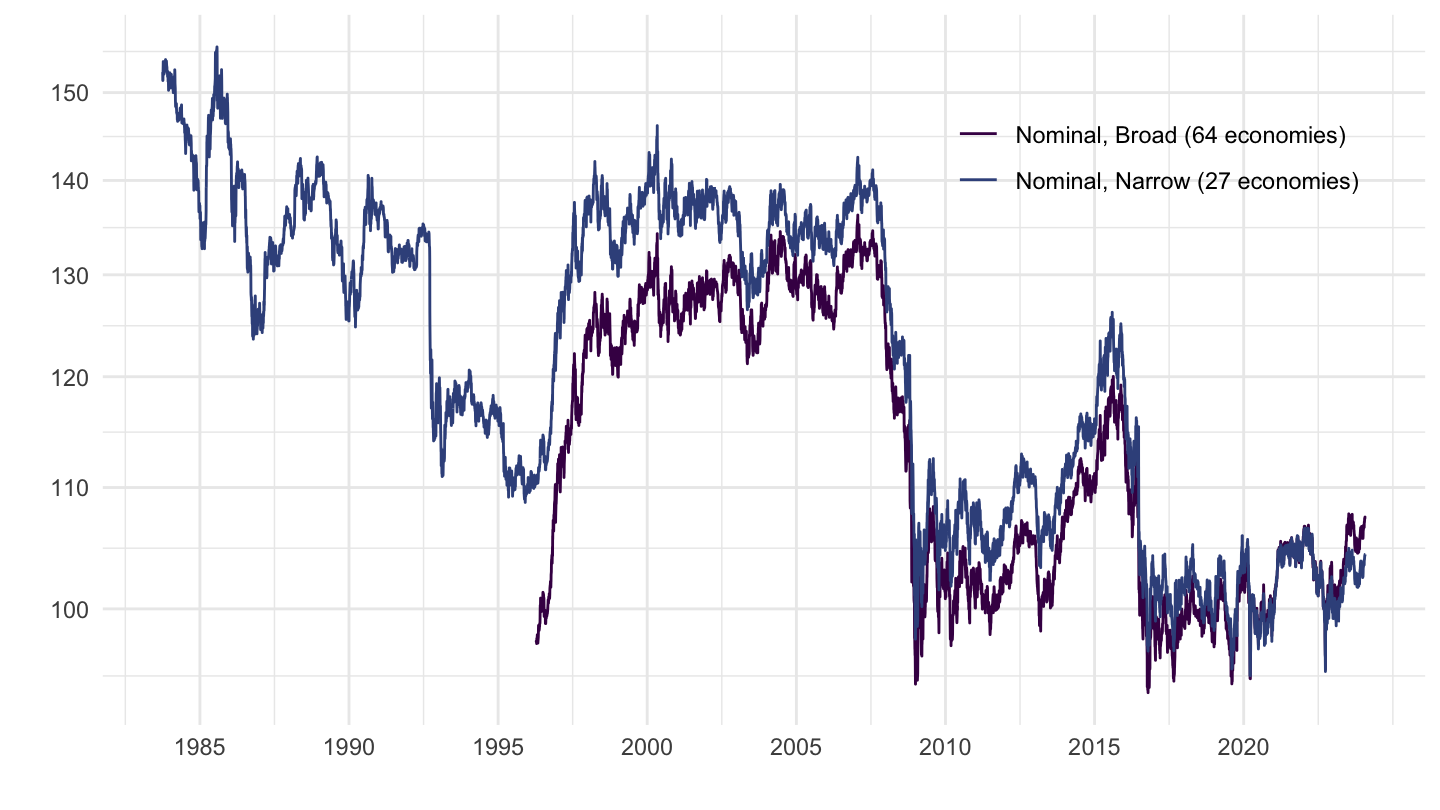
Canada
Code
EER_D %>%
  filter(iso3c %in% c("CAN")) %>%
  mutate(variable = paste0(Type, ", ", Basket)) %>%
  ggplot(.) +
  geom_line(aes(x = date, y = value, color = variable)) +
  theme_minimal() + xlab("") + ylab("") +
  scale_color_manual(values = viridis(5)[1:4]) +
  scale_x_date(breaks = seq(1940, 2020, 5) %>% paste0("-01-01") %>% as.Date,
               labels = date_format("%Y")) +
  scale_y_log10(breaks = seq(0, 600, 10),
                labels = dollar_format(accuracy = 1, prefix = "")) +
  theme(legend.position = c(0.2, 0.2),
        legend.title = element_blank())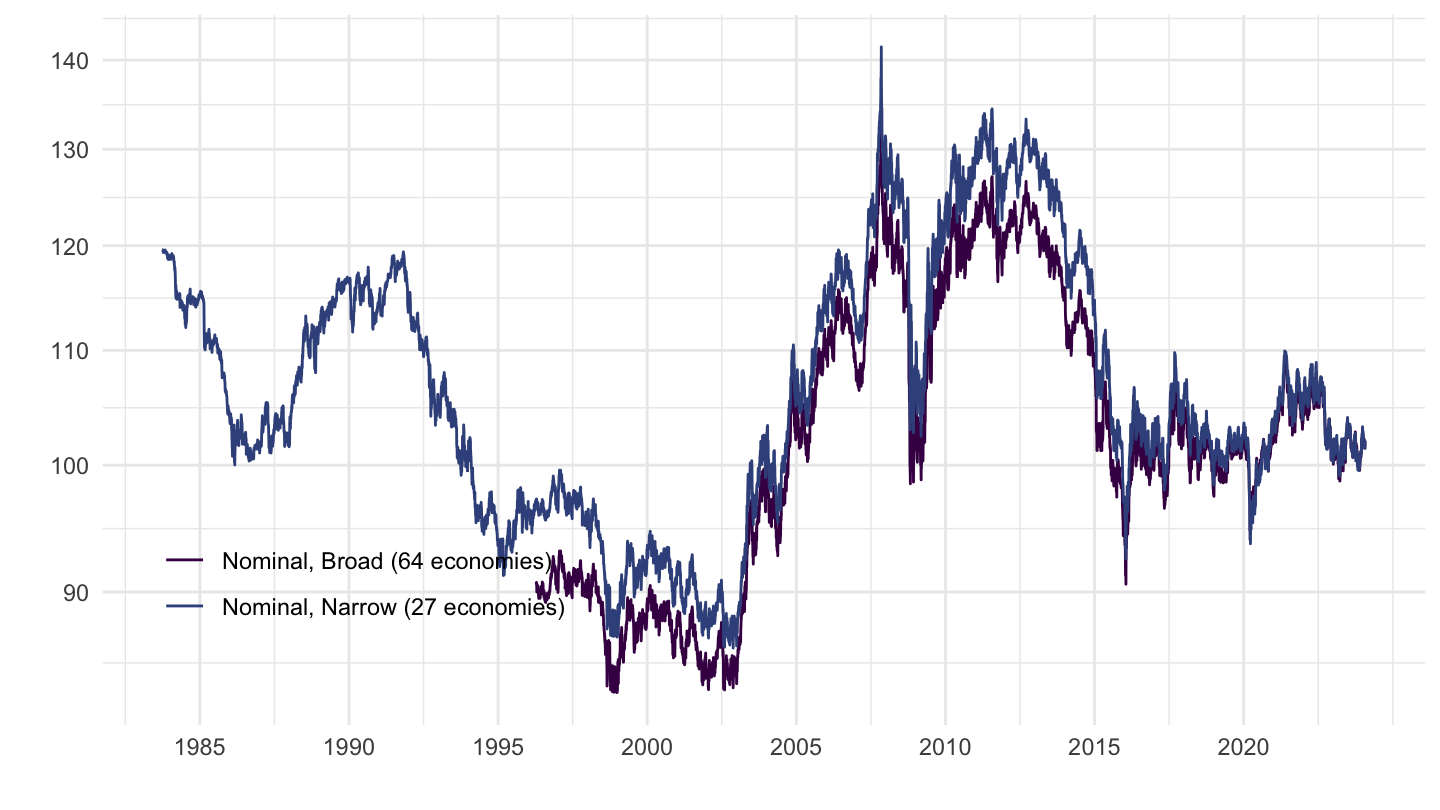
Sweden
Code
EER_D %>%
  filter(iso3c %in% c("SWE")) %>%
  mutate(variable = paste0(Type, ", ", Basket)) %>%
  ggplot(.) +
  geom_line(aes(x = date, y = value, color = variable)) +
  theme_minimal() + xlab("") + ylab("") +
  scale_color_manual(values = viridis(5)[1:4]) +
  scale_x_date(breaks = seq(1940, 2020, 5) %>% paste0("-01-01") %>% as.Date,
               labels = date_format("%Y")) +
  scale_y_log10(breaks = seq(0, 600, 10),
                labels = dollar_format(accuracy = 1, prefix = "")) +
  theme(legend.position = c(0.2, 0.2),
        legend.title = element_blank())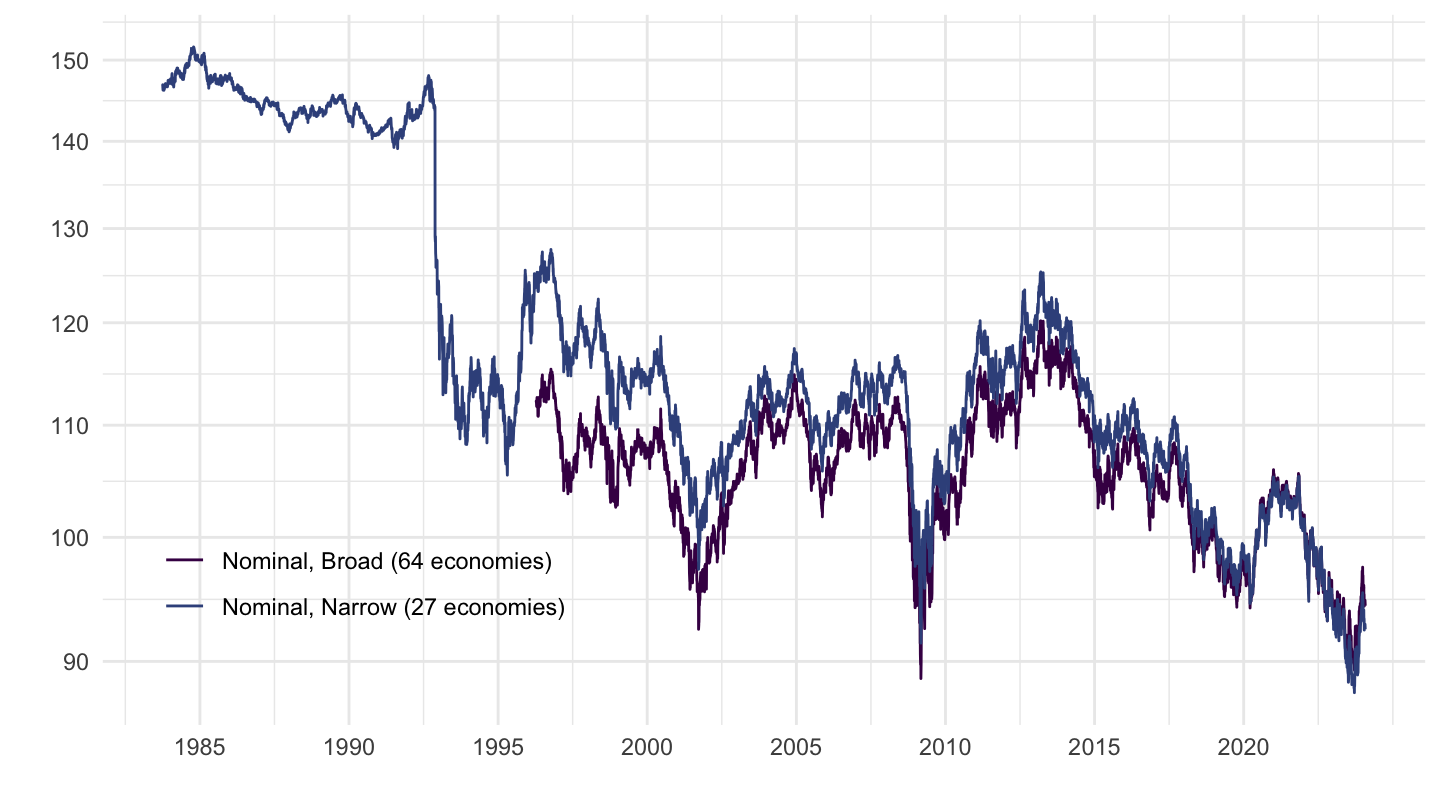
1997 Asian Financial Crisis
Philippines, Singapore, Indonesia
Code
EER_D %>%
  filter(iso3c %in% c("IDN", "SGP", "PHL"),
         date >= as.Date("1992-01-01"),
         date <= as.Date("2002-12-31")) %>%
  group_by(iso3c) %>%
  mutate(value = 100*value / value[date == as.Date("1997-01-03")]) %>%
  ggplot(.) + geom_line() + theme_minimal() +
  aes(x = date, y = value, color = `Reference area`, linetype = `Reference area`) +
  xlab("") + ylab("") +
  scale_color_manual(values = viridis(4)[1:3]) +
  scale_x_date(breaks = seq(1800, 2020, 1) %>% paste0("-01-01") %>% as.Date,
               labels = date_format("%Y")) +
  scale_y_log10(breaks = seq(50, 1000, 50),
                labels = dollar_format(a = 1, p = "")) +
  theme(legend.position = c(0.2, 0.80),
        legend.title = element_blank())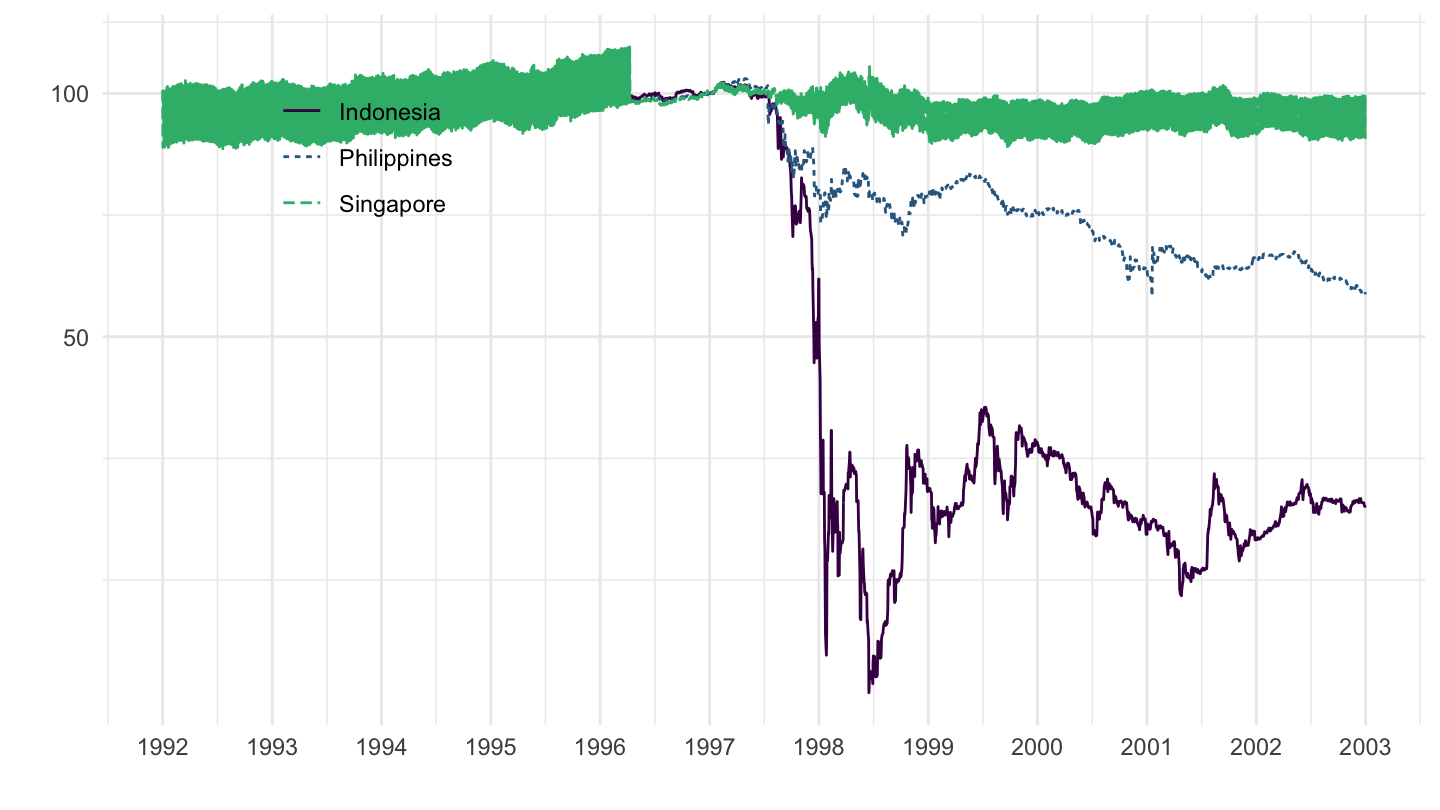
Thailand, Malaysia, South Korea
Code
EER_D %>%
  filter(iso3c %in% c("THA", "MYS", "KOR"),
         date >= as.Date("1992-01-01"),
         date <= as.Date("2002-12-31")) %>%
  group_by(iso3c) %>%
  mutate(value = 100*value / value[date == as.Date("1997-01-03")]) %>%
  ggplot(.) + geom_line() + theme_minimal() +
  aes(x = date, y = value, color = `Reference area`, linetype = `Reference area`) +
  xlab("") + ylab("") +
  scale_color_manual(values = viridis(4)[1:3]) +
  scale_x_date(breaks = seq(1800, 2020, 1) %>% paste0("-01-01") %>% as.Date,
               labels = date_format("%Y")) +
  scale_y_log10(breaks = seq(10, 300, 10),
                labels = dollar_format(a = 1, p = "")) +
  theme(legend.position = c(0.2, 0.80),
        legend.title = element_blank())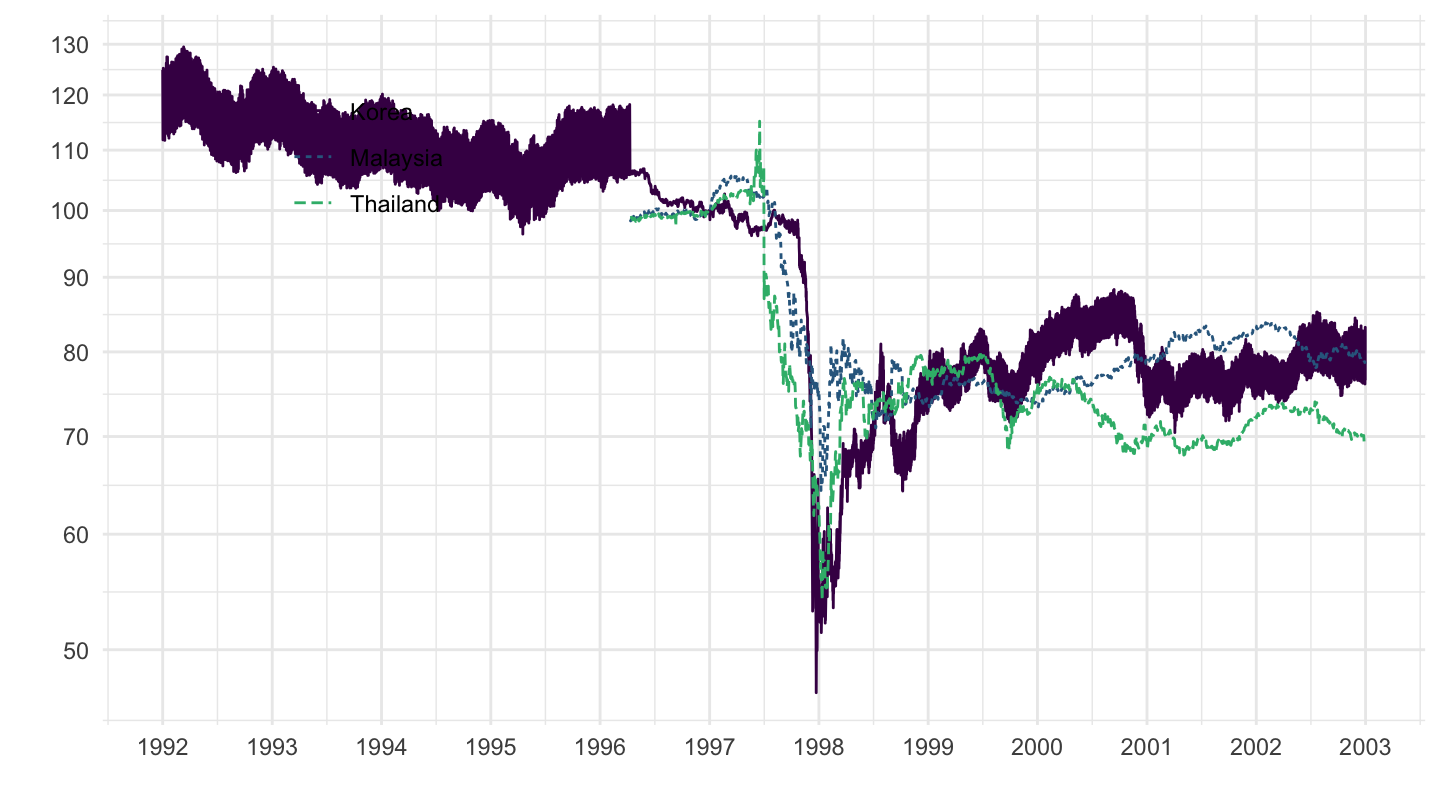
Thailand Baht
Code
EER_D %>%
  filter(iso3c %in% c("THA"),
         date >= as.Date("1992-01-01"),
         date <= as.Date("2002-12-31")) %>%
  mutate(variable = paste0(Type, ", ", Basket)) %>%
  ggplot(.) + geom_line(aes(x = date, y = value, color = variable)) +
 xlab("") + ylab("") + theme_minimal() +
  scale_color_manual(values = viridis(5)[1:4]) +
  scale_x_date(breaks = seq(1800, 2020, 1) %>% paste0("-01-01") %>% as.Date,
               labels = date_format("%Y")) +
  scale_y_log10(breaks = seq(0, 600, 10),
                labels = dollar_format(accuracy = 1, prefix = "")) +
  theme(legend.position = c(0.8, 0.2),
        legend.title = element_blank())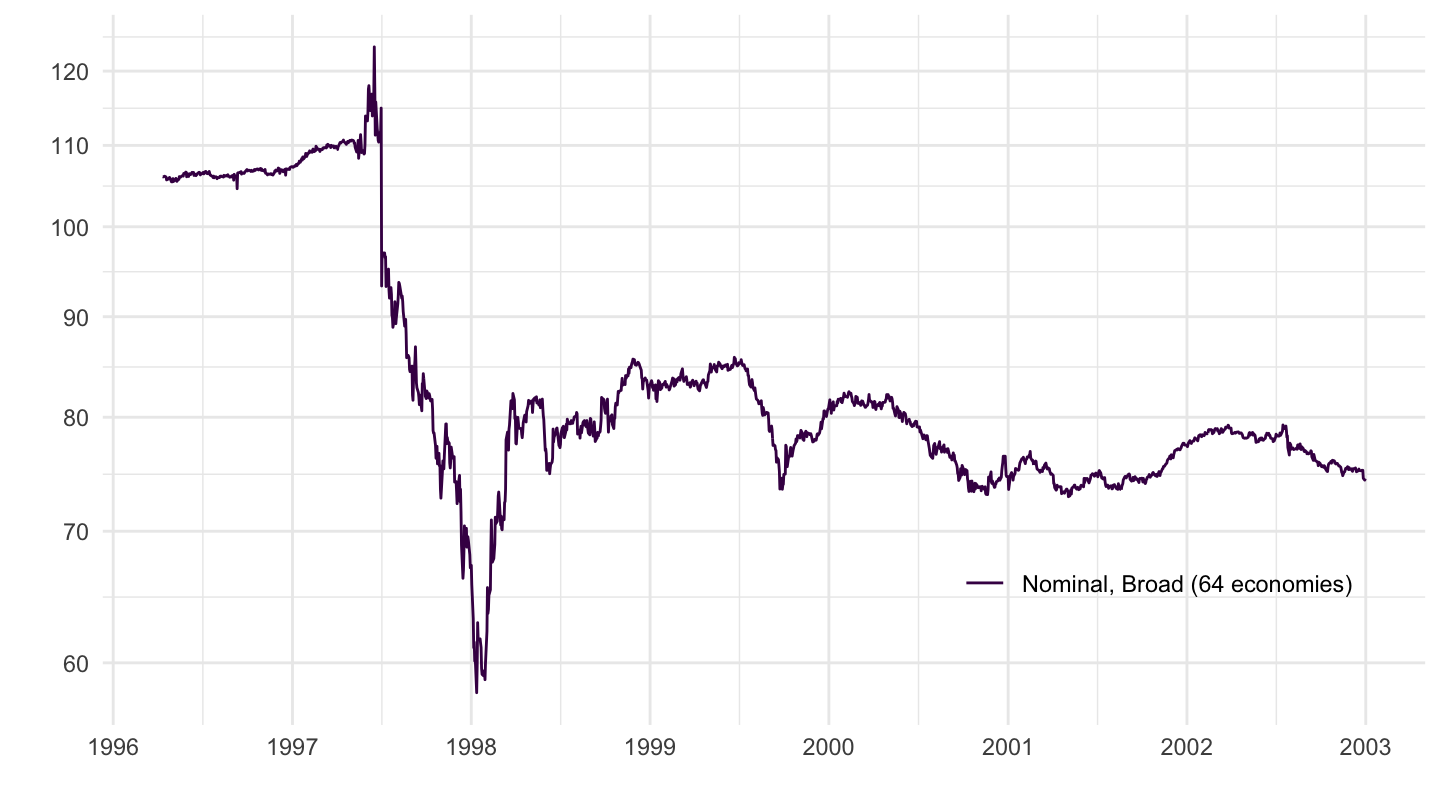
Malaysia Ringgit
Code
EER_D %>%
  filter(iso3c %in% c("MYS"),
         date >= as.Date("1992-01-01"),
         date <= as.Date("2002-12-31")) %>%
  mutate(variable = paste0(Type, ", ", Basket)) %>%
  ggplot(.) + geom_line(aes(x = date, y = value, color = variable)) +
 xlab("") + ylab("") + theme_minimal() +
  scale_color_manual(values = viridis(5)[1:4]) +
  scale_x_date(breaks = seq(1800, 2020, 1) %>% paste0("-01-01") %>% as.Date,
               labels = date_format("%Y")) +
  scale_y_log10(breaks = seq(0, 600, 10),
                labels = dollar_format(accuracy = 1, prefix = "")) +
  theme(legend.position = c(0.8, 0.2),
        legend.title = element_blank())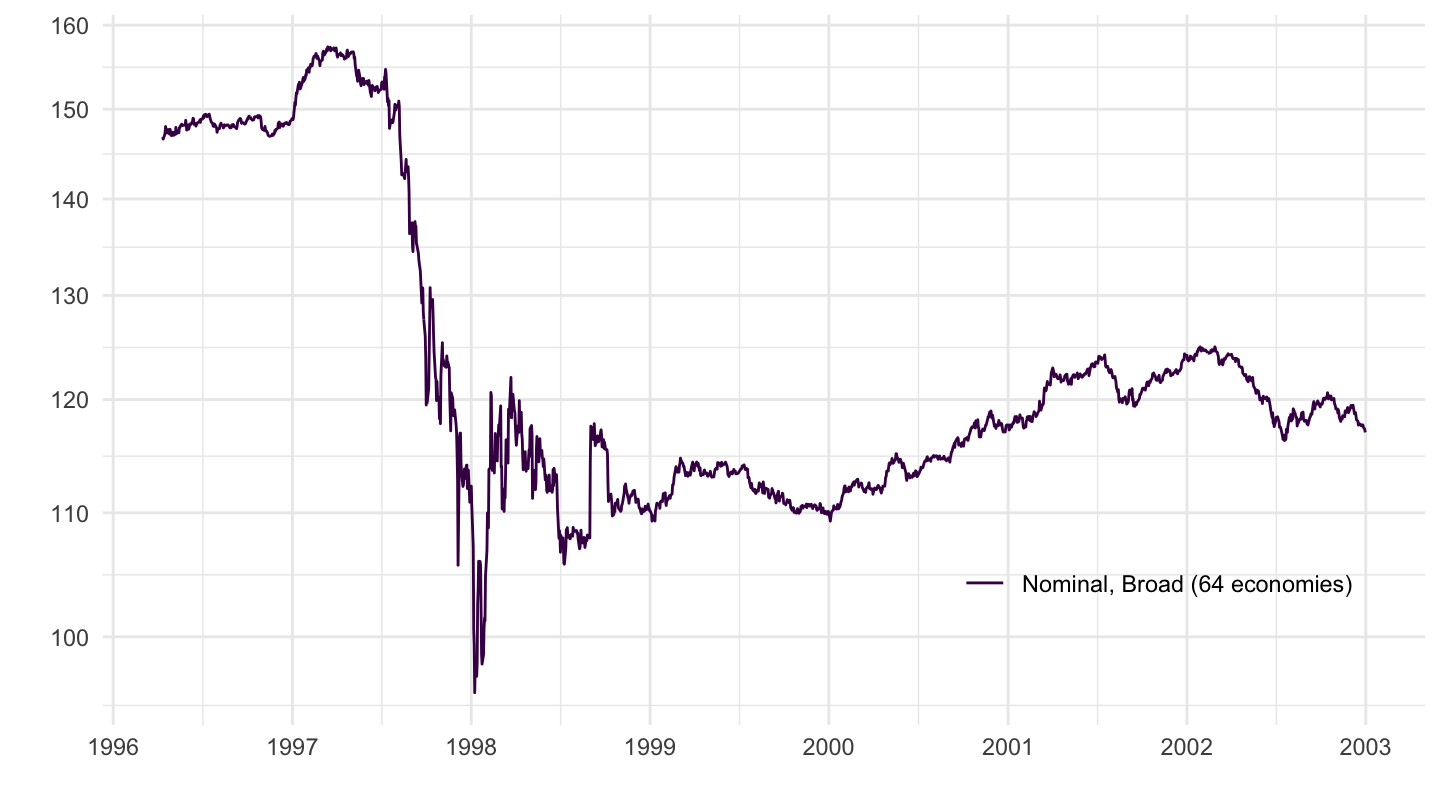
South Korea Won
Code
EER_D %>%
  filter(iso3c %in% c("KOR"),
         date >= as.Date("1992-01-01"),
         date <= as.Date("2002-12-31")) %>%
  mutate(variable = paste0(Type, ", ", Basket)) %>%
  ggplot(.) + geom_line(aes(x = date, y = value, color = variable)) +
 xlab("") + ylab("") + theme_minimal() +
  scale_color_manual(values = viridis(5)[1:4]) +
  scale_x_date(breaks = seq(1800, 2020, 1) %>% paste0("-01-01") %>% as.Date,
               labels = date_format("%Y")) +
  scale_y_log10(breaks = seq(0, 600, 10),
                labels = dollar_format(accuracy = 1, prefix = "")) +
  theme(legend.position = c(0.8, 0.2),
        legend.title = element_blank())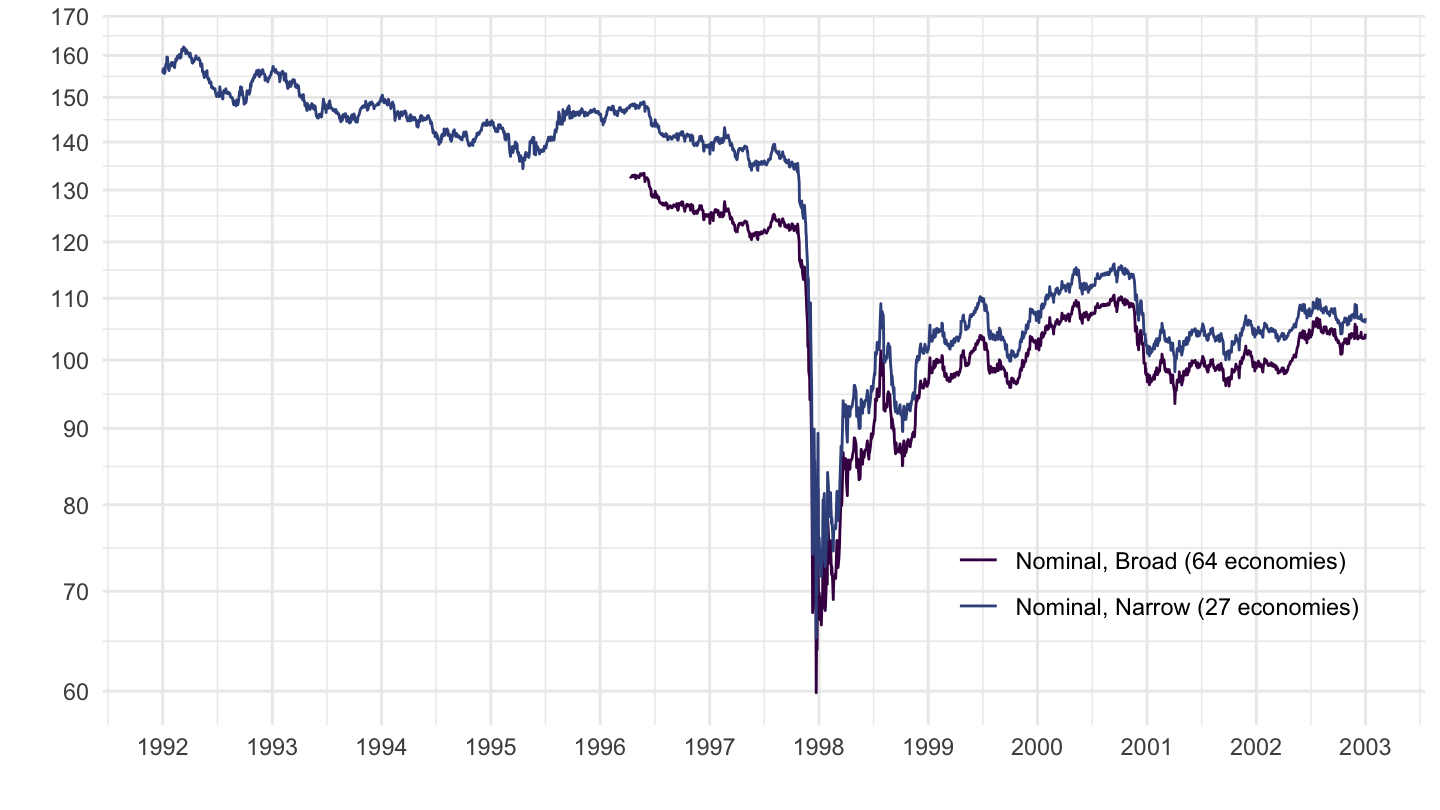
Philippine peso
Code
EER_D %>%
  filter(iso3c %in% c("PHL"),
         date >= as.Date("1992-01-01"),
         date <= as.Date("2002-12-31")) %>%
  mutate(variable = paste0(Type, ", ", Basket)) %>%
  ggplot(.) + geom_line(aes(x = date, y = value, color = variable)) +
 xlab("") + ylab("") + theme_minimal() +
  scale_color_manual(values = viridis(5)[1:4]) +
  scale_x_date(breaks = seq(1800, 2020, 1) %>% paste0("-01-01") %>% as.Date,
               labels = date_format("%Y")) +
  scale_y_log10(breaks = seq(0, 600, 10),
                labels = dollar_format(accuracy = 1, prefix = "")) +
  theme(legend.position = c(0.8, 0.2),
        legend.title = element_blank())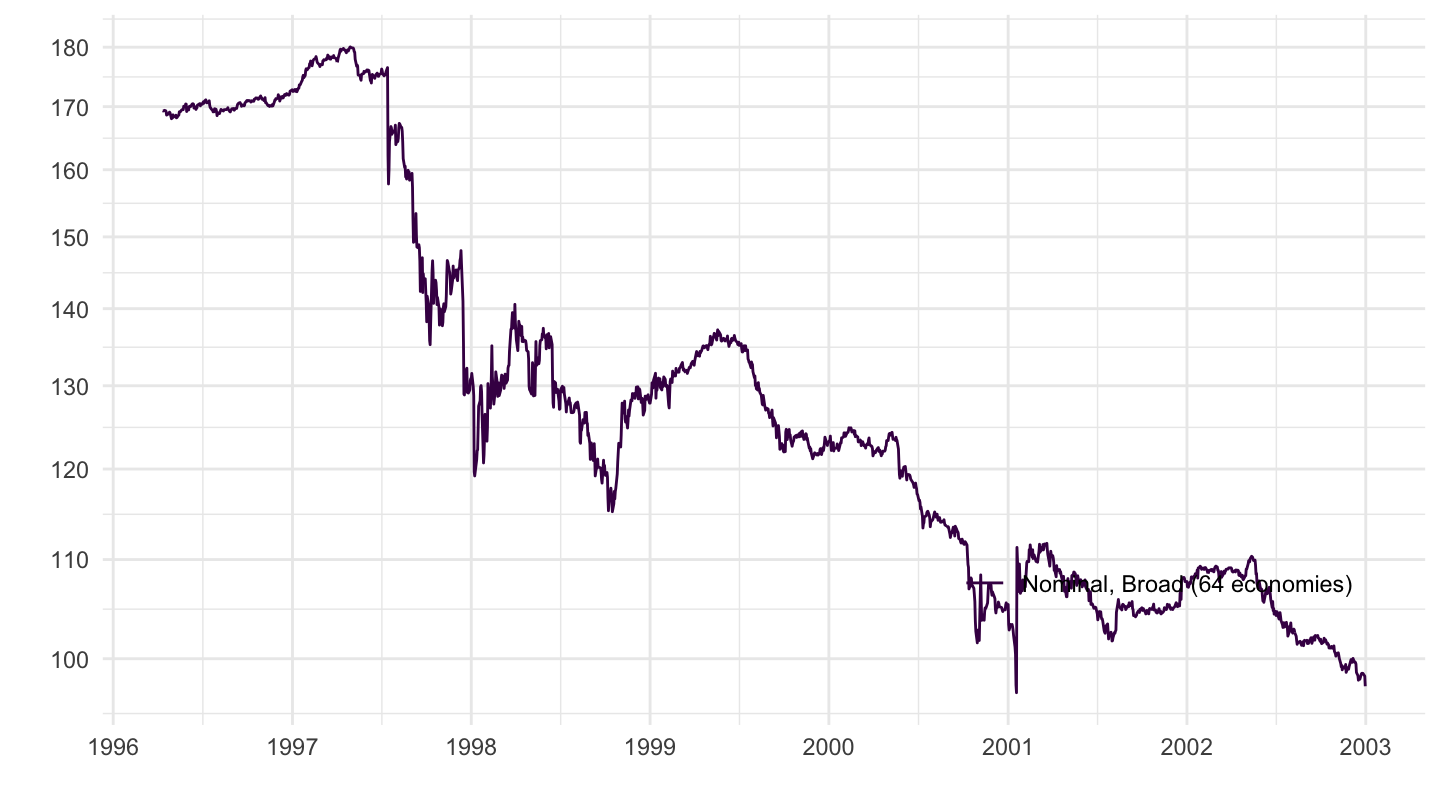
Singapore Dollar
Code
EER_D %>%
  filter(iso3c %in% c("SGP"),
         date >= as.Date("1992-01-01"),
         date <= as.Date("2002-12-31")) %>%
  mutate(variable = paste0(Type, ", ", Basket)) %>%
  ggplot(.) + geom_line(aes(x = date, y = value, color = variable)) +
 xlab("") + ylab("") + theme_minimal() +
  scale_color_manual(values = viridis(5)[1:4]) +
  scale_x_date(breaks = seq(1800, 2020, 1) %>% paste0("-01-01") %>% as.Date,
               labels = date_format("%Y")) +
  scale_y_log10(breaks = seq(0, 600, 2),
                labels = dollar_format(accuracy = 1, prefix = "")) +
  theme(legend.position = c(0.2, 0.8),
        legend.title = element_blank())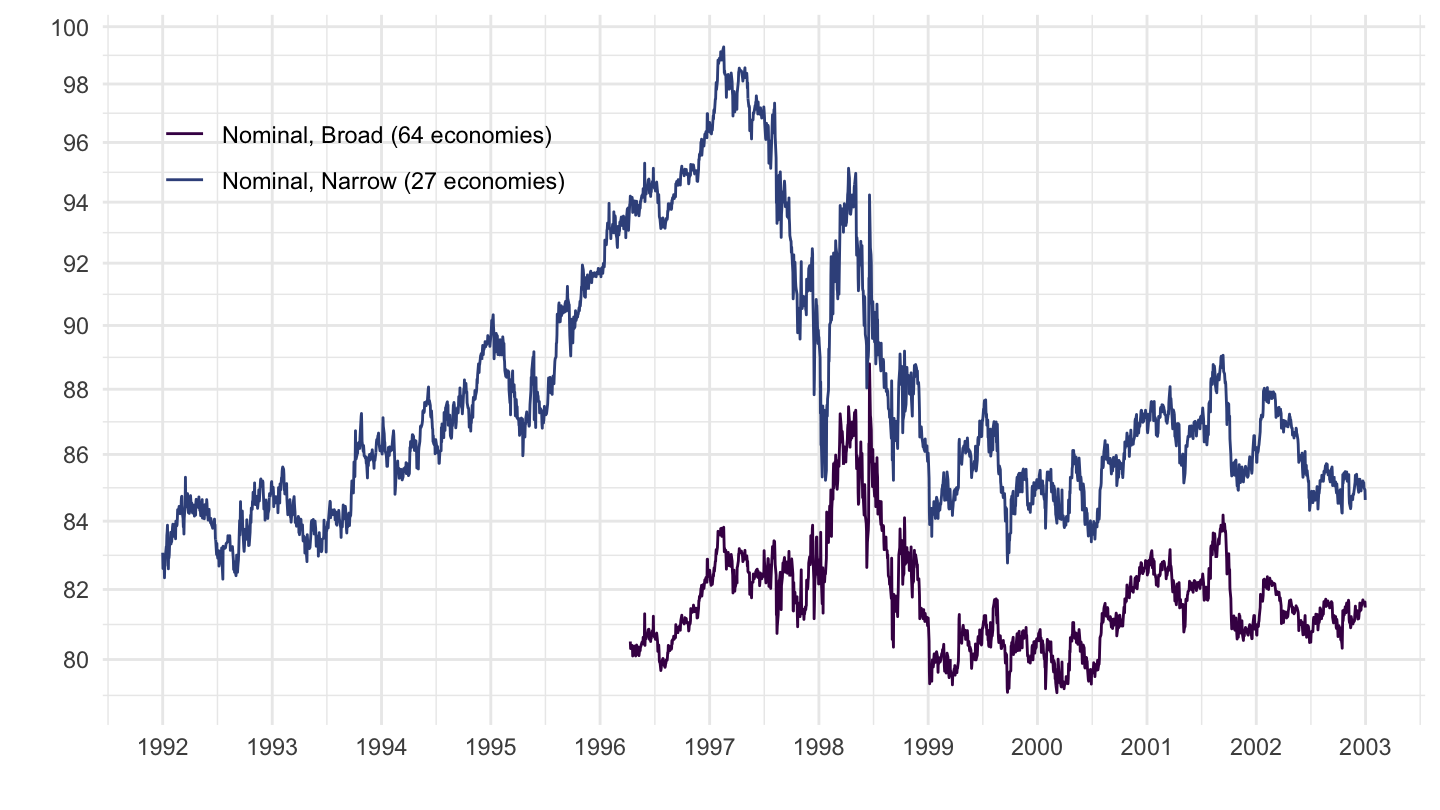
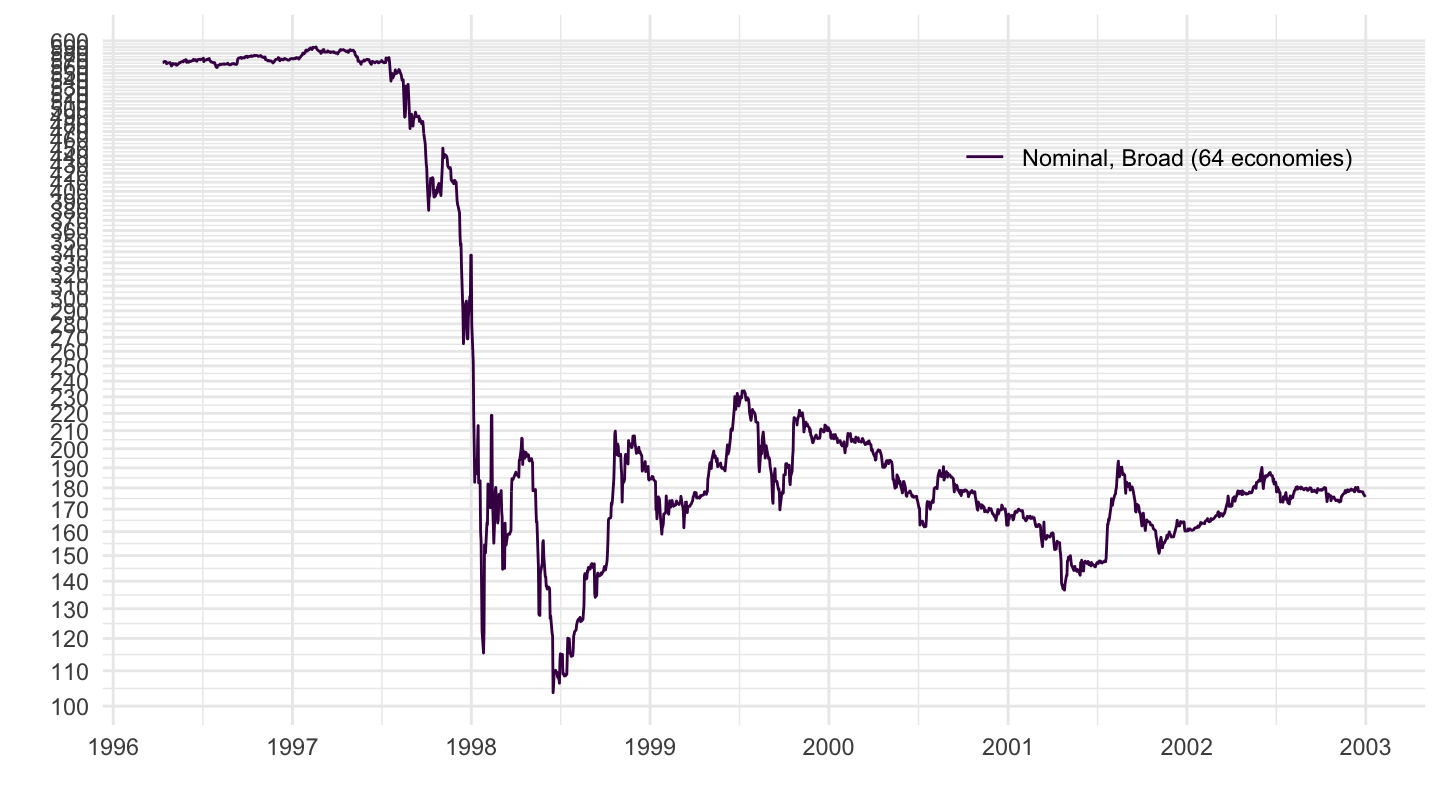
Indonesia peso
Code
EER_D %>%
  filter(iso3c %in% c("IDN"),
         date >= as.Date("1992-01-01"),
         date <= as.Date("2002-12-31")) %>%
  mutate(variable = paste0(Type, ", ", Basket)) %>%
  ggplot(.) + geom_line(aes(x = date, y = value, color = variable)) +
 xlab("") + ylab("") + theme_minimal() +
  scale_color_manual(values = viridis(5)[1:4]) +
  scale_x_date(breaks = seq(1800, 2020, 1) %>% paste0("-01-01") %>% as.Date,
               labels = date_format("%Y")) +
  scale_y_log10(breaks = seq(0, 600, 10),
                labels = dollar_format(accuracy = 1, prefix = "")) +
  theme(legend.position = c(0.8, 0.8),
        legend.title = element_blank())