Interest Rates
Data - Fred
Info
LAST_COMPILE
| LAST_COMPILE |
|---|
| 2026-02-21 |
Last
| date | Nobs |
|---|---|
| 2026-02-23 | 1 |
variable
Code
r %>%
  left_join(variable, by = "variable") %>%
  group_by(variable, Variable) %>%
  arrange(desc(date)) %>%
  summarise(Nobs = n(),
            date = date[1],
            Last = value[1]) %>%
  arrange(desc(date)) %>%
  print_table_conditional()
Mortgage Rates - 30-year, 15-year, FedFunds
All-
Code
r %>%
  filter(variable %in% c("MORTGAGE30US", "MORTGAGE15US", "EFFR")) %>%
  left_join(variable, by = "variable") %>%
  ggplot(.) + ylab("Treasury Rate (%)") + xlab("") + theme_minimal() +
  geom_line(aes(x = date, y = value / 100, color = Variable)) +

  geom_rect(data = nber_recessions %>%
              filter(Peak > as.Date("1973-01-01")),
            aes(xmin = Peak, xmax = Trough, ymin = -Inf, ymax = +Inf),
            fill = 'grey', alpha = 0.5) +
  theme(legend.title = element_blank(),
        legend.position = c(0.7, 0.9)) +
  scale_x_date(breaks = as.Date(paste0(seq(1960, 2025, 5), "-01-01")),
               labels = date_format("%Y")) +
  scale_y_continuous(breaks = seq(-0.01, 0.22, 0.01),
                     labels = scales::percent_format(accuracy = 1))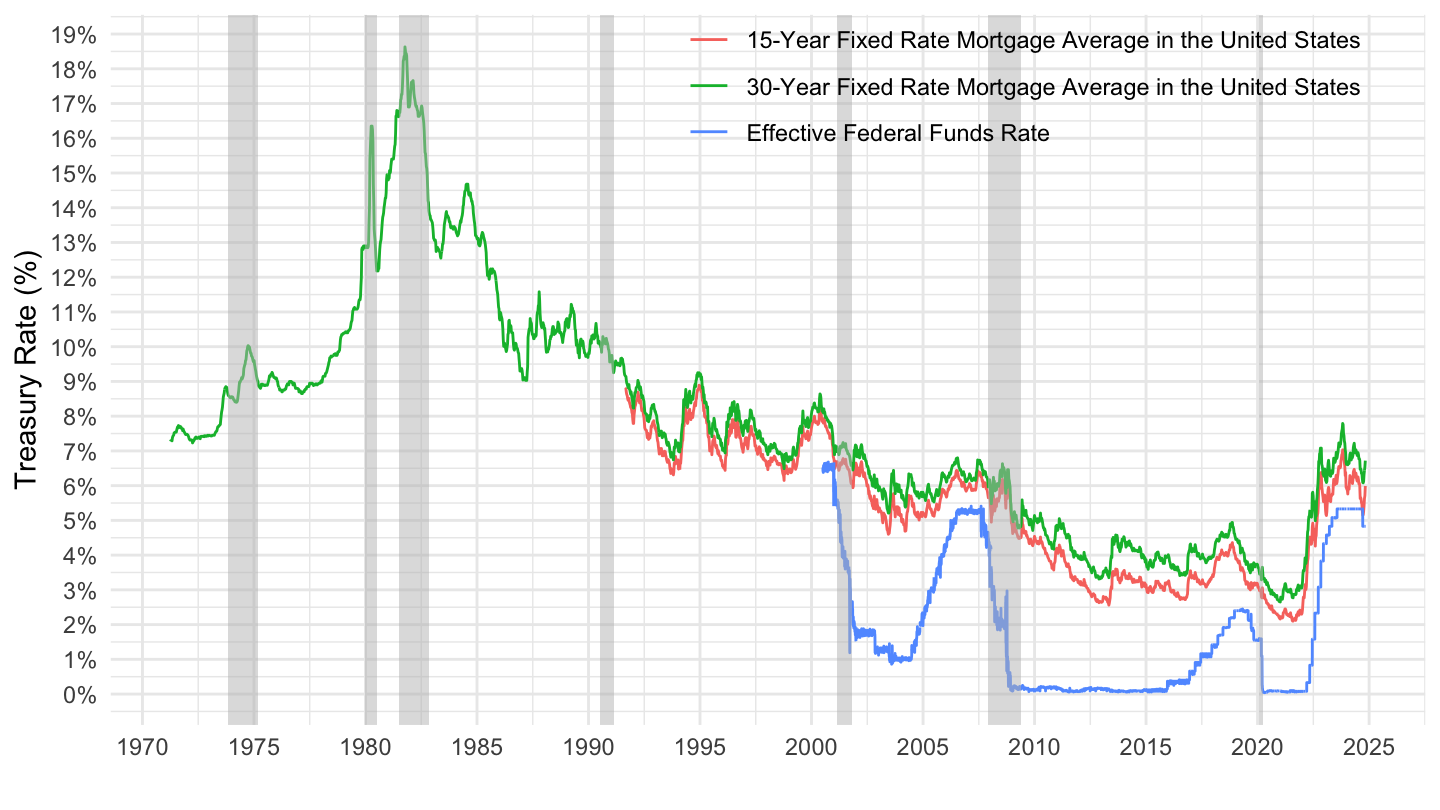
2000-
Code
r %>%
  filter(variable %in% c("MORTGAGE30US", "MORTGAGE15US", "EFFR"),
         date >= as.Date("2000-01-01")) %>%
  left_join(variable, by = "variable") %>%
  arrange(desc(date)) %>%
  ggplot(.) + ylab("Mortgage rate or Fed Funds rate (%)") + xlab("") + theme_minimal() +
  geom_line(aes(x = date, y = value / 100, color = Variable)) +

  geom_rect(data = nber_recessions %>%
              filter(Peak > as.Date("2000-01-01")),
            aes(xmin = Peak, xmax = Trough, ymin = -Inf, ymax = +Inf),
            fill = 'grey', alpha = 0.5) +
  theme(legend.title = element_blank(),
        legend.position = c(0.7, 0.9)) +
  scale_x_date(breaks = as.Date(paste0(seq(1990, 2100, 2), "-01-01")),
               labels = date_format("%Y")) +
  scale_y_continuous(breaks = seq(-0.01, 0.12, 0.01),
                     labels = scales::percent_format(accuracy = 1))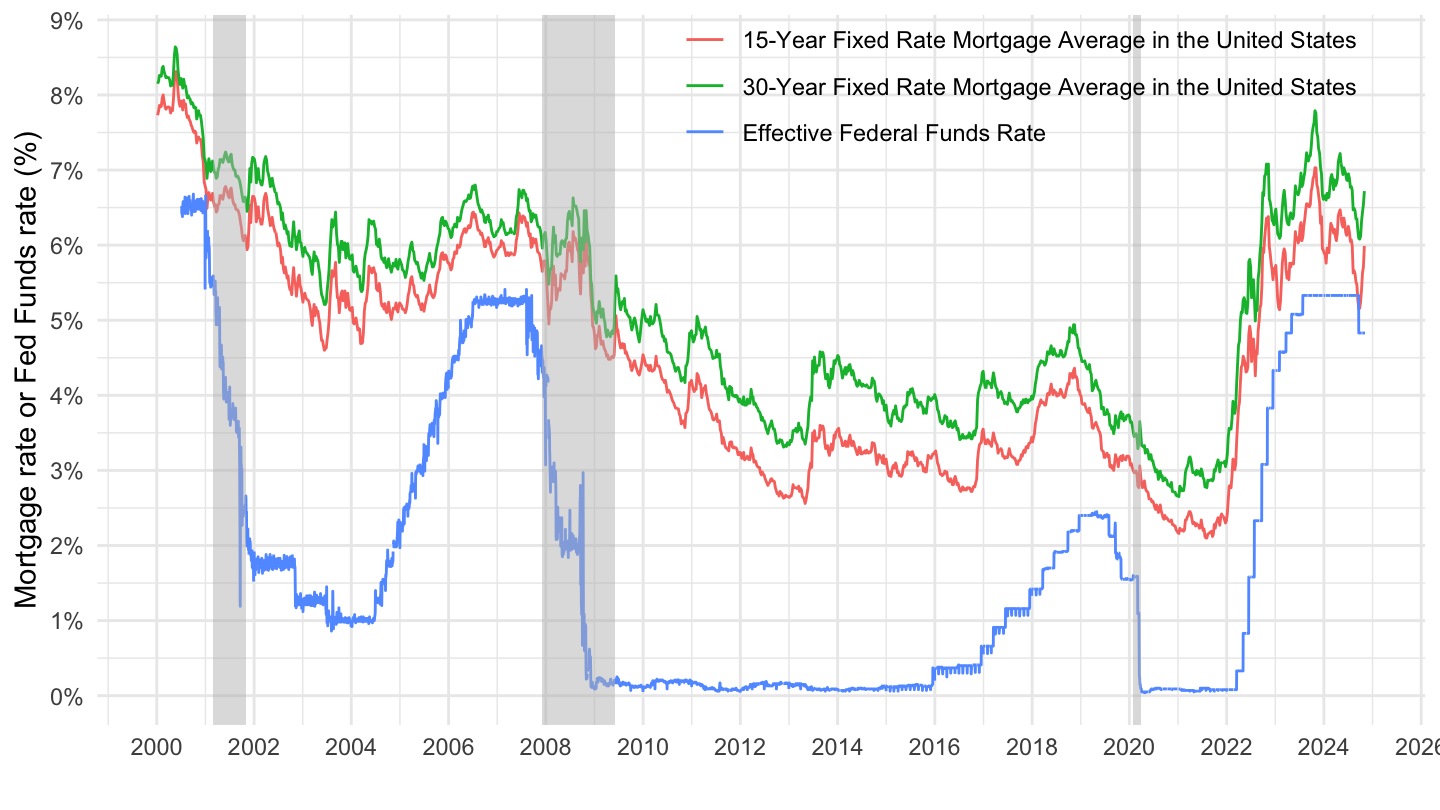
2010-
Code
r %>%
  filter(variable %in% c("MORTGAGE30US", "MORTGAGE15US", "EFFR"),
         date >= as.Date("2010-01-01")) %>%
  arrange(desc(date)) %>%
  left_join(variable, by = "variable") %>%
  ggplot(.) + ylab("Fixed Rate Mortgage Average (%)") + xlab("") + theme_minimal() +
  geom_line(aes(x = date, y = value / 100, color = Variable)) +

  theme(legend.title = element_blank(),
        legend.position = c(0.6, 0.95)) +
  scale_x_date(breaks = as.Date(paste0(seq(1990, 2100, 2), "-01-01")),
               labels = date_format("%Y")) +
  scale_y_continuous(breaks = seq(-0.01, 0.12, 0.005),
                     labels = scales::percent_format(accuracy = 0.1))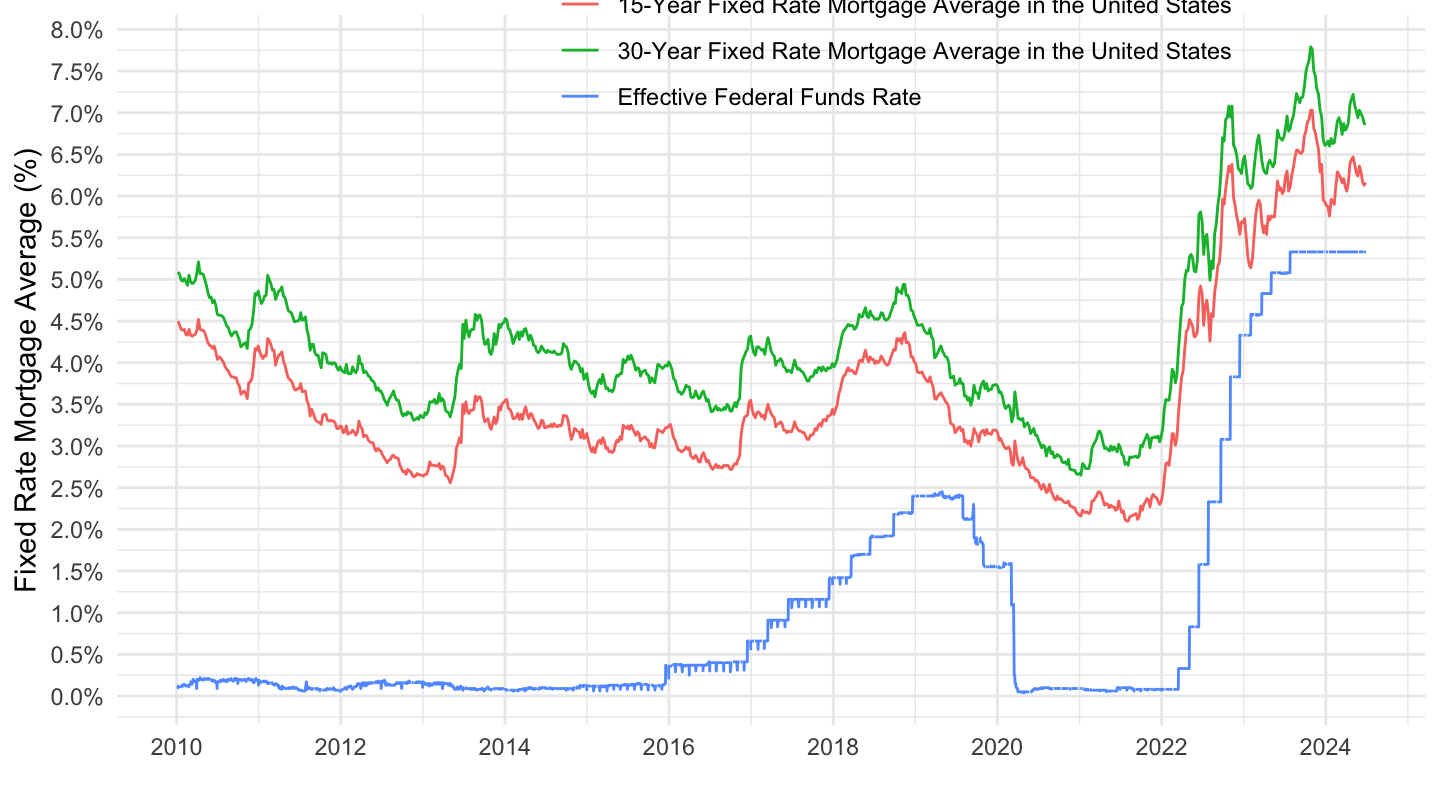
ECB Rates
All-
Code
r %>%
  filter(variable %in% c("ECBDFR", "ECBMRRFR", "ECBMLFR")) %>%
  left_join(variable, by = "variable") %>%
  ggplot(.) + ylab("Rate (%)") + xlab("") + theme_minimal() +
  geom_line(aes(x = date, y = value / 100, color = Variable)) +

  geom_rect(data = nber_recessions %>%
              filter(Peak > as.Date("1999-01-01")),
            aes(xmin = Peak, xmax = Trough, ymin = -Inf, ymax = +Inf),
            fill = 'grey', alpha = 0.5) +
  theme(legend.title = element_blank(),
        legend.position = c(0.6, 0.9)) +
  scale_x_date(breaks = as.Date(paste0(seq(1960, 2025, 5), "-01-01")),
               labels = date_format("%Y")) +
  scale_y_continuous(breaks = seq(-0.01, 0.22, 0.01),
                     labels = scales::percent_format(accuracy = 1))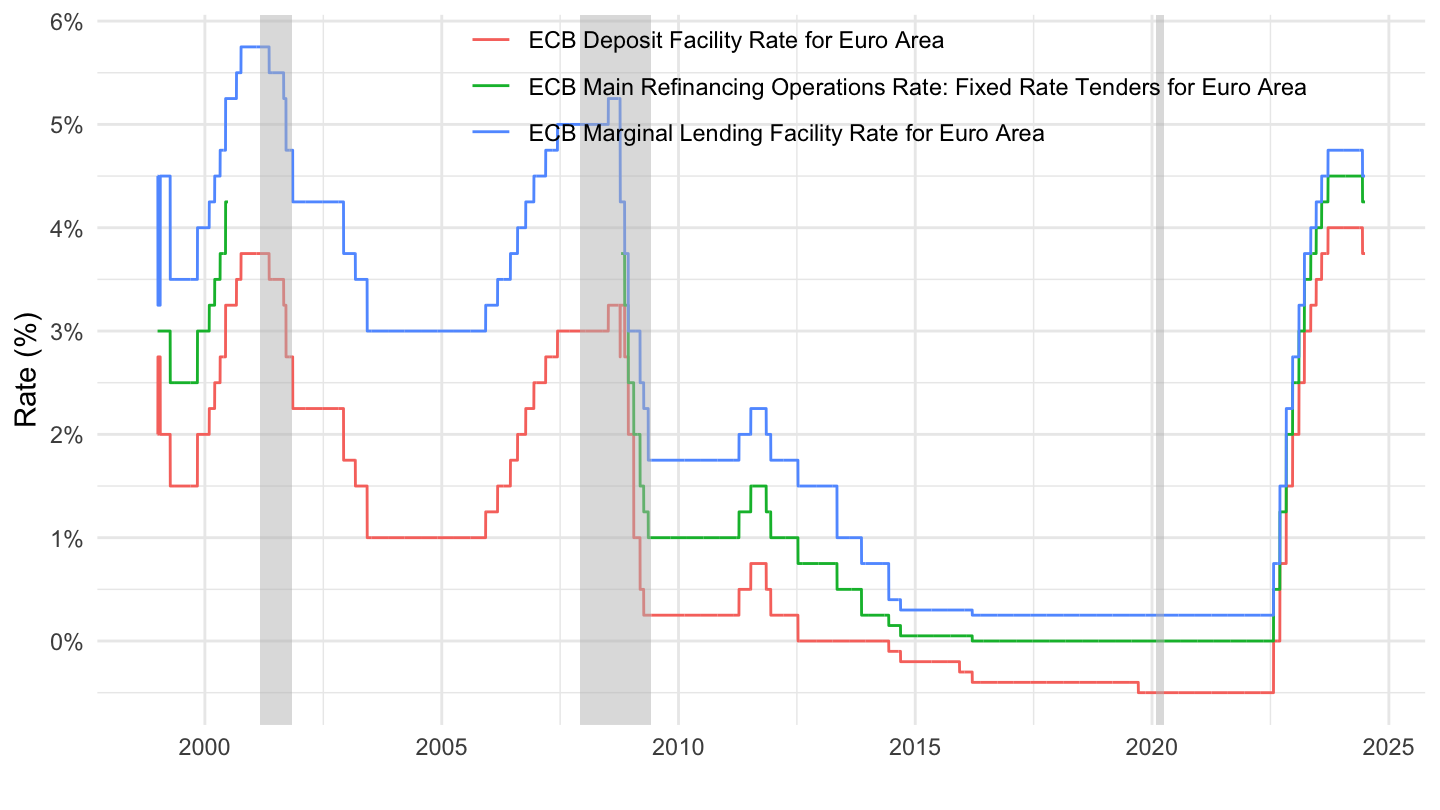
2000-
Code
r %>%
  filter(variable %in% c("ECBDFR", "ECBMRRFR", "ECBMLFR"),
         date >= as.Date("2000-01-01")) %>%
  left_join(variable, by = "variable") %>%
  arrange(desc(date)) %>%
  ggplot(.) + ylab("Rate (%)") + xlab("") + theme_minimal() +
  geom_line(aes(x = date, y = value / 100, color = Variable)) +

  geom_rect(data = nber_recessions %>%
              filter(Peak > as.Date("2000-01-01")),
            aes(xmin = Peak, xmax = Trough, ymin = -Inf, ymax = +Inf),
            fill = 'grey', alpha = 0.5) +
  theme(legend.title = element_blank(),
        legend.position = c(0.6, 0.9)) +
  scale_x_date(breaks = as.Date(paste0(seq(1990, 2100, 2), "-01-01")),
               labels = date_format("%Y")) +
  scale_y_continuous(breaks = seq(-0.01, 0.12, 0.01),
                     labels = scales::percent_format(accuracy = 1))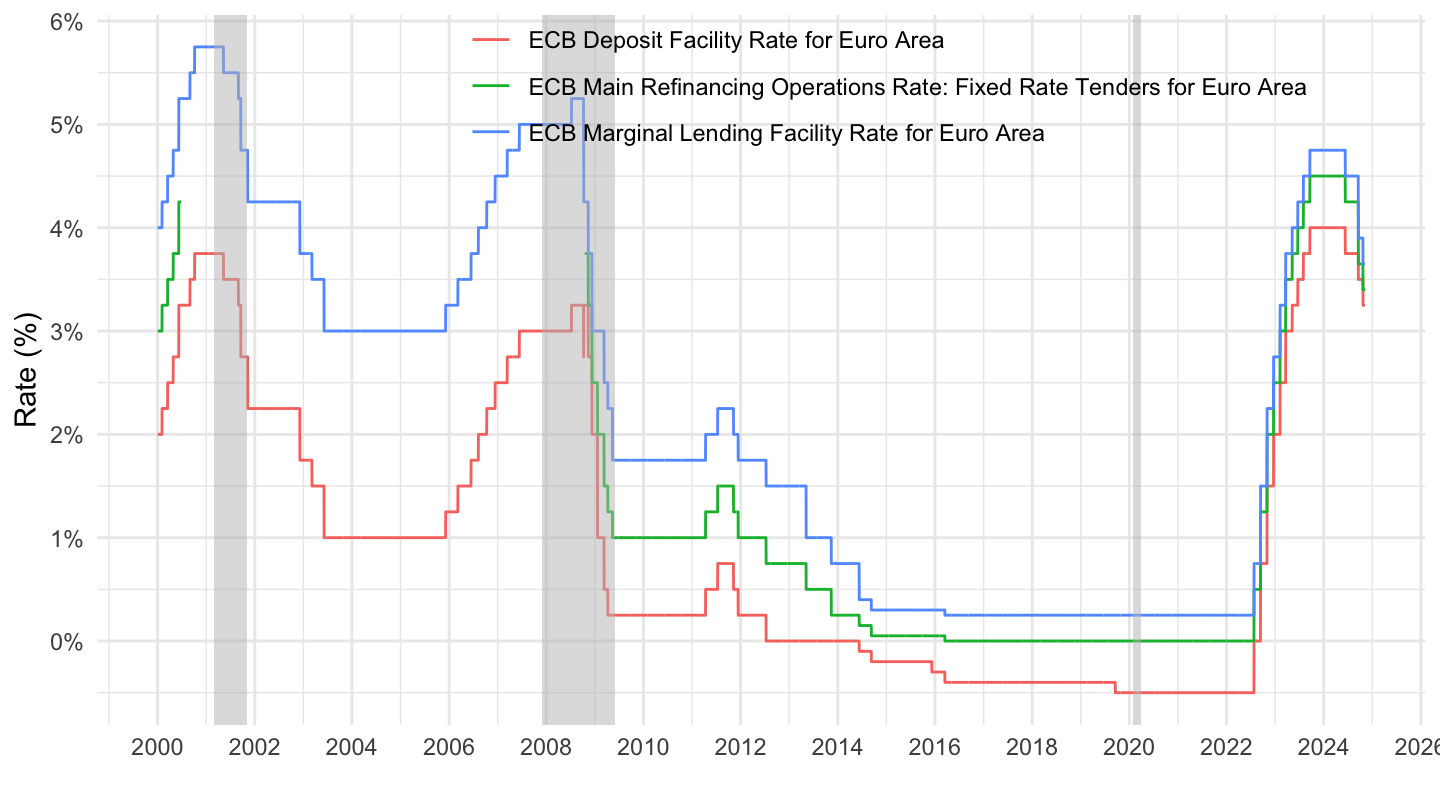
2010-
Code
r %>%
  filter(variable %in% c("ECBDFR", "ECBMRRFR", "ECBMLFR"),
         date >= as.Date("2010-01-01")) %>%
  arrange(desc(date)) %>%
  left_join(variable, by = "variable") %>%
  ggplot(.) + ylab("Rate (%)") + xlab("") + theme_minimal() +
  geom_line(aes(x = date, y = value / 100, color = Variable)) +

  theme(legend.title = element_blank(),
        legend.position = c(0.6, 0.95)) +
  scale_x_date(breaks = as.Date(paste0(seq(1990, 2100, 2), "-01-01")),
               labels = date_format("%Y")) +
  scale_y_continuous(breaks = seq(-0.01, 0.12, 0.005),
                     labels = scales::percent_format(accuracy = 0.1))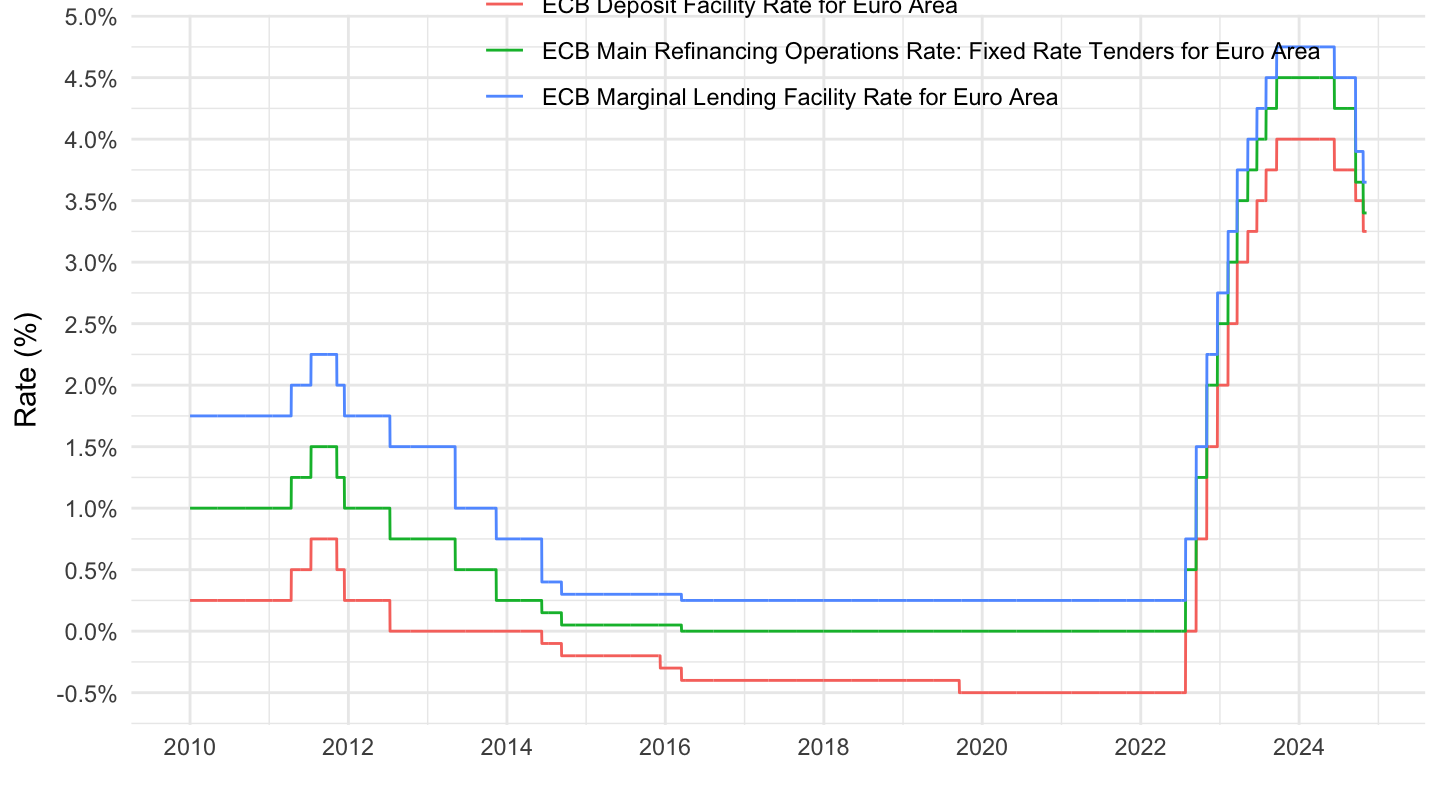
10-Year Nominal Yield
France, Germany, Japan
2016 -
Code
r %>%
  filter(variable %in% c("IRLTLT01DEM156N", "IRLTLT01JPM156N", "IRLTLT01FRM156N")) %>%
  mutate(Variable  = case_when(variable == "IRLTLT01DEM156N" ~ "Germany: 10-Year Nominal Yield",
                               variable == "IRLTLT01JPM156N" ~ "Japan: 10-Year Nominal Yield",
                               variable == "IRLTLT01FRM156N" ~ "France: 10-Year Nominal Yield")) %>%
  filter(date >= as.Date("2016-01-01")) %>%
  ggplot(.) + xlab("") + ylab("10-Year Nominal Government Bond (%)") + theme_minimal() +
  geom_line(aes(x = date, y = value / 100, color = Variable)) +
  scale_color_manual(values = c("#002395", "#000000", "#BC002D")) +
  theme(legend.title = element_blank(),
        legend.position = c(0.25, 0.85)) +
  scale_x_date(breaks = seq(1870, 2100, 1) %>% paste0("-01-01") %>% as.Date,
               labels = date_format("%Y")) +
  scale_y_continuous(breaks = 0.01*seq(-2, 10, 0.5),
                     labels = scales::percent_format(accuracy = 0.1))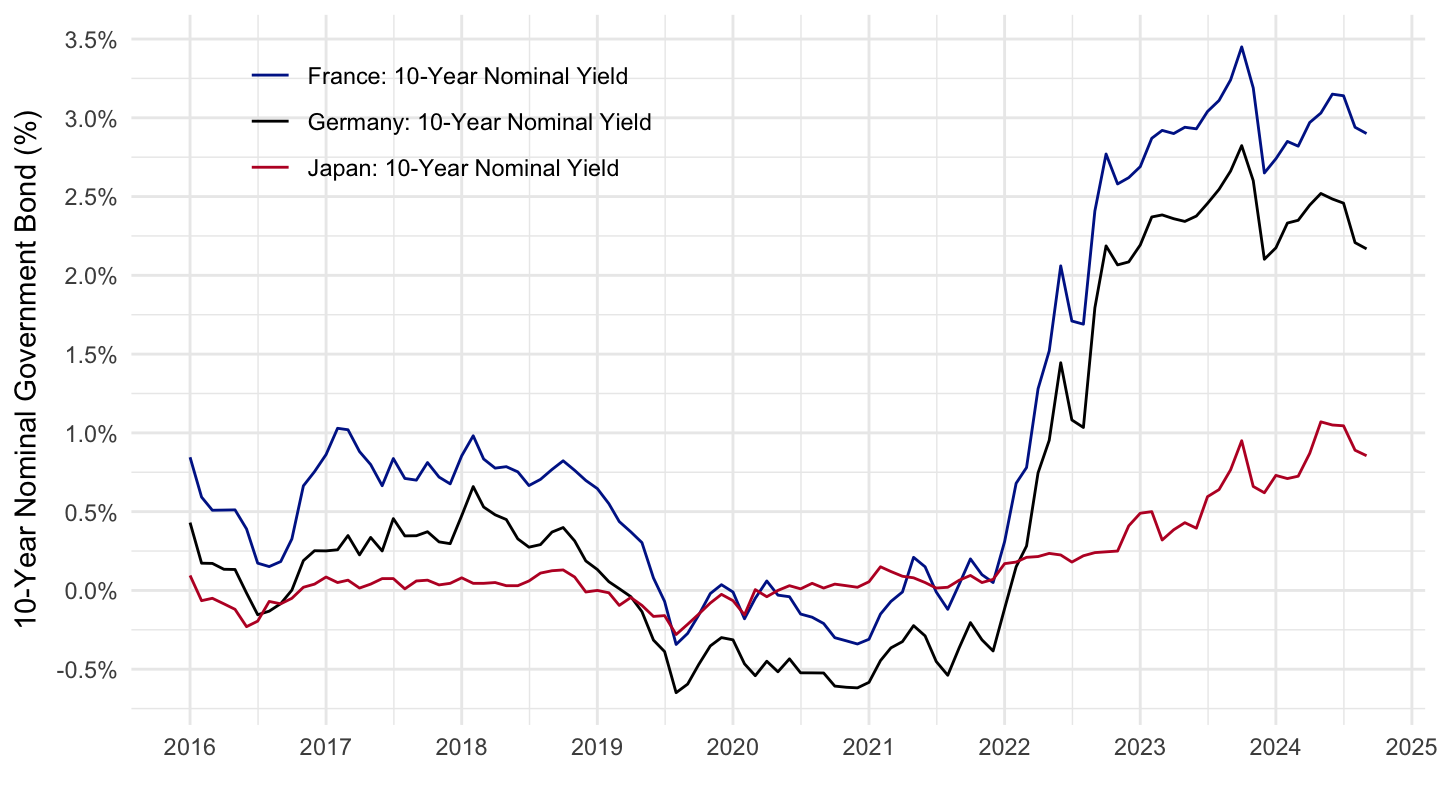
All
Code
r %>%
  filter(variable %in% c("IRLTLT01DEM156N", "IRLTLT01JPM156N", "IRLTLT01FRM156N")) %>%
  select(date, value, variable = variable) %>%
  mutate(Variable  = case_when(variable == "IRLTLT01DEM156N" ~ "Germany: 10-Year Nominal Yield",
                               variable == "IRLTLT01JPM156N" ~ "Japan: 10-Year Nominal Yield",
                               variable == "IRLTLT01FRM156N" ~ "France: 10-Year Nominal Yield")) %>%
  ggplot(.) + xlab("") + ylab("10-Year Nominal Government Bond (%)") + theme_minimal() +
  geom_line(aes(x = date, y = value / 100, color = Variable)) +
  scale_color_manual(values = c("#002395", "#000000", "#BC002D")) +
  theme(legend.title = element_blank(),
        legend.position = c(0.25, 0.15)) +
  scale_x_date(breaks = seq(1870, 2022, 5) %>% paste0("-01-01") %>% as.Date,
               labels = date_format("%Y")) +
  scale_y_continuous(breaks = 0.01*seq(-2, 40, 2),
                     labels = scales::percent_format(accuracy = 1))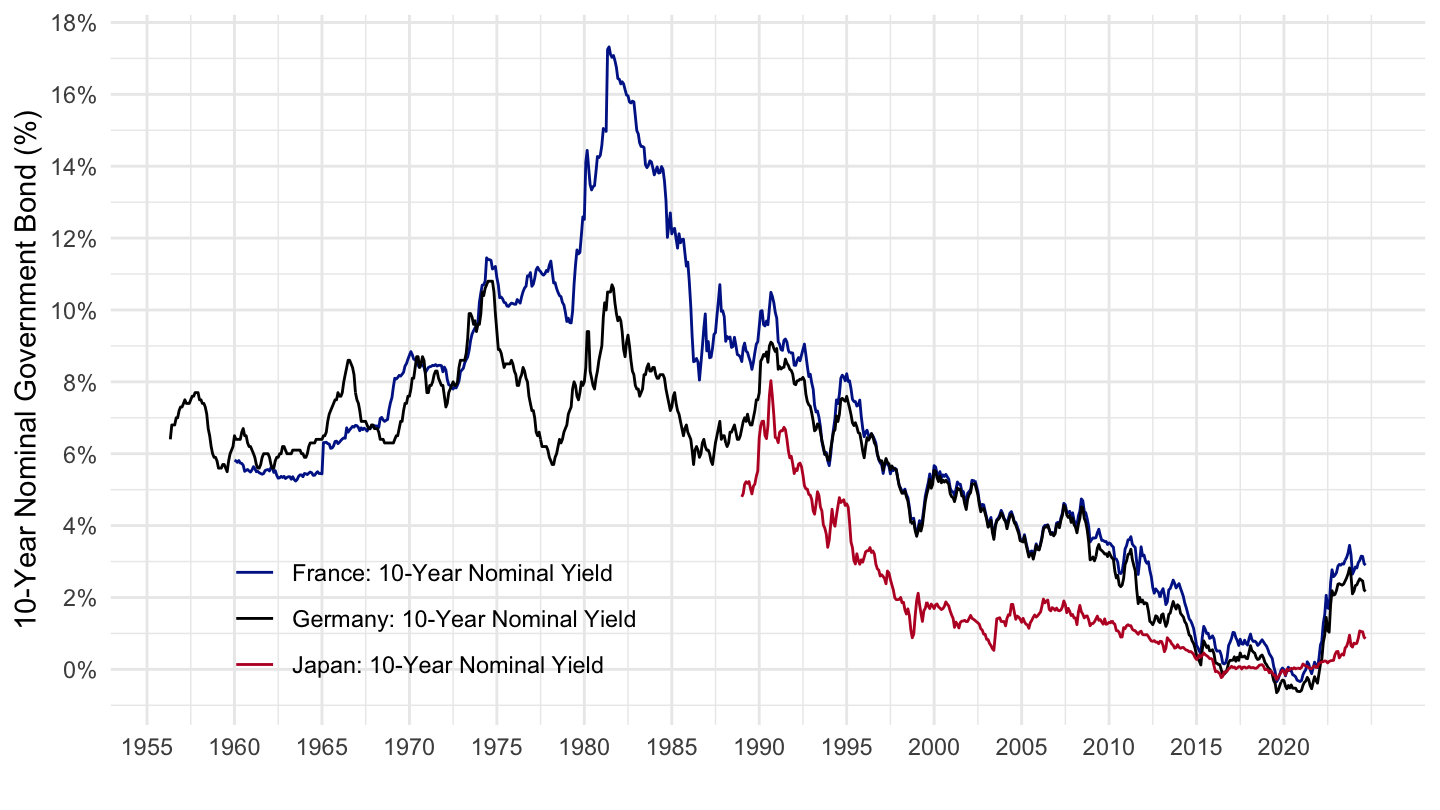
Germany, Japan
Code
r %>%
  filter(variable %in% c("IRLTLT01DEM156N", "IRLTLT01JPM156N")) %>%
  select(date, value, variable = variable) %>%
  mutate(value = value / 100,
         Variable  = case_when(variable == "IRLTLT01DEM156N" ~ "Germany: 10-Year Nominal Yield",
                                    variable == "IRLTLT01JPM156N" ~ "Japan: 10-Year Nominal Yield")) %>%
  filter(date >= as.Date("2016-01-01")) %>%
  ggplot(data = .) +
  geom_line(aes(x = date, y = value, color = Variable)) +
  labs(x = "Observation Date", y = "Rate") +
  theme_minimal() +
  scale_color_manual(values = c("#000000", "#BC002D")) +
  theme(legend.title = element_blank(),
        legend.position = c(0.2, 0.8)) +
  scale_x_date(breaks = seq(1870, 2030, 1) %>% paste0("-01-01") %>% as.Date,
               labels = date_format("%Y")) +
  scale_y_continuous(breaks = 0.01*seq(-2, 10, 0.2),
                     labels = scales::percent_format(accuracy = 0.1)) +
  xlab("") + ylab("10-Year Nominal Government Bond Yield")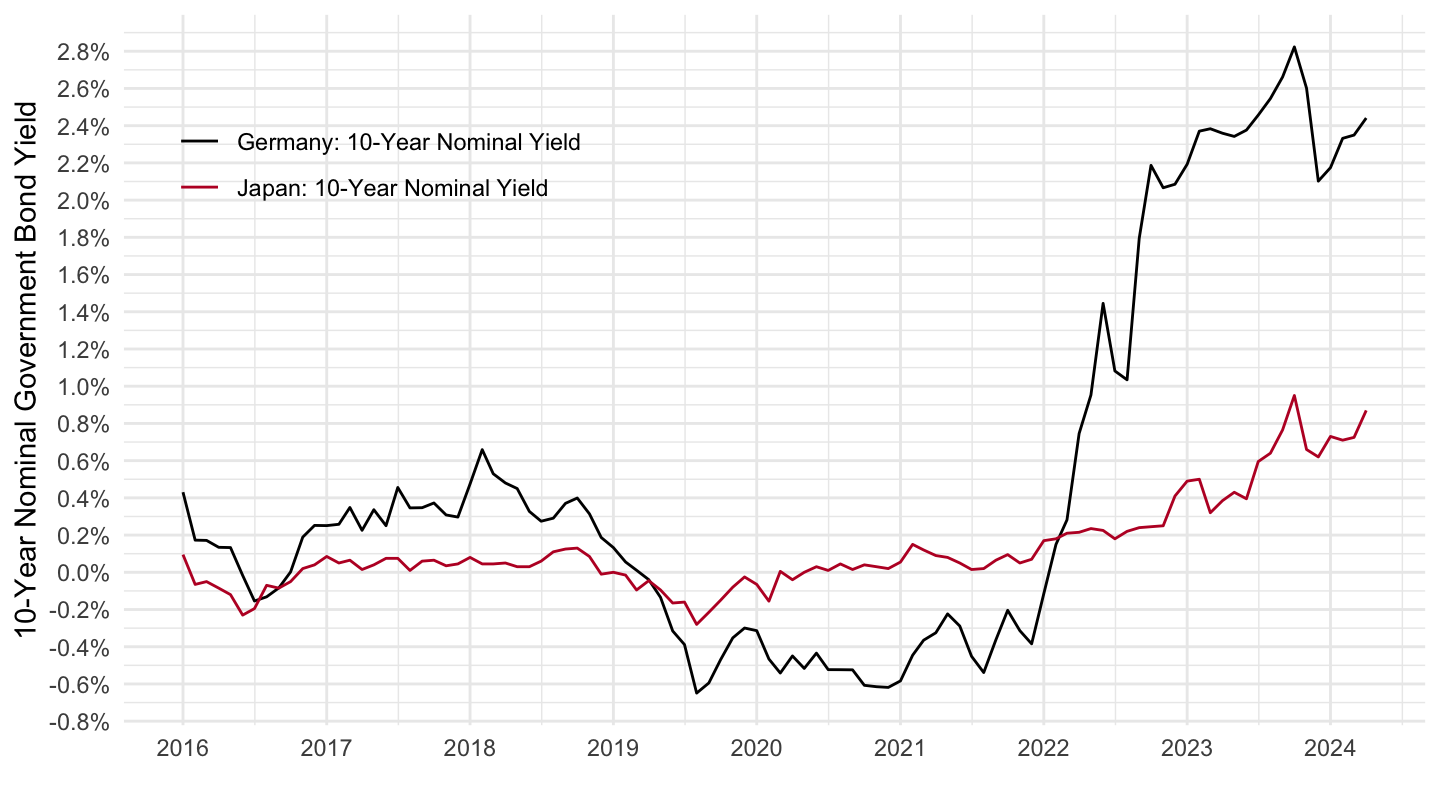
Mortgage Debt Service Payments (% Disposable Personal Income)
All
Code
r %>%
  filter(variable %in% c("MDSP")) %>%
  mutate(value = value / 100) %>%
  ggplot(.) + geom_line(aes(x = date, y = value)) + theme_minimal() +
  scale_x_date(breaks = seq(1870, 2022, 5) %>% paste0("-01-01") %>% as.Date,
               labels = date_format("%Y")) +
  scale_y_continuous(breaks = 0.01*seq(0, 15, 0.2),
                     labels = scales::percent_format(accuracy = 0.1)) +
  xlab("") + ylab("% of Disposable Income") +
  geom_vline(xintercept = as.Date("2008-09-15"), linetype = "dashed", color = viridis(3)[2]) +
    geom_rect(data = data_frame(start = as.Date("2004-06-01"),
                                end = as.Date("2007-08-01")),
              aes(xmin = start, xmax = end, ymin = -Inf, ymax = +Inf),
              fill = viridis(4)[4], alpha = 0.2) +
    geom_vline(xintercept = as.Date("2004-06-01"), linetype = "dashed", color = viridis(4)[4]) +
    geom_vline(xintercept = as.Date("2007-08-01"), linetype = "dashed", color = viridis(4)[4])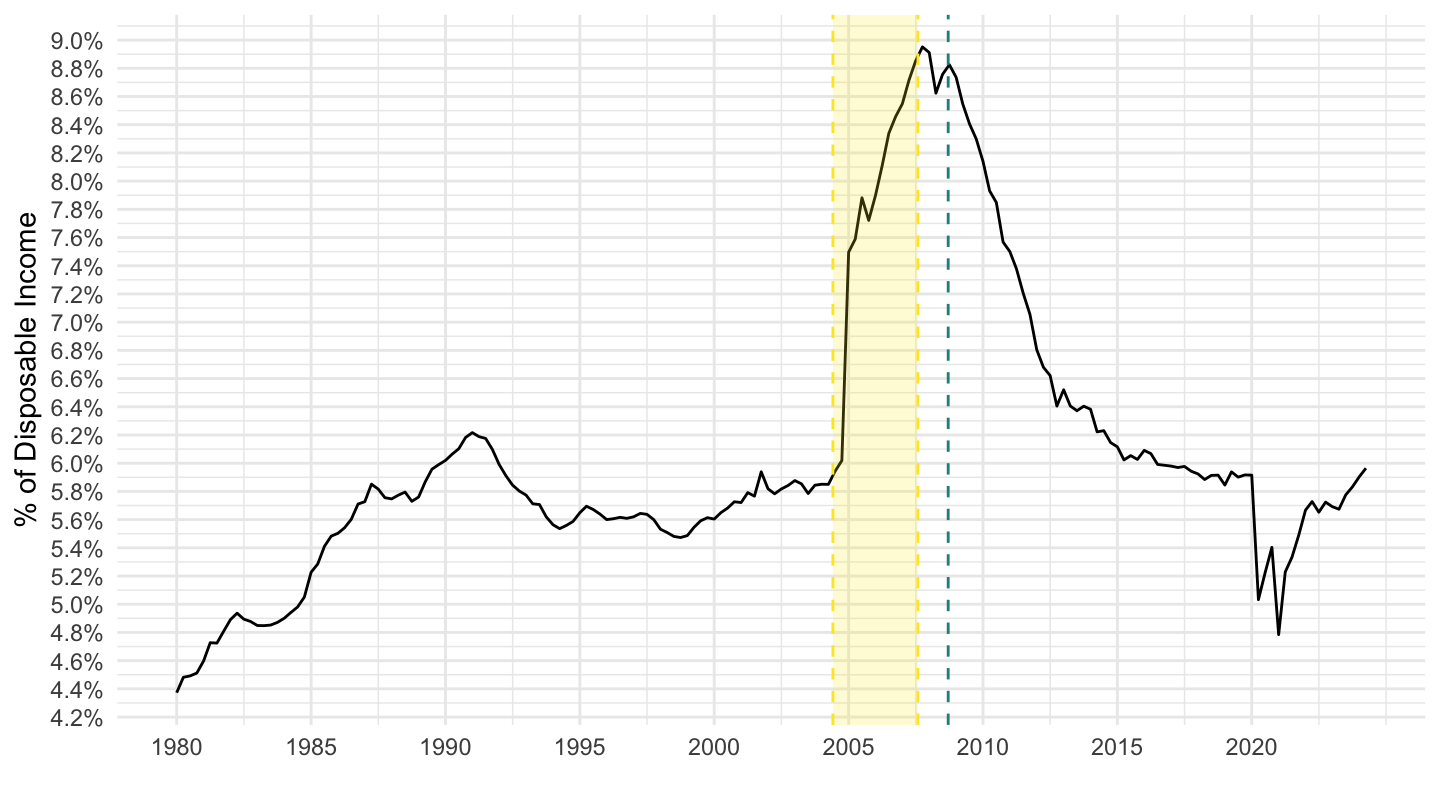
2000-
Code
r %>%
  filter(variable %in% c("MDSP"),
         date >= as.Date("1994-01-01")) %>%
  mutate(value = value / 100) %>%
  ggplot(.) + geom_line(aes(x = date, y = value)) + theme_minimal() +
  scale_x_date(breaks = seq(1870, 2100, 2) %>% paste0("-01-01") %>% as.Date,
               labels = date_format("%Y")) +
  scale_y_continuous(breaks = 0.01*seq(0, 15, 0.2),
                     labels = scales::percent_format(accuracy = 0.1)) +
  xlab("") + ylab("Mortgage debt service payments (% of Disposable Income)") +
  geom_vline(xintercept = as.Date("2008-09-15"), linetype = "dashed", color = viridis(3)[2]) +
    geom_rect(data = data_frame(start = as.Date("2004-06-01"),
                                end = as.Date("2007-08-01")),
              aes(xmin = start, xmax = end, ymin = -Inf, ymax = +Inf),
              fill = viridis(4)[4], alpha = 0.2) +
    geom_vline(xintercept = as.Date("2004-06-01"), linetype = "dashed", color = viridis(4)[4]) +
    geom_vline(xintercept = as.Date("2007-08-01"), linetype = "dashed", color = viridis(4)[4])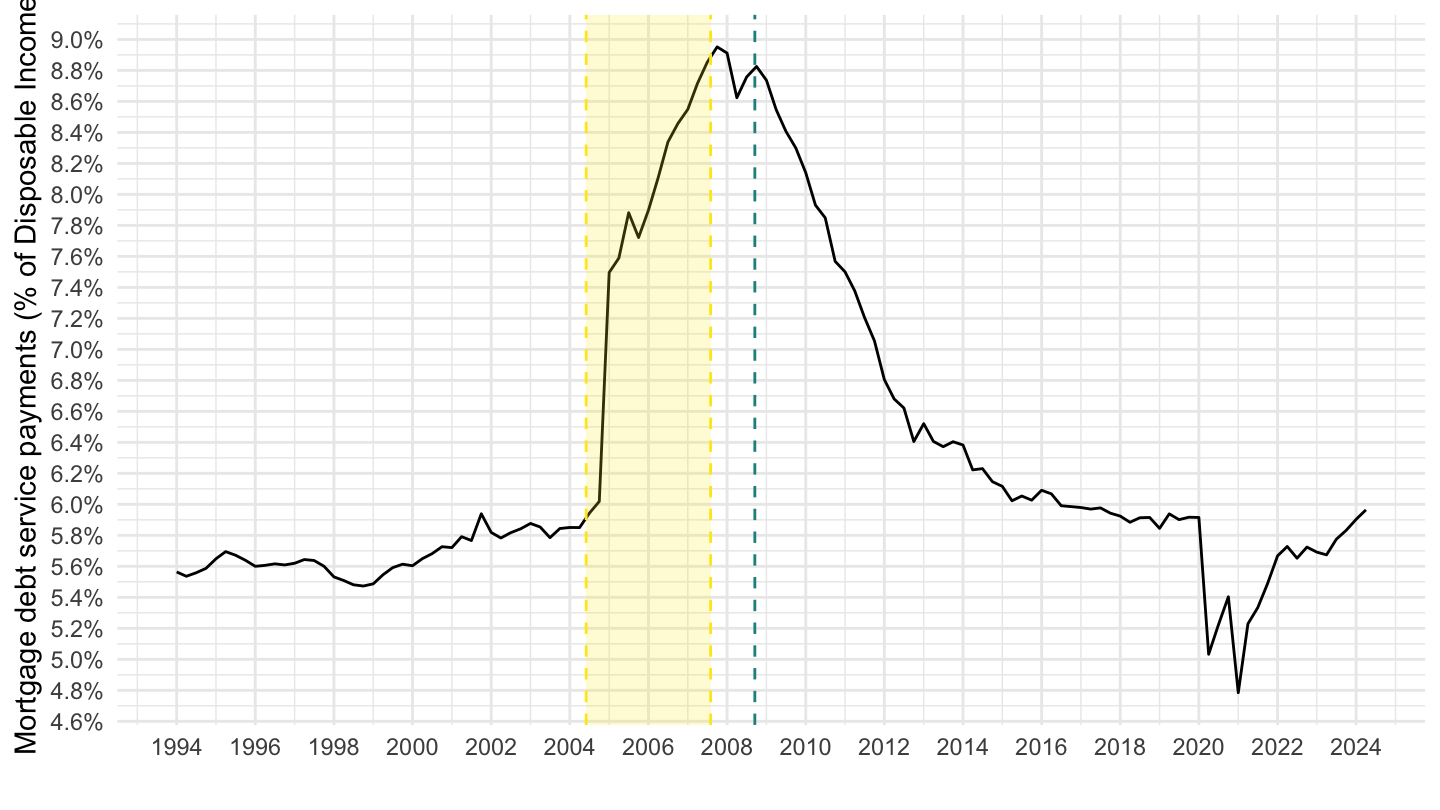
2000-2012
Code
r %>%
  filter(variable %in% c("MDSP")) %>%
  filter(date >= as.Date("2000-01-01"),
         date <= as.Date("2012-01-01")) %>%
  mutate(value = value / 100) %>%
  ggplot(.) + geom_line(aes(x = date, y = value)) + theme_minimal() +
  scale_x_date(breaks = seq(1870, 2100, 1) %>% paste0("-01-01") %>% as.Date,
               labels = date_format("%Y")) +
  scale_y_continuous(breaks = 0.01*seq(0, 15, 0.2),
                     labels = scales::percent_format(accuracy = 0.1)) +
  xlab("") + ylab("% of Disposable Income") +
  geom_vline(xintercept = as.Date("2008-09-15"), linetype = "dashed", color = viridis(3)[2]) +
    geom_rect(data = data_frame(start = as.Date("2004-06-01"),
                                end = as.Date("2007-08-01")),
              aes(xmin = start, xmax = end, ymin = -Inf, ymax = +Inf),
              fill = viridis(4)[4], alpha = 0.2) +
    geom_vline(xintercept = as.Date("2004-06-01"), linetype = "dashed", color = viridis(4)[4]) +
    geom_vline(xintercept = as.Date("2007-08-01"), linetype = "dashed", color = viridis(4)[4])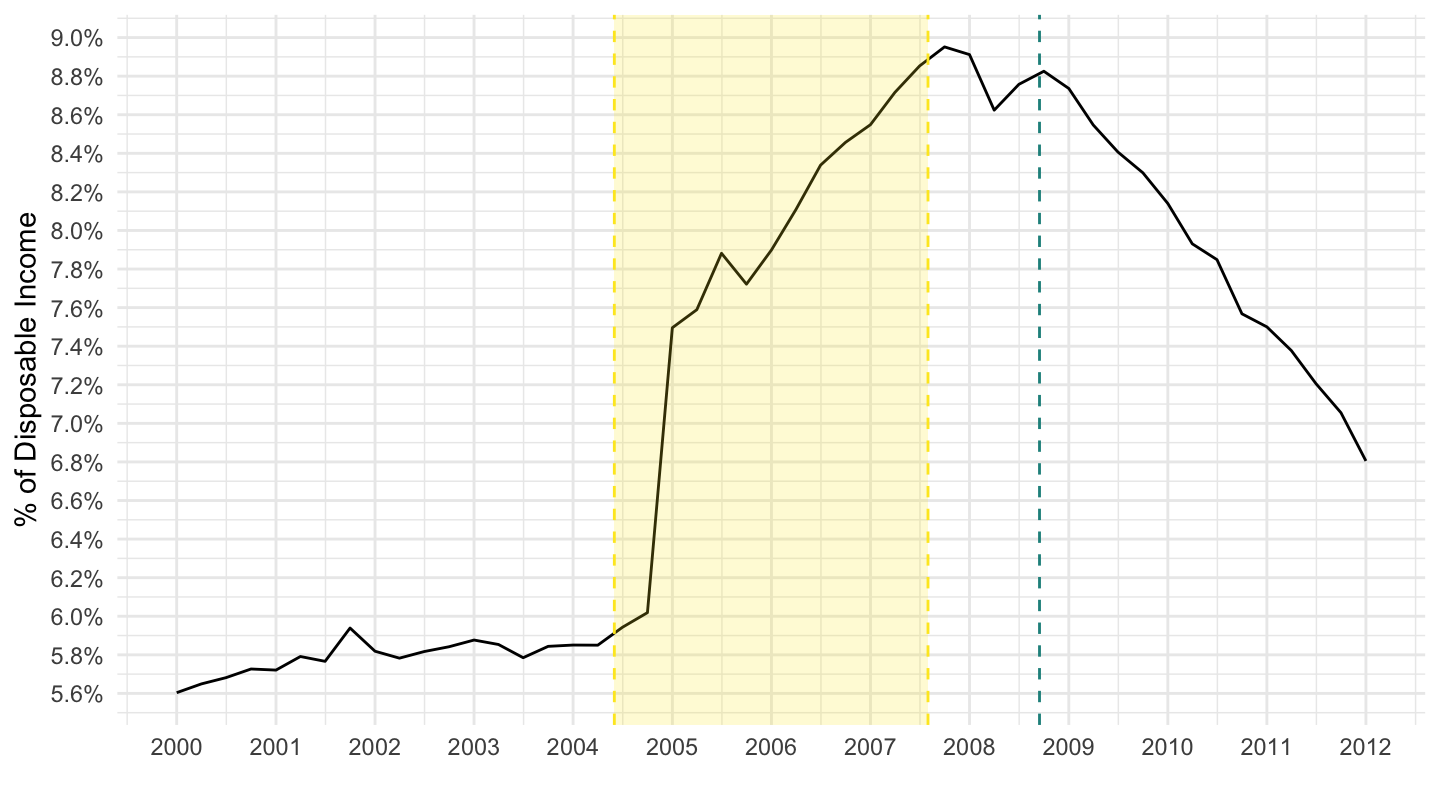
2002-2012
Code
r %>%
  filter(variable %in% c("MDSP")) %>%
  filter(date >= as.Date("2002-01-01"),
         date <= as.Date("2012-01-01")) %>%
  mutate(value = value / 100) %>%
  ggplot(.) + geom_line(aes(x = date, y = value)) + theme_minimal() +
  scale_x_date(breaks = seq(1870, 2100, 1) %>% paste0("-01-01") %>% as.Date,
               labels = date_format("%Y")) +
  scale_y_continuous(breaks = 0.01*seq(0, 15, 0.2),
                     labels = scales::percent_format(accuracy = 0.1)) +
  xlab("") + ylab("Mortgage Debt Service Payments (% of Disp. Income)") +
  geom_vline(xintercept = as.Date("2008-09-15"), linetype = "dashed", color = viridis(3)[2]) +
    geom_rect(data = data_frame(start = as.Date("2004-06-01"),
                                end = as.Date("2007-08-01")),
              aes(xmin = start, xmax = end, ymin = -Inf, ymax = +Inf),
              fill = viridis(4)[4], alpha = 0.2) +
    geom_vline(xintercept = as.Date("2004-06-01"), linetype = "dashed", color = viridis(4)[4]) +
    geom_vline(xintercept = as.Date("2007-08-01"), linetype = "dashed", color = viridis(4)[4])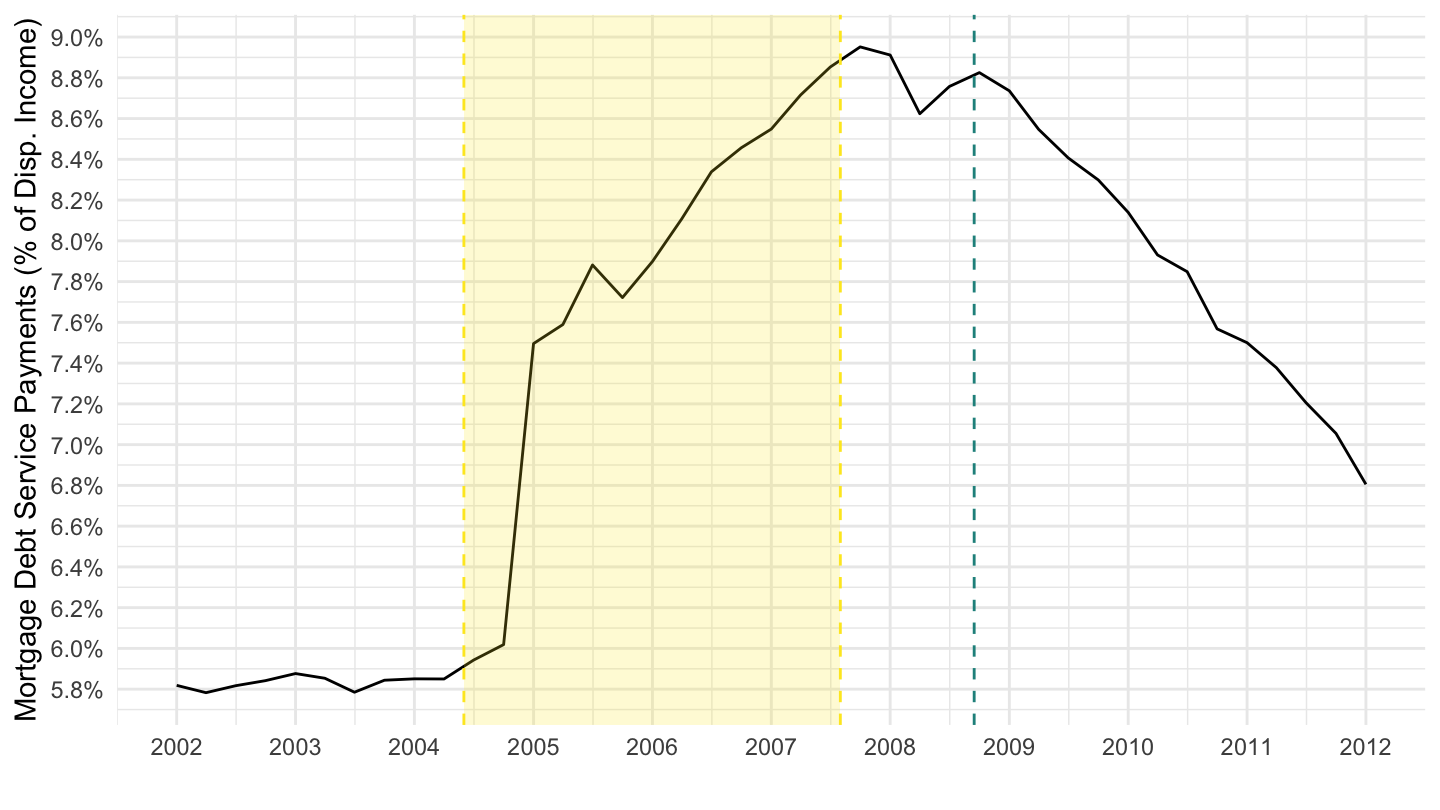
1990 Hiking Cycle
30-year convential Mortgage Rate
Code
r %>%
  filter(variable %in% c("MORTGAGE30US"),
         date >= as.Date("1987-01-01"),
         date <= as.Date("1993-01-01")) %>%
  mutate(value = value / 100) %>%
  ggplot(.) + geom_line(aes(x = date, y = value)) + theme_minimal() +
  scale_x_date(breaks = seq(1870, 2100, 1) %>% paste0("-01-01") %>% as.Date,
               labels = date_format("%Y")) +
  scale_y_continuous(breaks = 0.01*seq(0, 30, 0.5),
                     labels = scales::percent_format(accuracy = 0.1)) +
  xlab("") + ylab("") +
  geom_vline(xintercept = as.Date("2008-09-15"), linetype = "dashed", color = viridis(3)[2])
Federal Funds Rate (Source: FRED)
Code
r %>%
  filter(variable %in% c("FEDFUNDS")) %>%
  filter(date >= as.Date("1987-01-01"),
         date <= as.Date("1993-01-01")) %>%
  mutate(value = value / 100) %>%
  ggplot(.) + geom_line(aes(x = date, y = value)) + theme_minimal() +
  scale_x_date(breaks = seq(1870, 2100, 1) %>% paste0("-01-01") %>% as.Date,
               labels = date_format("%Y")) +
  scale_y_continuous(breaks = 0.01*seq(0, 15, 0.5),
                     labels = scales::percent_format(accuracy = 0.5)) +
  xlab("") + ylab("Federal Funds Rate") +
  geom_vline(xintercept = as.Date("2008-09-15"), linetype = "dashed", color = viridis(3)[2])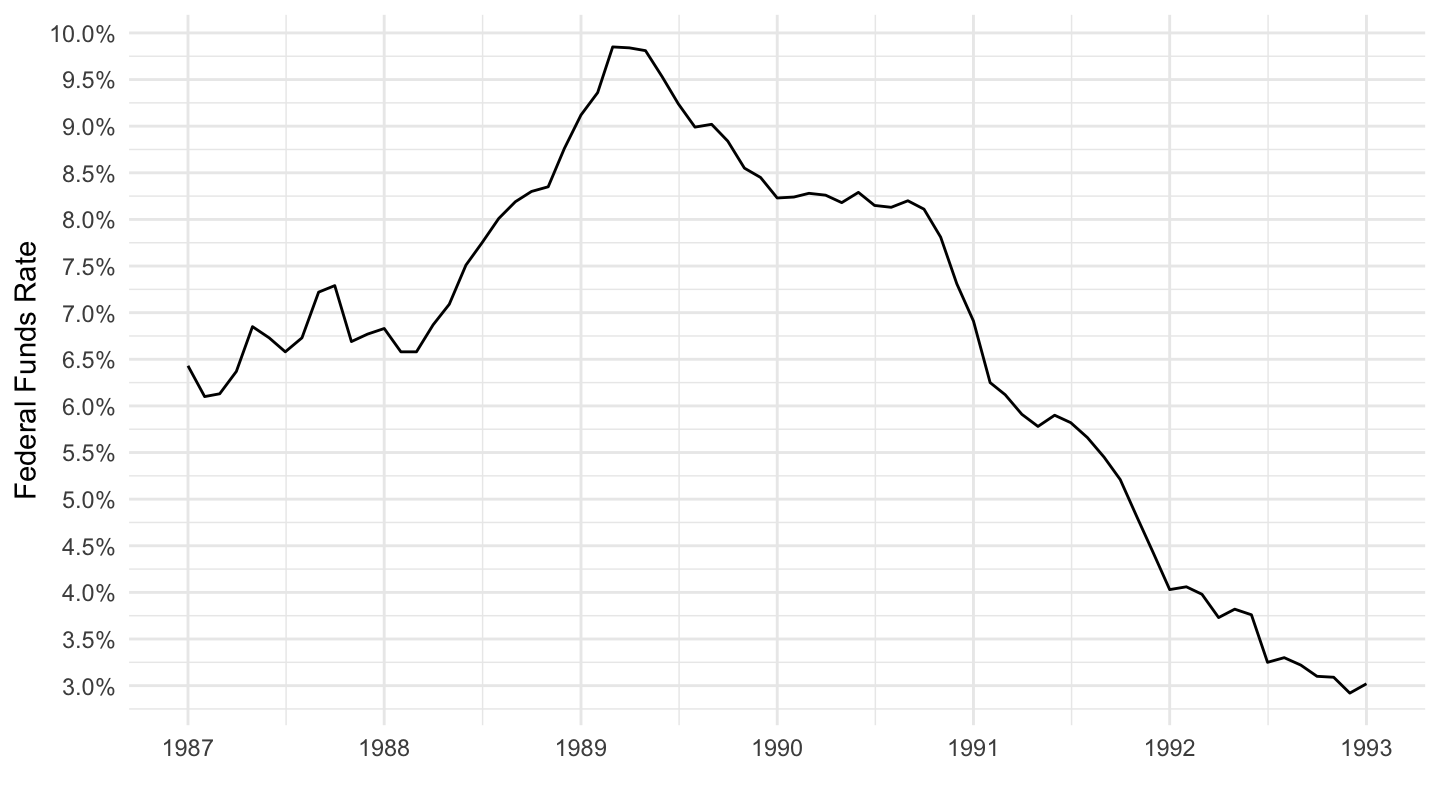
Fed Funds Rate, AAA, BAA
2000
Code
r %>%
  filter(variable %in% c("FEDFUNDS")) %>%
  filter(date >= as.Date("1994-01-01")) %>%
  mutate(value = value / 100) %>%
  ggplot(.) + geom_line(aes(x = date, y = value)) + theme_minimal() +
  scale_x_date(breaks = seq(1870, 2050, 2) %>% paste0("-01-01") %>% as.Date,
               labels = date_format("%Y")) +
  scale_y_continuous(breaks = 0.01*seq(0, 15, 0.5),
                     labels = scales::percent_format(accuracy = 0.5)) +
  xlab("") + ylab("Federal Funds Rate (%)") +
  geom_vline(xintercept = as.Date("2008-09-15"), linetype = "dashed", color = viridis(3)[2]) +
    geom_rect(data = data_frame(start = as.Date("2004-06-01"),
                                end = as.Date("2007-08-01")),
              aes(xmin = start, xmax = end, ymin = -Inf, ymax = +Inf),
              fill = viridis(4)[4], alpha = 0.2) +
    geom_vline(xintercept = as.Date("2004-06-01"), linetype = "dashed", color = viridis(4)[4]) +
    geom_vline(xintercept = as.Date("2007-08-01"), linetype = "dashed", color = viridis(4)[4])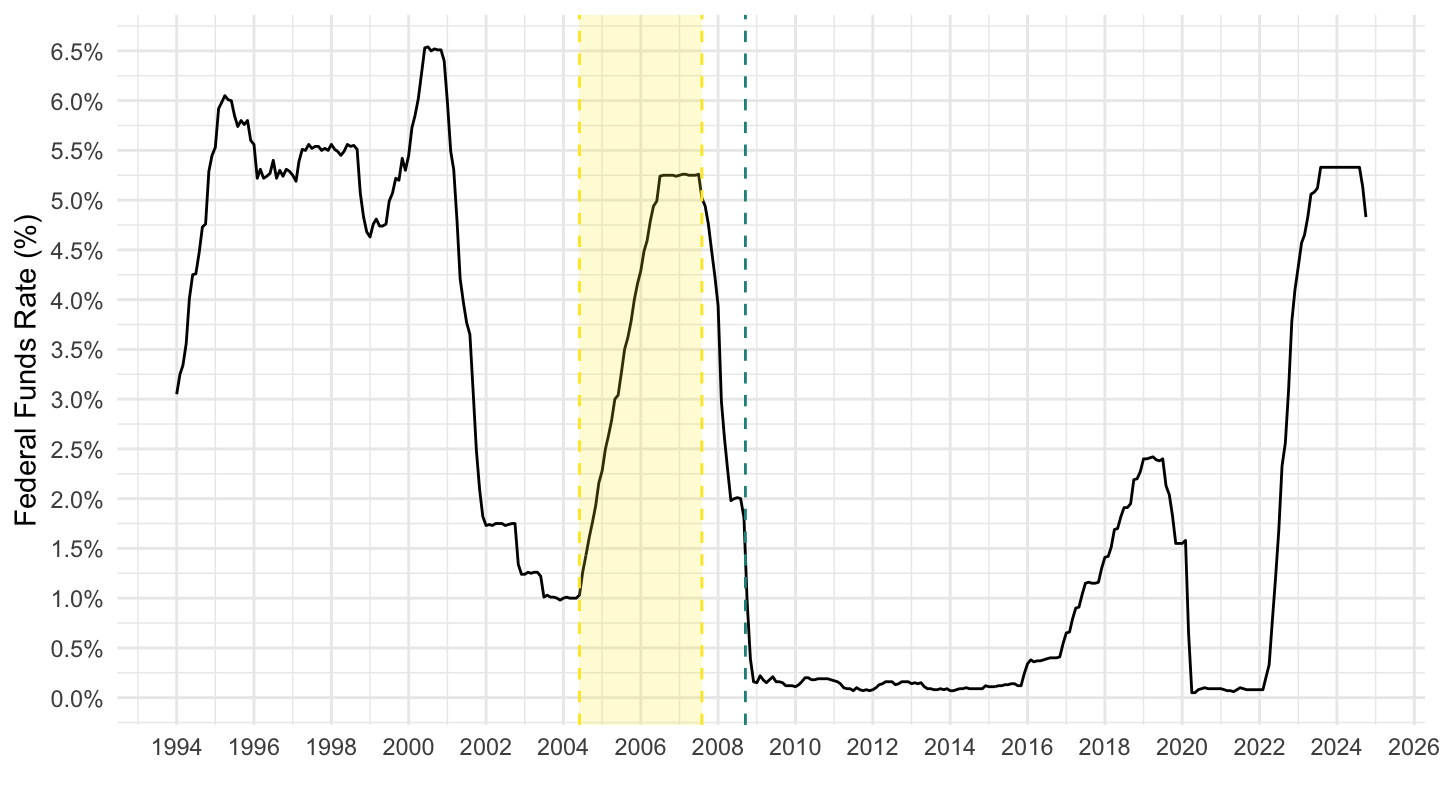
2002-2007 Hiking Cycle
Code
r %>%
  filter(variable %in% c("FEDFUNDS")) %>%
  filter(date >= as.Date("2002-01-01"),
         date <= as.Date("2012-01-01")) %>%
  mutate(value = value / 100) %>%
  ggplot(.) + geom_line(aes(x = date, y = value)) + theme_minimal() +
  scale_x_date(breaks = seq(1870, 2100, 1) %>% paste0("-01-01") %>% as.Date,
               labels = date_format("%Y")) +
  scale_y_continuous(breaks = 0.01*seq(0, 15, 0.5),
                     labels = scales::percent_format(accuracy = 0.5)) +
  xlab("") + ylab("Federal Funds Rate (%)") +
  geom_vline(xintercept = as.Date("2008-09-15"), linetype = "dashed", color = viridis(3)[2]) +
    geom_rect(data = data_frame(start = as.Date("2004-06-01"),
                                end = as.Date("2007-08-01")),
              aes(xmin = start, xmax = end, ymin = -Inf, ymax = +Inf),
              fill = viridis(4)[4], alpha = 0.2) +
    geom_vline(xintercept = as.Date("2004-06-01"), linetype = "dashed", color = viridis(4)[4]) +
    geom_vline(xintercept = as.Date("2007-08-01"), linetype = "dashed", color = viridis(4)[4])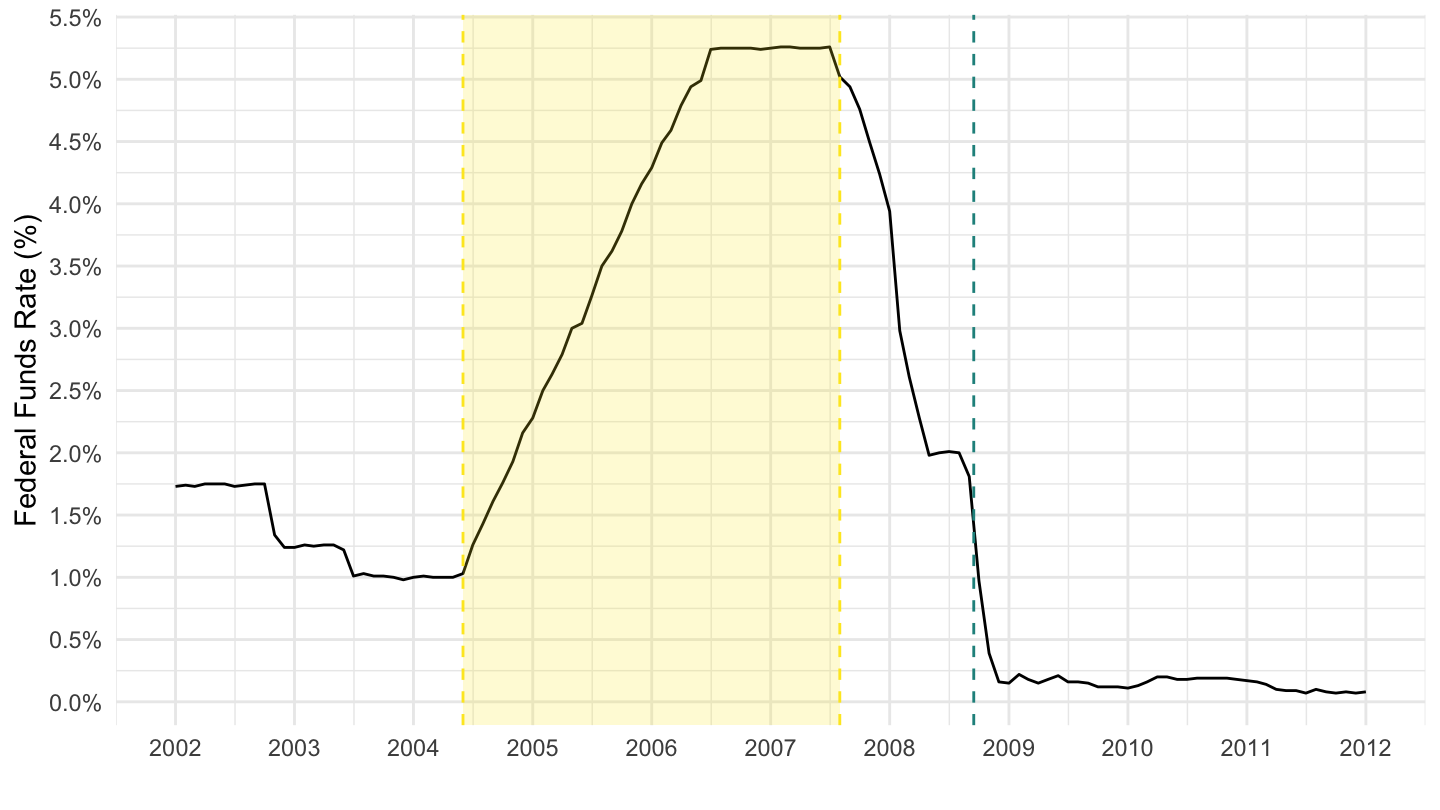
2004-2007 Hiking Cycle
Code
r %>%
  filter(variable %in% c("FEDFUNDS")) %>%
  filter(date >= as.Date("2004-01-01"),
         date <= as.Date("2012-01-01")) %>%
  mutate(value = value / 100) %>%
  ggplot(.) + geom_line(aes(x = date, y = value)) + theme_minimal() +
  scale_x_date(breaks = seq(1870, 2100, 1) %>% paste0("-01-01") %>% as.Date,
               labels = date_format("%Y")) +
  scale_y_continuous(breaks = 0.01*seq(0, 15, 0.5),
                     labels = scales::percent_format(accuracy = 0.5)) +
  xlab("") + ylab("Federal Funds Rate") +
  geom_vline(xintercept = as.Date("2008-09-15"), linetype = "dashed", color = viridis(3)[2]) +
    geom_rect(data = data_frame(start = as.Date("2004-06-01"),
                                end = as.Date("2007-08-01")),
              aes(xmin = start, xmax = end, ymin = -Inf, ymax = +Inf),
              fill = viridis(4)[4], alpha = 0.2) +
    geom_vline(xintercept = as.Date("2004-06-01"), linetype = "dashed", color = viridis(4)[4]) +
    geom_vline(xintercept = as.Date("2007-08-01"), linetype = "dashed", color = viridis(4)[4])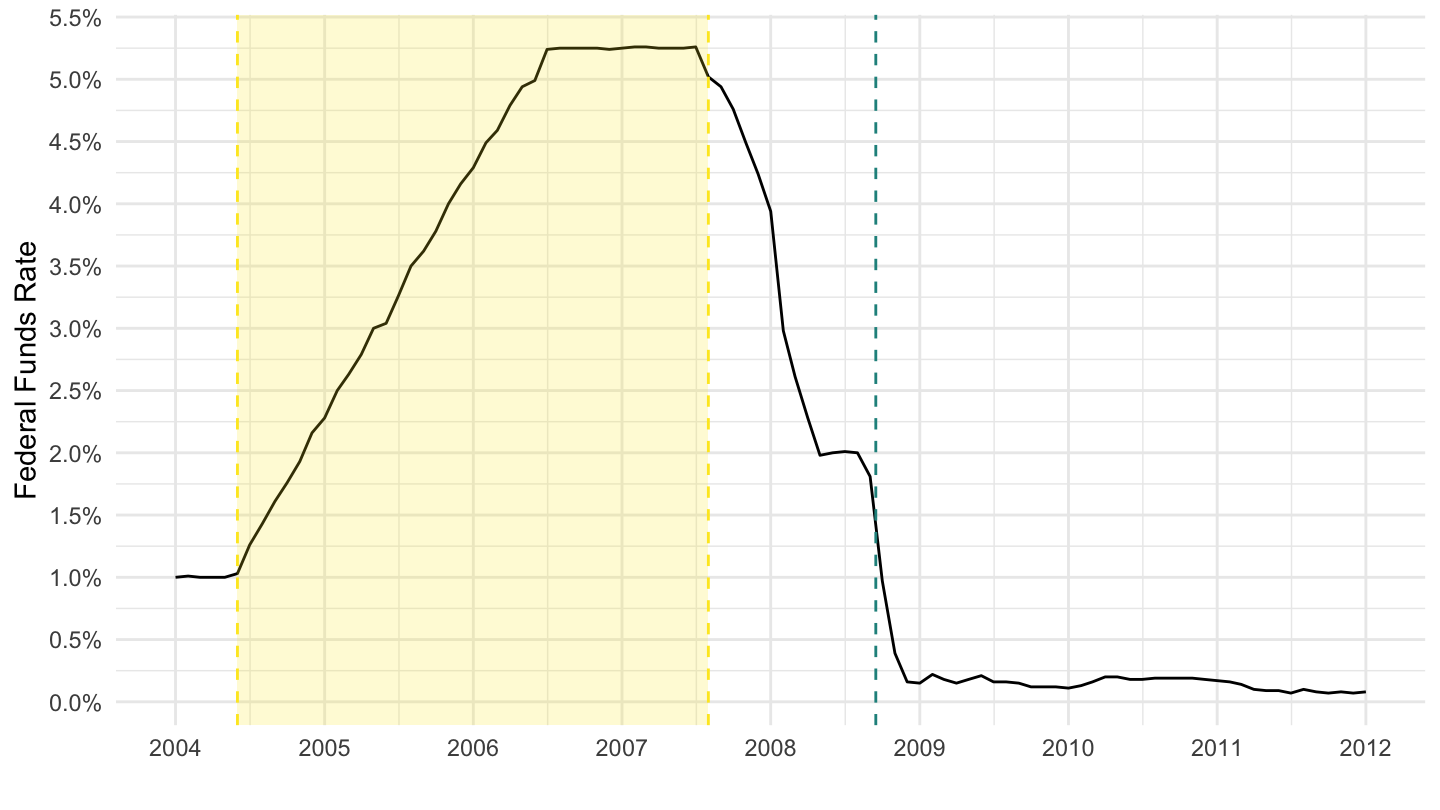
2000-2012
Code
r %>%
  filter(variable %in% c("FEDFUNDS")) %>%
  filter(date >= as.Date("2000-01-01"),
         date <= as.Date("2012-01-01")) %>%
  mutate(value = value / 100) %>%
  ggplot(.) + geom_line(aes(x = date, y = value)) + theme_minimal() +
  scale_x_date(breaks = seq(1870, 2100, 1) %>% paste0("-01-01") %>% as.Date,
               labels = date_format("%Y")) +
  scale_y_continuous(breaks = 0.01*seq(0, 15, 0.5),
                     labels = scales::percent_format(accuracy = 0.5)) +
  xlab("") + ylab("Federal Funds Rate") +
  geom_vline(xintercept = as.Date("2008-09-15"), linetype = "dashed", color = viridis(3)[2]) +
    geom_rect(data = data_frame(start = as.Date("2004-06-01"),
                                end = as.Date("2007-08-01")),
              aes(xmin = start, xmax = end, ymin = -Inf, ymax = +Inf),
              fill = viridis(4)[4], alpha = 0.2) +
    geom_vline(xintercept = as.Date("2004-06-01"), linetype = "dashed", color = viridis(4)[4]) +
    geom_vline(xintercept = as.Date("2007-08-01"), linetype = "dashed", color = viridis(4)[4])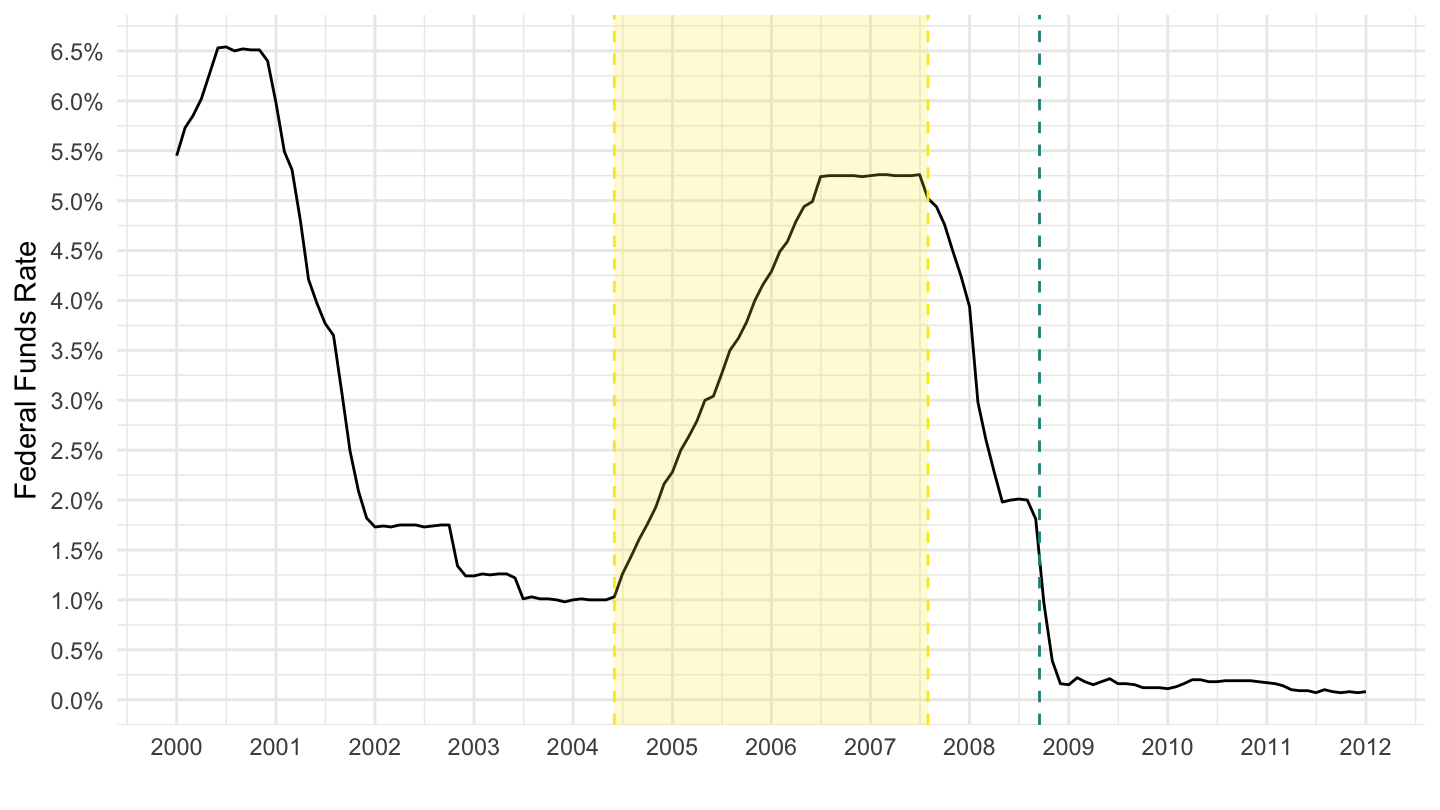
1920-
Code
r %>%
  filter(variable %in% c("AAA", "BAA", "FEDFUNDS")) %>%
  left_join(variable, by = "variable") %>%
  ggplot(.) + ylab("Corporate Bond Interest Rate (%)") + xlab("") + theme_minimal() +
  geom_line(aes(x = date, y = value / 100, color = Variable, linetype = Variable)) +

  scale_x_date(breaks = as.Date(paste0(seq(1920, 2100, 5), "-01-01")),
               labels = date_format("%Y")) +
  scale_y_continuous(breaks = 0.01*seq(0, 30, 2),
                     labels = scales::percent_format(accuracy = 1)) +
  geom_rect(data = nber_recessions %>%
              filter(Peak > as.Date("1920-01-01")),
            aes(xmin = Peak, xmax = Trough, ymin = -Inf, ymax = +Inf),
            fill = 'grey', alpha = 0.5) +
  theme(legend.position = c(0.3, 0.8),
        legend.title = element_blank())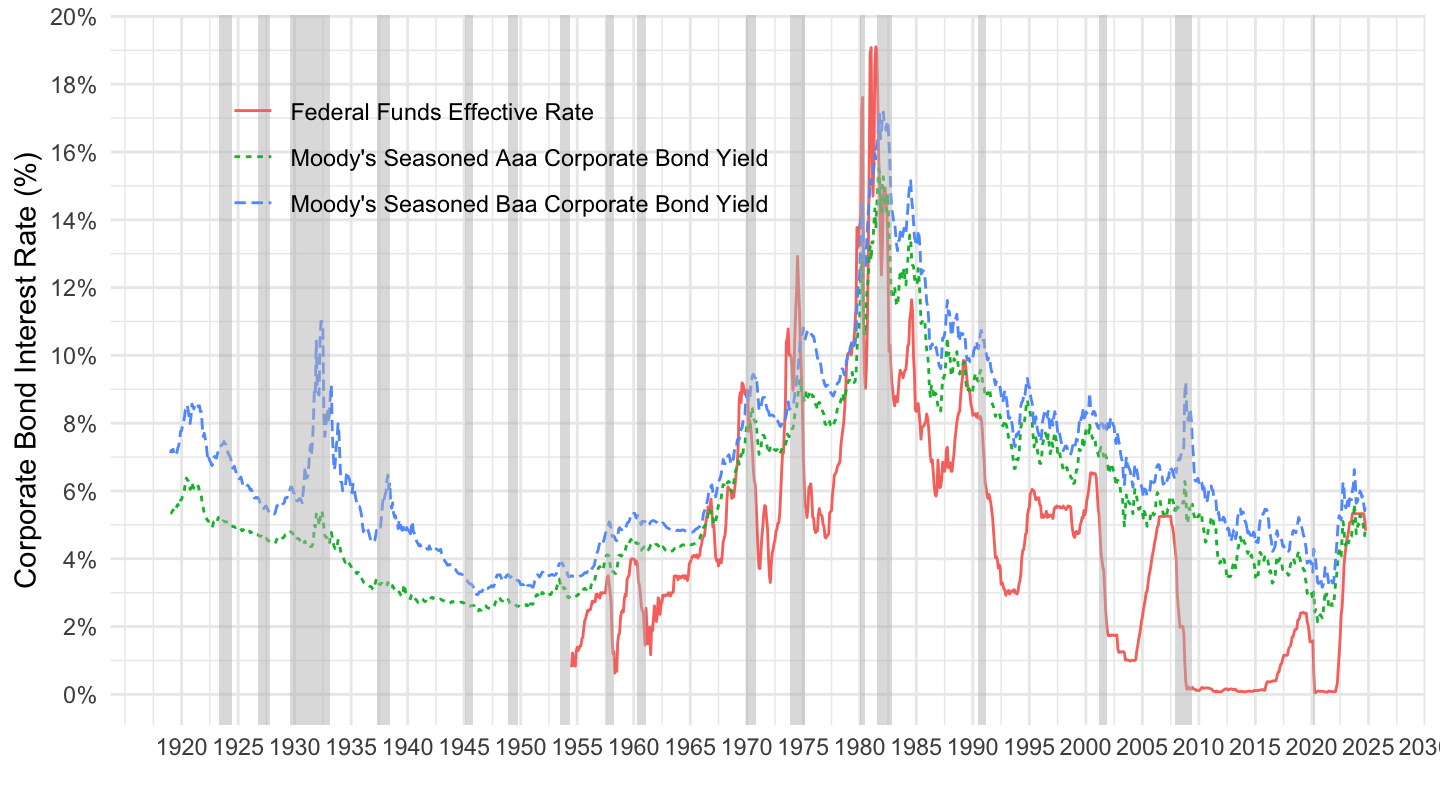
1969-
Code
r %>%
  filter(variable %in% c("AAA", "FEDFUNDS"),
         date >= as.Date("1969-01-01")) %>%
  left_join(variable, by = "variable") %>%
  ggplot(.) + ylab("Interest Rate (%)") + xlab("") + theme_minimal() +
  geom_line(aes(x = date, y = value / 100, color = Variable, linetype = Variable)) +

  scale_x_date(breaks = as.Date(paste0(seq(1920, 2100, 5), "-01-01")),
               labels = date_format("%Y")) +
  scale_y_continuous(breaks = 0.01*seq(0, 30, 2),
                     labels = scales::percent_format(accuracy = 1)) +
  geom_rect(data = nber_recessions %>%
              filter(Peak > as.Date("1969-01-01")),
            aes(xmin = Peak, xmax = Trough, ymin = -Inf, ymax = +Inf),
            fill = 'grey', alpha = 0.5) +
  theme(legend.position = c(0.7, 0.8),
        legend.title = element_blank())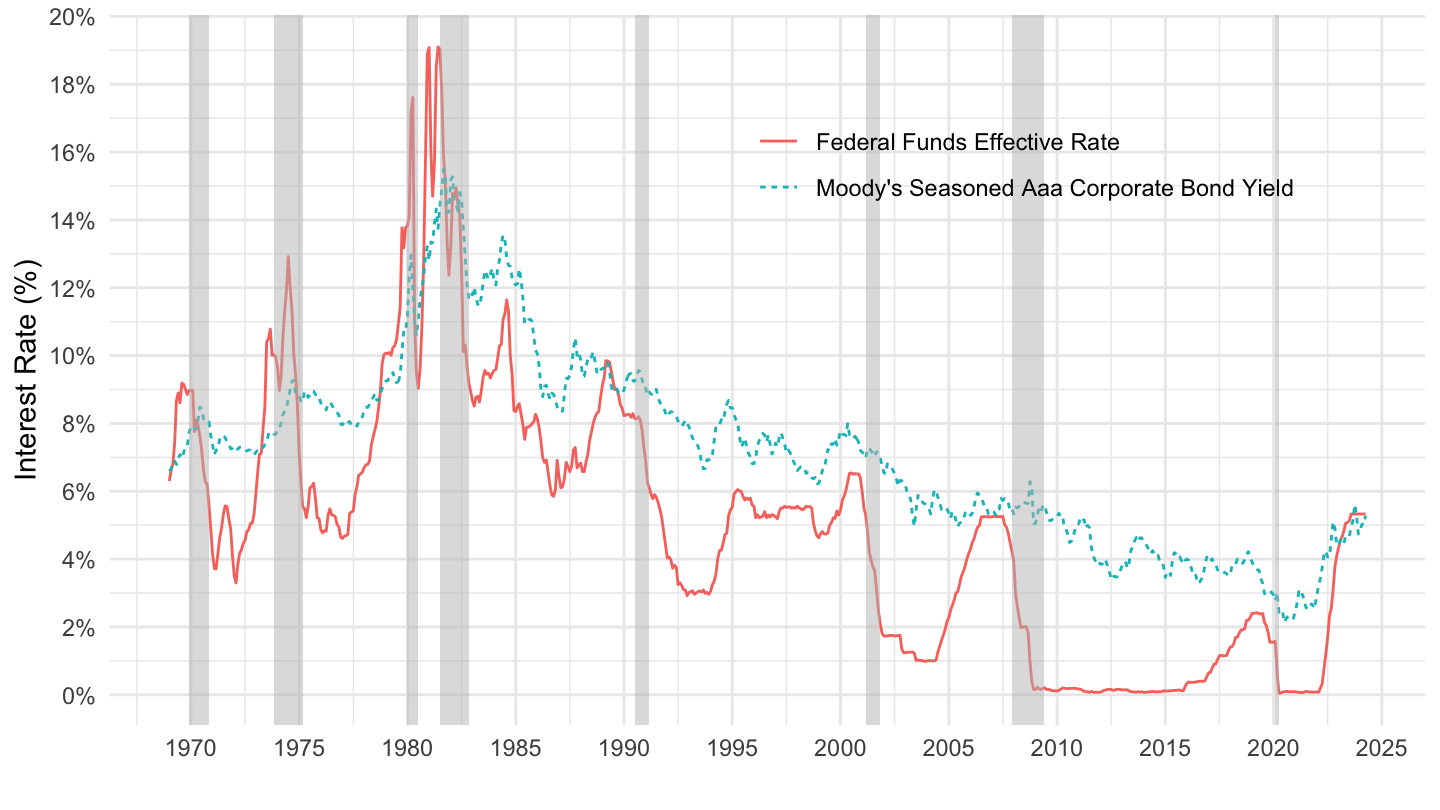
DGS - 10-Year Treasury Rate
All-
Code
r %>%
  filter(variable %in% c("DGS10", "DGS20", "DGS30")) %>%
  left_join(variable, by = "variable") %>%
  ggplot(.) + ylab("Treasury Rate (%)") + xlab("") + theme_minimal() +
  geom_line(aes(x = date, y = value / 100, color = Variable, linetype = Variable)) +
  geom_rect(data = nber_recessions %>%
              filter(Peak > as.Date("1960-01-01")),
            aes(xmin = Peak, xmax = Trough, ymin = -Inf, ymax = +Inf),
            fill = 'grey', alpha = 0.5) +
  theme(legend.title = element_blank(),
        legend.position = c(0.5, 0.9)) +
  scale_x_date(breaks = as.Date(paste0(seq(1960, 2100, 5), "-01-01")),
               labels = date_format("%Y")) +
  scale_y_continuous(breaks = seq(-0.01, 0.22, 0.01),
                     labels = scales::percent_format(accuracy = 1))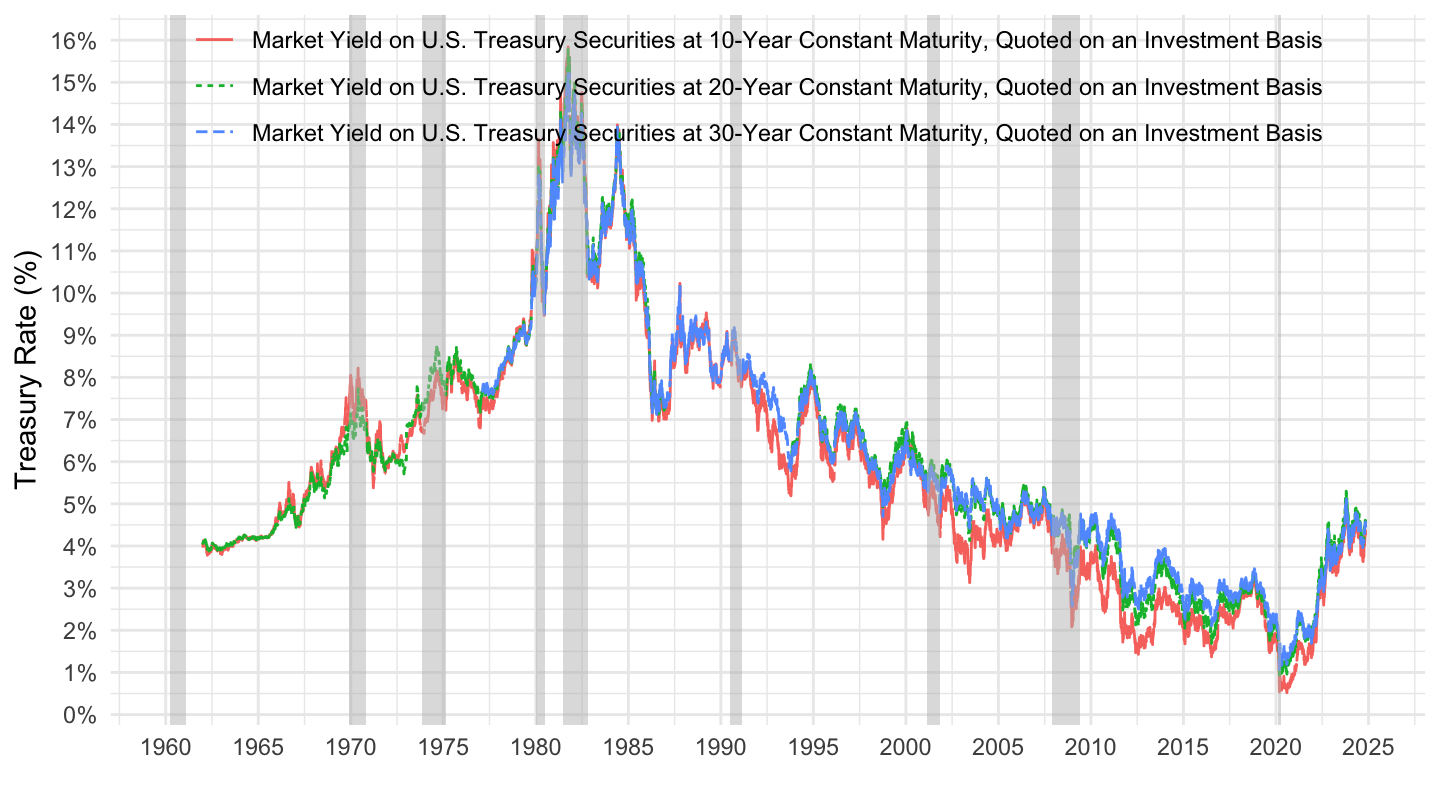
2000-
Code
r %>%
  filter(variable %in% c("DGS10", "DGS20", "DGS30"),
         date >= as.Date("2000-01-01")) %>%
  left_join(variable, by = "variable") %>%
  ggplot(.) + ylab("Treasury Rate (%)") + xlab("") + theme_minimal() +
  geom_line(aes(x = date, y = value / 100, color = Variable, linetype = Variable)) +
  #
  geom_rect(data = nber_recessions %>%
              filter(Peak > as.Date("2000-01-01")),
            aes(xmin = Peak, xmax = Trough, ymin = -Inf, ymax = +Inf),
            fill = 'grey', alpha = 0.5) +
  theme(legend.title = element_blank(),
        legend.position = c(0.5, 0.9)) +
  scale_x_date(breaks = as.Date(paste0(seq(1990, 2100, 2), "-01-01")),
               labels = date_format("%Y")) +
  scale_y_continuous(breaks = seq(-0.01, 0.12, 0.01),
                     labels = scales::percent_format(accuracy = 1))
2010-
Code
r %>%
  filter(variable %in% c("DGS10", "DGS20", "DGS30"),
         date >= as.Date("2010-01-01")) %>%
  left_join(variable, by = "variable") %>%
  ggplot(.) + ylab("Treasury Rate (%)") + xlab("") + theme_minimal() +
  geom_line(aes(x = date, y = value / 100, color = Variable, linetype = Variable)) +
  #
  theme(legend.title = element_blank(),
        legend.position = c(0.5, 0.9)) +
  scale_x_date(breaks = as.Date(paste0(seq(1990, 2100, 1), "-01-01")),
               labels = date_format("%Y")) +
  scale_y_continuous(breaks = seq(-0.01, 0.12, 0.01),
                     labels = scales::percent_format(accuracy = 1))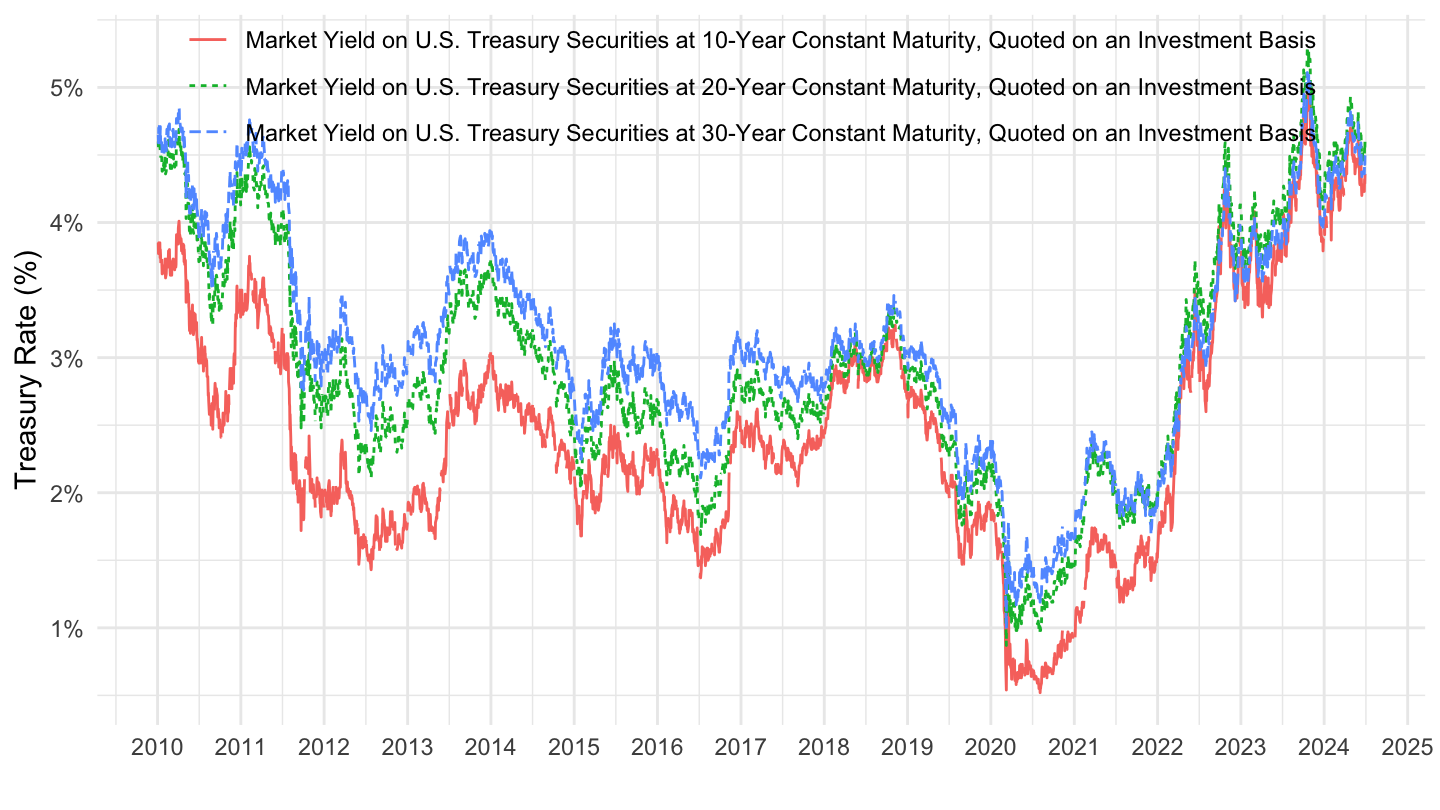
DFII - Treasury Inflation-Indexed Security
All
Code
r %>%
  filter(variable %in% c("DFII10", "DFII20", "DFII30")) %>%
  left_join(tibble(variable = c("DFII10", "DFII20", "DFII30"),
                   Variable = c("Inflation Indexed 10-Year",
                                "Inflation Indexed 20-Year",
                                "Inflation Indexed 30-Year")), by = "variable") %>%
  ggplot(.) + ylab("Treasury Inflation-Indexed Security Rate (%)") + xlab("") + theme_minimal() +
  geom_line(aes(x = date, y = value / 100, color = Variable, linetype = Variable)) +
  #
  geom_rect(data = nber_recessions %>%
              filter(Peak > as.Date("2002-01-01")),
            aes(xmin = Peak, xmax = Trough, ymin = -Inf, ymax = +Inf),
            fill = 'grey', alpha = 0.5) +
  theme(legend.title = element_blank(),
        legend.position = c(0.7, 0.9)) +
  scale_x_date(breaks = as.Date(paste0(seq(1990, 2100, 2), "-01-01")),
               labels = date_format("%Y")) +
  scale_y_continuous(breaks = seq(-0.01, 0.12, 0.01),
                     labels = scales::percent_format(accuracy = 1))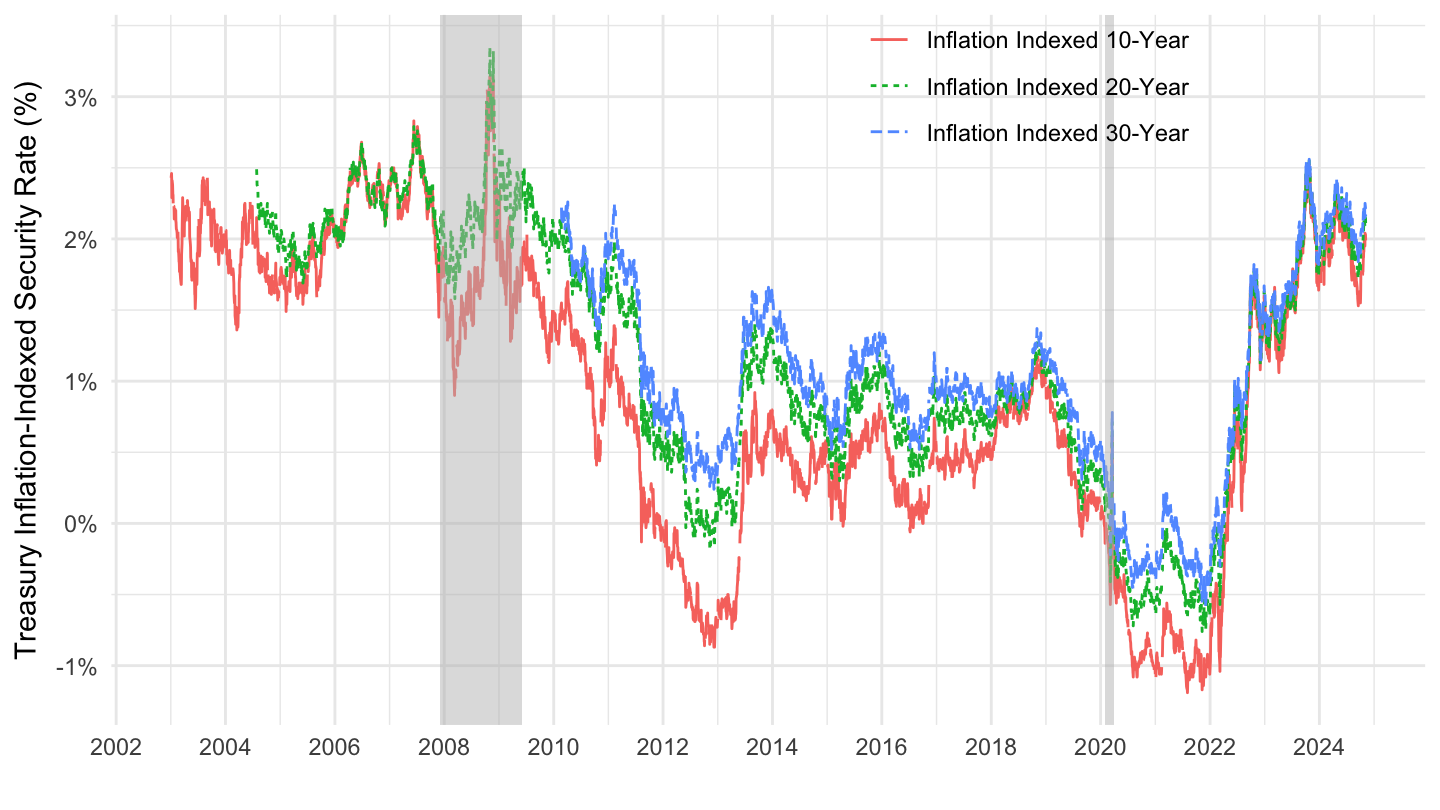
2017-
Code
r %>%
  filter(variable %in% c("DFII10", "DFII20", "DFII30")) %>%
  filter(date >= as.Date("2017-01-01")) %>%
  left_join(tibble(variable = c("DFII10", "DFII20", "DFII30"),
                   Variable = c("Inflation Indexed 10-Year",
                                "Inflation Indexed 20-Year",
                                "Inflation Indexed 30-Year")), by = "variable") %>%
  ggplot(.) + ylab("Treasury Inflation-Indexed Security Rate (%)") + xlab("") + theme_minimal() +
  geom_line(aes(x = date, y = value / 100, color = Variable)) +
  #
  geom_rect(data = nber_recessions %>%
              filter(Peak > as.Date("2017-01-01")),
            aes(xmin = Peak, xmax = Trough, ymin = -Inf, ymax = +Inf),
            fill = 'grey', alpha = 0.5) +
  theme(legend.title = element_blank(),
        legend.position = c(0.7, 0.9)) +
  scale_x_date(breaks = as.Date(paste0(seq(1990, 2100, 1), "-01-01")),
               labels = date_format("%Y")) +
  scale_y_continuous(breaks = seq(-0.01, 0.12, 0.005),
                     labels = scales::percent_format(accuracy = .1))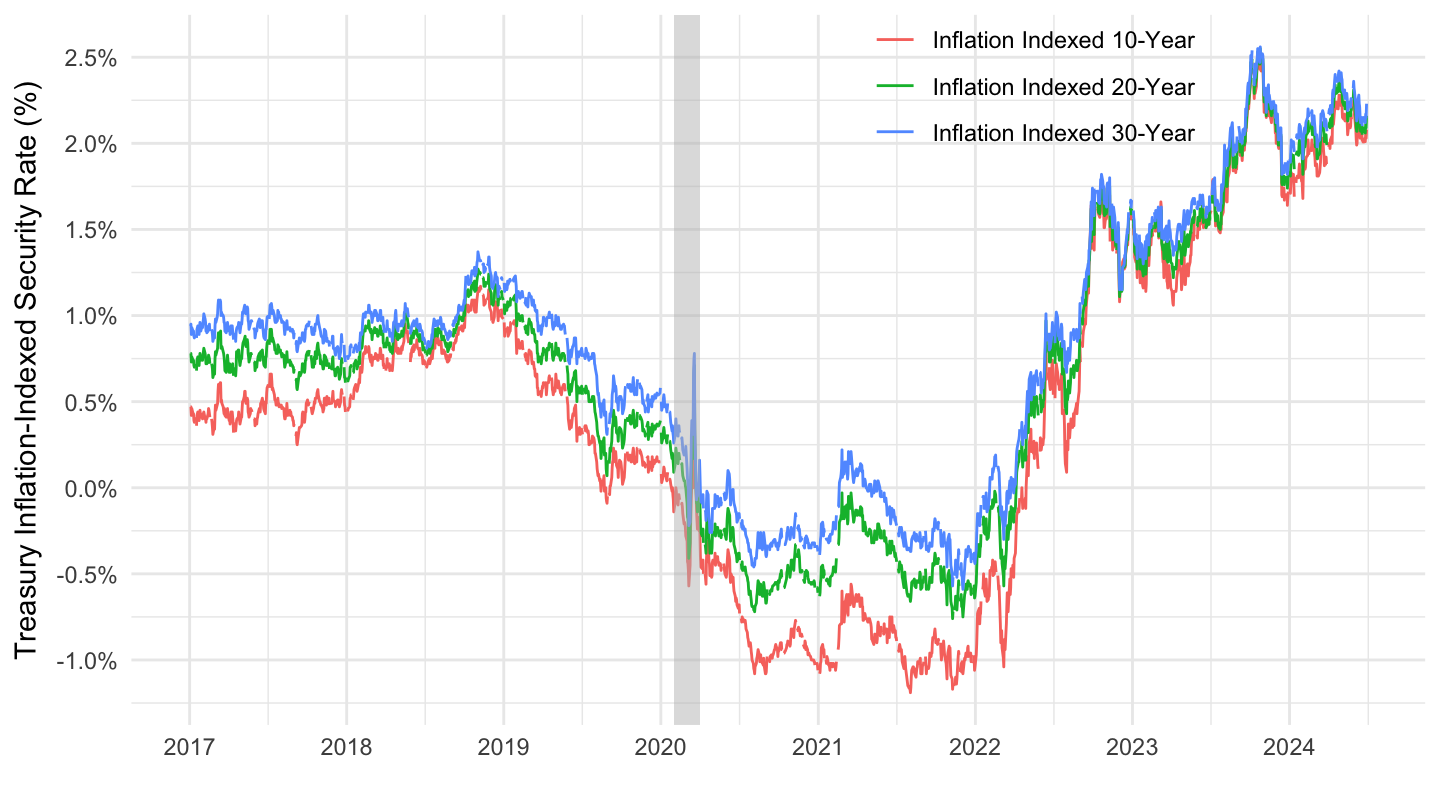
AAA / BAA Moody’s
1920 -
All
Code
r %>%
  filter(variable %in% c("AAA", "BAA")) %>%
  left_join(variable, by = "variable") %>%
  ggplot(.) + ylab("Corporate Bond Interest Rate (%)") + xlab("") + theme_minimal() +
  geom_line(aes(x = date, y = value / 100, color = Variable, linetype = Variable)) +
  #
  scale_x_date(breaks = as.Date(paste0(seq(1920, 2025, 10), "-01-01")),
               labels = date_format("%Y")) +
  scale_y_continuous(breaks = 0.01*seq(0, 30, 2),
                     labels = scales::percent_format(accuracy = 1),
                     limits = c(0.02, 0.18)) +
  geom_rect(data = nber_recessions %>%
              filter(Peak > as.Date("1920-01-01")),
            aes(xmin = Peak, xmax = Trough, ymin = -Inf, ymax = +Inf),
            fill = 'grey', alpha = 0.5) +
  theme(legend.position = c(0.3, 0.8),
        legend.title = element_blank())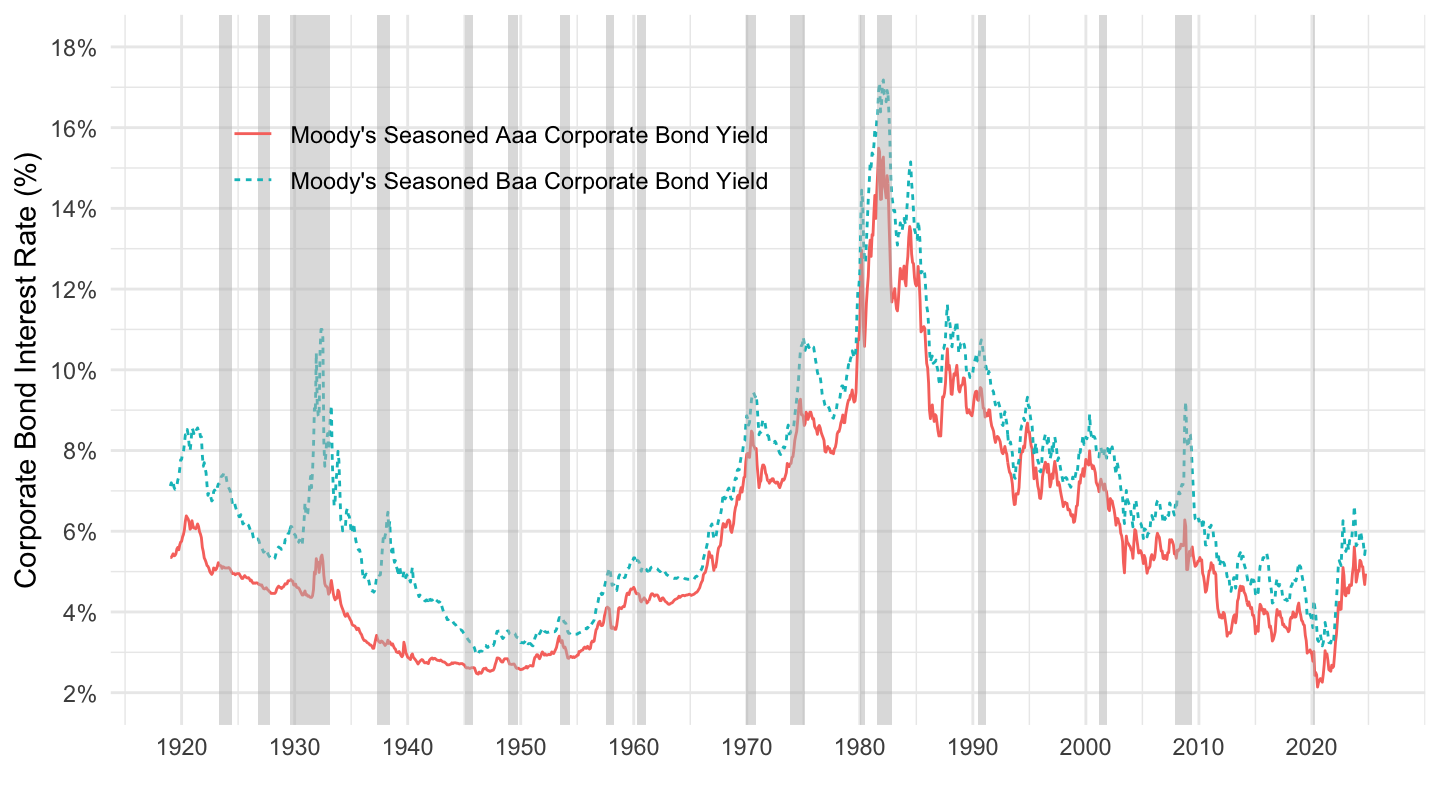
AFGAP Graph
- Association Française des Gestionnaires Actif-Passif - AFGAP. pdf
Code
r %>%
  filter(variable %in% c("AAA", "BAA")) %>%
  left_join(variable, by = "variable") %>%
  ggplot(.) + ylab("Corporate Bond Interest Rate (%)") + xlab("") + theme_minimal() +
  geom_line(aes(x = date, y = value / 100, color = Variable)) +
  scale_color_manual(values = c("#2D68C4", "#F2A900")) +
  scale_x_date(breaks = as.Date(paste0(seq(1920, 2100, 10), "-01-01")),
               labels = date_format("%Y")) +
  scale_y_continuous(breaks = 0.01*seq(0, 30, 2),
                     labels = scales::percent_format(accuracy = 1),
                     limits = c(0.02, 0.18)) +
  geom_rect(data = nber_recessions %>%
              filter(Peak > as.Date("1920-01-01")),
            aes(xmin = Peak, xmax = Trough, ymin = -Inf, ymax = +Inf),
            fill = 'grey', alpha = 0.5) +
  theme(legend.position = c(0.3, 0.8),
        legend.title = element_blank())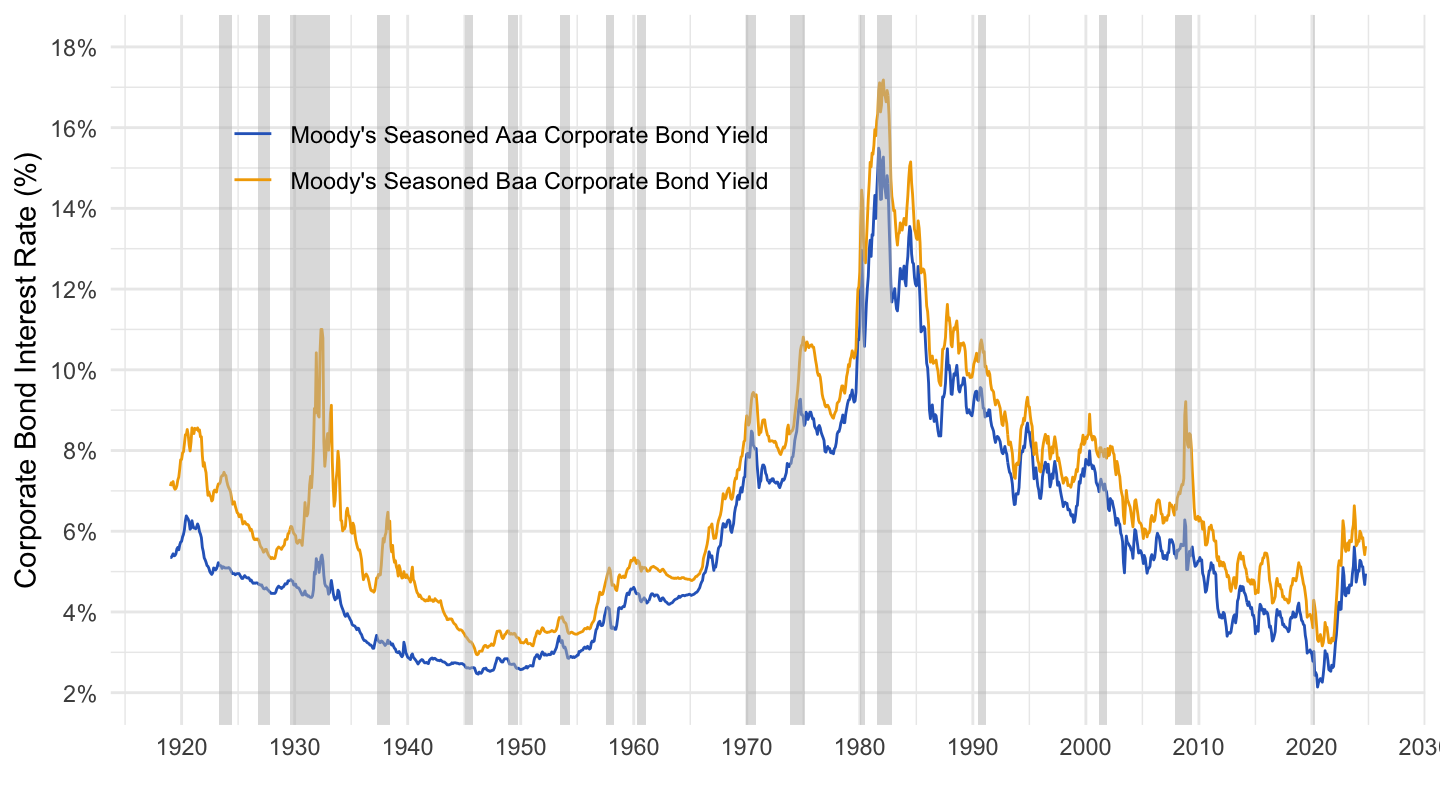
1980 -
Code
r %>%
  filter(variable %in% c("AAA", "BAA"),
         date >= as.Date("1980-01-01")) %>%
  left_join(variable, by = "variable") %>%
  filter(date >= as.Date("1980-01-01")) %>%
  ggplot(.) + ylab("U.S. Interest Rate (%)") + xlab("") + theme_minimal() +
  geom_line(aes(x = date, y = value / 100, color = Variable, linetype = Variable)) +

  scale_x_date(breaks = as.Date(paste0(seq(1980, 2025, 5), "-01-01")),
               labels = date_format("%Y"),) +
  geom_rect(data = nber_recessions %>%
              filter(Peak > as.Date("1980-01-01")),
            aes(xmin = Peak, xmax = Trough, ymin = -Inf, ymax = +Inf),
            fill = 'grey', alpha = 0.5) +
  theme(legend.position = c(0.65, 0.85),
        legend.title = element_blank()) +
  scale_y_continuous(breaks = 0.01*seq(-1, 30, 1),
                     labels = scales::percent_format(accuracy = 1))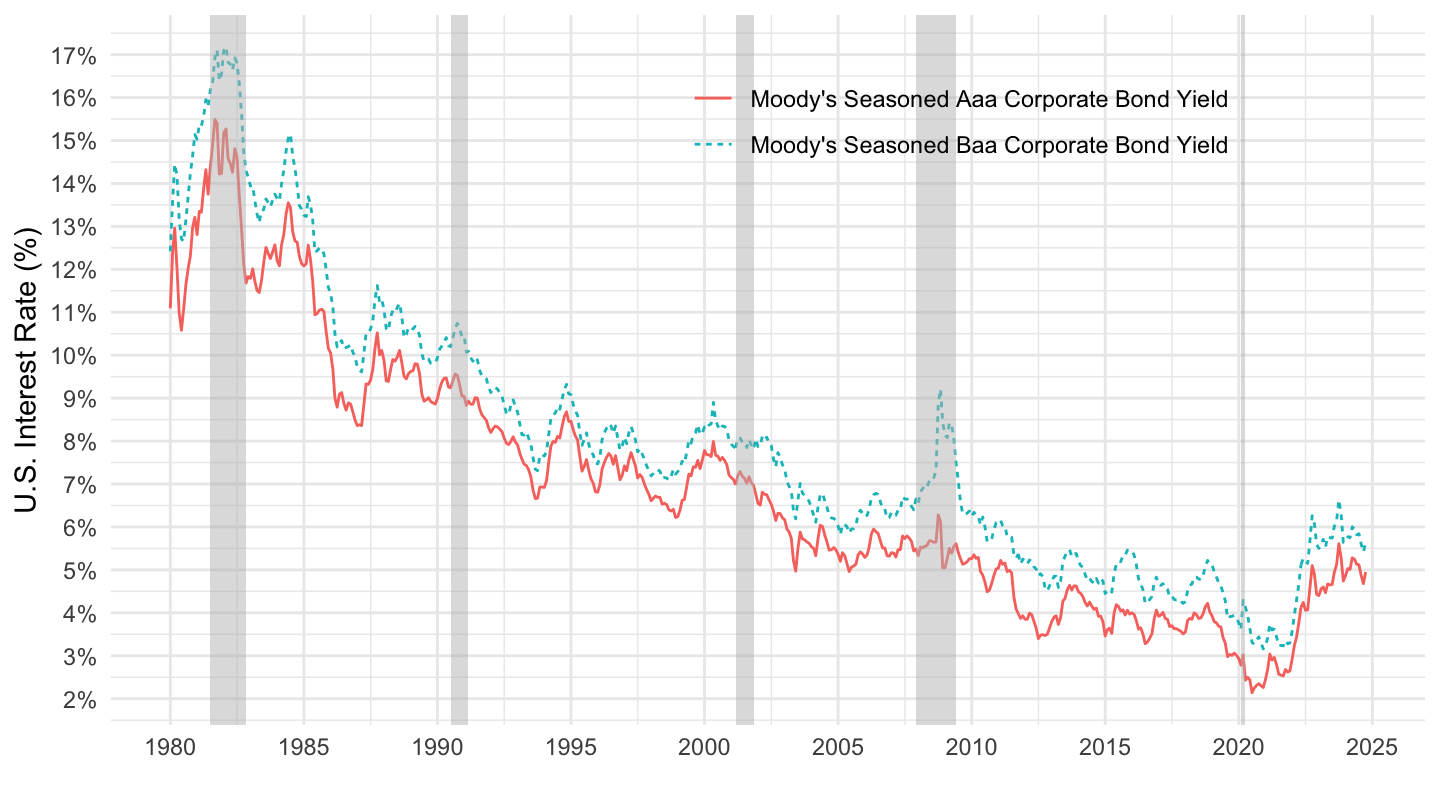
2010 -
Code
r %>%
  filter(variable %in% c("AAA", "BAA"),
         date >= as.Date("2005-01-01")) %>%
  left_join(variable, by = "variable") %>%
  filter(date >= as.Date("1980-01-01")) %>%
  ggplot(.) + ylab("Corporate Bond Yield (%)") + xlab("") + theme_minimal() +
  geom_line(aes(x = date, y = value / 100, color = Variable)) +

  scale_x_date(breaks = as.Date(paste0(seq(1980, 2100, 2), "-01-01")),
               labels = date_format("%Y")) +
  geom_rect(data = nber_recessions %>%
              filter(Peak > as.Date("2005-01-01")),
            aes(xmin = Peak, xmax = Trough, ymin = -Inf, ymax = +Inf),
            fill = 'grey', alpha = 0.5) +
  theme(legend.position = c(0.65, 0.85),
        legend.title = element_blank()) +
  scale_y_continuous(breaks = 0.01*seq(-1, 30, 1),
                     labels = scales::percent_format(accuracy = 1))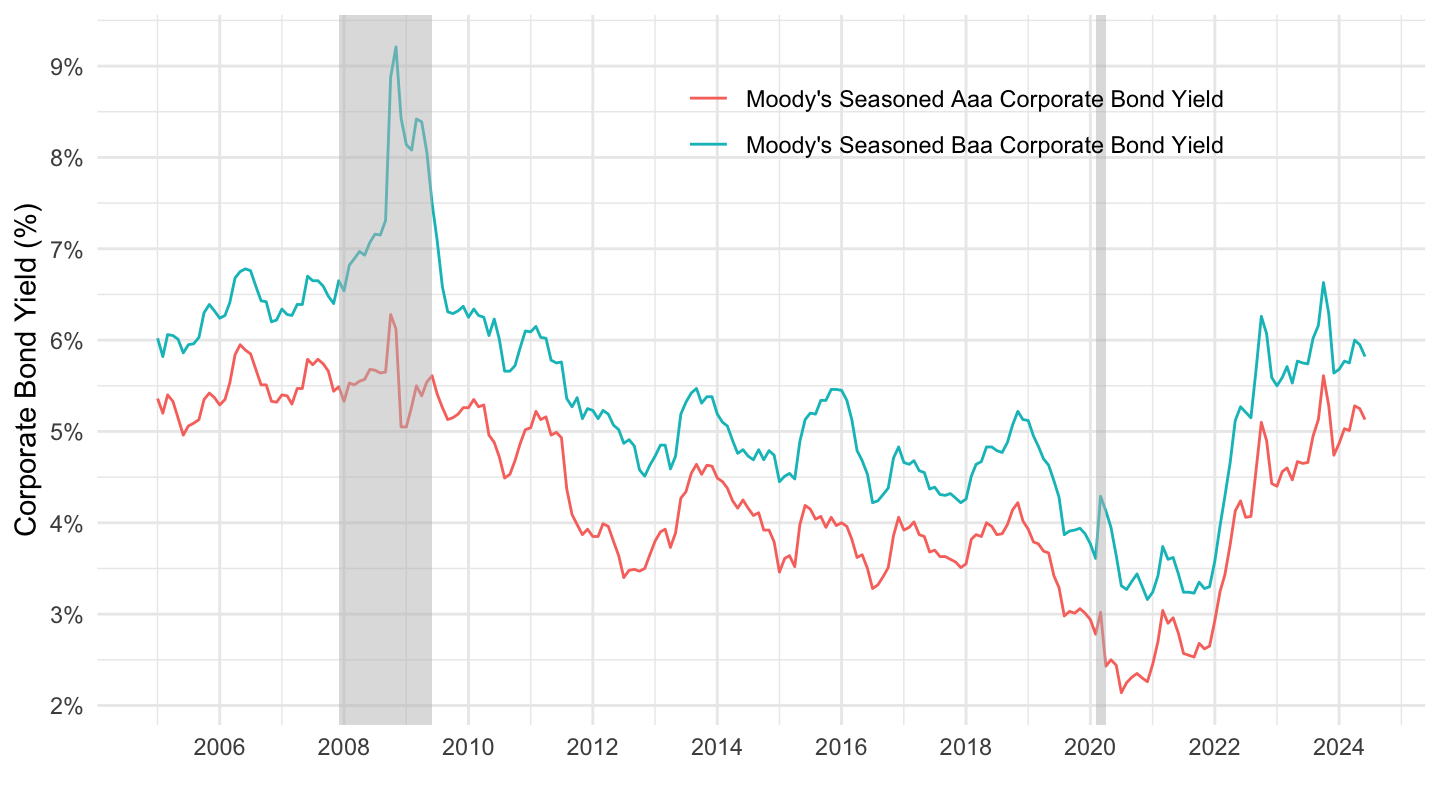
Treasury Yields: AAA, BAA, DGS10, DFII10
All
Code
r %>%
  filter(variable %in% c("AAA", "BAA", "DGS10", "DFII10"),
         date >= as.Date("1980-01-01")) %>%
  left_join(variable, by = "variable") %>%
  filter(date >= as.Date("1980-01-01")) %>%
  ggplot(.) + ylab("U.S. Interest Rate (%)") + xlab("") + theme_minimal() +
  geom_line(aes(x = date, y = value / 100, color = Variable)) +
  scale_x_date(breaks = as.Date(paste0(seq(1980, 2025, 5), "-01-01")),
               labels = date_format("%Y"),) +
  geom_rect(data = nber_recessions %>%
              filter(Peak > as.Date("1980-01-01")),
            aes(xmin = Peak, xmax = Trough, ymin = -Inf, ymax = +Inf),
            fill = 'grey', alpha = 0.5) +
  theme(legend.position = c(0.65, 0.85),
        legend.title = element_blank()) +
  scale_y_continuous(breaks = 0.01*seq(-1, 30, 1),
                     labels = scales::percent_format(accuracy = 1))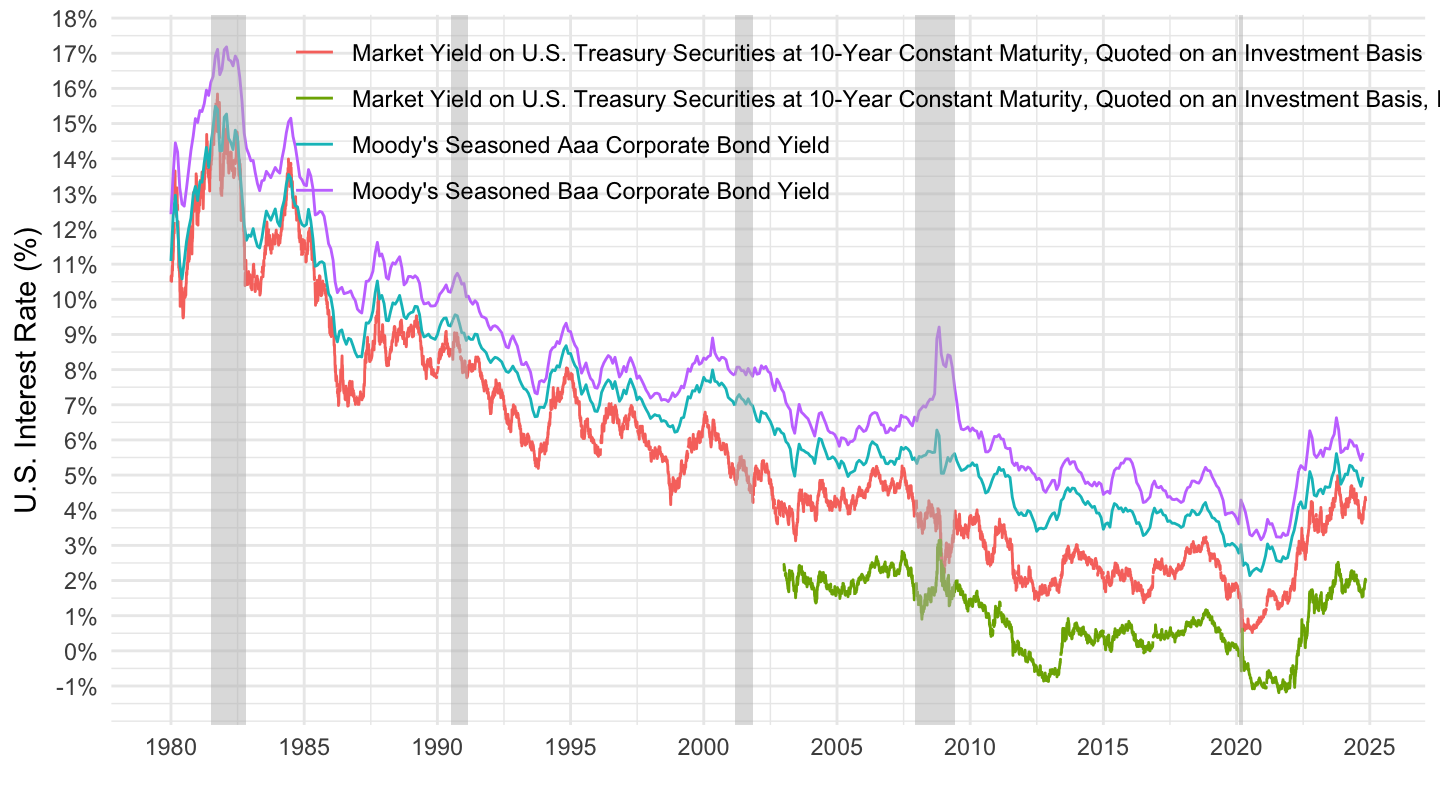
AFGAP
- Association Française des Gestionnaires Actif-Passif - AFGAP. pdf
Code
r %>%
  filter(variable %in% c("DGS10", "DFII10"),
         date >= as.Date("1980-01-01")) %>%
  left_join(variable, by = "variable") %>%
  filter(date >= as.Date("1980-01-01")) %>%
  ggplot(.) + ylab("U.S. Interest Rate (%)") + xlab("") + theme_minimal() +
  geom_line(aes(x = date, y = value / 100, color = Variable)) +
  scale_color_manual(values = c("#2D68C4", "#F2A900")) +
  scale_x_date(breaks = as.Date(paste0(seq(1980, 2025, 5), "-01-01")),
               labels = date_format("%Y"),) +
  geom_rect(data = nber_recessions %>%
              filter(Peak > as.Date("1980-01-01")),
            aes(xmin = Peak, xmax = Trough, ymin = -Inf, ymax = +Inf),
            fill = 'grey', alpha = 0.5) +
  theme(legend.position = c(0.65, 0.85),
        legend.title = element_blank()) +
  scale_y_continuous(breaks = 0.01*seq(-1, 30, 1),
                     labels = scales::percent_format(accuracy = 1))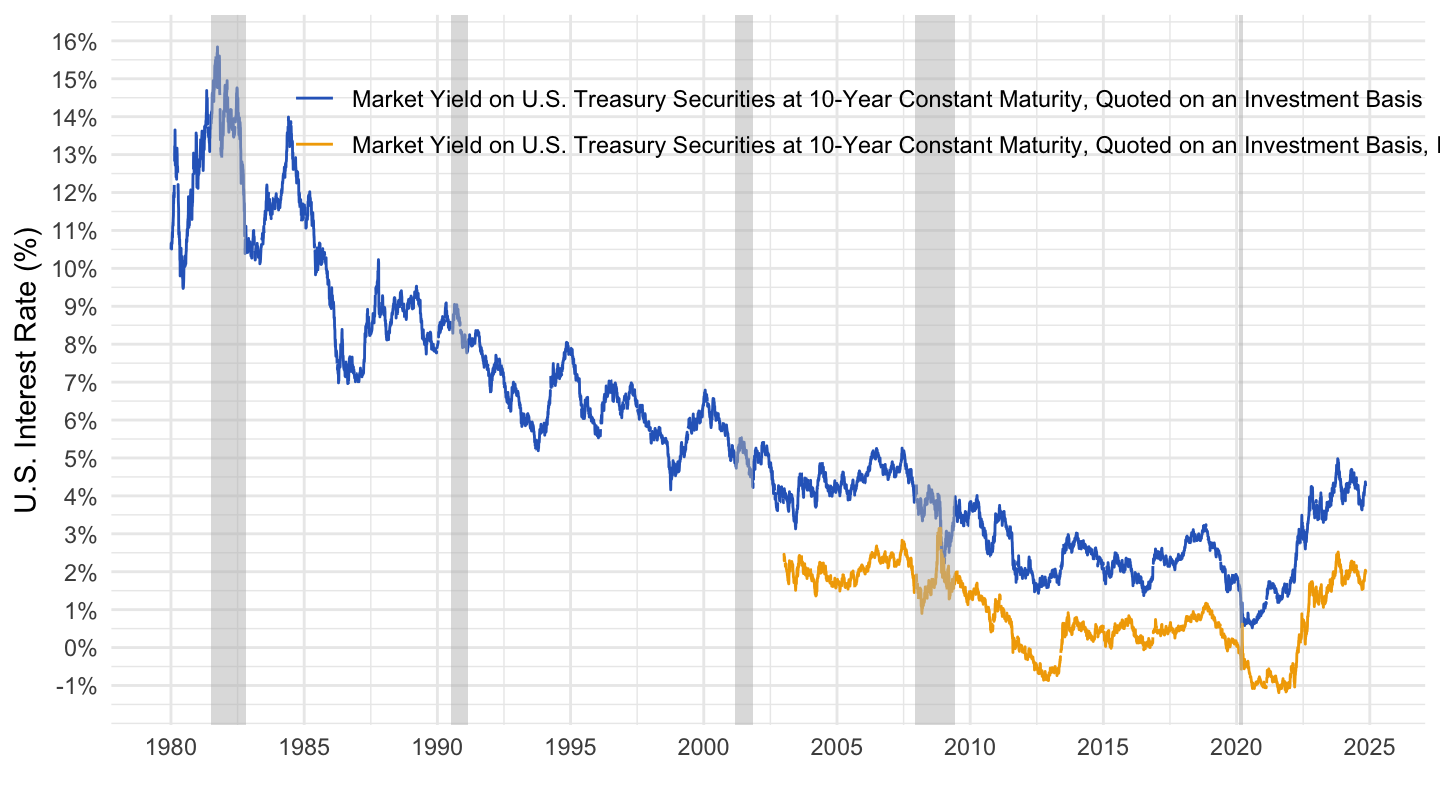
TIPS
Code
r %>%
  filter(variable %in% c("DFII10"),
         date >= as.Date("1980-01-01")) %>%
  left_join(variable, by = "variable") %>%
  filter(date >= as.Date("1980-01-01")) %>%
  ggplot(.) + ylab("Treasury Inflation Protected Securities - TIPS (%)") + xlab("") + theme_minimal() +
  geom_line(aes(x = date, y = value / 100)) +
  scale_x_date(breaks = as.Date(paste0(seq(1980, 2100, 2), "-01-01")),
               labels = date_format("%Y"),) +
  geom_rect(data = nber_recessions %>%
              filter(Peak > as.Date("2002-01-01")),
            aes(xmin = Peak, xmax = Trough, ymin = -Inf, ymax = +Inf),
            fill = 'grey', alpha = 0.5) +
  theme(legend.position = c(0.65, 0.85),
        legend.title = element_blank()) +
  scale_y_continuous(breaks = 0.01*seq(-1, 30, 1),
                     labels = scales::percent_format(accuracy = 1))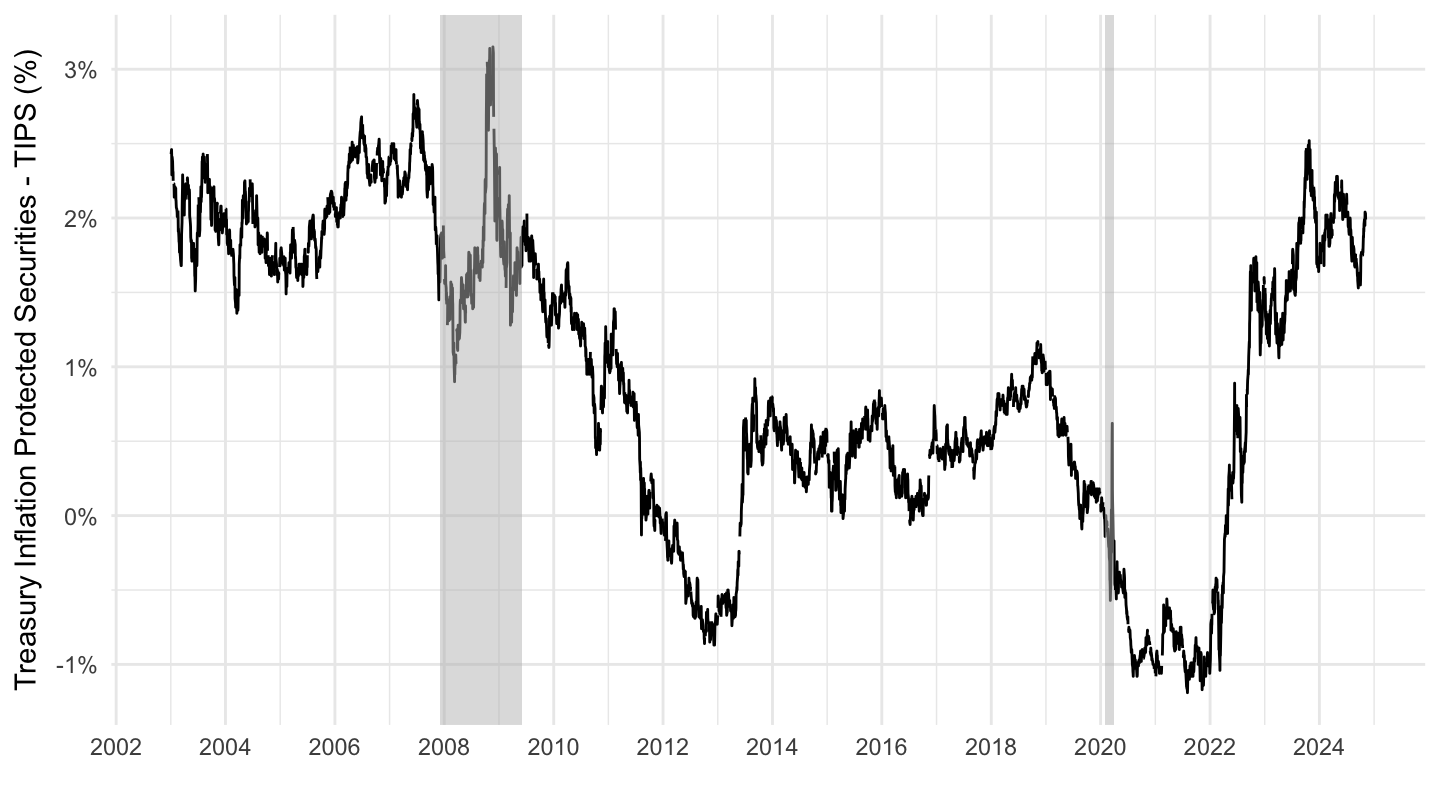
Code
r %>%
  filter(variable %in% c("AAA", "BAA")) %>%
  left_join(variable, by = "variable") %>%
  filter(date >= as.Date("1980-01-01")) %>%
  ggplot(.) + ylab("Corporate Bond Interest Rate (%)") + xlab("") + theme_minimal() +
  geom_line(aes(x = date, y = value / 100, color = Variable, linetype = Variable)) +

  scale_x_date(breaks = as.Date(paste0(seq(1980, 2025, 5), "-01-01")),
               labels = date_format("%Y"),) +
  geom_rect(data = nber_recessions %>%
              filter(Peak > as.Date("1980-01-01")),
            aes(xmin = Peak, xmax = Trough, ymin = -Inf, ymax = +Inf),
            fill = 'grey', alpha = 0.5) +
  theme(legend.position = c(0.45, 0.9),
        legend.title = element_blank()) +
  scale_y_continuous(breaks = 0.01*seq(0, 30, 1),
                     labels = scales::percent_format(accuracy = 1))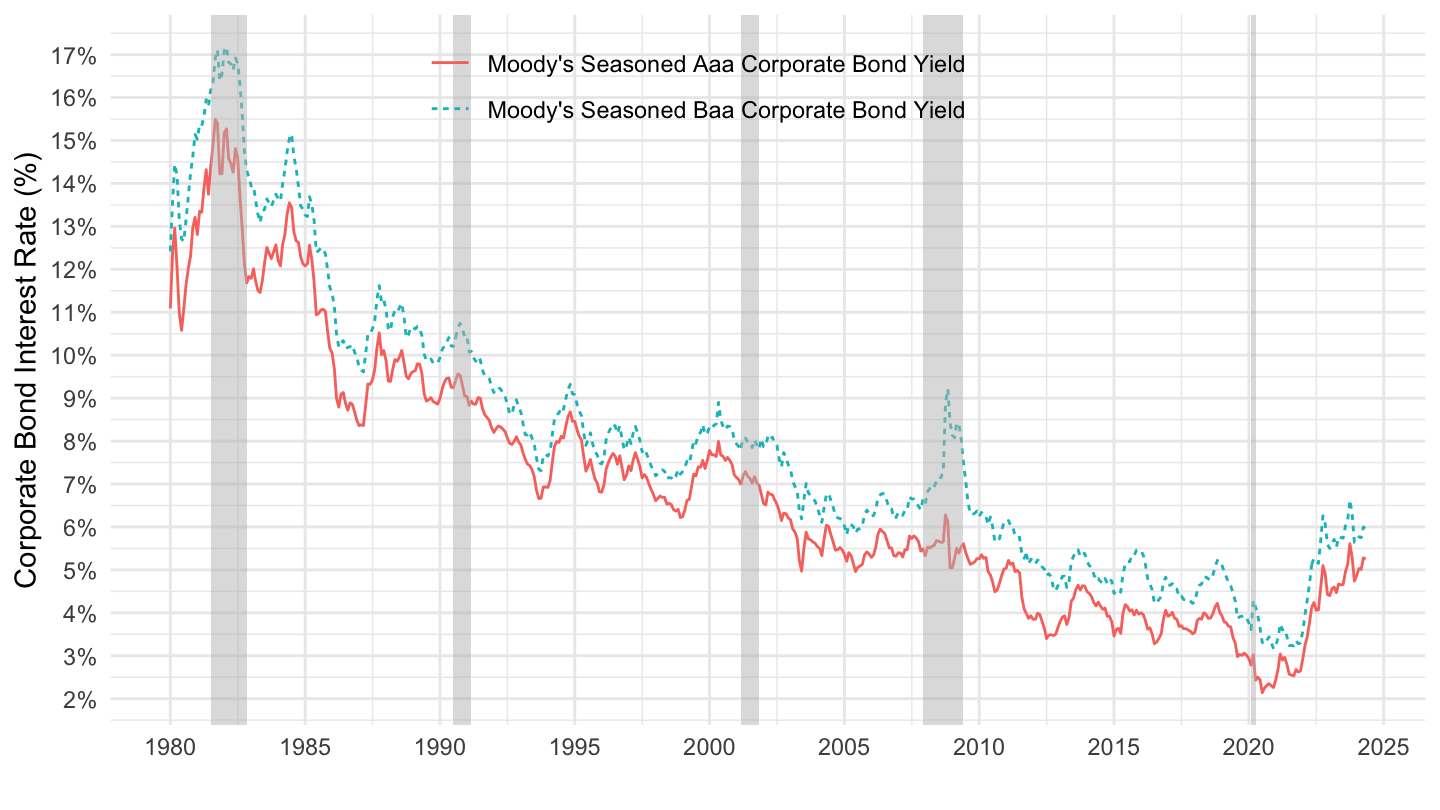
2013 Taper Tentrum
30-year convential Mortgage Rate before and after Taper Tantrum
Code
r %>%
  filter(variable %in% c("MORTGAGE30US")) %>%
  filter(date >= as.Date("2011-01-01"),
         date <= as.Date("2016-01-01")) %>%
  mutate(value = value / 100) %>%
  ggplot(.) + geom_line(aes(x = date, y = value)) + theme_minimal() +
  scale_x_date(breaks = seq(1870, 2100, 1) %>% paste0("-01-01") %>% as.Date,
               labels = date_format("%Y")) +
  scale_y_continuous(breaks = 0.01*seq(0, 15, 0.2),
                     labels = scales::percent_format(accuracy = 0.1)) +
  xlab("") + ylab("") +
  geom_vline(xintercept = as.Date("2008-09-15"), linetype = "dashed", color = viridis(3)[2])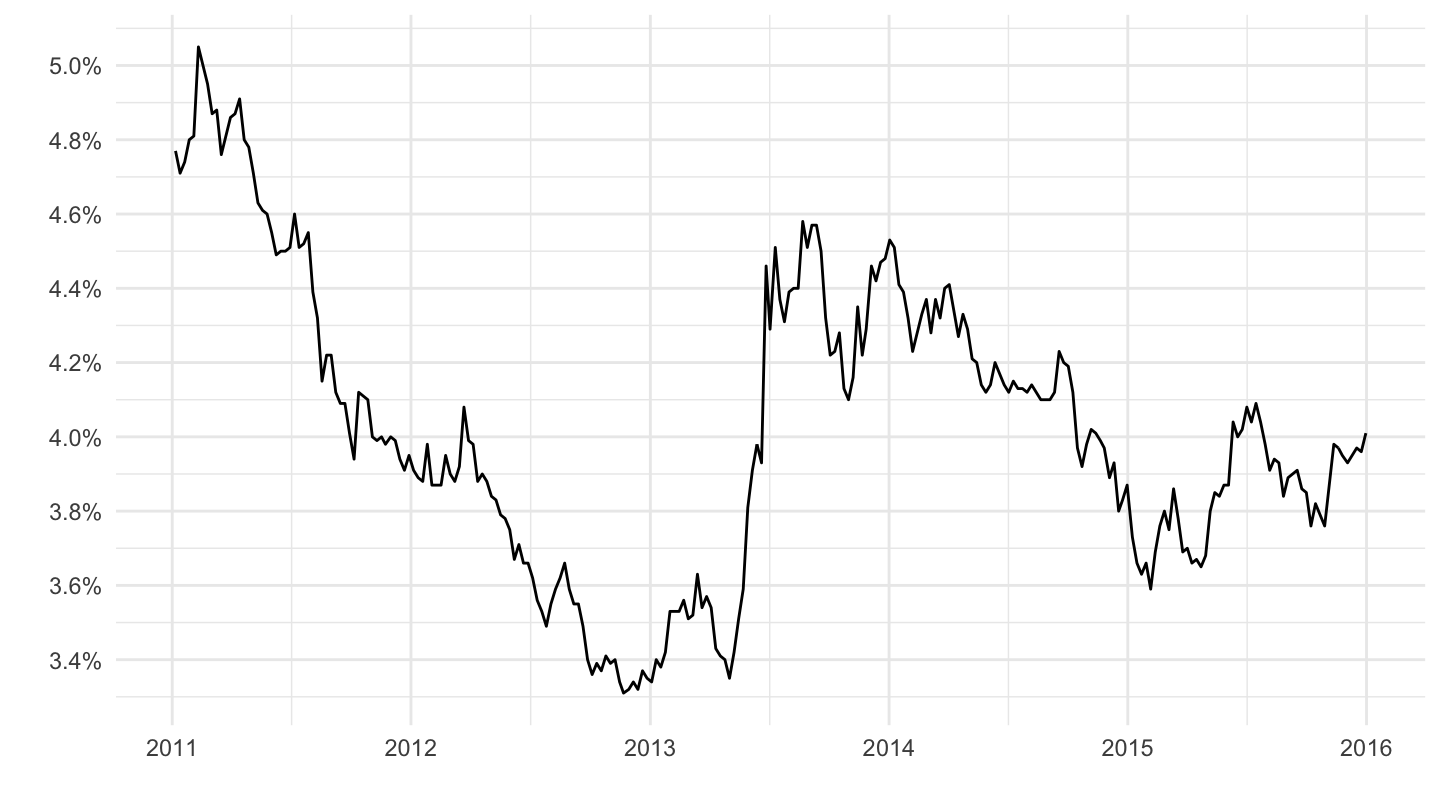
Mortgage Debt Service Payments (2011-2016)
Code
r %>%
  filter(variable %in% c("MDSP")) %>%
  filter(date >= as.Date("2011-01-01"),
         date <= as.Date("2016-01-01")) %>%
  mutate(value = value / 100) %>%
  ggplot(.) + geom_line(aes(x = date, y = value)) + theme_minimal() +
  scale_x_date(breaks = seq(1870, 2100, 1) %>% paste0("-01-01") %>% as.Date,
               labels = date_format("%Y")) +
  scale_y_continuous(breaks = 0.01*seq(0, 15, 0.1),
                     labels = scales::percent_format(accuracy = 0.1)) +
  xlab("") + ylab("% of Disposable Income") +
  geom_vline(xintercept = as.Date("2008-09-15"), linetype = "dashed", color = viridis(3)[2])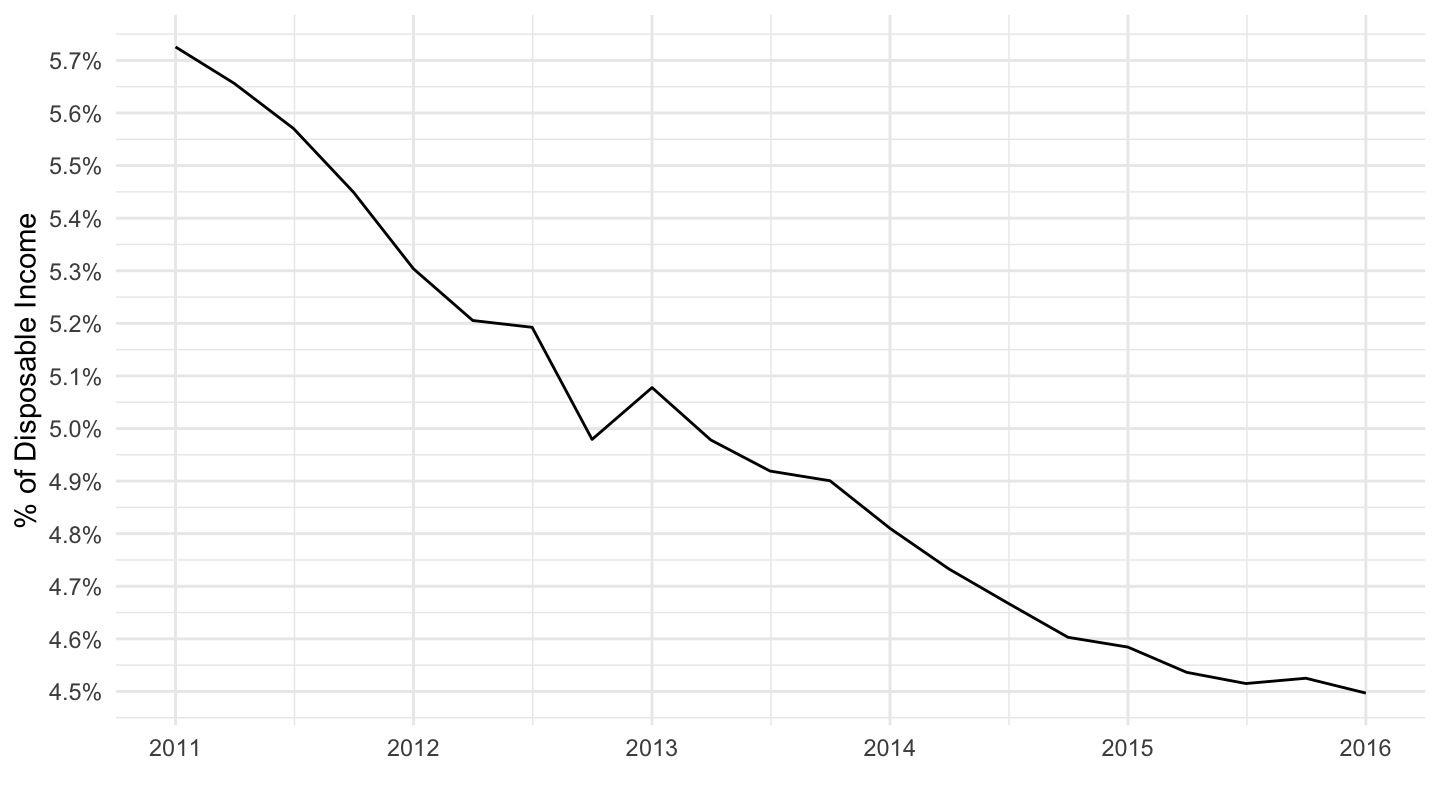
Policy Interest Rates
U.S. Versus Euro Area Discount Rates
1980-
Code
r %>%
  filter(variable %in% c("FEDFUNDS", "ECBMLFR"),
         date >= as.Date("1980-01-01")) %>%
  left_join(variable, by = "variable") %>%
  mutate(value = value/100) %>%
  ggplot(.) + theme_minimal() +
  geom_line(aes(x = date, y = value, color = Variable)) +

  geom_rect(data = nber_recessions %>%
              filter(Peak >= as.Date("1980-01-01")),
            aes(xmin = Peak, xmax = Trough, ymin = -Inf, ymax = +Inf),
            fill = 'grey', alpha = 0.5) +
  scale_x_date(breaks = seq(1870, 2100, 5) %>% paste0("-01-01") %>% as.Date,
               labels = date_format("%Y")) +
  scale_y_continuous(breaks = 0.01*seq(-50, 50, 1),
                     labels = scales::percent_format(accuracy = 1)) +
  theme(legend.position = c(0.8, 0.8),
        legend.title = element_blank()) +
  xlab("") + ylab("")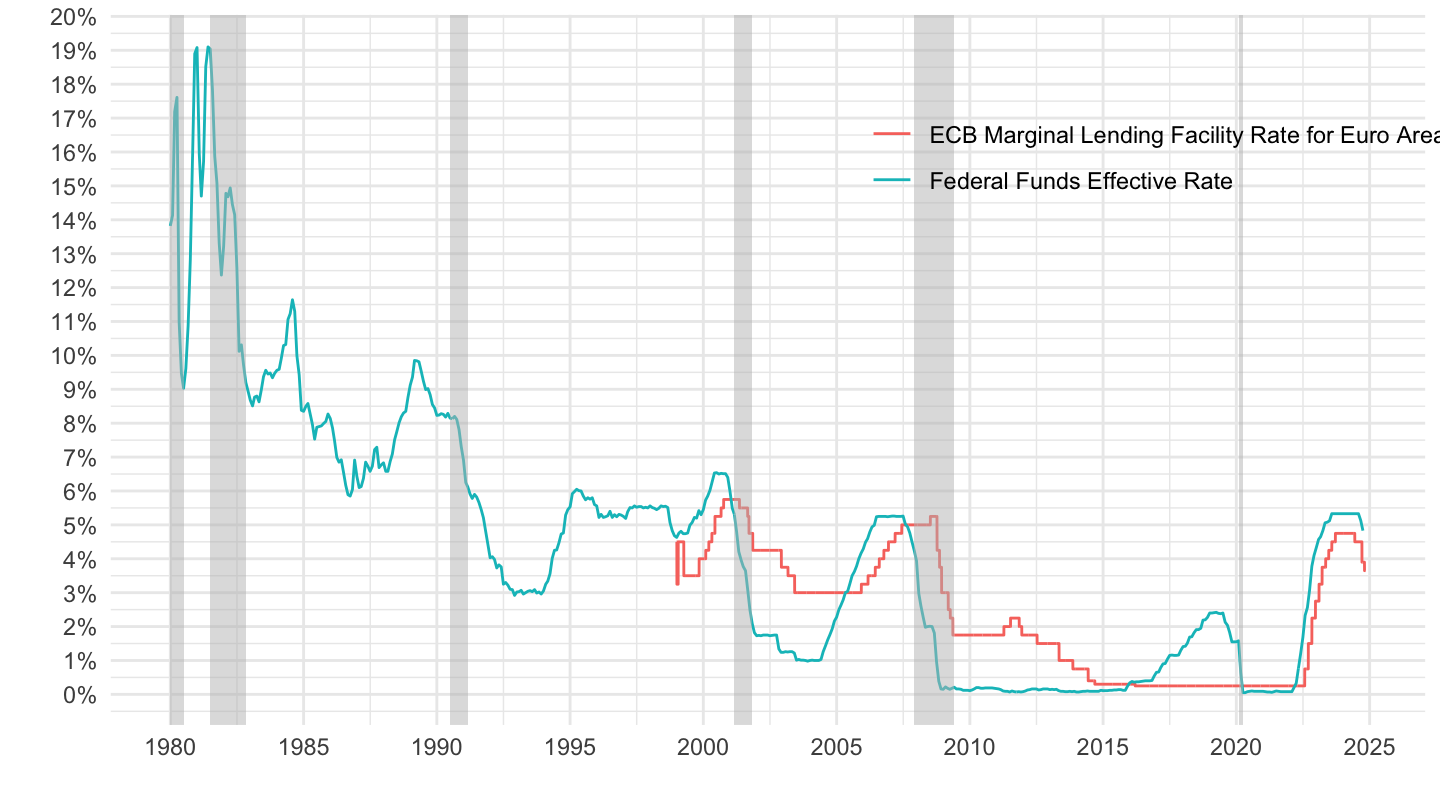
1998-
Code
r %>%
  filter(variable %in% c("EFFR", "ECBMLFR"),
         date >= as.Date("1998-01-01")) %>%
  left_join(variable, by = "variable") %>%
  mutate(value = value/100) %>%
  ggplot(.) + theme_minimal() +
  geom_line(aes(x = date, y = value, color = Variable)) +

  geom_rect(data = nber_recessions %>%
              filter(Peak >= as.Date("1998-01-01")),
            aes(xmin = Peak, xmax = Trough, ymin = -Inf, ymax = +Inf),
            fill = 'grey', alpha = 0.5) +
  scale_x_date(breaks = seq(1870, 2025, 5) %>% paste0("-01-01") %>% as.Date,
               labels = date_format("%Y")) +
  scale_y_continuous(breaks = 0.01*seq(-50, 50, 1),
                     labels = scales::percent_format(accuracy = 1)) +
  theme(legend.position = c(0.75, 0.9),
        legend.title = element_blank()) +
  xlab("") + ylab("")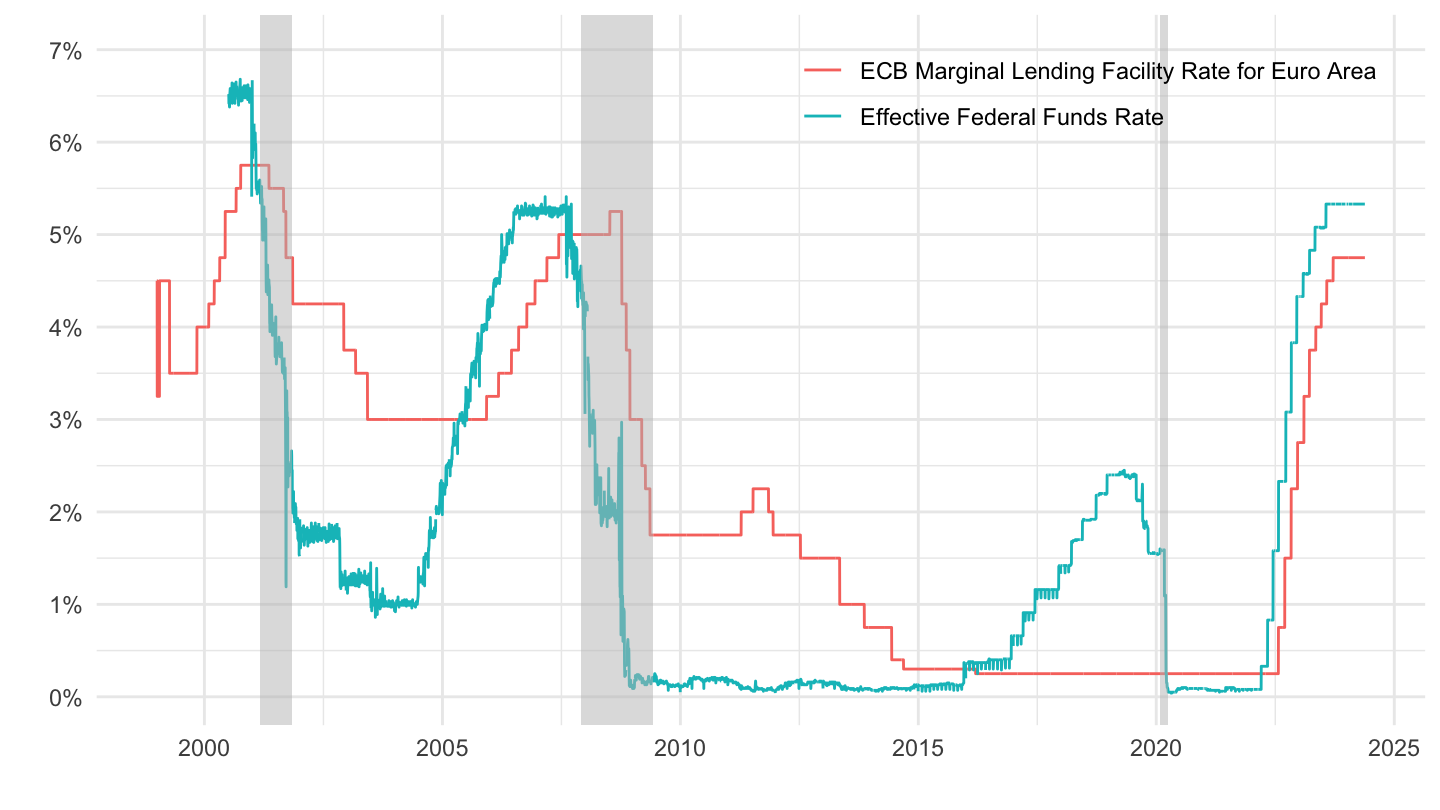
2009-2015
Code
r %>%
  filter(variable %in% c("FEDFUNDS", "INTDSREZQ193N"),
         date >= as.Date("2009-01-01"),
         date <= as.Date("2014-12-31")) %>%
  mutate(value = value/100,
         Variable = case_when(variable == "INTDSREZQ193N" ~ "Euro Area Discount Rate",
                                   variable == "FEDFUNDS" ~ "U.S. Fed Funds Rate")) %>%
  ggplot(.) + theme_minimal() +
  geom_line(aes(x = date, y = value, color = Variable)) +

  scale_x_date(breaks = seq(1870, 2100, 1) %>% paste0("-01-01") %>% as.Date,
               labels = date_format("%Y")) +
  scale_y_continuous(breaks = 0.01*seq(-50, 50, 0.5),
                     labels = scales::percent_format(accuracy = .1)) +
  theme(legend.position = c(0.8, 0.8),
        legend.title = element_blank()) +
  xlab("") + ylab("")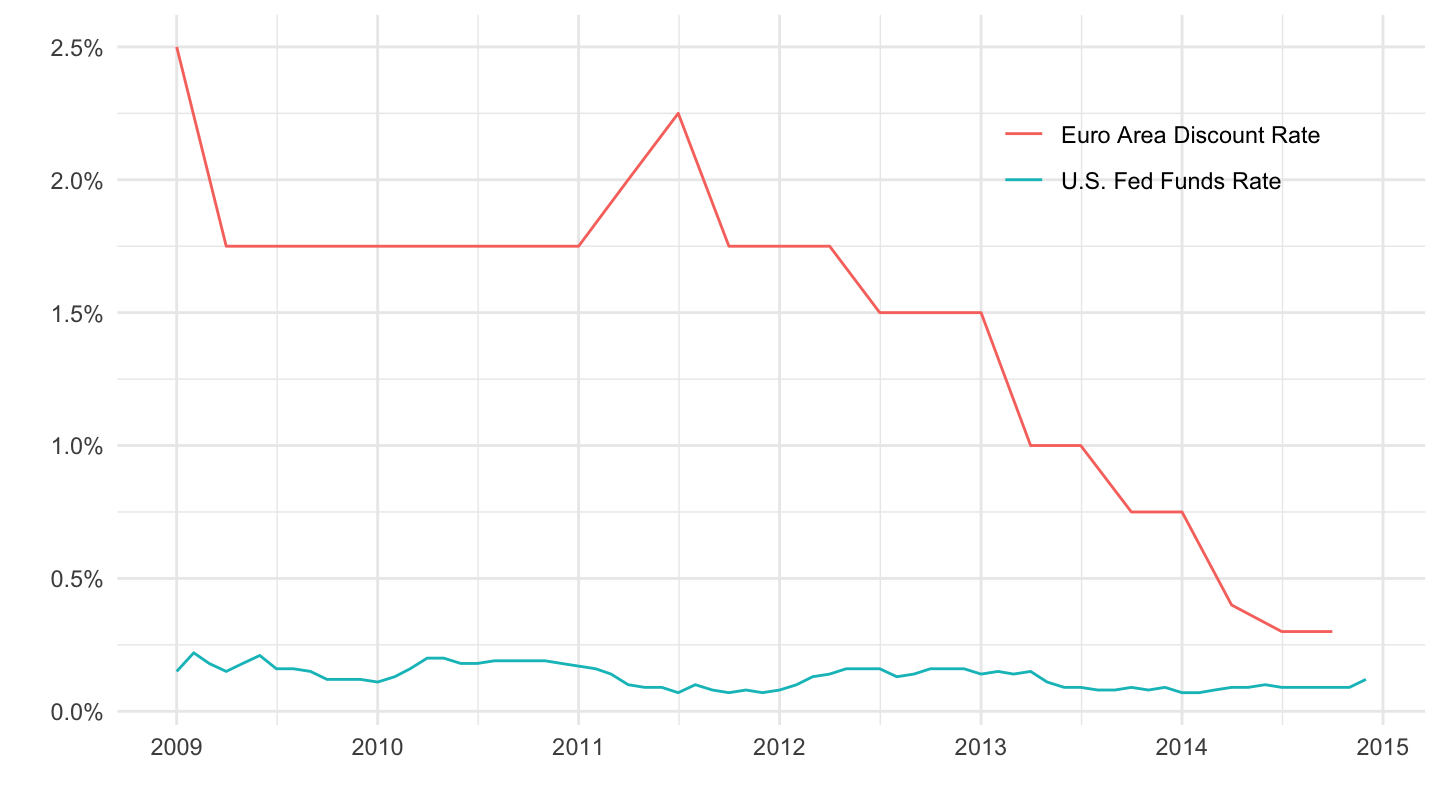
Italy
IRLTLT01ITM156N - Italian 10-year Government Bond Yields
Code
r %>%
  filter(variable == "IRLTLT01ITM156N",
         date >= as.Date("2008-01-01"),
         date <= as.Date("2014-01-01")) %>%
  mutate(value = value / 100) %>%
  ggplot(data = .) +
  geom_line(aes(x = date, y = value)) +
  labs(x = "Observation Date", y = "Rate") +
  theme_minimal() +
  theme(legend.title = element_blank(),
        legend.position = c(0.4, 0.8)) +
  scale_x_date(breaks = as.Date(paste0(seq(1920, 2100, 1), "-01-01")),
               labels = date_format("%Y")) +
  scale_y_continuous(breaks = 0.01*seq(-1, 20, 0.5),
                     labels = scales::percent_format(accuracy = 0.1)) +
  xlab("") + ylab("Italian 10-year Government Bond Yields") +
  geom_vline(xintercept = as.Date("2012-07-01"), color = viridis(3)[2], linetype = "dashed")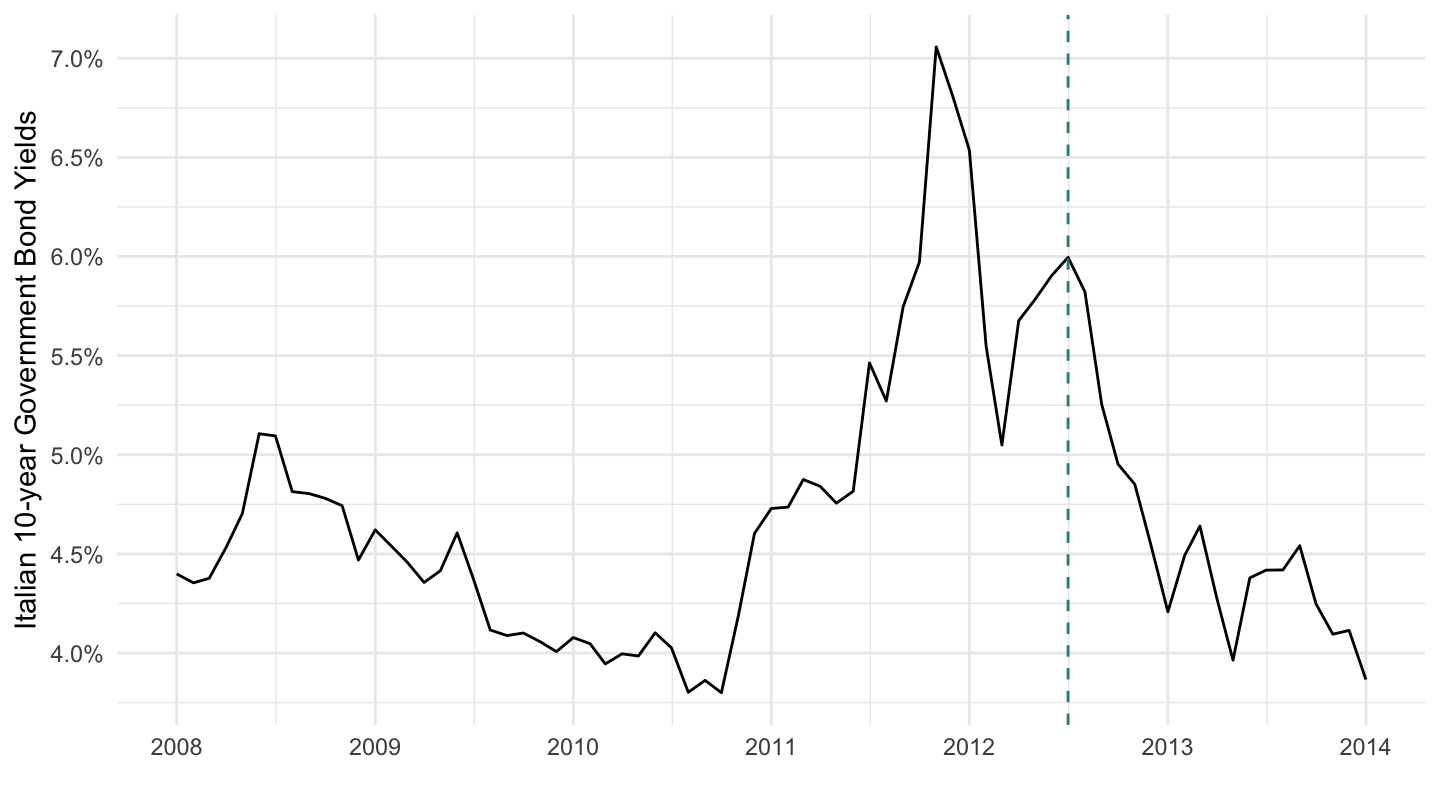
Interest Rates
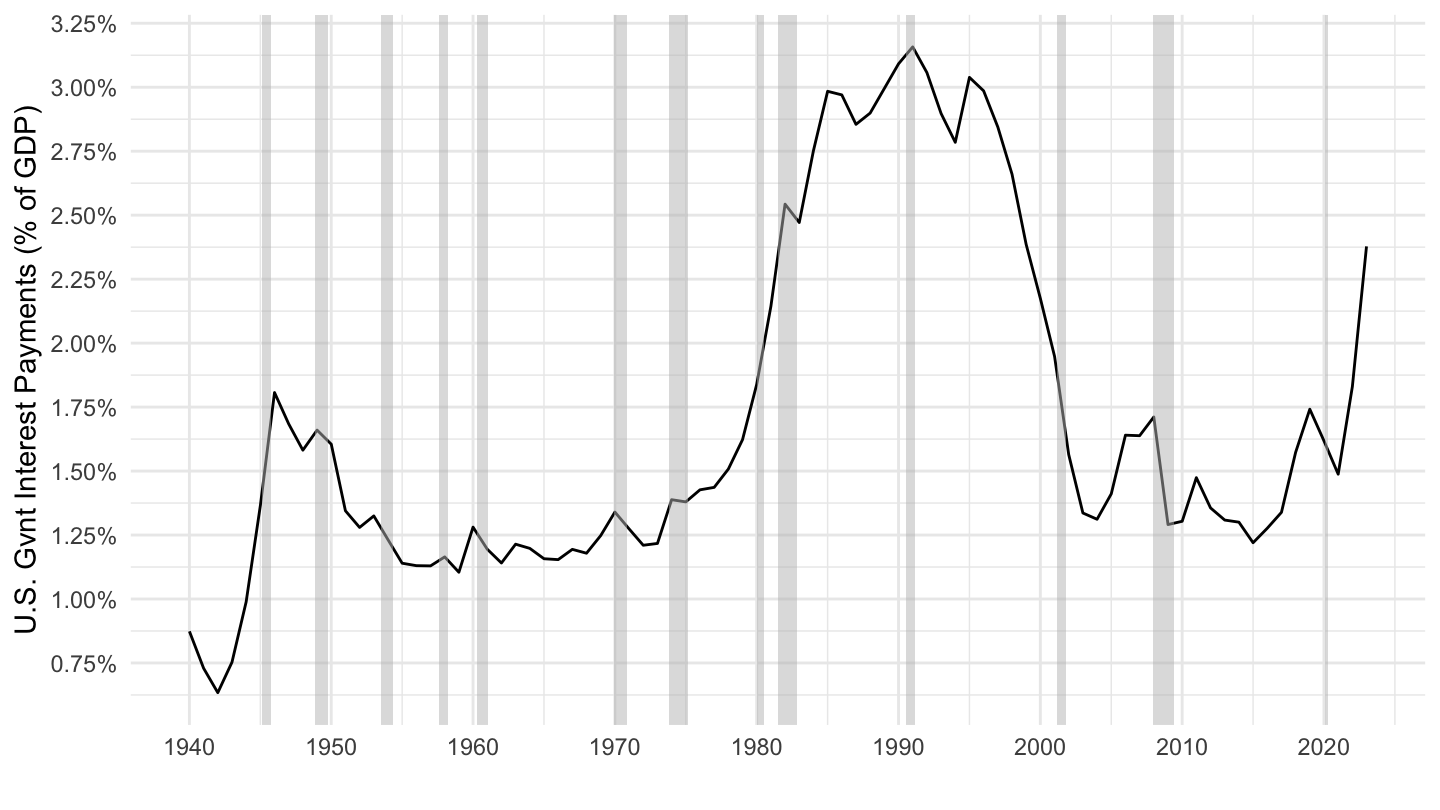
FYOIGDA188S - Interest Payments
Code
r %>%
  filter(variable == "FYOIGDA188S") %>%
  ggplot(data = .) + geom_line(aes(x = date, y = value / 100)) + theme_minimal() +
  xlab("") + ylab("U.S. Gvnt Interest Payments (% of GDP)") +
  geom_rect(data = nber_recessions %>%
              filter(Peak > as.Date("1945-01-01")),
            aes(xmin = Peak, xmax = Trough, ymin = -Inf, ymax = +Inf),
            fill = 'grey', alpha = 0.5) +
  theme(legend.title = element_blank(),
        legend.position = c(0.4, 0.8)) +
  scale_x_date(breaks = as.Date(paste0(seq(1920, 2100, 10), "-01-01")),
               labels = date_format("%Y")) +
  scale_y_continuous(breaks = 0.01*seq(-1, 3.5, 0.25),
                     labels = scales::percent_format(accuracy = 0.05))