Daily Liquidity
Data - ECB
Info
Info
Monetary financial institutions in the euro area are legally obliged to report data to their National Central Banks, which in turn report to the ECB.
Data on monetary policy
| source | dataset | Title | .html | .rData |
|---|---|---|---|---|
| ecb | liq_daily | Daily Liquidity | 2026-07-24 | 2026-07-24 |
| bdf | FM | Marché financier, taux | 2026-07-24 | 2026-07-24 |
| bdf | MIR | Taux d'intérêt - Zone euro | 2026-07-24 | 2026-07-24 |
| bdf | MIR1 | Taux d'intérêt - France | 2026-07-24 | 2026-07-24 |
| bis | CBPOL | Policy Rates, Daily | 2026-07-25 | 2026-07-25 |
| ecb | BSI | Balance Sheet Items | 2026-07-24 | 2026-07-23 |
| ecb | BSI_PUB | Balance Sheet Items - Published series | 2026-07-24 | 2026-07-24 |
| ecb | FM | Financial market data | 2026-07-24 | 2026-07-24 |
| ecb | ILM | Internal Liquidity Management | 2026-07-24 | 2026-07-24 |
| ecb | ILM_PUB | Internal Liquidity Management - Published series | 2026-07-24 | 2026-07-24 |
| ecb | MIR | MFI Interest Rate Statistics | 2026-07-24 | 2026-07-24 |
| ecb | RAI | Risk Assessment Indicators | 2026-07-24 | 2026-07-24 |
| ecb | SUP | Supervisory Banking Statistics | 2026-07-24 | 2026-07-24 |
| ecb | YC | Financial market data - yield curve | 2026-07-24 | 2026-07-23 |
| ecb | YC_PUB | Financial market data - yield curve - Published series | 2026-07-24 | 2026-07-24 |
| eurostat | ei_mfir_m | Interest rates - monthly data | 2026-07-23 | 2026-07-23 |
| eurostat | irt_st_m | Money market interest rates - monthly data | 2026-07-24 | 2026-07-23 |
| fred | r | Interest Rates | 2026-07-24 | 2026-07-24 |
| oecd | MEI | Main Economic Indicators | 2026-07-24 | 2025-07-24 |
| oecd | MEI_FIN | Monthly Monetary and Financial Statistics (MEI) | 2024-09-15 | 2025-07-24 |
LAST_COMPILE
| LAST_COMPILE |
|---|
| 2026-07-26 |
variable
Code
liq_daily %>%
  left_join(variable, by = "variable") %>%
  group_by(variable, Variable) %>%
  summarise(Nobs = n()) %>%
  arrange(variable) %>%
print_table_conditional| variable | Variable | Nobs |
|---|---|---|
| ABSPP | ABSPP - ABS purchase programme | 616 |
| CBPP1 | CBPP1 - Covered bond purchase programme | 2729 |
| CBPP2 | CBPP2 - Covered bond purchase programme 2 | 1999 |
| CBPP3 | CBPP3 - Covered bond purchase programme 3 | 616 |
| CSPP | CSPP - Corporate sector purchase programme | 531 |
| DF | Deposit facility | 9271 |
| MLF | Marginal lending facility | 9271 |
| OMO | Open market operations excl. MonPol portfolios | 9271 |
| PEPP | PEPP - Pandemic emergency purchase programme | 330 |
| PSPP | PSPP - Public sector purchase programm | 595 |
| SMP | SMP - Securities Markets programme | 657 |
| current_accounts | Current accounts | 9307 |
| excess_liquidity | Excess liquidity | 1792 |
| net_autonomous_monpol | Net liquidity effect from Autonomous Factors and MonPol portfolios | 9307 |
| reserve_requirements | Reserve requirements | 9307 |
duplicates
Same + different values
Code
liq_daily %>%
  group_by(variable, date) %>%
  filter(n()>1) %>%
  arrange(date, variable) %>%
  print_table_conditional
Different values
Code
liq_daily %>%
  unique %>%
  group_by(variable, date) %>%
  filter(n()>1) %>%
  arrange(date, variable) %>%
print_table_conditional| date | variable | value |
|---|---|---|
| 2008-01-01 | OMO | 535514 |
| 2008-01-01 | OMO | 535503 |
| 2008-01-01 | net_autonomous_monpol | 256501 |
| 2008-01-01 | net_autonomous_monpol | 256490 |
| 2008-01-02 | OMO | 468454 |
| 2008-01-02 | OMO | 468443 |
| 2008-01-02 | net_autonomous_monpol | 262467 |
| 2008-01-02 | net_autonomous_monpol | 262456 |
| 2008-01-03 | OMO | 437094 |
| 2008-01-03 | OMO | 437083 |
| 2008-01-03 | net_autonomous_monpol | 269250 |
| 2008-01-03 | net_autonomous_monpol | 269239 |
| 2008-01-15 | current_accounts | 168183 |
| 2008-01-15 | current_accounts | 168187 |
| 2008-01-15 | net_autonomous_monpol | 232059 |
| 2008-01-15 | net_autonomous_monpol | 232055 |
Data on liquidity
Last date
Code
liq_daily %>%
  filter(date == max(date)) %>%
print_table_conditional| date | variable | value |
|---|---|---|
| 2026-07-23 | OMO | 30991 |
| 2026-07-23 | MLF | 84 |
| 2026-07-23 | DF | 2009216 |
| 2026-07-23 | net_autonomous_monpol | -2300304 |
| 2026-07-23 | current_accounts | 322164 |
| 2026-07-23 | reserve_requirements | 173861 |
| 2026-07-23 | excess_liquidity | 2157434 |
Last date by variable
Code
liq_daily %>%
  group_by(variable) %>%
  filter(date == max(date)) %>%
print_table_conditional| date | variable | value |
|---|---|---|
| 2026-07-23 | OMO | 30991 |
| 2026-07-23 | MLF | 84 |
| 2026-07-23 | DF | 2009216 |
| 2026-07-23 | net_autonomous_monpol | -2300304 |
| 2026-07-23 | current_accounts | 322164 |
| 2026-07-23 | reserve_requirements | 173861 |
| 2026-07-17 | CBPP1 | 0 |
| 2026-07-17 | CBPP2 | 0 |
| 2026-07-17 | SMP | 14 |
| 2026-07-17 | CBPP3 | 191884 |
| 2026-07-17 | ABSPP | 2070 |
| 2026-07-17 | PSPP | 1693012 |
| 2026-07-17 | CSPP | 218392 |
| 2026-07-23 | excess_liquidity | 2157434 |
| 2026-07-17 | PEPP | 1303591 |
Asset purchase program
CBPP1, CBPP2, CBPP3, SMP, ABSPP, PSPP, CSPP, PEPP
All
Lines
Code
liq_daily %>%
  left_join(variable, by = "variable") %>%
  filter(variable %in% c("CBPP1", "CBPP2", "CBPP3", "SMP", "ABSPP", "PSPP", "CSPP", "PEPP")) %>%
  ggplot + geom_line(aes(x = date, y = value/10^3, color = Variable)) +
  xlab("") + ylab("") + theme_minimal() +
  scale_x_date(breaks = as.Date(paste0(seq(1940, 2030, 2), "-01-01")),
               labels = date_format("%Y")) +
  theme(legend.position = c(0.3, 0.7),
        legend.title = element_blank()) +
  scale_y_continuous(breaks = 1000*seq(-100, 90, .5),
                     labels = scales::dollar_format(acc = 1, su = " Bn€", pre = ""))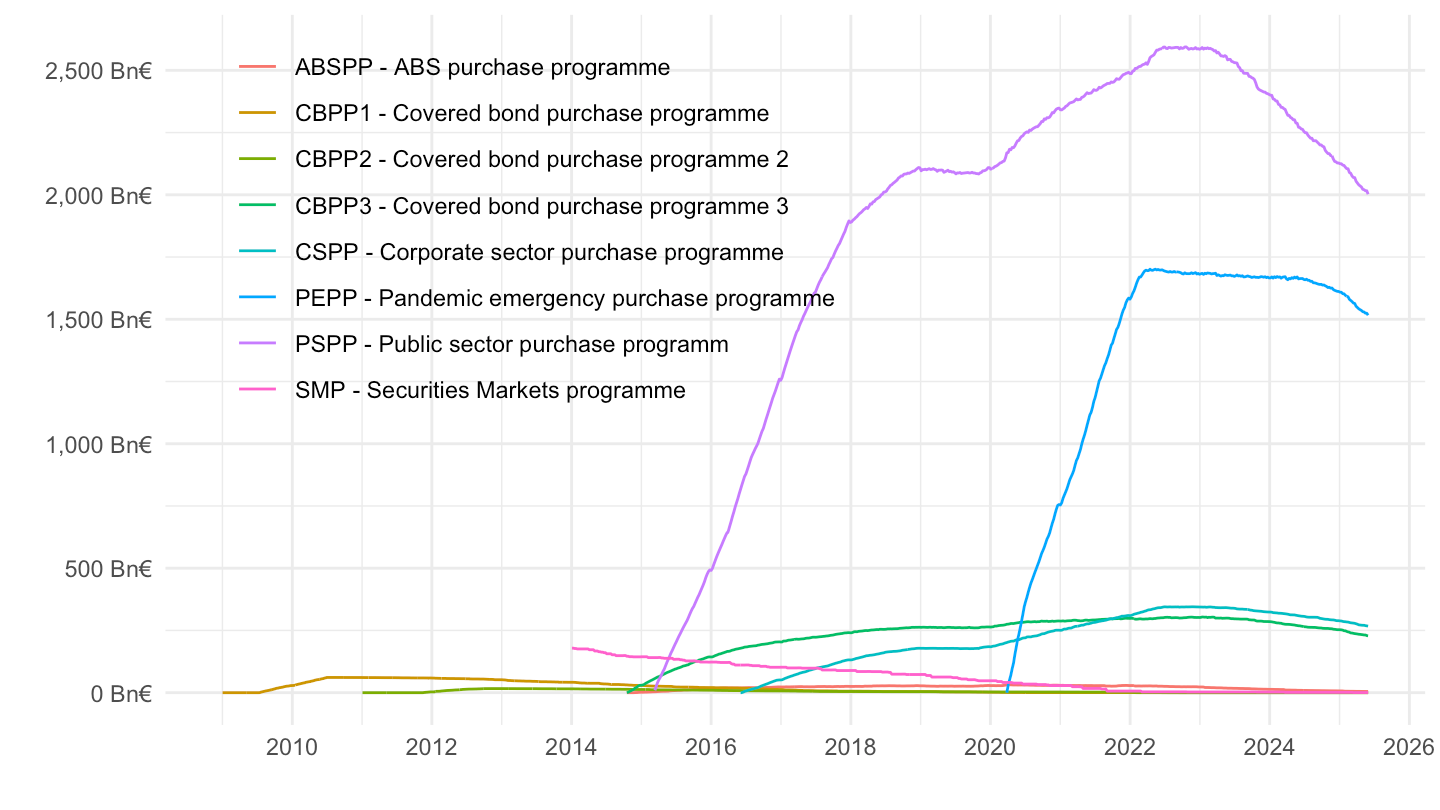
Stock
Code
liq_daily %>%
  left_join(variable, by = "variable") %>%
  filter(variable %in% c("CBPP1", "CBPP2", "CBPP3", "SMP", "ABSPP", "PSPP", "CSPP", "PEPP")) %>%
  ggplot + geom_area(aes(x = date, y = value/10^3, fill = Variable), alpha = 0.5) +
  xlab("") + ylab("") + theme_minimal() +
  scale_x_date(breaks = as.Date(paste0(seq(1940, 2100, 1), "-01-01")),
               labels = date_format("%Y")) +
    # Add labels manually with matching colors
  annotate("text", x = as.Date("2023-01-01"), y = 3000, label = "PEPP", color = scales::hue_pal()(8)[6], size = 4) +
  annotate("text", x = as.Date("2021-01-01"), y = 1300, label = "PSPP", color = scales::hue_pal()(8)[7], size = 4) +
  theme(legend.position = c(0.3, 0.7),
        legend.title = element_blank()) +
  scale_y_continuous(breaks = 1000*seq(-100, 90, .5),
                     labels = scales::dollar_format(acc = 1, su = " Bn€", pre = ""))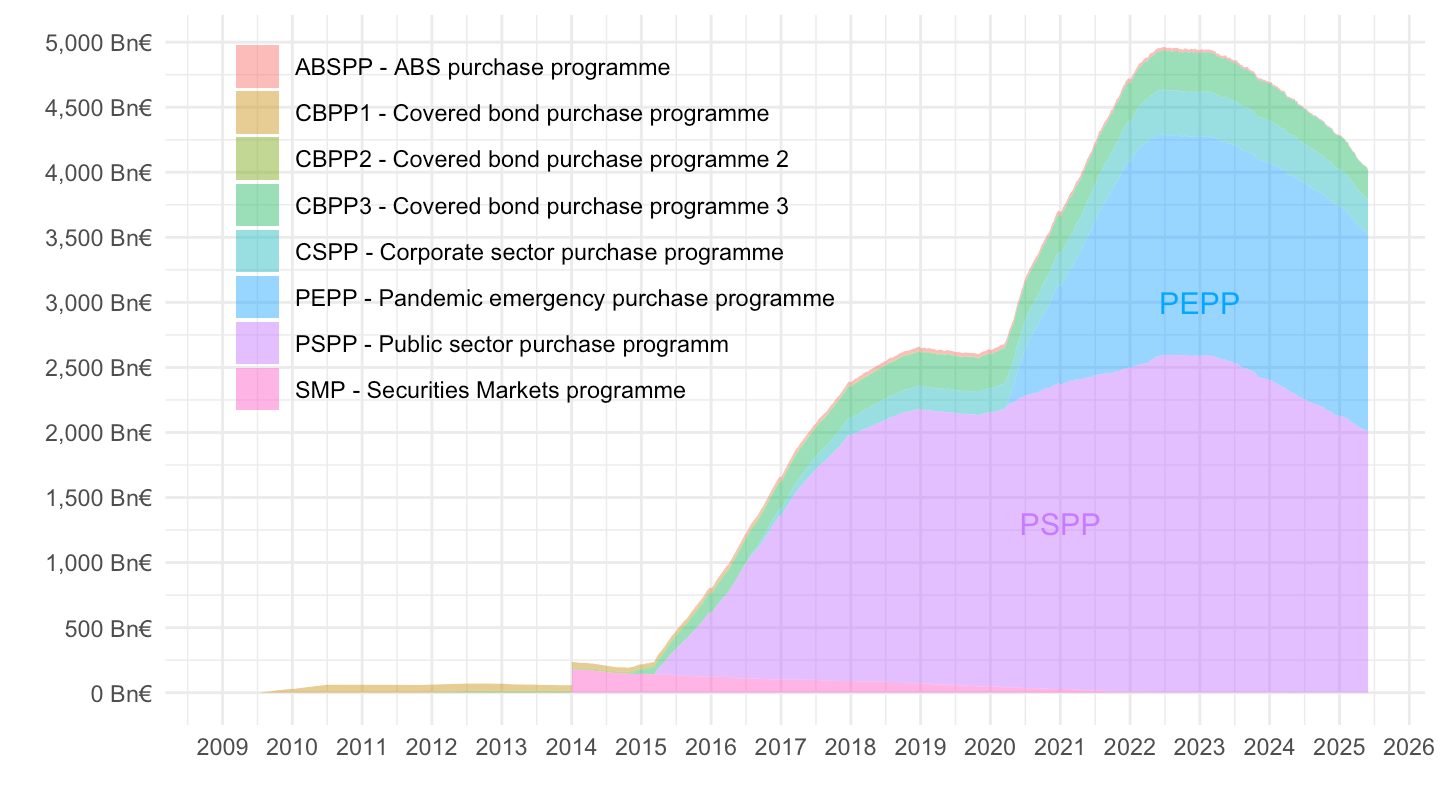
2020-
Code
liq_daily %>%
  left_join(variable, by = "variable") %>%
  filter(date >= as.Date("2020-01-01")) %>%
  filter(variable %in% c("CBPP1", "CBPP2", "CBPP3", "SMP", "ABSPP", "PSPP", "CSPP", "PEPP")) %>%
  ggplot + geom_line(aes(x = date, y = value/10^3, color = Variable)) +
  xlab("") + ylab("") + theme_minimal() +
  scale_x_date(breaks = seq(from = as.Date("2020-01-01"), Sys.Date(), by = "6 months"),
               labels = date_format("%b %Y")) +
  theme(legend.position = c(0.5, 0.5),
        legend.title = element_blank()) +
  scale_y_continuous(breaks = 1000*seq(-100, 90, .5),
                     labels = scales::dollar_format(acc = 1, su = " Bn€", pre = ""))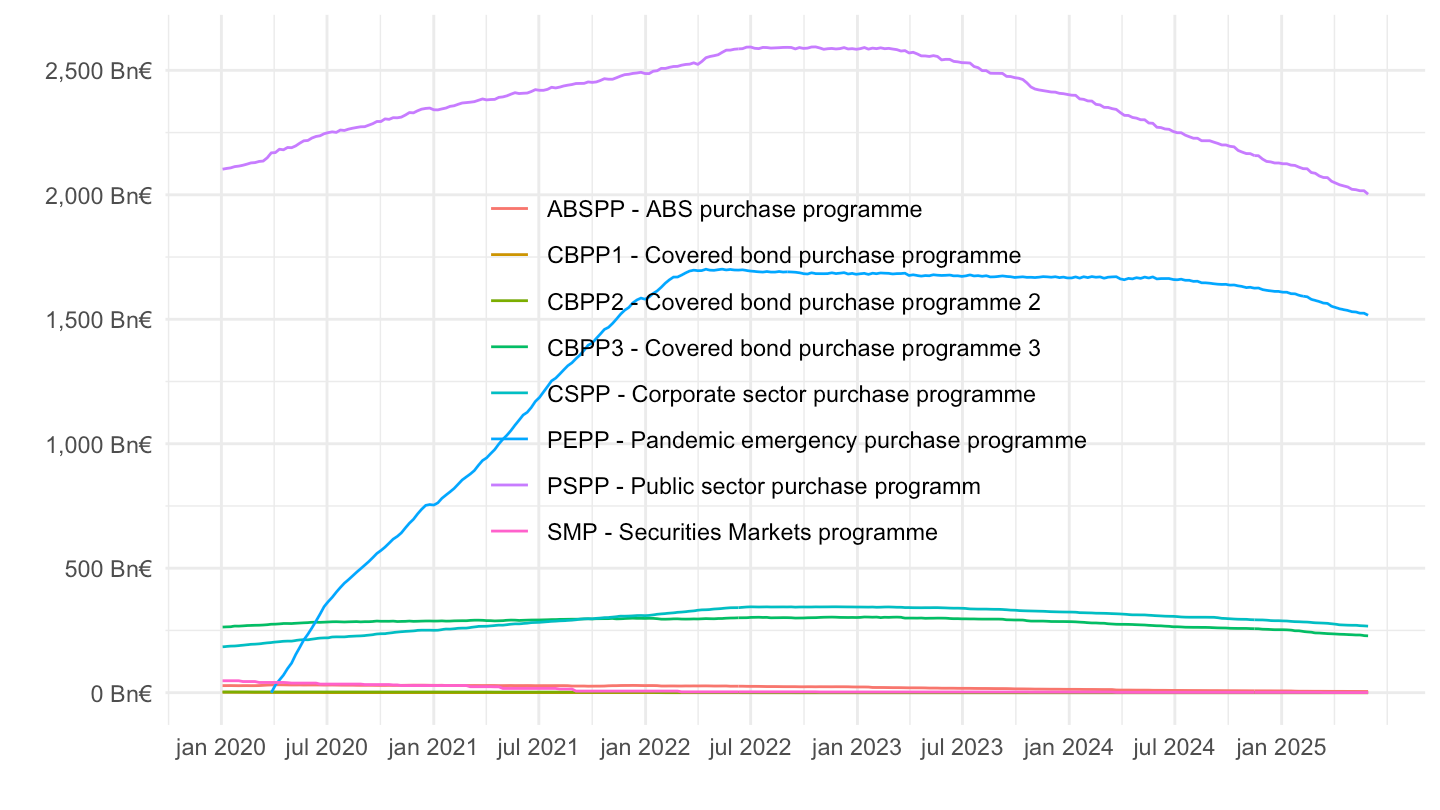
2022-
Code
liq_daily %>%
  left_join(variable, by = "variable") %>%
  filter(date >= as.Date("2022-01-01")) %>%
  filter(variable %in% c("CBPP1", "CBPP2", "CBPP3", "SMP", "ABSPP", "PSPP", "CSPP", "PEPP")) %>%
  ggplot + geom_line(aes(x = date, y = value/10^3, color = Variable)) +
  xlab("") + ylab("") + theme_minimal() +
  scale_x_date(breaks = seq(from = as.Date("2022-01-01"), as.Date("2026-01-01"), by = "2 months"),
               labels = date_format("%b %Y")) +
  theme(legend.position = c(0.45, 0.5),
        legend.title = element_blank(),
        axis.text.x = element_text(angle = 45, vjust = 1, hjust = 1)) +
  scale_y_continuous(breaks = 1000*seq(-100, 90, .5),
                     labels = scales::dollar_format(acc = 1, su = " Bn€", pre = ""))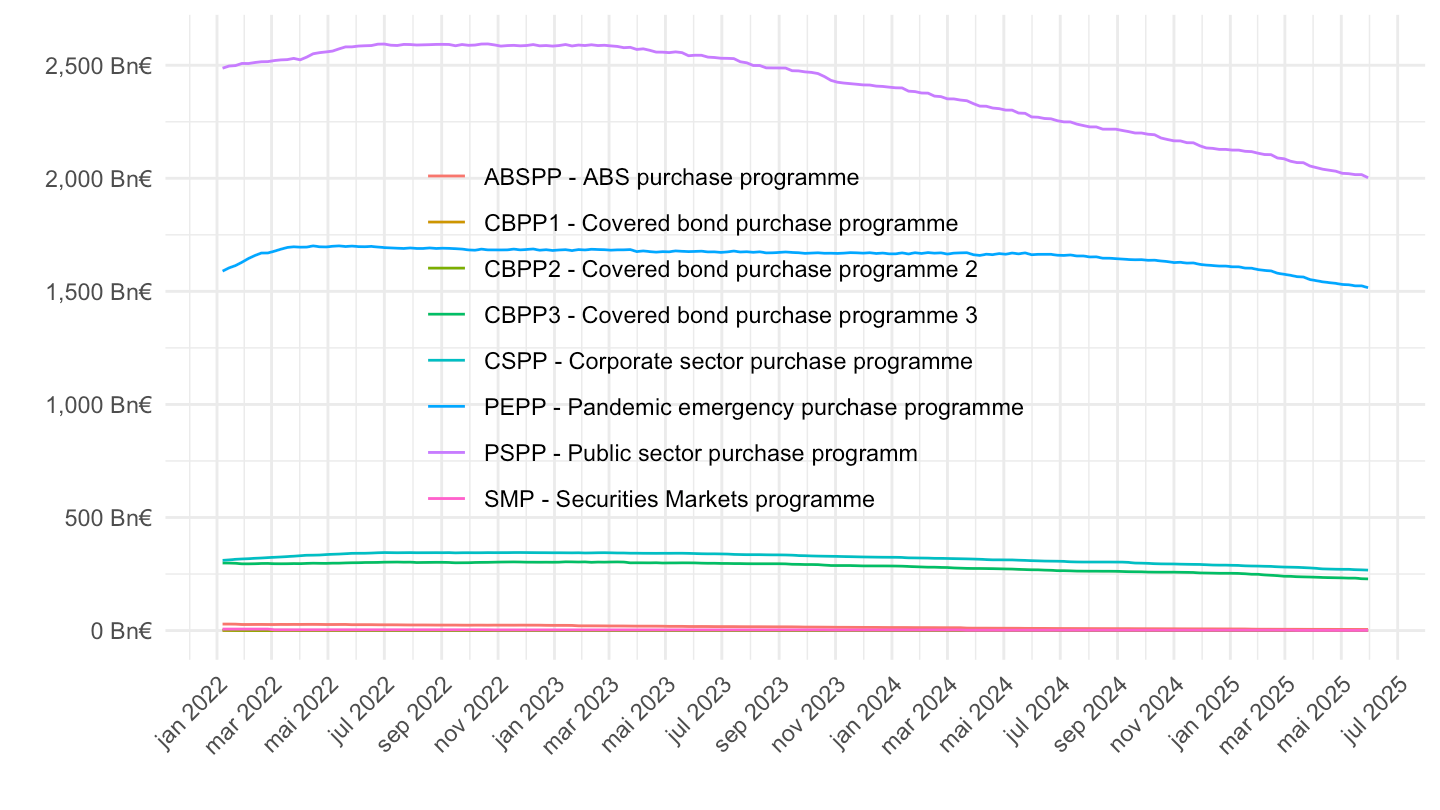
Excess Liquidity
Code
liq_daily %>%
  left_join(variable, by = "variable") %>%
  filter(Variable == "Excess liquidity") %>%
  ggplot + geom_line(aes(x = date, y = value/10^3)) +
  xlab("") + ylab("") + theme_minimal() +
  scale_x_date(breaks = as.Date(paste0(seq(1940, 2030, 1), "-01-01")),
               labels = date_format("%Y")) +
  theme(legend.position = c(0.4, 0.9),
        legend.title = element_blank()) +
  scale_y_continuous(breaks = 1000*seq(-100, 90, .5),
                     labels = scales::dollar_format(acc = 1, su = " Bn€", pre = ""))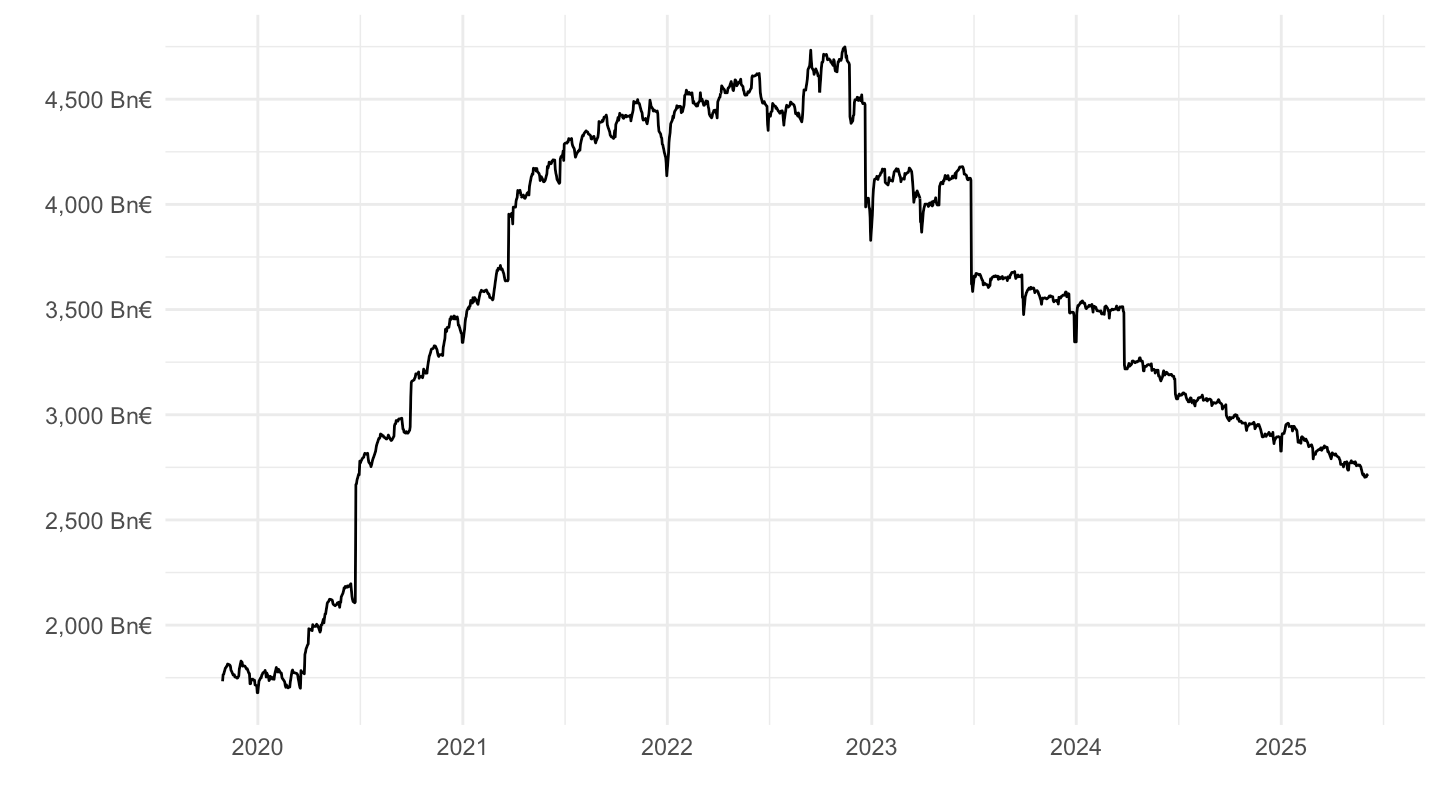
Excess Liquidity & Deposit Facility
Code
liq_daily %>%
  left_join(variable, by = "variable") %>%
  filter(Variable %in% c("Excess liquidity", "Deposit facility")) %>%
  ggplot + geom_line(aes(x = date, y = value/10^3, color = Variable)) +
  xlab("") + ylab("") + theme_minimal() +
  scale_x_date(breaks = as.Date(paste0(seq(1940, 2030, 2), "-01-01")),
               labels = date_format("%Y")) +
  theme(legend.position = c(0.4, 0.9),
        legend.title = element_blank()) +
  scale_y_continuous(breaks = 1000*seq(-100, 90, .5),
                     labels = scales::dollar_format(acc = 1, su = " Bn€", pre = ""))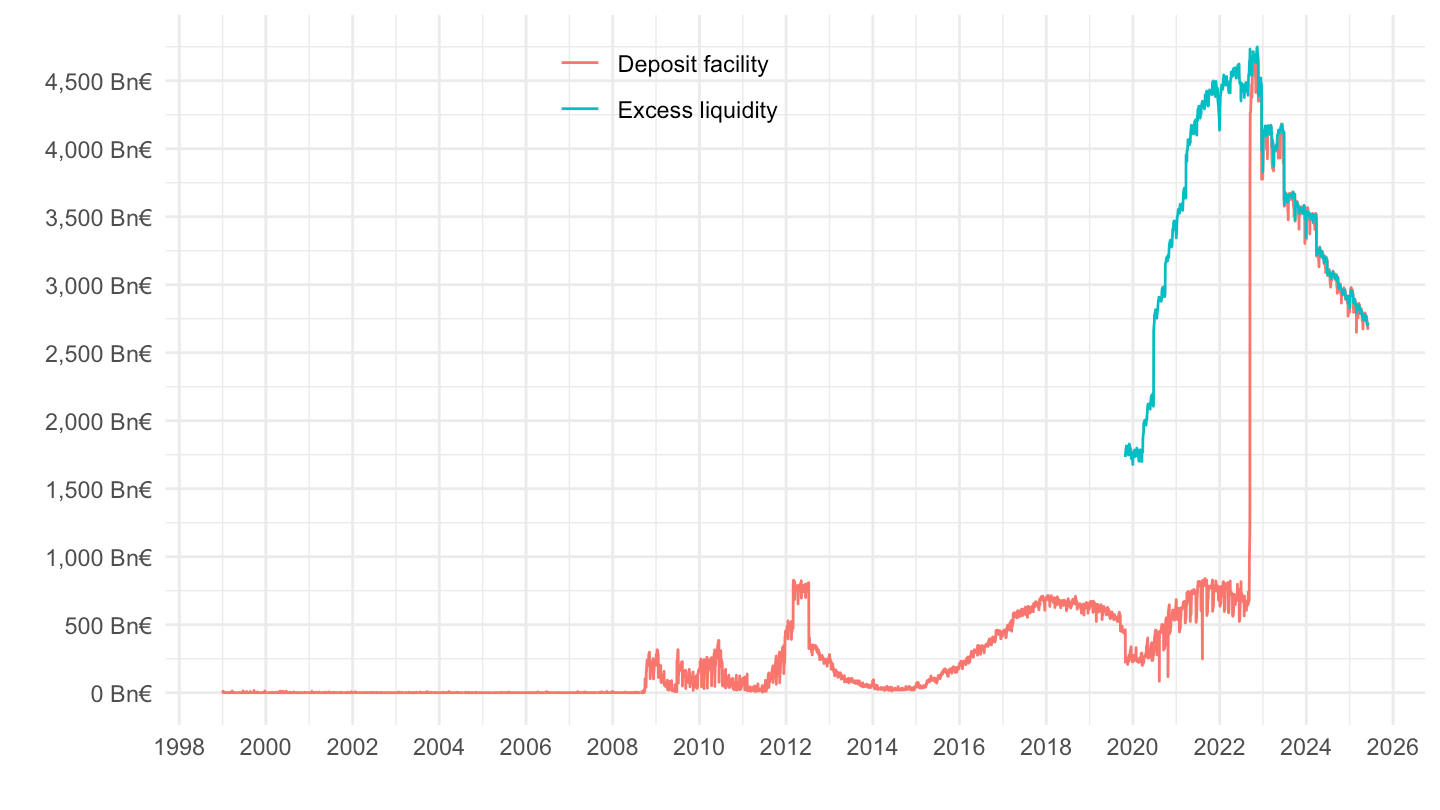
Synthesis excess liquidity
All
Code
liq_daily %>%
  filter(variable %in% c("excess_liquidity", "reserve_requirements", "current_accounts", "DF", "MLF")) %>%
  group_by(date, variable) %>%
  filter(row_number(value) == 1) %>%
  spread(variable, value) %>%
  transmute(date, `Excess Liquidity (ECB)` = excess_liquidity,
            `Excess Liquidity (own)` = current_accounts-reserve_requirements+DF-MLF) %>%
  gather(Variable, value, -date) %>%
  ggplot + geom_line(aes(x = date, y = value/10^3, color = Variable, linetype = Variable)) +
  xlab("") + ylab("") + theme_minimal() +
  scale_color_manual(values = c("red", "black")) +
  scale_x_date(breaks = as.Date(paste0(seq(1940, 2030, 2), "-01-01")),
               labels = date_format("%Y")) +
  theme(legend.position = c(0.3, 0.9),
        legend.title = element_blank()) +
  scale_y_continuous(breaks = 1000*seq(-100, 90, .5),
                     labels = scales::dollar_format(acc = 1, su = " Bn€", pre = ""))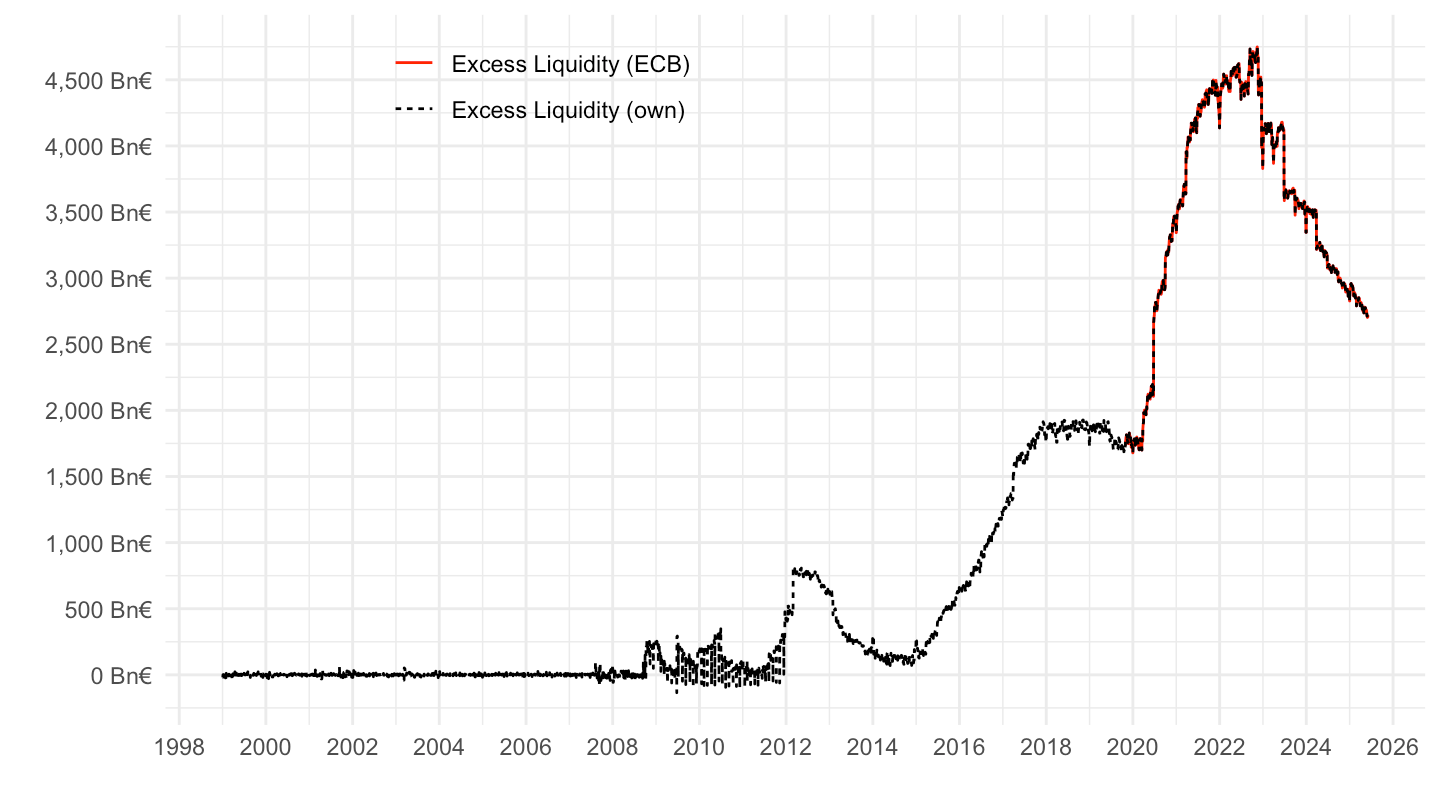
2022
Code
liq_daily %>%
  filter(variable %in% c("excess_liquidity", "reserve_requirements", "current_accounts", "DF", "MLF")) %>%
  group_by(date, variable) %>%
  filter(row_number(value) == 1) %>%
  spread(variable, value) %>%
  transmute(date, `Excess Liquidity (ECB)` = excess_liquidity,
            `Excess Liquidity (own)` = current_accounts-reserve_requirements+DF-MLF) %>%
  gather(Variable, value, -date) %>%
  filter(date >= as.Date("2022-01-01")) %>%
  ggplot + geom_line(aes(x = date, y = value/10^3, color = Variable)) +
  xlab("") + ylab("") + theme_minimal() +
  scale_x_date(breaks = seq(from = as.Date("2022-01-01"), as.Date("2026-01-01"), by = "2 months"),
               labels = date_format("%b %Y")) +
  theme(legend.position = c(0.8, 0.9),
        legend.title = element_blank(),
        axis.text.x = element_text(angle = 45, vjust = 1, hjust = 1)) +
  scale_y_continuous(breaks = 1000*seq(-100, 90, .5),
                     labels = scales::dollar_format(acc = 1, su = " Bn€", pre = ""))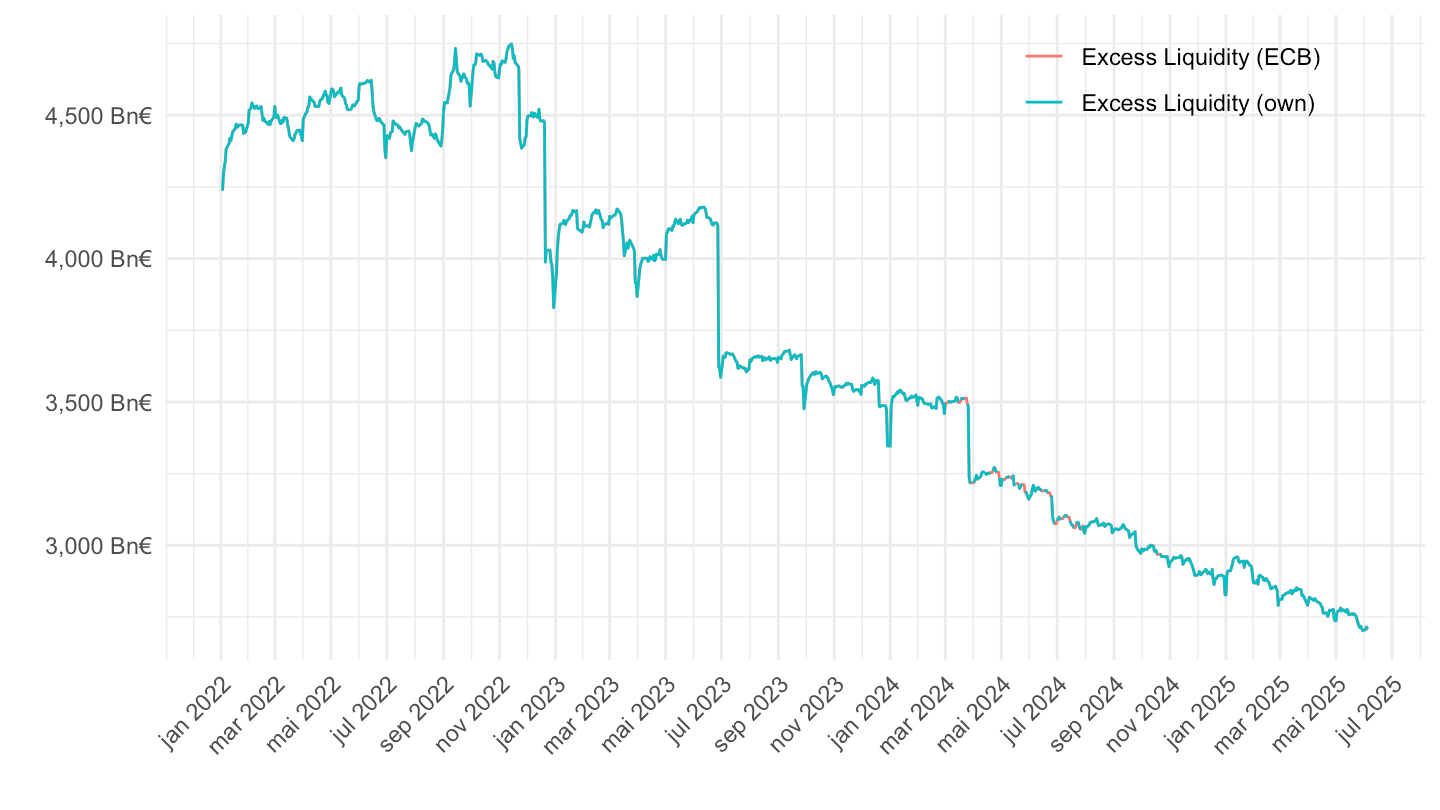
Excess Liquidity
Code
liq_daily %>%
  filter(variable %in% c("excess_liquidity", "reserve_requirements", "current_accounts", "DF", "MLF")) %>%
  group_by(date, variable) %>%
  filter(row_number(value) == 1) %>%
  spread(variable, value) %>%
  transmute(date, value = current_accounts-reserve_requirements+DF-MLF) %>%
  ggplot + geom_line(aes(x = date, y = value/10^3)) +
  xlab("") + ylab("Excess liquidity") + theme_minimal() +
  scale_x_date(breaks = as.Date(paste0(seq(1940, 2030, 2), "-01-01")),
               labels = date_format("%Y")) +
  theme(legend.position = c(0.4, 0.9),
        legend.title = element_blank()) +
  scale_y_continuous(breaks = 1000*seq(-100, 90, .5),
                     labels = scales::dollar_format(acc = 1, su = " Bn€", pre = ""))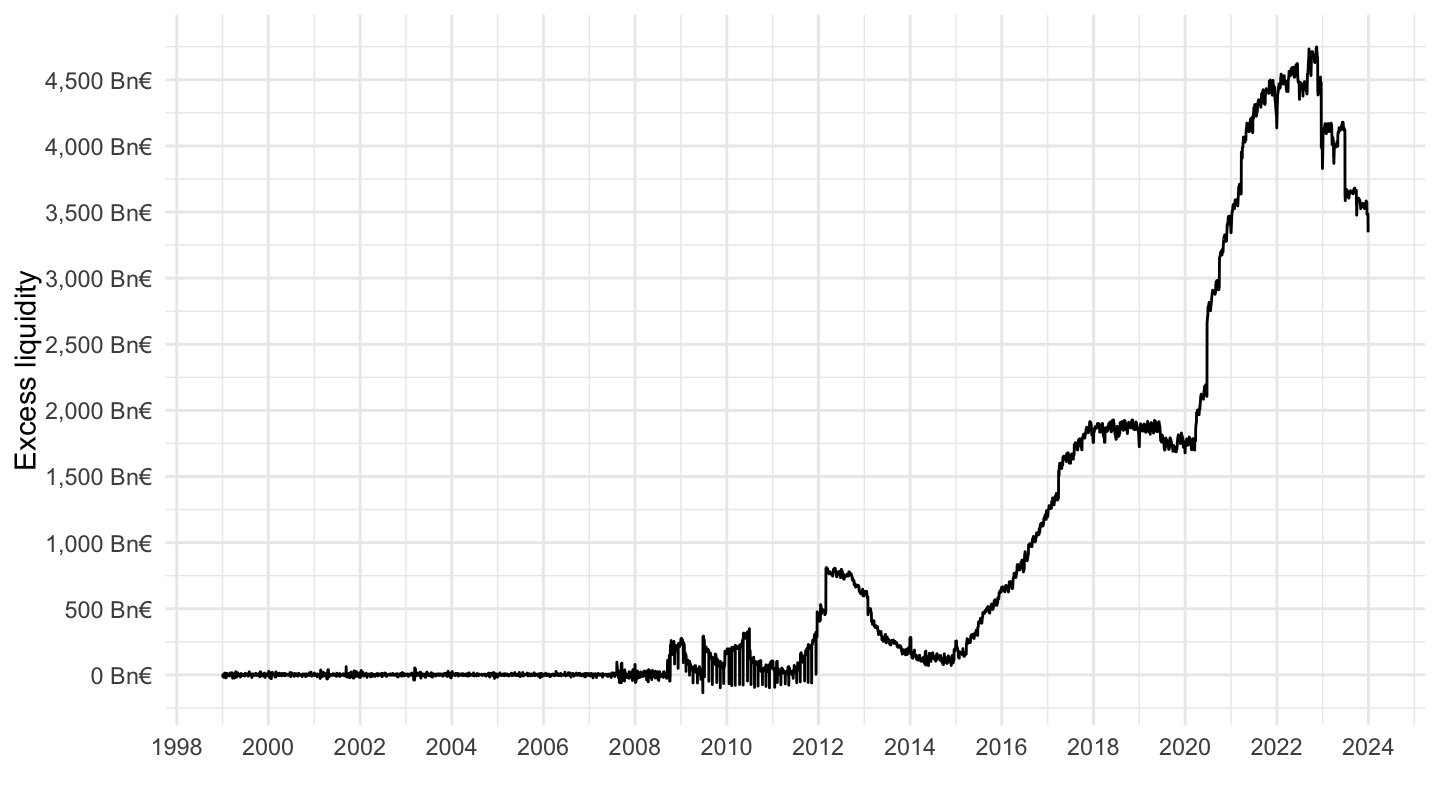
Excess Liquidity & Deposit Facility & Current accounts
All
Code
liq_daily %>%
  left_join(variable, by = "variable") %>%
  filter(Variable %in% c("Excess liquidity", "Deposit facility", "Current accounts")) %>%
  ggplot + geom_line(aes(x = date, y = value/10^3, color = Variable)) +
  xlab("") + ylab("") + theme_minimal() +
  scale_x_date(breaks = as.Date(paste0(seq(1940, 2030, 2), "-01-01")),
               labels = date_format("%Y")) +
  theme(legend.position = c(0.4, 0.9),
        legend.title = element_blank()) +
  scale_y_continuous(breaks = 1000*seq(-100, 90, .5),
                     labels = scales::dollar_format(acc = 1, su = " Bn€", pre = ""))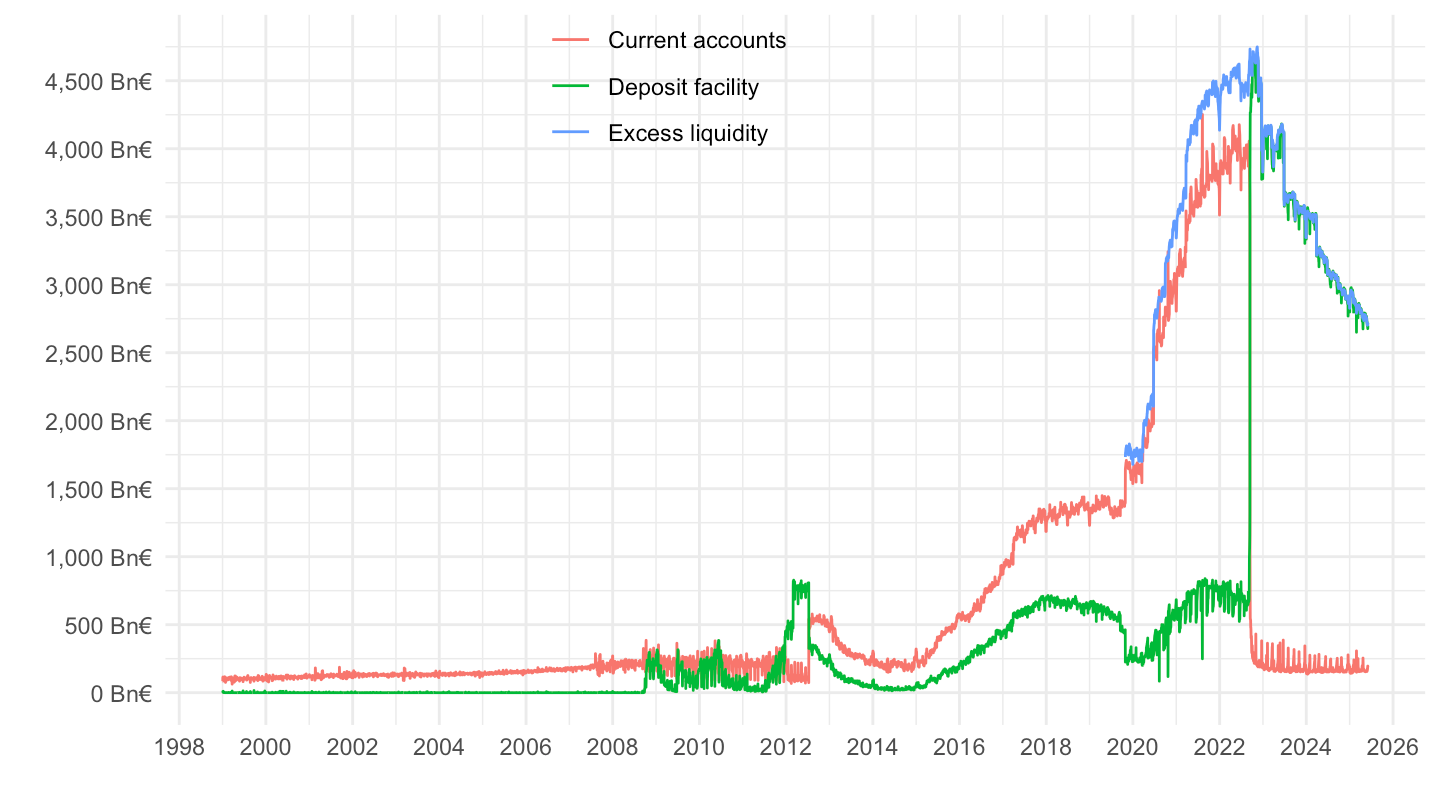
2020-
Code
liq_daily %>%
  left_join(variable, by = "variable") %>%
  filter(date >= as.Date("2020-01-01")) %>%
  filter(Variable %in% c("Excess liquidity", "Deposit facility", "Current accounts")) %>%
  ggplot + geom_line(aes(x = date, y = value/10^3, color = Variable)) +
  xlab("") + ylab("") + theme_minimal() +
  scale_x_date(breaks = seq(from = as.Date("2020-01-01"), Sys.Date(), by = "6 months"),
               labels = date_format("%b %Y")) +
  theme(legend.position = c(0.2, 0.9),
        legend.title = element_blank()) +
  scale_y_continuous(breaks = 1000*seq(-100, 90, .5),
                     labels = scales::dollar_format(acc = 1, su = " Bn€", pre = ""))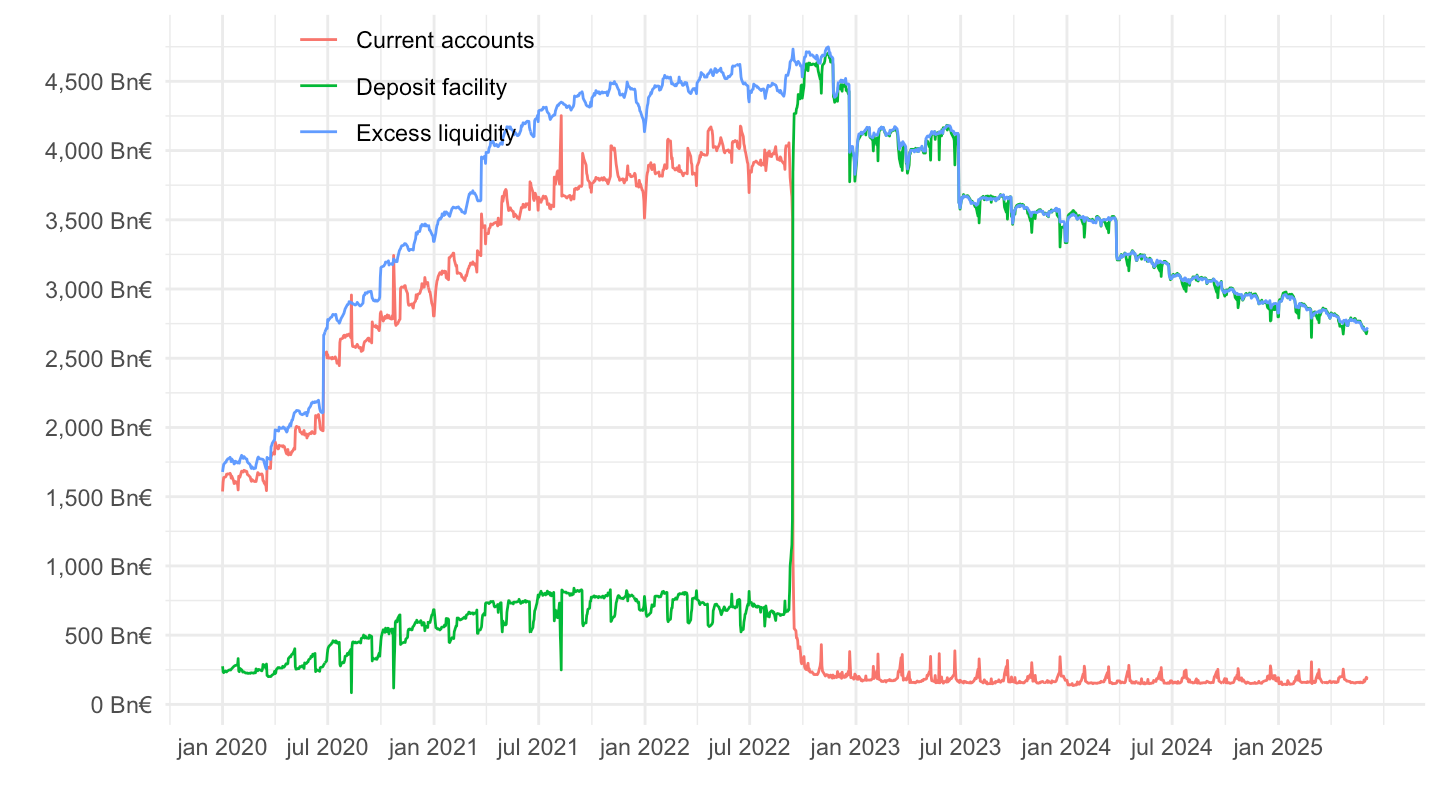
2022-
Code
liq_daily %>%
  left_join(variable, by = "variable") %>%
  filter(date >= as.Date("2022-01-01")) %>%
  filter(Variable %in% c("Excess liquidity", "Deposit facility", "Current accounts")) %>%
  ggplot + geom_line(aes(x = date, y = value/10^3, color = Variable)) +
  xlab("") + ylab("") + theme_minimal() +
  scale_x_date(breaks = seq(from = as.Date("2022-01-01"), as.Date("2026-01-01"), by = "2 months"),
               labels = date_format("%b %Y")) +
  theme(legend.position = c(0.15, 0.5),
        legend.title = element_blank(),
        axis.text.x = element_text(angle = 45, vjust = 1, hjust = 1)) +
  scale_y_continuous(breaks = 1000*seq(-100, 90, .5),
                     labels = scales::dollar_format(acc = 1, su = " Bn€", pre = ""))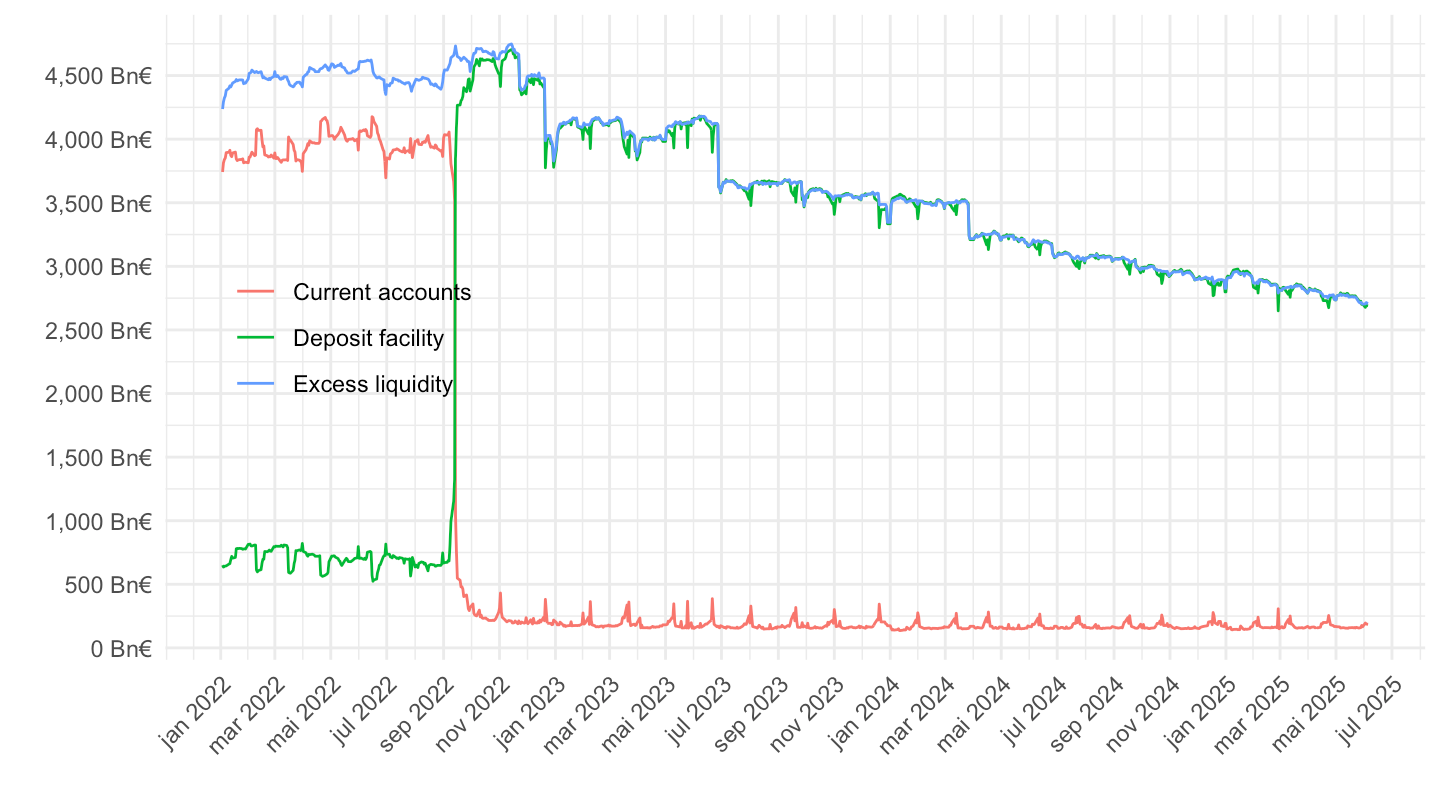
Excess Liquidity & Deposit Facility & Current accounts
All
Code
liq_daily %>%
  left_join(variable, by = "variable") %>%
  filter(Variable %in% c("Excess liquidity", "Deposit facility", "Current accounts", "Marginal lending facility", "Reserve requirements")) %>%
  mutate(Variable = factor(Variable, levels = c("Current accounts", "Reserve requirements", "Deposit facility", "Marginal lending facility", "Excess liquidity"))) %>%
  ggplot + geom_line(aes(x = date, y = value/10^3, color = Variable)) +
  xlab("") + ylab("") + theme_minimal() +
  scale_x_date(breaks = as.Date(paste0(seq(1940, 2030, 2), "-01-01")),
               labels = date_format("%Y")) +
  theme(legend.position = c(0.2, 0.8),
        legend.title = element_blank()) +
  scale_y_continuous(breaks = 1000*seq(-100, 90, .5),
                     labels = scales::dollar_format(acc = 1, su = " Bn€", pre = ""))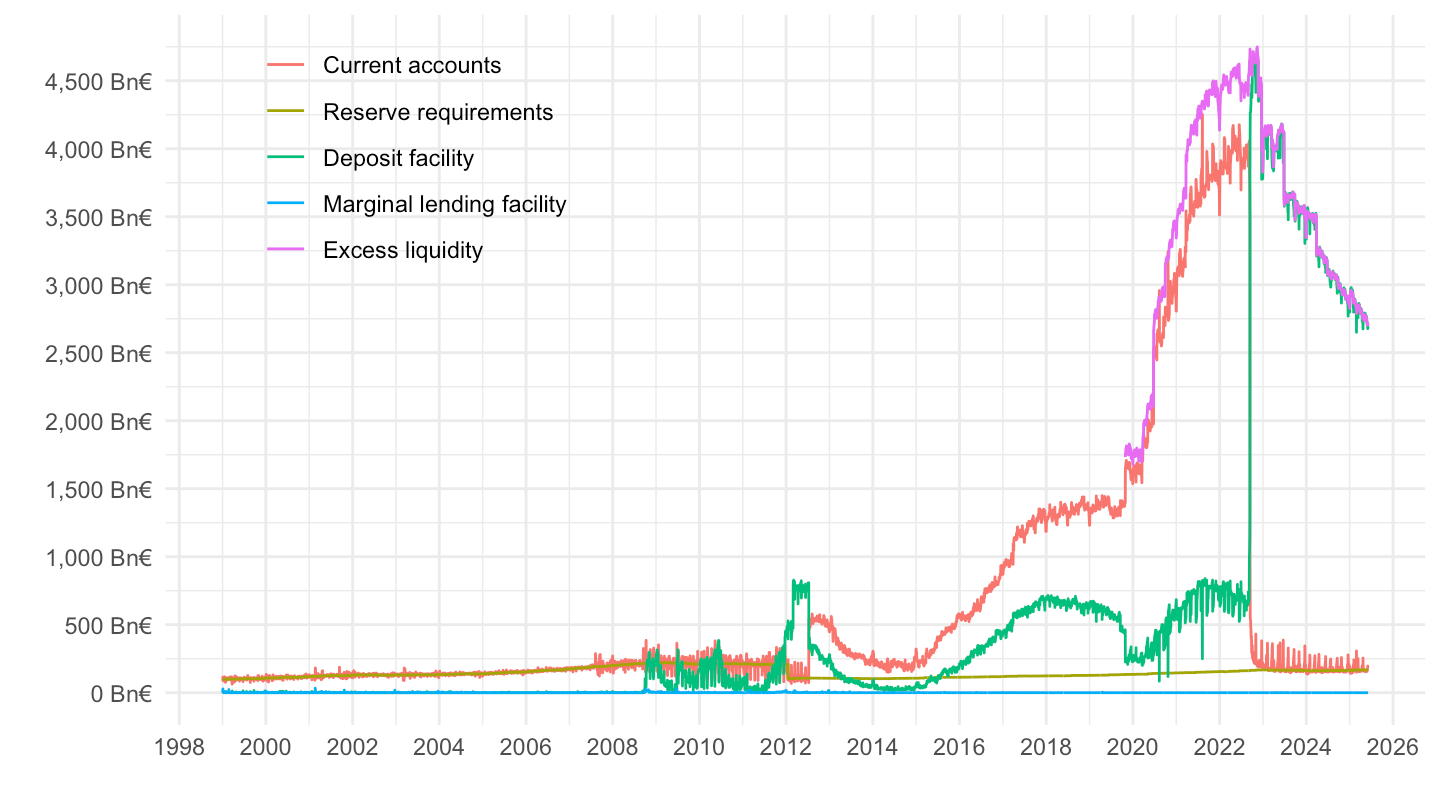
2020-
Code
liq_daily %>%
  left_join(variable, by = "variable") %>%
  filter(date >= as.Date("2020-01-01")) %>%
  filter(Variable %in% c("Excess liquidity", "Deposit facility", "Current accounts", "Marginal lending facility", "Reserve requirements")) %>%
  mutate(Variable = factor(Variable, levels = c("Current accounts", "Reserve requirements", "Deposit facility", "Marginal lending facility", "Excess liquidity"))) %>%
  ggplot + geom_line(aes(x = date, y = value/10^3, color = Variable)) +
  xlab("") + ylab("") + theme_minimal() +
  scale_x_date(breaks = seq(from = as.Date("2020-01-01"), Sys.Date(), by = "6 months"),
               labels = date_format("%b %Y")) +
  theme(legend.position = c(0.5, 0.5),
        legend.title = element_blank()) +
  scale_y_continuous(breaks = 1000*seq(-100, 90, .5),
                     labels = scales::dollar_format(acc = 1, su = " Bn€", pre = ""))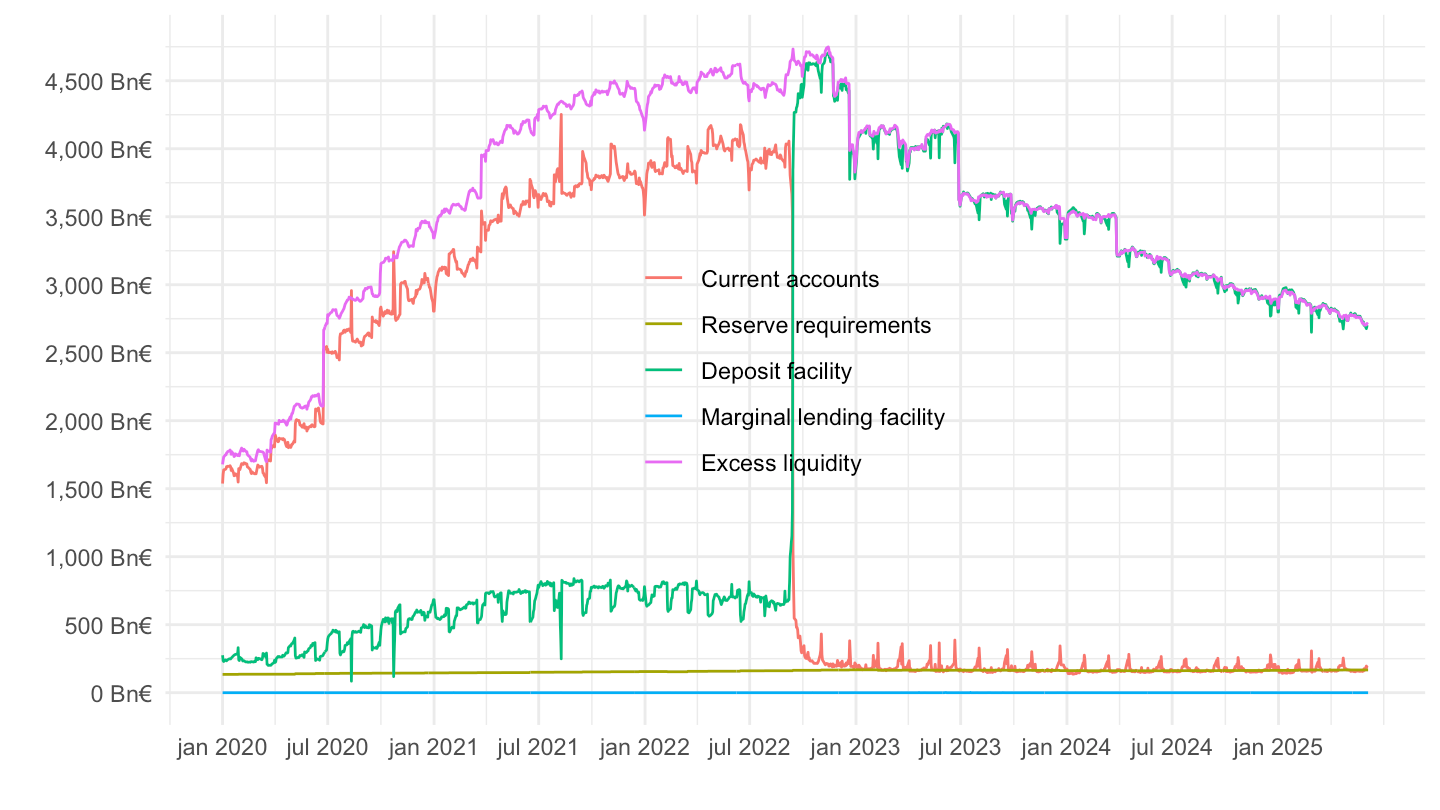
2022-
Code
liq_daily %>%
  left_join(variable, by = "variable") %>%
  filter(date >= as.Date("2022-01-01")) %>%
  filter(Variable %in% c("Excess liquidity", "Deposit facility", "Current accounts", "Marginal lending facility", "Reserve requirements")) %>%
  mutate(Variable = factor(Variable, levels = c("Current accounts", "Reserve requirements", "Deposit facility", "Marginal lending facility", "Excess liquidity"))) %>%
  ggplot + geom_line(aes(x = date, y = value/10^3, color = Variable)) +
  xlab("") + ylab("") + theme_minimal() +
  scale_x_date(breaks = seq(from = as.Date("2022-01-01"), as.Date("2026-01-01"), by = "2 months"),
               labels = date_format("%b %Y")) +
  theme(legend.position = c(0.15, 0.5),
        legend.title = element_blank(),
        axis.text.x = element_text(angle = 45, vjust = 1, hjust = 1)) +
  scale_y_continuous(breaks = 1000*seq(-100, 90, .5),
                     labels = scales::dollar_format(acc = 1, su = " Bn€", pre = ""))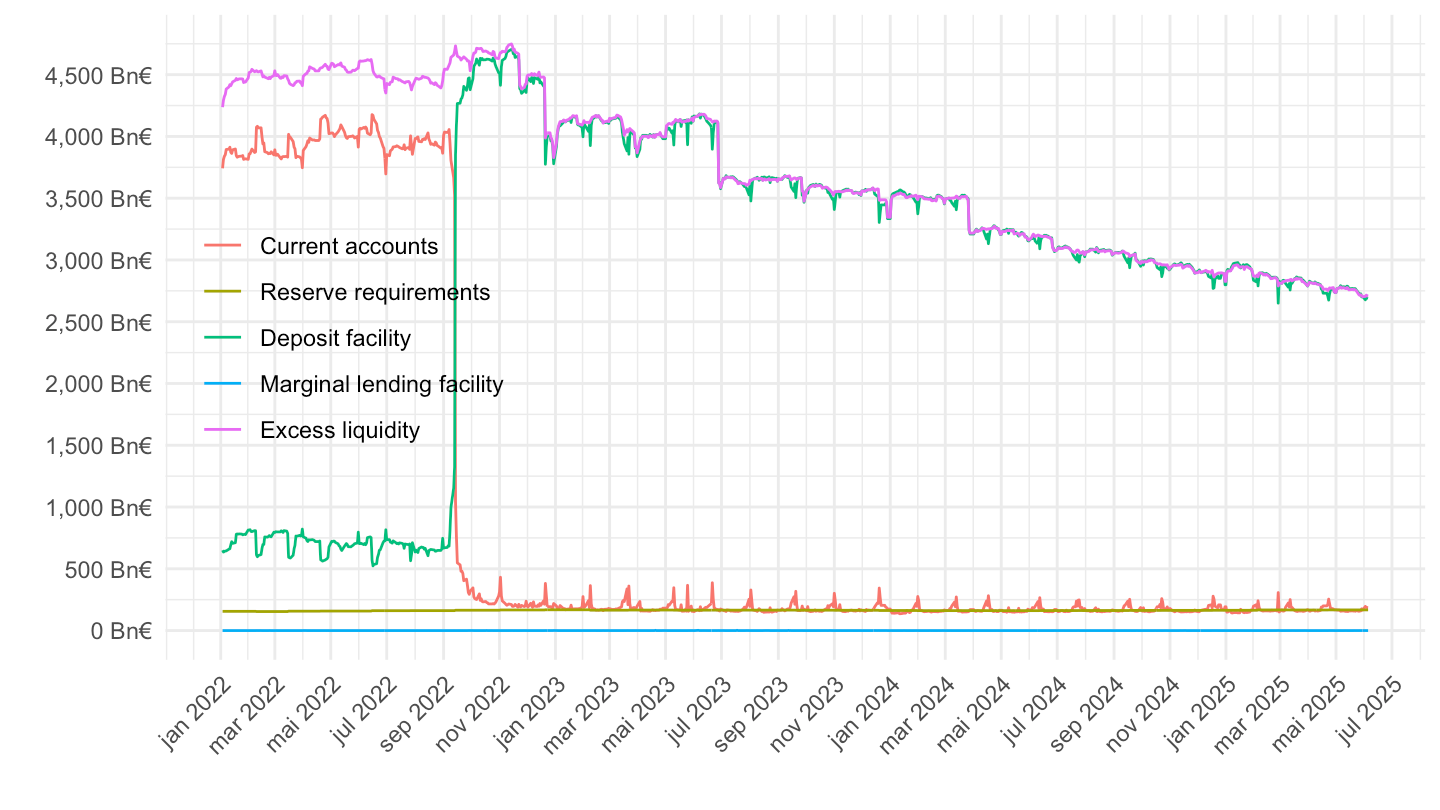
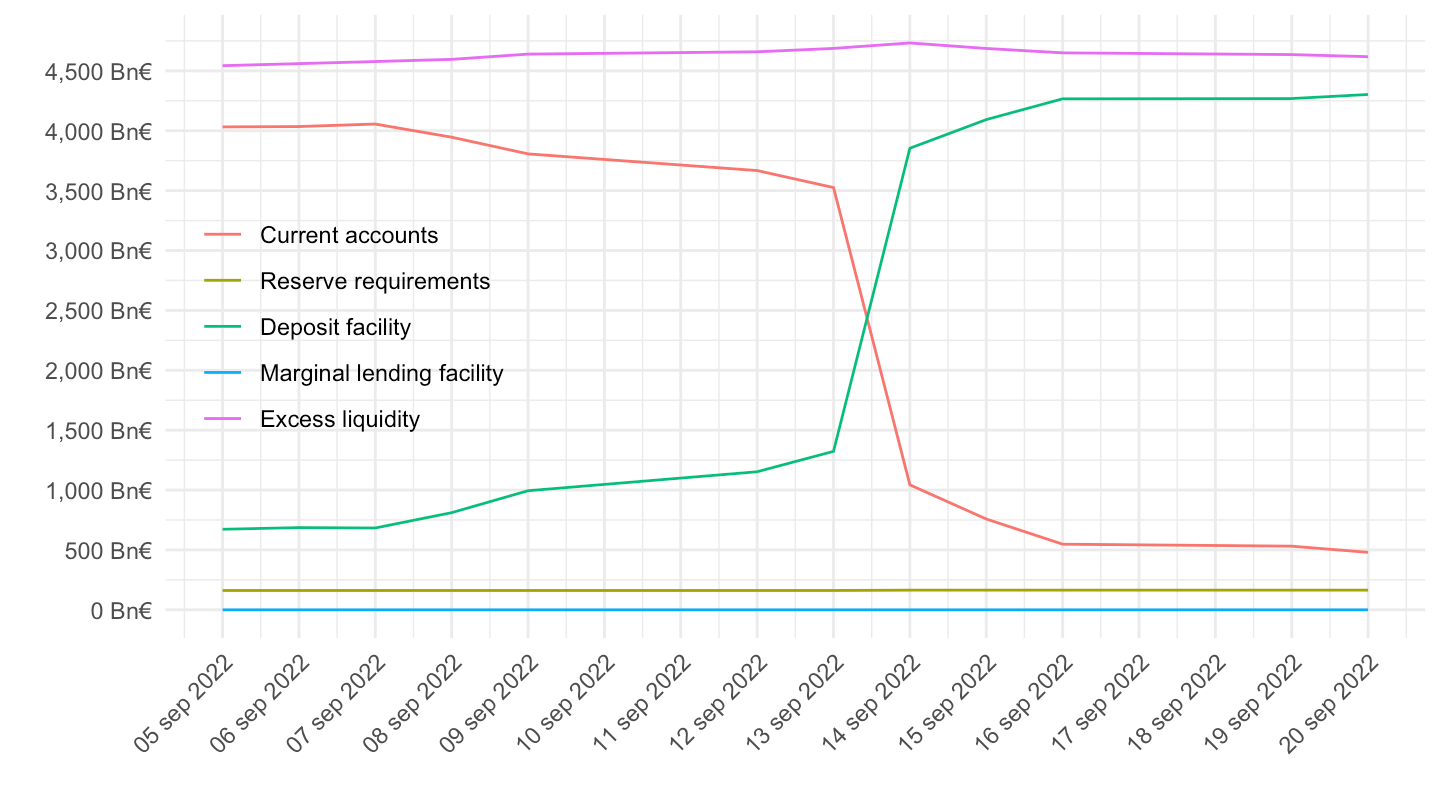
July 2022- Novembre 2022
Code
liq_daily %>%
  left_join(variable, by = "variable") %>%
  filter(date >= as.Date("2022-09-05"),
         date <= as.Date("2022-09-20")) %>%
  filter(Variable %in% c("Excess liquidity", "Deposit facility", "Current accounts", "Marginal lending facility", "Reserve requirements")) %>%
  mutate(Variable = factor(Variable, levels = c("Current accounts", "Reserve requirements", "Deposit facility", "Marginal lending facility", "Excess liquidity"))) %>%
  ggplot + geom_line(aes(x = date, y = value/10^3, color = Variable)) +
  xlab("") + ylab("") + theme_minimal() +
  scale_x_date(breaks = seq(from = as.Date("2022-01-01"), as.Date("2026-01-01"), by = "1 day"),
               labels = date_format("%d %b %Y")) +
  theme(legend.position = c(0.15, 0.5),
        legend.title = element_blank(),
        axis.text.x = element_text(angle = 45, vjust = 1, hjust = 1)) +
  scale_y_continuous(breaks = 1000*seq(-100, 90, .5),
                     labels = scales::dollar_format(acc = 1, su = " Bn€", pre = ""))