Exchange Rates
Data - Fred
Info
LAST_COMPILE
| LAST_COMPILE |
|---|
| 2026-02-21 |
Last
| date | Nobs |
|---|---|
| 2026-02-13 | 3 |
variable
| variable | Variable | Nobs |
|---|---|---|
| DEXJPUS | Japanese Yen to U.S. Dollar Spot Exchange Rate | 14380 |
| DEXUSUK | U.S. Dollars to U.K. Pound Sterling Spot Exchange Rate | 14380 |
| DEXUSEU | U.S. Dollars to Euro Spot Exchange Rate | 7075 |
| CCUSSP01DEM650N | Currency Conversions: US Dollar Exchange Rate: Spot, End of Period: USD: National Currency for Germany | 768 |
U.S. - Euro (Daily)
Daily
All
Code
xrates %>%
  filter(variable == "DEXUSEU") %>%
  ggplot(.) + theme_minimal() + geom_line(aes(date, value)) +
  geom_rect(data = nber_recessions %>%
              filter(Peak >= as.Date("1999-01-01")),
            aes(xmin = Peak, xmax = Trough, ymin = -Inf, ymax = +Inf),
            fill = 'grey', alpha = 0.5) +
  scale_y_continuous(breaks = seq(0.8, 3, 0.2),
                     labels = scales::dollar_format(accuracy = 0.1)) +
  scale_x_date(breaks = seq.Date(as.Date("2000-01-01"), as.Date("2025-01-01"), by = "5 years"),
               labels = date_format("%Y")) +
  theme_minimal() +
  geom_vline(xintercept = as.Date("1971-08-15"), linetype = "dashed", color = viridis(3)[2]) +
  xlab("") + ylab("1 € in $")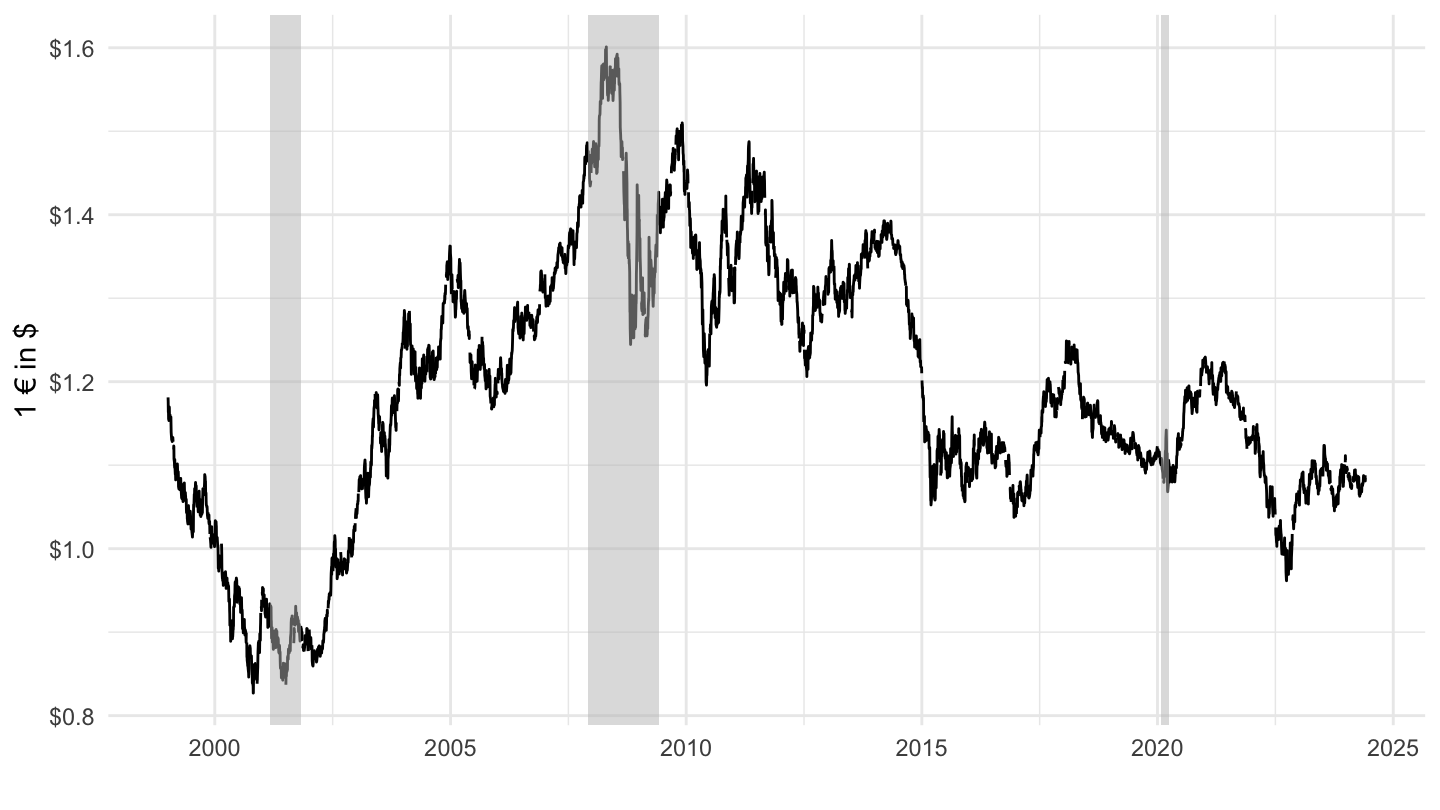
2010-
Code
xrates %>%
  filter(variable == "DEXUSEU",
         date >= as.Date("2010-01-01")) %>%
  ggplot(.) + theme_minimal() + geom_line(aes(date, value)) +
  geom_rect(data = nber_recessions %>%
              filter(Peak >= as.Date("2010-01-01")),
            aes(xmin = Peak, xmax = Trough, ymin = -Inf, ymax = +Inf),
            fill = 'grey', alpha = 0.5) +
  scale_y_continuous(breaks = seq(0.8, 3, 0.1),
                     labels = scales::dollar_format(accuracy = 0.1)) +
  scale_x_date(breaks = seq.Date(as.Date("2000-01-01"), as.Date("2025-01-01"), by = "2 years"),
               labels = date_format("%Y")) +
  theme_minimal() +
  geom_vline(xintercept = as.Date("1971-08-15"), linetype = "dashed", color = viridis(3)[2]) +
  xlab("") + ylab("1 € in $")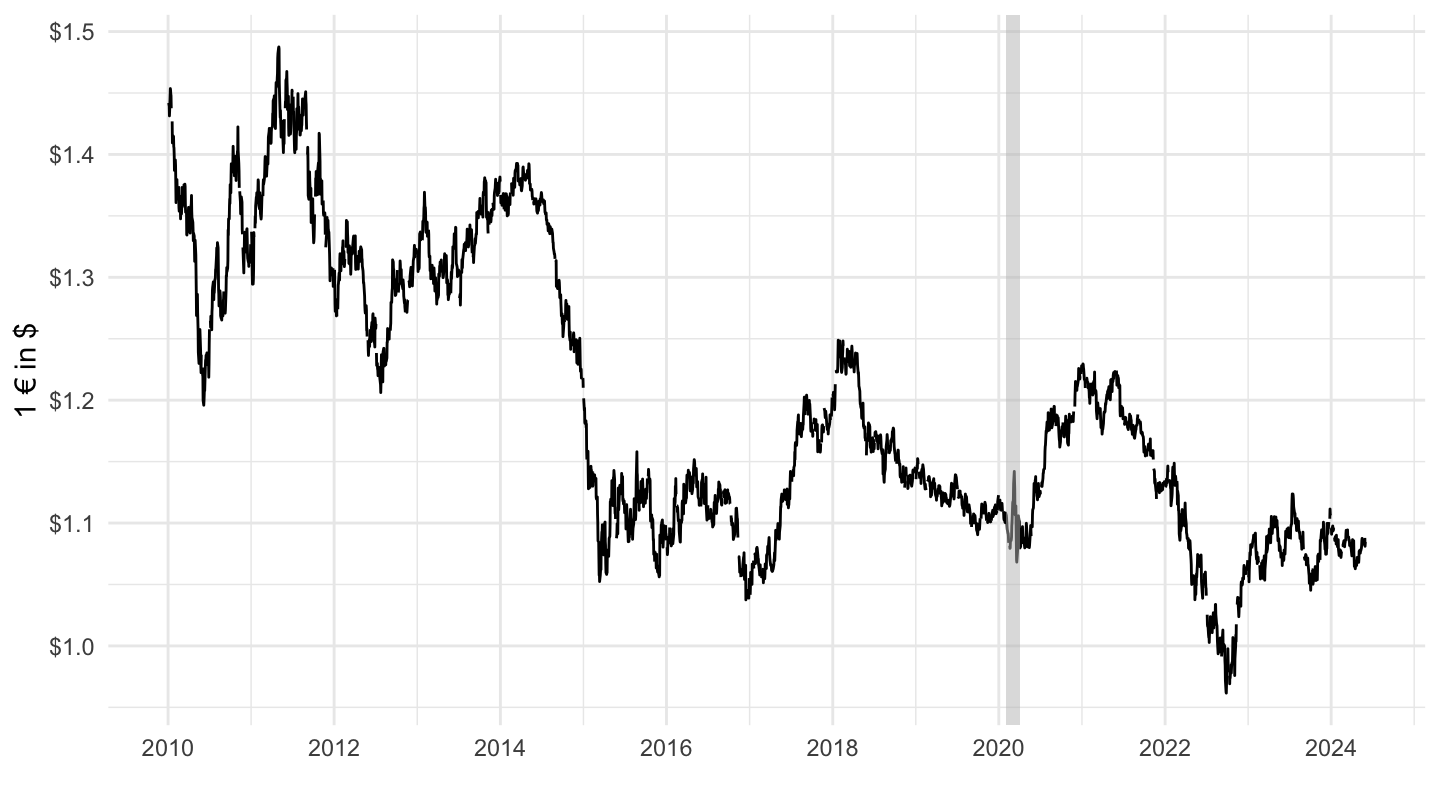
2015-
Code
xrates %>%
  filter(variable == "DEXUSEU",
         date >= as.Date("2015-01-01")) %>%
  ggplot(.) + theme_minimal() + geom_line(aes(date, value)) +
  geom_rect(data = nber_recessions %>%
              filter(Peak >= as.Date("2015-01-01")),
            aes(xmin = Peak, xmax = Trough, ymin = -Inf, ymax = +Inf),
            fill = 'grey', alpha = 0.5) +
  scale_y_continuous(breaks = seq(0.8, 3, 0.02),
                     labels = scales::dollar_format(accuracy = 0.01)) +
  scale_x_date(breaks = seq.Date(as.Date("2000-01-01"), as.Date("2025-01-01"), by = "1 year"),
               labels = date_format("%Y")) +
  theme_minimal() +
  geom_vline(xintercept = as.Date("1971-08-15"), linetype = "dashed", color = viridis(3)[2]) +
  xlab("") + ylab("1 € in $")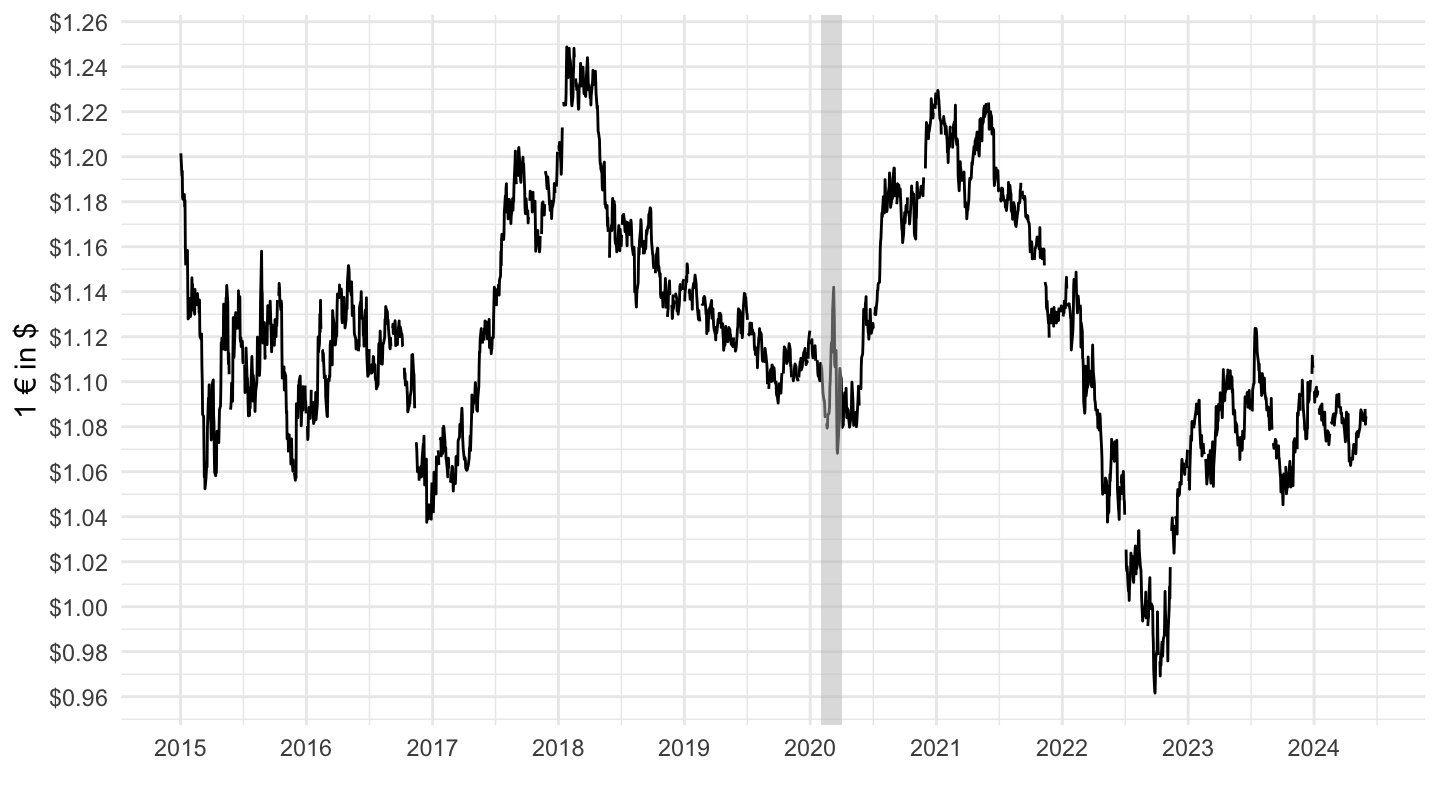
Monthly
All
Code
xrates %>%
  filter(variable == "CCUSSP01DEM650N") %>%
  ggplot(.) + theme_minimal() + geom_line(aes(date, value)) +
  geom_rect(data = nber_recessions %>%
              filter(Peak >= as.Date("1971-01-01")),
            aes(xmin = Peak, xmax = Trough, ymin = -Inf, ymax = +Inf),
            fill = 'grey', alpha = 0.5) +
  scale_y_continuous(breaks = seq(0, 3, 0.1),
                     labels = scales::dollar_format(accuracy = 0.1)) +
  scale_x_date(breaks = c(nber_recessions$Peak, as.Date("2019-01-01")),
               labels = date_format("%Y")) +
  theme_minimal() +
  xlab("") + ylab("1 € or 1.95 DEM in $")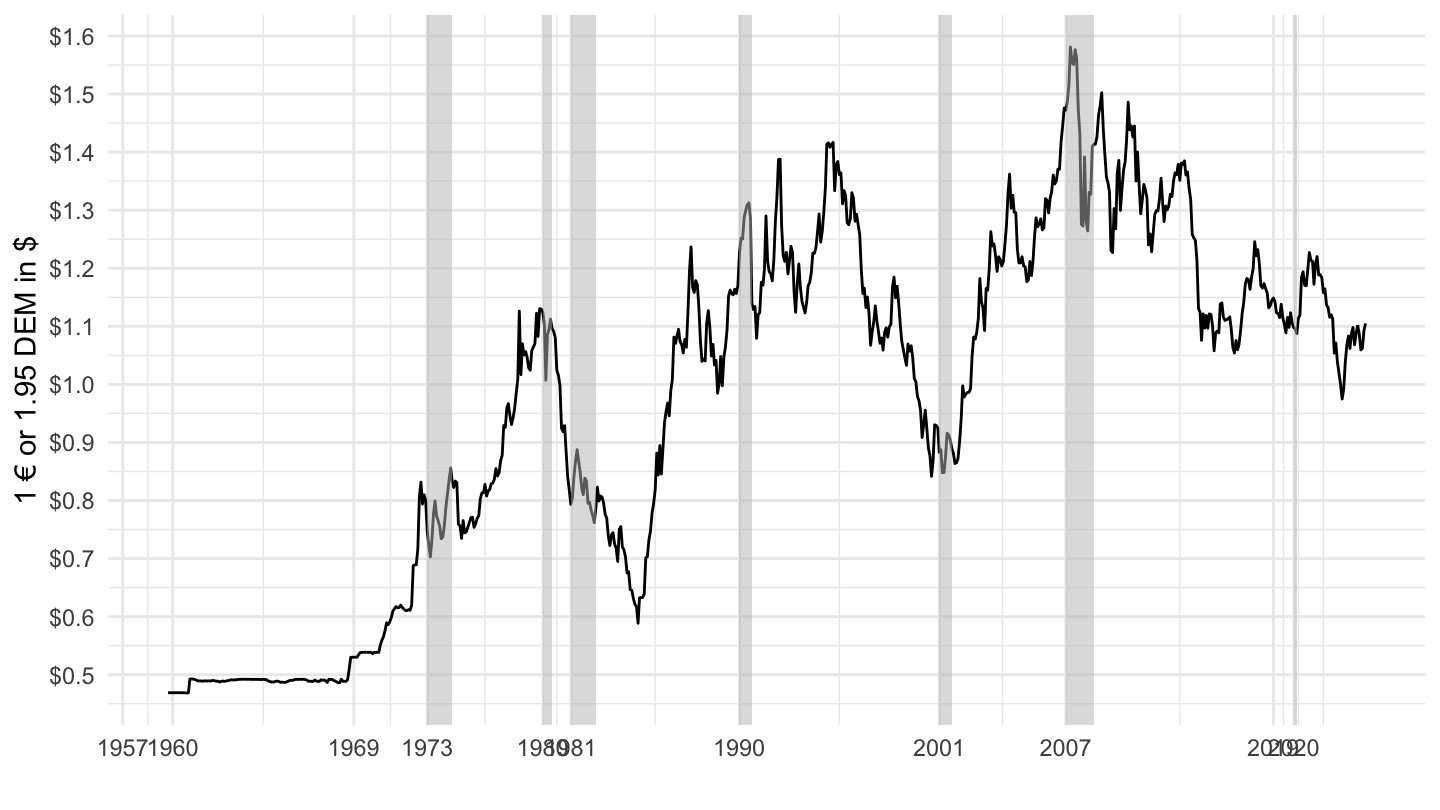
1953-
Code
xrates %>%
  filter(variable == "CCUSSP01DEM650N",
         date >= as.Date("1953-01-01")) %>%
  ggplot(.) + theme_minimal() + geom_line(aes(date, value)) +
  geom_rect(data = nber_recessions %>%
              filter(Peak >= as.Date("1971-01-01")),
            aes(xmin = Peak, xmax = Trough, ymin = -Inf, ymax = +Inf),
            fill = 'grey', alpha = 0.5) +
  scale_y_continuous(breaks = seq(0, 3, 0.1),
                     labels = scales::dollar_format(accuracy = 0.1)) +
  scale_x_date(breaks = c(nber_recessions$Peak, as.Date("2019-01-01")),
               labels = date_format("%Y")) +
  theme_minimal() +
  xlab("") + ylab("1 € or 1.95 DEM in $")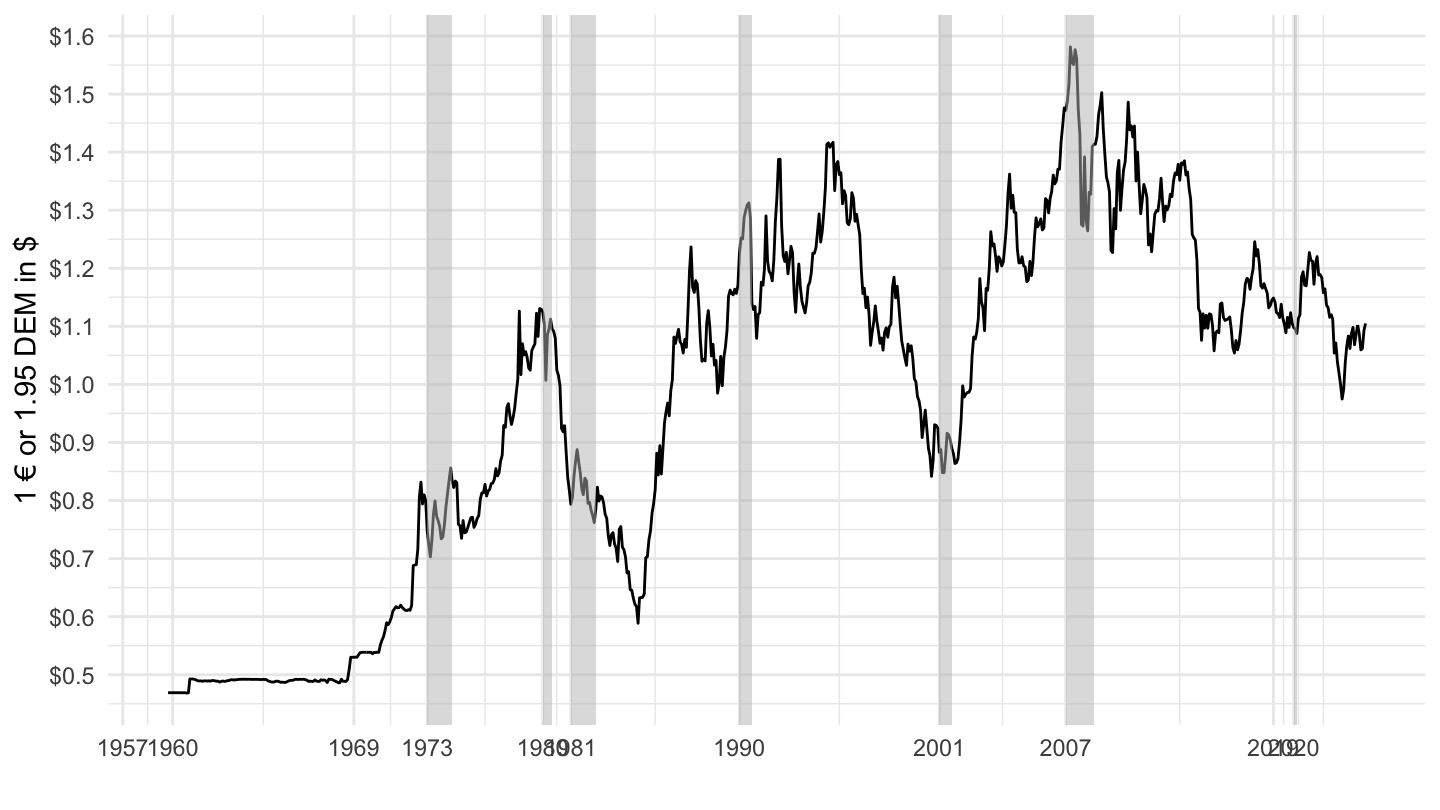
2000-
Code
xrates %>%
  filter(variable == "CCUSSP01DEM650N",
         date >= as.Date("2000-01-01")) %>%
  ggplot(.) + theme_minimal() + geom_line(aes(date, value)) +
  geom_rect(data = nber_recessions %>%
              filter(Peak >= as.Date("2000-01-01")),
            aes(xmin = Peak, xmax = Trough, ymin = -Inf, ymax = +Inf),
            fill = 'grey', alpha = 0.5) +
  scale_y_continuous(breaks = seq(0, 3, 0.1),
                     labels = scales::dollar_format(accuracy = 0.1)) +
  scale_x_date(breaks = seq.Date(ymd("1996-01-01"), ymd("2100-01-01"), "2 years"),
               labels = date_format("%Y")) +
  theme_minimal() +
  xlab("") + ylab("1 € or 1.95 DEM in $")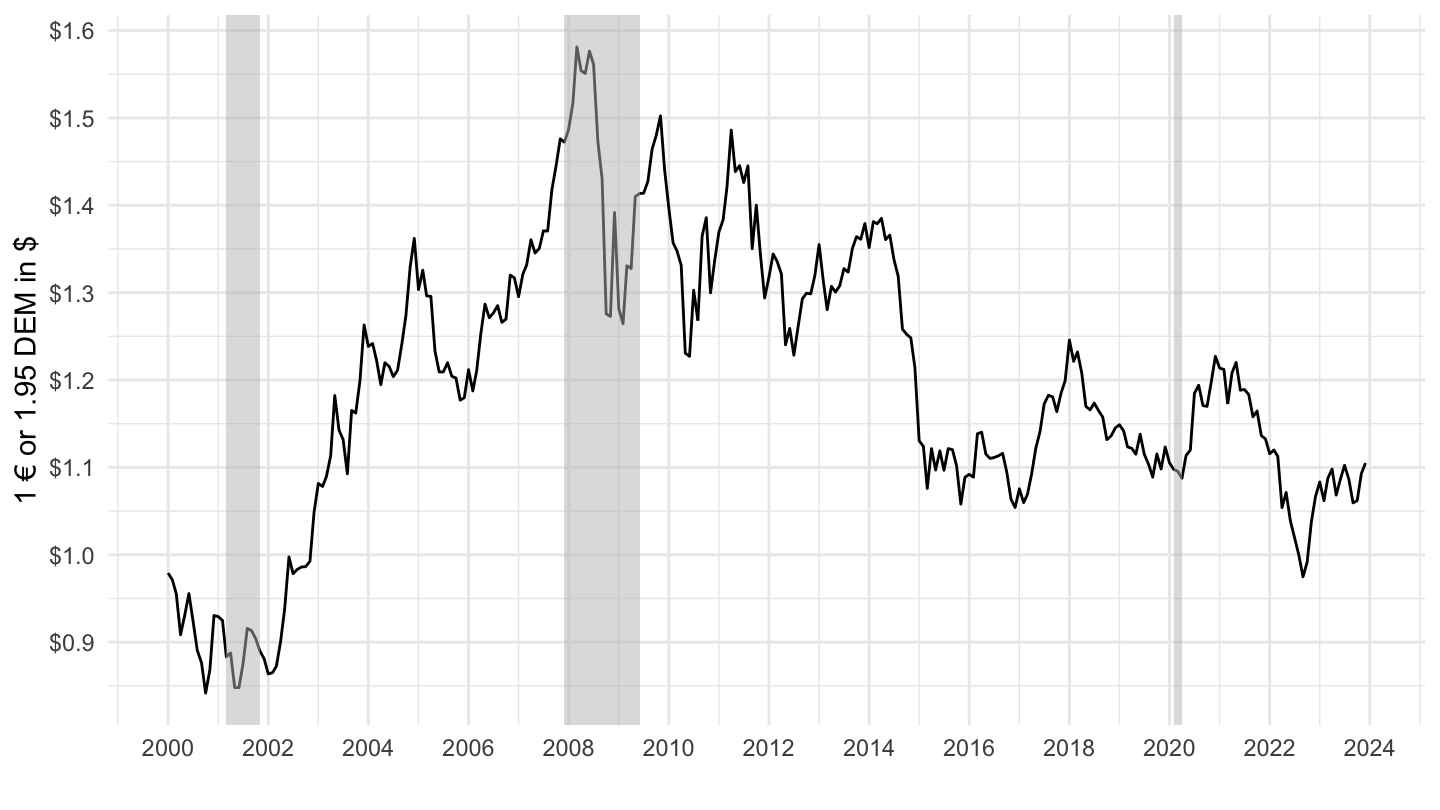
Japanese Yen to U.S. Dollar Spot Exchange Rate - DEXJPUS
All
Code
xrates %>%
  filter(variable == "DEXJPUS") %>%
  ggplot(.) + theme_minimal() + geom_line(aes(date, value)) +
  geom_rect(data = nber_recessions %>%
              filter(Peak >= as.Date("1971-01-01")),
            aes(xmin = Peak, xmax = Trough, ymin = -Inf, ymax = +Inf),
            fill = 'grey', alpha = 0.5) +
  scale_y_reverse(breaks = seq(50, 1000, 50),
                     labels = scales::dollar_format(accuracy = 1, su = "¥", pre = "")) +
  scale_x_date(breaks = c(nber_recessions$Peak, as.Date("2019-01-01")),
               labels = date_format("%Y")) +
  theme_minimal() +
  xlab("") + ylab("$1 in ¥")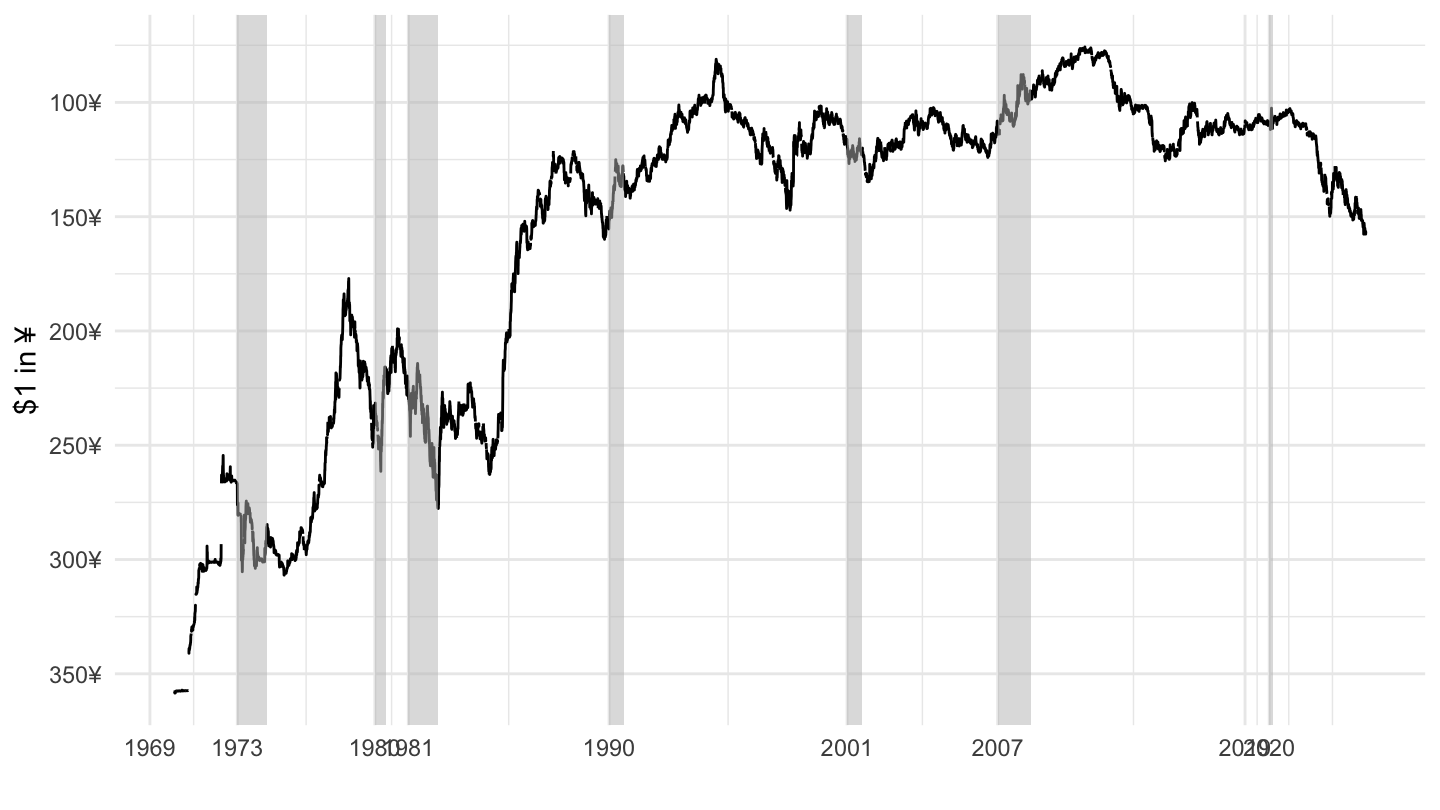
2000-
Code
xrates %>%
  filter(variable == "DEXJPUS",
         date >= as.Date("2000-01-01")) %>%
  ggplot(.) + theme_minimal() + geom_line(aes(date, value)) +
  scale_y_reverse(breaks = seq(50, 1000, 10),
                     labels = scales::dollar_format(accuracy = 1, su = "¥", pre = "")) +
  scale_x_date(breaks = seq.Date(as.Date("2000-01-01"), as.Date("2025-01-01"), by = "2 years"),
               labels = date_format("%Y")) +
  theme_minimal() +
  xlab("") + ylab("$1 in ¥")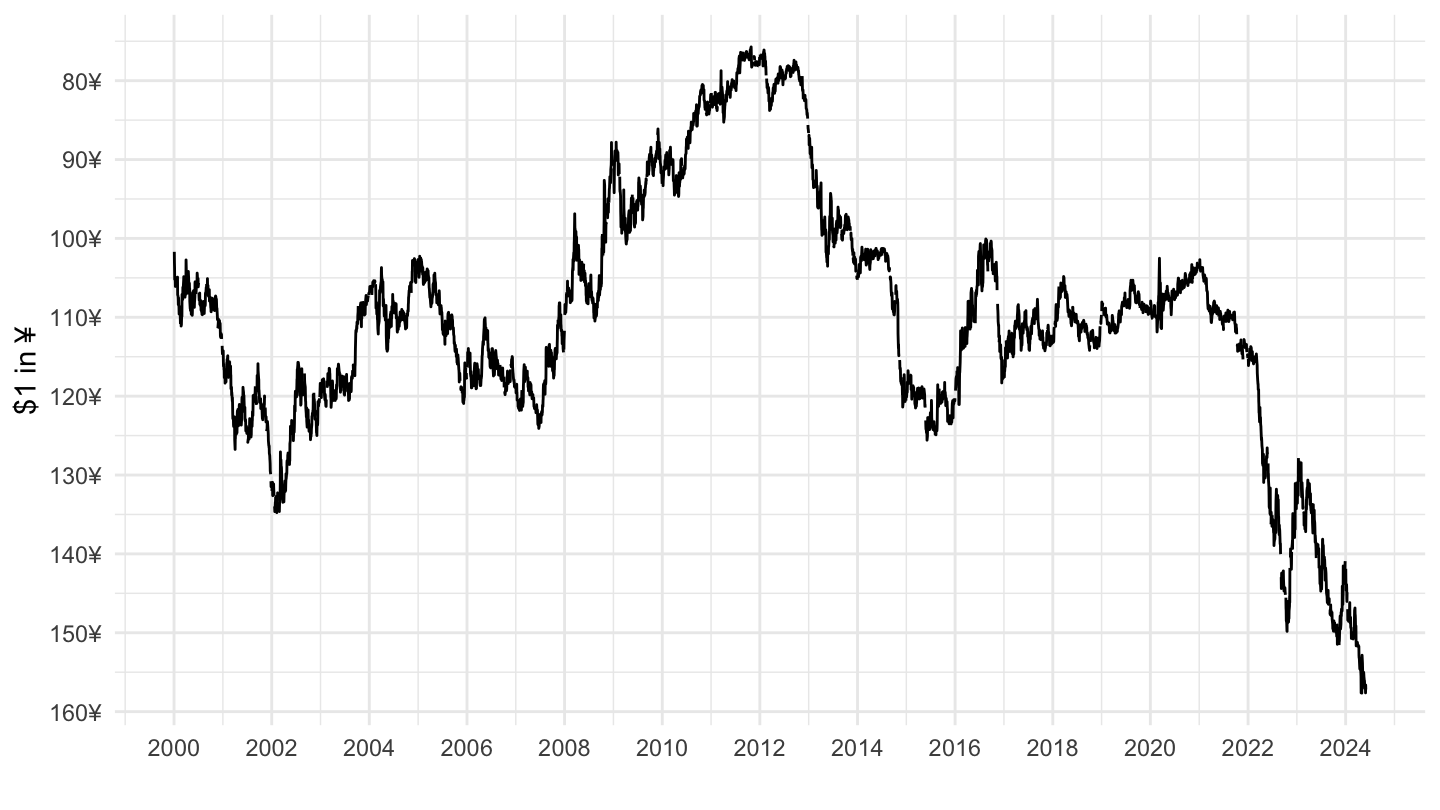
2020-
Code
xrates %>%
  filter(variable == "DEXJPUS",
         date >= as.Date("2020-01-01")) %>%
  ggplot(.) + theme_minimal() + geom_line(aes(date, value)) +
  scale_y_reverse(breaks = seq(50, 1000, 5),
                     labels = scales::dollar_format(accuracy = 1, su = "¥", pre = "")) +
  scale_x_date(breaks = seq.Date(as.Date("2000-01-01"), as.Date("2025-01-01"), by = "6 months"),
               labels = date_format("%b %y")) +
  theme_minimal() +
  xlab("") + ylab("$1 in ¥")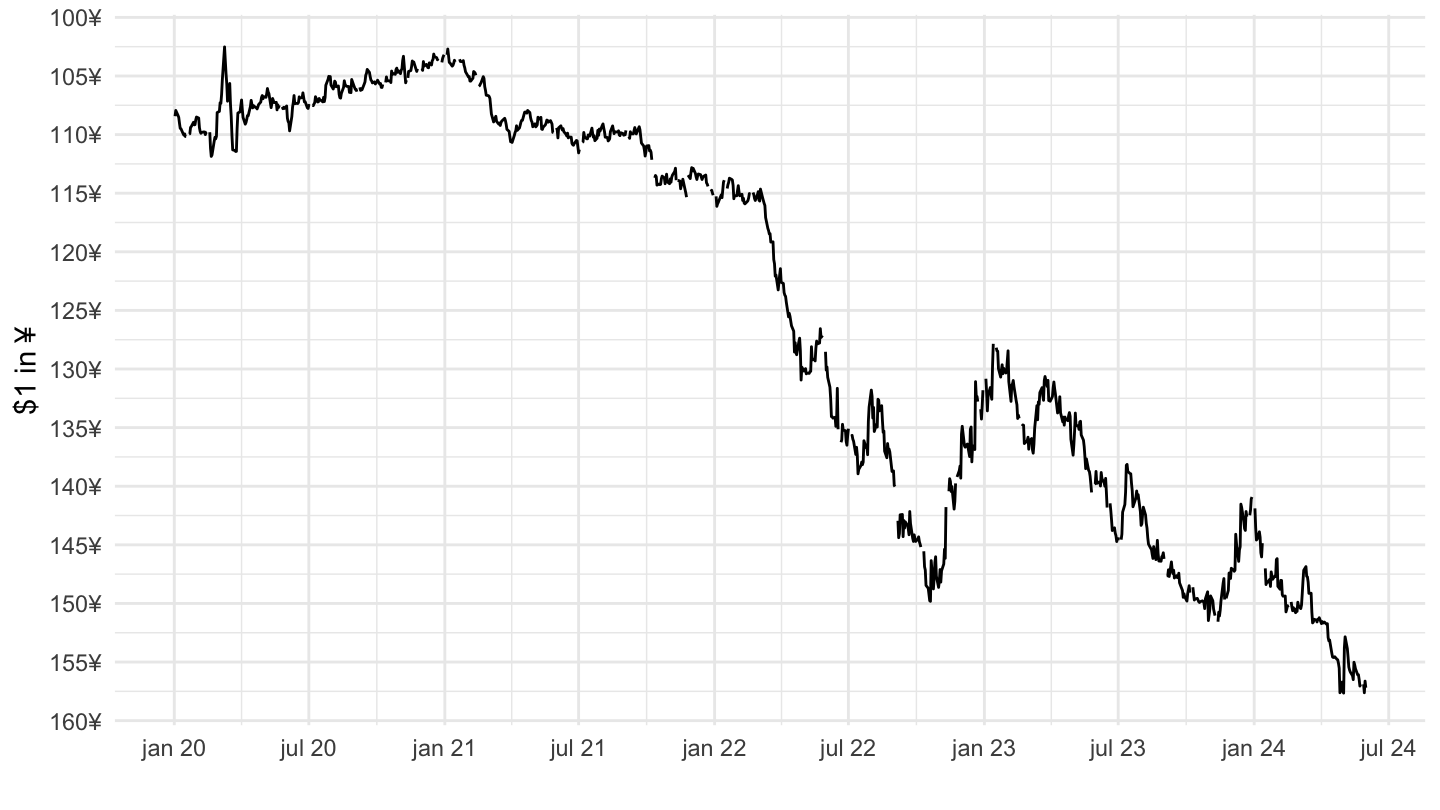
2021-
Code
xrates %>%
  filter(variable == "DEXJPUS",
         date >= as.Date("2021-01-01")) %>%
  ggplot(.) + theme_minimal() + geom_line(aes(date, value)) +
  scale_y_reverse(breaks = seq(50, 1000, 5),
                     labels = scales::dollar_format(accuracy = 1, su = "¥", pre = "")) +
  scale_x_date(breaks = seq.Date(as.Date("2000-01-01"), as.Date("2025-01-01"), by = "2 months"),
               labels = date_format("%b %y")) +
  theme_minimal() +
  xlab("") + ylab("$1 in ¥")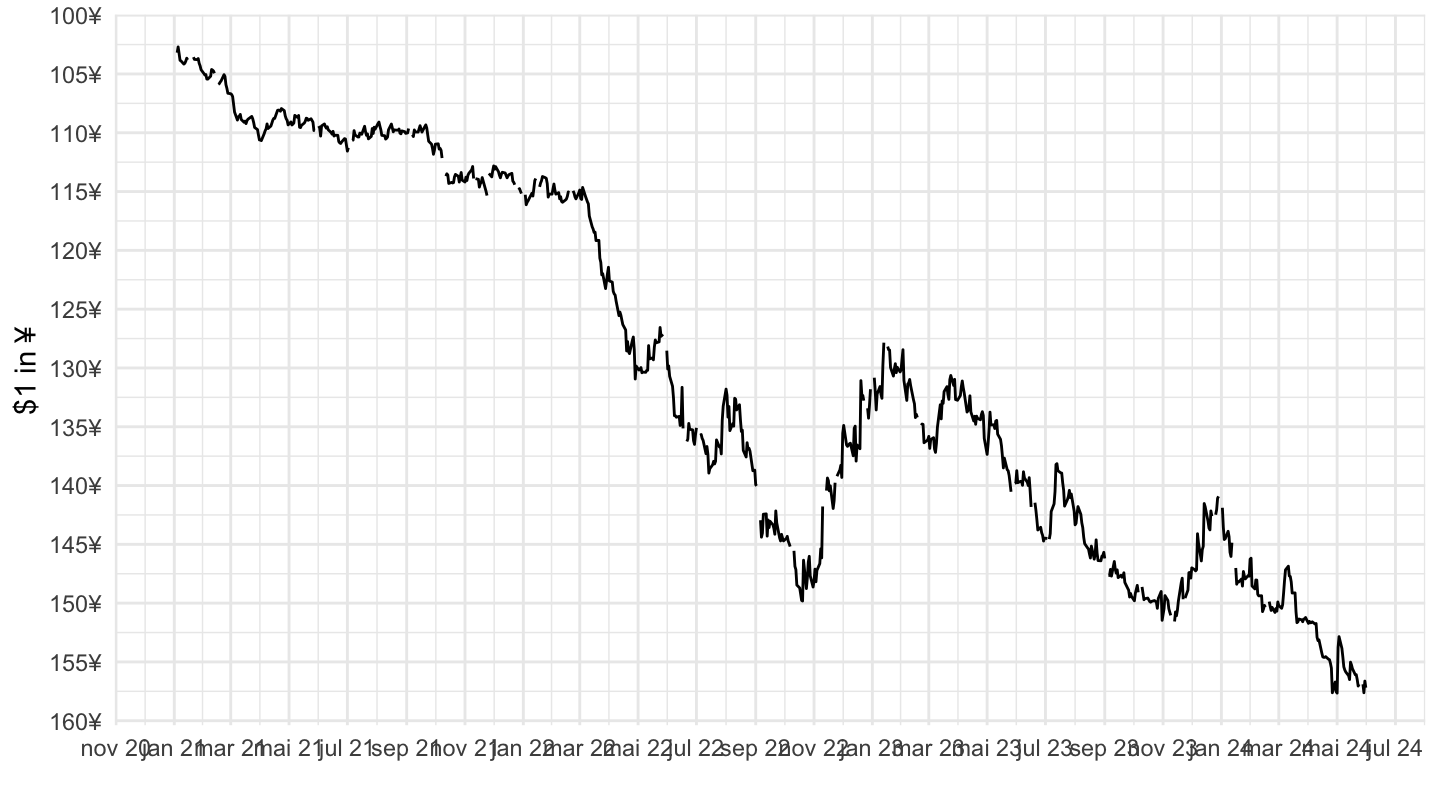
U.S. - U.K Nominal Exchange Rate
All
Code
xrates %>%
  filter(variable == "DEXUSUK",
         date >= as.Date("1953-01-01")) %>%
  ggplot(.) + theme_minimal() + geom_line(aes(date, value)) +
  geom_rect(data = nber_recessions %>%
              filter(Peak >= as.Date("1971-01-01")),
            aes(xmin = Peak, xmax = Trough, ymin = -Inf, ymax = +Inf),
            fill = 'grey', alpha = 0.5) +
  scale_y_continuous(breaks = seq(0.8, 3, 0.2),
                     labels = scales::dollar_format(accuracy = 0.1)) +
  scale_x_date(breaks = c(nber_recessions$Peak, as.Date("2019-01-01")),
               labels = date_format("%Y")) +
  theme_minimal() +
  geom_vline(xintercept = as.Date("1971-08-15"), linetype = "dashed", color = viridis(3)[2]) +
  xlab("") + ylab("1 £ in $")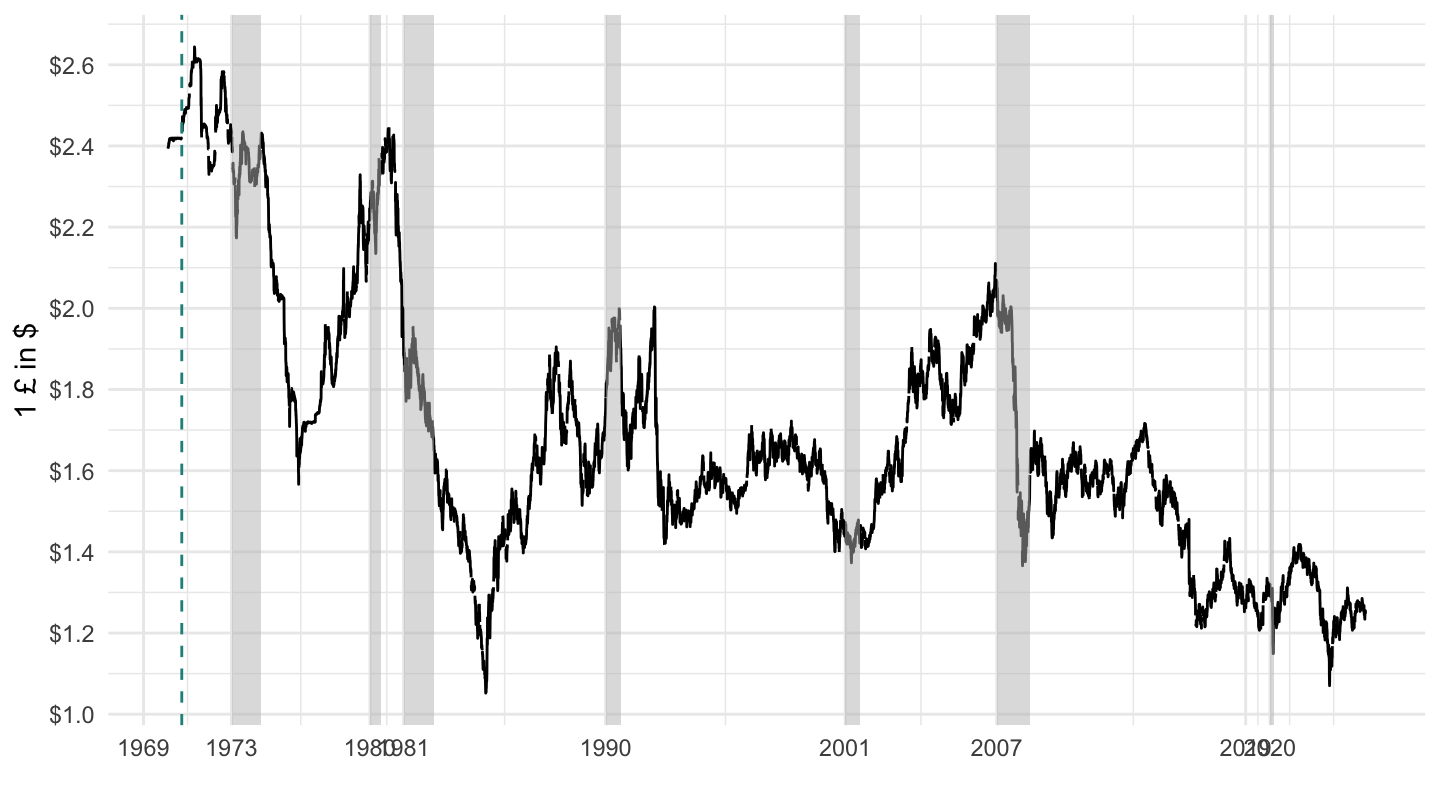
2010-
Code
xrates %>%
  filter(variable == "DEXUSUK",
         date >= as.Date("2010-01-01")) %>%
  ggplot(.) + theme_minimal() + geom_line(aes(date, value)) +
  geom_rect(data = nber_recessions %>%
              filter(Peak >= as.Date("2010-01-01")),
            aes(xmin = Peak, xmax = Trough, ymin = -Inf, ymax = +Inf),
            fill = 'grey', alpha = 0.5) +
  scale_y_continuous(breaks = seq(0.8, 3, 0.1),
                     labels = scales::dollar_format(accuracy = 0.1)) +
  scale_x_date(breaks = seq.Date(as.Date("2000-01-01"), as.Date("2025-01-01"), by = "2 years"),
               labels = date_format("%Y")) +
  theme_minimal() +
  geom_vline(xintercept = as.Date("1971-08-15"), linetype = "dashed", color = viridis(3)[2]) +
  xlab("") + ylab("1 £ in $")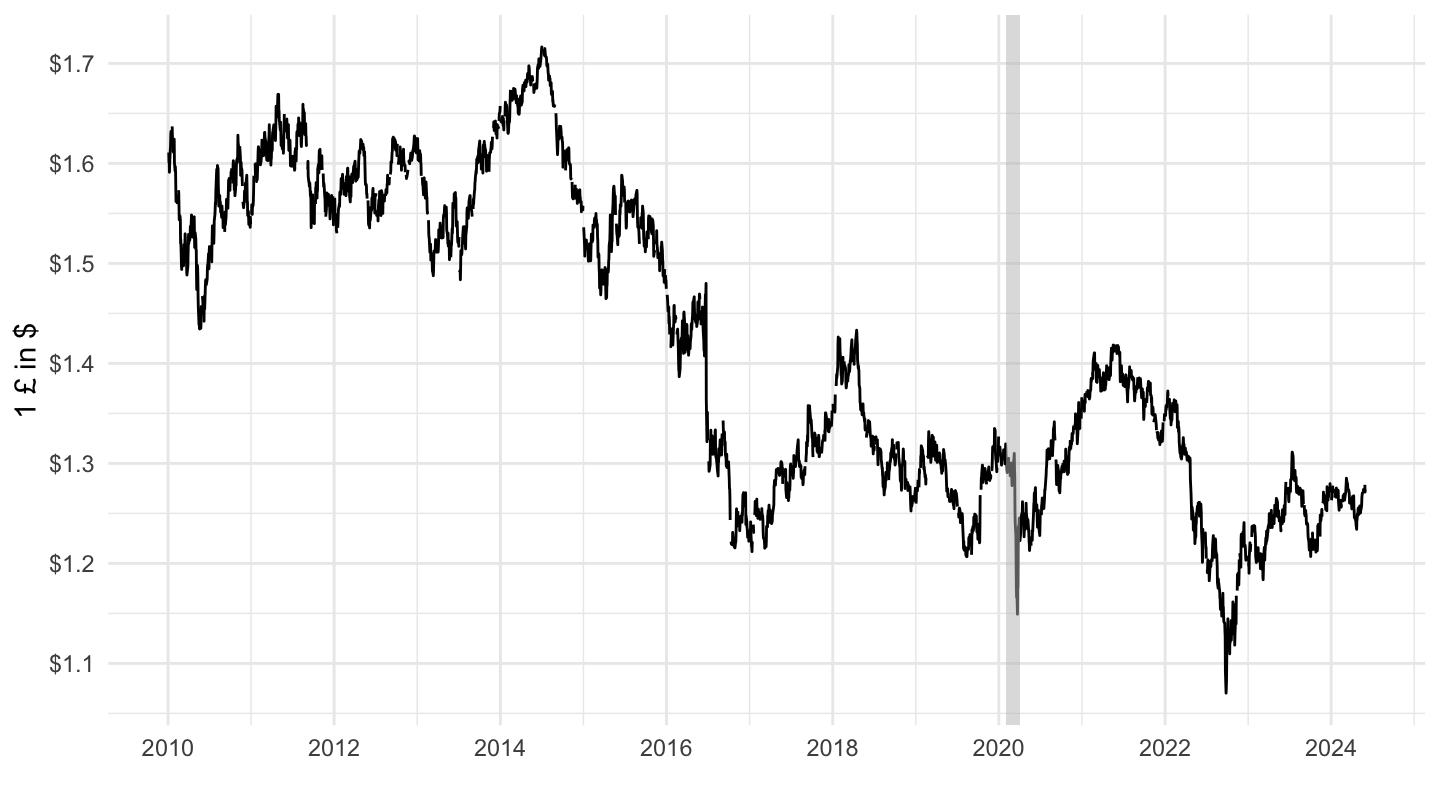
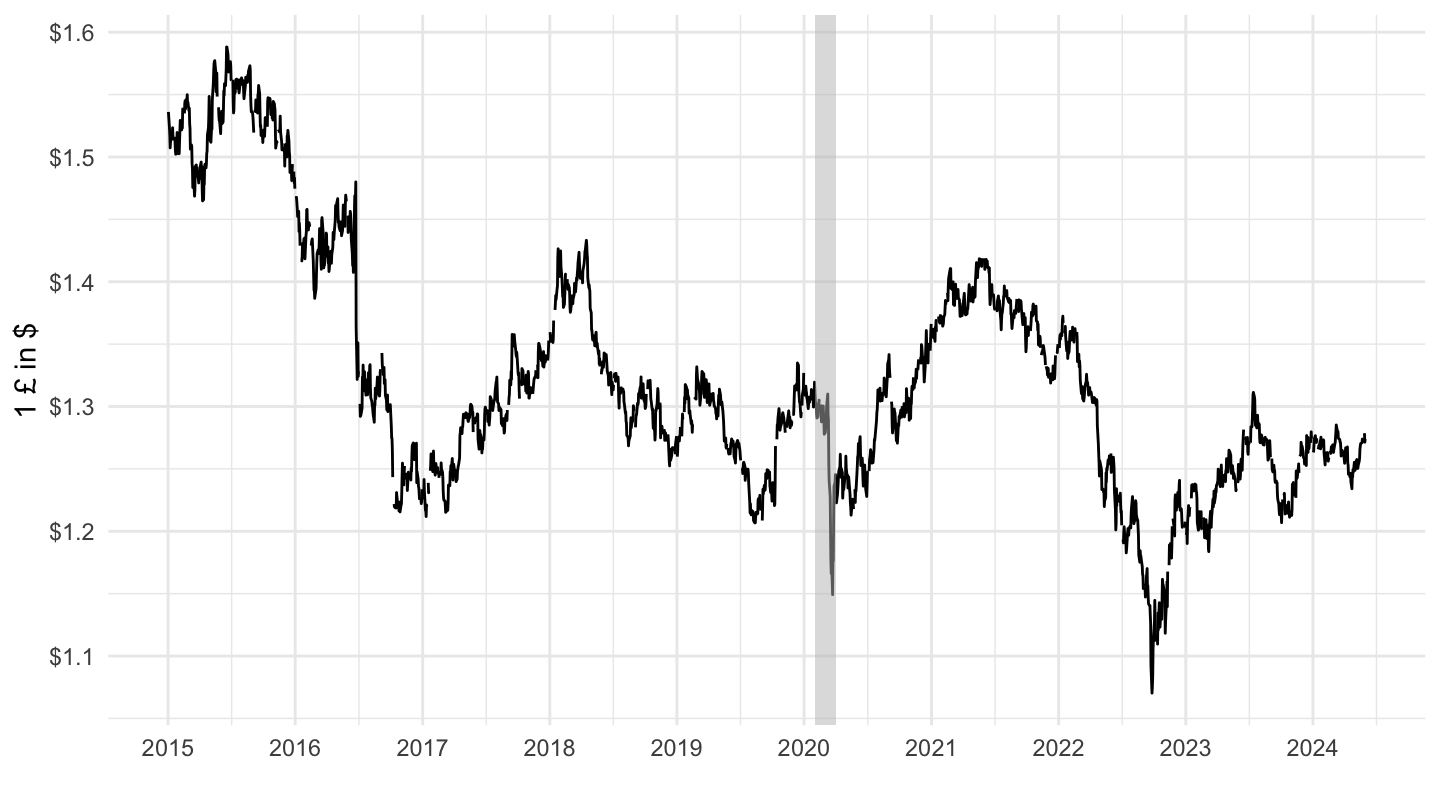
2015-
Code
xrates %>%
  filter(variable == "DEXUSUK",
         date >= as.Date("2015-01-01")) %>%
  ggplot(.) + theme_minimal() + geom_line(aes(date, value)) +
  geom_rect(data = nber_recessions %>%
              filter(Peak >= as.Date("2015-01-01")),
            aes(xmin = Peak, xmax = Trough, ymin = -Inf, ymax = +Inf),
            fill = 'grey', alpha = 0.5) +
  scale_y_continuous(breaks = seq(0.8, 3, 0.1),
                     labels = scales::dollar_format(accuracy = 0.1)) +
  scale_x_date(breaks = seq.Date(as.Date("2000-01-01"), as.Date("2025-01-01"), by = "1 year"),
               labels = date_format("%Y")) +
  theme_minimal() +
  geom_vline(xintercept = as.Date("1971-08-15"), linetype = "dashed", color = viridis(3)[2]) +
  xlab("") + ylab("1 £ in $")