Balance Sheet Items - Published series
Data - ECB
Info
Last observation: Monthly: 2026-06 (N = 163)
First observation: Monthly: 1980-01 (N = 7)
Last data update: 13 aoû 2026, 01:28. Last compile: 13 aoû 2026, 08:17
Structure
Info
Data on monetary policy
| source | dataset | Title | .html | .rData |
|---|---|---|---|---|
| ecb | BSI_PUB | Balance Sheet Items - Published series | 2026-08-12 | 2026-08-11 |
| bdf | FM | Marché financier, taux | 2026-08-11 | 2026-08-10 |
| bdf | MIR | Taux d'intérêt - Zone euro | 2026-08-11 | 2026-08-10 |
| bdf | MIR1 | Taux d'intérêt - France | 2026-08-11 | 2026-08-10 |
| bis | CBPOL | Policy Rates, Daily | 2026-08-11 | 2026-07-25 |
| ecb | BSI | Balance Sheet Items | 2026-08-12 | 2026-08-11 |
| ecb | FM | Financial market data | 2026-08-12 | 2026-08-11 |
| ecb | ILM | Internal Liquidity Management | 2026-08-12 | 2026-08-11 |
| ecb | ILM_PUB | Internal Liquidity Management - Published series | 2026-08-12 | 2026-08-11 |
| ecb | MIR | MFI Interest Rate Statistics | 2026-08-12 | 2026-08-11 |
| ecb | RAI | Risk Assessment Indicators | 2026-08-12 | 2026-08-11 |
| ecb | SUP | Supervisory Banking Statistics | 2026-08-12 | 2026-08-12 |
| ecb | YC | Financial market data - yield curve | 2026-08-12 | 2026-08-12 |
| ecb | YC_PUB | Financial market data - yield curve - Published series | 2026-08-12 | 2026-08-12 |
| ecb | liq_daily | Daily Liquidity | 2026-08-12 | 2026-08-12 |
| eurostat | ei_mfir_m | Interest rates - monthly data | 2026-08-11 | 2026-08-11 |
| eurostat | irt_st_m | Money market interest rates - monthly data | 2026-08-11 | 2026-08-11 |
| fred | r | Interest Rates | 2026-08-11 | 2026-08-11 |
| oecd | MEI | Main Economic Indicators | 2026-08-11 | 2026-08-02 |
| oecd | MEI_FIN | Monthly Monetary and Financial Statistics (MEI) | 2026-08-11 | 2026-08-02 |
LAST_COMPILE
| LAST_COMPILE |
|---|
| 2026-08-13 |
Last
Code
BSI_PUB |>
group_by(TIME_PERIOD, FREQ) |>
summarise(Nobs = n()) |>
ungroup() |>
select(FREQ, TIME_PERIOD, Nobs) |>
group_by(FREQ) |>
arrange(desc(TIME_PERIOD)) |>
filter(row_number() < 5) |>
arrange(FREQ) |>
print_table_conditional()| FREQ | TIME_PERIOD | Nobs |
|---|---|---|
| M | 2026-06 | 163 |
| M | 2026-05 | 163 |
| M | 2026-04 | 163 |
| M | 2026-03 | 163 |
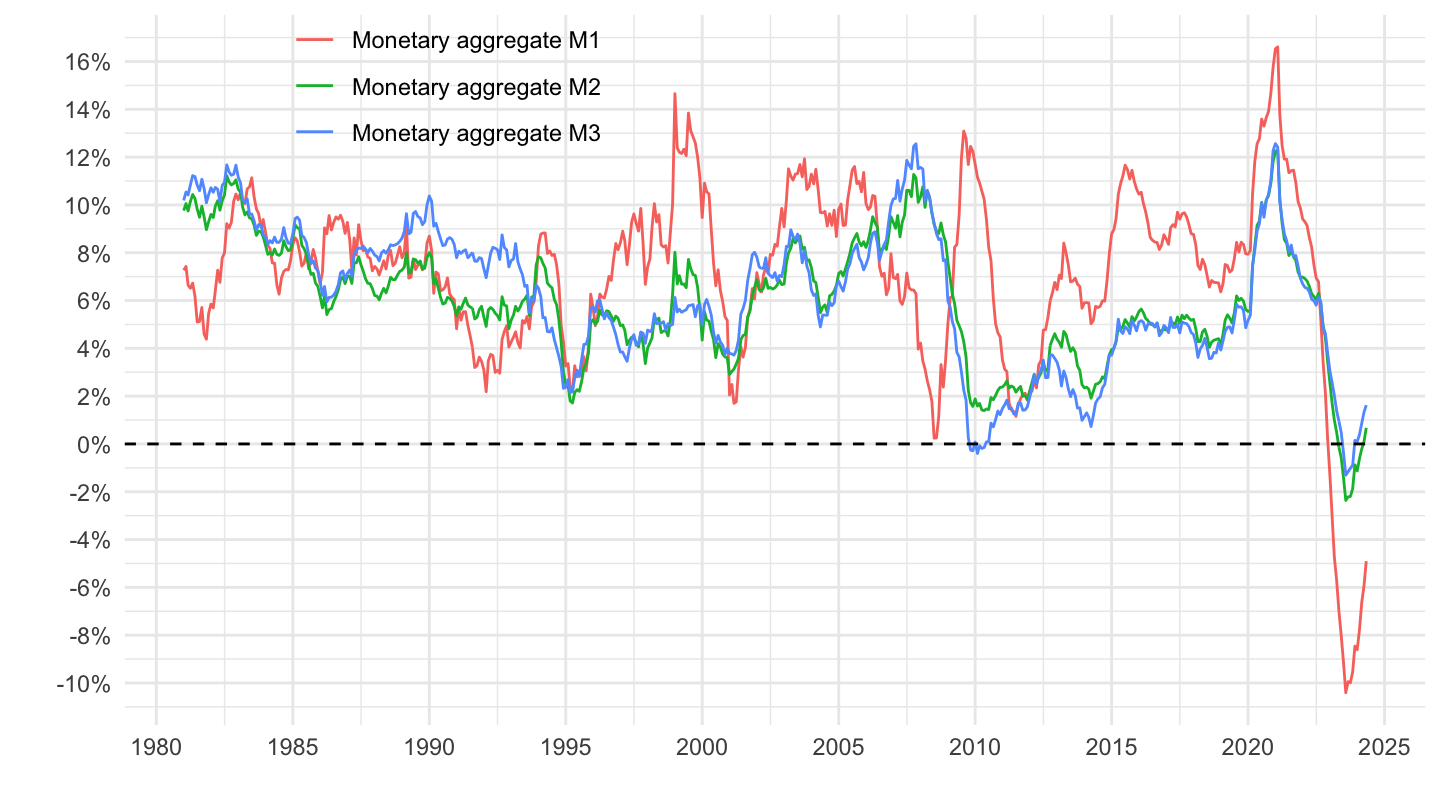
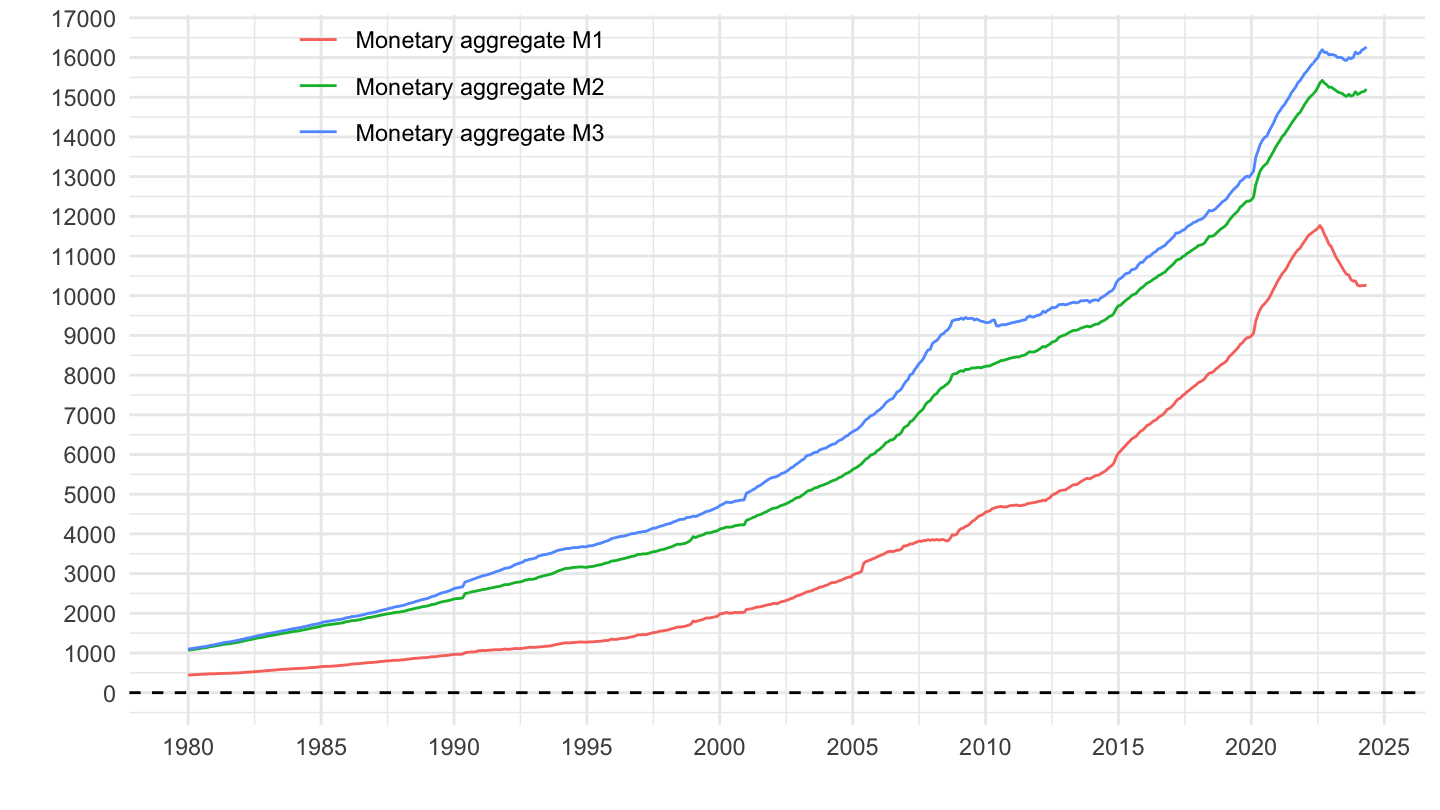
Monetary aggregates
M1, M2, M3
Niveau
Code
BSI_PUB |>
filter(BS_ITEM %in% c("M10", "M20", "M30"),
BS_SUFFIX == "E",
FREQ == "M",
ADJUSTMENT == "Y",
COLLECTION == "E",
DATA_TYPE == "1") |>
month_to_date() |>
arrange(desc(date)) |>
ggplot() + geom_line(aes(x = date, y = OBS_VALUE/1000, color = Bs_item)) +
xlab("") + ylab("") + theme_minimal() +
scale_x_date(breaks = as.Date(paste0(seq(1940, 2100, 5), "-01-01")),
labels = date_format("%Y")) +
theme(legend.position = c(0.25, 0.9),
legend.title = element_blank()) +
scale_y_continuous(breaks = seq(0, 20000, 1000)) +
geom_hline(yintercept = 0, linetype = "dashed")
Croissance
Code
BSI_PUB |>
filter(BS_ITEM %in% c("M10", "M20", "M30"),
BS_SUFFIX == "A",
FREQ == "M") |>
month_to_date() |>
ggplot() + geom_line(aes(x = date, y = OBS_VALUE/100, color = Bs_item)) +
xlab("") + ylab("") + theme_minimal() +
scale_x_date(breaks = as.Date(paste0(seq(1940, 2100, 5), "-01-01")),
labels = date_format("%Y")) +
theme(legend.position = c(0.25, 0.9),
legend.title = element_blank()) +
scale_y_continuous(breaks = 0.01*seq(-100, 90, 2),
labels = scales::percent_format(accuracy = 1)) +
geom_hline(yintercept = 0, linetype = "dashed")