Exchange Rate
Data - BDF
Info
Data on xrates
| source | dataset | Title | .html | .rData |
|---|---|---|---|---|
| bis | XRU_D | Exchange Rates, Daily | 2026-01-11 | 2025-05-24 |
| bdf | EXR | Exchange Rate | 2026-02-15 | 2026-01-10 |
| bis | EER | Real Effective Exchange Rates, Monthly | 2025-08-25 | 2026-02-15 |
| bis | EER_D | Real Effective Exchange Rates, Daily | 2024-11-18 | 2024-05-10 |
| bis | XRU | Exchange Rates | 2025-08-28 | 2026-02-15 |
| ecb | EXR | Exchange Rates | 2026-02-14 | 2026-02-15 |
| eurostat | ert_bil_eur_d | Euro/ECU exchange rates - daily data | 2026-02-16 | 2026-01-27 |
| eurostat | ert_h_eur_d | Former euro area national currencies vs. euro/ECU - daily data | 2026-02-16 | 2025-05-24 |
| fred | xrates | Exchange Rates | 2026-02-15 | 2026-02-15 |
| gfd | xrates | Exchange Rates | 2024-06-20 | 2021-01-08 |
| oecd | REFSERIES_MSIT | Exchange rates | 2024-09-15 | 2025-05-24 |
| oecd | SNA_TABLE4 | PPPs and exchange rates | 2024-09-15 | 2025-05-24 |
| wdi | PA.NUS.FCRF | Official exchange rate (LCU per USD, period average) | 2025-05-24 | 2026-02-15 |
LAST_COMPILE
| LAST_COMPILE |
|---|
| 2026-02-21 |
Last
| date | Nobs |
|---|---|
| 2026-01-09 | 29 |
FREQ
Code
EXR %>%
  left_join(EXR_var, by = "variable") %>%
  left_join(FREQ, by = "FREQ") %>%
  group_by(FREQ, Freq) %>%
  summarise(Nobs = n()) %>%
  arrange(-Nobs) %>%
print_table_conditional| FREQ | Freq | Nobs |
|---|---|---|
| D | Quotidien | 334800 |
| M | Mensuel | 20134 |
EXR_TYPE
Code
EXR %>%
  left_join(EXR_var, by = "variable") %>%
  left_join(EXR_TYPE, by = "EXR_TYPE") %>%
  group_by(EXR_TYPE, Exr_type) %>%
  summarise(Nobs = n()) %>%
  arrange(-Nobs) %>%
print_table_conditional| EXR_TYPE | Exr_type | Nobs |
|---|---|---|
| SP00 | Cours spot | 354934 |
EXR_SUFFIX
Code
EXR %>%
  left_join(EXR_var, by = "variable") %>%
  left_join(EXR_SUFFIX, by = "EXR_SUFFIX") %>%
  group_by(EXR_SUFFIX, Exr_suffix) %>%
  summarise(Nobs = n()) %>%
  arrange(-Nobs) %>%
print_table_conditional| EXR_SUFFIX | Exr_suffix | Nobs |
|---|---|---|
| A | Moyenne sur la période | 344732 |
| E | Fin de période | 10202 |
CURRENCY
Code
EXR %>%
  left_join(EXR_var, by = "variable") %>%
  left_join(CURRENCY, by = "CURRENCY") %>%
  group_by(CURRENCY, Currency) %>%
  summarise(Nobs = n()) %>%
  arrange(-Nobs) %>%
  print_table_conditional
Swiss Franc, Dollar, Pound
All
Code
EXR %>%
  left_join(variable, by = "variable") %>%
  filter(FREQ == "D",
         CURRENCY %in% c("USD", "CHF", "GBP"),
         CURRENCY_DENOM == "EUR") %>%
  arrange(desc(date)) %>%
  ggplot(.) + geom_line(aes(x = date, y = value, color = Variable)) +
  theme_minimal() + xlab("") + ylab("") +
  scale_x_date(breaks = seq(1960, 2100, 2) %>% paste0("-01-01") %>% as.Date,
               labels = date_format("%Y")) +
  scale_y_continuous(breaks = seq(0.1, 3, 0.1),
                     labels = dollar_format(accuracy = .1, prefix = "", suffix = "/€")) +
  theme(legend.position = c(0.8, 0.80),
        legend.title = element_blank())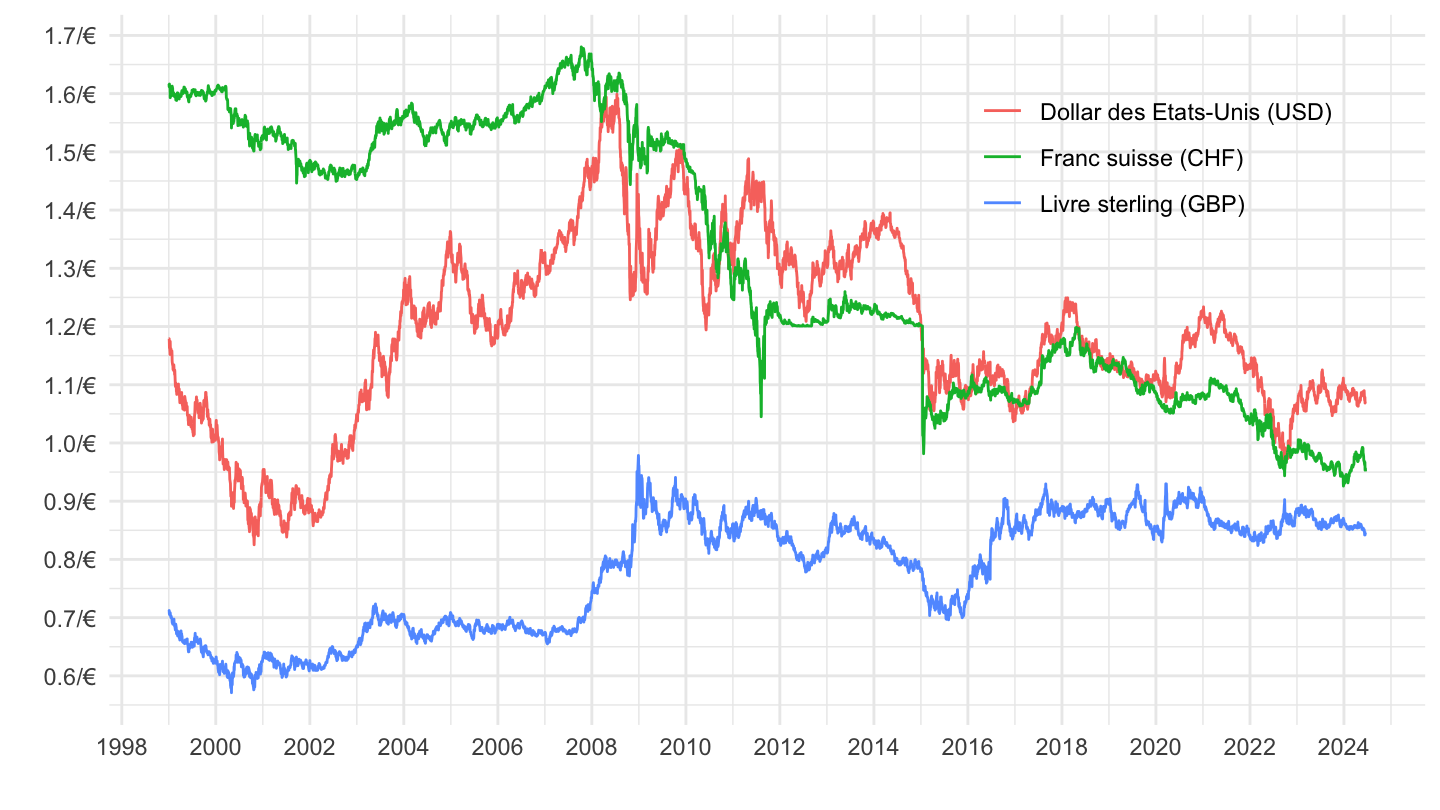
2008-
Code
EXR %>%
  left_join(variable, by = "variable") %>%
  filter(FREQ == "D",
         CURRENCY %in% c("USD", "CHF", "GBP"),
         CURRENCY_DENOM == "EUR") %>%
  filter(date >= as.Date("2008-01-01")) %>%
  arrange(desc(date)) %>%
  ggplot(.) + geom_line(aes(x = date, y = value, color = Variable)) +
  theme_minimal() + xlab("") + ylab("") +
  scale_x_date(breaks = seq(1960, 2100, 2) %>% paste0("-01-01") %>% as.Date,
               labels = date_format("%Y")) +
  scale_y_continuous(breaks = seq(0.1, 3, 0.1),
                     labels = dollar_format(accuracy = .1, prefix = "", suffix = "/€")) +

  theme(legend.position = c(0.8, 0.80),
        legend.title = element_blank())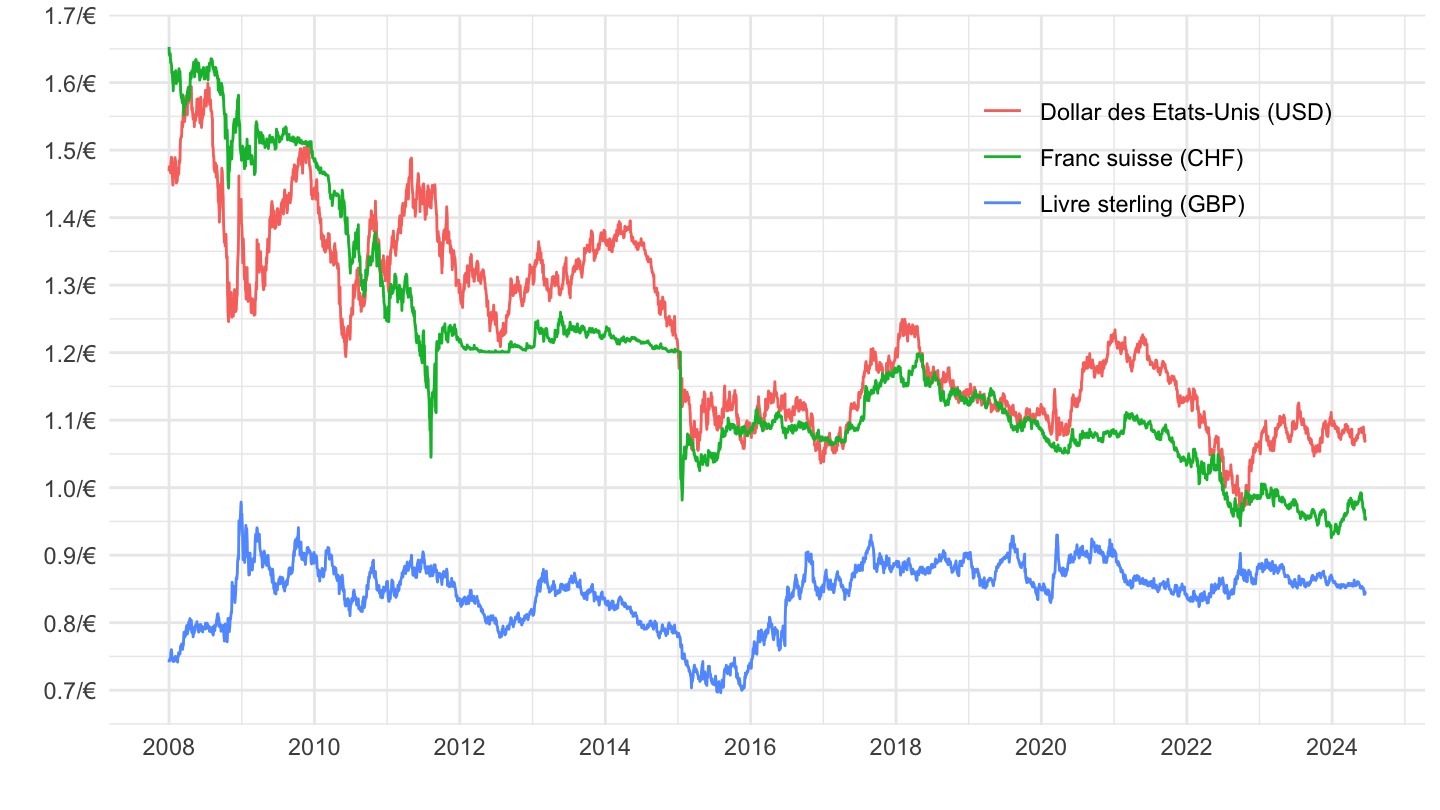
2021-
Code
EXR %>%
  left_join(variable, by = "variable") %>%
  filter(FREQ == "D",
         CURRENCY %in% c("USD", "CHF", "GBP"),
         CURRENCY_DENOM == "EUR") %>%
  filter(date >= as.Date("2021-01-01")) %>%
  arrange(desc(date)) %>%
  ggplot(.) + geom_line(aes(x = date, y = value, color = Variable)) +
  theme_minimal() + xlab("") + ylab("") +
  scale_x_date(breaks = "3 months",
               labels = date_format("%b %Y")) +
  scale_y_continuous(breaks = seq(0.1, 3, 0.05),
                     labels = dollar_format(accuracy = .1, prefix = "", suffix = "/€")) +

  theme(legend.position = c(0.8, 0.9),
        legend.title = element_blank(),
        axis.text.x = element_text(angle = 45, vjust = 1, hjust = 1))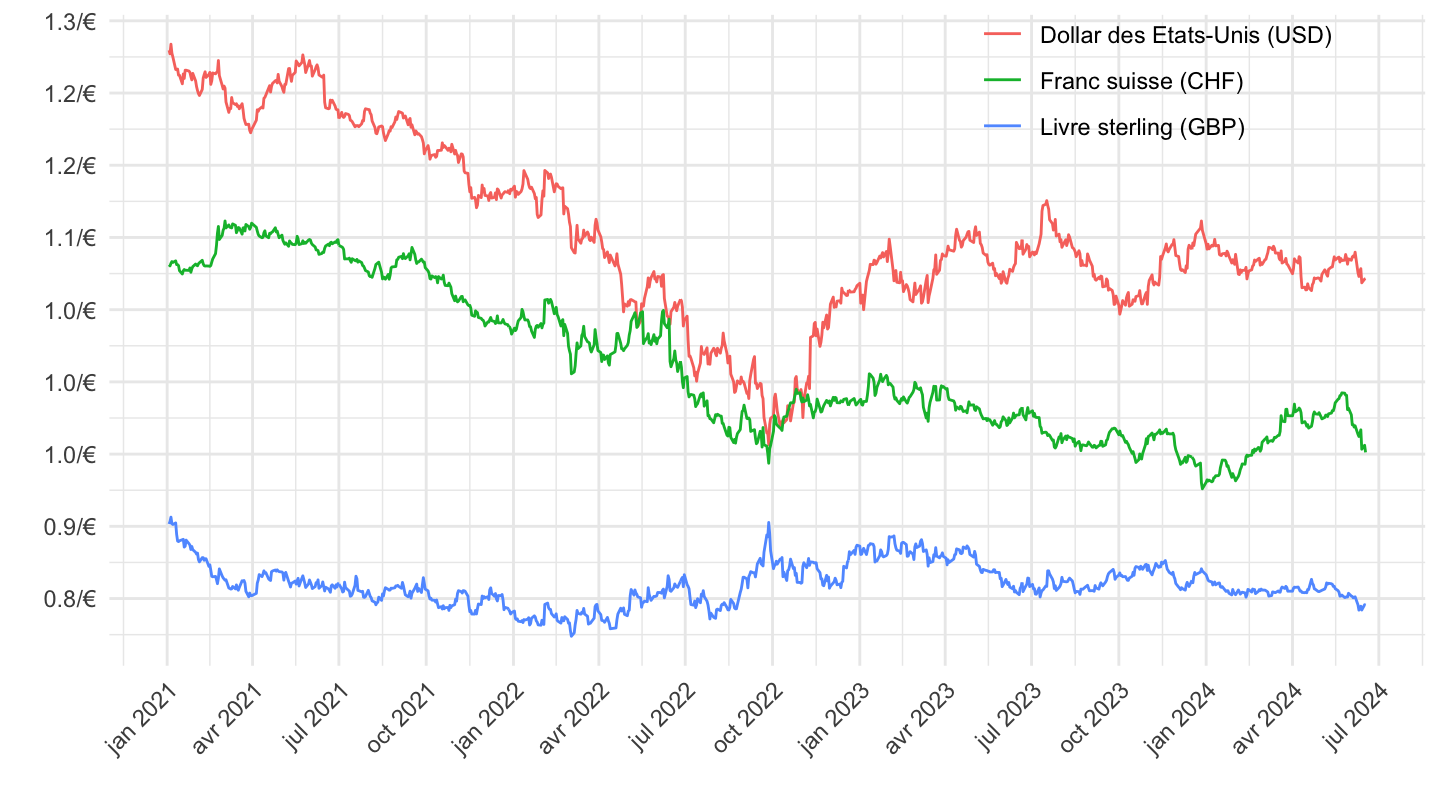
2 years before
Code
EXR %>%
  left_join(variable, by = "variable") %>%
  filter(FREQ == "D",
         CURRENCY %in% c("USD", "CHF", "GBP"),
         CURRENCY_DENOM == "EUR") %>%
  filter(date >= Sys.Date() - years(2)) %>%
  arrange(desc(date)) %>%
  ggplot(.) + geom_line(aes(x = date, y = value, color = Variable)) +
  theme_minimal() + xlab("") + ylab("") +
  scale_x_date(breaks = "2 months",
               labels = date_format("%b %Y")) +
  scale_y_continuous(breaks = seq(0.1, 3, 0.05),
                     labels = dollar_format(accuracy = .01, prefix = "", suffix = "/€")) +

  theme(legend.position = c(0.8, 0.9),
        legend.title = element_blank(),
        axis.text.x = element_text(angle = 45, vjust = 1, hjust = 1))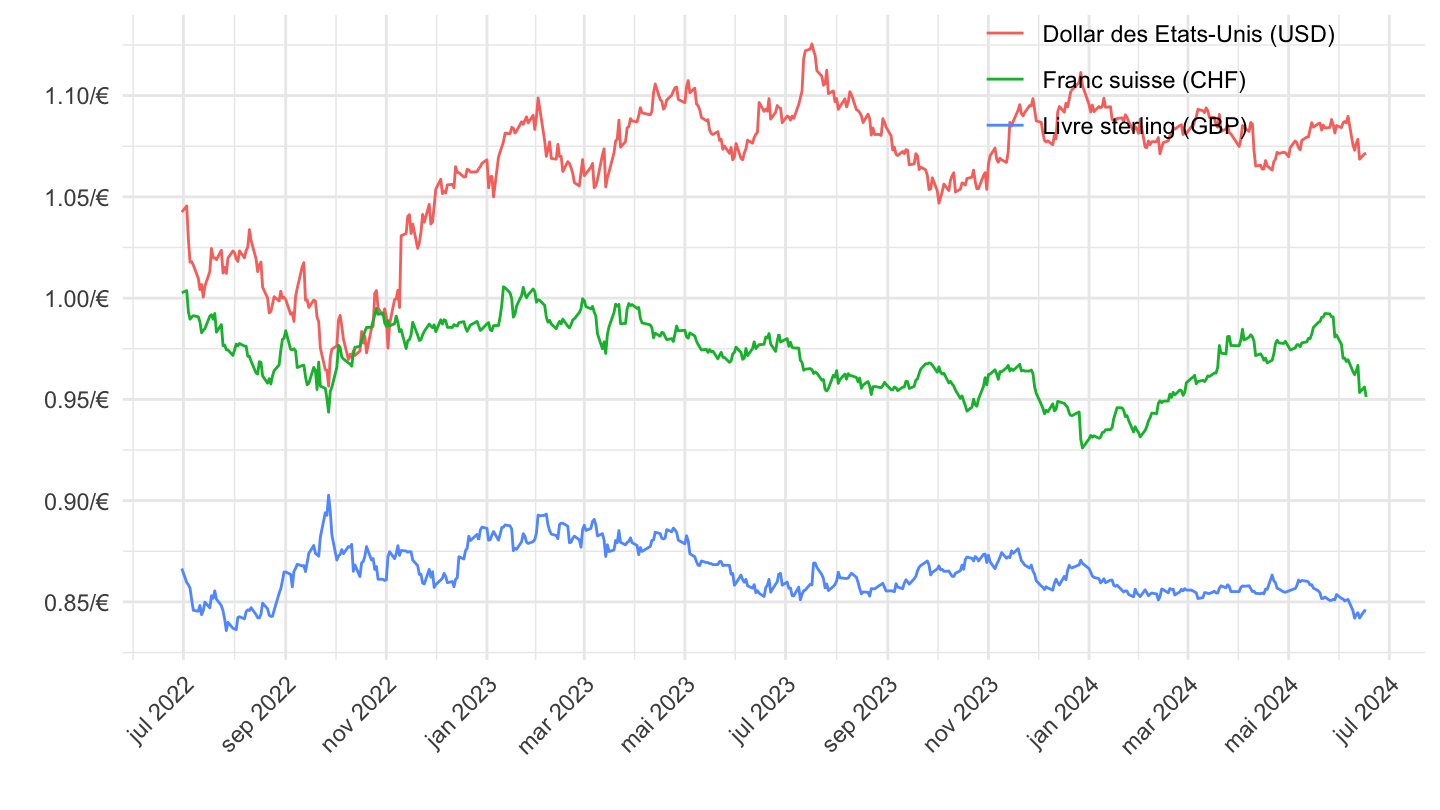
2022-
Code
EXR %>%
  left_join(variable, by = "variable") %>%
  filter(FREQ == "D",
         CURRENCY %in% c("USD", "CHF", "GBP"),
         CURRENCY_DENOM == "EUR") %>%
  filter(date >= as.Date("2022-01-01")) %>%
  arrange(desc(date)) %>%
  ggplot(.) + geom_line(aes(x = date, y = value, color = Variable)) +
  theme_minimal() + xlab("") + ylab("") +
  scale_x_date(breaks = "1 month",
               labels = date_format("%b %Y")) +
  scale_y_continuous(breaks = seq(0.1, 3, 0.05),
                     labels = dollar_format(accuracy = .1, prefix = "", suffix = "/€")) +

  theme(legend.position = c(0.8, 0.9),
        legend.title = element_blank(),
        axis.text.x = element_text(angle = 45, vjust = 1, hjust = 1))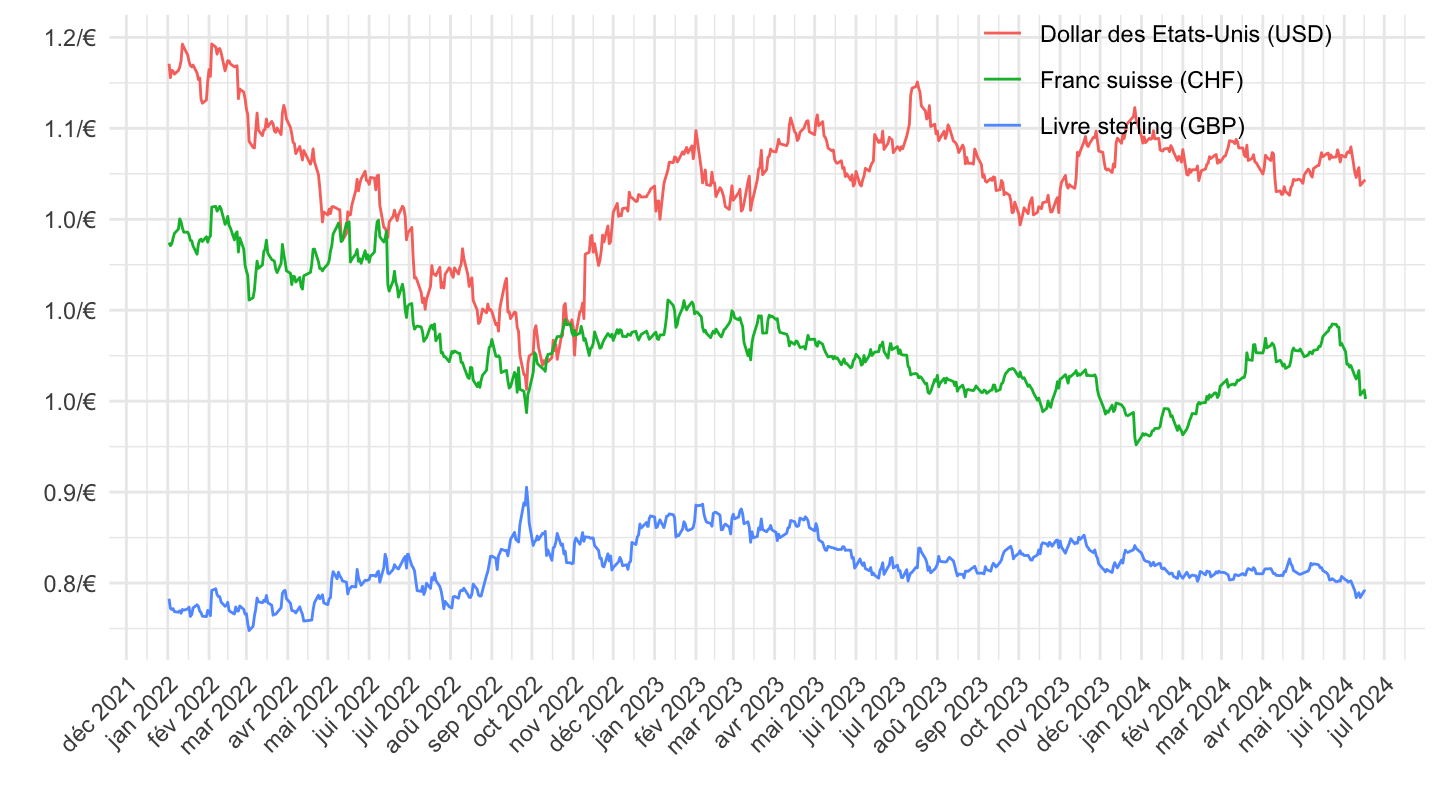
1 year-before
Code
EXR %>%
  left_join(variable, by = "variable") %>%
  filter(FREQ == "D",
         CURRENCY %in% c("USD", "CHF", "GBP"),
         CURRENCY_DENOM == "EUR") %>%
  filter(date >= Sys.Date() - years(1)) %>%
  arrange(desc(date)) %>%
  ggplot(.) + geom_line(aes(x = date, y = value, color = Variable)) +
  theme_minimal() + xlab("") + ylab("") +
  scale_x_date(breaks = "1 month",
               labels = date_format("%b %Y")) +
  scale_y_log10(breaks = seq(0.1, 3, 0.04),
                     labels = dollar_format(accuracy = .01, prefix = "", suffix = "/€")) +

  theme(legend.position = c(0.15, 0.9),
        legend.title = element_blank(),
        axis.text.x = element_text(angle = 45, vjust = 1, hjust = 1))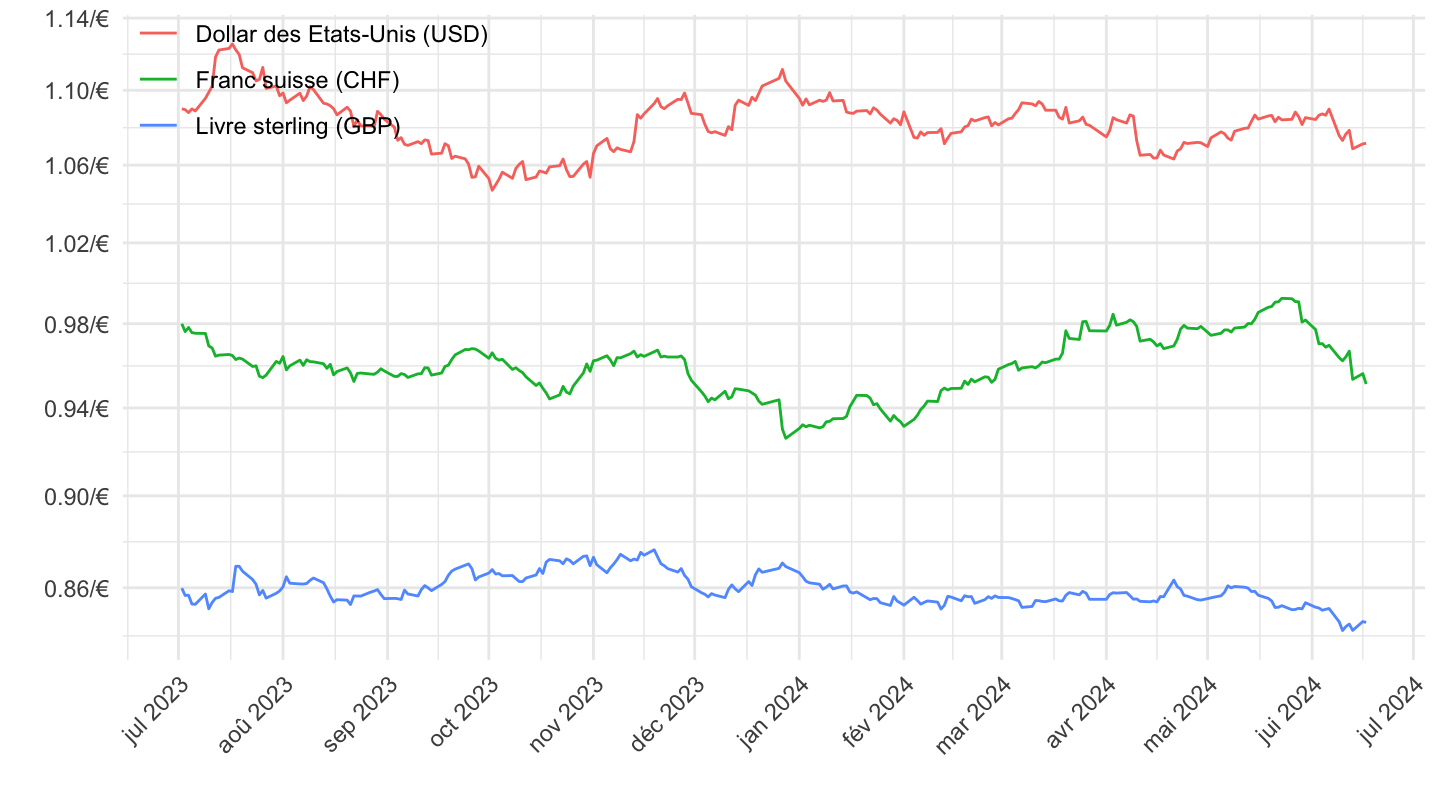
6 months
Code
EXR %>%
  left_join(variable, by = "variable") %>%
  filter(FREQ == "D",
         CURRENCY %in% c("USD", "CHF", "GBP"),
         CURRENCY_DENOM == "EUR") %>%
  filter(date >= Sys.Date() - months(6)) %>%
  arrange(desc(date)) %>%
  ggplot(.) + geom_line(aes(x = date, y = value, color = Variable)) +
  theme_minimal() + xlab("") + ylab("") +
  scale_x_date(breaks = "7 days",
               labels = date_format("%d %b %Y")) +
  scale_y_log10(breaks = seq(0.1, 3, 0.04),
                     labels = dollar_format(accuracy = .01, prefix = "", suffix = "/€")) +

  theme(legend.position = c(0.15, 0.3),
        legend.title = element_blank(),
        axis.text.x = element_text(angle = 45, vjust = 1, hjust = 1)) +
  geom_text_repel(aes(x = date, y = value, label = value),
                  fontface ="plain", color = "black", size = 3)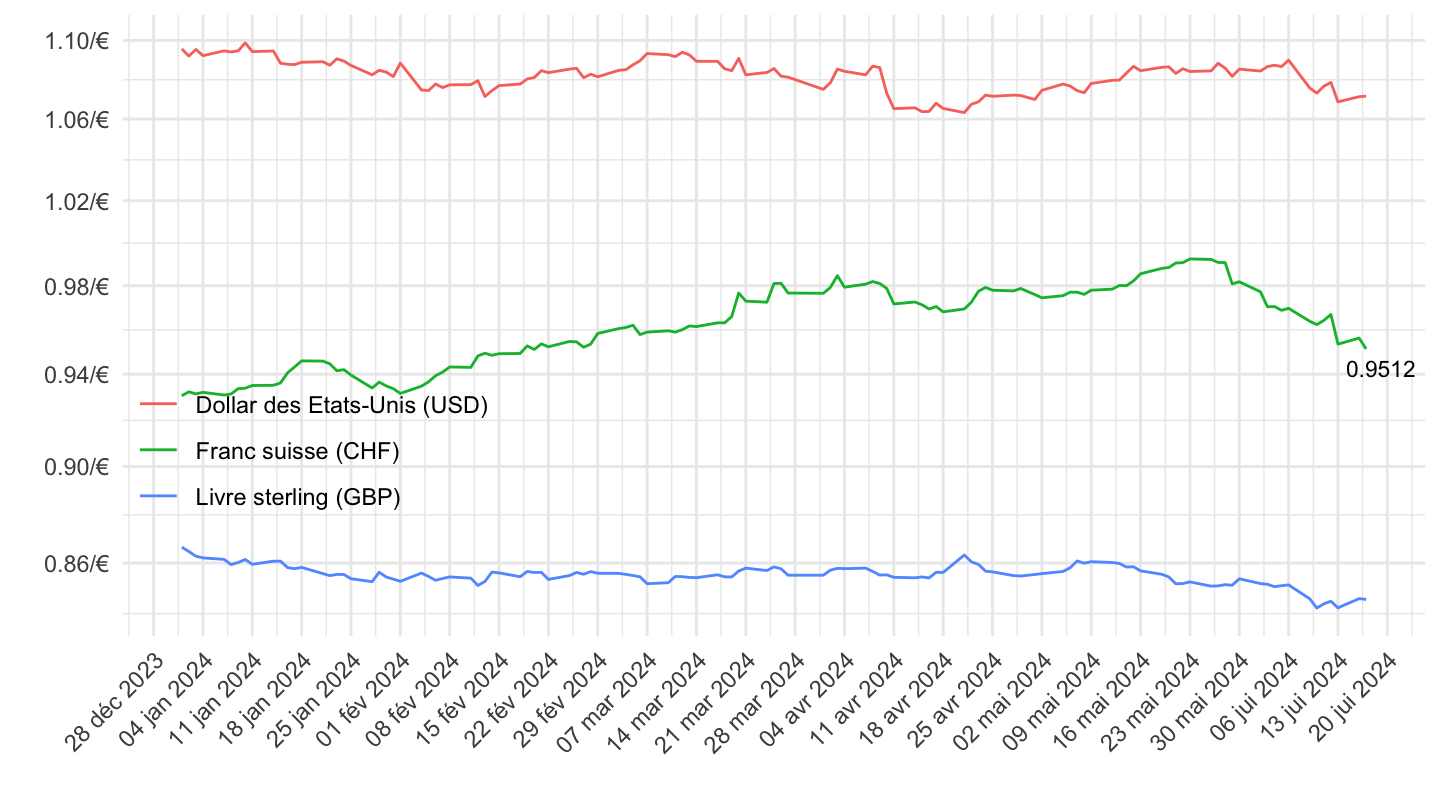
3 months
Code
EXR %>%
  left_join(variable, by = "variable") %>%
  filter(FREQ == "D",
         CURRENCY %in% c("USD", "CHF", "GBP"),
         CURRENCY_DENOM == "EUR") %>%
  filter(date >= Sys.Date() - months(3)) %>%
  arrange(desc(date)) %>%
  ggplot(.) + geom_line(aes(x = date, y = value, color = Variable)) +
  theme_minimal() + xlab("") + ylab("") +
  scale_x_date(breaks = "1 day",
               labels = date_format("%d %b %Y")) +
  scale_y_log10(breaks = seq(0.1, 3, 0.04),
                     labels = dollar_format(accuracy = .01, prefix = "", suffix = "/€")) +

  theme(legend.position = c(0.15, 0.3),
        legend.title = element_blank(),
        axis.text.x = element_text(angle = 45, vjust = 1, hjust = 1)) +
  geom_text_repel(aes(x = date, y = value, label = value),
                  fontface ="plain", color = "black", size = 3)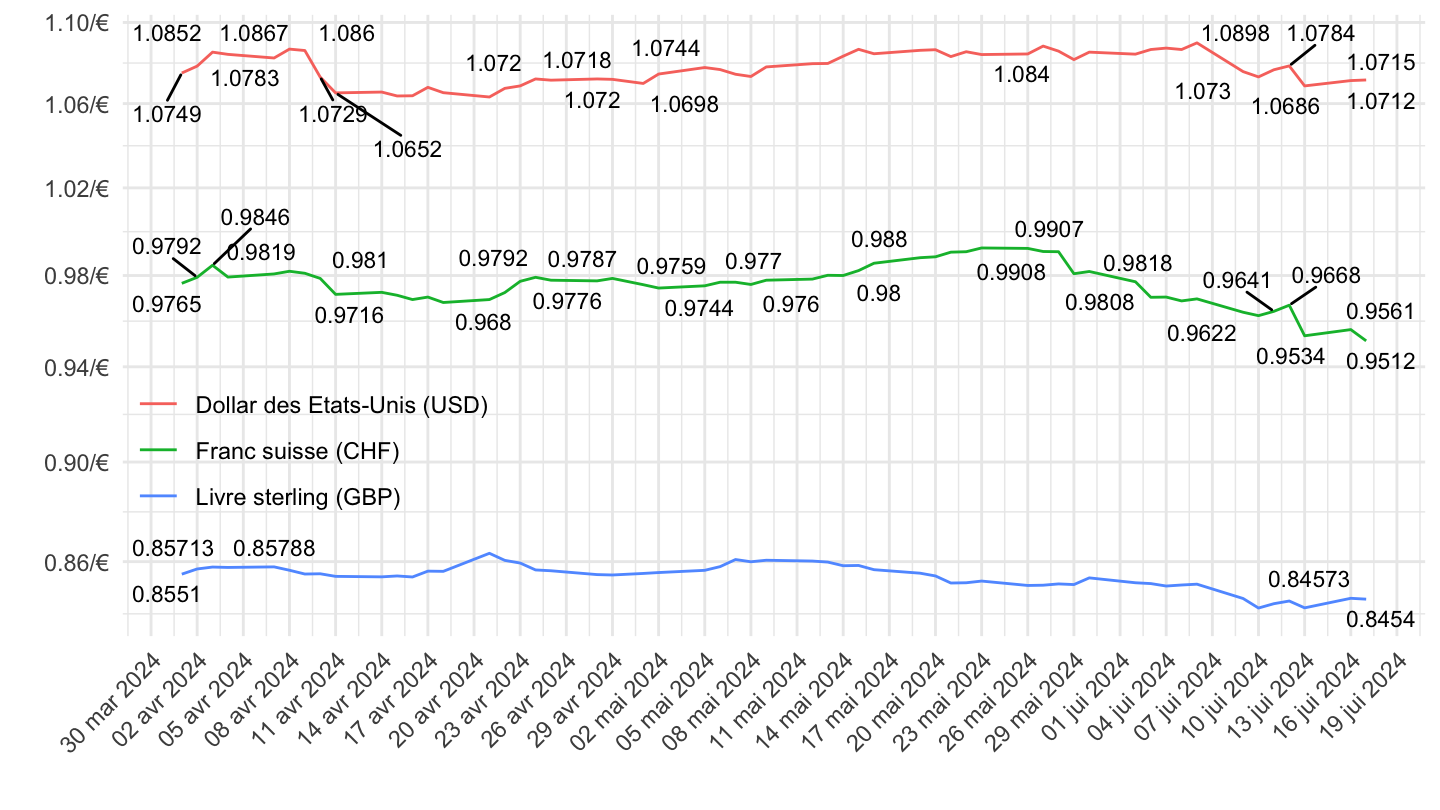
1 month
Code
EXR %>%
  left_join(variable, by = "variable") %>%
  filter(FREQ == "D",
         CURRENCY %in% c("USD", "CHF", "GBP"),
         CURRENCY_DENOM == "EUR") %>%
  filter(date >= Sys.Date() - months(1)) %>%
  arrange(desc(date)) %>%
  ggplot(.) + geom_line(aes(x = date, y = value, color = Variable)) +
  theme_minimal() + xlab("") + ylab("") +
  scale_x_date(breaks = "1 day",
               labels = date_format("%d %b %Y")) +
  scale_y_log10(breaks = seq(0.1, 3, 0.04),
                     labels = dollar_format(accuracy = .01, prefix = "", suffix = "/€")) +

  theme(legend.position = c(0.15, 0.75),
        legend.title = element_blank(),
        axis.text.x = element_text(angle = 45, vjust = 1, hjust = 1)) +
  geom_text_repel(aes(x = date, y = value, label = value), fontface ="plain", color = "black", size = 3)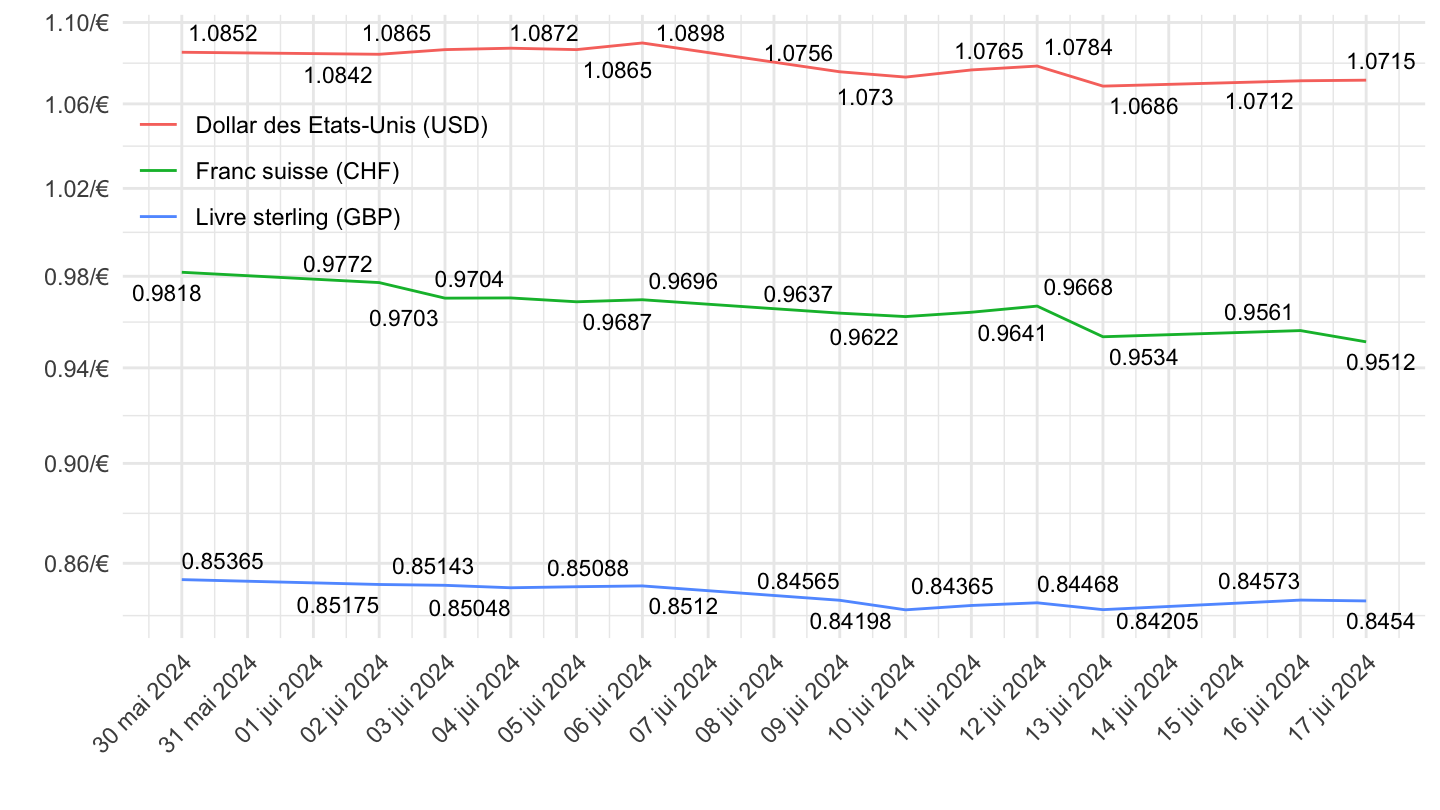
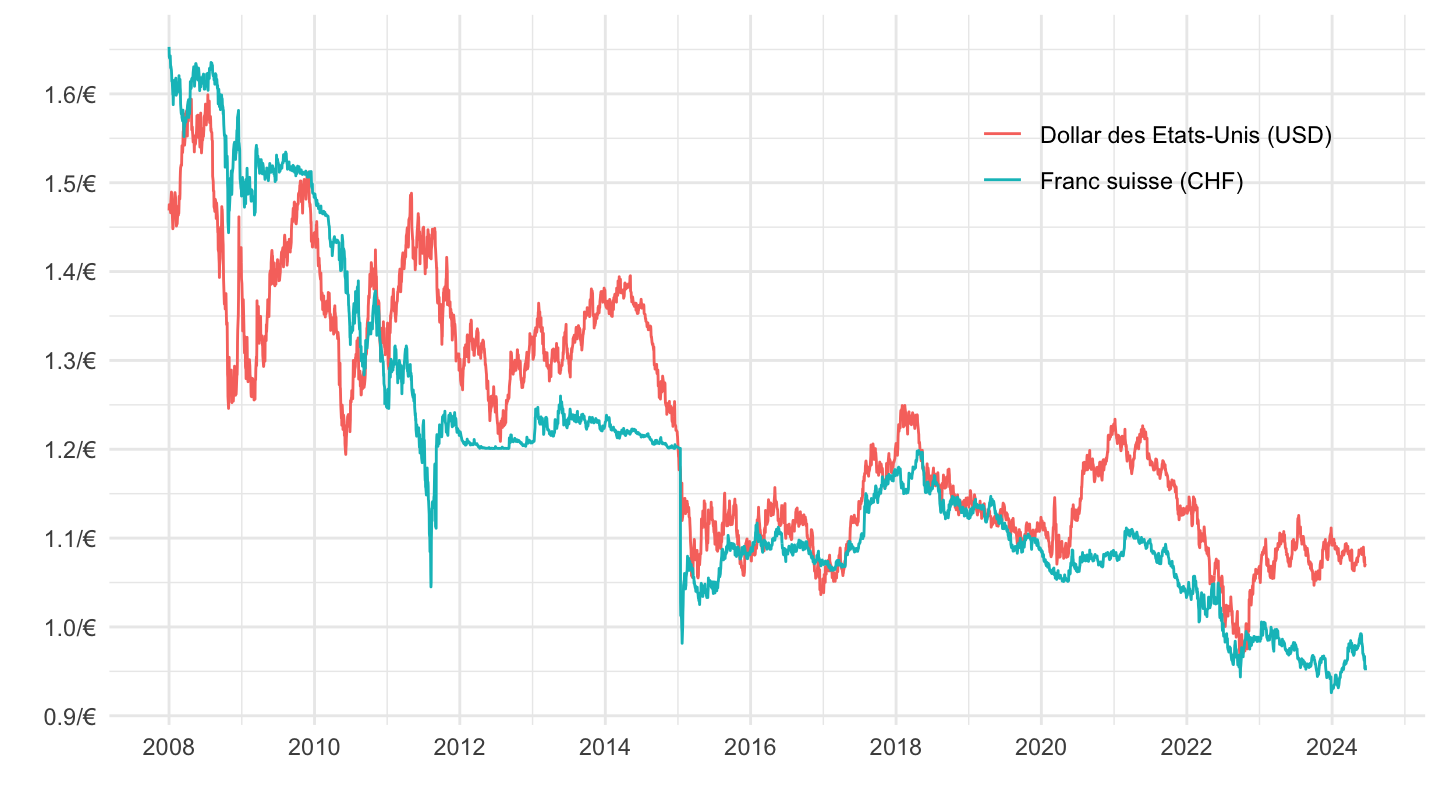
Swiss Franc, Dollar
All
Code
EXR %>%
  left_join(variable, by = "variable") %>%
  filter(FREQ == "D",
         CURRENCY %in% c("USD", "CHF"),
         CURRENCY_DENOM == "EUR") %>%
  arrange(desc(date)) %>%
  ggplot(.) + geom_line(aes(x = date, y = value, color = Variable)) +
  theme_minimal() + xlab("") + ylab("") +
  scale_x_date(breaks = seq(1960, 2100, 2) %>% paste0("-01-01") %>% as.Date,
               labels = date_format("%Y")) +
  scale_y_continuous(breaks = seq(0.1, 3, 0.1),
                     labels = dollar_format(accuracy = .1, prefix = "", suffix = "/€")) +
  theme(legend.position = c(0.8, 0.80),
        legend.title = element_blank())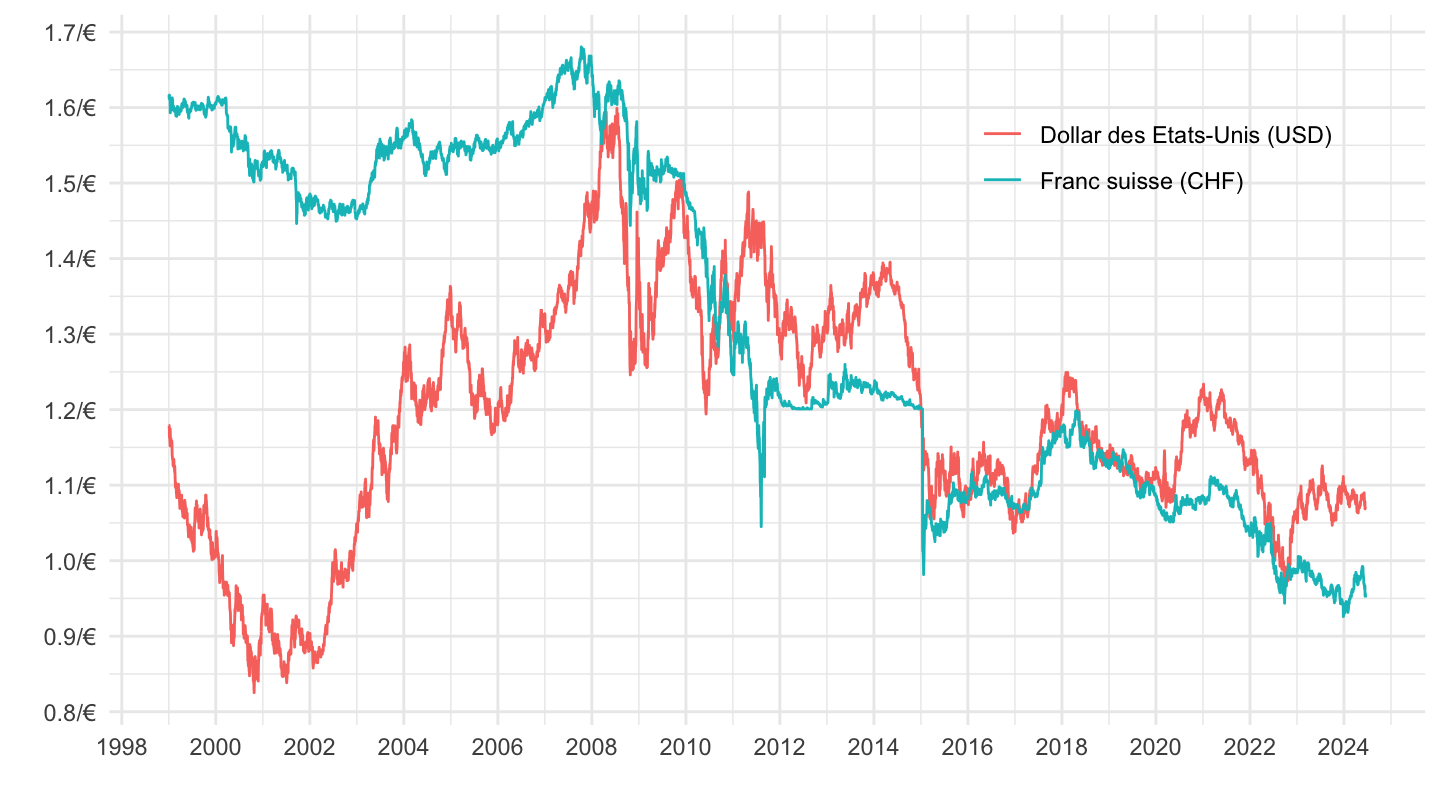
2008-
Code
EXR %>%
  left_join(variable, by = "variable") %>%
  filter(FREQ == "D",
         CURRENCY %in% c("USD", "CHF"),
         CURRENCY_DENOM == "EUR") %>%
  filter(date >= as.Date("2008-01-01")) %>%
  arrange(desc(date)) %>%
  ggplot(.) + geom_line(aes(x = date, y = value, color = Variable)) +
  theme_minimal() + xlab("") + ylab("") +
  scale_x_date(breaks = seq(1960, 2100, 2) %>% paste0("-01-01") %>% as.Date,
               labels = date_format("%Y")) +
  scale_y_continuous(breaks = seq(0.1, 3, 0.1),
                     labels = dollar_format(accuracy = .1, prefix = "", suffix = "/€")) +
  theme(legend.position = c(0.8, 0.80),
        legend.title = element_blank())