| source | dataset | .html | .RData |
|---|---|---|---|
| 2024-09-11 | 2024-04-30 |
Exchange rates
Data - OECD
Info
Data on xrates
| source | dataset | .html | .RData |
|---|---|---|---|
| 2024-07-26 | 2024-06-18 | ||
| 2024-08-09 | 2024-08-28 | ||
| 2024-08-28 | 2024-05-10 | ||
| 2024-05-10 | 2024-09-14 | ||
| 2024-08-28 | 2024-08-28 | ||
| 2024-09-14 | 2024-09-14 | ||
| 2024-09-14 | 2024-08-28 | ||
| 2024-09-14 | 2024-06-08 | ||
| 2024-09-14 | 2024-09-14 | ||
| 2024-06-20 | 2021-01-08 | ||
| 2024-09-11 | 2024-04-30 | ||
| 2024-09-11 | 2024-04-30 | ||
| 2024-08-28 | 2024-09-15 |
COMPILE_TIME
| COMPILE_TIME |
|---|
| 2024-09-15 |
Last
| obsTime | Nobs |
|---|---|
| 2013-Q4 | 36 |
COU
Code
REFSERIES_MSIT %>%
  left_join(REFSERIES_MSIT_var$COU, by = "COU") %>%
  group_by(COU, Cou) %>%
  summarise(Nobs = n()) %>%
  arrange(-Nobs) %>%
  mutate(Flag = gsub(" ", "-", str_to_lower(Cou)),
         Flag = paste0('<img src="../../icon/flag/vsmall/', Flag, '.png" alt="Flag">')) %>%
  select(Flag, everything()) %>%
  {if (is_html_output()) datatable(., filter = 'top', rownames = F, escape = F) else .}
France, Italy, Germany, Canada
Code
REFSERIES_MSIT %>%
  filter(COU %in% c("CHE", "DEU", "USA", "FRA", "ESP")) %>%
  filter(nchar(obsTime) == 4) %>%
  year_to_date %>%
  left_join(REFSERIES_MSIT_var$COU, by = "COU") %>%
  rename(Location = Cou) %>%
  left_join(colors, by = c("Location"  = "country")) %>%
  ggplot(.) + geom_line(aes(x = date, y = obsValue, color = color)) +
  scale_color_identity() + add_5flags +
  theme_minimal() + xlab("") + ylab("Exchange Rate ($1 = ? National Currency)") +
  scale_x_date(breaks = seq(1955, 2020, 5) %>% paste0("-01-01") %>% as.Date,
               labels = date_format("%Y")) +
  scale_y_continuous(breaks = seq(-100, 200, .5))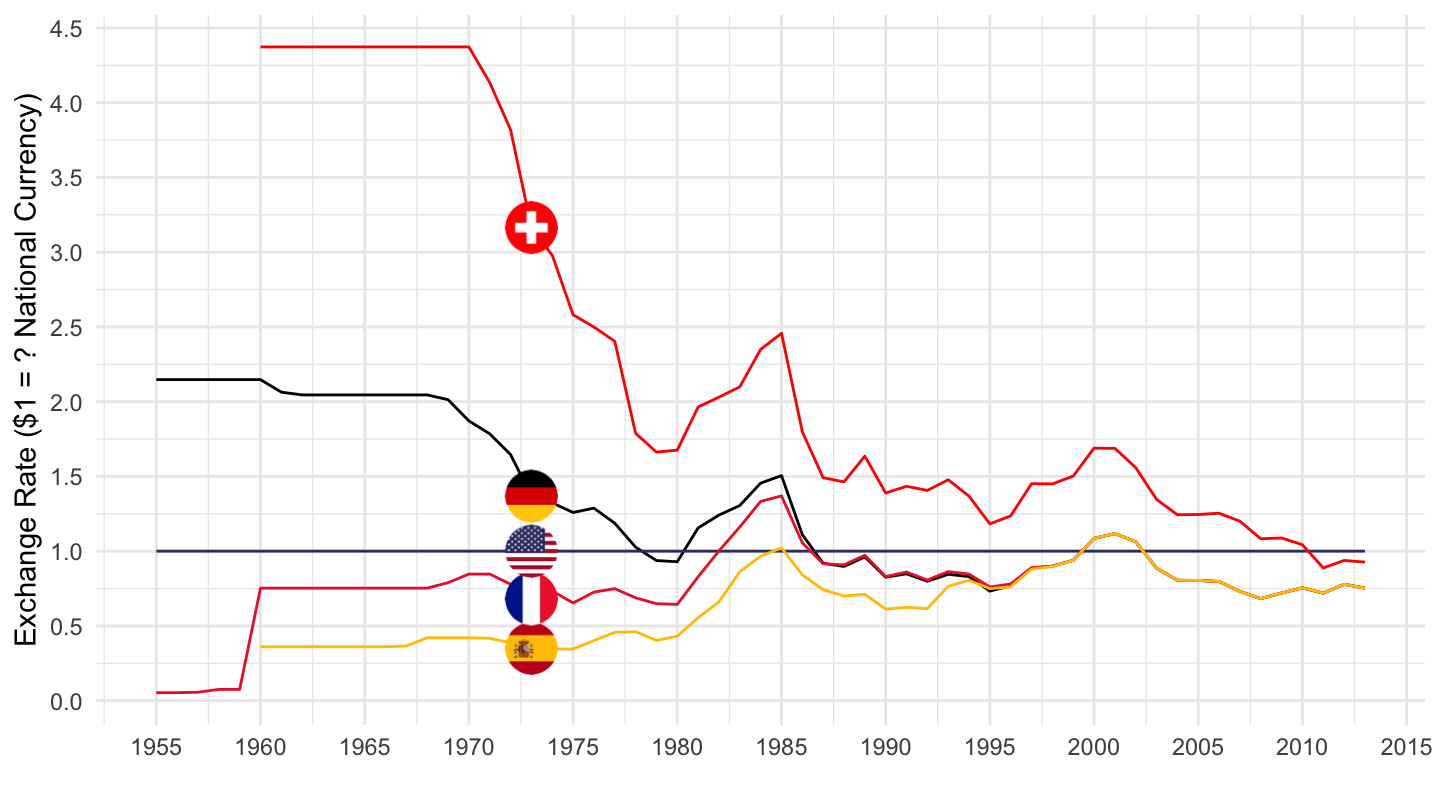
France, Germany, Italy, Spain, Greece
Code
REFSERIES_MSIT %>%
  filter(COU %in% c("FRA", "DEU", "ITA", "ESP", "GRC")) %>%
  filter(nchar(obsTime) == 4) %>%
  year_to_date %>%
  left_join(REFSERIES_MSIT_var$COU, by = "COU") %>%
  rename(Location = Cou) %>%
  left_join(colors, by = c("Location"  = "country")) %>%
  ggplot(.) + geom_line(aes(x = date, y = obsValue, color = color)) +
  scale_color_identity() + add_5flags +
  theme_minimal() + xlab("") + ylab("Exchange Rate ($1 = ? National Currency)") +
  scale_x_date(breaks = seq(1955, 2020, 5) %>% paste0("-01-01") %>% as.Date,
               labels = date_format("%Y")) +
  scale_y_continuous(breaks = seq(-100, 200, .5))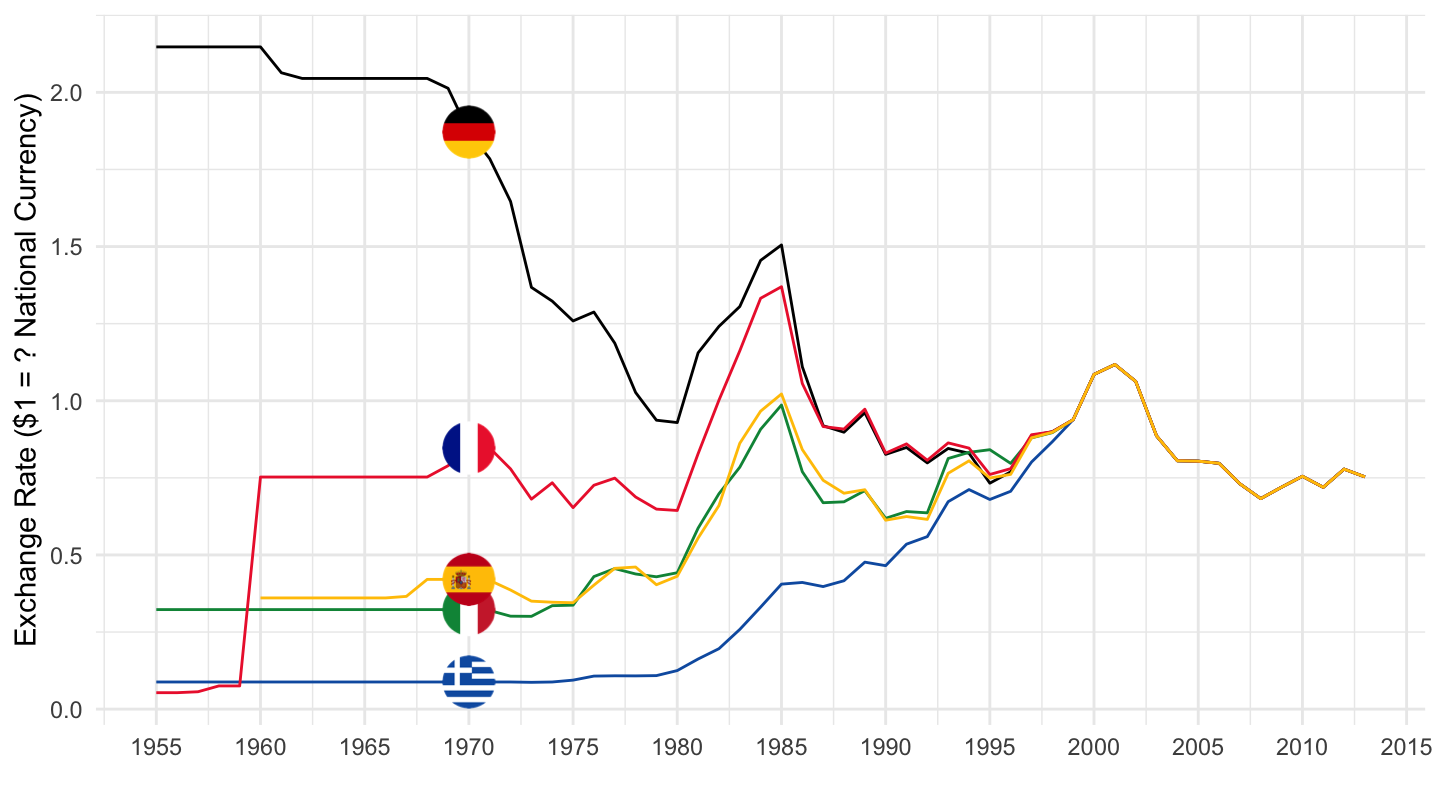
France, Italy, Germany, Canada
Code
REFSERIES_MSIT %>%
  filter(COU %in% c("FRA", "ITA", "DEU", "CAN")) %>%
  filter(nchar(obsTime) == 4) %>%
  year_to_date %>%
  left_join(REFSERIES_MSIT_var$COU, by = "COU") %>%
  rename(Location = Cou) %>%
  left_join(colors, by = c("Location"  = "country")) %>%
  ggplot(.) + geom_line(aes(x = date, y = obsValue, color = color)) +
  scale_color_identity() + add_4flags +
  theme_minimal() + xlab("") + ylab("") +
  scale_x_date(breaks = seq(1955, 2020, 5) %>% paste0("-01-01") %>% as.Date,
               labels = date_format("%Y")) +
  scale_y_continuous(breaks = seq(-100, 200, .1))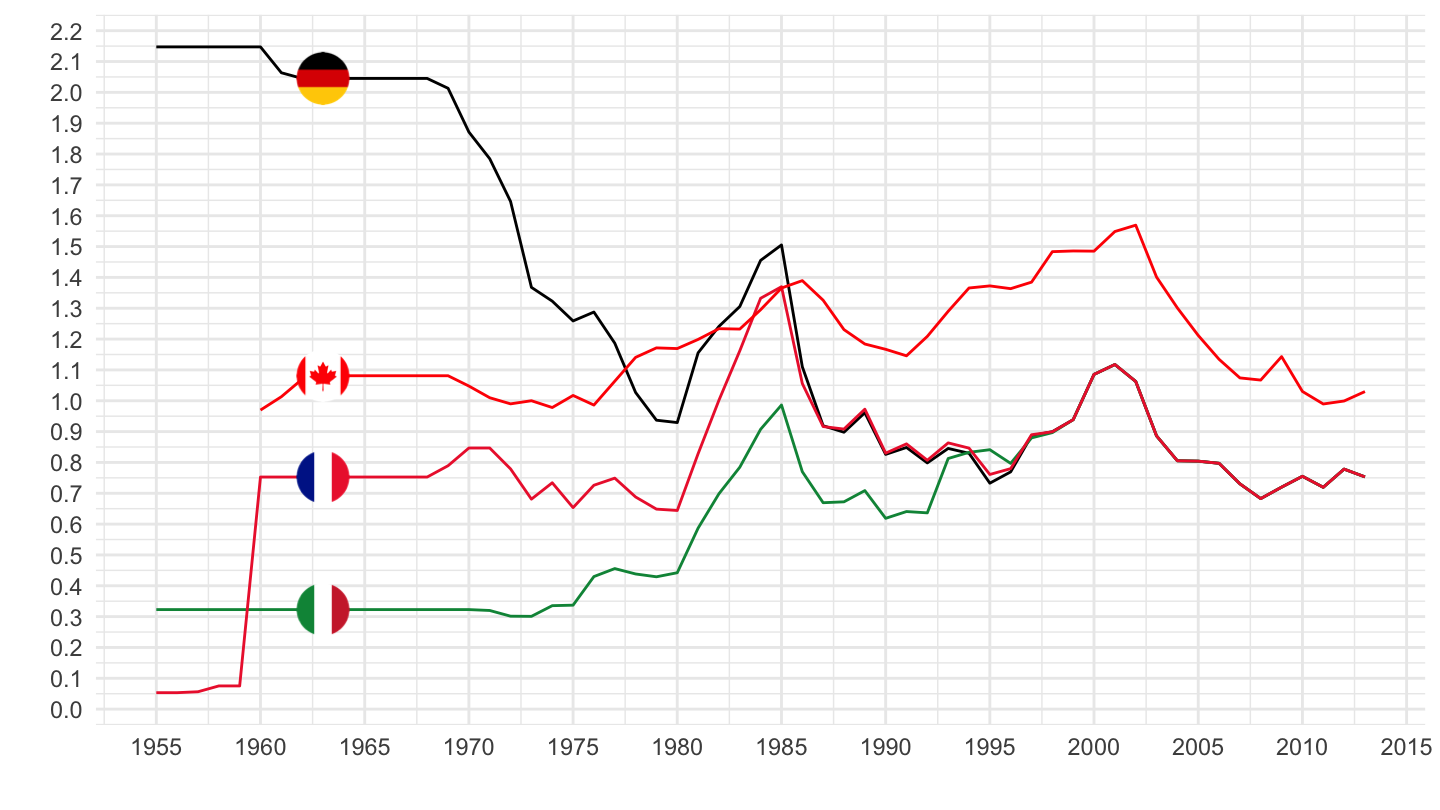
Spain, Greece, Belgium
Code
REFSERIES_MSIT %>%
  filter(COU %in% c("BEL", "GRC", "ESP")) %>%
  filter(nchar(obsTime) == 4) %>%
  year_to_date %>%
  left_join(REFSERIES_MSIT_var$COU, by = "COU") %>%
  rename(Location = Cou) %>%
  left_join(colors, by = c("Location"  = "country")) %>%
  mutate(color = ifelse(COU == "BEL", "#000000", color)) %>%
  ggplot(.) + geom_line(aes(x = date, y = obsValue, color = color)) +
  scale_color_identity() + add_3flags +
  theme_minimal() + xlab("") + ylab("") +
  scale_x_date(breaks = seq(1955, 2020, 5) %>% paste0("-01-01") %>% as.Date,
               labels = date_format("%Y")) +
  scale_y_continuous(breaks = seq(-100, 200, .1))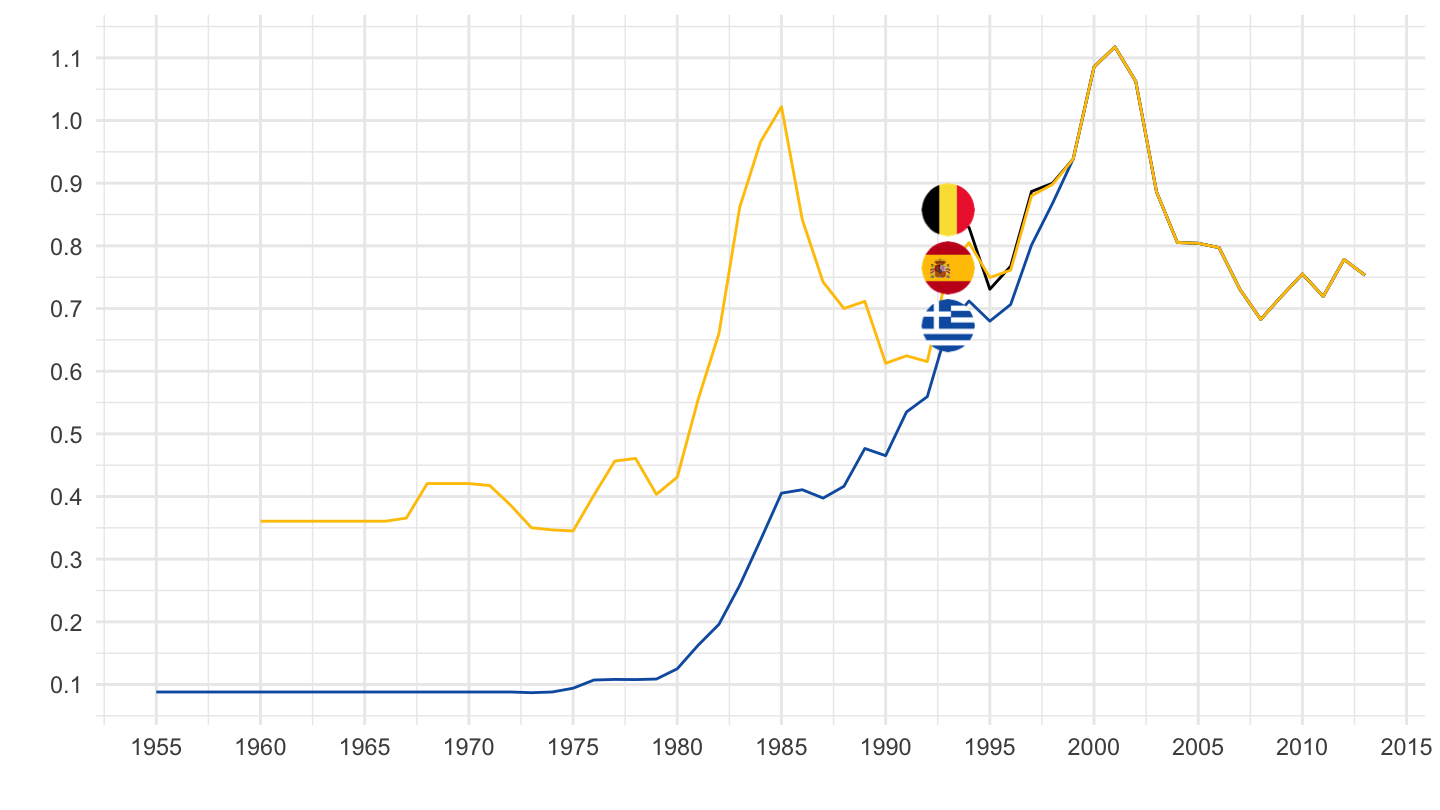
Switzerland, Germany
Code
REFSERIES_MSIT %>%
  filter(COU %in% c("CHE", "DEU")) %>%
  filter(nchar(obsTime) == 4) %>%
  year_to_date %>%
  left_join(REFSERIES_MSIT_var$COU, by = "COU") %>%
  rename(Location = Cou) %>%
  left_join(colors, by = c("Location"  = "country")) %>%
  ggplot(.) + geom_line(aes(x = date, y = obsValue, color = color)) +
  scale_color_identity() + add_2flags +
  theme_minimal() + xlab("") + ylab("") +
  scale_x_date(breaks = seq(1955, 2020, 5) %>% paste0("-01-01") %>% as.Date,
               labels = date_format("%Y")) +
  scale_y_continuous(breaks = seq(-100, 200, .1))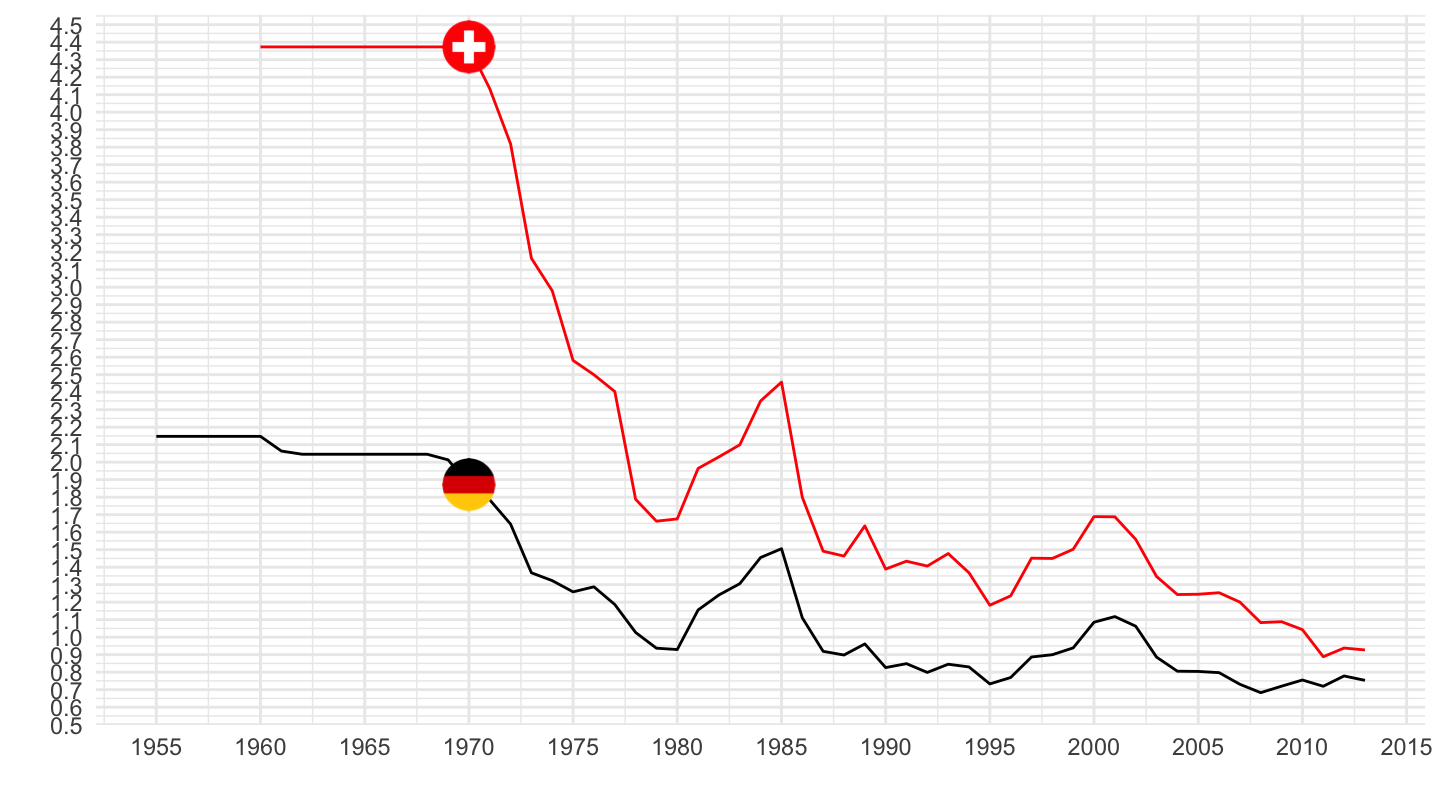
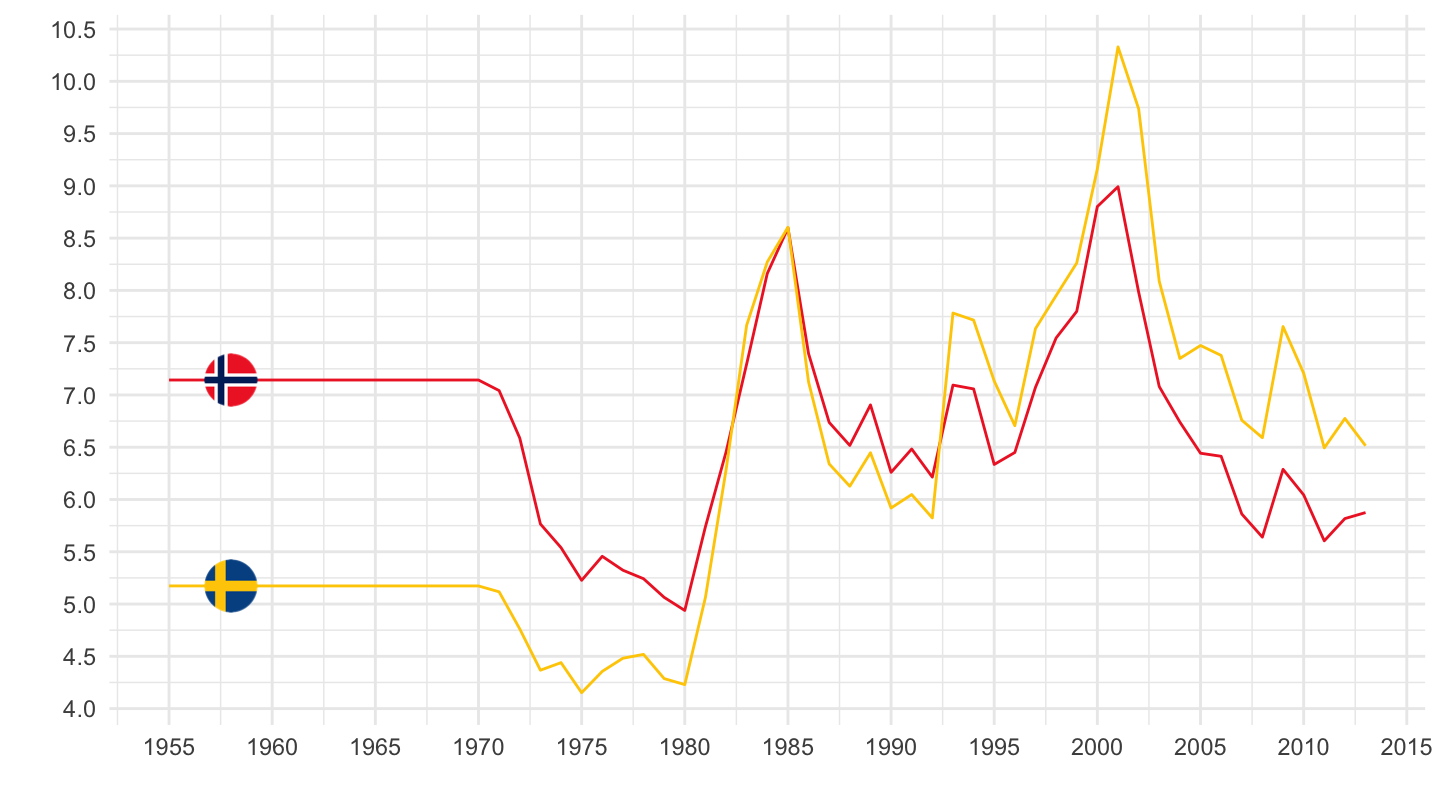
Sweden, Norway
Code
REFSERIES_MSIT %>%
  filter(COU %in% c("SWE", "NOR")) %>%
  filter(nchar(obsTime) == 4) %>%
  year_to_date %>%
  left_join(REFSERIES_MSIT_var$COU, by = "COU") %>%
  rename(Location = Cou) %>%
  left_join(colors, by = c("Location"  = "country")) %>%
  ggplot(.) + geom_line(aes(x = date, y = obsValue, color = color)) +
  scale_color_identity() + add_2flags +
  theme_minimal() + xlab("") + ylab("") +
  scale_x_date(breaks = seq(1955, 2020, 5) %>% paste0("-01-01") %>% as.Date,
               labels = date_format("%Y")) +
  scale_y_continuous(breaks = seq(-100, 200, .5))