Real Effective Exchange Rates, Monthly
Data - BIS
Info
LAST_COMPILE
| LAST_COMPILE |
|---|
| 2026-07-25 |
Last
| date | Nobs |
|---|---|
| 2023-12-01 | 181 |
iso3c, iso2c, Reference area
Code
EER %>%
  arrange(iso3c, date) %>%
  group_by(iso3c, iso2c, `Reference area`, FREQ) %>%
  summarise(Nobs = n(),
            start = first(date),
            end = last(date)) %>%
  arrange(-Nobs) %>%
  mutate(Flag = gsub(" ", "-", str_to_lower(`Reference area`)),
         Flag = paste0('<img src="../../bib/flags/vsmall/', Flag, '.png" alt="Flag">')) %>%
  mutate(html = paste0('<a  target=_blank href=EER.html#', gsub(" ", "_", `Reference area`), '> Link </a>')) %>%
  select(Flag, everything()) %>%
  {if (is_html_output()) datatable(., filter = 'top', rownames = F, escape = F) else .}
EER_TYPE
Code
EER %>%
  group_by(EER_TYPE, Type) %>%
  summarise(Nobs = n()) %>%
  arrange(-Nobs) %>%
print_table_conditional()| EER_TYPE | Type | Nobs |
|---|---|---|
| R | Real | 42480 |
| N | Nominal | 41760 |
EER_BASKET
Code
EER %>%
  group_by(EER_BASKET, Basket) %>%
  summarise(Nobs = n()) %>%
  arrange(-Nobs) %>%
print_table_conditional()| EER_BASKET | Basket | Nobs |
|---|---|---|
| B | Broad (64 economies) | 46080 |
| N | Narrow (27 economies) | 38160 |
Individual Countries
Argentina
All
Code
EER %>%
  filter(iso3c %in% c("ARG")) %>%
  mutate(variable = paste0(Type, ", ", Basket)) %>%
  ggplot(.) + geom_line(aes(x = date, y = value, color = variable)) +
  theme_minimal() + xlab("") + ylab("Exchange Rate ($? = National Currency)") +

  scale_x_date(breaks = seq(1940, 2100, 5) %>% paste0("-01-01") %>% as.Date,
               labels = date_format("%Y")) +
  scale_y_log10(breaks = seq(0, 600, 10),
                labels = dollar_format(accuracy = 1, prefix = "")) +
  theme(legend.position = c(0.7, 0.90),
        legend.title = element_blank())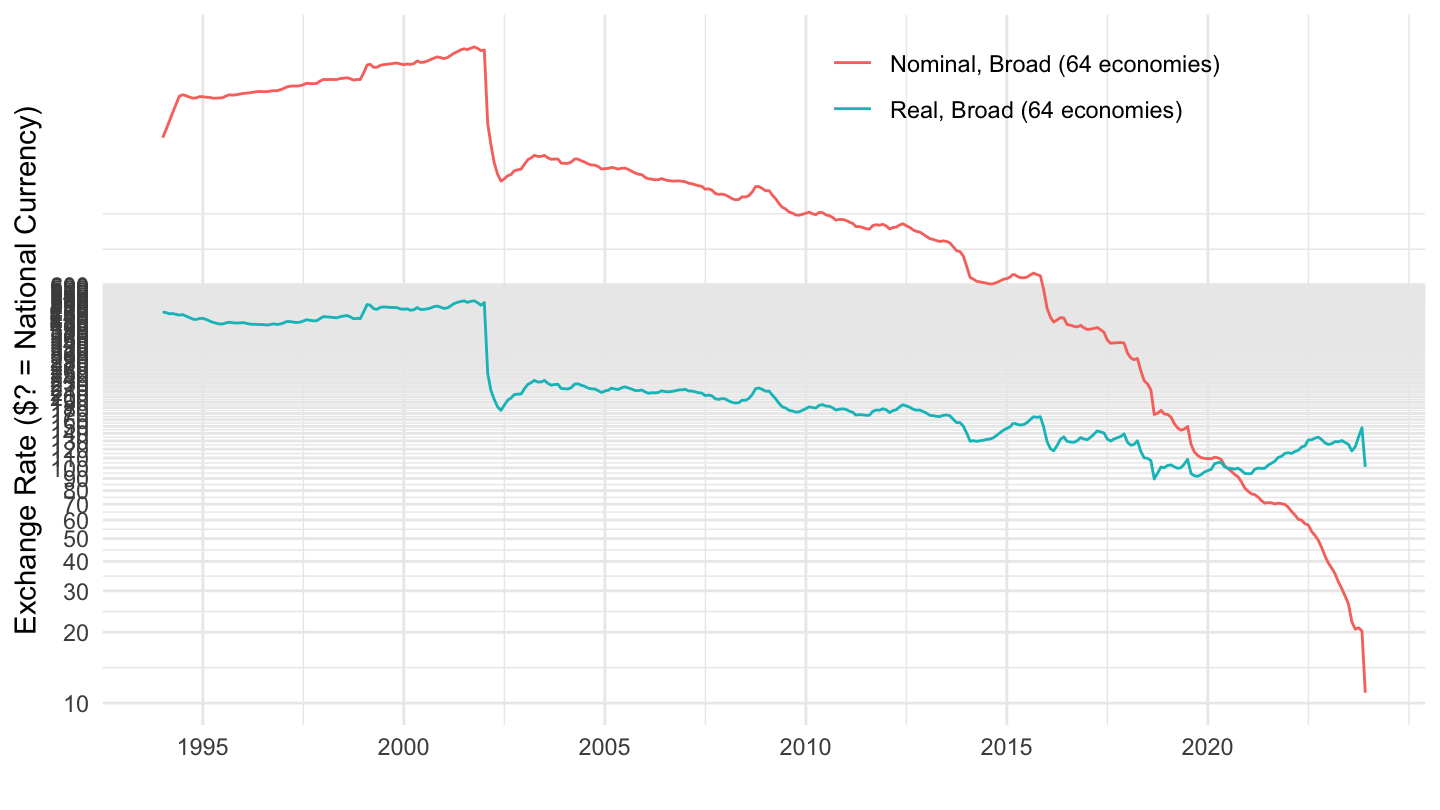
2000-
Code
EER %>%
  filter(iso3c %in% c("ARG"),
         date >= as.Date("2000-01-01")) %>%
  mutate(variable = paste0(Type, ", ", Basket)) %>%
  ggplot(.) + geom_line(aes(x = date, y = value, color = variable)) +
  theme_minimal() + xlab("") + ylab("Exchange Rate ($? = National Currency)") +

  scale_x_date(breaks = seq(1940, 2100, 2) %>% paste0("-01-01") %>% as.Date,
               labels = date_format("%Y")) +
  scale_y_log10(breaks = seq(0, 600, 10),
                labels = dollar_format(accuracy = 1, prefix = "")) +
  theme(legend.position = c(0.7, 0.90),
        legend.title = element_blank())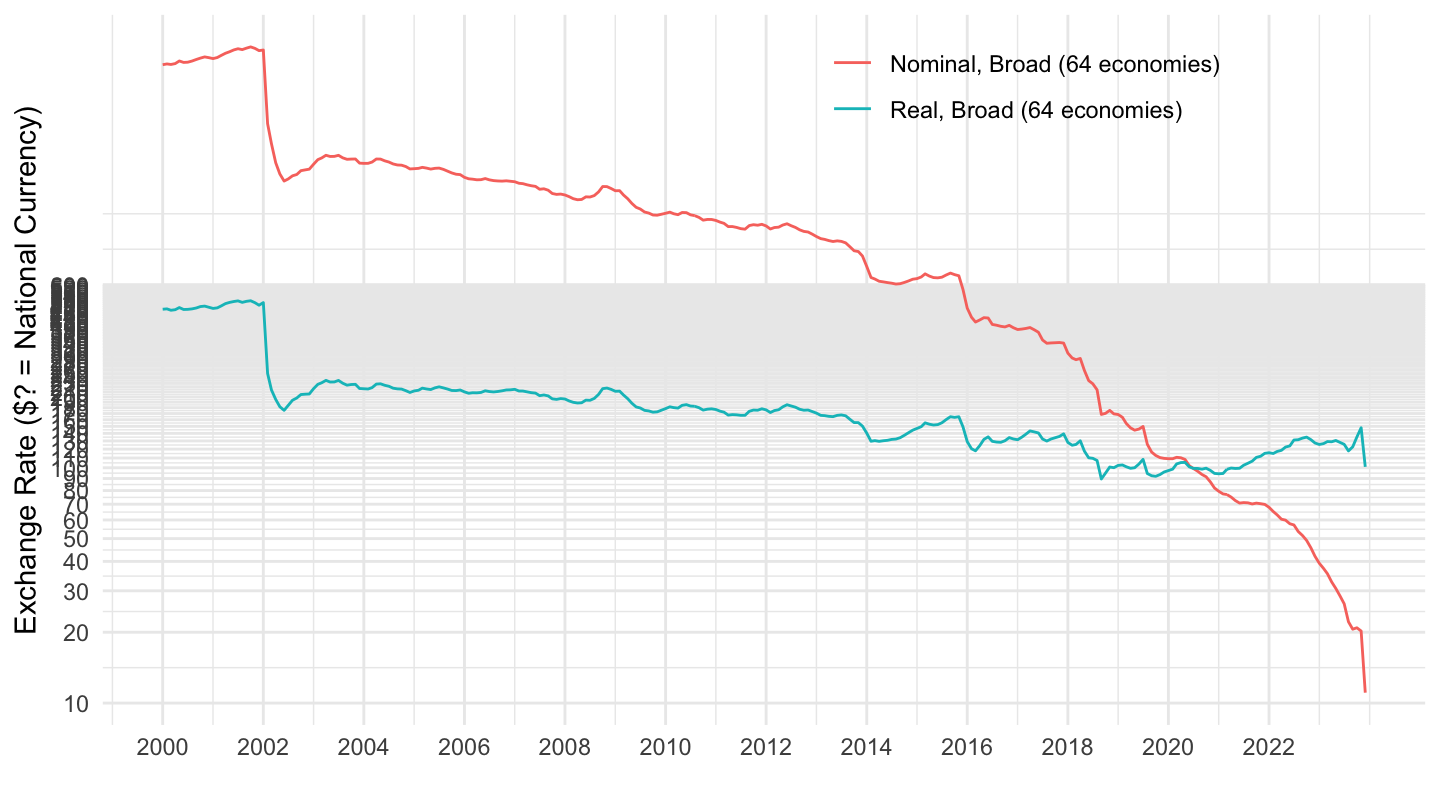
2010-
Code
EER %>%
  filter(iso3c %in% c("ARG"),
         date >= as.Date("2010-01-01")) %>%
  mutate(variable = paste0(Type, ", ", Basket)) %>%
  ggplot(.) + geom_line(aes(x = date, y = value, color = variable)) +
  theme_minimal() + xlab("") + ylab("Exchange Rate ($? = National Currency)") +

  scale_x_date(breaks = seq(1940, 2100, 2) %>% paste0("-01-01") %>% as.Date,
               labels = date_format("%Y")) +
  scale_y_log10(breaks = seq(0, 600, 10),
                labels = dollar_format(accuracy = 1, prefix = "")) +
  theme(legend.position = c(0.2, 0.2),
        legend.title = element_blank())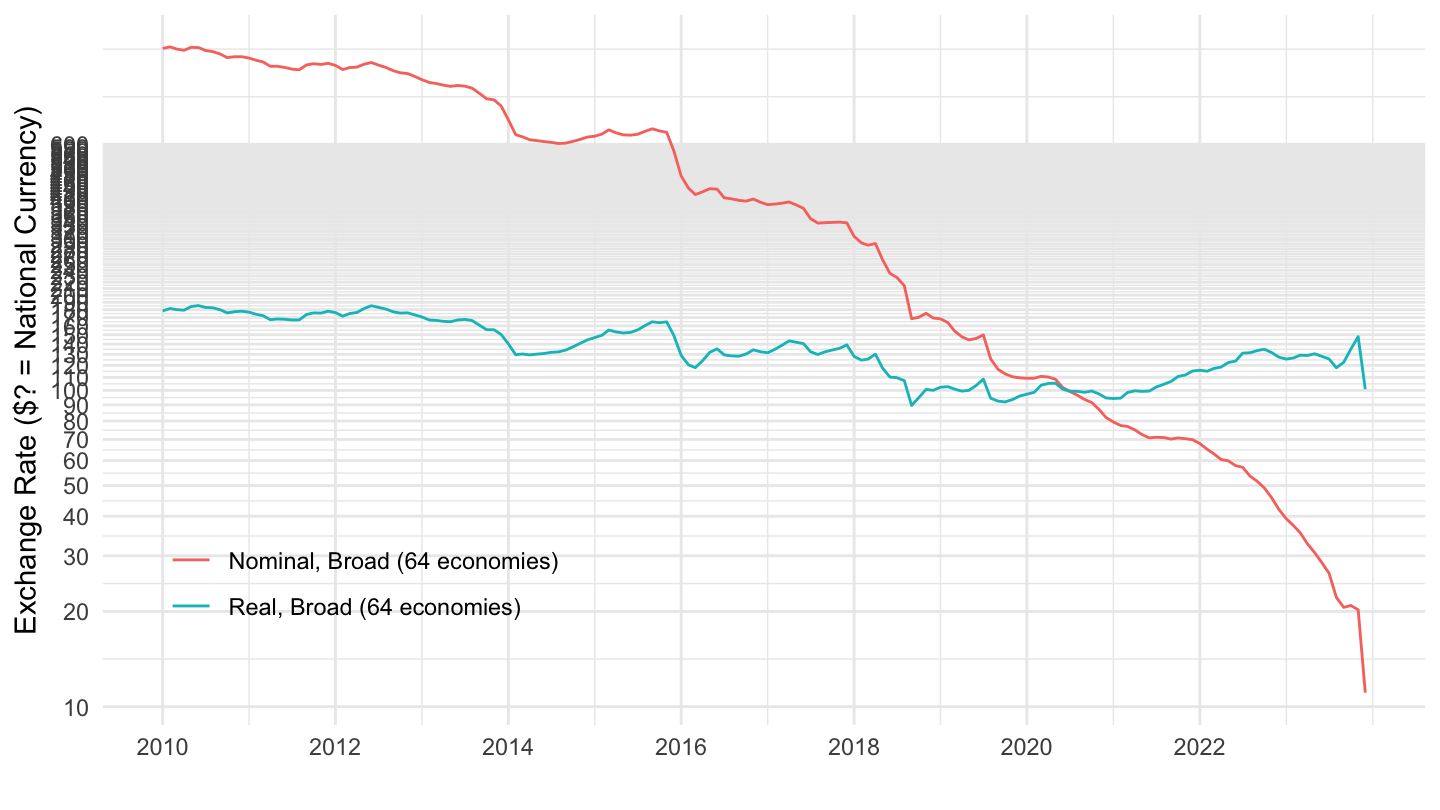
United States
All
Code
EER %>%
  filter(iso3c %in% c("USA")) %>%
  mutate(variable = paste0(Type, ", ", Basket)) %>%
  ggplot(.) + geom_line(aes(x = date, y = value, color = variable)) +
  theme_minimal() + xlab("") + ylab("Exchange Rate ($? = National Currency)") +

  scale_x_date(breaks = seq(1940, 2100, 5) %>% paste0("-01-01") %>% as.Date,
               labels = date_format("%Y")) +
  scale_y_log10(breaks = seq(0, 600, 10),
                labels = dollar_format(accuracy = 1, prefix = "")) +
  theme(legend.position = c(0.7, 0.90),
        legend.title = element_blank())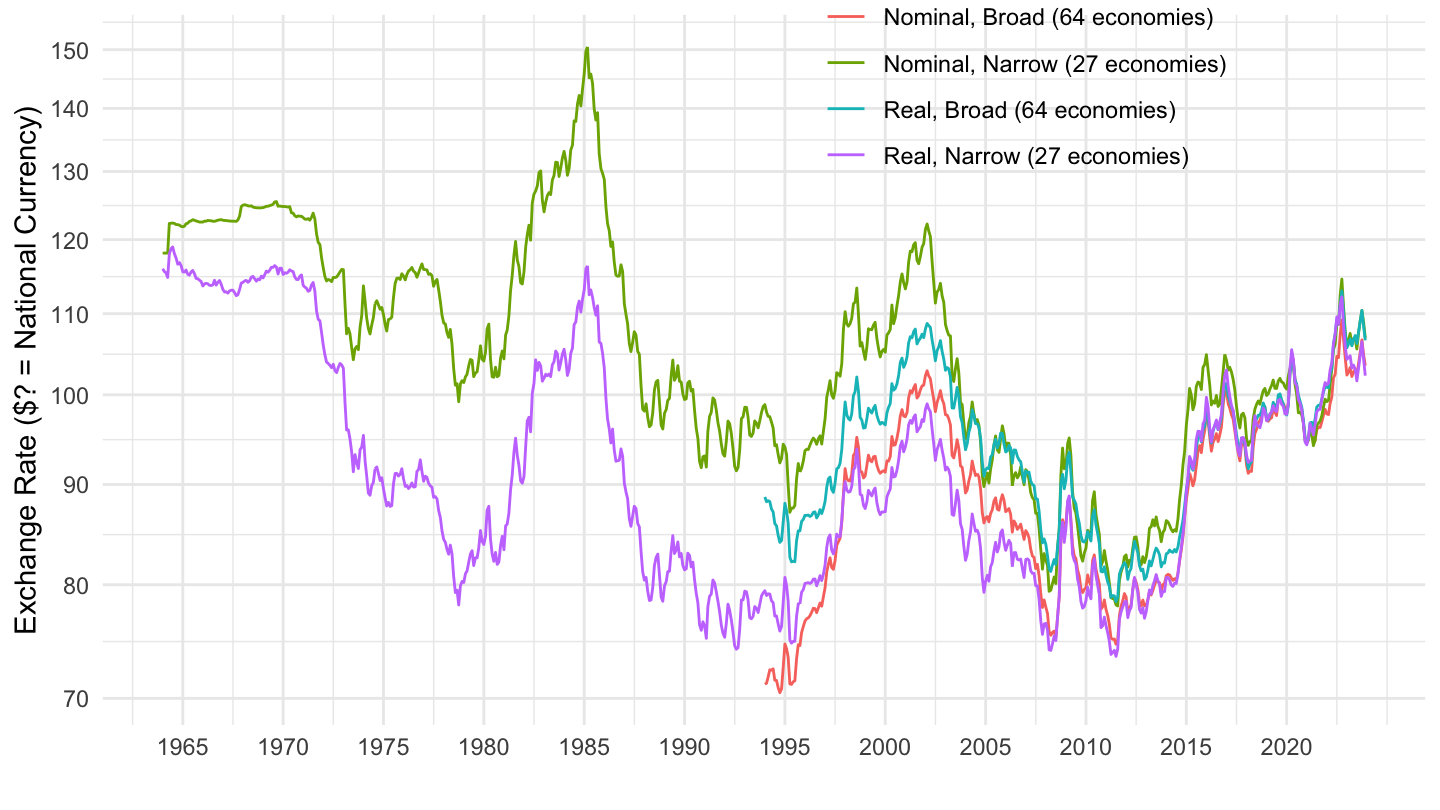
1964-1979
Code
EER %>%
  filter(iso3c %in% c("USA"),
         date <= as.Date("1979-01-01")) %>%
  mutate(variable = paste0(Type, ", ", Basket)) %>%
  group_by(variable) %>%
  mutate(value = 100* value/value[date == as.Date("1970-01-01")]) %>%
  ggplot(.) + geom_line(aes(x = date, y = value, color = variable)) +
  theme_minimal() + xlab("") + ylab("Exchange Rate ($? = National Currency)") +

  scale_x_date(breaks = seq(1940, 2100, 2) %>% paste0("-01-01") %>% as.Date,
               labels = date_format("%Y")) +
  scale_y_log10(breaks = seq(0, 600, 10),
                labels = dollar_format(accuracy = 1, prefix = "")) +
  theme(legend.position = c(0.2, 0.2),
        legend.title = element_blank())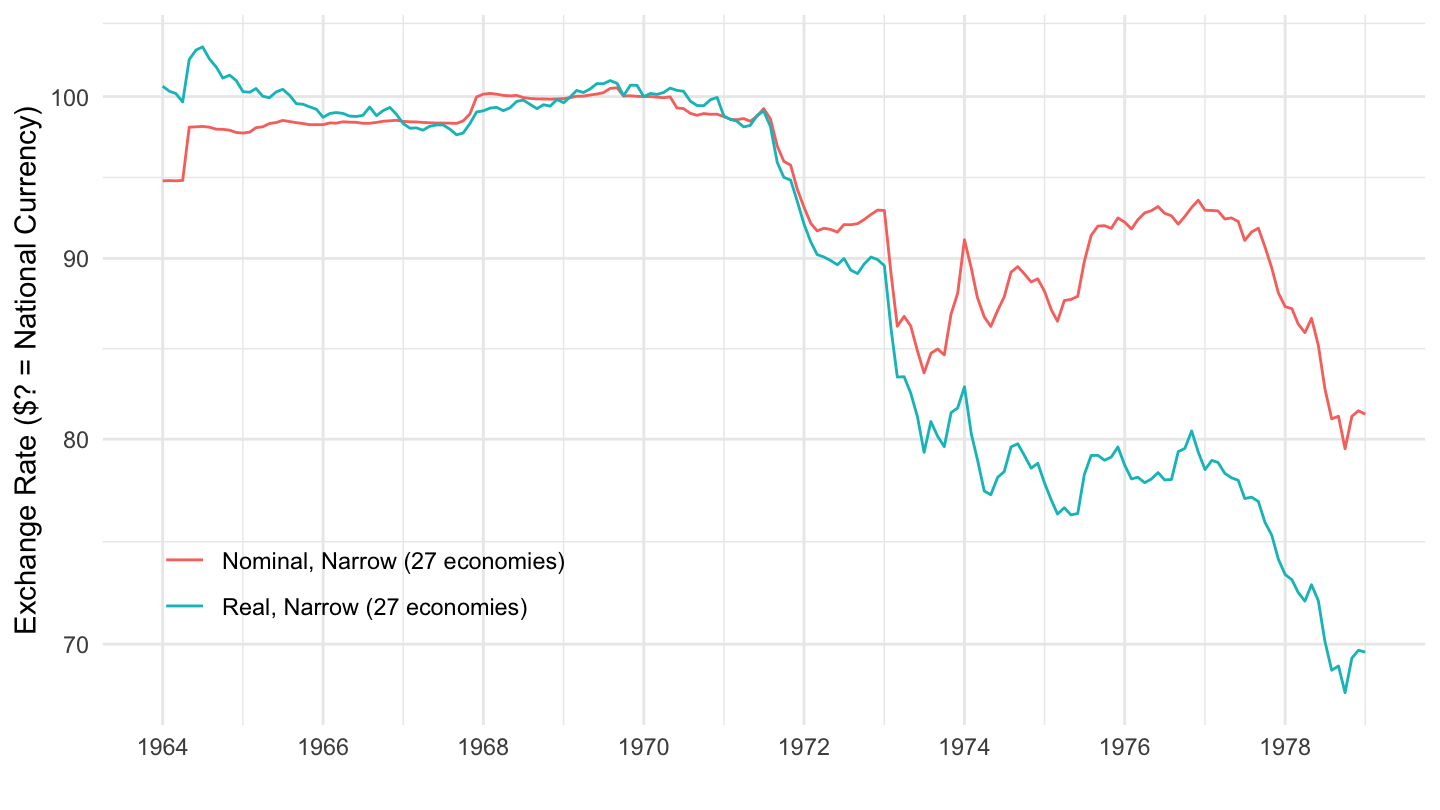
1964-1987
Code
EER %>%
  filter(iso3c %in% c("USA"),
         date <= as.Date("1987-01-01")) %>%
  mutate(variable = paste0(Type, ", ", Basket)) %>%
  ggplot(.) + geom_line(aes(x = date, y = value, color = variable)) +
  theme_minimal() + xlab("") + ylab("Exchange Rate ($? = National Currency)") +

  scale_x_date(breaks = seq(1940, 2100, 5) %>% paste0("-01-01") %>% as.Date,
               labels = date_format("%Y")) +
  scale_y_log10(breaks = seq(0, 600, 10),
                labels = dollar_format(accuracy = 1, prefix = "")) +
  theme(legend.position = c(0.2, 0.90),
        legend.title = element_blank())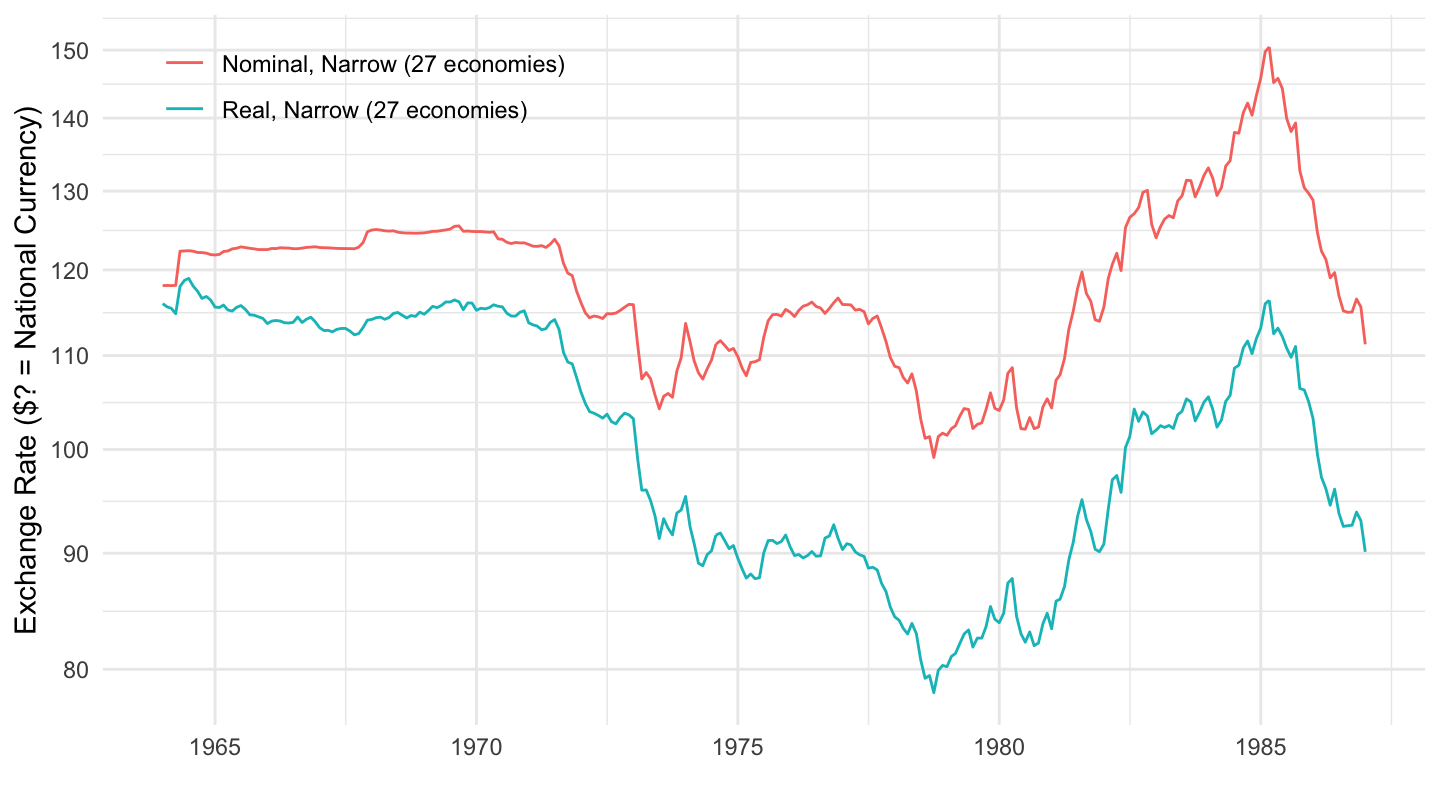
1980
Code
EER %>%
  filter(iso2c %in% c("US"),
         date >= as.Date("1980-01-01")) %>%
  mutate(variable = paste0(Type, ", ", Basket)) %>%
  ggplot(.) + geom_line(aes(x = date, y = value, color = variable)) +
  theme_minimal() + xlab("") + ylab("") +

  scale_x_date(breaks = seq(1940, 2100, 5) %>% paste0("-01-01") %>% as.Date,
               labels = date_format("%Y")) +
  scale_y_log10(breaks = seq(0, 600, 10),
                labels = dollar_format(accuracy = 1, prefix = "")) +
  theme(legend.position = c(0.65, 0.8),
        legend.title = element_blank())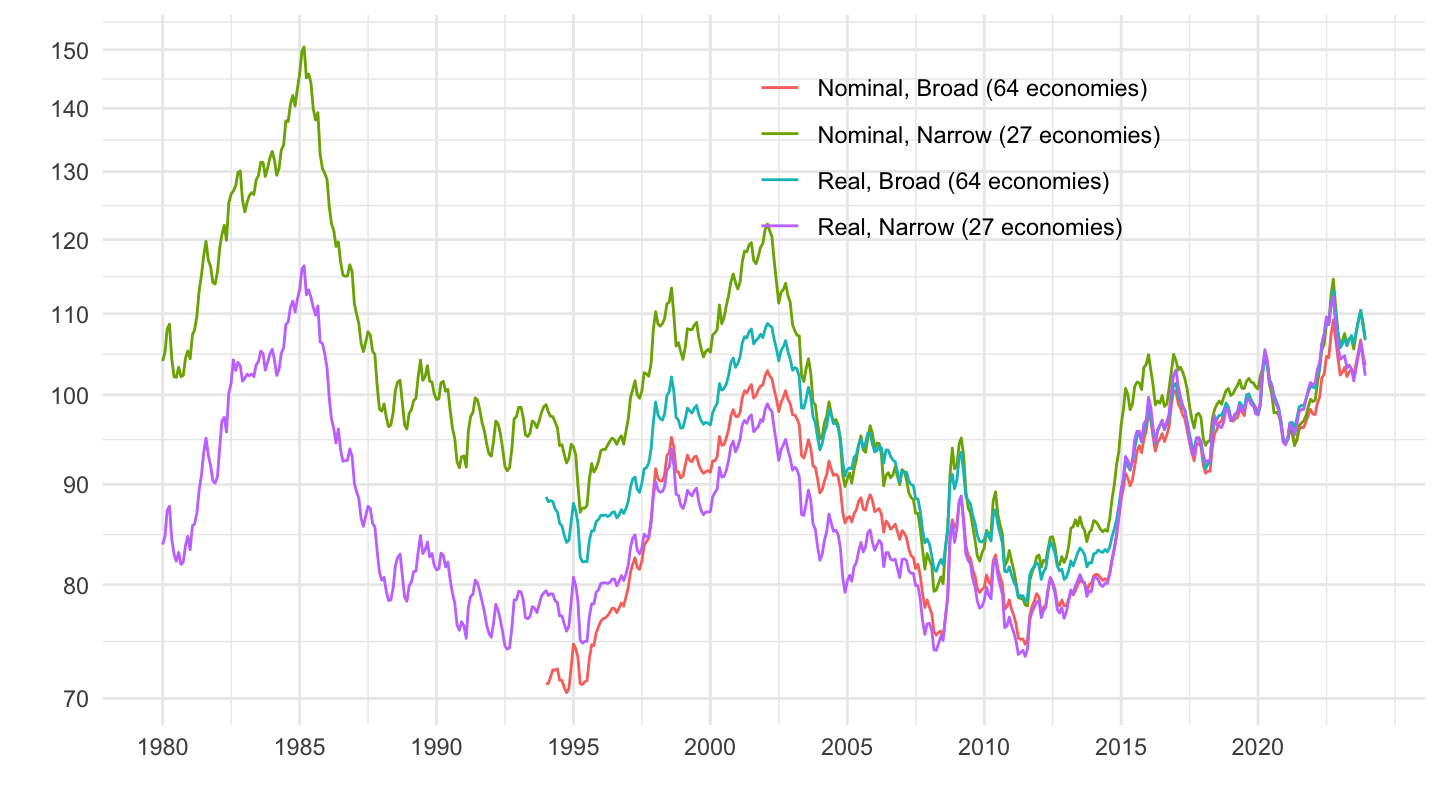
1990
Code
EER %>%
  filter(iso2c %in% c("US"),
         date >= as.Date("1990-01-01")) %>%
  mutate(variable = paste0(Type, ", ", Basket)) %>%
  ggplot(.) + geom_line(aes(x = date, y = value, color = variable)) +
  theme_minimal() + xlab("") + ylab("") +

  scale_x_date(breaks = seq(1940, 2100, 5) %>% paste0("-01-01") %>% as.Date,
               labels = date_format("%Y")) +
  scale_y_log10(breaks = seq(0, 600, 10),
                labels = dollar_format(accuracy = 1, prefix = "")) +
  theme(legend.position = c(0.65, 0.8),
        legend.title = element_blank())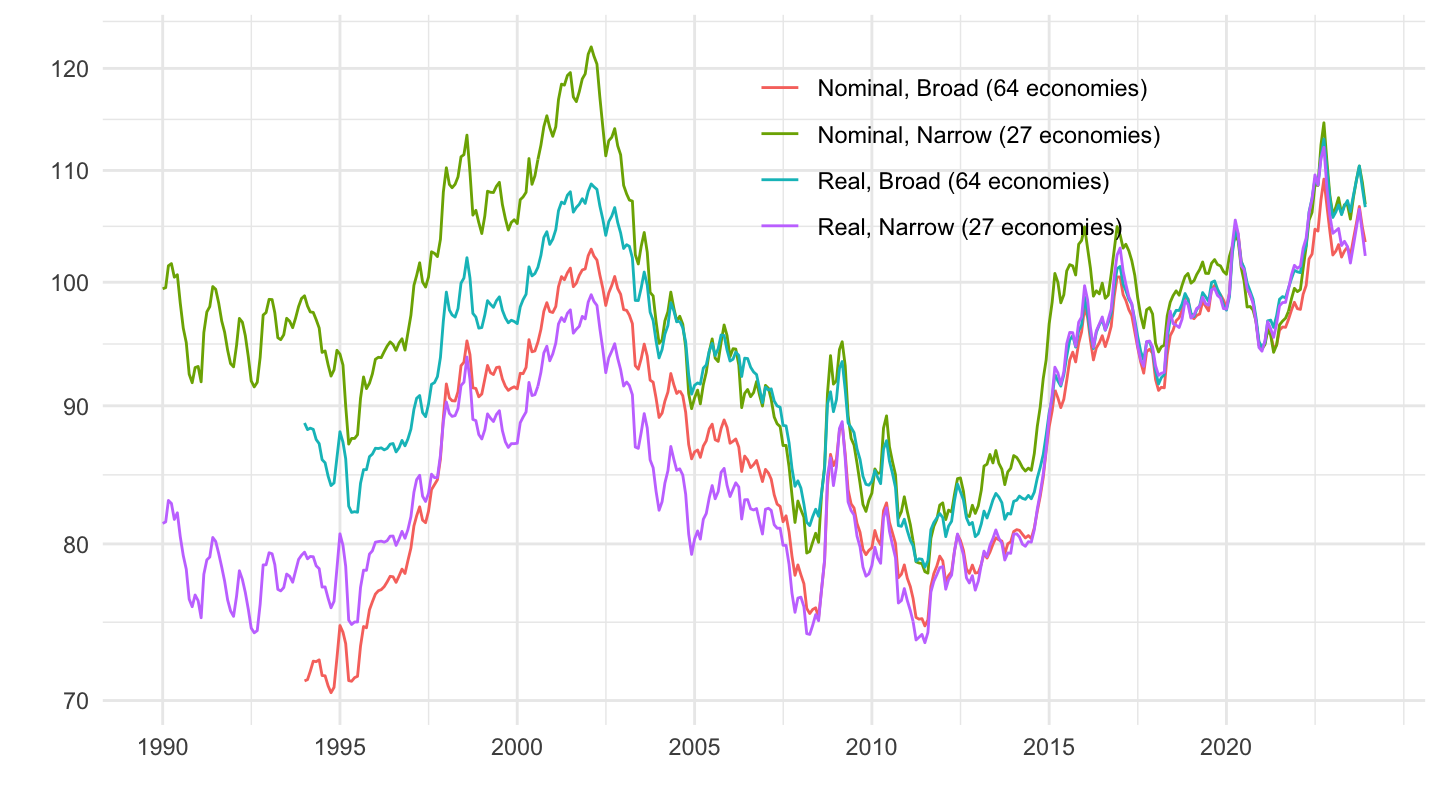
2000
Code
EER %>%
  filter(iso2c %in% c("US"),
         date >= as.Date("2000-01-01")) %>%
  mutate(variable = paste0(Type, ", ", Basket)) %>%
  ggplot(.) + geom_line(aes(x = date, y = value, color = variable)) +
  theme_minimal() + xlab("") + ylab("") +

  scale_x_date(breaks = seq(1940, 2100, 5) %>% paste0("-01-01") %>% as.Date,
               labels = date_format("%Y")) +
  scale_y_log10(breaks = seq(0, 600, 10),
                labels = dollar_format(accuracy = 1, prefix = "")) +
  theme(legend.position = c(0.5, 0.8),
        legend.title = element_blank())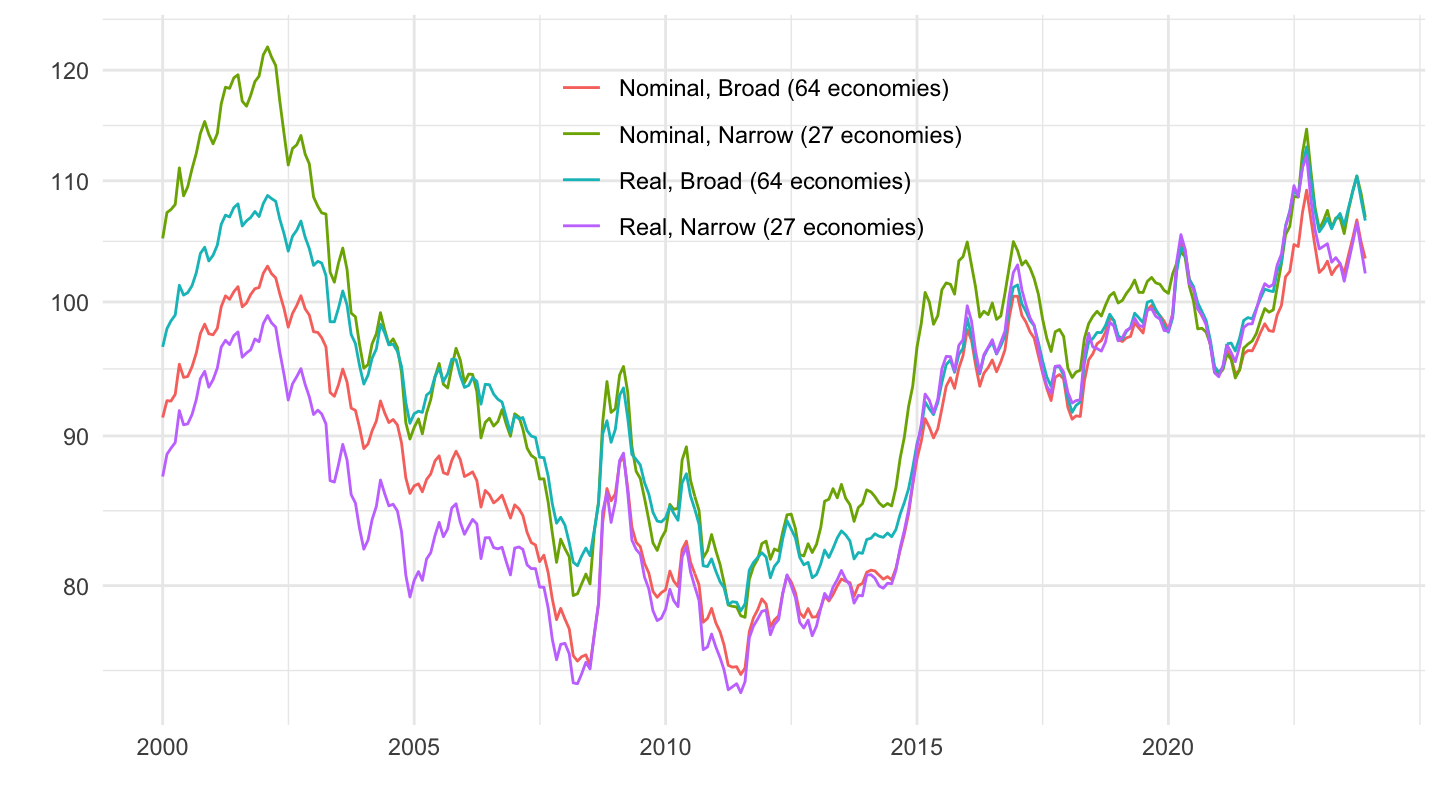
2010
Code
EER %>%
  filter(iso2c %in% c("US"),
         date >= as.Date("2010-01-01")) %>%
  mutate(variable = paste0(Type, ", ", Basket)) %>%
  ggplot(.) + geom_line(aes(x = date, y = value, color = variable)) +
  theme_minimal() + xlab("") + ylab("") +

  scale_x_date(breaks = seq(1940, 2100, 2) %>% paste0("-01-01") %>% as.Date,
               labels = date_format("%Y")) +
  scale_y_log10(breaks = seq(0, 600, 10),
                labels = dollar_format(accuracy = 1, prefix = "")) +
  theme(legend.position = c(0.7, 0.2),
        legend.title = element_blank())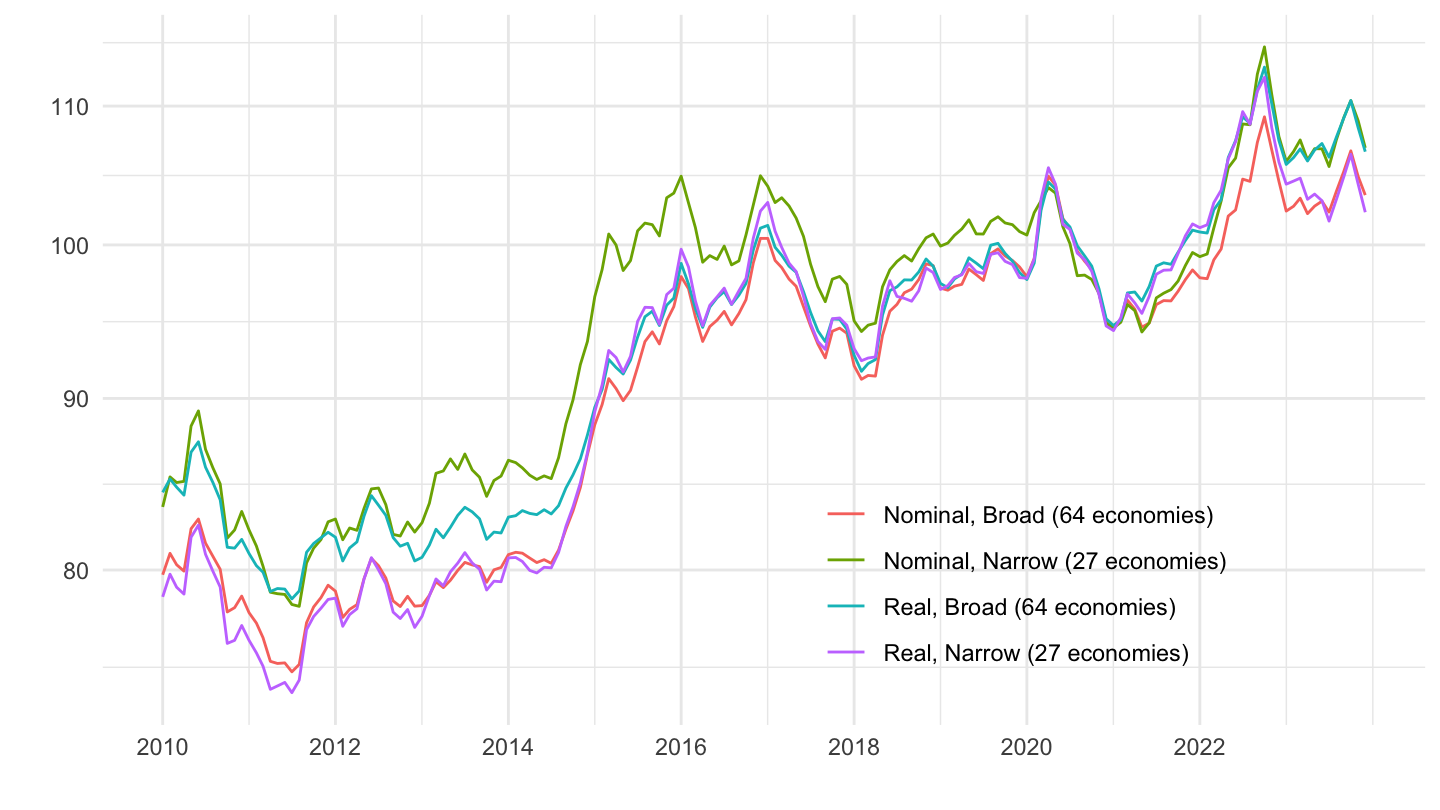
2009-2014
Code
EER %>%
  filter(iso2c %in% c("US"),
         date >= as.Date("2009-01-01"),
         date <= as.Date("2014-12-31")) %>%
  mutate(variable = paste0(Type, ", ", Basket)) %>%
  ggplot(.) + geom_line(aes(x = date, y = value, color = variable)) +
  theme_minimal() + xlab("") + ylab("") +

  scale_x_date(breaks = seq(1940, 2100, 1) %>% paste0("-01-01") %>% as.Date,
               labels = date_format("%Y")) +
  scale_y_log10(breaks = seq(0, 600, 5),
                labels = dollar_format(accuracy = 1, prefix = "")) +
  theme(legend.position = c(0.5, 0.8),
        legend.title = element_blank())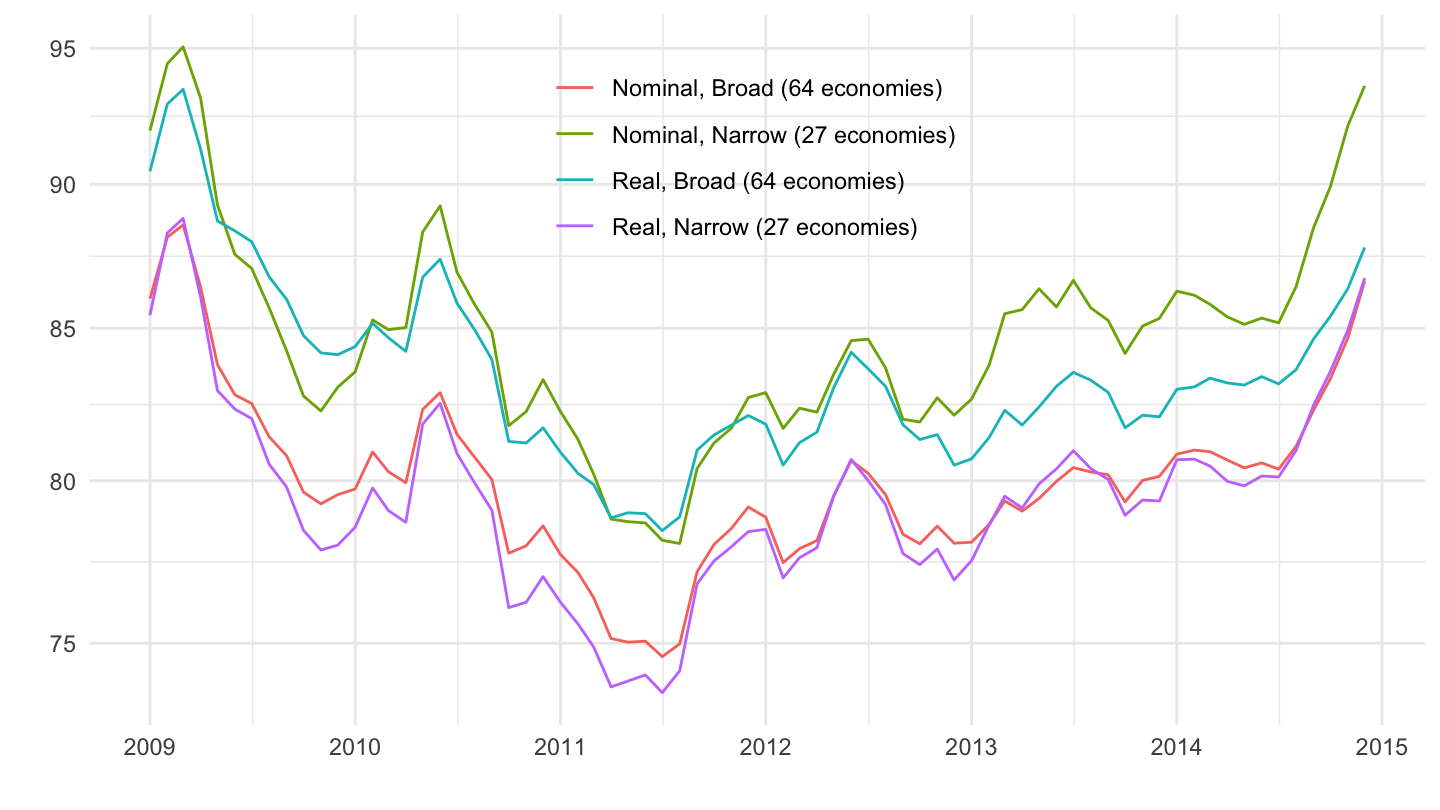
2017-
Code
EER %>%
  filter(iso2c %in% c("US"),
         date >= as.Date("2016-01-01")) %>%
  mutate(variable = paste0(Type, ", ", Basket)) %>%
  ggplot(.) + geom_line(aes(x = date, y = value, color = variable)) +
  theme_minimal() + xlab("") + ylab("") +

  scale_x_date(breaks = seq(1940, 2100, 1) %>% paste0("-01-01") %>% as.Date,
               labels = date_format("%Y")) +
  scale_y_log10(breaks = seq(0, 600, 5),
                labels = dollar_format(accuracy = 1, prefix = "")) +
  theme(legend.position = c(0.5, 0.8),
        legend.title = element_blank())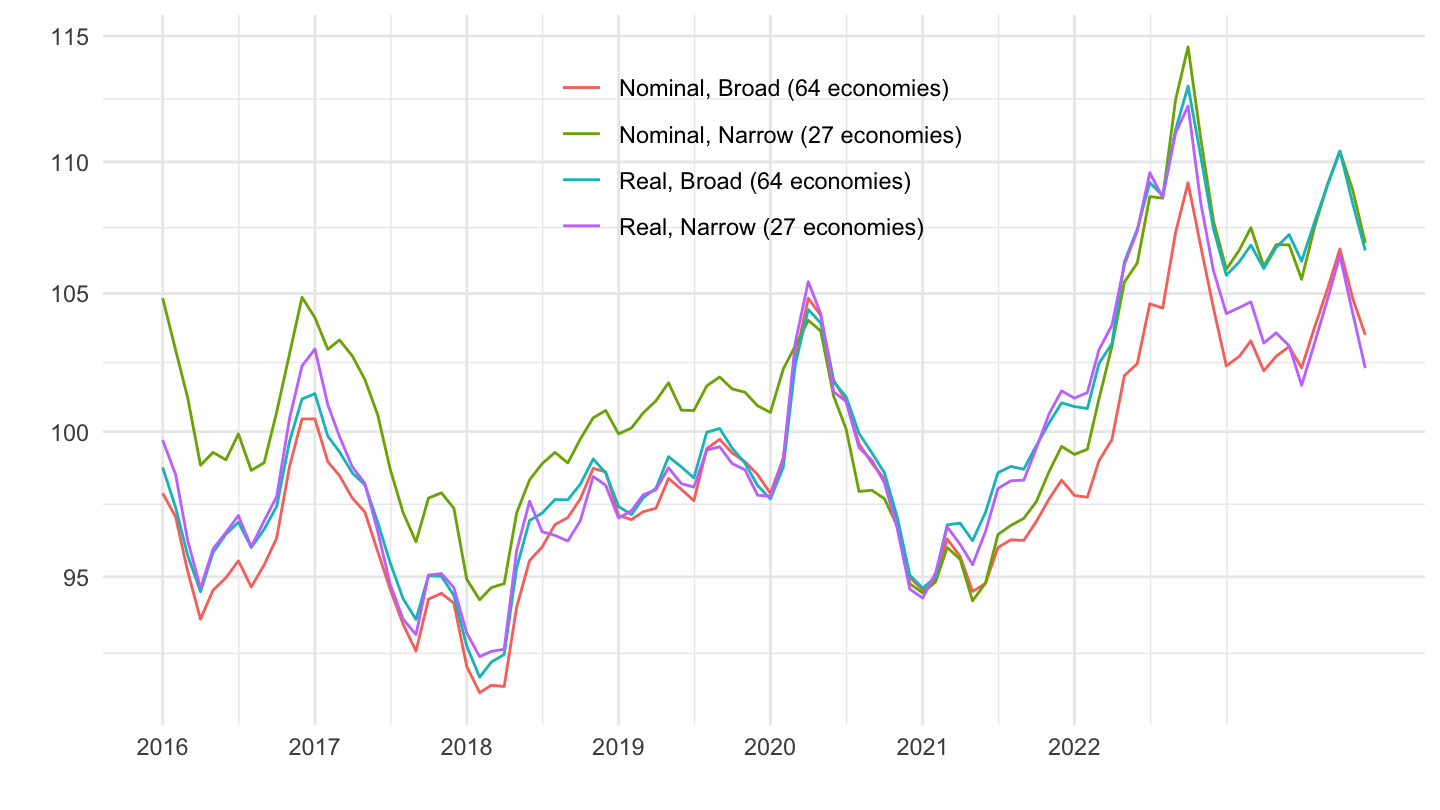
Japan
All
Code
EER %>%
  filter(iso3c %in% c("JPN")) %>%
  mutate(variable = paste0(Type, ", ", Basket)) %>%
  ggplot(.) + geom_line(aes(x = date, y = value, color = variable)) +
  theme_minimal() + xlab("") + ylab("Exchange Rate ($? = National Currency)") +

  scale_x_date(breaks = seq(1940, 2100, 5) %>% paste0("-01-01") %>% as.Date,
               labels = date_format("%Y")) +
  scale_y_log10(breaks = seq(0, 600, 10),
                labels = dollar_format(accuracy = 1, prefix = "")) +
  theme(legend.position = c(0.7, 0.30),
        legend.title = element_blank())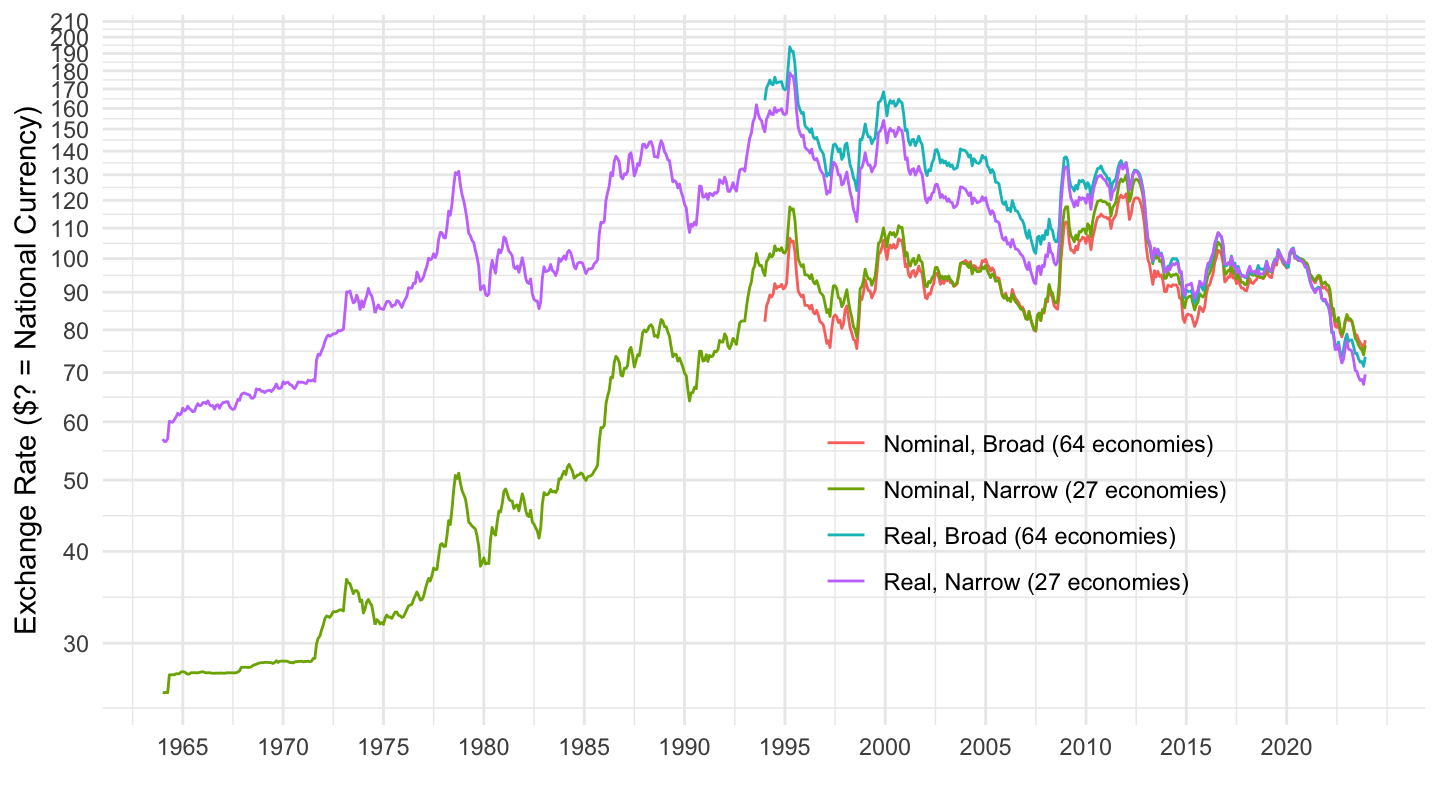
1980
Code
EER %>%
  filter(iso3c %in% c("JPN"),
         date >= as.Date("1980-01-01")) %>%
  mutate(variable = paste0(Type, ", ", Basket)) %>%
  ggplot(.) + geom_line(aes(x = date, y = value, color = variable)) +
  theme_minimal() + xlab("") + ylab("") +

  scale_x_date(breaks = seq(1940, 2100, 2) %>% paste0("-01-01") %>% as.Date,
               labels = date_format("%Y")) +
  scale_y_log10(breaks = seq(0, 600, 10),
                labels = dollar_format(accuracy = 1, prefix = "")) +
  theme(legend.position = c(0.65, 0.25),
        legend.title = element_blank())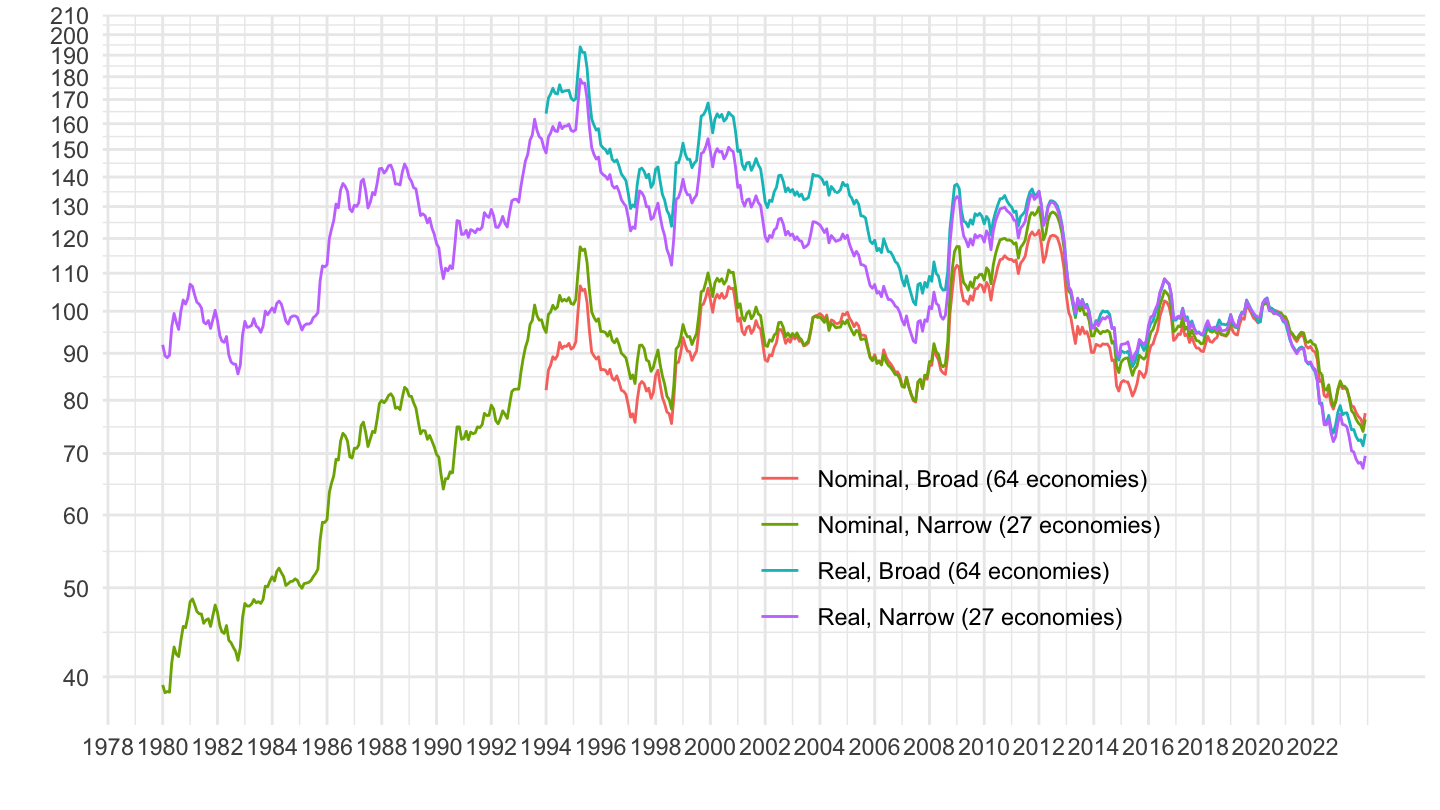
1990
Code
EER %>%
  filter(iso3c %in% c("JPN"),
         date >= as.Date("1990-01-01")) %>%
  mutate(variable = paste0(Type, ", ", Basket)) %>%
  ggplot(.) + geom_line(aes(x = date, y = value, color = variable)) +
  theme_minimal() + xlab("") + ylab("") +

  scale_x_date(breaks = seq(1940, 2100, 2) %>% paste0("-01-01") %>% as.Date,
               labels = date_format("%Y")) +
  scale_y_log10(breaks = seq(0, 600, 10),
                labels = dollar_format(accuracy = 1, prefix = "")) +
  theme(legend.position = c(0.65, 0.85),
        legend.title = element_blank())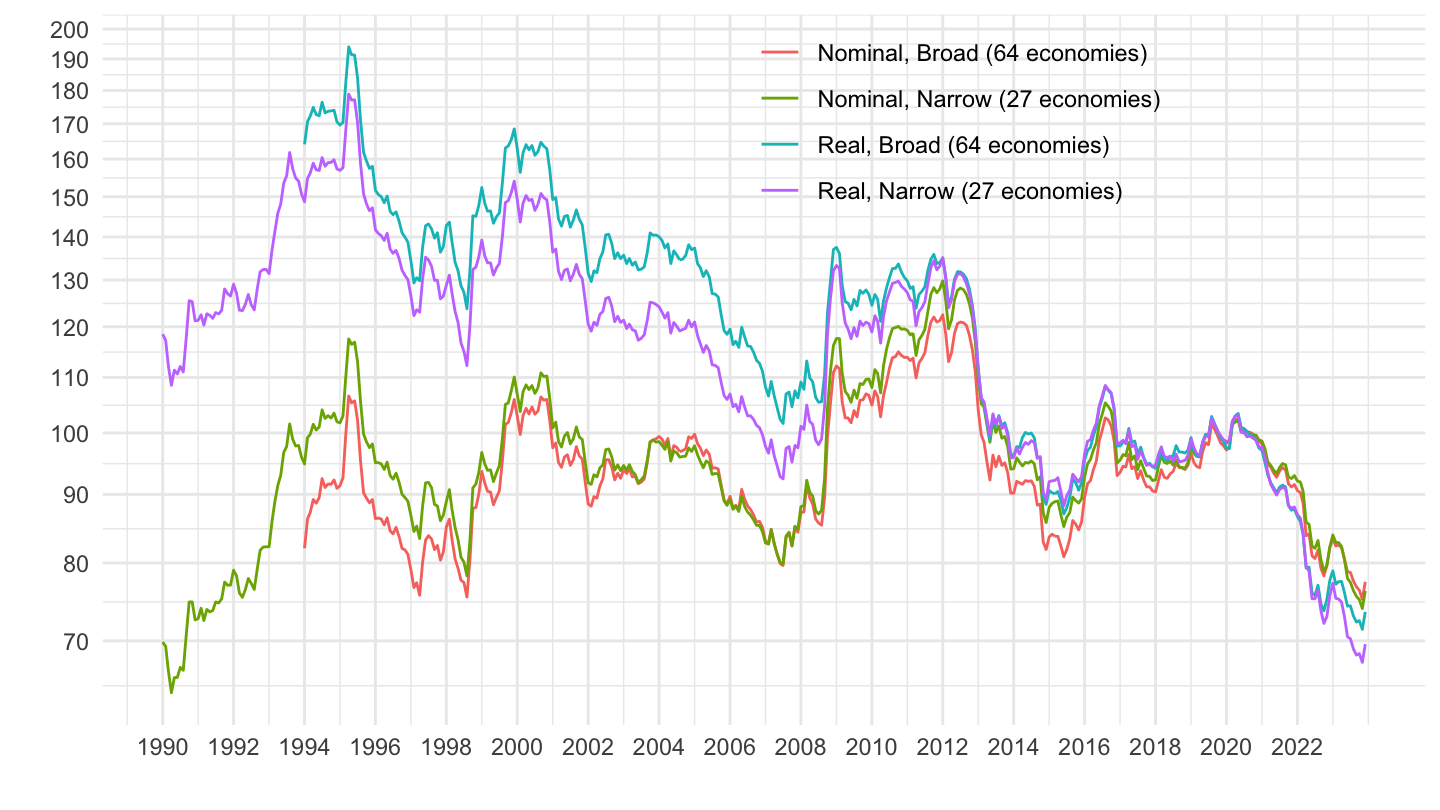
2000
Code
EER %>%
  filter(iso3c %in% c("JPN"),
         date >= as.Date("2000-01-01")) %>%
  mutate(variable = paste0(Type, ", ", Basket)) %>%
  ggplot(.) + geom_line(aes(x = date, y = value, color = variable)) +
  theme_minimal() + xlab("") + ylab("") +

  scale_x_date(breaks = seq(1940, 2100, 2) %>% paste0("-01-01") %>% as.Date,
               labels = date_format("%Y")) +
  scale_y_log10(breaks = seq(0, 600, 10),
                labels = dollar_format(accuracy = 1, prefix = "")) +
  theme(legend.position = c(0.8, 0.9),
        legend.title = element_blank())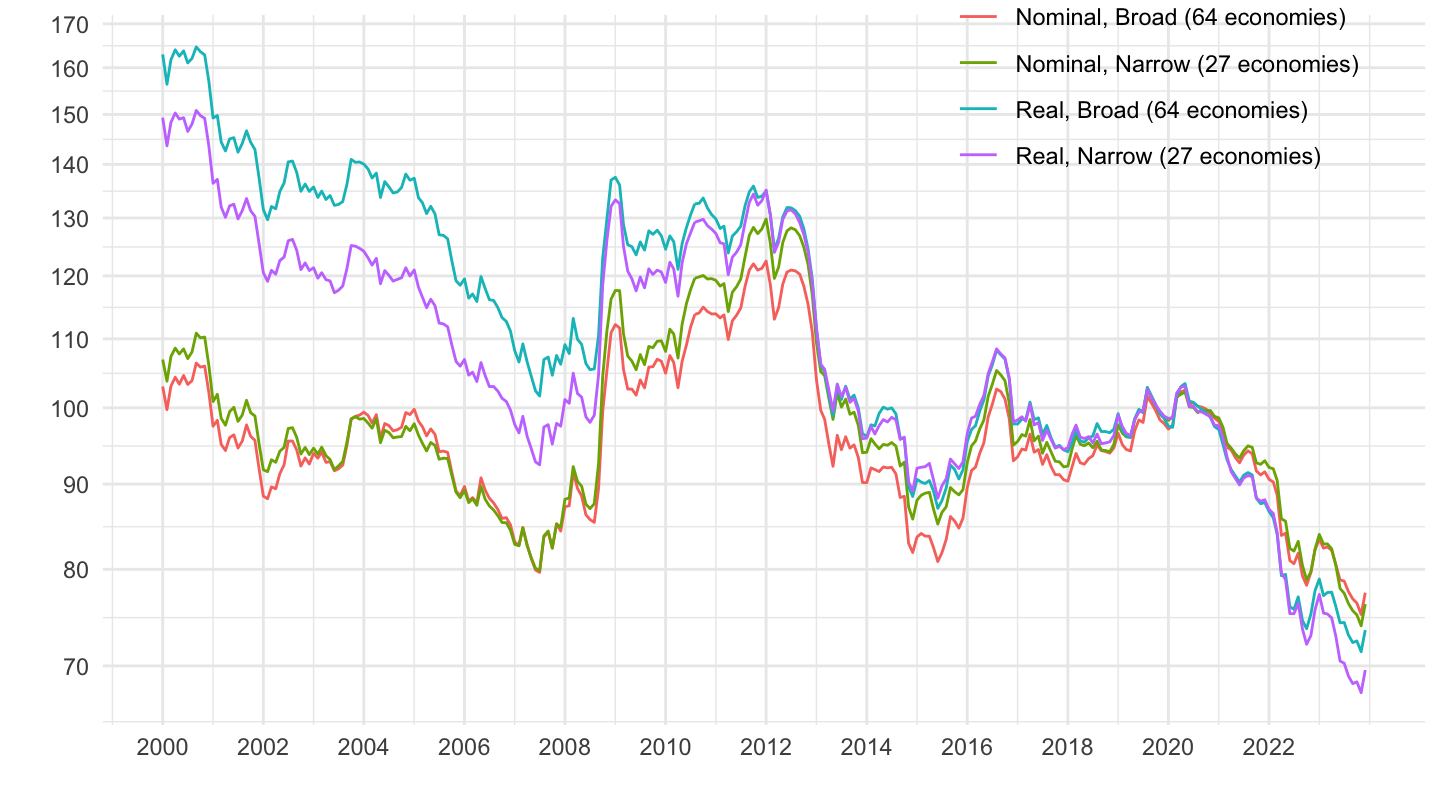
2010
Code
EER %>%
  filter(iso3c %in% c("JPN"),
         date >= as.Date("2010-01-01")) %>%
  mutate(variable = paste0(Type, ", ", Basket)) %>%
  ggplot(.) + geom_line(aes(x = date, y = value, color = variable)) +
  theme_minimal() + xlab("") + ylab("") +

  scale_x_date(breaks = seq(1940, 2100, 1) %>% paste0("-01-01") %>% as.Date,
               labels = date_format("%Y")) +
  scale_y_log10(breaks = seq(0, 600, 10),
                labels = dollar_format(accuracy = 1, prefix = "")) +
  theme(legend.position = c(0.7, 0.85),
        legend.title = element_blank())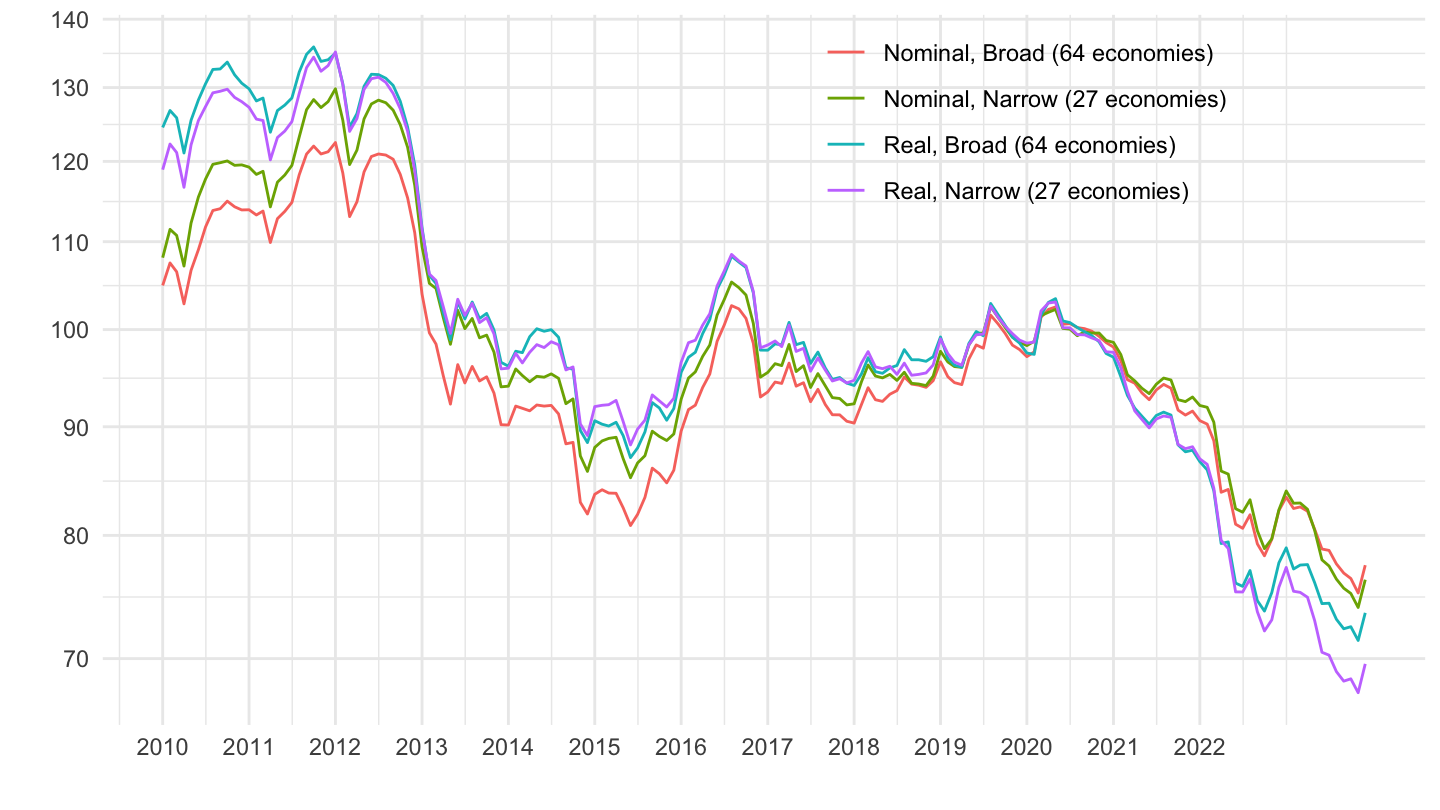
2009-2014
Code
EER %>%
  filter(iso3c %in% c("JPN"),
         date >= as.Date("2009-01-01"),
         date <= as.Date("2014-12-31")) %>%
  mutate(variable = paste0(Type, ", ", Basket)) %>%
  ggplot(.) + geom_line(aes(x = date, y = value, color = variable)) +
  theme_minimal() + xlab("") + ylab("") +

  scale_x_date(breaks = seq(1940, 2100, 1) %>% paste0("-01-01") %>% as.Date,
               labels = date_format("%Y")) +
  scale_y_log10(breaks = seq(0, 600, 5),
                labels = dollar_format(accuracy = 1, prefix = "")) +
  theme(legend.position = c(0.3, 0.3),
        legend.title = element_blank())
New Zealand
All
Code
EER %>%
  filter(iso3c %in% c("NZL")) %>%
  mutate(variable = paste0(Type, ", ", Basket)) %>%
  ggplot(.) + geom_line(aes(x = date, y = value, color = variable)) +
  theme_minimal() + xlab("") + ylab("Exchange Rate ($? = National Currency)") +

  scale_x_date(breaks = seq(1940, 2100, 5) %>% paste0("-01-01") %>% as.Date,
               labels = date_format("%Y")) +
  scale_y_log10(breaks = seq(0, 600, 10),
                labels = dollar_format(accuracy = 1, prefix = "")) +
  theme(legend.position = c(0.7, 0.7),
        legend.title = element_blank())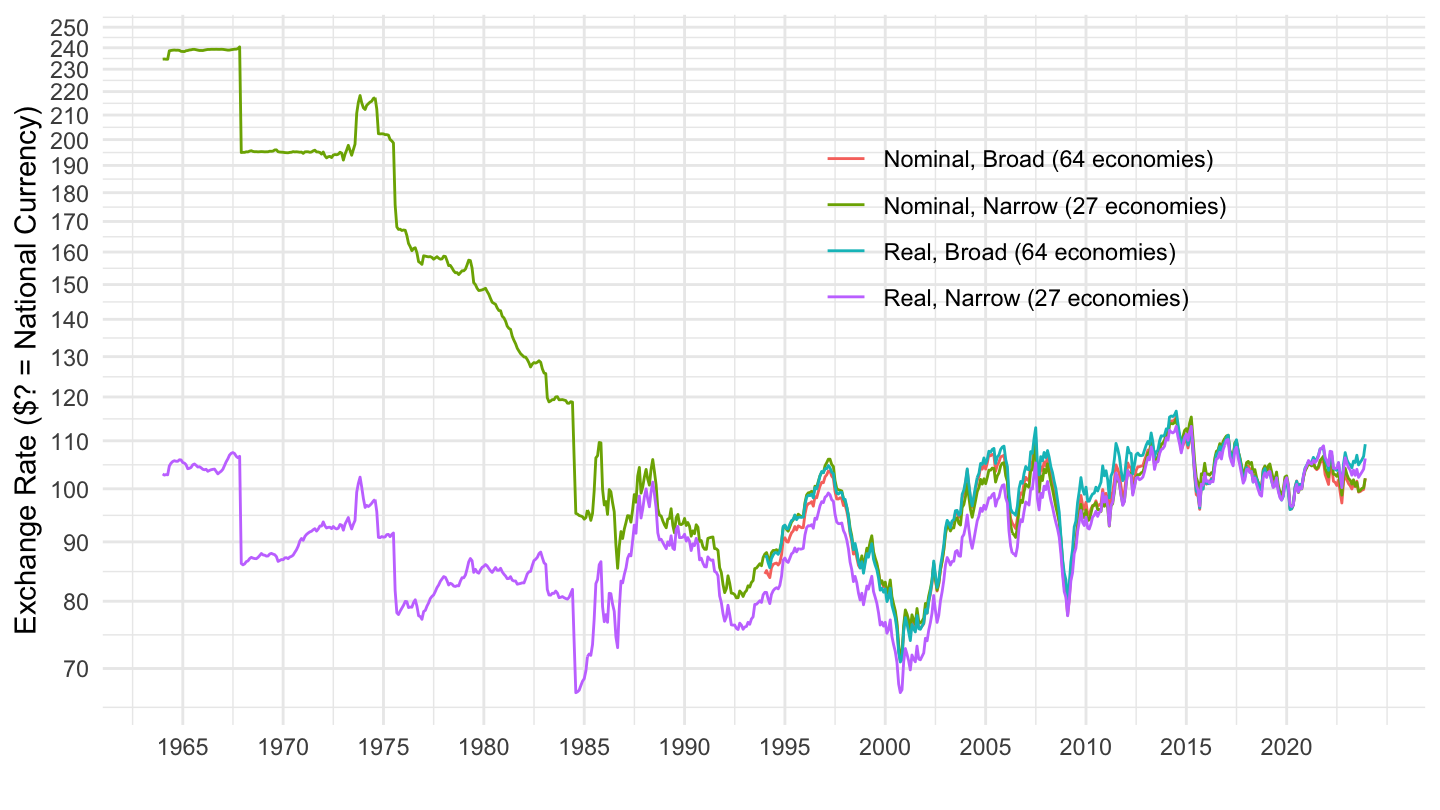
1980
Code
EER %>%
  filter(iso3c %in% c("NZL"),
         date >= as.Date("1980-01-01")) %>%
  mutate(variable = paste0(Type, ", ", Basket)) %>%
  ggplot(.) + geom_line(aes(x = date, y = value, color = variable)) +
  theme_minimal() + xlab("") + ylab("") +

  scale_x_date(breaks = seq(1940, 2100, 2) %>% paste0("-01-01") %>% as.Date,
               labels = date_format("%Y")) +
  scale_y_log10(breaks = seq(0, 600, 10),
                labels = dollar_format(accuracy = 1, prefix = "")) +
  theme(legend.position = c(0.65, 0.25),
        legend.title = element_blank())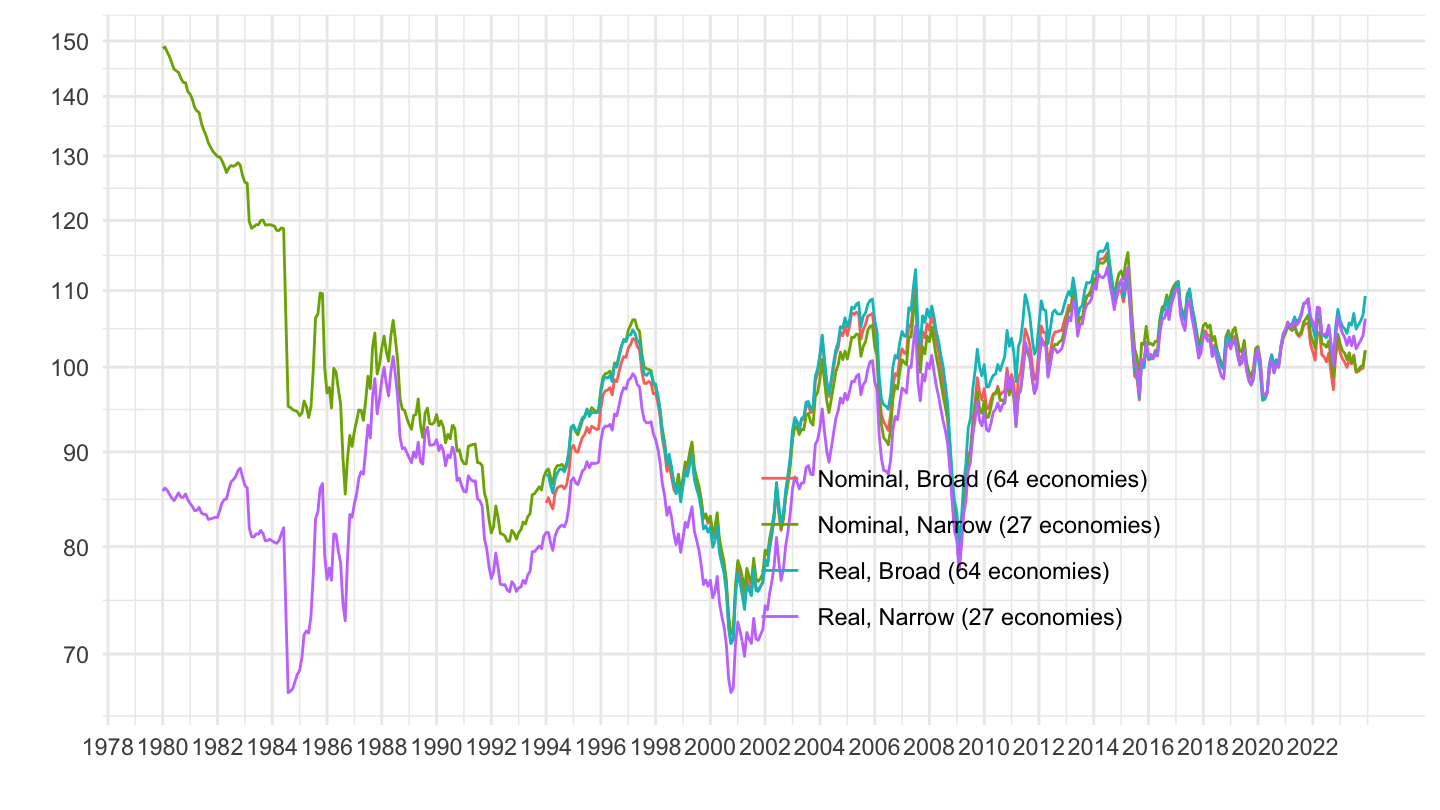
1990
Code
EER %>%
  filter(iso3c %in% c("NZL"),
         date >= as.Date("1990-01-01")) %>%
  mutate(variable = paste0(Type, ", ", Basket)) %>%
  ggplot(.) + geom_line(aes(x = date, y = value, color = variable)) +
  theme_minimal() + xlab("") + ylab("") +

  scale_x_date(breaks = seq(1940, 2100, 2) %>% paste0("-01-01") %>% as.Date,
               labels = date_format("%Y")) +
  scale_y_log10(breaks = seq(0, 600, 10),
                labels = dollar_format(accuracy = 1, prefix = "")) +
  theme(legend.position = c(0.65, 0.3),
        legend.title = element_blank())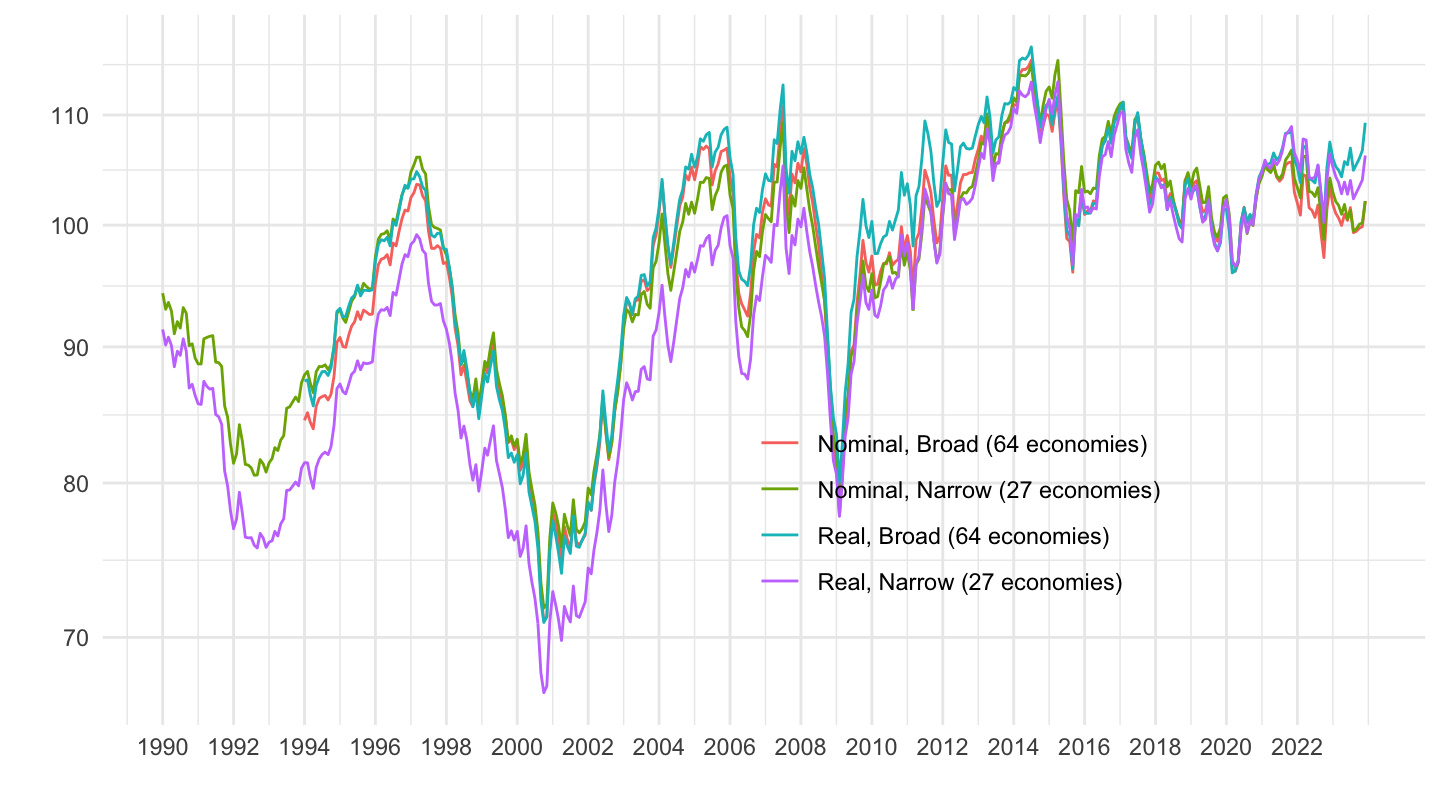
2000
Code
EER %>%
  filter(iso3c %in% c("NZL"),
         date >= as.Date("2000-01-01")) %>%
  mutate(variable = paste0(Type, ", ", Basket)) %>%
  ggplot(.) + geom_line(aes(x = date, y = value, color = variable)) +
  theme_minimal() + xlab("") + ylab("") +

  scale_x_date(breaks = seq(1940, 2100, 2) %>% paste0("-01-01") %>% as.Date,
               labels = date_format("%Y")) +
  scale_y_log10(breaks = seq(0, 600, 10),
                labels = dollar_format(accuracy = 1, prefix = "")) +
  theme(legend.position = c(0.8, 0.3),
        legend.title = element_blank())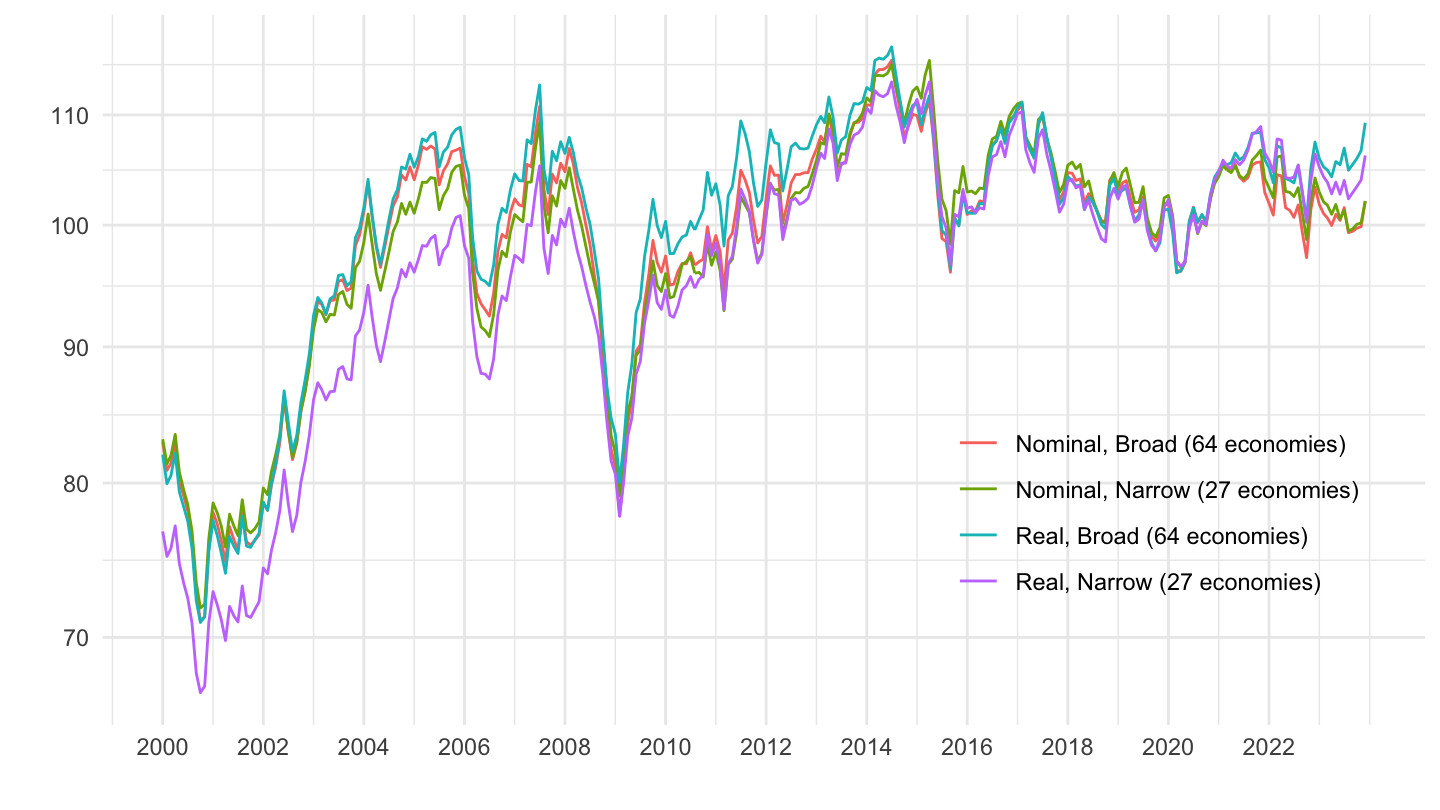
2010
Code
EER %>%
  filter(iso3c %in% c("NZL"),
         date >= as.Date("2010-01-01")) %>%
  mutate(variable = paste0(Type, ", ", Basket)) %>%
  ggplot(.) + geom_line(aes(x = date, y = value, color = variable)) +
  theme_minimal() + xlab("") + ylab("") +

  scale_x_date(breaks = seq(1940, 2100, 1) %>% paste0("-01-01") %>% as.Date,
               labels = date_format("%Y")) +
  scale_y_log10(breaks = seq(0, 600, 10),
                labels = dollar_format(accuracy = 1, prefix = "")) +
  theme(legend.position = c(0.7, 0.85),
        legend.title = element_blank())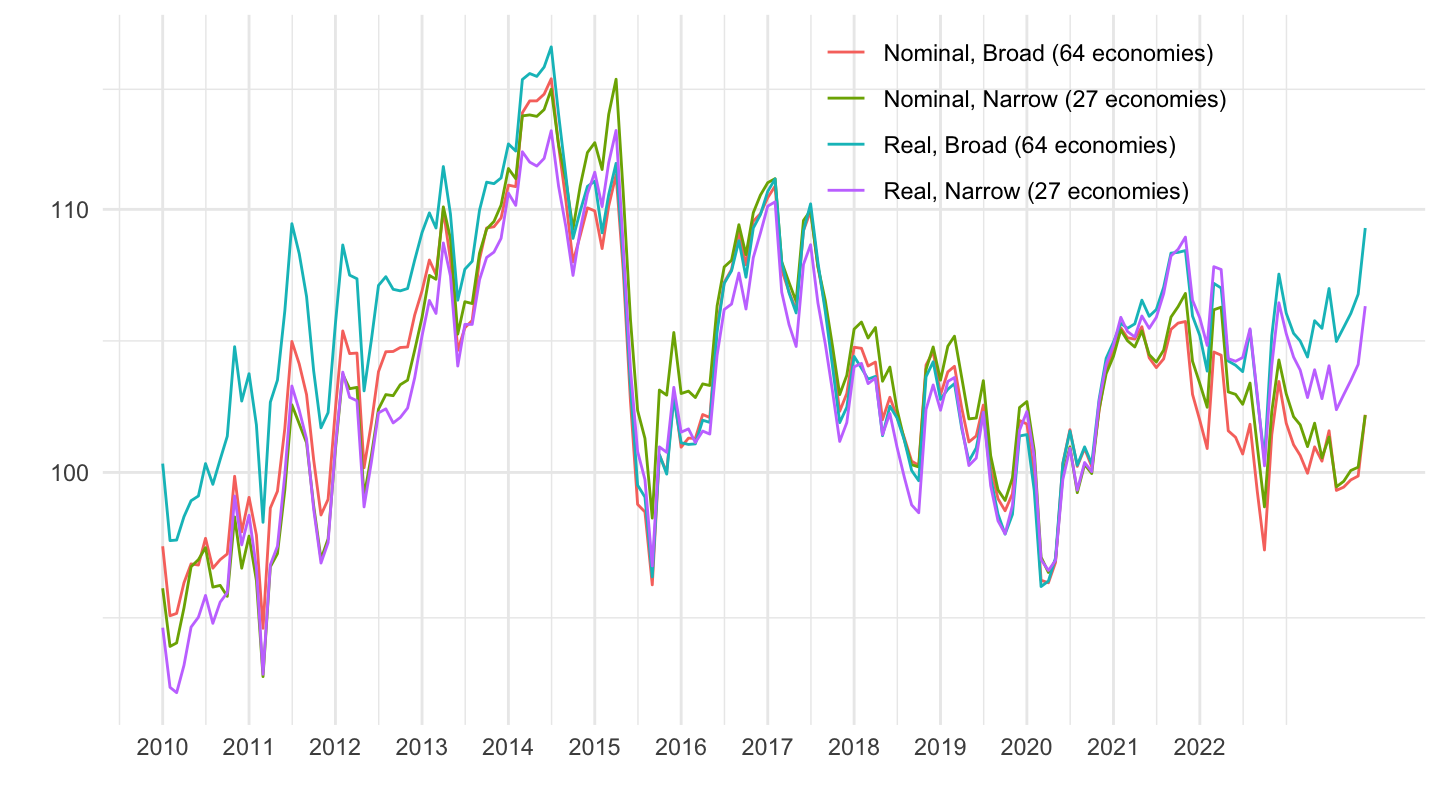
2009-2014
Code
EER %>%
  filter(iso3c %in% c("NZL"),
         date >= as.Date("2009-01-01"),
         date <= as.Date("2014-12-31")) %>%
  mutate(variable = paste0(Type, ", ", Basket)) %>%
  ggplot(.) + geom_line(aes(x = date, y = value, color = variable)) +
  theme_minimal() + xlab("") + ylab("") +

  scale_x_date(breaks = seq(1940, 2100, 1) %>% paste0("-01-01") %>% as.Date,
               labels = date_format("%Y")) +
  scale_y_log10(breaks = seq(0, 600, 5),
                labels = dollar_format(accuracy = 1, prefix = "")) +
  theme(legend.position = c(0.3, 0.3),
        legend.title = element_blank())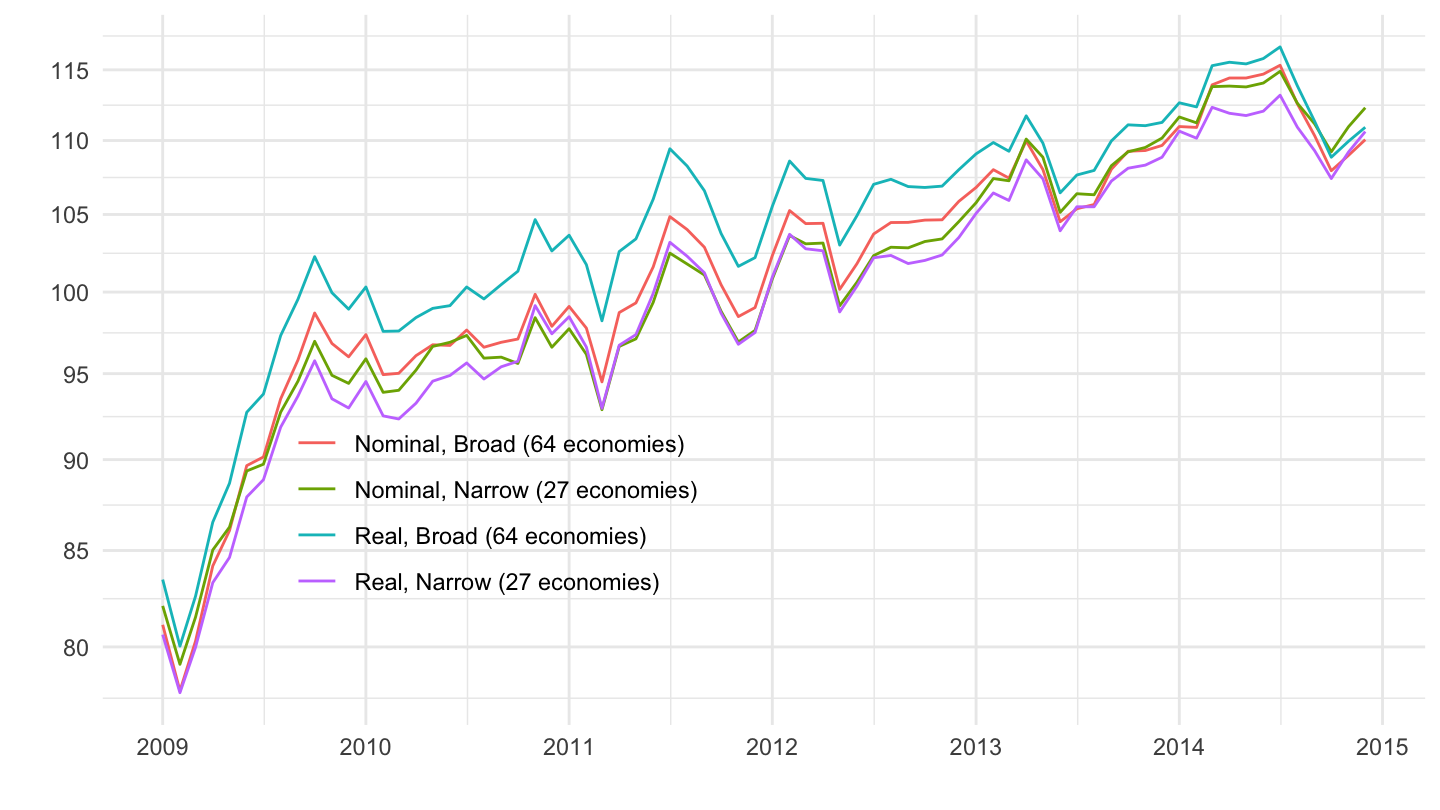
Europe
All
Code
EER %>%
  filter(iso2c %in% c("XM")) %>%
  mutate(variable = paste0(Type, ", ", Basket)) %>%
  ggplot(.) + geom_line(aes(x = date, y = value, color = variable)) +
  theme_minimal() + xlab("") + ylab("") +

  scale_x_date(breaks = seq(1940, 2100, 5) %>% paste0("-01-01") %>% as.Date,
               labels = date_format("%Y")) +
  scale_y_log10(breaks = seq(0, 600, 10),
                labels = dollar_format(accuracy = 1, prefix = "")) +
  theme(legend.position = c(0.2, 0.15),
        legend.title = element_blank())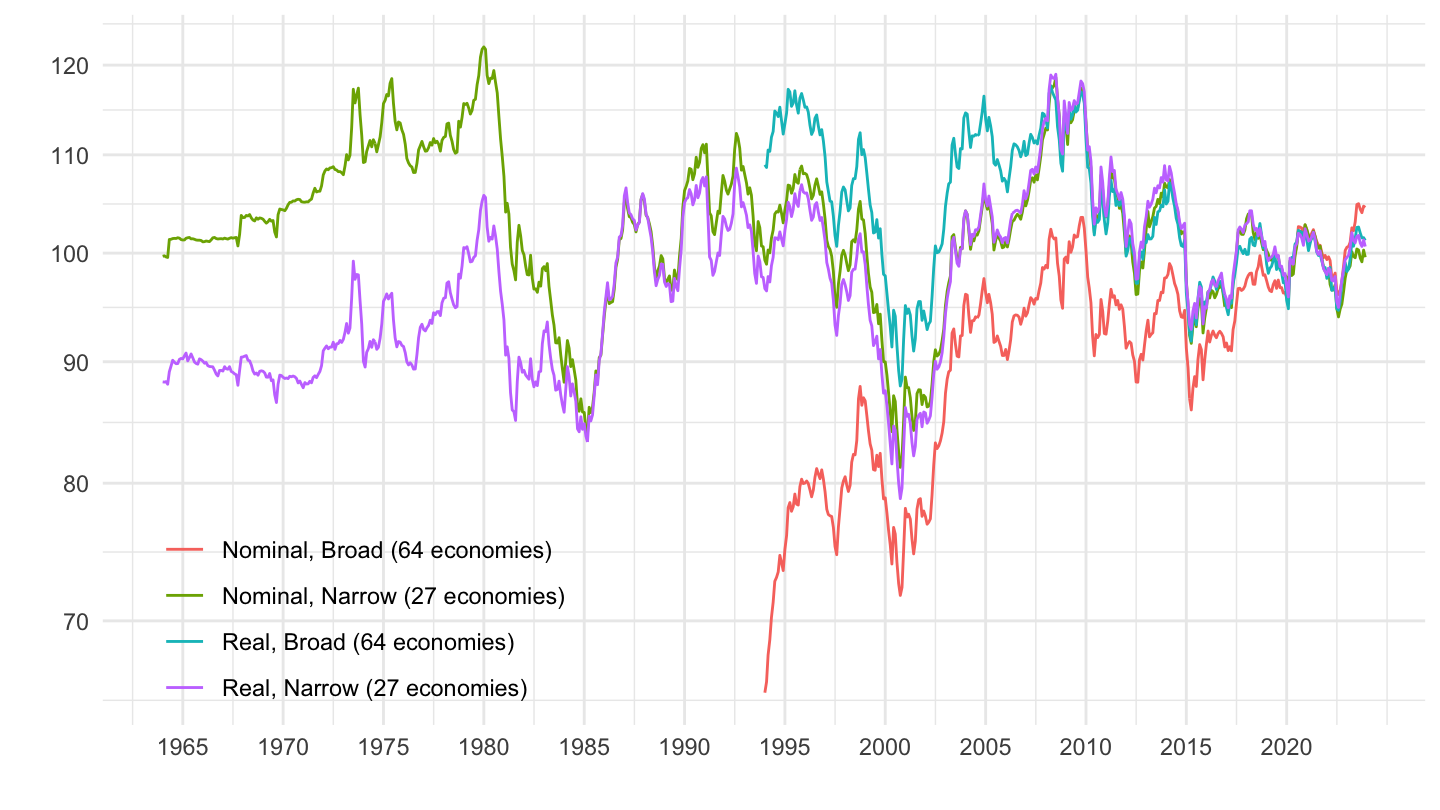
1990
Code
EER %>%
  filter(iso2c %in% c("XM"),
         date >= as.Date("1990-01-01")) %>%
  mutate(variable = paste0(Type, ", ", Basket)) %>%
  ggplot(.) + geom_line(aes(x = date, y = value, color = variable)) +
  theme_minimal() + xlab("") + ylab("") +

  scale_x_date(breaks = seq(1940, 2100, 5) %>% paste0("-01-01") %>% as.Date,
               labels = date_format("%Y")) +
  scale_y_log10(breaks = seq(0, 600, 10),
                labels = dollar_format(accuracy = 1, prefix = "")) +
  theme(legend.position = c(0.7, 0.2),
        legend.title = element_blank())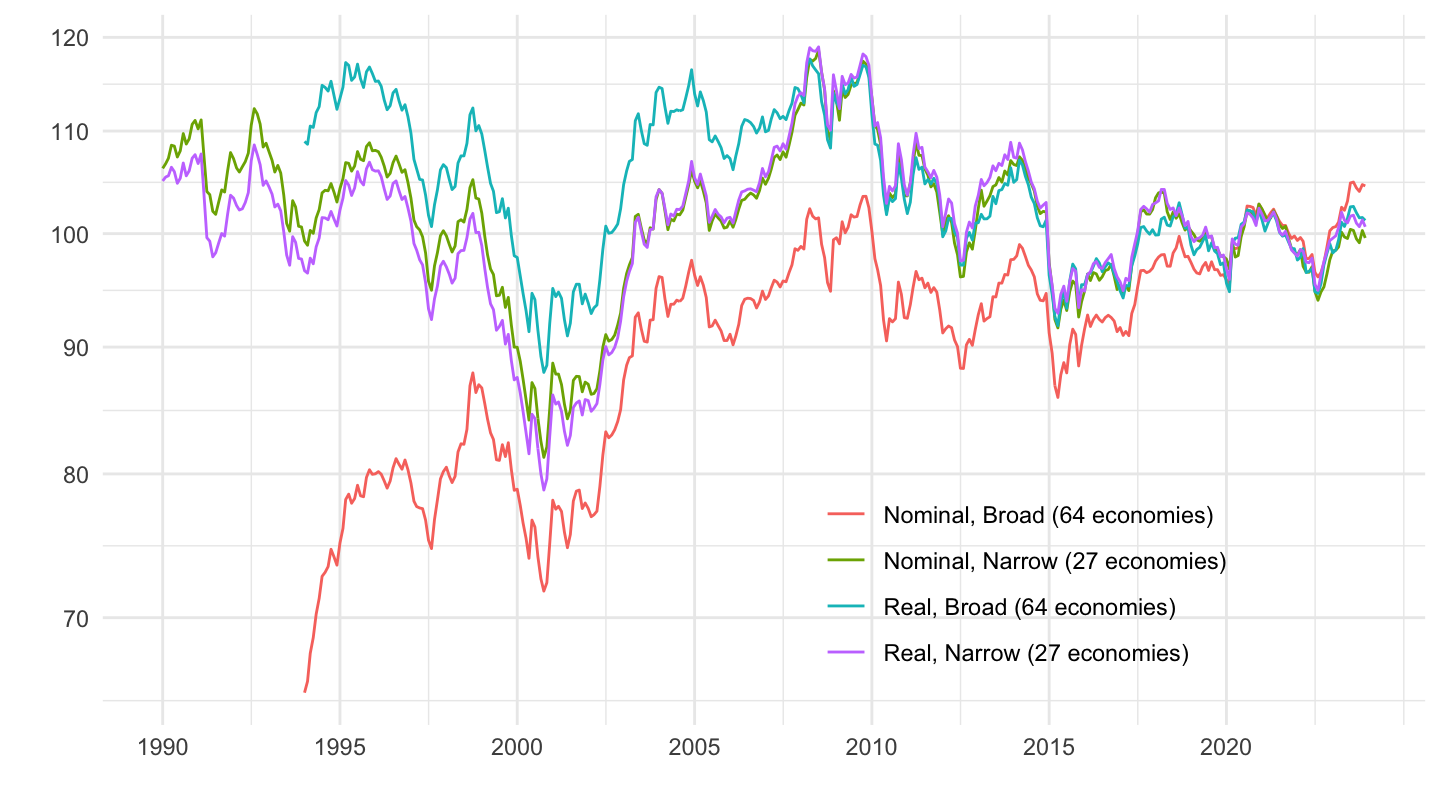
2000
Code
EER %>%
  filter(iso2c %in% c("XM"),
         date >= as.Date("2000-01-01")) %>%
  mutate(variable = paste0(Type, ", ", Basket)) %>%
  ggplot(.) + geom_line(aes(x = date, y = value, color = variable)) +
  theme_minimal() + xlab("") + ylab("") +

  scale_x_date(breaks = seq(1940, 2100, 2) %>% paste0("-01-01") %>% as.Date,
               labels = date_format("%Y")) +
  scale_y_log10(breaks = seq(0, 600, 10),
                labels = dollar_format(accuracy = 1, prefix = "")) +
  theme(legend.position = c(0.7, 0.2),
        legend.title = element_blank())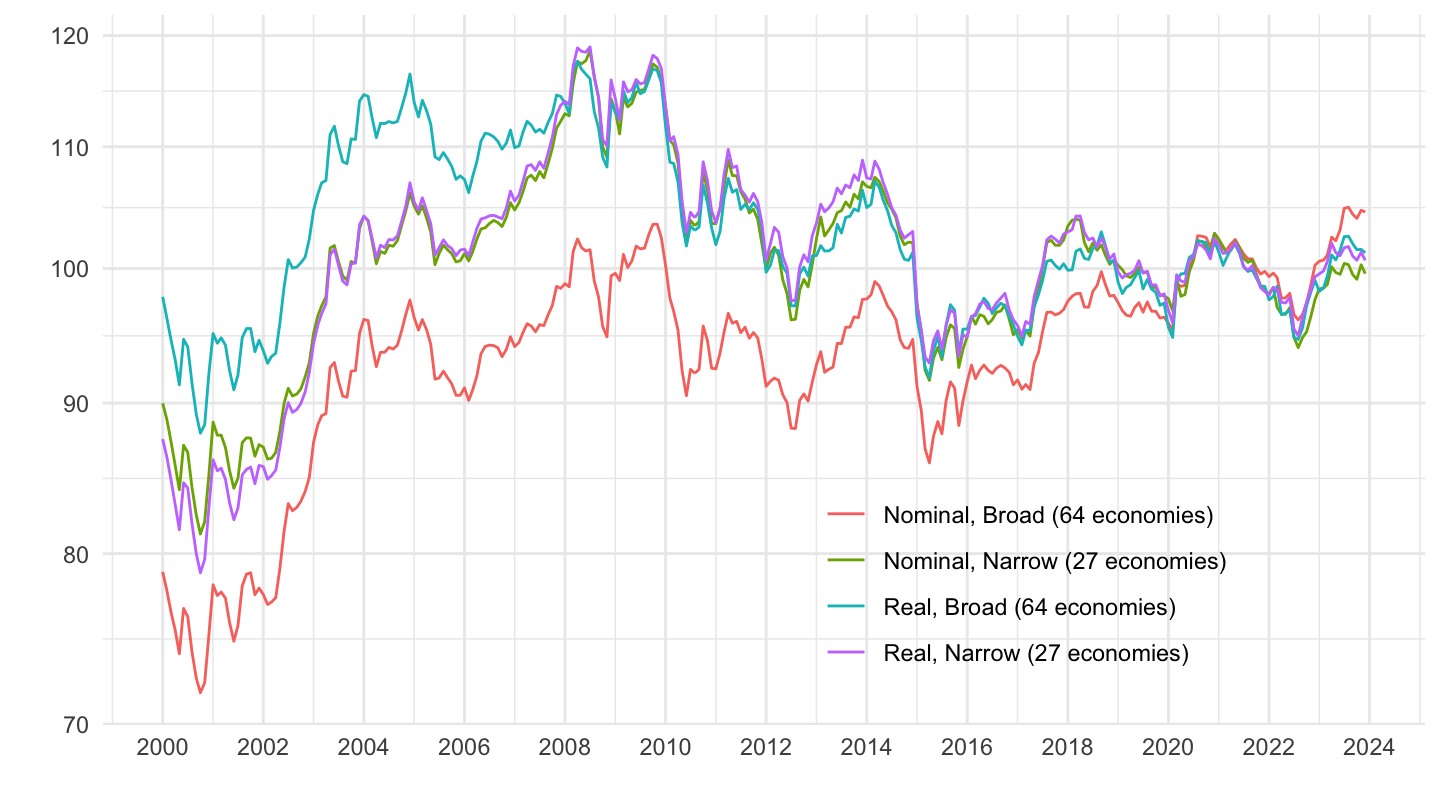
2010
Code
EER %>%
  filter(iso2c %in% c("XM"),
         date >= as.Date("2010-01-01")) %>%
  mutate(variable = paste0(Type, ", ", Basket)) %>%
  ggplot(.) + geom_line(aes(x = date, y = value, color = variable)) +
  theme_minimal() + xlab("") + ylab("Euro BIS Real Exchange Rate") +

  scale_x_date(breaks = seq(1940, 2100, 1) %>% paste0("-01-01") %>% as.Date,
               labels = date_format("%Y")) +
  scale_y_log10(breaks = seq(0, 600, 5),
                labels = dollar_format(accuracy = 1, prefix = "")) +
  theme(legend.position = c(0.8, 0.85),
        legend.title = element_blank())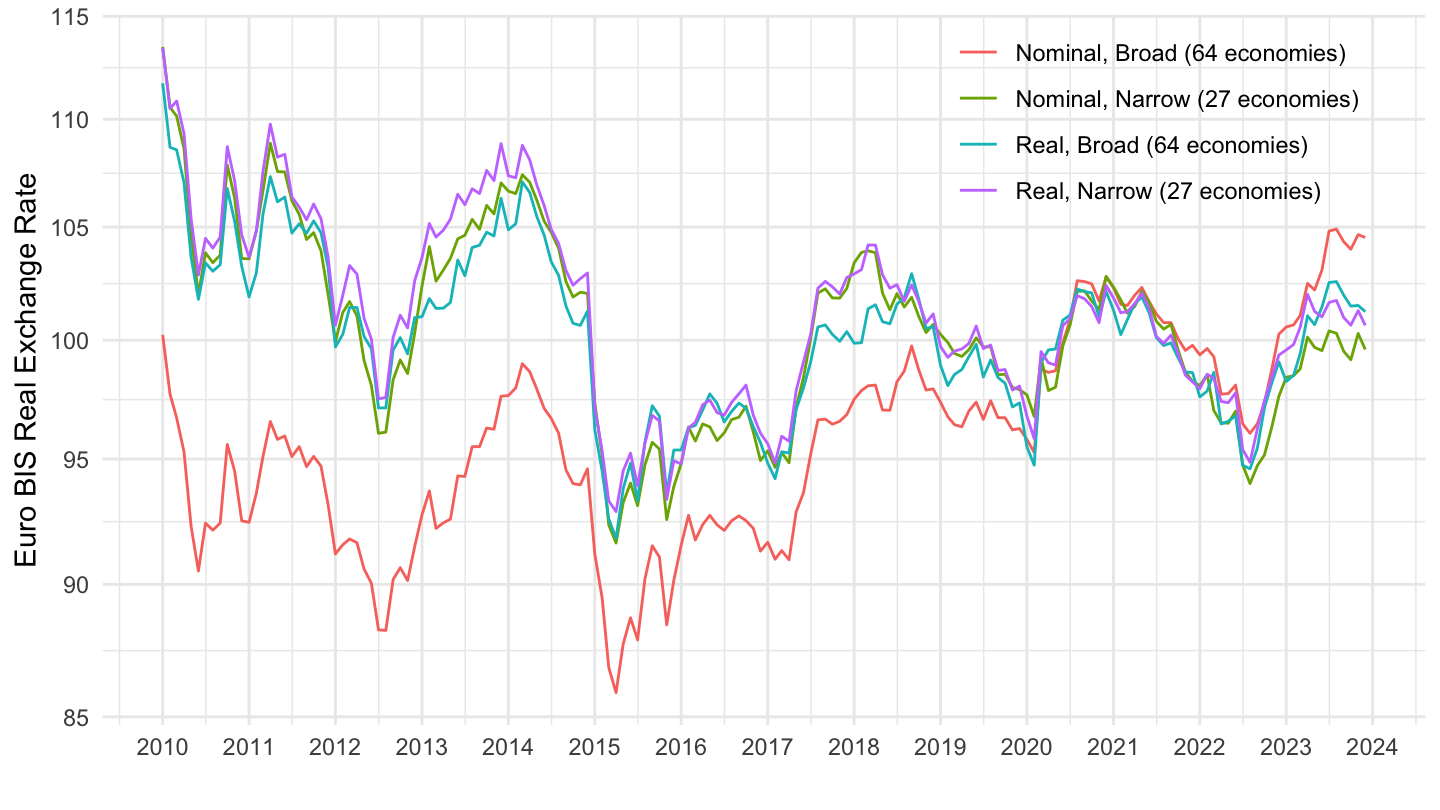
2009-2014
Code
EER %>%
  filter(iso2c %in% c("XM"),
         date >= as.Date("2009-01-01"),
         date <= as.Date("2014-12-31")) %>%
  mutate(variable = paste0(Type, ", ", Basket)) %>%
  ggplot(.) + geom_line(aes(x = date, y = value, color = variable)) +
  theme_minimal() + xlab("") + ylab("") +

  scale_x_date(breaks = seq(1940, 2100, 1) %>% paste0("-01-01") %>% as.Date,
               labels = date_format("%Y")) +
  scale_y_log10(breaks = seq(0, 600, 5),
                labels = dollar_format(accuracy = 1, prefix = "")) +
  theme(legend.position = c(0.6, 0.8),
        legend.title = element_blank())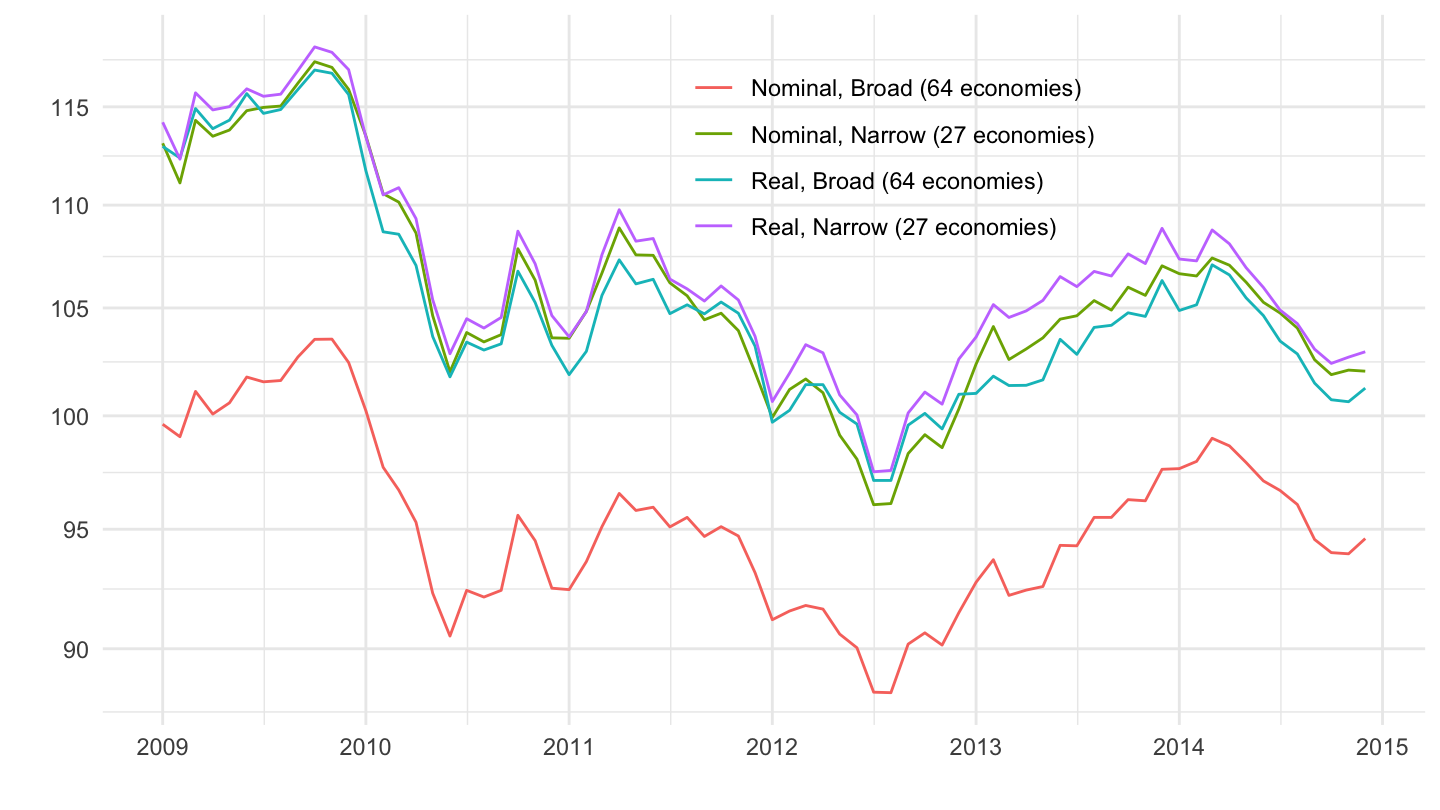
2017-
Code
EER %>%
  filter(iso2c %in% c("XM"),
         date >= as.Date("2017-01-01")) %>%
  mutate(variable = paste0(Type, ", ", Basket)) %>%
  ggplot(.) + geom_line(aes(x = date, y = value, color = variable)) +
  theme_minimal() + xlab("") + ylab("") +

  scale_x_date(breaks = seq(1940, 2100, 1) %>% paste0("-01-01") %>% as.Date,
               labels = date_format("%Y")) +
  scale_y_log10(breaks = seq(0, 600, 5),
                labels = dollar_format(accuracy = 1, prefix = "")) +
  theme(legend.position = c(0.6, 0.8),
        legend.title = element_blank())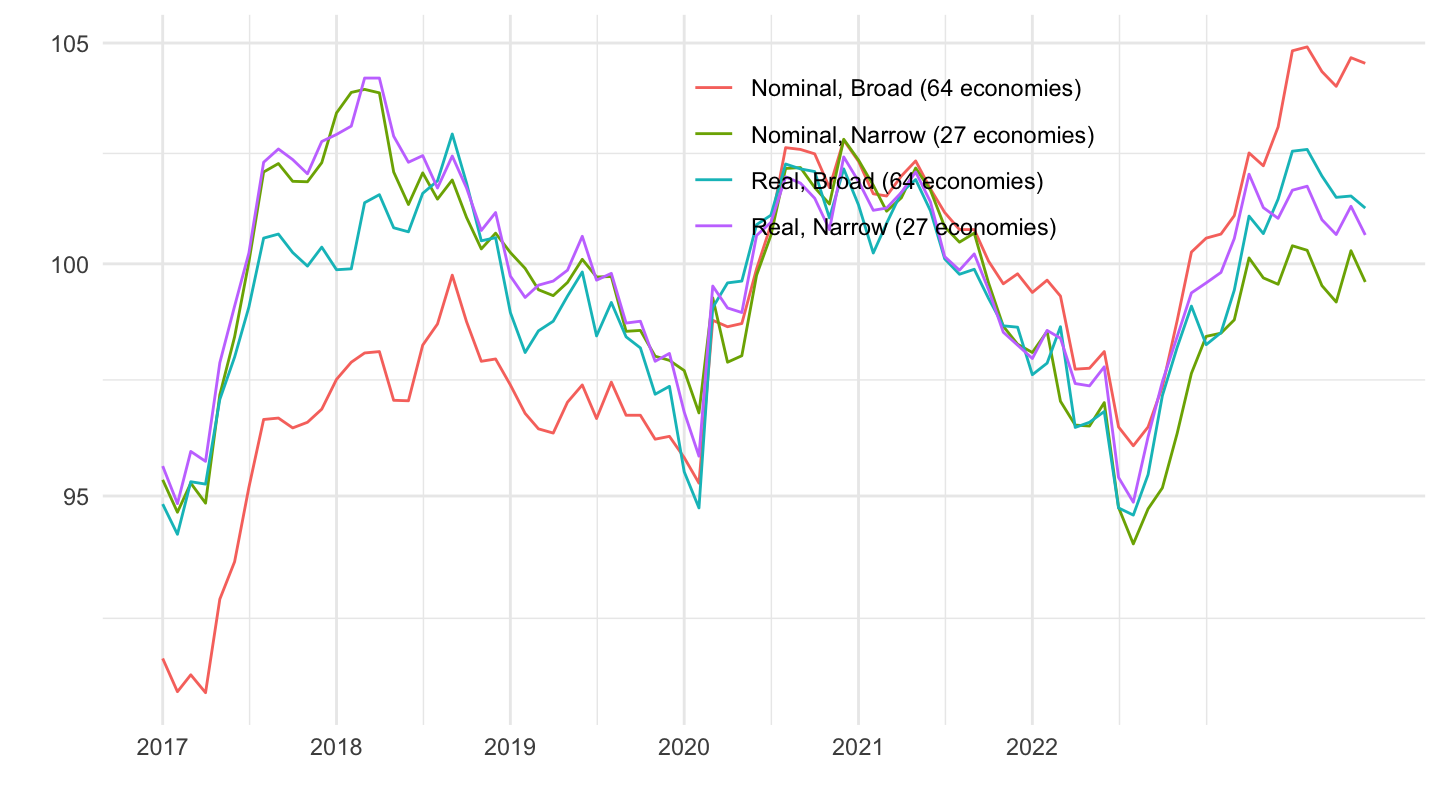
Israel
All
Code
EER %>%
  filter(iso3c %in% c("ISR")) %>%
  mutate(variable = paste0(Type, ", ", Basket)) %>%
  ggplot(.) + geom_line(aes(x = date, y = value, color = variable)) +
  theme_minimal() + xlab("") + ylab("Exchange Rate ($? = National Currency)") +
  scale_color_manual(values = viridis(3)[1:2]) +
  scale_x_date(breaks = seq(1940, 2100, 5) %>% paste0("-01-01") %>% as.Date,
               labels = date_format("%Y")) +
  scale_y_log10(breaks = seq(0, 600, 10),
                labels = dollar_format(accuracy = 1, prefix = "")) +
  theme(legend.position = c(0.3, 0.90),
        legend.title = element_blank())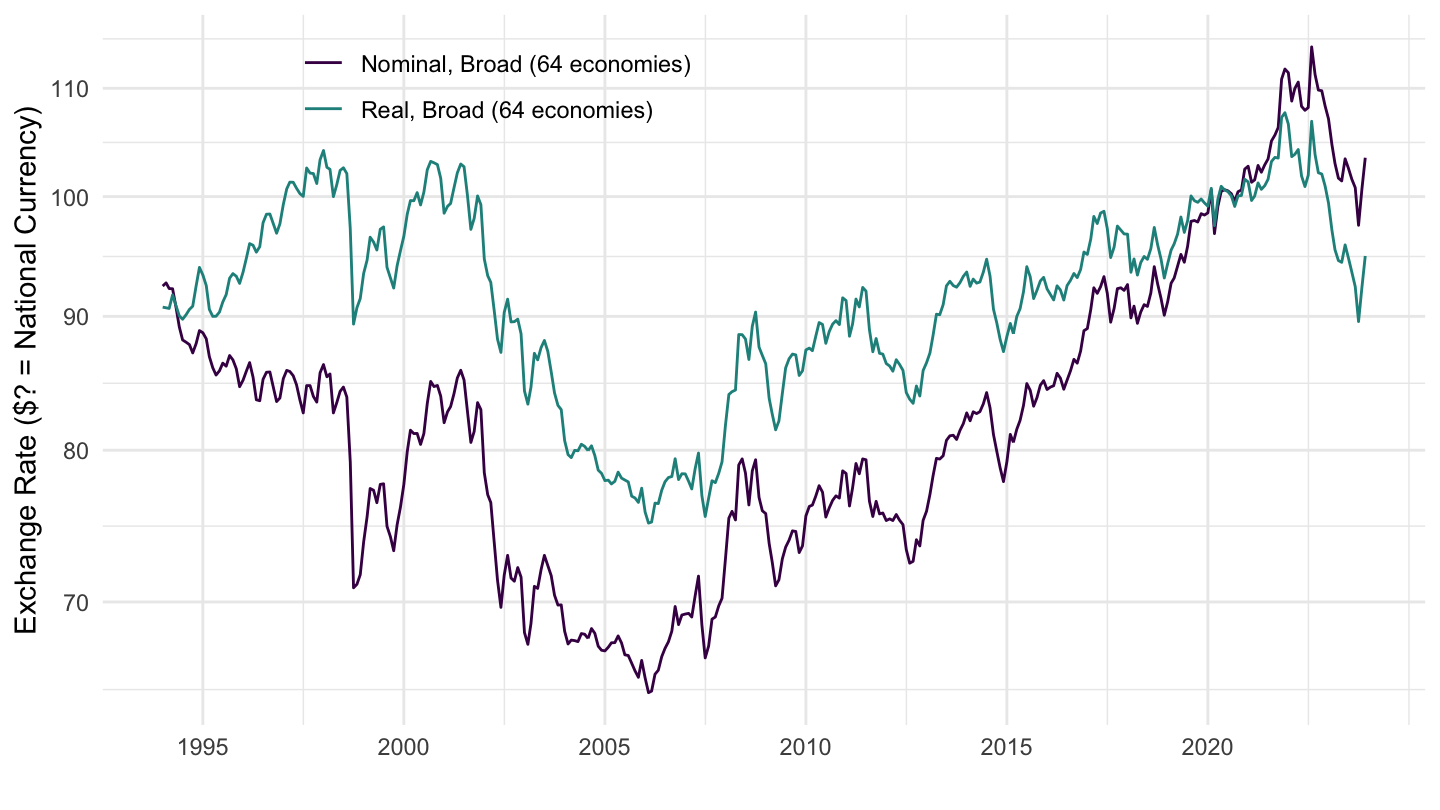
1990
Code
EER %>%
  filter(iso3c %in% c("ISR"),
         date >= as.Date("1990-01-01")) %>%
  mutate(variable = paste0(Type, ", ", Basket)) %>%
  ggplot(.) + geom_line(aes(x = date, y = value, color = variable)) +
  theme_minimal() + xlab("") + ylab("") +
  scale_color_manual(values = viridis(3)[1:2]) +
  scale_x_date(breaks = seq(1940, 2100, 5) %>% paste0("-01-01") %>% as.Date,
               labels = date_format("%Y")) +
  scale_y_log10(breaks = seq(0, 600, 10),
                labels = dollar_format(accuracy = 1, prefix = "")) +
  theme(legend.position = c(0.65, 0.8),
        legend.title = element_blank())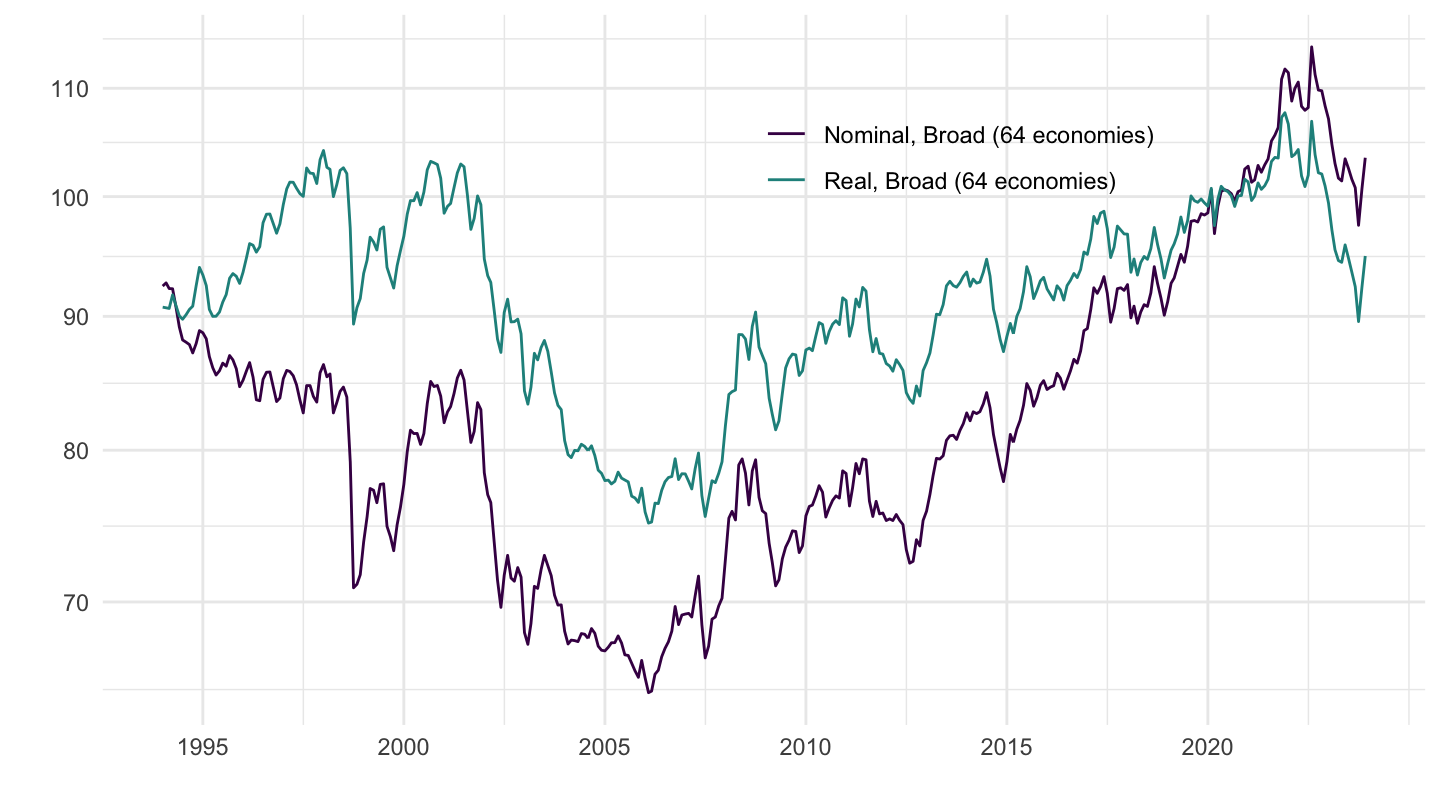
2000
Code
EER %>%
  filter(iso3c %in% c("ISR"),
         date >= as.Date("2000-01-01")) %>%
  mutate(variable = paste0(Type, ", ", Basket)) %>%
  ggplot(.) + geom_line(aes(x = date, y = value, color = variable)) +
  theme_minimal() + xlab("") + ylab("") +
  scale_color_manual(values = viridis(3)[1:2]) +
  scale_x_date(breaks = seq(1940, 2100, 5) %>% paste0("-01-01") %>% as.Date,
               labels = date_format("%Y")) +
  scale_y_log10(breaks = seq(0, 600, 10),
                labels = dollar_format(accuracy = 1, prefix = "")) +
  theme(legend.position = c(0.5, 0.8),
        legend.title = element_blank())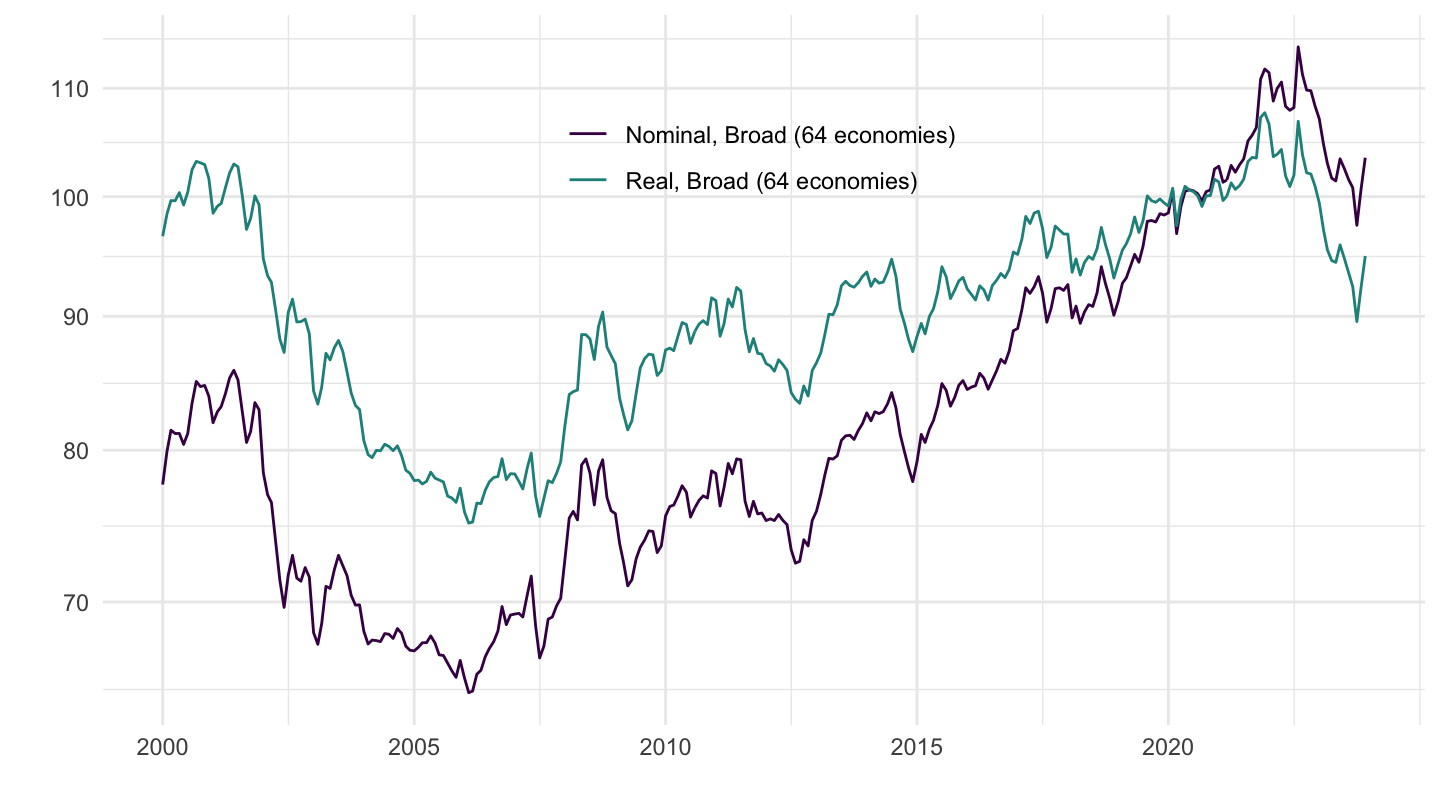
2010
Code
EER %>%
  filter(iso3c %in% c("ISR"),
         date >= as.Date("2010-01-01")) %>%
  mutate(variable = paste0(Type, ", ", Basket)) %>%
  ggplot(.) + geom_line(aes(x = date, y = value, color = variable)) +
  theme_minimal() + xlab("") + ylab("") +
  scale_color_manual(values = viridis(3)[1:2]) +
  scale_x_date(breaks = seq(1940, 2100, 1) %>% paste0("-01-01") %>% as.Date,
               labels = date_format("%Y")) +
  scale_y_log10(breaks = seq(0, 600, 10),
                labels = dollar_format(accuracy = 1, prefix = "")) +
  theme(legend.position = c(0.2, 0.9),
        legend.title = element_blank())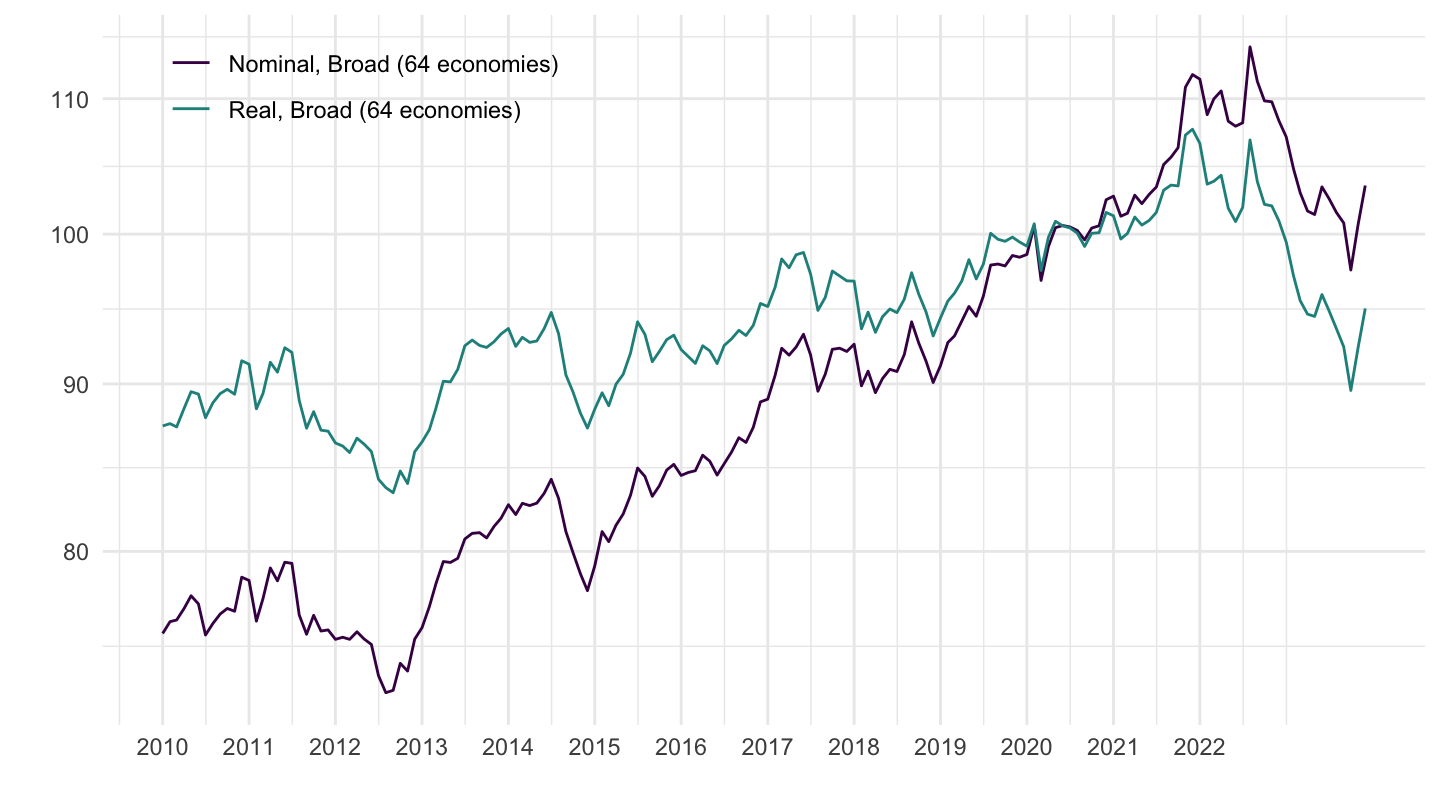
2009-2014
Code
EER %>%
  filter(iso3c %in% c("ISR"),
         date >= as.Date("2009-01-01"),
         date <= as.Date("2014-12-31")) %>%
  mutate(variable = paste0(Type, ", ", Basket)) %>%
  ggplot(.) + geom_line(aes(x = date, y = value, color = variable)) +
  theme_minimal() + xlab("") + ylab("") +
  scale_color_manual(values = viridis(3)[1:2]) +
  scale_x_date(breaks = seq(1940, 2100, 1) %>% paste0("-01-01") %>% as.Date,
               labels = date_format("%Y")) +
  scale_y_log10(breaks = seq(0, 600, 5),
                labels = dollar_format(accuracy = 1, prefix = "")) +
  theme(legend.position = c(0.2, 0.9),
        legend.title = element_blank())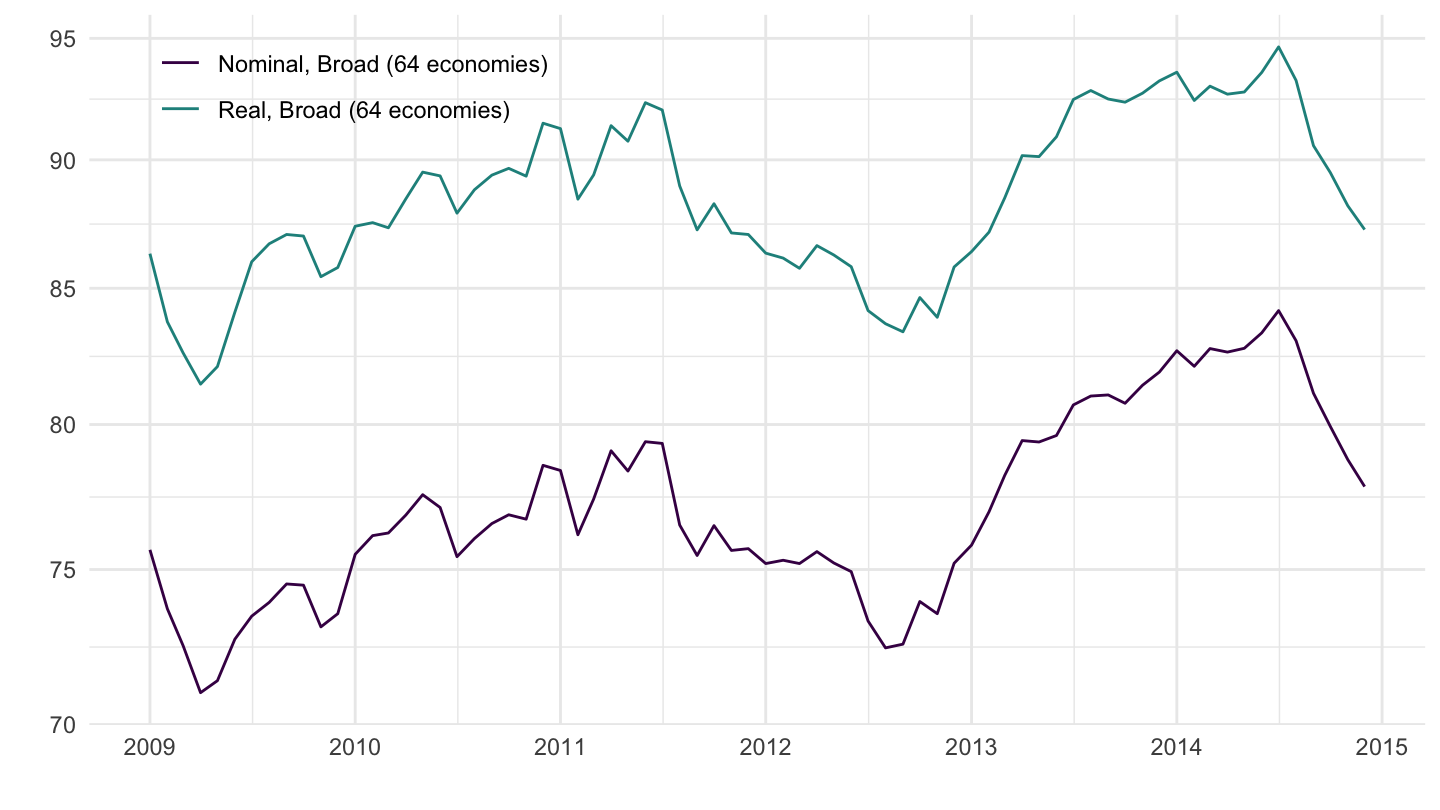
Australia
All
Code
EER %>%
  filter(iso3c %in% c("AUS")) %>%
  mutate(variable = paste0(Type, ", ", Basket)) %>%
  ggplot(.) + geom_line(aes(x = date, y = value, color = variable)) +
  theme_minimal() + xlab("") + ylab("Exchange Rate ($? = National Currency)") +

  scale_x_date(breaks = seq(1940, 2100, 5) %>% paste0("-01-01") %>% as.Date,
               labels = date_format("%Y")) +
  scale_y_log10(breaks = seq(0, 600, 10),
                labels = dollar_format(accuracy = 1, prefix = "")) +
  theme(legend.position = c(0.7, 0.8),
        legend.title = element_blank())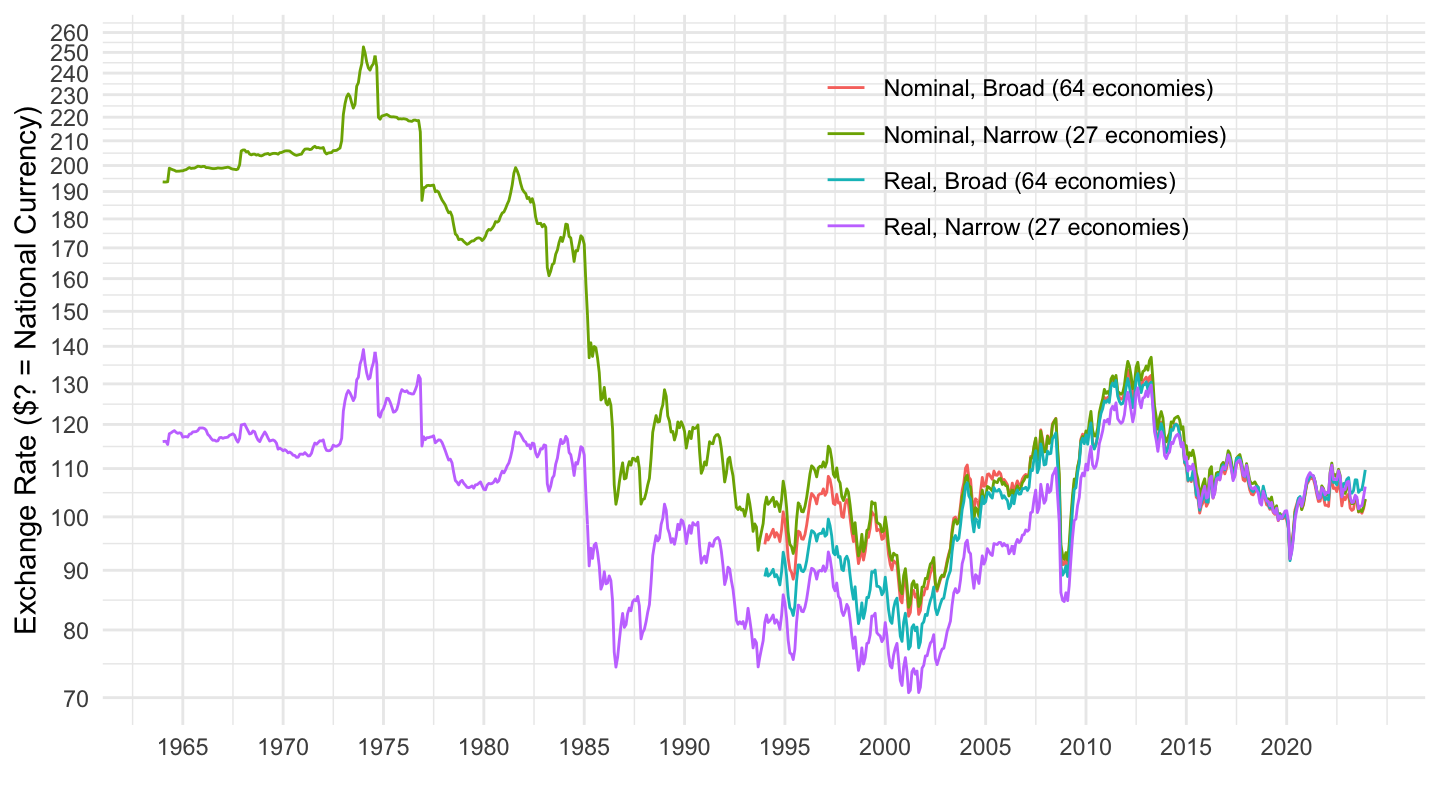
1990
Code
EER %>%
  filter(iso3c %in% c("AUS"),
         date >= as.Date("1990-01-01")) %>%
  mutate(variable = paste0(Type, ", ", Basket)) %>%
  ggplot(.) + geom_line(aes(x = date, y = value, color = variable)) +
  theme_minimal() + xlab("") + ylab("") +

  scale_x_date(breaks = seq(1940, 2100, 2) %>% paste0("-01-01") %>% as.Date,
               labels = date_format("%Y")) +
  scale_y_log10(breaks = seq(0, 600, 10),
                labels = dollar_format(accuracy = 1, prefix = "")) +
  theme(legend.position = c(0.25, 0.85),
        legend.title = element_blank())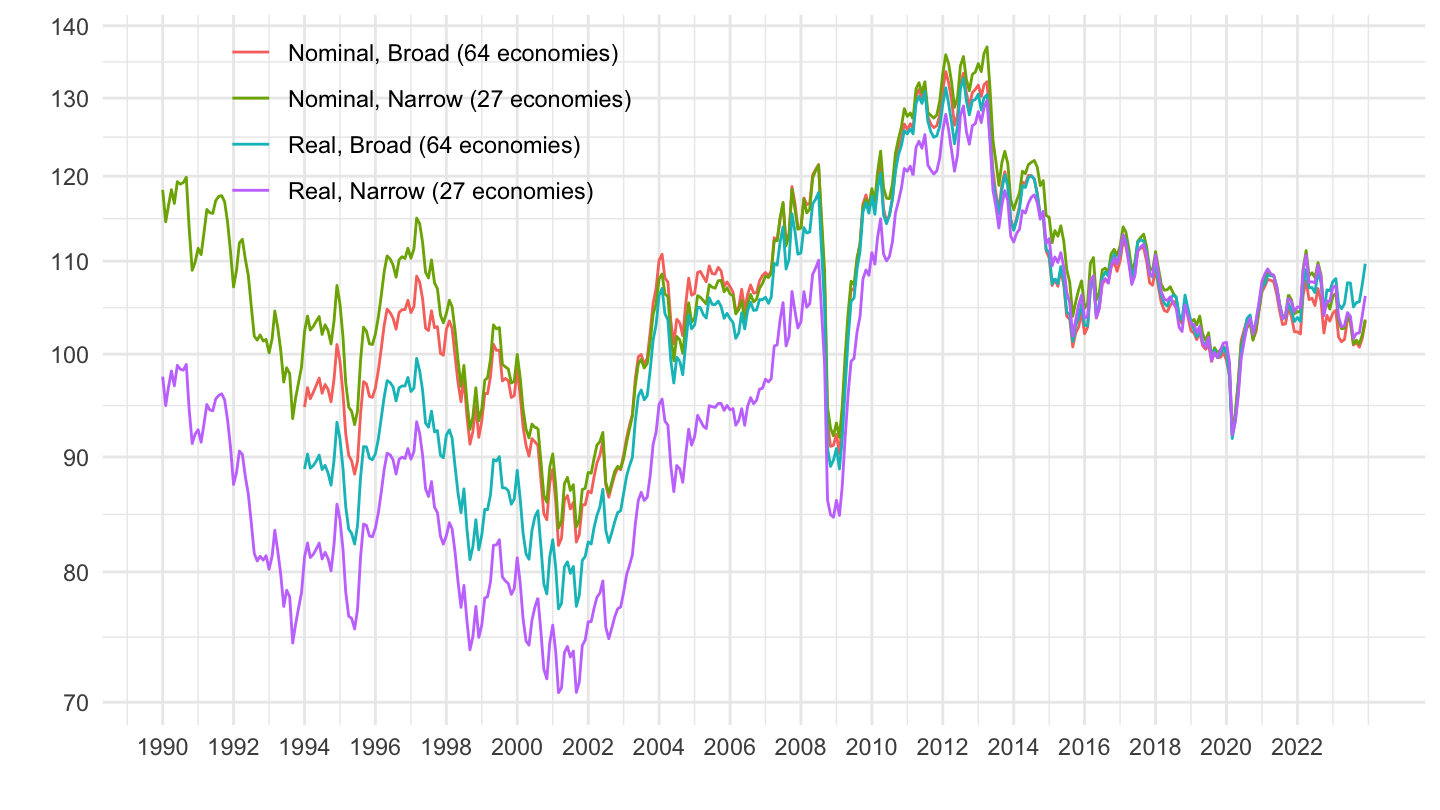
2000
Code
EER %>%
  filter(iso3c %in% c("AUS"),
         date >= as.Date("2000-01-01")) %>%
  mutate(variable = paste0(Type, ", ", Basket)) %>%
  ggplot(.) + geom_line(aes(x = date, y = value, color = variable)) +
  theme_minimal() + xlab("") + ylab("") +

  scale_x_date(breaks = seq(1940, 2100, 2) %>% paste0("-01-01") %>% as.Date,
               labels = date_format("%Y")) +
  scale_y_log10(breaks = seq(0, 600, 10),
                labels = dollar_format(accuracy = 1, prefix = "")) +
  theme(legend.position = c(0.8, 0.2),
        legend.title = element_blank())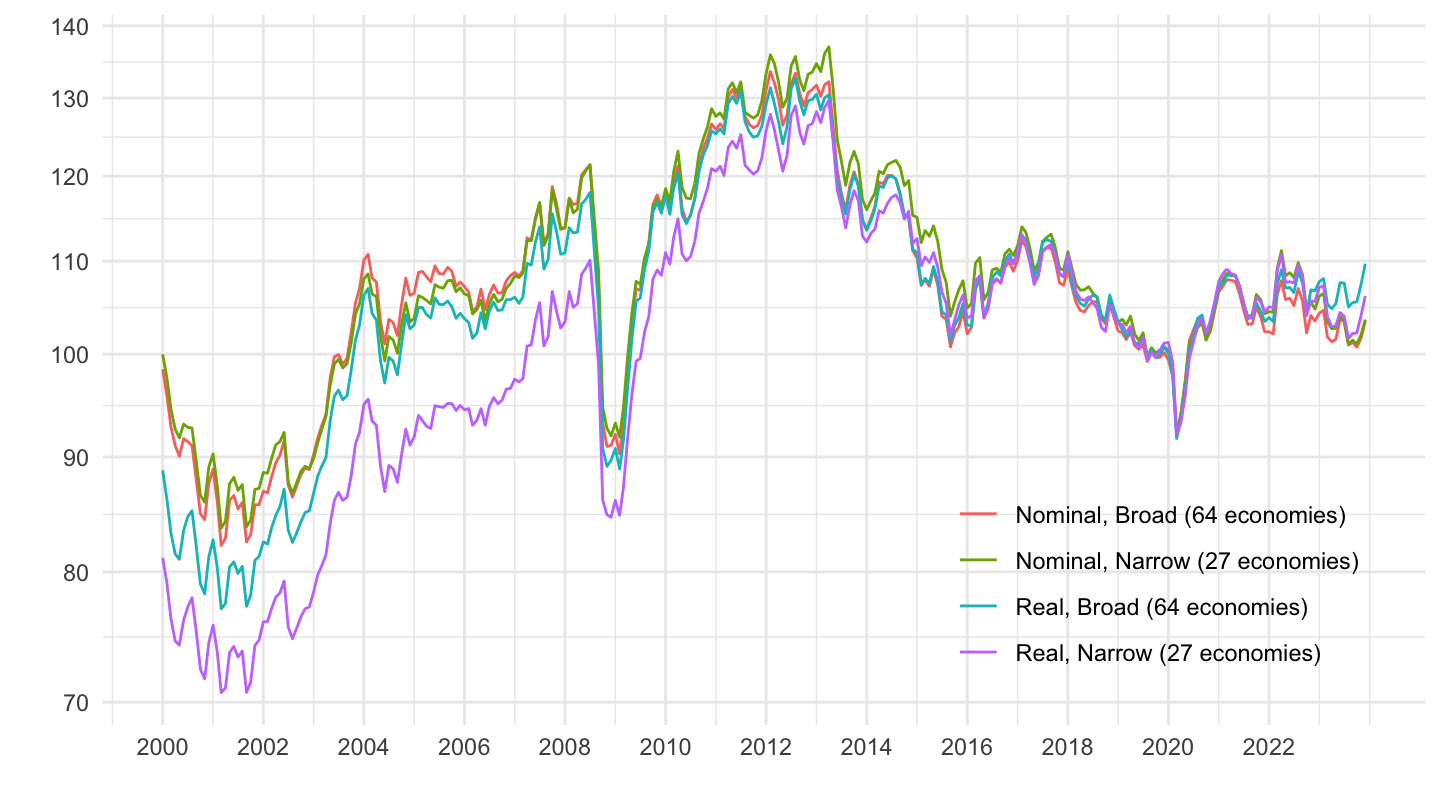
2010
Code
EER %>%
  filter(iso3c %in% c("AUS"),
         date >= as.Date("2010-01-01")) %>%
  mutate(variable = paste0(Type, ", ", Basket)) %>%
  ggplot(.) + geom_line(aes(x = date, y = value, color = variable)) +
  theme_minimal() + xlab("") + ylab("") +

  scale_x_date(breaks = seq(1940, 2100, 1) %>% paste0("-01-01") %>% as.Date,
               labels = date_format("%Y")) +
  scale_y_log10(breaks = seq(0, 600, 10),
                labels = dollar_format(accuracy = 1, prefix = "")) +
  theme(legend.position = c(0.7, 0.85),
        legend.title = element_blank())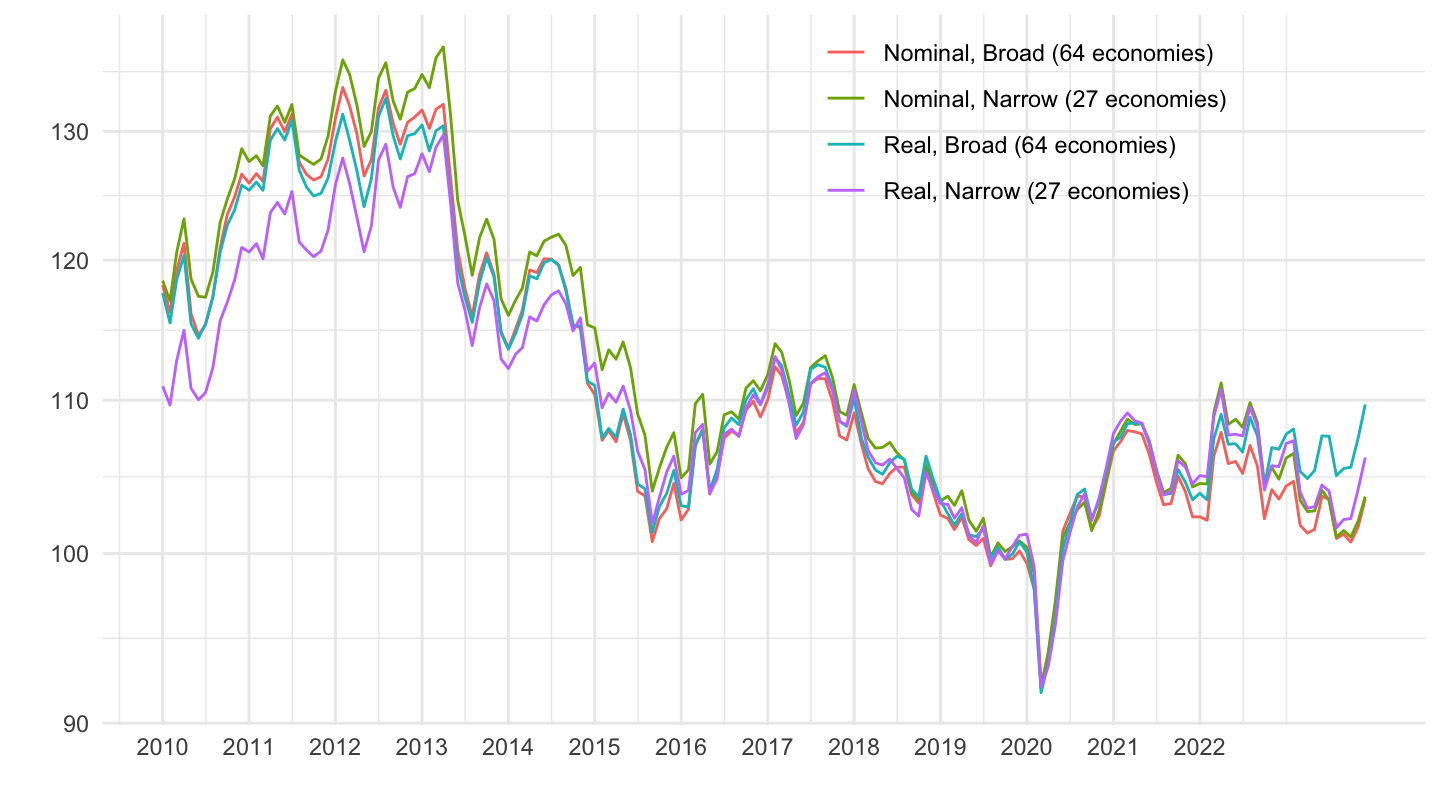
Switzerland
All
Code
EER %>%
  filter(iso3c %in% c("CHE")) %>%
  mutate(variable = paste0(Type, ", ", Basket)) %>%
  ggplot(.) + geom_line(aes(x = date, y = value, color = variable)) +
  theme_minimal() + xlab("") + ylab("") +

  scale_x_date(breaks = seq(1940, 2100, 5) %>% paste0("-01-01") %>% as.Date,
               labels = date_format("%Y")) +
  scale_y_log10(breaks = seq(0, 600, 10),
                labels = dollar_format(accuracy = 1, prefix = "")) +
  theme(legend.position = c(0.8, 0.2),
        legend.title = element_blank())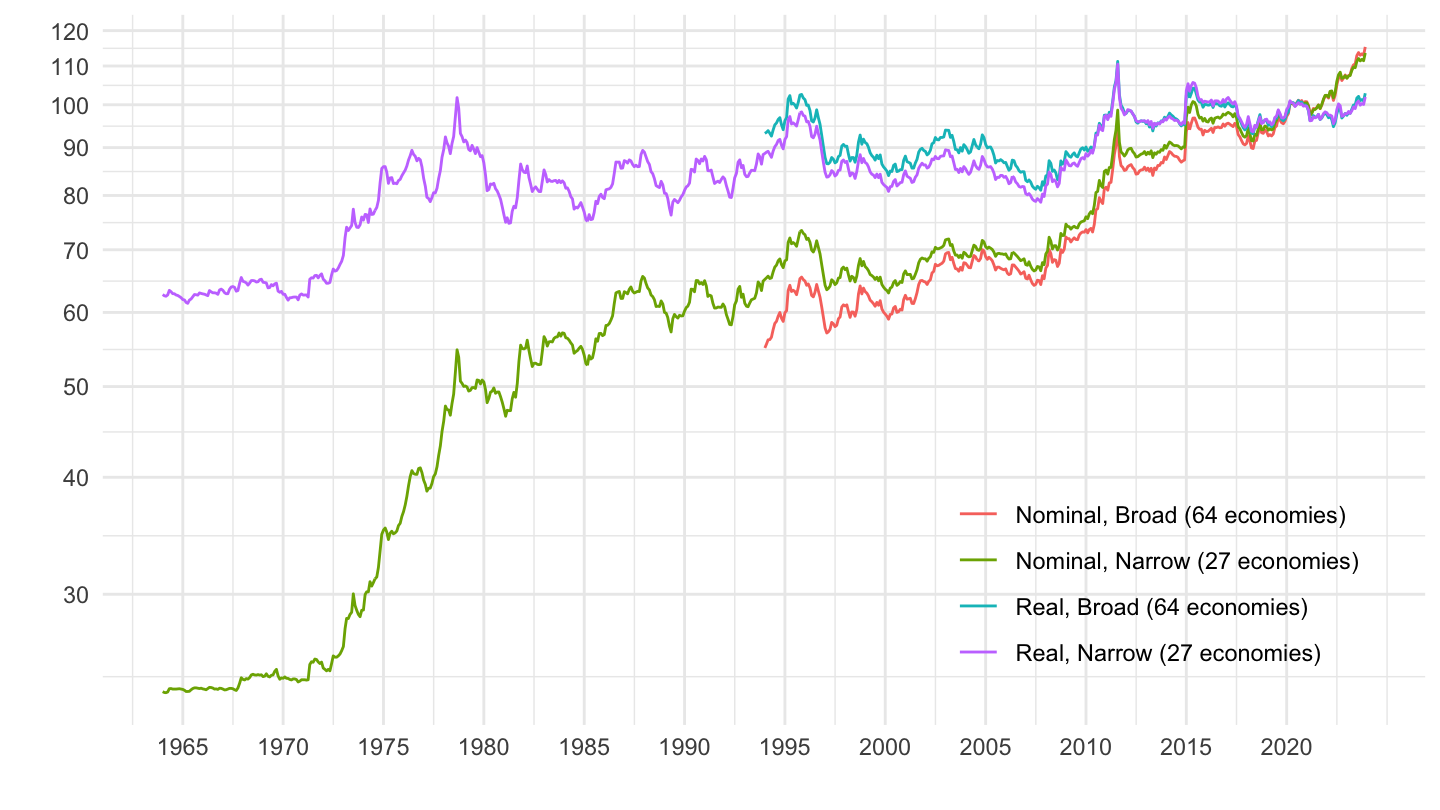
1990-
Code
EER %>%
  filter(iso3c %in% c("CHE"),
         date >= as.Date("1990-01-01")) %>%
  mutate(variable = paste0(Type, ", ", Basket)) %>%
  ggplot(.) + geom_line(aes(x = date, y = value, color = variable)) +
  theme_minimal() + xlab("") + ylab("") +

  scale_x_date(breaks = seq(1940, 2100, 5) %>% paste0("-01-01") %>% as.Date,
               labels = date_format("%Y")) +
  scale_y_log10(breaks = seq(0, 600, 10),
                labels = dollar_format(accuracy = 1, prefix = "")) +
  theme(legend.position = c(0.8, 0.2),
        legend.title = element_blank())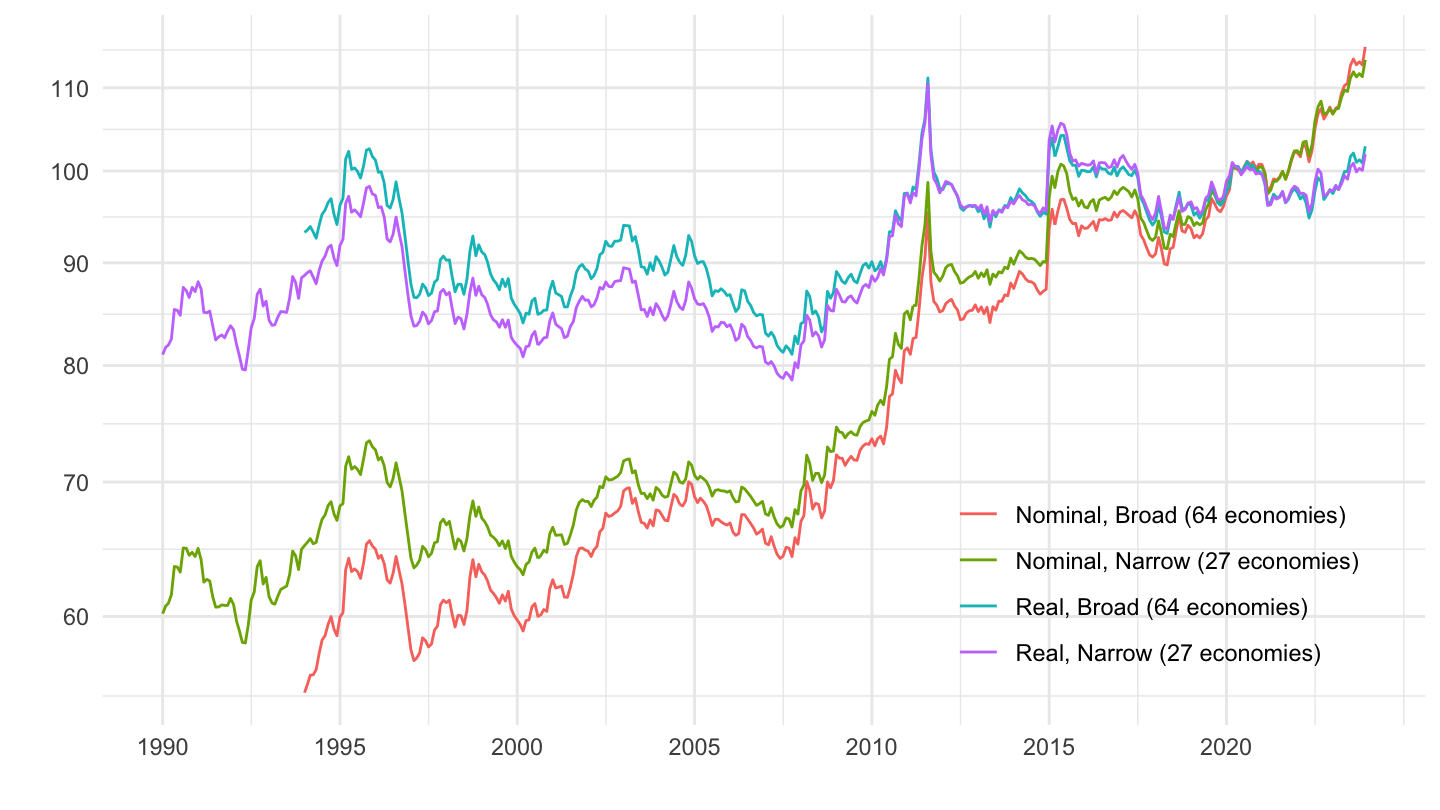
2000-
Code
EER %>%
  filter(iso3c %in% c("CHE"),
         date >= as.Date("2000-01-01")) %>%
  mutate(variable = paste0(Type, ", ", Basket)) %>%
  ggplot(.) + geom_line(aes(x = date, y = value, color = variable)) +
  theme_minimal() + xlab("") + ylab("") +

  scale_x_date(breaks = seq(1940, 2100, 2) %>% paste0("-01-01") %>% as.Date,
               labels = date_format("%Y")) +
  scale_y_log10(breaks = seq(0, 600, 10),
                labels = dollar_format(accuracy = 1, prefix = "")) +
  theme(legend.position = c(0.8, 0.2),
        legend.title = element_blank())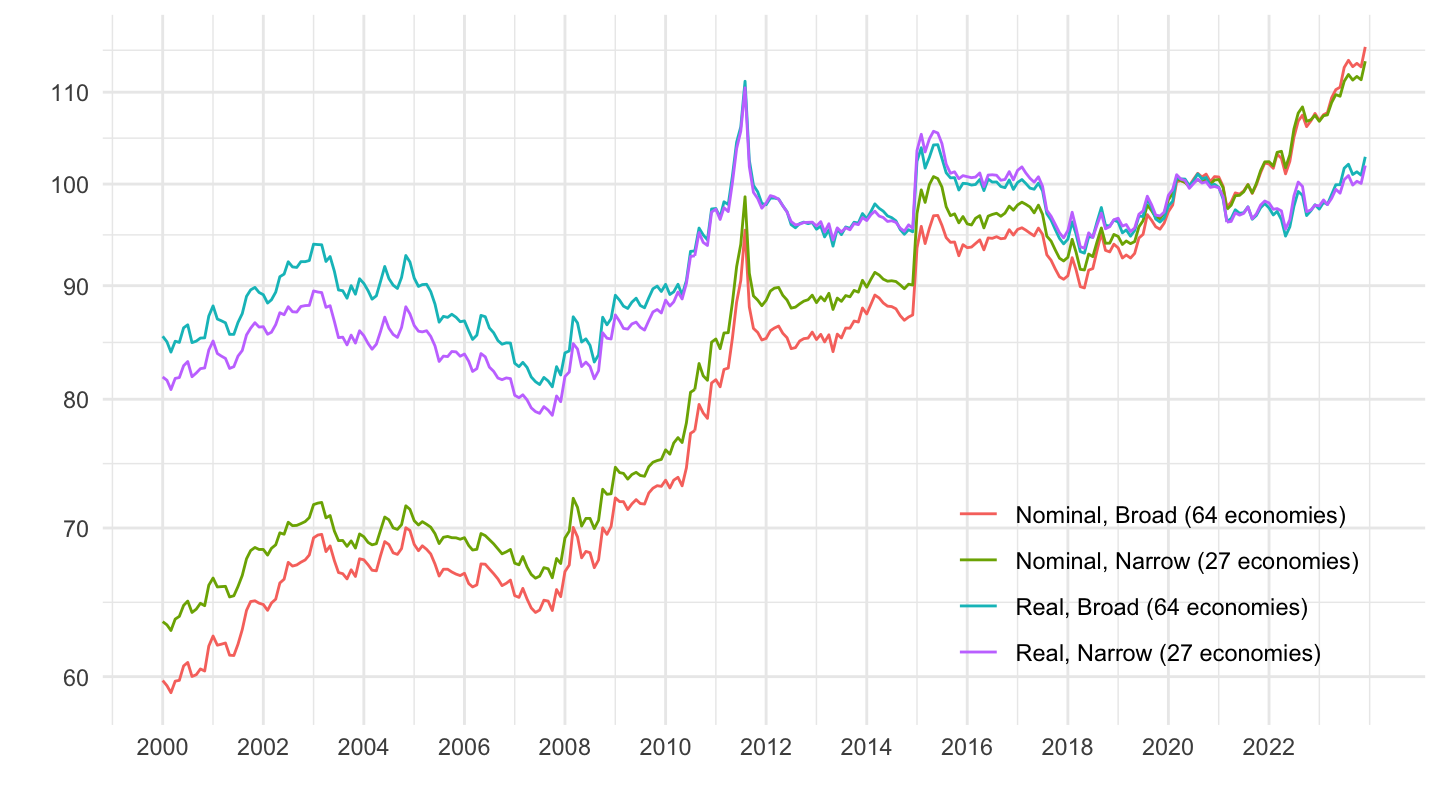
2010-
Code
EER %>%
  filter(iso3c %in% c("CHE"),
         date >= as.Date("2010-01-01")) %>%
  mutate(variable = paste0(Type, ", ", Basket)) %>%
  ggplot(.) + geom_line(aes(x = date, y = value, color = variable)) +
  theme_minimal() + xlab("") + ylab("") +

  scale_x_date(breaks = seq(1940, 2100, 1) %>% paste0("-01-01") %>% as.Date,
               labels = date_format("%Y")) +
  scale_y_log10(breaks = seq(0, 600, 10),
                labels = dollar_format(accuracy = 1, prefix = "")) +
  theme(legend.position = c(0.8, 0.2),
        legend.title = element_blank())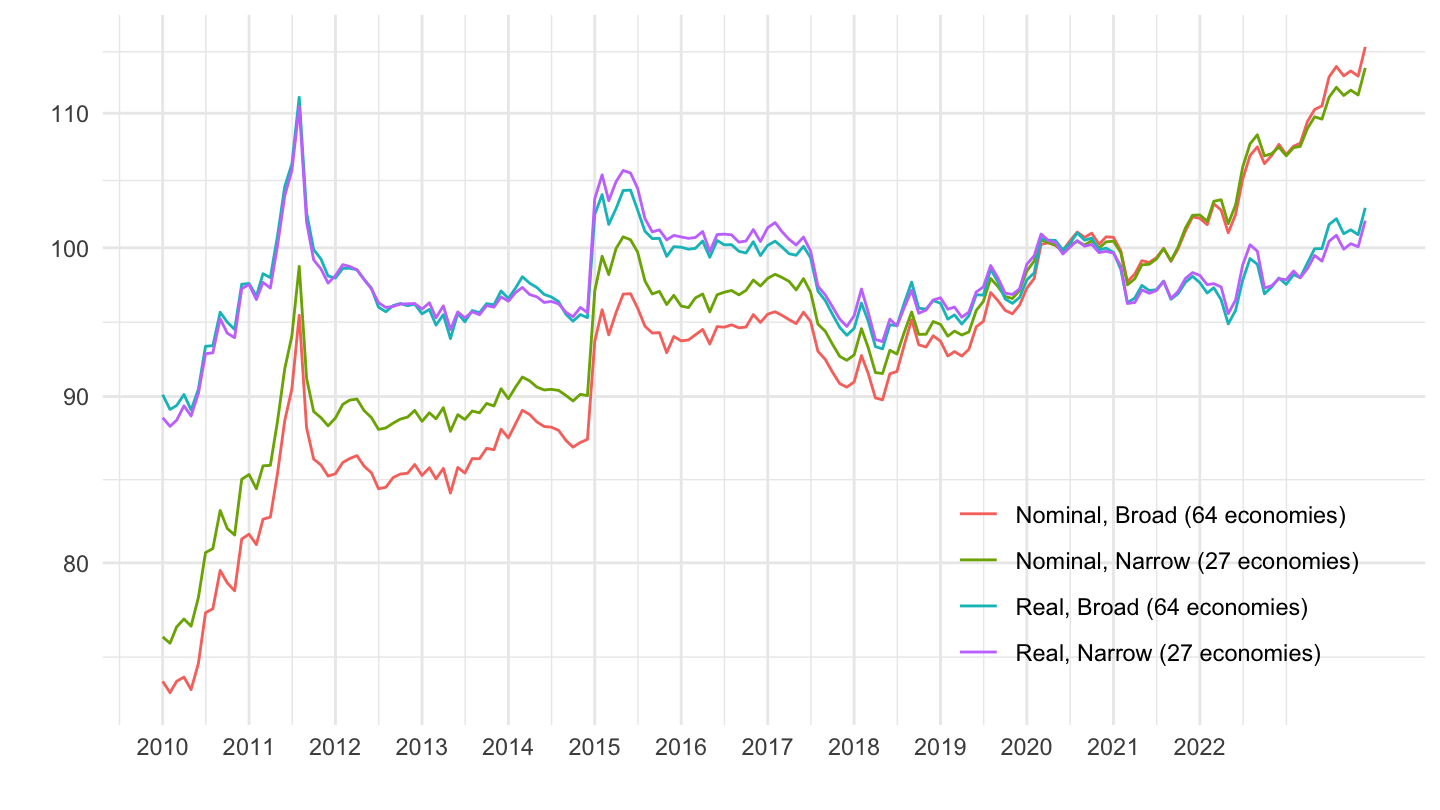
Iceland
All
Code
EER %>%
  filter(iso3c %in% c("ISL")) %>%
  mutate(variable = paste0(Type, ", ", Basket)) %>%
  ggplot(.) + geom_line(aes(x = date, y = value, color = variable)) +
  theme_minimal() + xlab("") + ylab("") +

  scale_x_date(breaks = seq(1940, 2100, 5) %>% paste0("-01-01") %>% as.Date,
               labels = date_format("%Y")) +
  scale_y_log10(breaks = seq(0, 600, 10),
                labels = dollar_format(accuracy = 1, prefix = "")) +
  theme(legend.position = c(0.2, 0.2),
        legend.title = element_blank())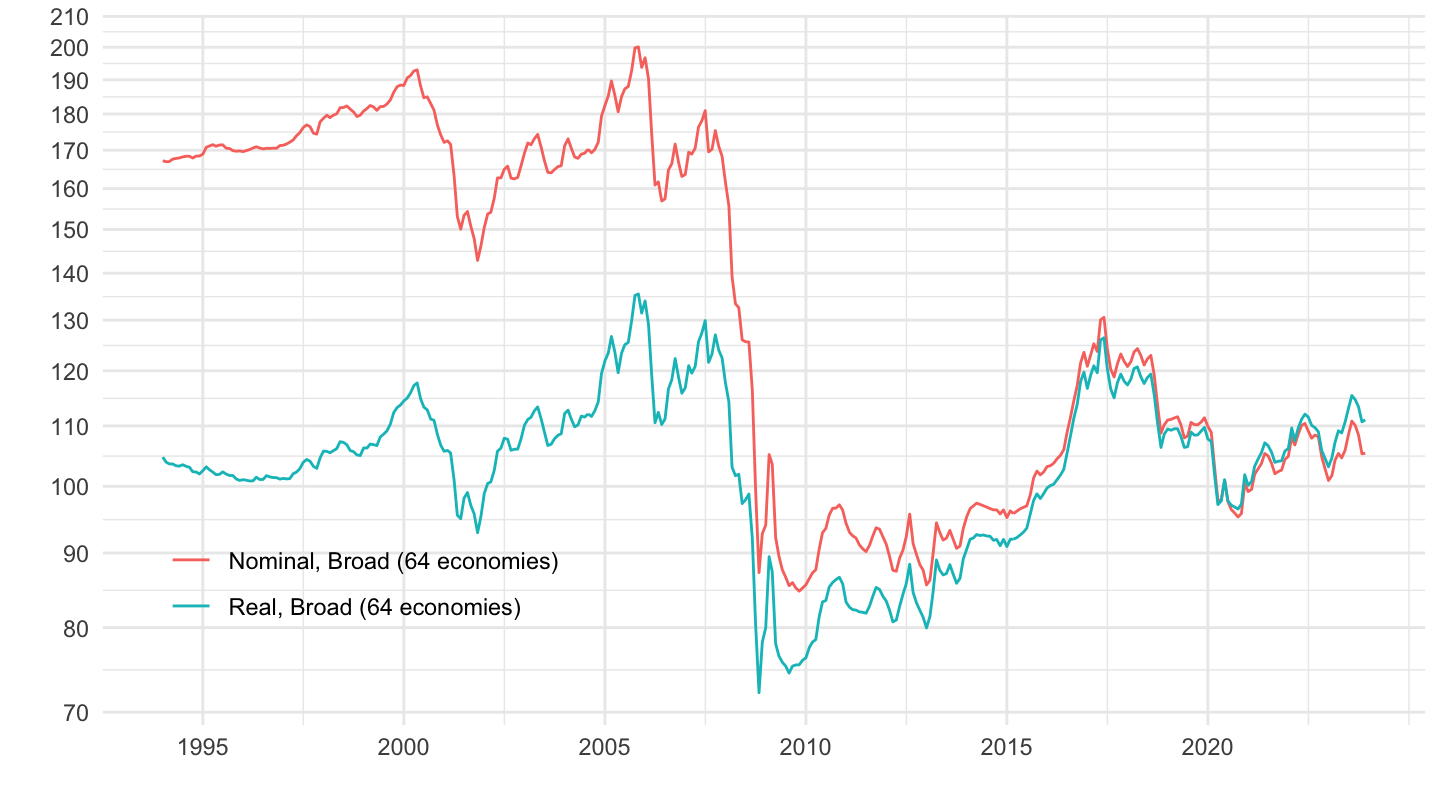
2000-
Code
EER %>%
  filter(iso3c %in% c("ISL"),
         date >= as.Date("2000-01-01")) %>%
  mutate(variable = paste0(Type, ", ", Basket)) %>%
  ggplot(.) + geom_line(aes(x = date, y = value, color = variable)) +
  theme_minimal() + xlab("") + ylab("") +

  scale_x_date(breaks = seq(1940, 2100, 2) %>% paste0("-01-01") %>% as.Date,
               labels = date_format("%Y")) +
  scale_y_log10(breaks = seq(0, 600, 10),
                labels = dollar_format(accuracy = 1, prefix = "")) +
  theme(legend.position = c(0.8, 0.8),
        legend.title = element_blank())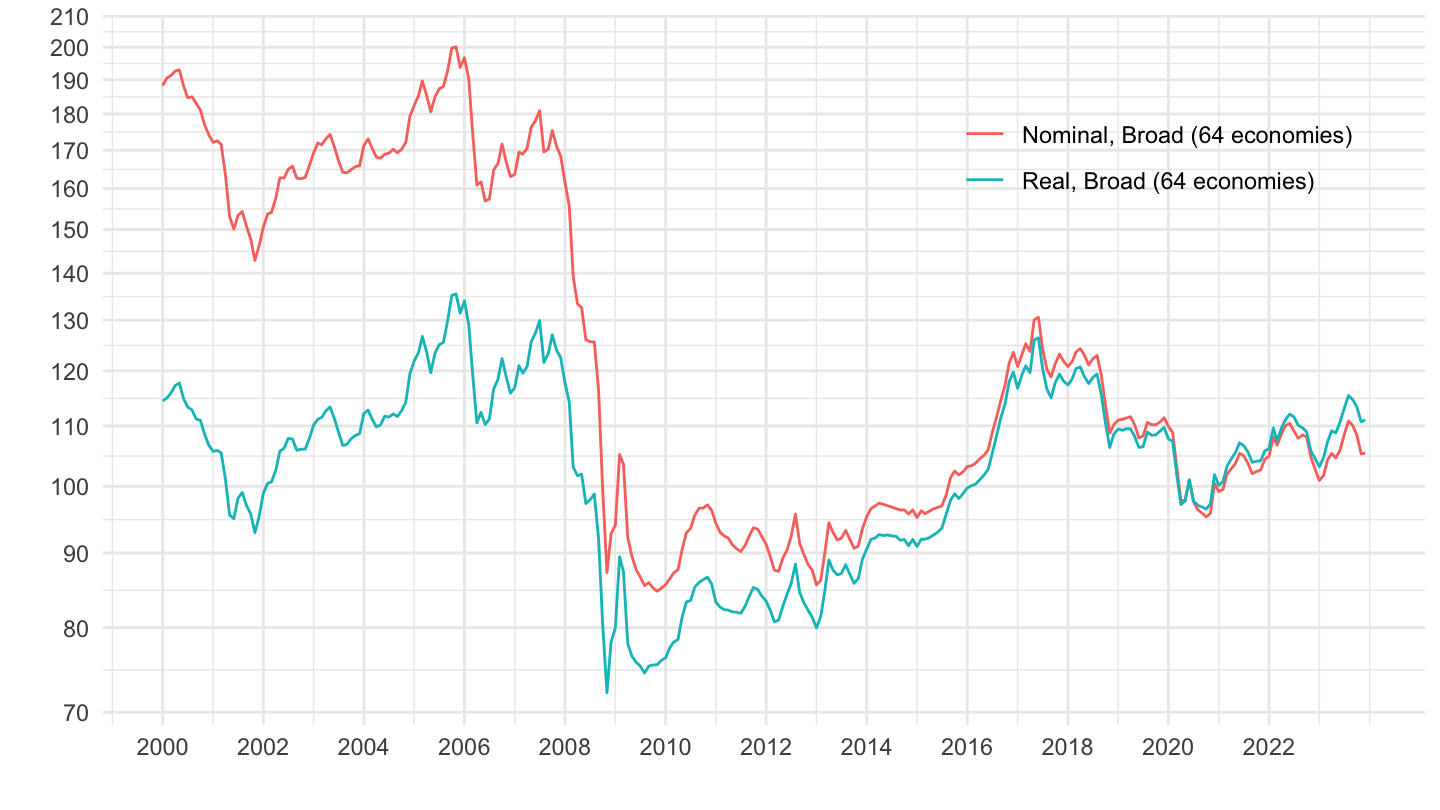
2010-
Code
EER %>%
  filter(iso3c %in% c("ISL"),
         date >= as.Date("2010-01-01")) %>%
  mutate(variable = paste0(Type, ", ", Basket)) %>%
  ggplot(.) + geom_line(aes(x = date, y = value, color = variable)) +
  theme_minimal() + xlab("") + ylab("") +

  scale_x_date(breaks = seq(1940, 2100, 1) %>% paste0("-01-01") %>% as.Date,
               labels = date_format("%Y")) +
  scale_y_log10(breaks = seq(0, 600, 10),
                labels = dollar_format(accuracy = 1, prefix = "")) +
  theme(legend.position = c(0.2, 0.8),
        legend.title = element_blank())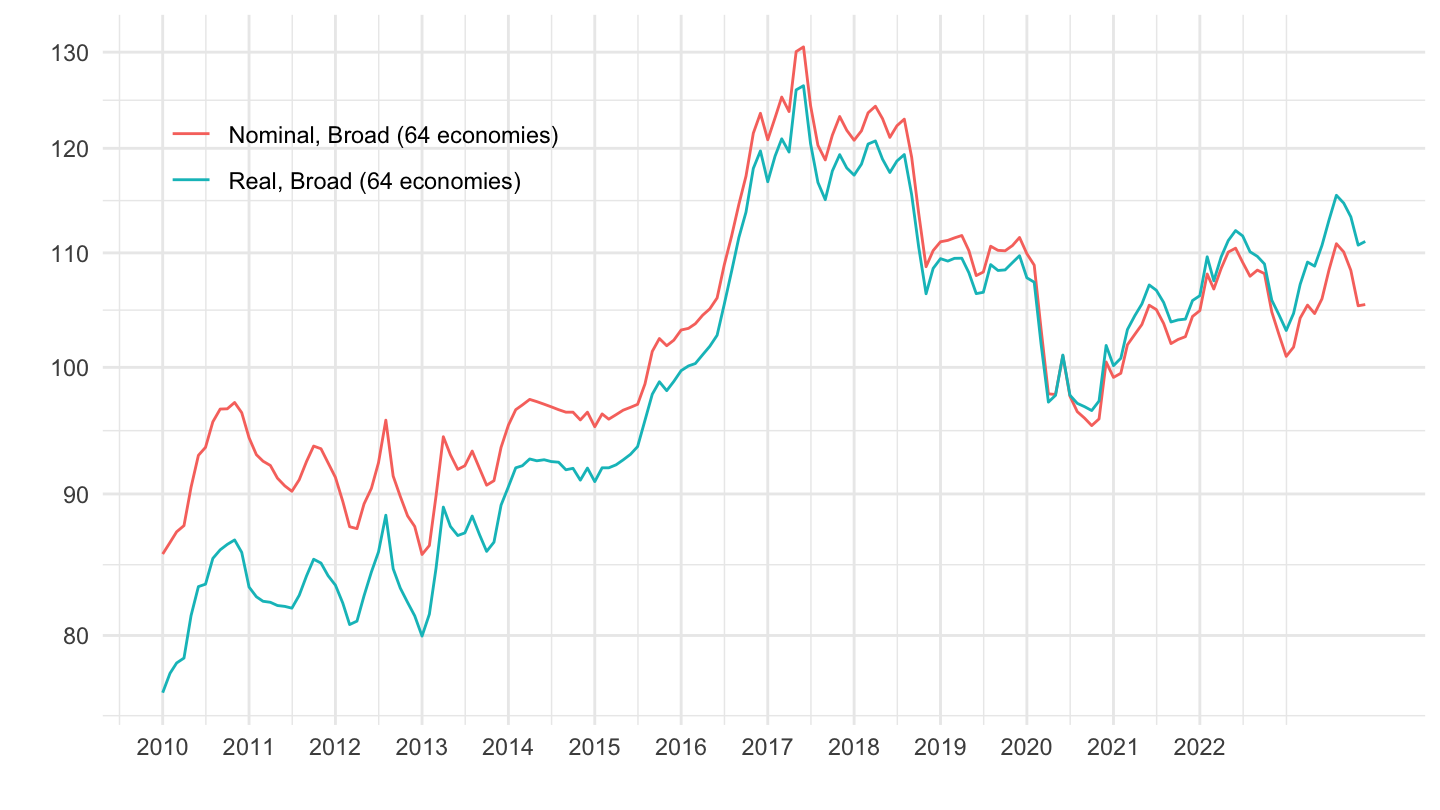
China
Code
EER %>%
  filter(iso3c %in% c("CHN")) %>%
  mutate(variable = paste0(Type, ", ", Basket)) %>%
  ggplot(.) + geom_line(aes(x = date, y = value, color = variable)) +
  theme_minimal() + xlab("") + ylab("") +

  scale_x_date(breaks = seq(1940, 2100, 2) %>% paste0("-01-01") %>% as.Date,
               labels = date_format("%Y")) +
  scale_y_log10(breaks = seq(0, 600, 10),
                labels = dollar_format(accuracy = 1, prefix = "")) +
  theme(legend.position = c(0.2, 0.9),
        legend.title = element_blank())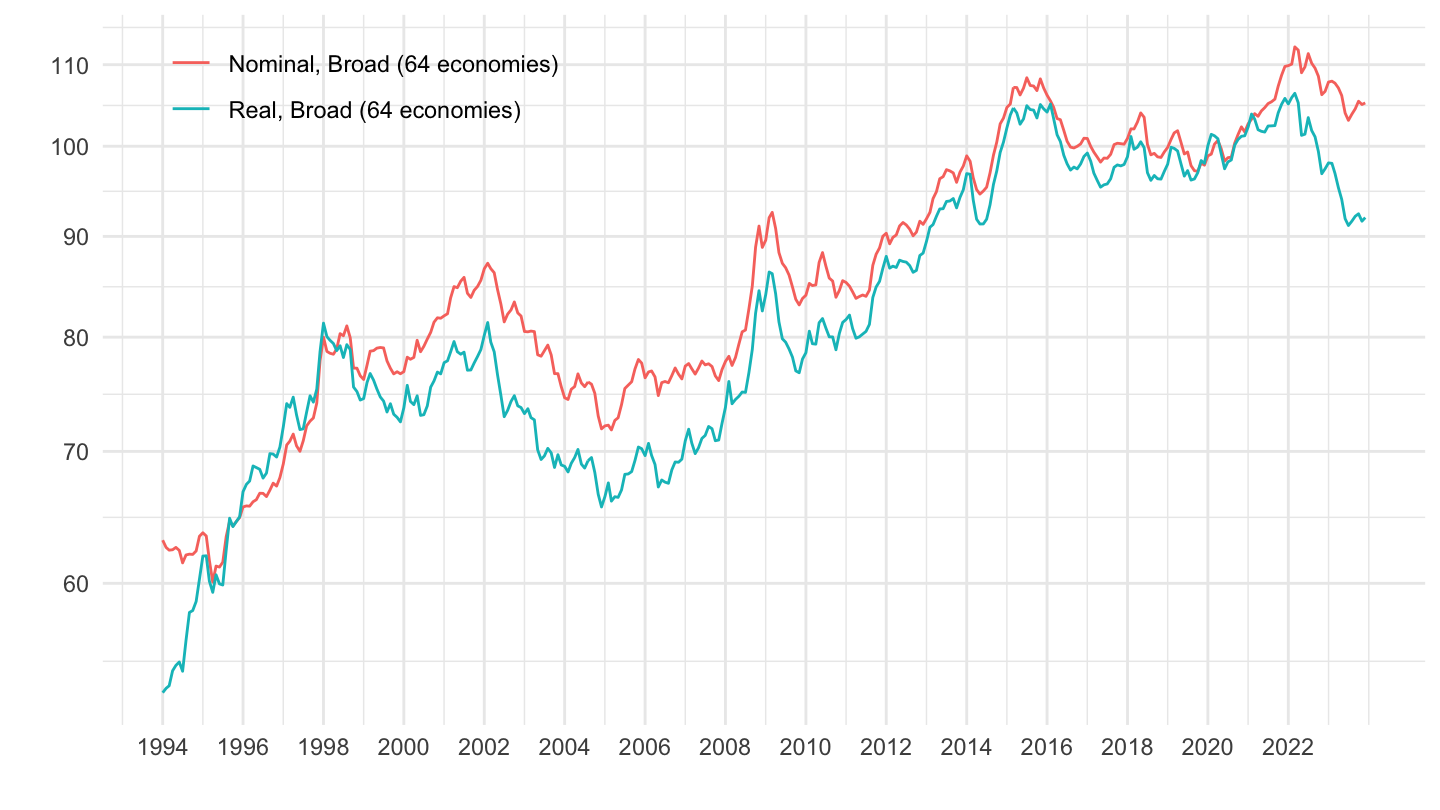
Denmark
Code
EER %>%
  filter(iso3c %in% c("DNK")) %>%
  mutate(variable = paste0(Type, ", ", Basket)) %>%
  ggplot(.) + geom_line(aes(x = date, y = value, color = variable)) +
  theme_minimal() + xlab("") + ylab("") +

  scale_x_date(breaks = seq(1940, 2100, 5) %>% paste0("-01-01") %>% as.Date,
               labels = date_format("%Y")) +
  scale_y_log10(breaks = seq(0, 600, 10),
                labels = dollar_format(accuracy = 1, prefix = "")) +
  theme(legend.position = c(0.8, 0.2),
        legend.title = element_blank())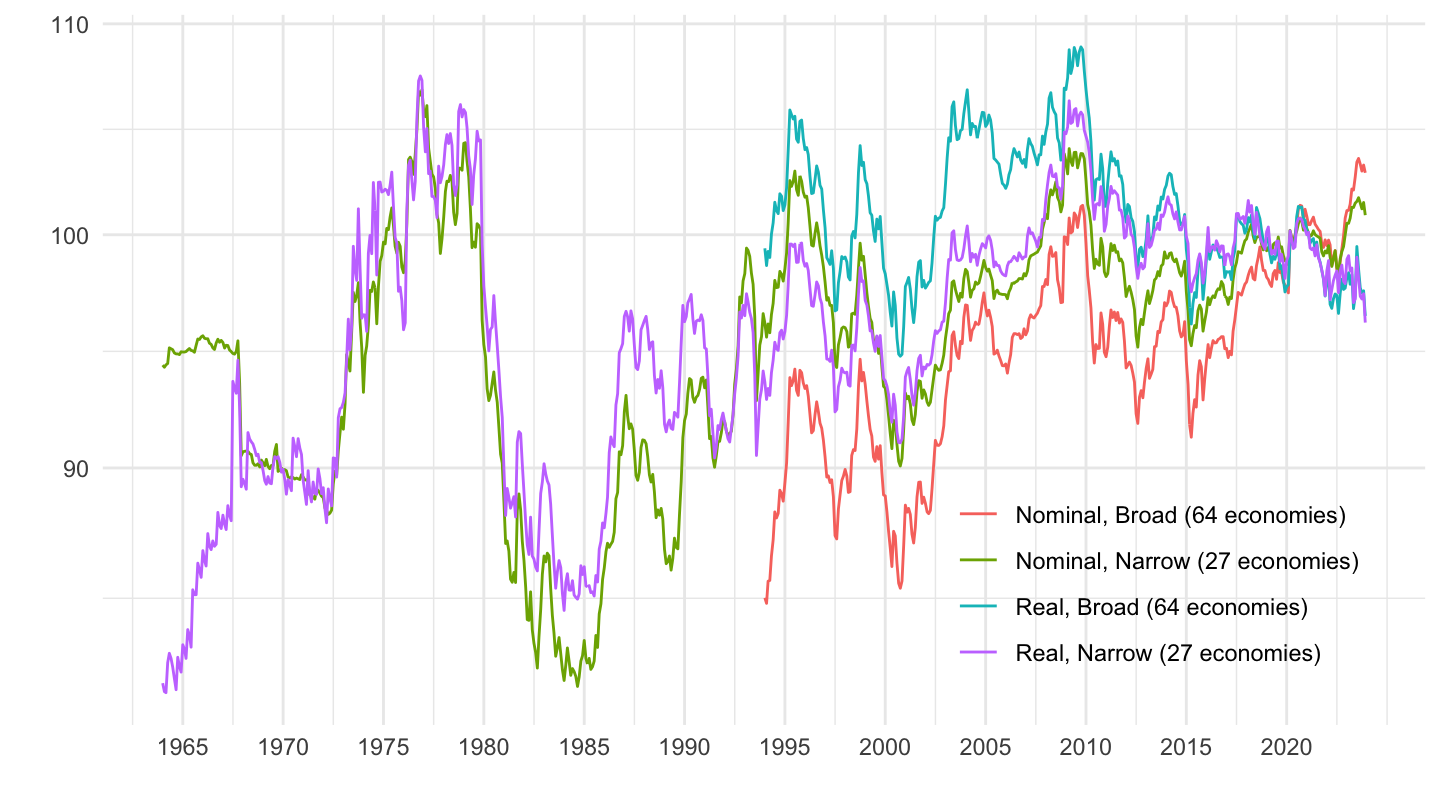
Germany
Code
EER %>%
  filter(iso3c %in% c("DEU")) %>%
  mutate(variable = paste0(Type, ", ", Basket)) %>%
  ggplot(.) + geom_line(aes(x = date, y = value, color = variable)) +
  theme_minimal() + xlab("") + ylab("") +

  scale_x_date(breaks = seq(1940, 2100, 5) %>% paste0("-01-01") %>% as.Date,
               labels = date_format("%Y")) +
  scale_y_log10(breaks = seq(0, 600, 10),
                labels = dollar_format(accuracy = 1, prefix = "")) +
  theme(legend.position = c(0.8, 0.2),
        legend.title = element_blank())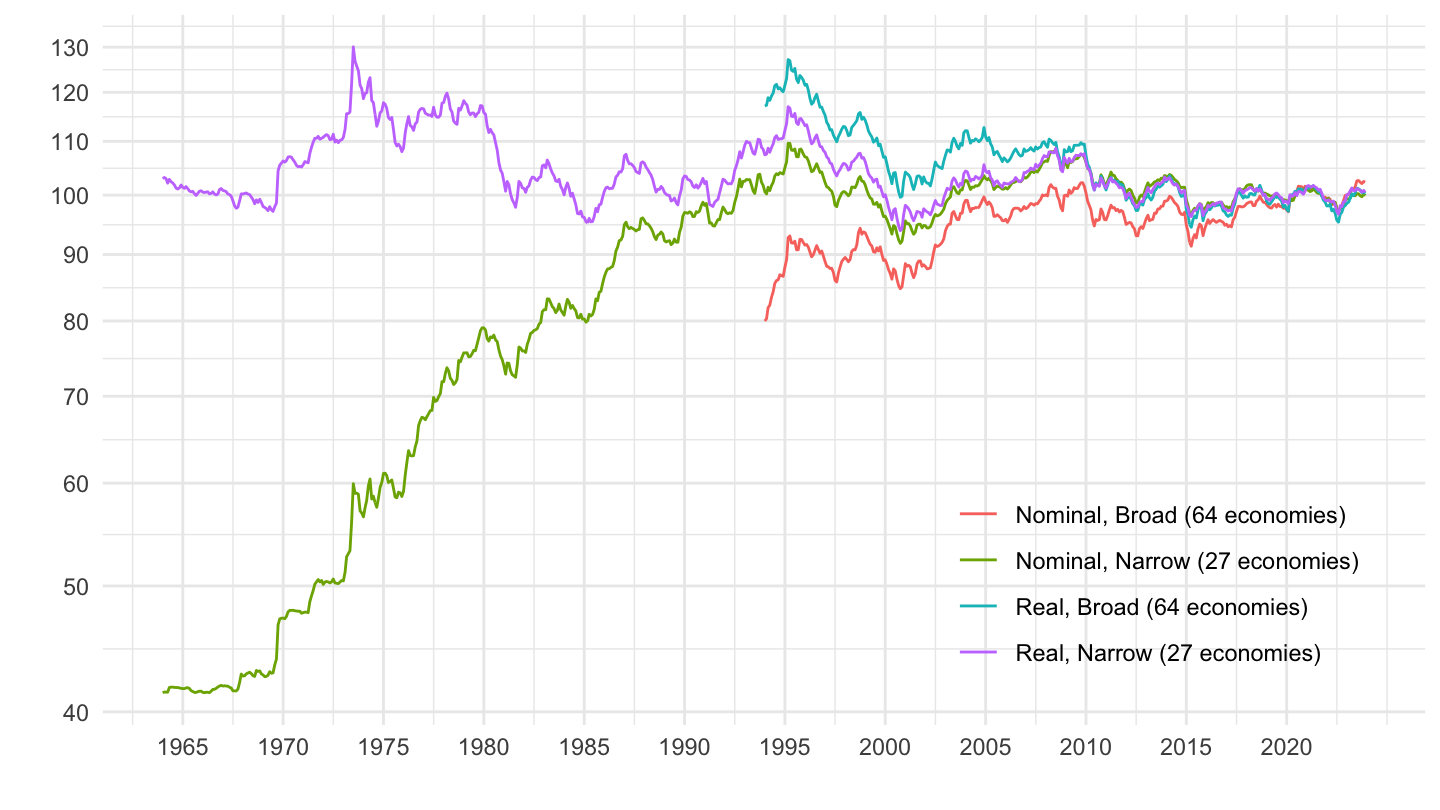
France
Code
EER %>%
  filter(iso3c %in% c("FRA")) %>%
  mutate(variable = paste0(Type, ", ", Basket)) %>%
  ggplot(.) +
  geom_line(aes(x = date, y = value, color = variable)) +
  theme_minimal() + xlab("") + ylab("") +

  scale_x_date(breaks = seq(1940, 2100, 5) %>% paste0("-01-01") %>% as.Date,
               labels = date_format("%Y")) +
  scale_y_log10(breaks = seq(0, 600, 10),
                labels = dollar_format(accuracy = 1, prefix = "")) +
  theme(legend.position = c(0.8, 0.8),
        legend.title = element_blank())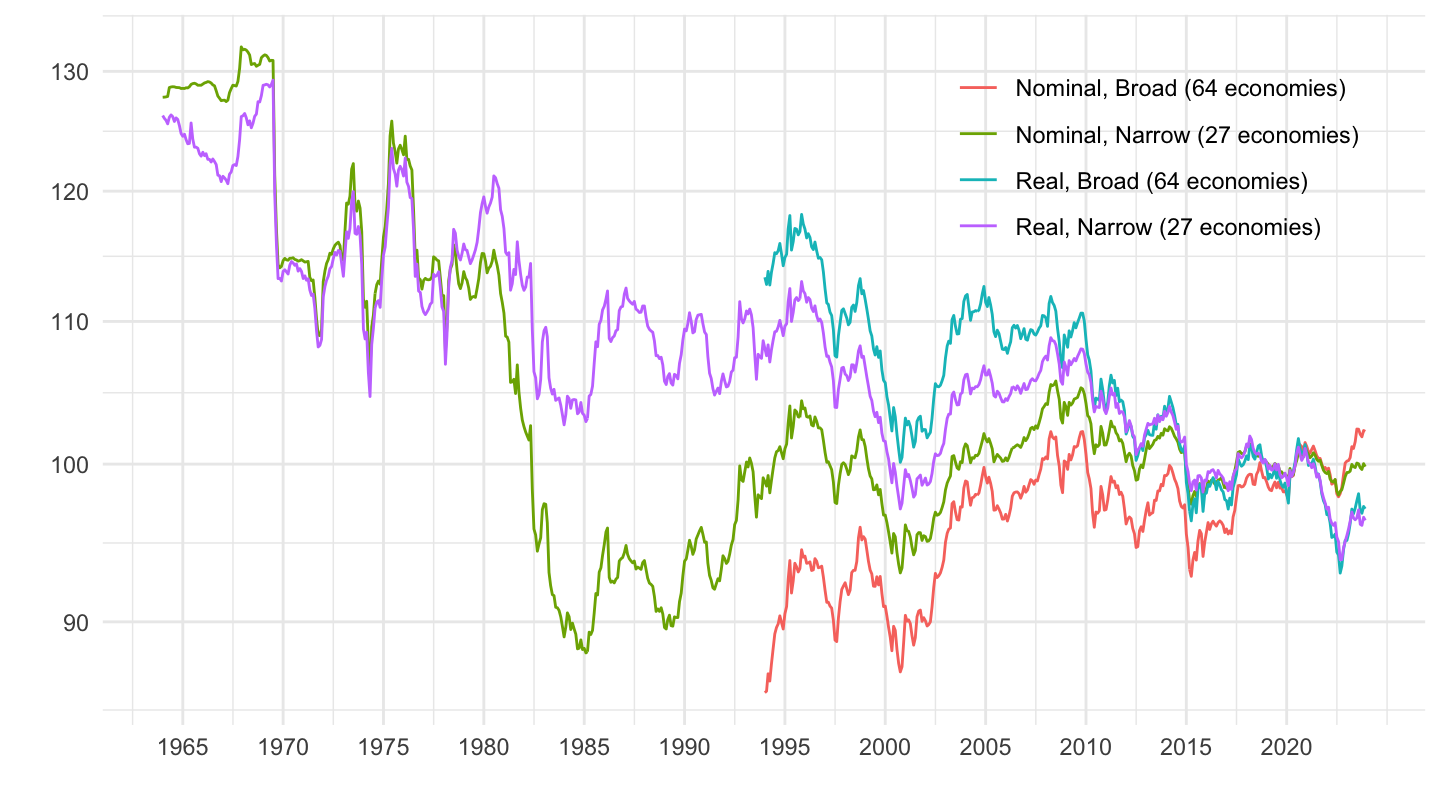
Italy
Code
EER %>%
  filter(iso3c %in% c("ITA")) %>%
  mutate(variable = paste0(Type, ", ", Basket)) %>%
  ggplot(.) +
  geom_line(aes(x = date, y = value, color = variable)) +
  theme_minimal() + xlab("") + ylab("") +

  scale_x_date(breaks = seq(1940, 2100, 5) %>% paste0("-01-01") %>% as.Date,
               labels = date_format("%Y")) +
  scale_y_log10(breaks = seq(0, 600, 10),
                labels = dollar_format(accuracy = 1, prefix = "")) +
  theme(legend.position = c(0.8, 0.8),
        legend.title = element_blank())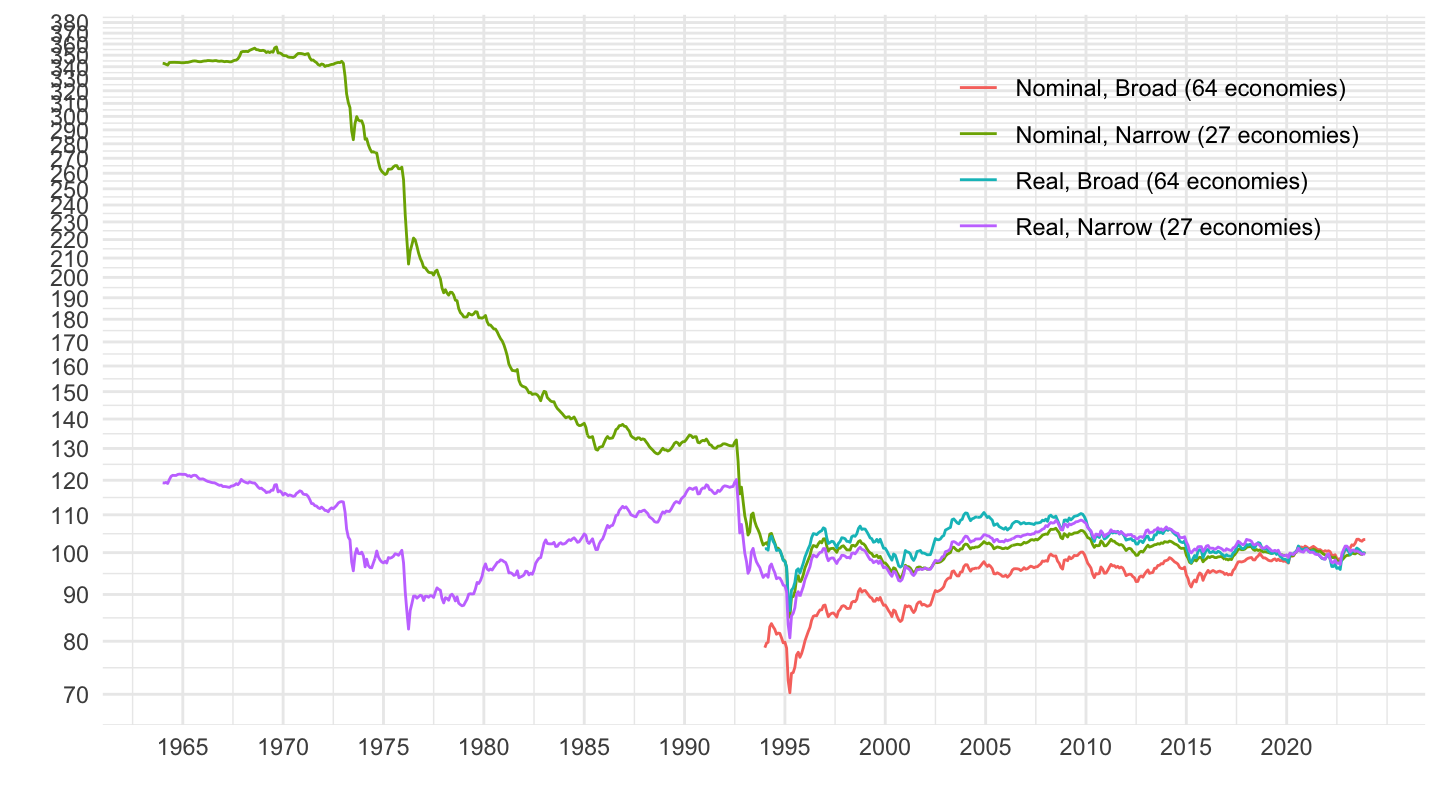
United Kingdom
All
Code
EER %>%
  filter(iso3c %in% c("GBR")) %>%
  mutate(variable = paste0(Type, ", ", Basket)) %>%
  ggplot(.) +
  geom_line(aes(x = date, y = value, color = variable)) +
  theme_minimal() + xlab("") + ylab("") +

  scale_x_date(breaks = seq(1940, 2100, 5) %>% paste0("-01-01") %>% as.Date,
               labels = date_format("%Y")) +
  scale_y_log10(breaks = seq(0, 600, 10),
                labels = dollar_format(accuracy = 1, prefix = "")) +
  theme(legend.position = c(0.8, 0.8),
        legend.title = element_blank())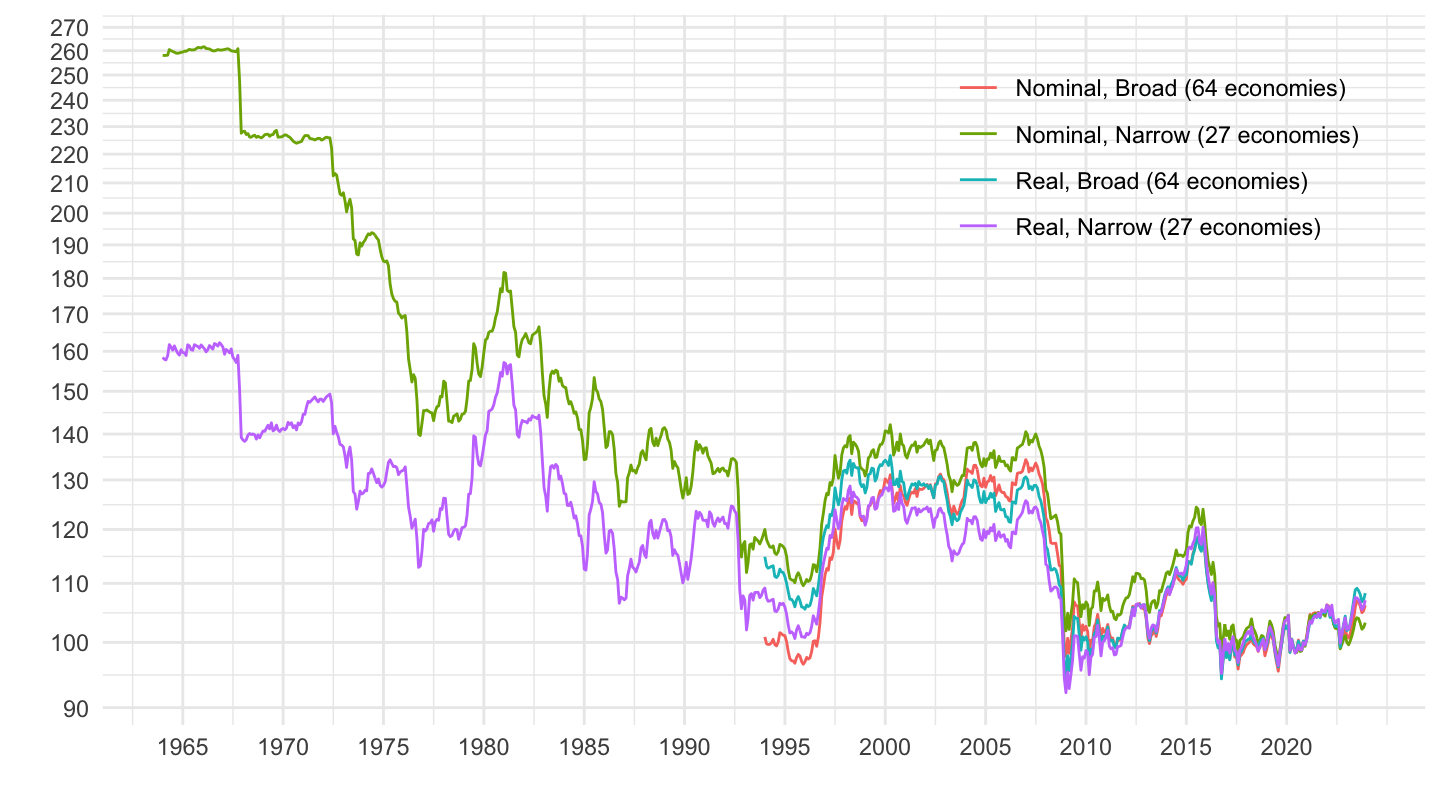
1990-
Code
EER %>%
  filter(iso3c %in% c("GBR"),
         date >= as.Date("1990-01-01")) %>%
  mutate(variable = paste0(Type, ", ", Basket)) %>%
  ggplot(.) +
  geom_line(aes(x = date, y = value, color = variable)) +
  theme_minimal() + xlab("") + ylab("") +

  scale_x_date(breaks = seq(1940, 2100, 5) %>% paste0("-01-01") %>% as.Date,
               labels = date_format("%Y")) +
  scale_y_log10(breaks = seq(0, 600, 10),
                labels = dollar_format(accuracy = 1, prefix = "")) +
  theme(legend.position = c(0.8, 0.8),
        legend.title = element_blank())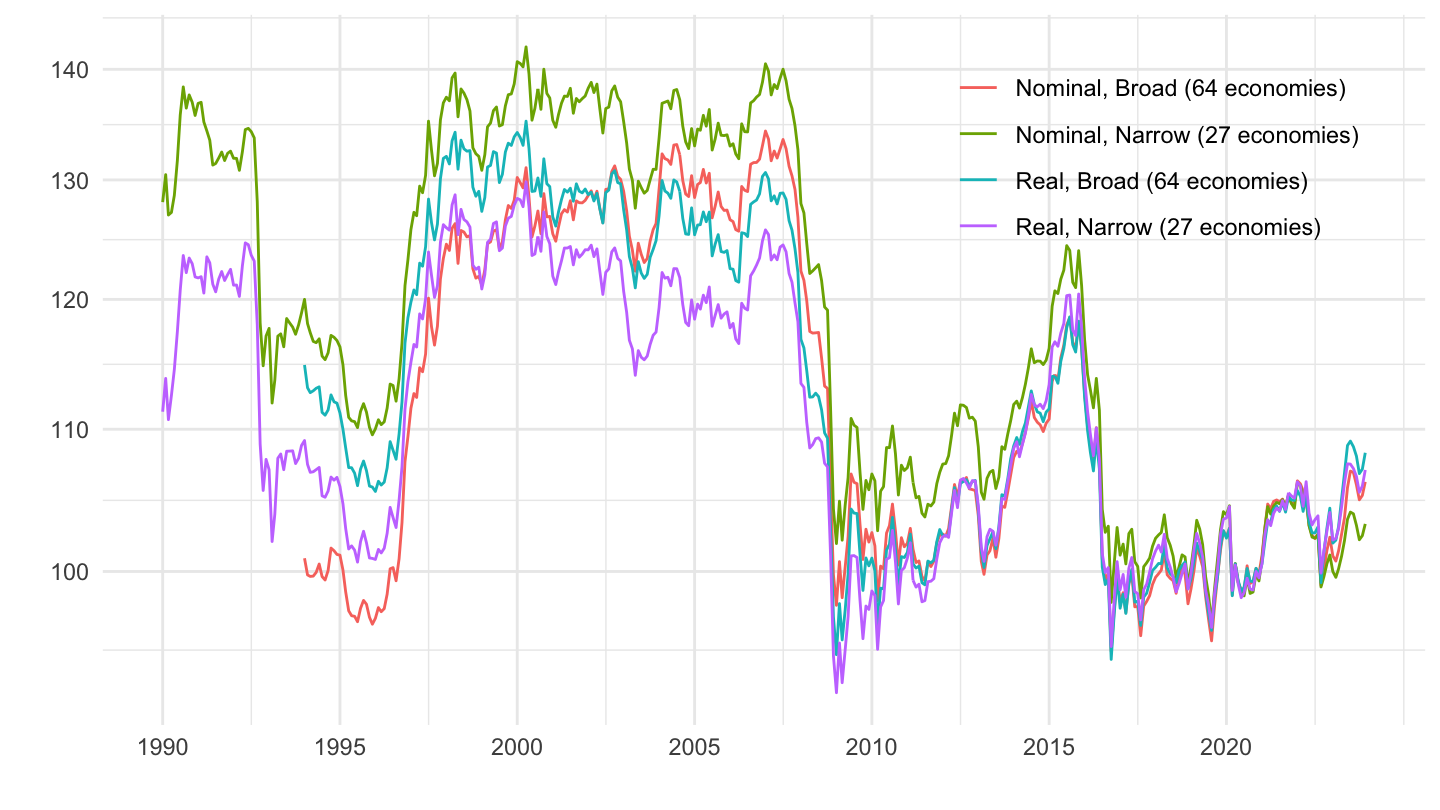
2000-
Code
EER %>%
  filter(iso3c %in% c("GBR"),
         date >= as.Date("2000-01-01")) %>%
  mutate(variable = paste0(Type, ", ", Basket)) %>%
  ggplot(.) +
  geom_line(aes(x = date, y = value, color = variable)) +
  theme_minimal() + xlab("") + ylab("") +

  scale_x_date(breaks = seq(1940, 2100, 5) %>% paste0("-01-01") %>% as.Date,
               labels = date_format("%Y")) +
  scale_y_log10(breaks = seq(0, 600, 10),
                labels = dollar_format(accuracy = 1, prefix = "")) +
  theme(legend.position = c(0.8, 0.8),
        legend.title = element_blank())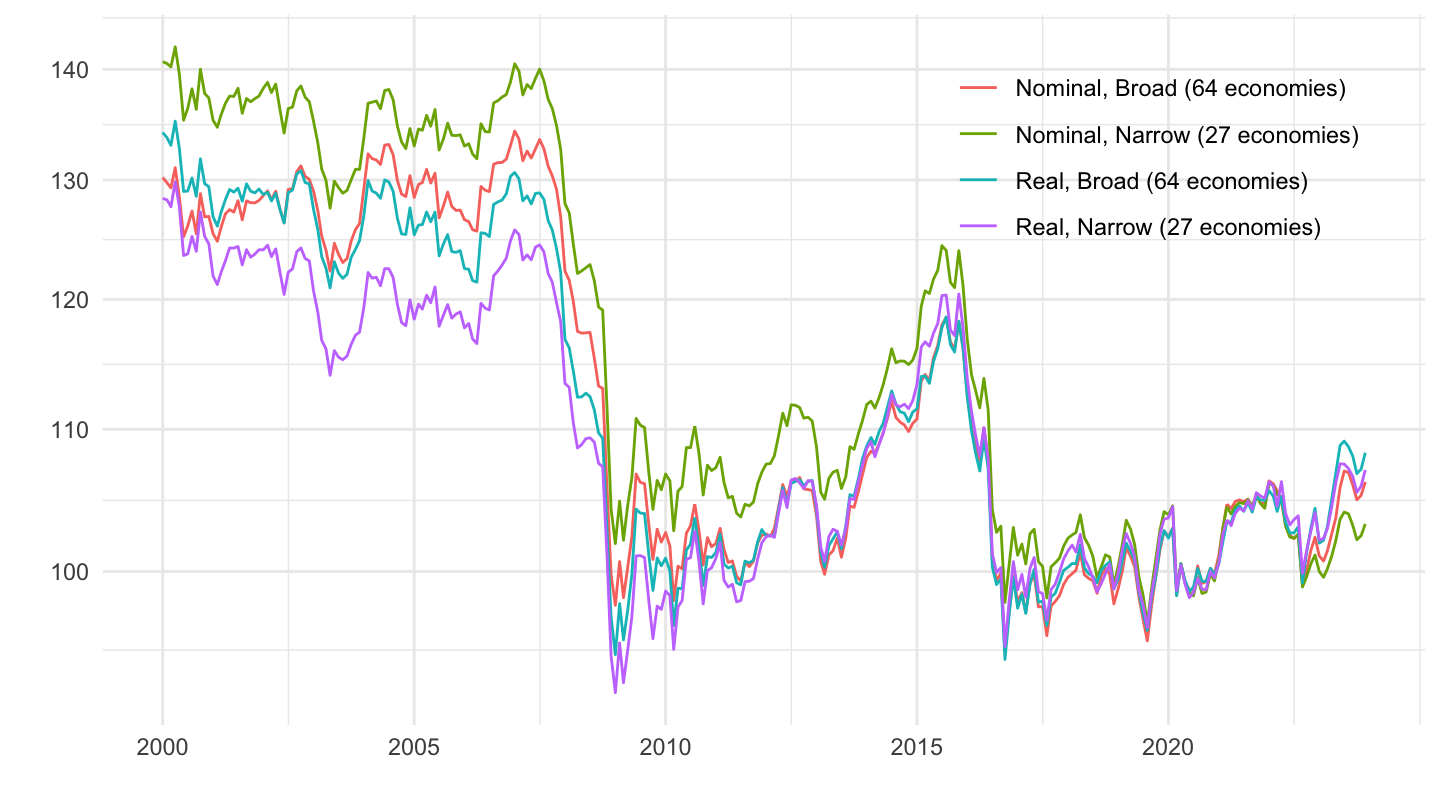
2010-
Code
EER %>%
  filter(iso3c %in% c("GBR"),
         date >= as.Date("2010-01-01")) %>%
  mutate(variable = paste0(Type, ", ", Basket)) %>%
  ggplot(.) +
  geom_line(aes(x = date, y = value, color = variable)) +
  theme_minimal() + xlab("") + ylab("") +

  scale_x_date(breaks = seq(1940, 2100, 5) %>% paste0("-01-01") %>% as.Date,
               labels = date_format("%Y")) +
  scale_y_log10(breaks = seq(0, 600, 10),
                labels = dollar_format(accuracy = 1, prefix = "")) +
  theme(legend.position = c(0.8, 0.8),
        legend.title = element_blank())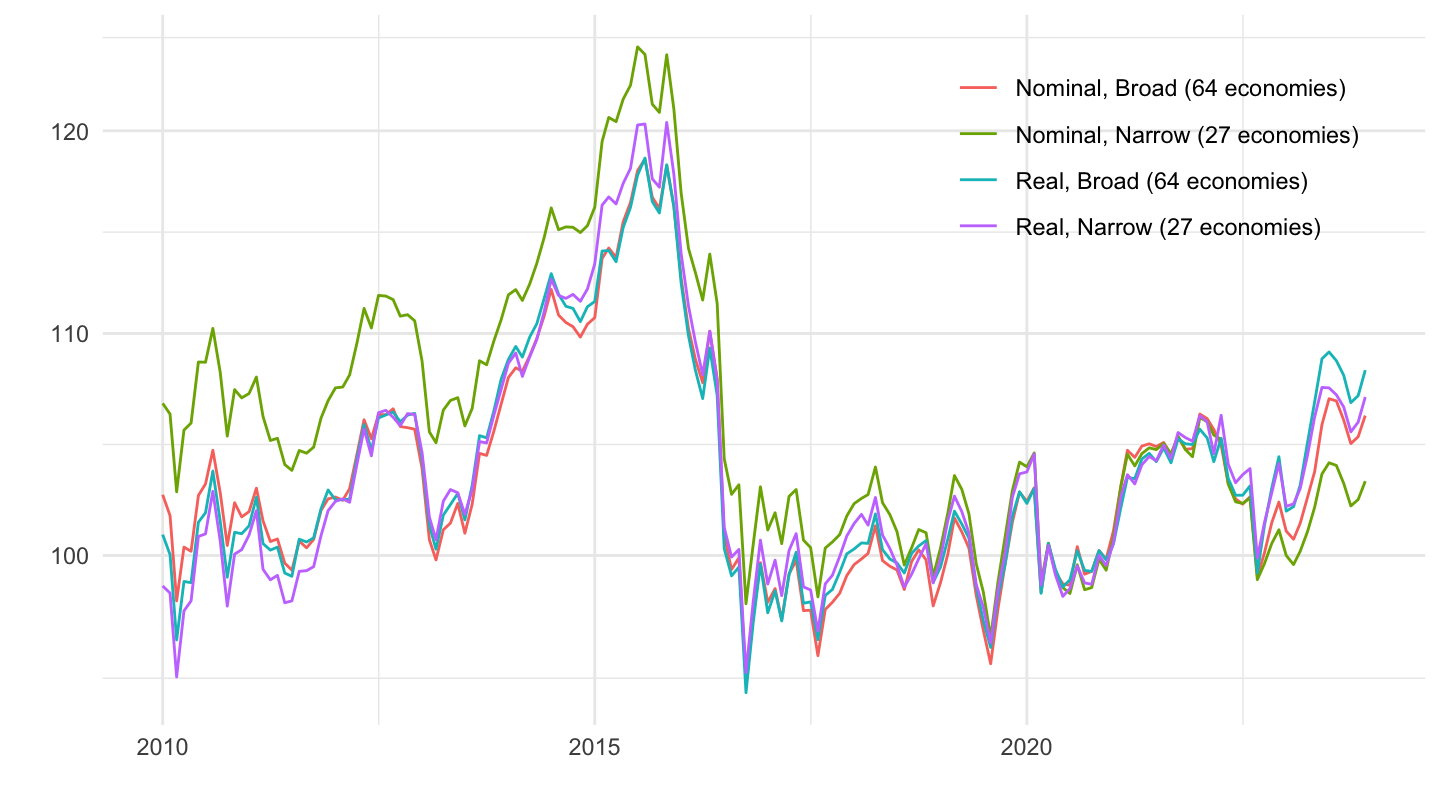
Canada
Code
EER %>%
  filter(iso3c %in% c("CAN")) %>%
  mutate(variable = paste0(Type, ", ", Basket)) %>%
  ggplot(.) +
  geom_line(aes(x = date, y = value, color = variable)) +
  theme_minimal() + xlab("") + ylab("") +

  scale_x_date(breaks = seq(1940, 2100, 5) %>% paste0("-01-01") %>% as.Date,
               labels = date_format("%Y")) +
  scale_y_log10(breaks = seq(0, 600, 10),
                labels = dollar_format(accuracy = 1, prefix = "")) +
  theme(legend.position = c(0.2, 0.2),
        legend.title = element_blank())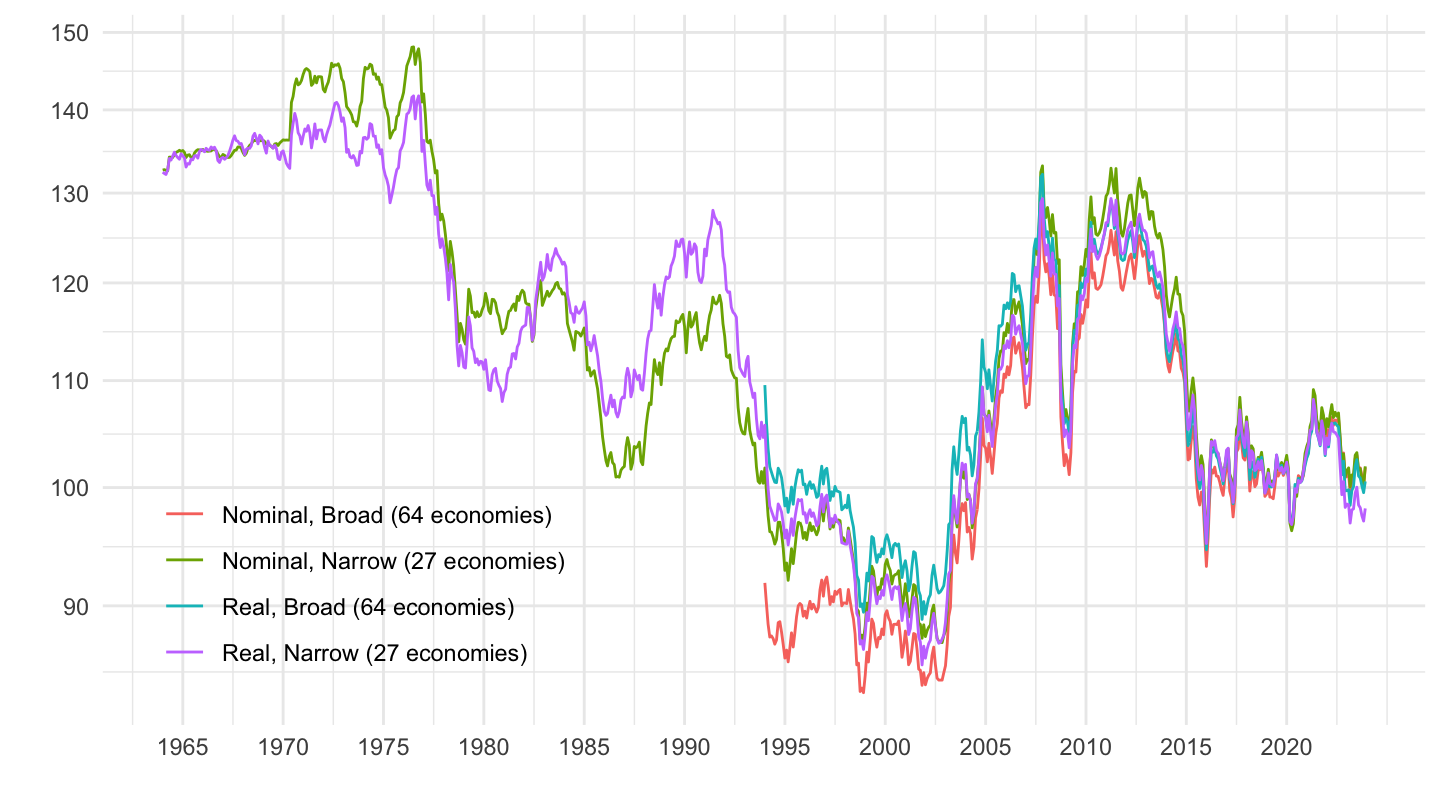
Sweden
Code
EER %>%
  filter(iso3c %in% c("SWE")) %>%
  mutate(variable = paste0(Type, ", ", Basket)) %>%
  ggplot(.) +
  geom_line(aes(x = date, y = value, color = variable)) +
  theme_minimal() + xlab("") + ylab("") +

  scale_x_date(breaks = seq(1940, 2100, 5) %>% paste0("-01-01") %>% as.Date,
               labels = date_format("%Y")) +
  scale_y_log10(breaks = seq(0, 600, 10),
                labels = dollar_format(accuracy = 1, prefix = "")) +
  theme(legend.position = c(0.2, 0.2),
        legend.title = element_blank())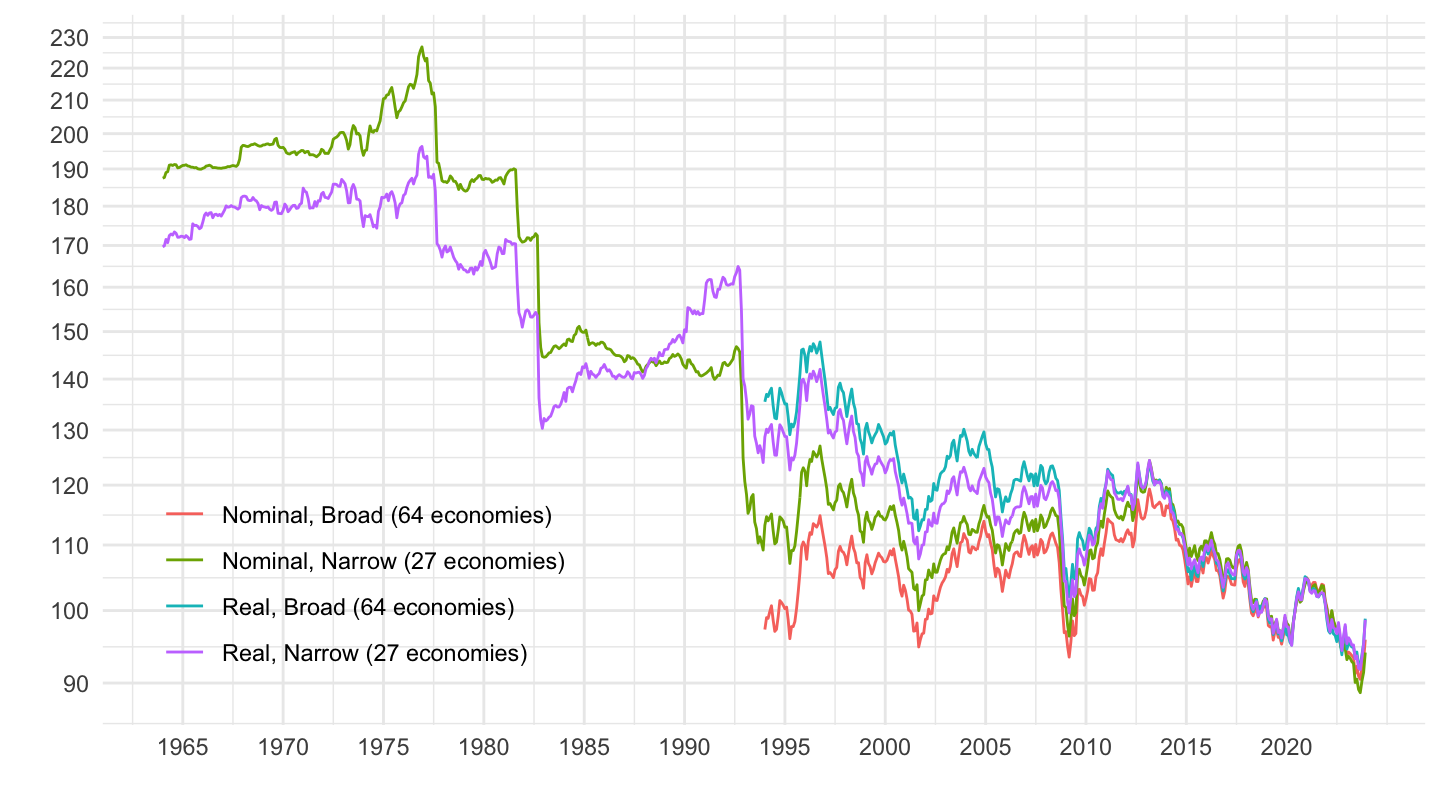
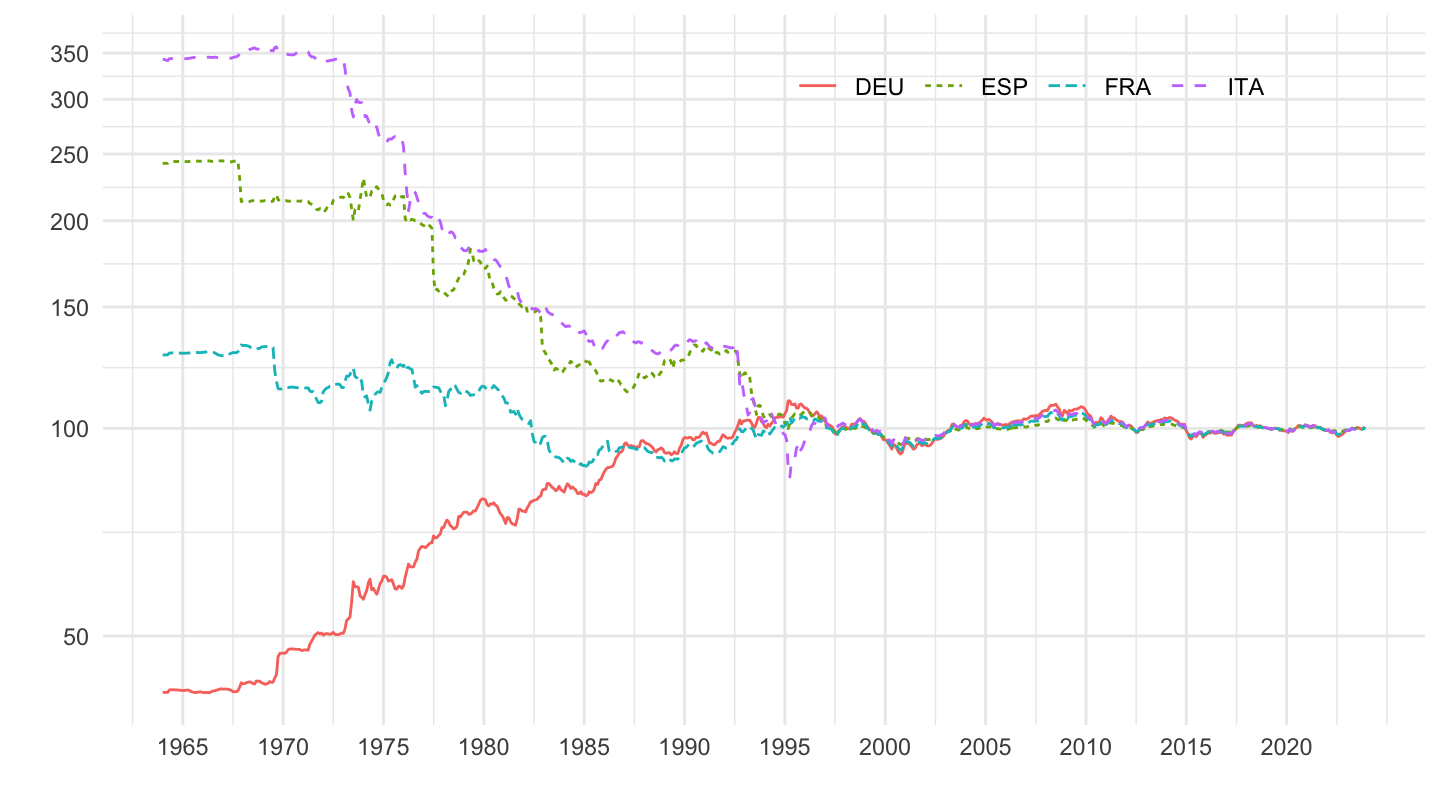
Germany, France, United States
Real Exchange rates
Code
EER %>%
  filter(iso3c %in% c("DEU", "FRA", "ITA", "ESP"),
         EER_BASKET == "N",
         EER_TYPE == "R") %>%
  ggplot(.) +
  geom_line(aes(x = date, y = value, color = iso3c, linetype = iso3c)) +
  theme_minimal() + xlab("") + ylab("Exchange Rate ($1 = ? National Currency)") +
  scale_x_date(breaks = seq(1940, 2100, 5) %>% paste0("-01-01") %>% as.Date,
               labels = date_format("%Y")) +
  scale_y_log10(breaks = seq(0, 200, 10),
                labels = dollar_format(accuracy = 1, prefix = "")) +

  theme(legend.position = c(0.7, 0.90),
        legend.title = element_blank(),
        legend.direction = "horizontal")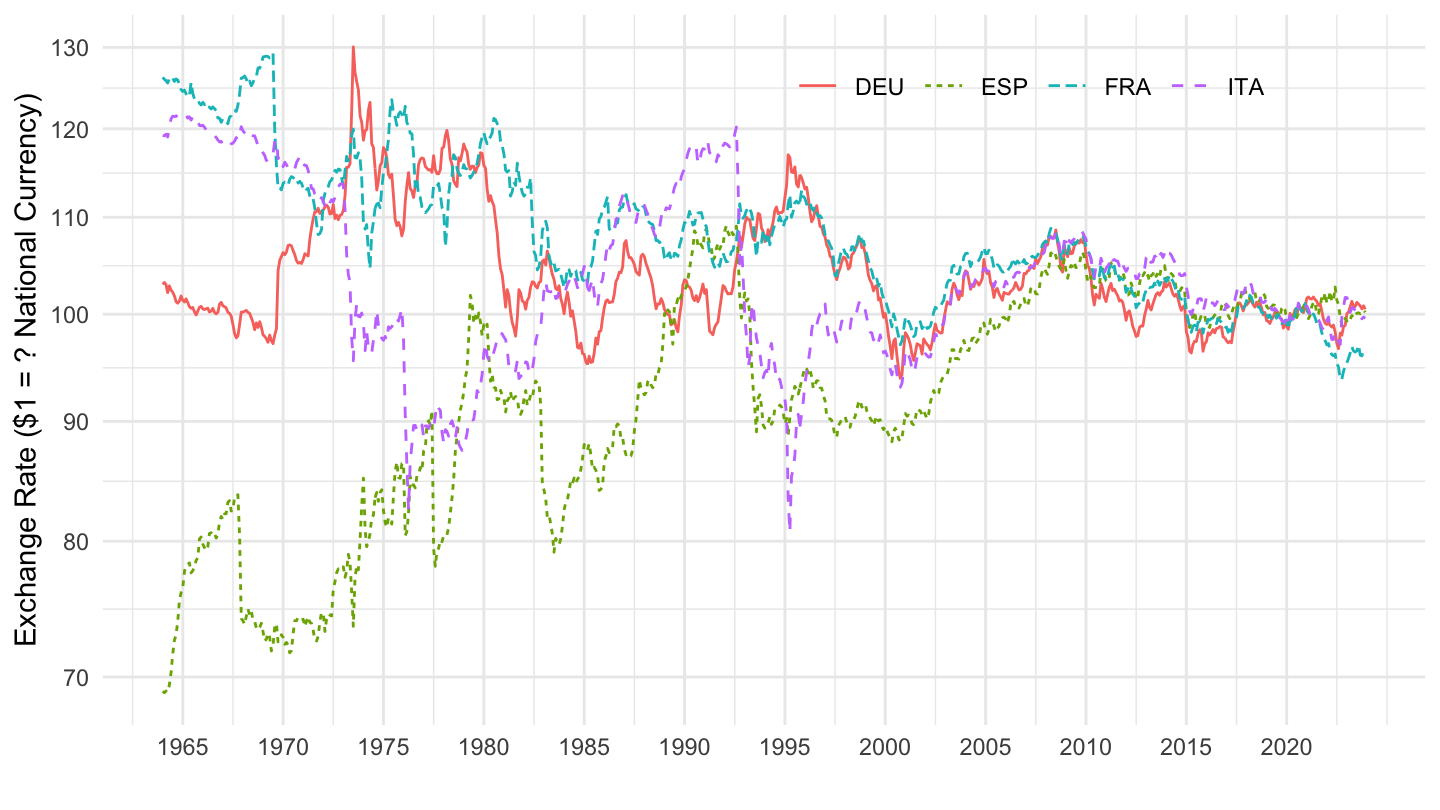
Nominal Exchange rates
Code
EER %>%
  filter(iso3c %in% c("DEU", "FRA", "ITA", "ESP"),
         EER_BASKET == "N",
         EER_TYPE == "N") %>%
  ggplot(.) +
  geom_line(aes(x = date, y = value, color = iso3c, linetype = iso3c)) +
  theme_minimal() + xlab("") + ylab("") +
  scale_x_date(breaks = seq(1940, 2100, 5) %>% paste0("-01-01") %>% as.Date,
               labels = date_format("%Y")) +
  scale_y_log10(breaks = seq(0, 600, 50),
                labels = dollar_format(accuracy = 1, prefix = "")) +

  theme(legend.position = c(0.7, 0.90),
        legend.title = element_blank(),
        legend.direction = "horizontal")