Euro/ECU exchange rates - daily data
Data - Eurostat
Info
Last observation: Daily: 2026-07-13 (N = 30)
First observation: Daily: 1974-07-01 (N = 6)
Last data update: 14 jul 2026, 15:36. Last compile: 24 jul 2026, 01:33
Structure
USD, CHF, GBP
All
Code
ert_bil_eur_d %>%
  filter(currency %in% c("USD", "CHF", "GBP")) %>%

  day_to_date %>%
  mutate(Geo = case_when(currency == "USD" ~ "United States",
                         currency == "CHF" ~ "Switzerland",
                         currency == "GBP" ~ "United Kingdom")) %>%
  left_join(colors, by = c("Geo" = "country")) %>%
  ggplot + geom_line(aes(x = date, y = values, color = color)) +
  scale_color_identity() + theme_minimal()  + add_3flags +
  scale_x_date(breaks = as.Date(paste0(seq(1960, 2100, 5), "-01-01")),
               labels = date_format("%Y")) +
  xlab("") + ylab("") +
  scale_y_log10(breaks = seq(0, 10, 0.5),
                     labels = dollar_format(p = "", su = "/€")) +
  geom_label(data = . %>% filter(max(date) == date),
             aes(x = date, y = values, label = round(values, 3), color = color))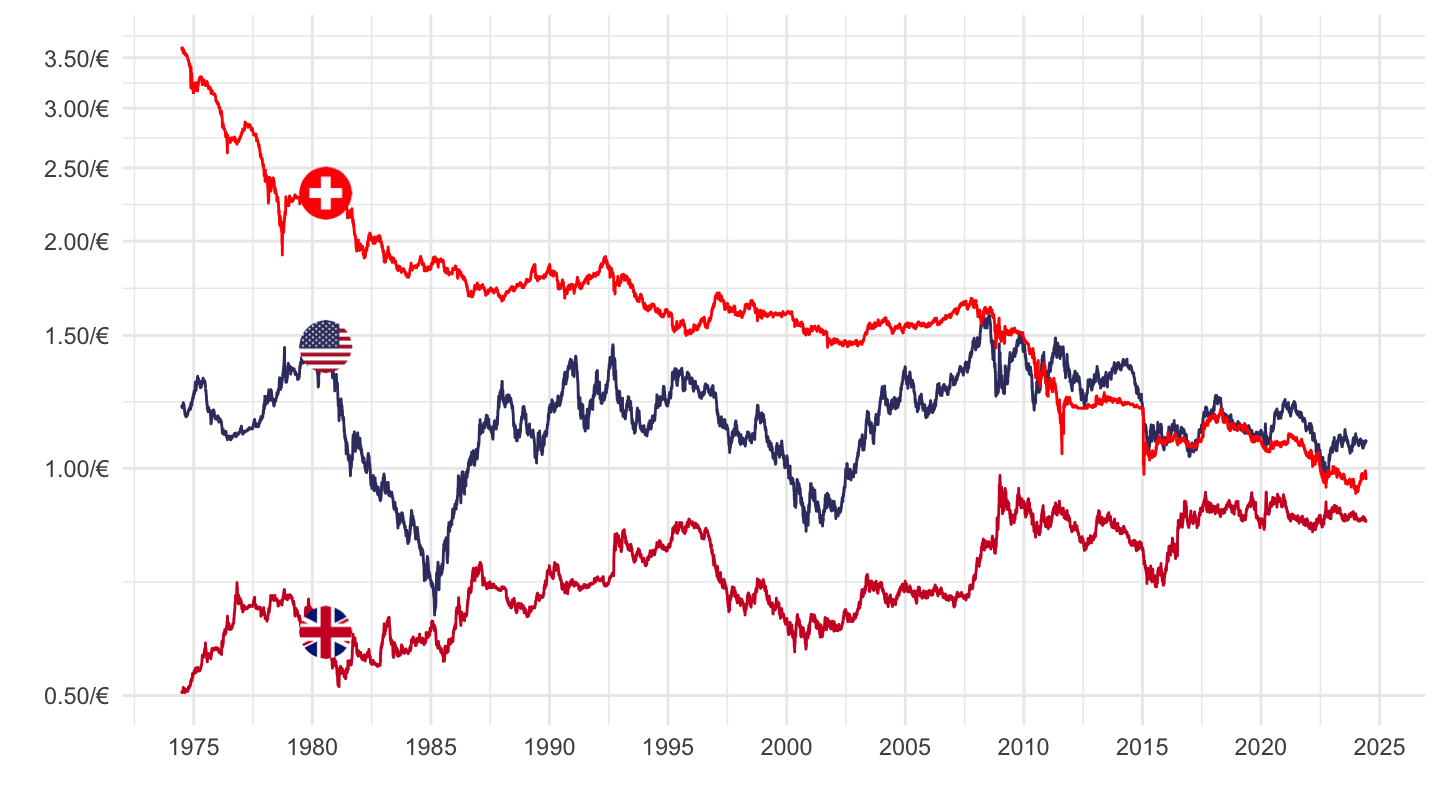
10 years
Code
ert_bil_eur_d %>%
  filter(currency %in% c("USD", "CHF", "GBP")) %>%

  day_to_date %>%
  filter(date >= Sys.Date() - years(10)) %>%
  mutate(Geo = case_when(currency == "USD" ~ "United States",
                         currency == "CHF" ~ "Switzerland",
                         currency == "GBP" ~ "United Kingdom")) %>%
  left_join(colors, by = c("Geo" = "country")) %>%
  ggplot + geom_line(aes(x = date, y = values, color = color)) +
  scale_color_identity() + theme_minimal()  + add_3flags +
  scale_x_date(breaks = "6 months",
               labels = date_format("%b %Y")) +
  theme(axis.text.x = element_text(angle = 45, vjust = 1, hjust = 1)) +
  xlab("") + ylab("") +
  scale_y_log10(breaks = seq(0, 10, 0.05),
                     labels = dollar_format(p = "", su = "/€")) +
  geom_label(data = . %>% filter(max(date) == date),
             aes(x = date, y = values, label = round(values, 3), color = color))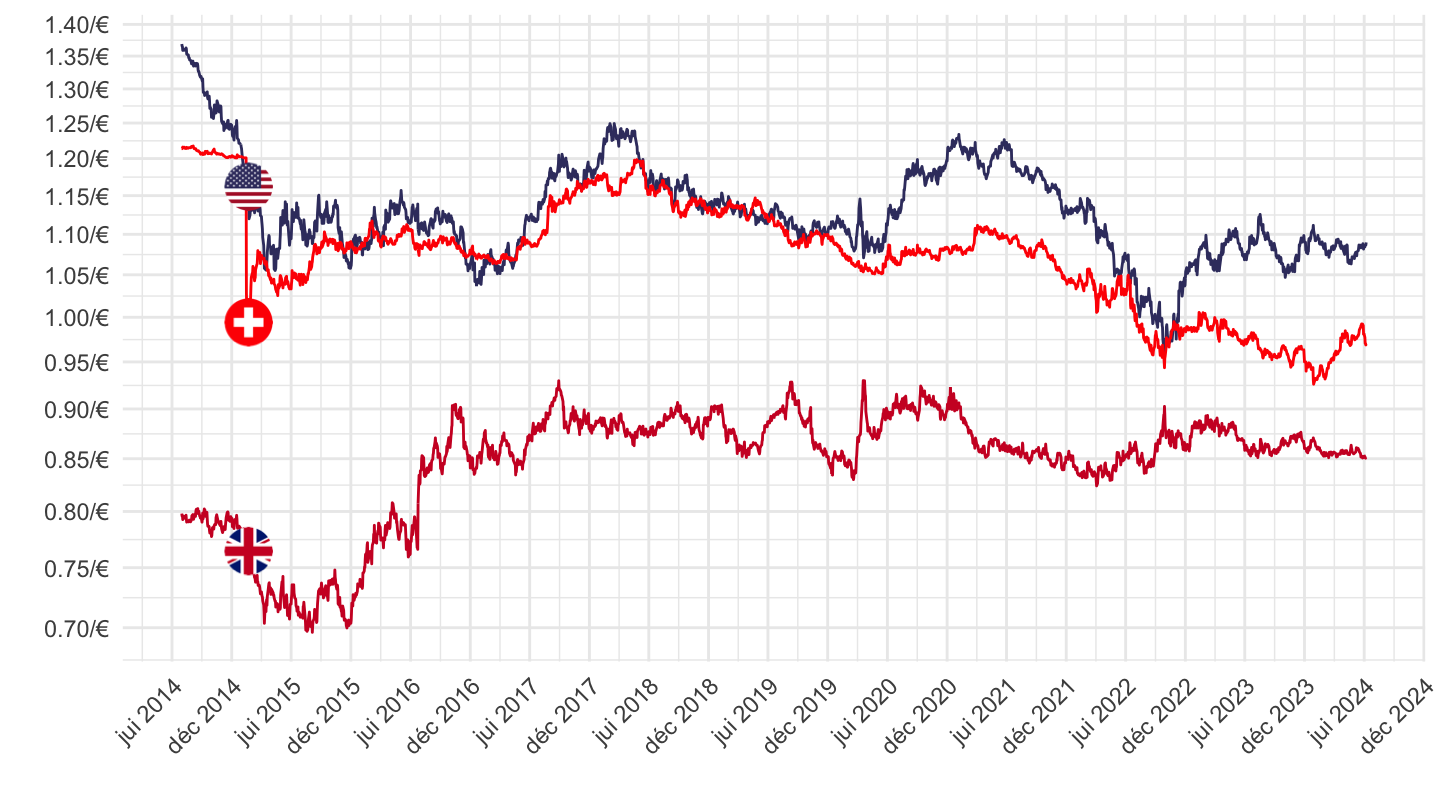
2 years
Code
ert_bil_eur_d %>%
  filter(currency %in% c("USD", "CHF", "GBP")) %>%

  day_to_date %>%
  filter(date >= Sys.Date() - years(2)) %>%
  mutate(Geo = case_when(currency == "USD" ~ "United States",
                         currency == "CHF" ~ "Switzerland",
                         currency == "GBP" ~ "United Kingdom")) %>%
  left_join(colors, by = c("Geo" = "country")) %>%
  ggplot + geom_line(aes(x = date, y = values, color = color)) +
  scale_color_identity() + theme_minimal()  + add_3flags +
  scale_x_date(breaks = "1 month",
               labels = date_format("%d %b %Y")) +
  theme(axis.text.x = element_text(angle = 45, vjust = 1, hjust = 1)) +
  xlab("") + ylab("") +
  scale_y_log10(breaks = seq(0, 10, 0.05),
                     labels = dollar_format(p = "", su = "/€")) +
  geom_label(data = . %>% filter(max(date) == date),
             aes(x = date, y = values, label = round(values, 3), color = color))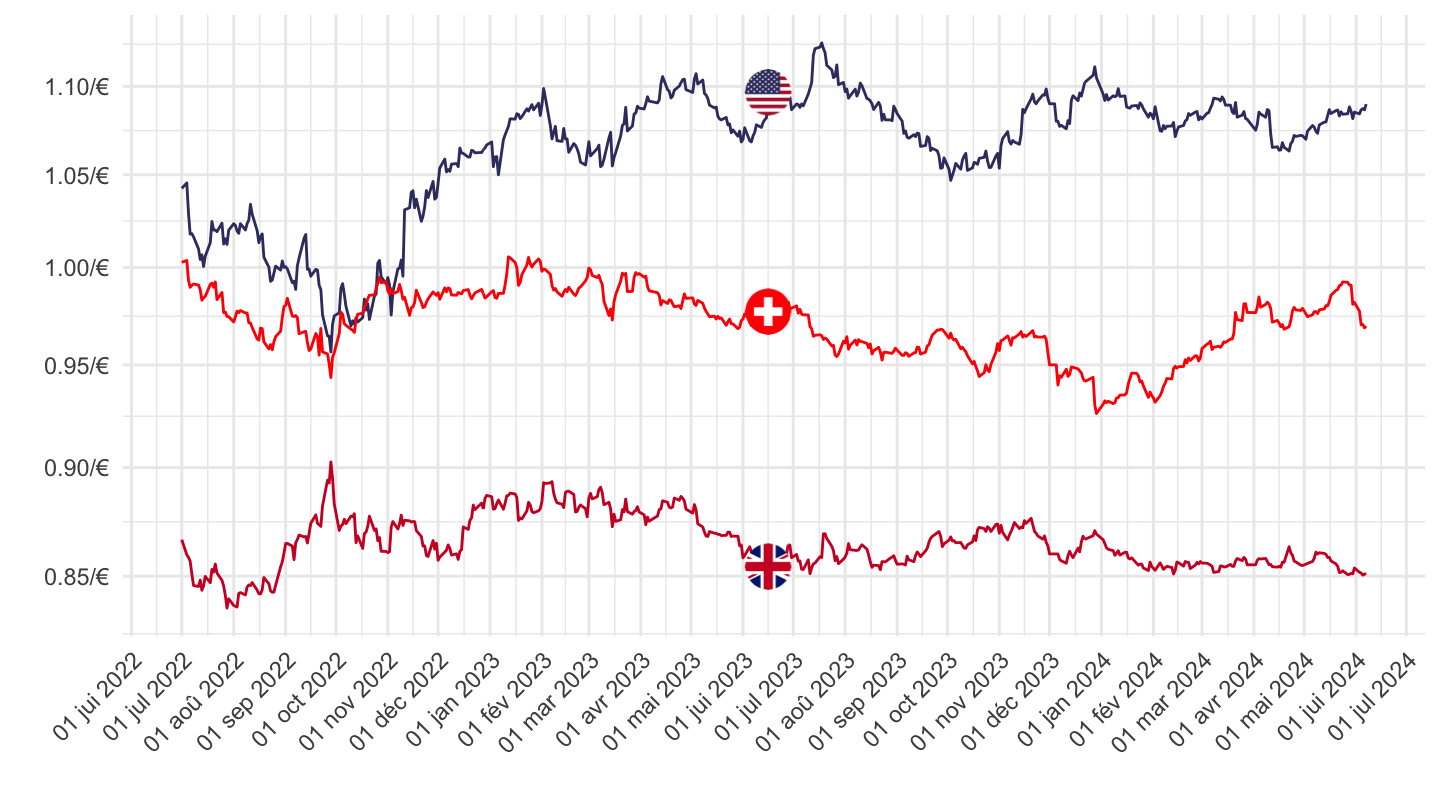
1 year
Code
ert_bil_eur_d %>%
  filter(currency %in% c("USD", "CHF", "GBP")) %>%

  day_to_date %>%
  filter(date >= Sys.Date() - years(1)) %>%
  mutate(Geo = case_when(currency == "USD" ~ "United States",
                         currency == "CHF" ~ "Switzerland",
                         currency == "GBP" ~ "United Kingdom")) %>%
  left_join(colors, by = c("Geo" = "country")) %>%
  ggplot + geom_line(aes(x = date, y = values, color = color)) +
  scale_color_identity() + theme_minimal()  + add_3flags +
  scale_x_date(breaks = "1 month",
               labels = date_format("%d %b %Y")) +
  theme(axis.text.x = element_text(angle = 45, vjust = 1, hjust = 1)) +
  xlab("") + ylab("") +
  scale_y_log10(breaks = seq(0, 10, 0.05),
                     labels = dollar_format(p = "", su = "/€")) +
  geom_label(data = . %>% filter(max(date) == date),
             aes(x = date, y = values, label = round(values, 3), color = color))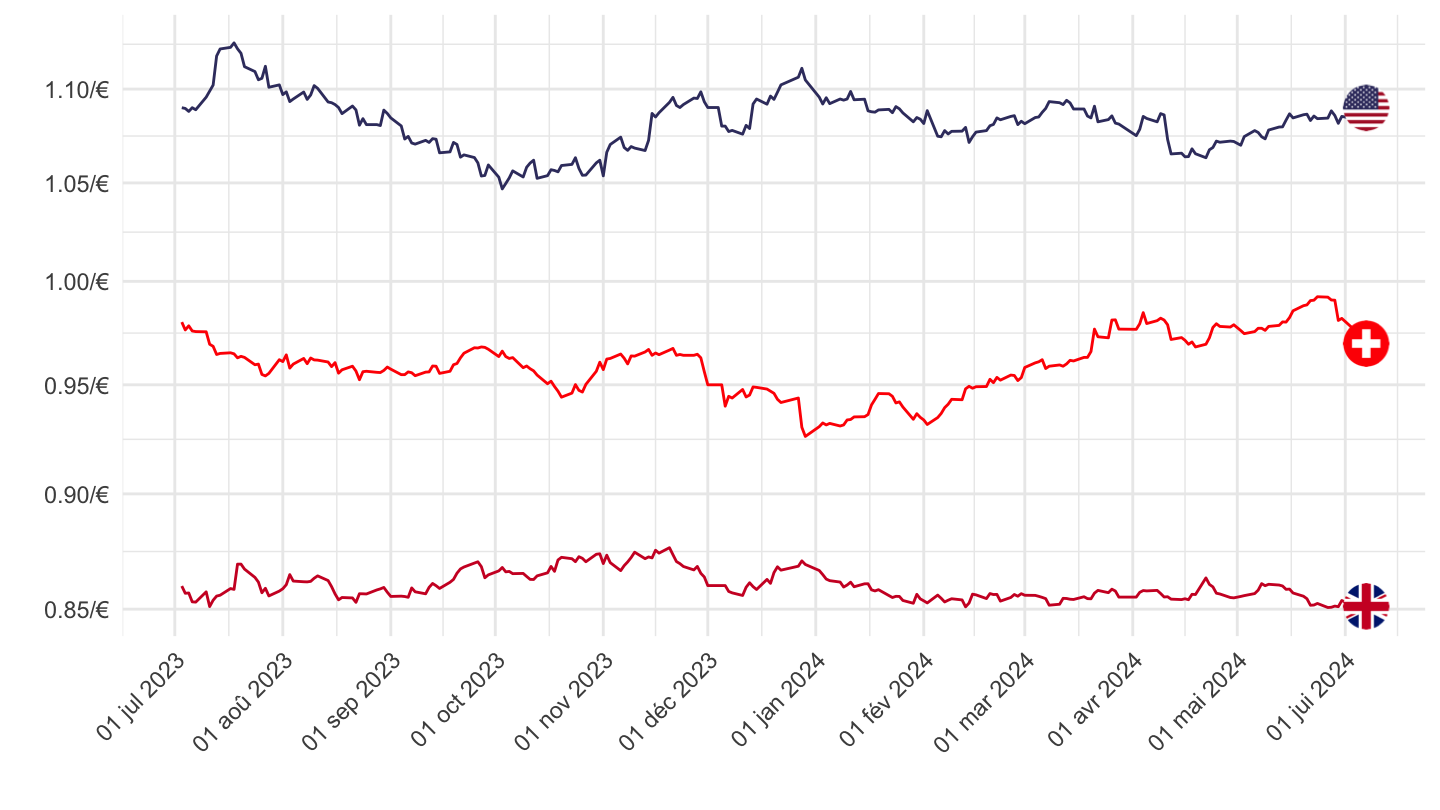
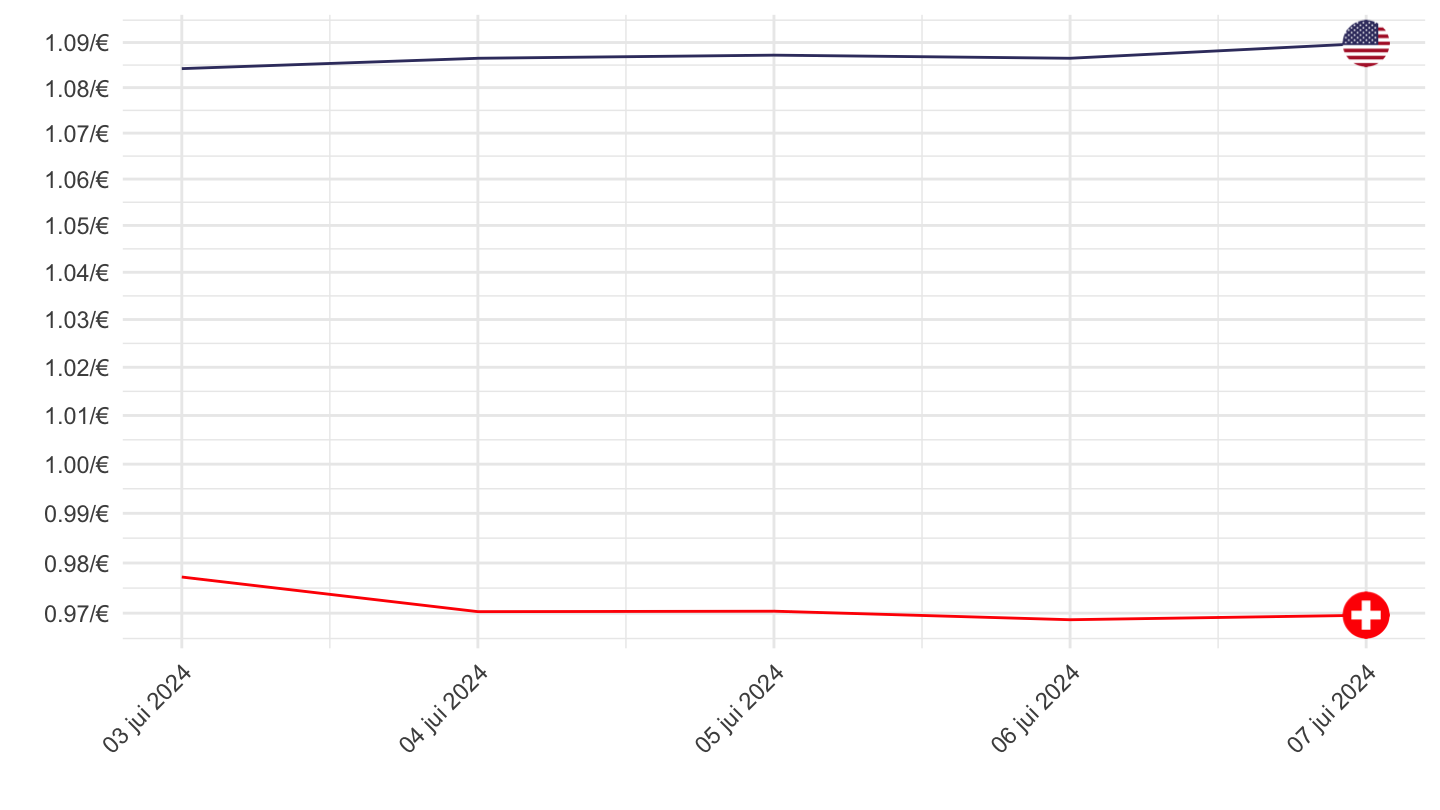
1 month
Code
ert_bil_eur_d %>%
  filter(currency %in% c("USD", "CHF", "GBP")) %>%

  day_to_date %>%
  filter(date >= Sys.Date() - months(1)) %>%
  mutate(Geo = case_when(currency == "USD" ~ "United States",
                         currency == "CHF" ~ "Switzerland",
                         currency == "GBP" ~ "United Kingdom")) %>%
  left_join(colors, by = c("Geo" = "country")) %>%
  ggplot + geom_line(aes(x = date, y = values, color = color)) +
  scale_color_identity() + theme_minimal()  + add_3flags +
  scale_x_date(breaks = "1 day",
               labels = date_format("%d %b %Y")) +
  theme(axis.text.x = element_text(angle = 45, vjust = 1, hjust = 1)) +
  xlab("") + ylab("") +
  scale_y_log10(breaks = seq(0, 10, 0.02),
                     labels = dollar_format(p = "", su = "/€")) +
  geom_label(data = . %>% filter(max(date) == date),
             aes(x = date, y = values, label = round(values, 3), color = color))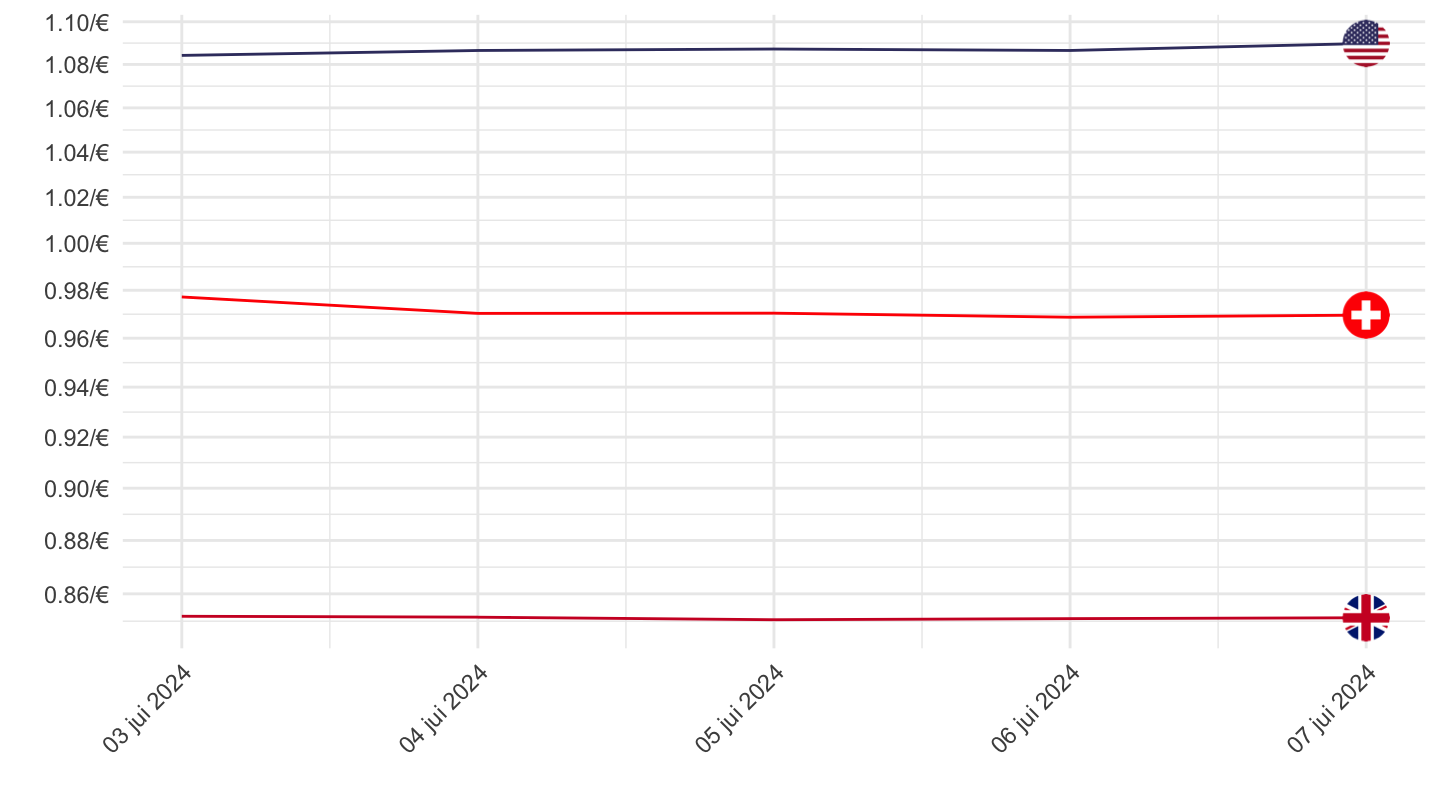
NOK, CHF
All
Code
ert_bil_eur_d %>%
  filter(currency %in% c("NOK", "CHF")) %>%

  day_to_date %>%
  mutate(Geo = case_when(currency == "NOK" ~ "Norway",
                         currency == "CHF" ~ "Switzerland")) %>%
  left_join(colors, by = c("Geo" = "country")) %>%
  ggplot + geom_line(aes(x = date, y = values, color = color)) +
  scale_color_identity() + theme_minimal()  + add_2flags +
  scale_x_date(breaks = as.Date(paste0(seq(1960, 2100, 5), "-01-01")),
               labels = date_format("%Y")) +
  xlab("") + ylab("") +
  scale_y_log10(breaks = seq(0, 10, 0.5),
                     labels = dollar_format(p = "", su = "/€")) +
  geom_label(data = . %>% filter(max(date) == date),
             aes(x = date, y = values, label = round(values, 3), color = color))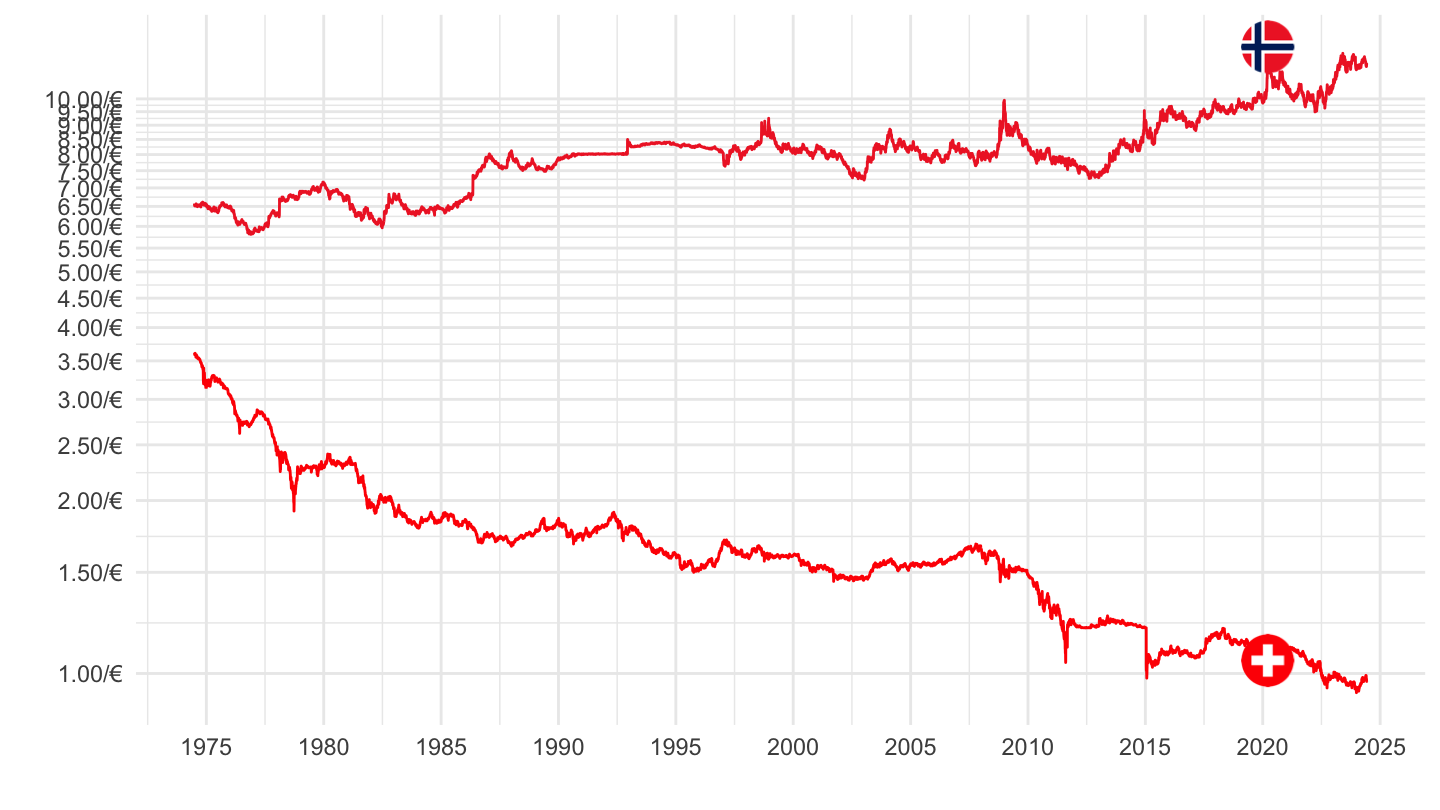
10 years
Code
ert_bil_eur_d %>%
  filter(currency %in% c("NOK", "CHF")) %>%

  day_to_date %>%
  filter(date >= Sys.Date() - years(10)) %>%
  mutate(Geo = case_when(currency == "NOK" ~ "Norway",
                         currency == "CHF" ~ "Switzerland")) %>%
  left_join(colors, by = c("Geo" = "country")) %>%
  group_by(currency) %>%
  arrange(date) %>%
  mutate(values = 100*values/values[1]) %>%
  ggplot + geom_line(aes(x = date, y = values, color = color)) +
  scale_color_identity() + theme_minimal()  + add_2flags +
  scale_x_date(breaks = as.Date(paste0(seq(1960, 2100, 1), "-01-01")),
               labels = date_format("%Y")) +
  #theme(axis.text.x = element_text(angle = 45, vjust = 1, hjust = 1)) +
  xlab("") + ylab("") +
  scale_y_log10(breaks = seq(0, 10, 0.05),
                     labels = dollar_format(p = "", su = "/€")) +
  geom_label(data = . %>% filter(max(date) == date),
             aes(x = date, y = values, label = round(values, 3), color = color))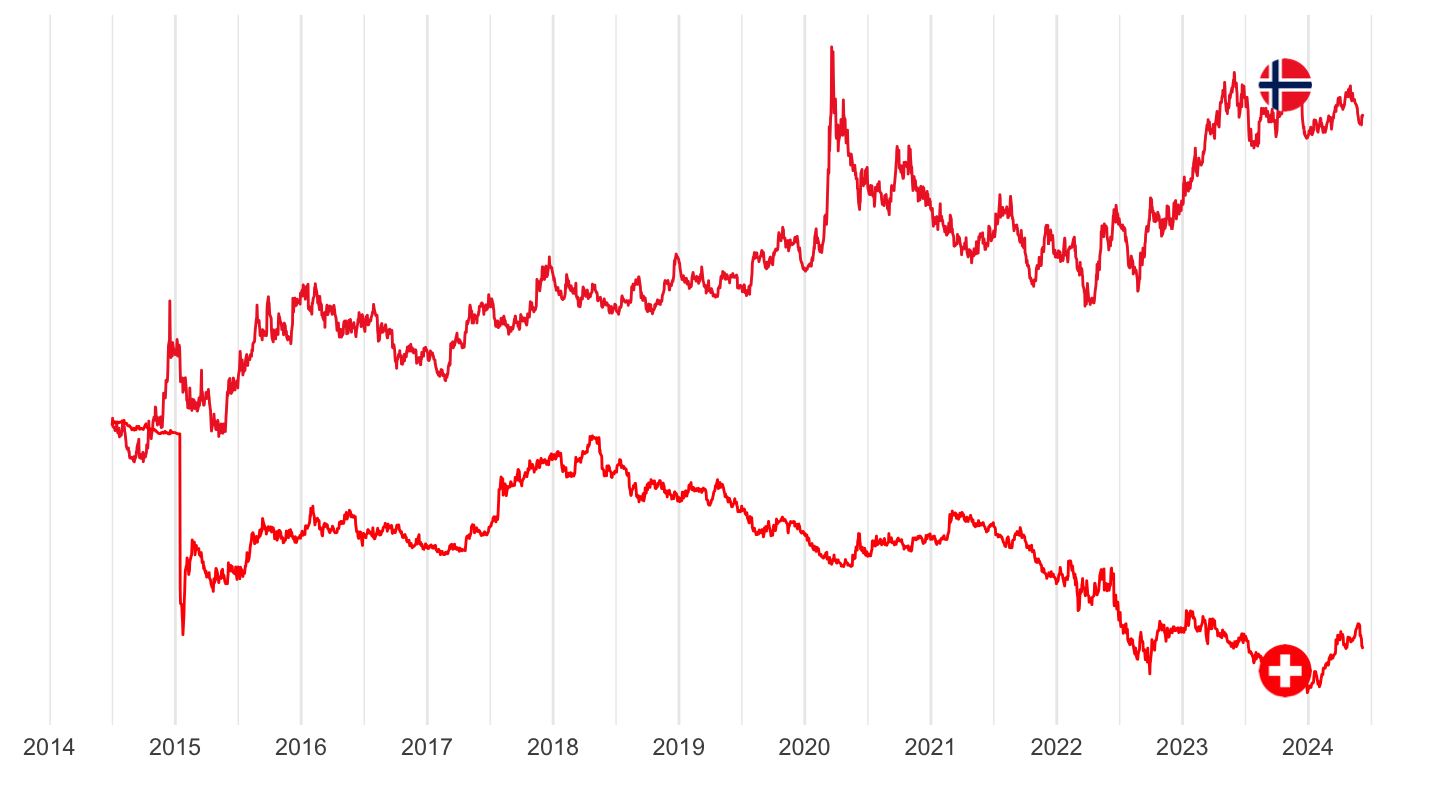
2 years
Code
ert_bil_eur_d %>%
  filter(currency %in% c("NOK", "CHF")) %>%

  day_to_date %>%
  filter(date >= Sys.Date() - years(2)) %>%
  mutate(Geo = case_when(currency == "NOK" ~ "Norway",
                         currency == "CHF" ~ "Switzerland")) %>%
  left_join(colors, by = c("Geo" = "country")) %>%
  mutate(color = ifelse(Geo == "Norway", color2, color)) %>%
  group_by(currency) %>%
  arrange(date) %>%
  mutate(values = 100*values/values[1]) %>%
  ggplot + geom_line(aes(x = date, y = values, color = color)) +
  scale_color_identity() + theme_minimal()  + add_2flags +
  scale_x_date(breaks = "1 month",
               labels = date_format("%b %Y")) +
  theme(axis.text.x = element_text(angle = 45, vjust = 1, hjust = 1)) +
  xlab("") + ylab("") +
  scale_y_log10(breaks = seq(10, 400, 5)) +
  geom_label(data = . %>% filter(max(date) == date),
             aes(x = date, y = values, label = round(values, 3), color = color))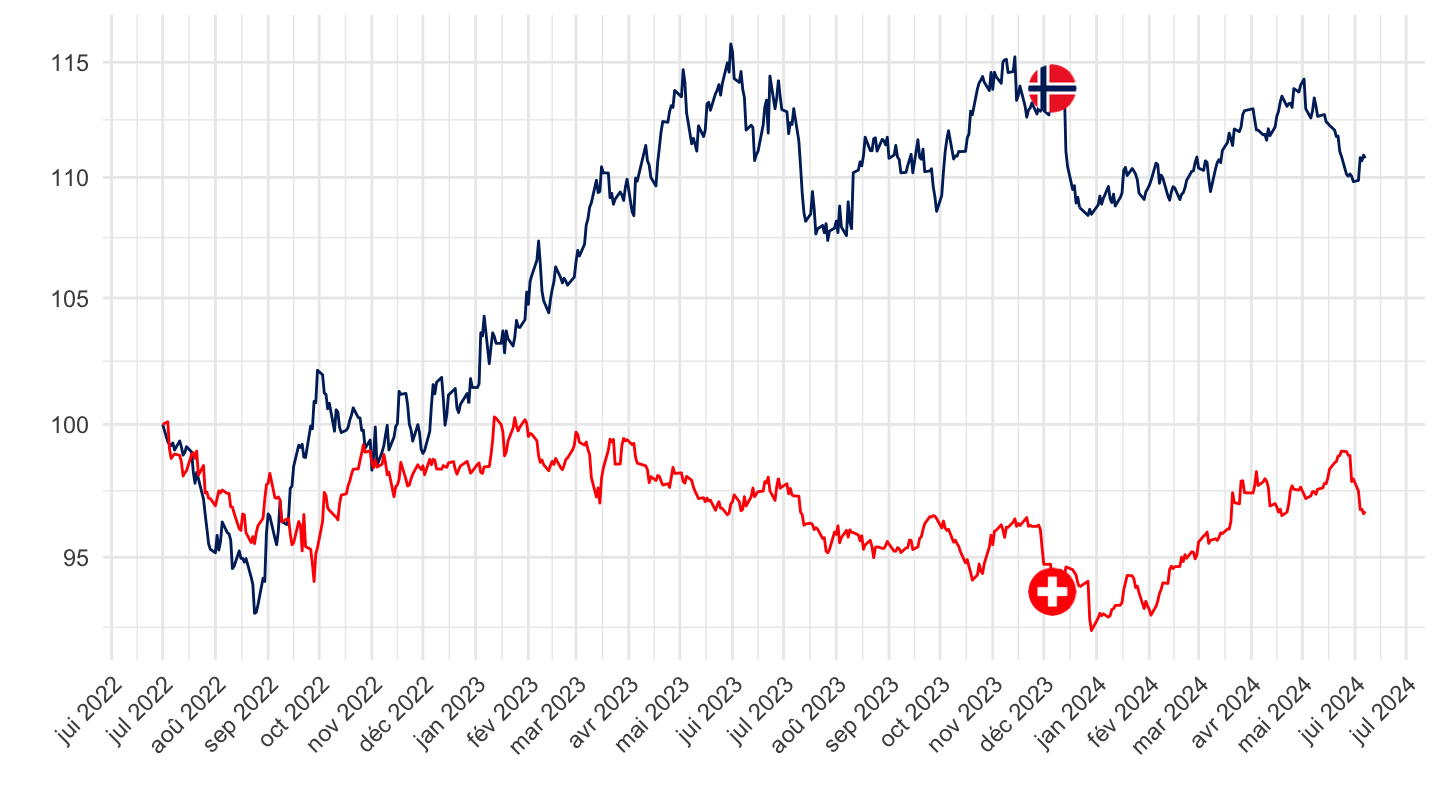
USD, CHF
All
Code
ert_bil_eur_d %>%
  filter(currency %in% c("USD", "CHF")) %>%

  day_to_date %>%
  mutate(Geo = case_when(currency == "USD" ~ "United States",
                         currency == "CHF" ~ "Switzerland")) %>%
  left_join(colors, by = c("Geo" = "country")) %>%
  ggplot + geom_line(aes(x = date, y = values, color = color)) +
  scale_color_identity() + theme_minimal()  + add_2flags +
  scale_x_date(breaks = as.Date(paste0(seq(1960, 2100, 5), "-01-01")),
               labels = date_format("%Y")) +
  xlab("") + ylab("") +
  scale_y_log10(breaks = seq(0, 10, 0.5),
                     labels = dollar_format(p = "", su = "/€")) +
  geom_label(data = . %>% filter(max(date) == date),
             aes(x = date, y = values, label = round(values, 3), color = color))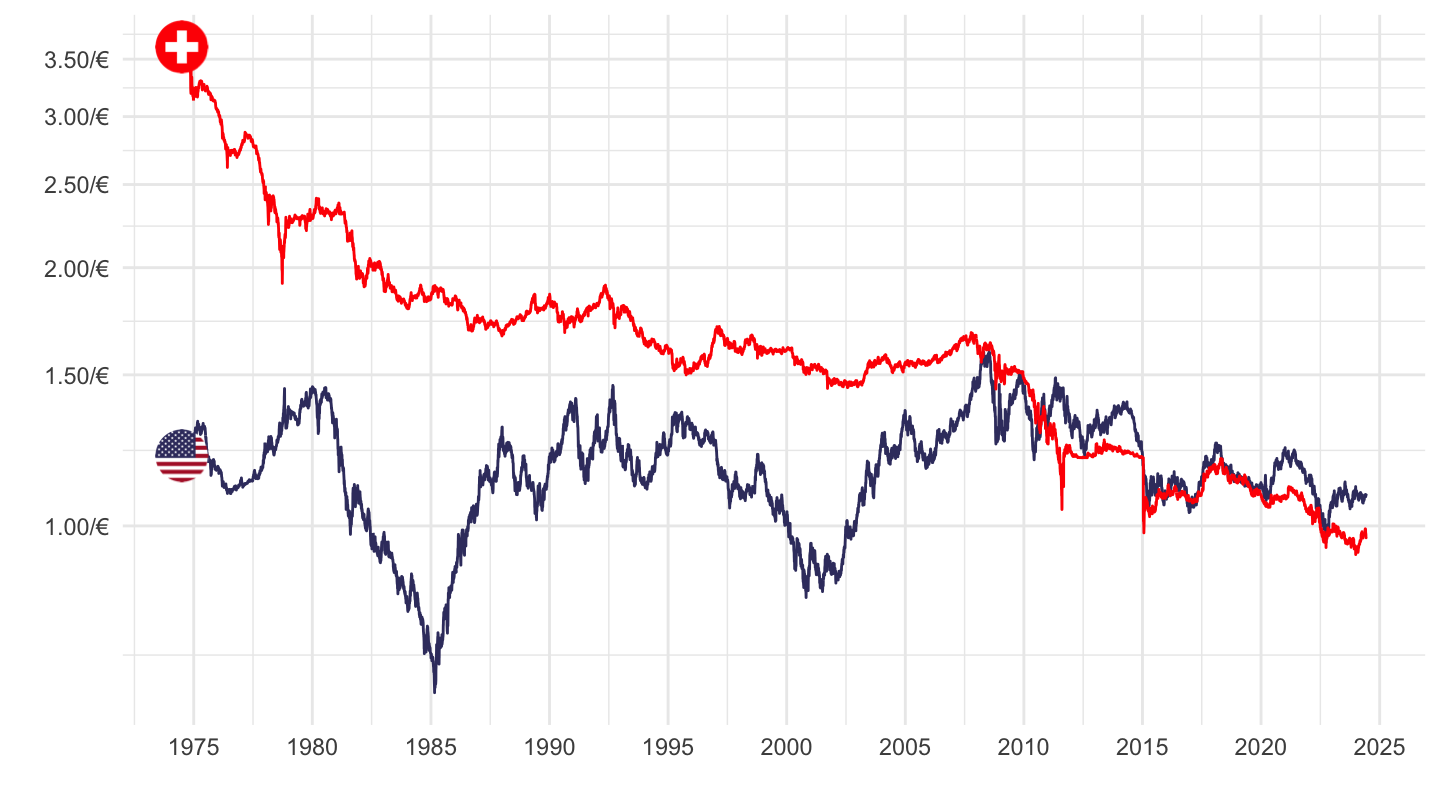
2013-2017
Code
ert_bil_eur_d %>%
  filter(currency %in% c("USD", "CHF")) %>%

  day_to_date %>%
  filter(date >= as.Date("2013-01-01"),
         date <= as.Date("2018-01-01")) %>%
  mutate(Geo = case_when(currency == "USD" ~ "United States",
                         currency == "CHF" ~ "Switzerland")) %>%
  left_join(colors, by = c("Geo" = "country")) %>%
  ggplot + geom_line(aes(x = date, y = values, color = color)) +
  scale_color_identity() + theme_minimal()  + add_2flags +
  scale_x_date(breaks = as.Date(paste0(seq(1960, 2100, 1), "-01-01")),
               labels = date_format("%Y")) +
  xlab("") + ylab("") +
  scale_y_log10(breaks = seq(0, 10, 0.05),
                     labels = dollar_format(p = "", su = "/€", acc = 0.01)) +
  geom_label(data = . %>% filter(max(date) == date),
             aes(x = date, y = values, label = round(values, 3), color = color))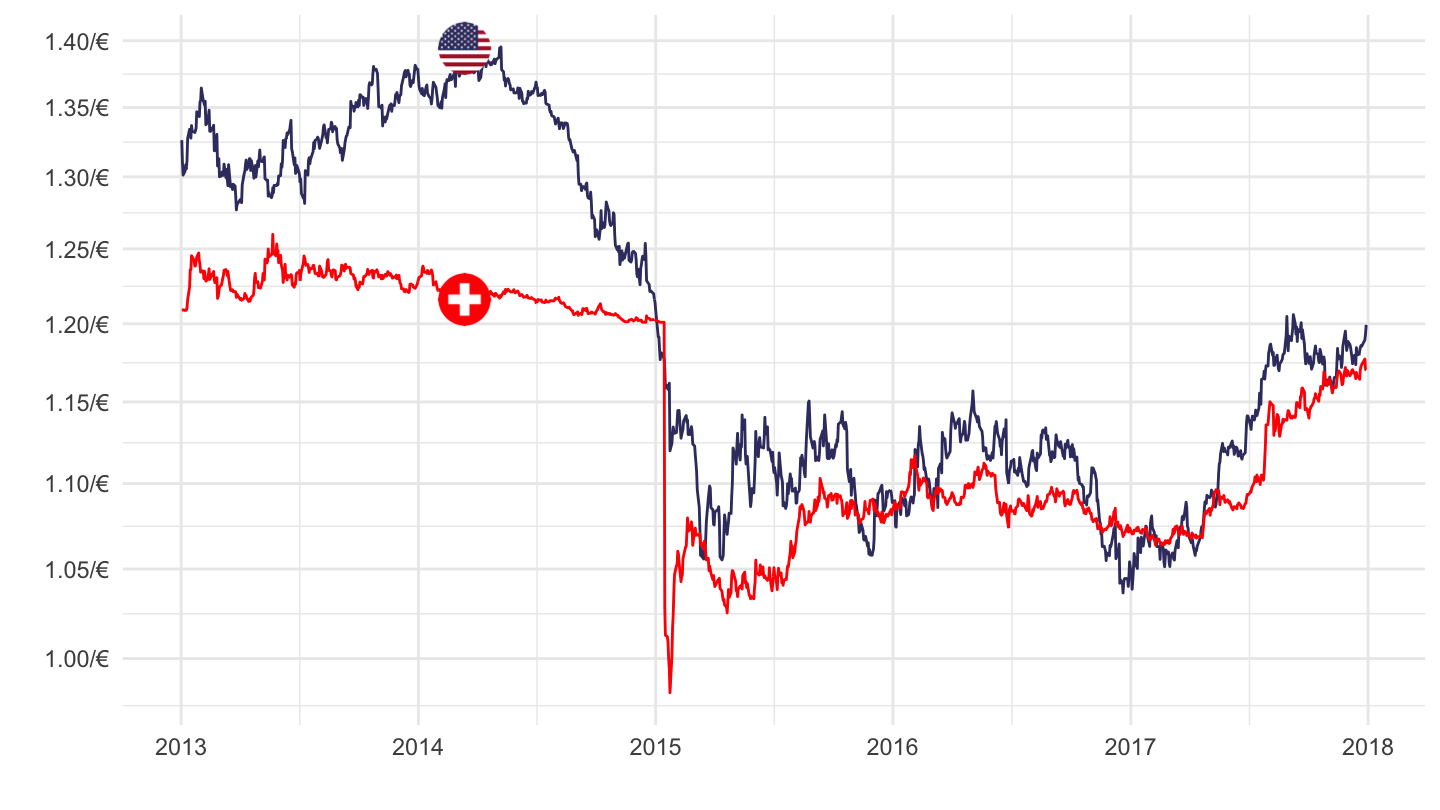
2014-2015
Code
ert_bil_eur_d %>%
  filter(currency %in% c("USD", "CHF")) %>%

  day_to_date %>%
  filter(date >= as.Date("2014-07-01"),
         date <= as.Date("2015-07-01")) %>%
  mutate(Geo = case_when(currency == "USD" ~ "United States",
                         currency == "CHF" ~ "Switzerland")) %>%
  left_join(colors, by = c("Geo" = "country")) %>%
  ggplot + geom_line(aes(x = date, y = values, color = color)) +
  scale_color_identity() + theme_minimal()  + add_2flags +
  scale_x_date(breaks = "1 month",
               labels = date_format("%b %Y")) +
  theme(axis.text.x = element_text(angle = 45, vjust = 1, hjust = 1)) +
  xlab("") + ylab("") +
  scale_y_log10(breaks = seq(0, 10, 0.05),
                     labels = dollar_format(p = "", su = "/€", acc = 0.01)) +
  geom_label(data = . %>% filter(max(date) == date),
             aes(x = date, y = values, label = round(values, 3), color = color))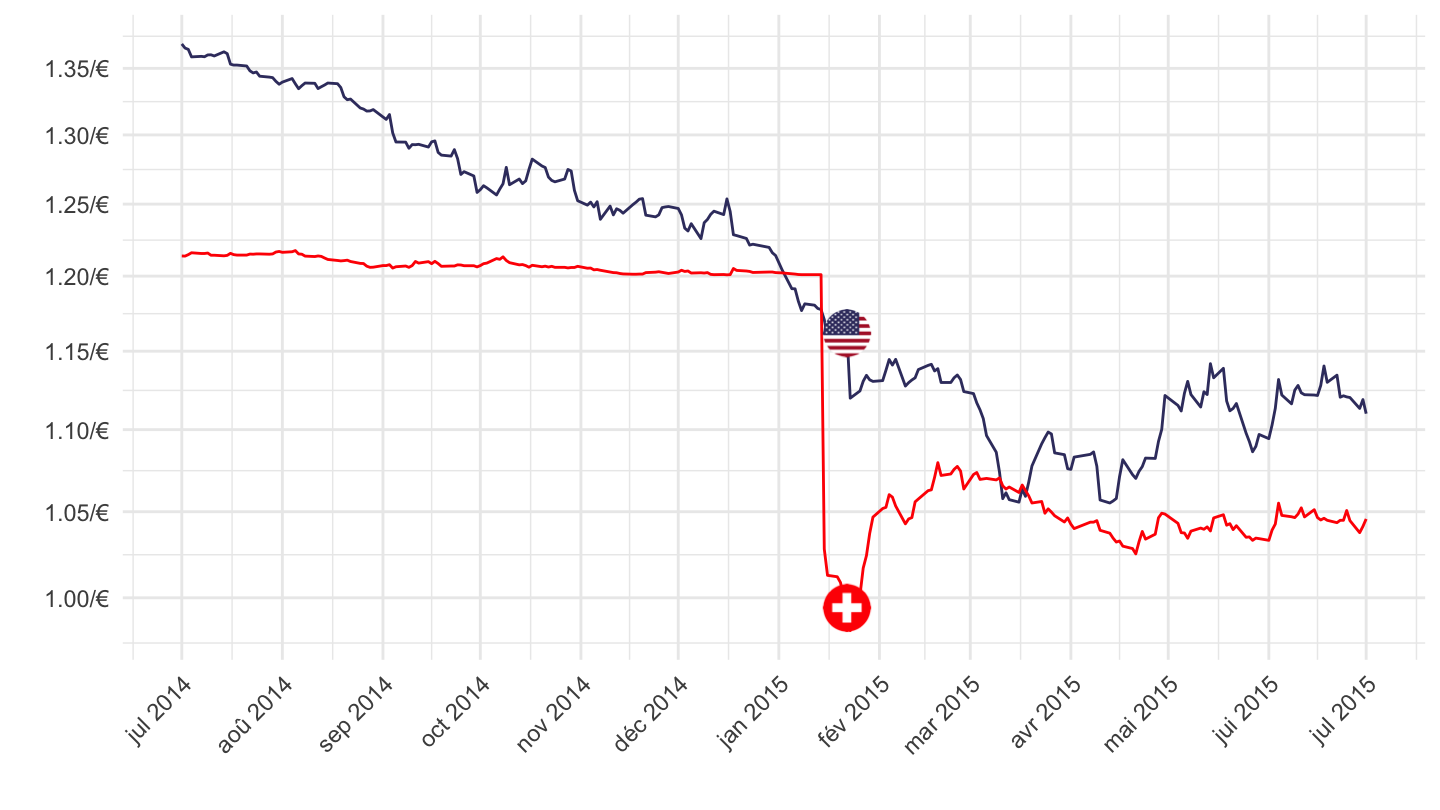
2007-
Code
ert_bil_eur_d %>%
  filter(currency %in% c("USD", "CHF")) %>%

  day_to_date %>%
  filter(date >= as.Date("2007-01-01")) %>%
  mutate(Geo = case_when(currency == "USD" ~ "United States",
                         currency == "CHF" ~ "Switzerland")) %>%
  left_join(colors, by = c("Geo" = "country")) %>%
  ggplot + geom_line(aes(x = date, y = values, color = color)) +
  scale_color_identity() + theme_minimal()  + add_2flags +
  scale_x_date(breaks = as.Date(paste0(seq(1960, 2100, 1), "-01-01")),
               labels = date_format("%Y")) +
  #theme(axis.text.x = element_text(angle = 45, vjust = 1, hjust = 1)) +
  xlab("") + ylab("") +
  theme(axis.text.x = element_text(angle = 45, vjust = 1, hjust = 1)) +
  scale_y_log10(breaks = seq(0, 10, 0.05),
                     labels = dollar_format(p = "", su = "/€")) +
  geom_label(data = . %>% filter(max(date) == date),
             aes(x = date, y = values, label = round(values, 3), color = color))
2013-
Code
ert_bil_eur_d %>%
  filter(currency %in% c("USD", "CHF")) %>%

  day_to_date %>%
  filter(date >= as.Date("2013-01-01")) %>%
  mutate(Geo = case_when(currency == "USD" ~ "United States",
                         currency == "CHF" ~ "Switzerland")) %>%
  left_join(colors, by = c("Geo" = "country")) %>%
  ggplot + geom_line(aes(x = date, y = values, color = color)) +
  scale_color_identity() + theme_minimal()  + add_2flags +
  scale_x_date(breaks = as.Date(paste0(seq(1960, 2100, 1), "-01-01")),
               labels = date_format("%Y")) +
  #theme(axis.text.x = element_text(angle = 45, vjust = 1, hjust = 1)) +
  xlab("") + ylab("") +
  theme(axis.text.x = element_text(angle = 45, vjust = 1, hjust = 1)) +
  scale_y_log10(breaks = seq(0, 10, 0.05),
                     labels = dollar_format(p = "", su = "/€")) +
  geom_label(data = . %>% filter(max(date) == date),
             aes(x = date, y = values, label = round(values, 3), color = color))
10 years
Code
ert_bil_eur_d %>%
  filter(currency %in% c("USD", "CHF")) %>%

  day_to_date %>%
  filter(date >= Sys.Date() - years(10)) %>%
  mutate(Geo = case_when(currency == "USD" ~ "United States",
                         currency == "CHF" ~ "Switzerland")) %>%
  left_join(colors, by = c("Geo" = "country")) %>%
  ggplot + geom_line(aes(x = date, y = values, color = color)) +
  scale_color_identity() + theme_minimal()  + add_2flags +
  scale_x_date(breaks = as.Date(paste0(seq(1960, 2100, 1), "-01-01")),
               labels = date_format("%Y")) +
  #theme(axis.text.x = element_text(angle = 45, vjust = 1, hjust = 1)) +
  xlab("") + ylab("") +
  scale_y_log10(breaks = seq(0, 10, 0.05),
                     labels = dollar_format(p = "", su = "/€")) +
  geom_label(data = . %>% filter(max(date) == date),
             aes(x = date, y = values, label = round(values, 3), color = color))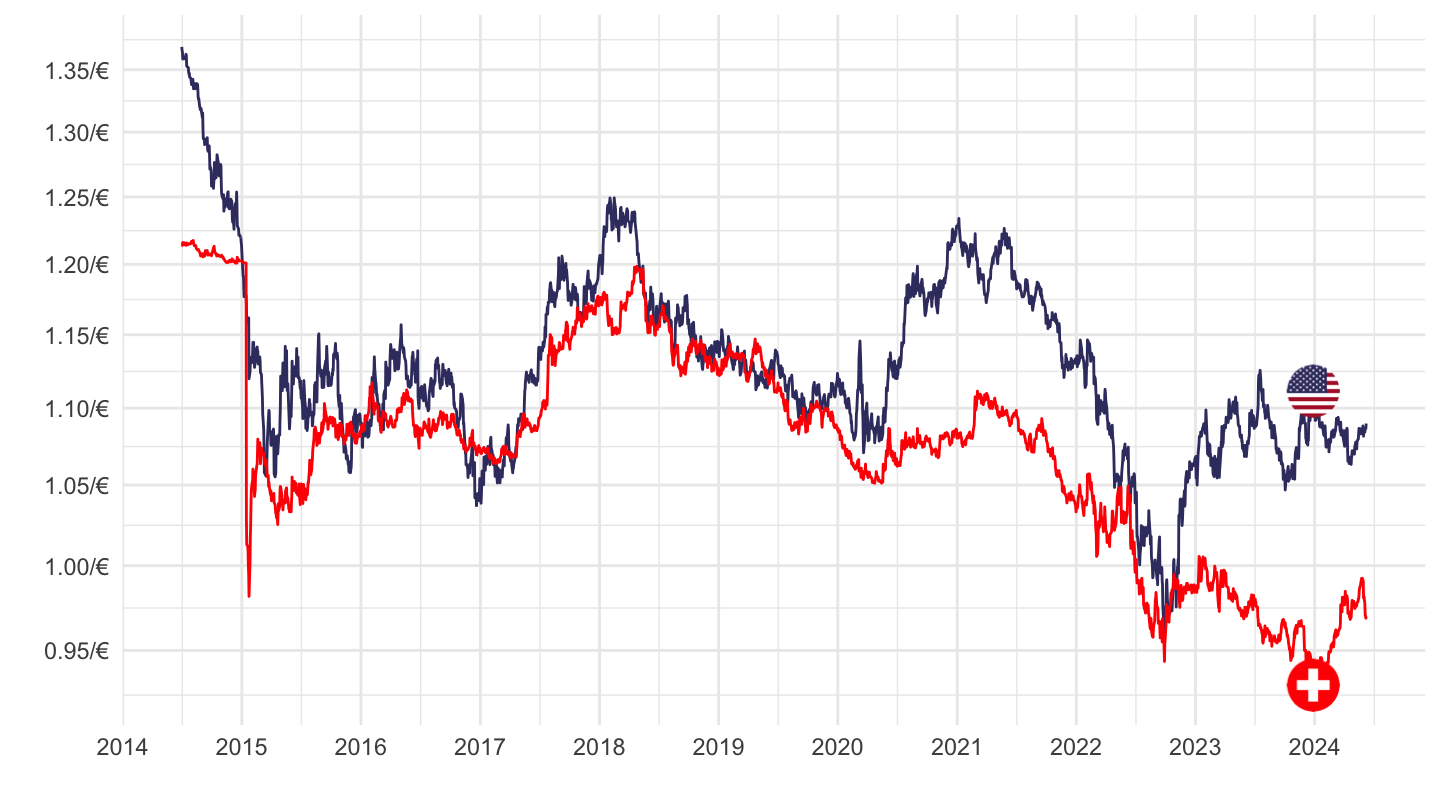
2 years
Code
ert_bil_eur_d %>%
  filter(currency %in% c("USD", "CHF")) %>%

  day_to_date %>%
  filter(date >= Sys.Date() - years(2)) %>%
  mutate(Geo = case_when(currency == "USD" ~ "United States",
                         currency == "CHF" ~ "Switzerland")) %>%
  left_join(colors, by = c("Geo" = "country")) %>%
  ggplot + geom_line(aes(x = date, y = values, color = color)) +
  scale_color_identity() + theme_minimal()  + add_2flags +
  scale_x_date(breaks = "1 month",
               labels = date_format("%d %b %Y")) +
  theme(axis.text.x = element_text(angle = 45, vjust = 1, hjust = 1)) +
  xlab("") + ylab("") +
  scale_y_log10(breaks = seq(0, 10, 0.01),
                     labels = dollar_format(p = "", su = "/€")) +
  geom_label(data = . %>% filter(max(date) == date),
             aes(x = date, y = values, label = round(values, 3), color = color))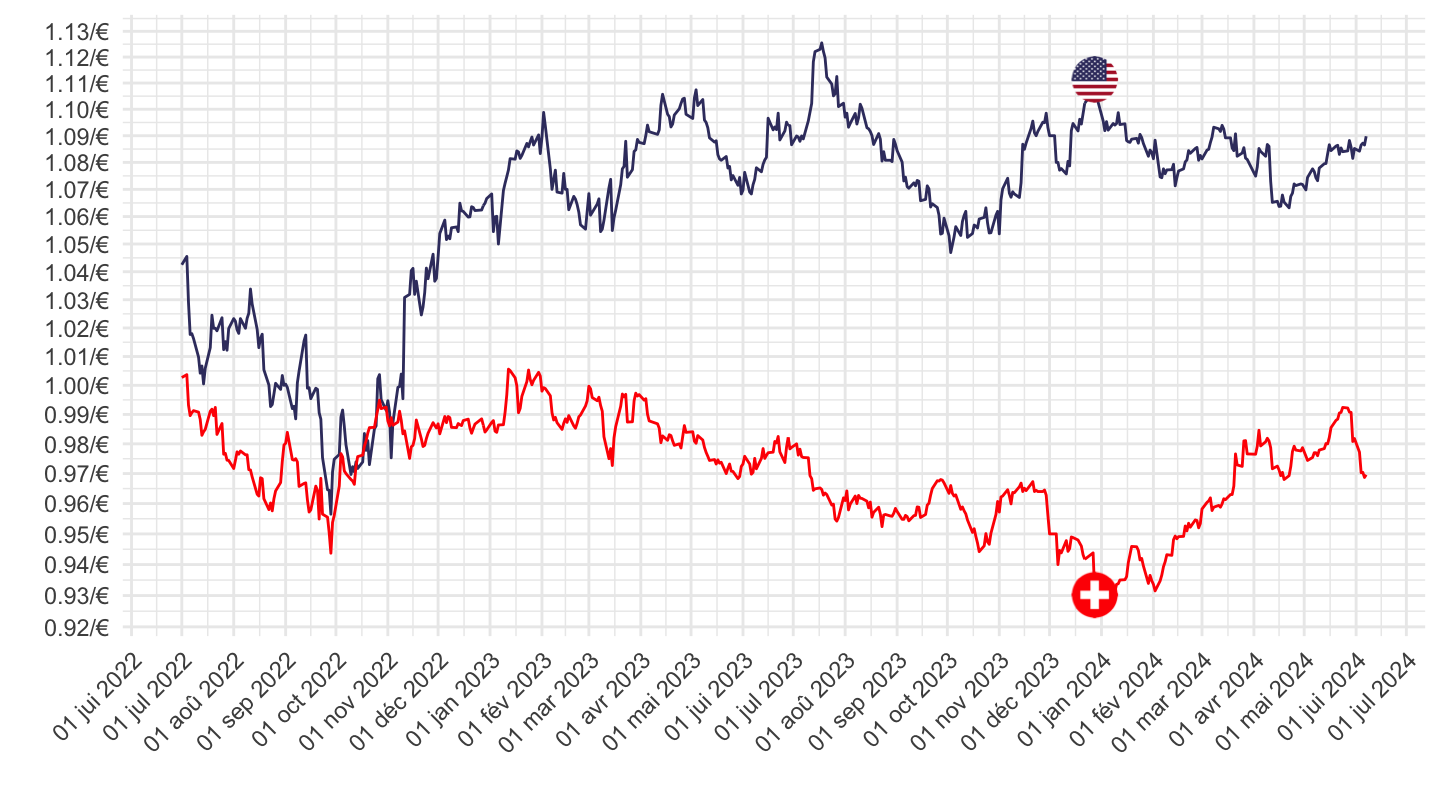
1 year
Code
ert_bil_eur_d %>%
  filter(currency %in% c("USD", "CHF")) %>%

  day_to_date %>%
  filter(date >= Sys.Date() - years(1)) %>%
  mutate(Geo = case_when(currency == "USD" ~ "United States",
                         currency == "CHF" ~ "Switzerland")) %>%
  left_join(colors, by = c("Geo" = "country")) %>%
  ggplot + geom_line(aes(x = date, y = values, color = color)) +
  scale_color_identity() + theme_minimal()  + add_2flags +
  scale_x_date(breaks = "1 month",
               labels = date_format("%d %b %Y")) +
  theme(axis.text.x = element_text(angle = 45, vjust = 1, hjust = 1)) +
  xlab("") + ylab("") +
  scale_y_log10(breaks = seq(0, 10, 0.01),
                     labels = dollar_format(p = "", su = "/€")) +
  geom_label(data = . %>% filter(max(date) == date),
             aes(x = date, y = values, label = round(values, 3), color = color))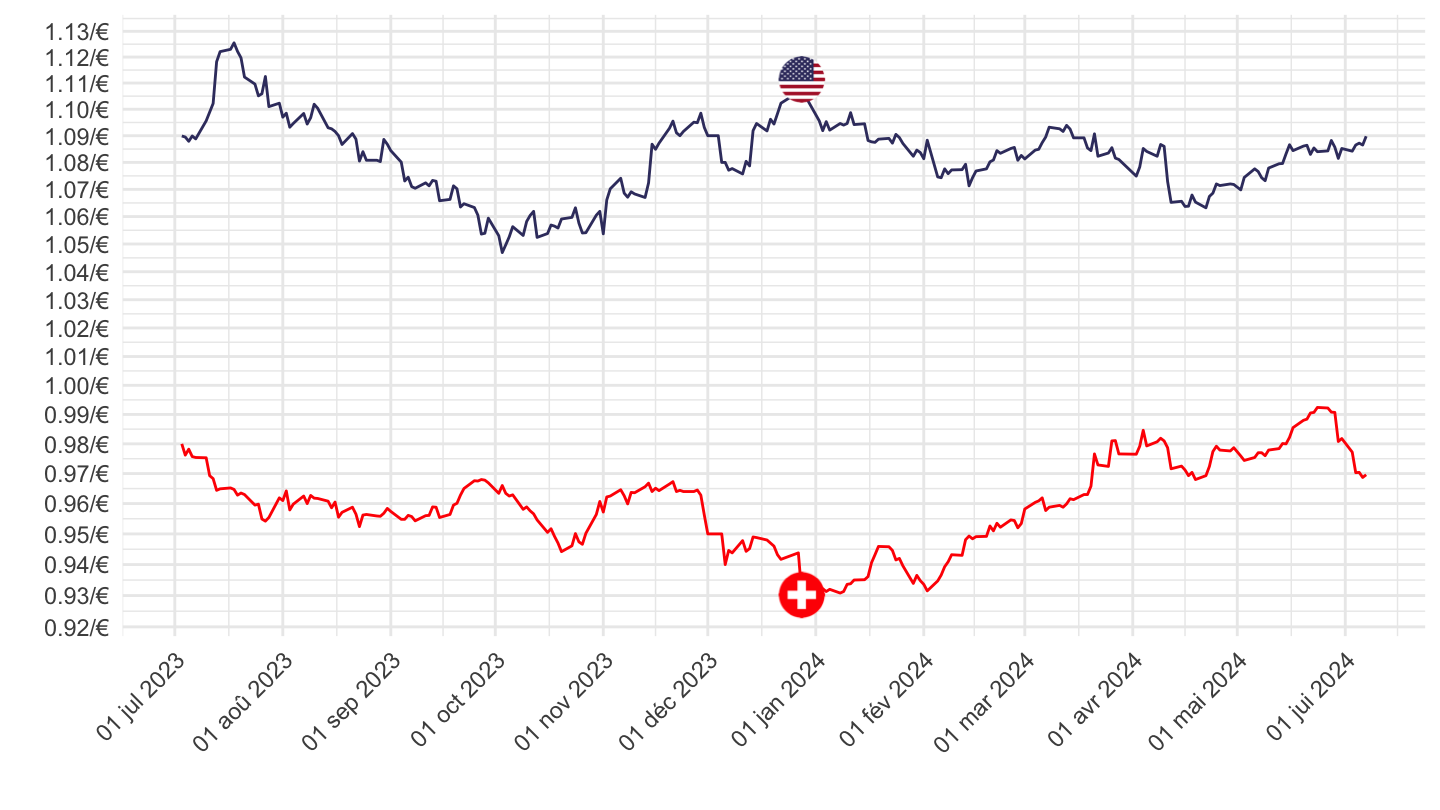
1 month
Code
ert_bil_eur_d %>%
  filter(currency %in% c("USD", "CHF")) %>%

  day_to_date %>%
  filter(date >= Sys.Date() - months(1)) %>%
  mutate(Geo = case_when(currency == "USD" ~ "United States",
                         currency == "CHF" ~ "Switzerland")) %>%
  left_join(colors, by = c("Geo" = "country")) %>%
  ggplot + geom_line(aes(x = date, y = values, color = color)) +
  scale_color_identity() + theme_minimal()  + add_2flags +
  scale_x_date(breaks = "1 day",
               labels = date_format("%d %b %Y")) +
  theme(axis.text.x = element_text(angle = 45, vjust = 1, hjust = 1)) +
  xlab("") + ylab("") +
  scale_y_log10(breaks = seq(0, 10, 0.01),
                     labels = dollar_format(p = "", su = "/€")) +
  geom_label(data = . %>% filter(max(date) == date),
             aes(x = date, y = values, label = round(values, 3), color = color))