
Last observation: Q1 2024 (N = 676)
First observation: Q1 1949 (N = 674)
Last data update: 09 oct. 2026, 22:20
Last compile: 10 oct. 2026, 00:51
`CNT-2014-OPERATIONS` |>
  filter(TIME_PERIOD == max(TIME_PERIOD)) |>
  select(TIME_PERIOD, TITLE_FR, OBS_VALUE) |>
  arrange(TITLE_FR) |>
print_table_conditional()`CNT-2014-OPERATIONS` |>
filter(OPERATION %in% c("P3M"),
FREQ == "T",
CNA_PRODUIT %in% c("A17-AZ", "A17-C1"),
VALORISATION == "V") |>
left_join(tibble(CNA_PRODUIT = c("A17-AZ", "A17-C1"),
Cna_produit_short = c("Agriculture",
"Industrie agro")), by = "CNA_PRODUIT") |>
mutate(Cna_produit_short = ordered(Cna_produit_short, levels = c("Agriculture",
"Industrie agro"))) |>
quarter_to_date() |>
select(Cna_produit_short, OPERATION, date, OBS_VALUE) |>
spread(OPERATION, OBS_VALUE) |>
left_join(gdp_quarterly, by = "date") |>
mutate(obsValue = P3M/gdp) |>
arrange(desc(date)) |>
filter(date >= as.Date("1970-01-01")) |>
ggplot() + geom_line(aes(x = date, y = obsValue, color = Cna_produit_short)) +
theme_minimal() + xlab("") + ylab("Consommation des ménages (% du PIB)") +
scale_x_date(breaks = seq(1940, 2100, 10) |> paste0("-01-01") |> as.Date(),
labels = date_format("%Y")) +
scale_y_continuous(breaks = 0.01*seq(-100, 500, 1),
labels = percent_format(accuracy = 1)) +
theme(legend.position = c(0.75, 0.9),
legend.title = element_blank()) +
geom_hline(yintercept = 0, linetype = "dashed")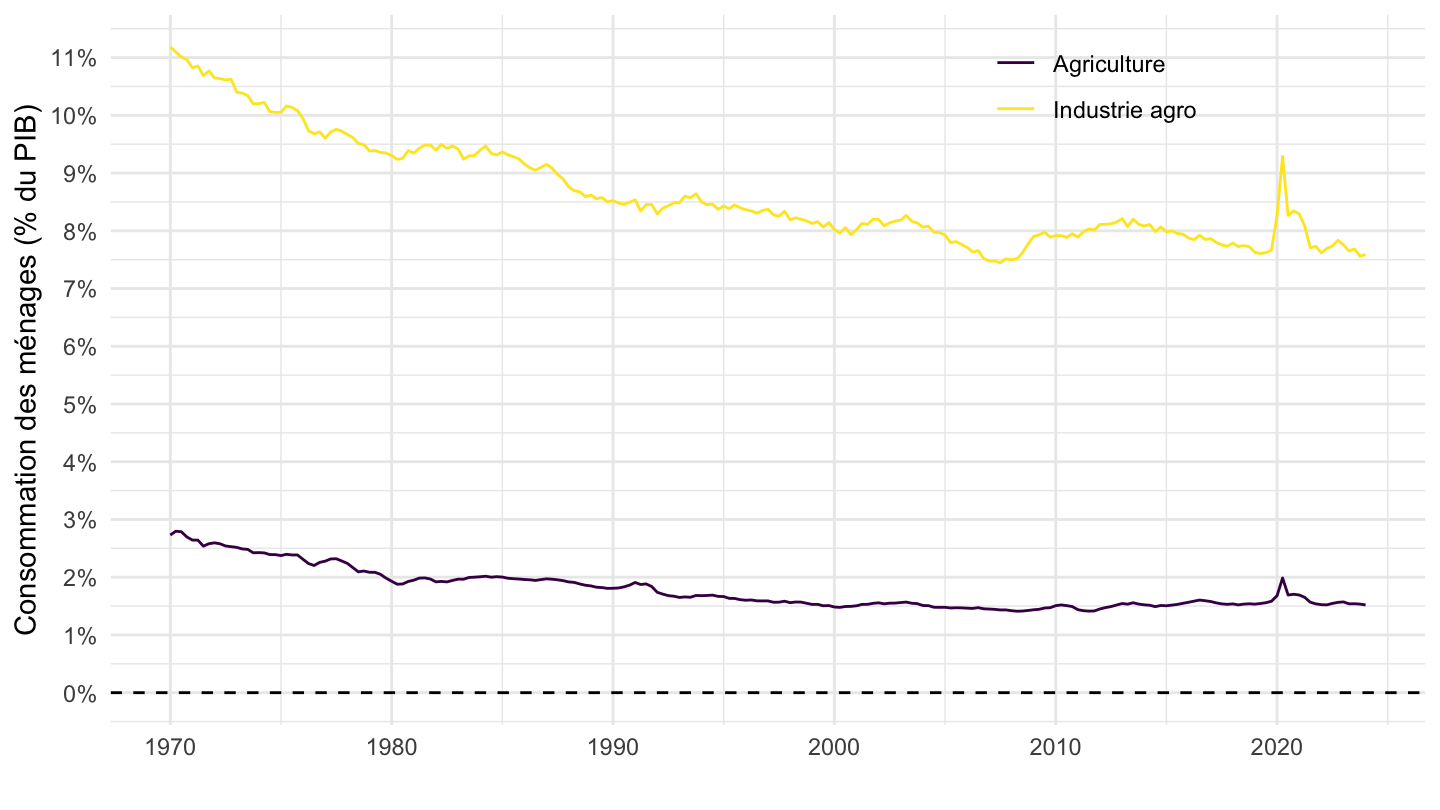
i_g("bib/insee/TEF2020/142/compte-des-relations-avec-le-RdM.png")
i_g("bib/insee/TEF2020/142/solde-exterieur-de-biens-et-de-services.png")
i_g("bib/insee/TEF2020/142/solde-des-echanges-exterieurs.png")
`CNT-2014-OPERATIONS` |>
  filter(OPERATION %in% c("P6", "P7"),
         FREQ == "T",
         VALORISATION == "V",
         TIME_PERIOD %in% c("1950-Q1", "1970-Q1", "1990-Q1", "2020-Q1")) |>

  quarter_to_date() |>
  arrange(date) |>
  select(CNA_PRODUIT, CNA_PRODUIT, OPERATION, date, OBS_VALUE) |>
  spread(OPERATION, OBS_VALUE) |>
  left_join(gdp_quarterly, by = "date") |>
  mutate(year = year(date)) |>
  transmute(CNA_PRODUIT, CNA_PRODUIT, date, value = round(100*(P6-P7)/gdp, 1)) |>
  spread(date, value) |>
print_table_conditional()| CNA_PRODUIT | 1950-01-01 | 1970-01-01 | 1990-01-01 | 2020-01-01 |
|---|---|---|---|---|
| A17-AZ | -3.3 | -0.2 | 0.5 | 0.1 |
| A17-C1 | -0.1 | -0.1 | 0.3 | 0.3 |
| A17-C2 | -0.2 | -0.1 | -0.2 | -0.8 |
| A17-C3 | 0.3 | 0.0 | -0.9 | -1.3 |
| A17-C4 | 0.8 | 0.7 | 0.9 | 0.8 |
| A17-C5 | 2.6 | 0.6 | -0.9 | -0.5 |
| A17-DE | -1.6 | -1.4 | -1.3 | -0.8 |
| A17-GZ | 0.1 | -0.1 | -0.1 | -0.1 |
| A17-HZ | 1.4 | -0.1 | -0.2 | -0.5 |
| A17-JZ | 0.0 | -0.1 | -0.2 | -0.1 |
| A17-KZ | 0.1 | 0.1 | 0.2 | 0.3 |
| A17-MN | 0.1 | 0.0 | 0.2 | 0.1 |
| A17-OQ | 0.0 | 0.0 | 0.0 | 0.0 |
| A17-PCAFAB | NA | NA | NA | NA |
| A17-PCHTR | 0.0 | 0.0 | 0.4 | 0.4 |
| A17-RU | 0.0 | 0.0 | 0.1 | 0.0 |
| DB-CNT | -1.4 | -0.5 | -1.5 | -2.3 |
| DI-CNT | 2.0 | -0.3 | -2.0 | -2.3 |
| DIM-CNT | 3.6 | 1.1 | -0.7 | -1.6 |
| DS-CNT | 1.8 | -0.1 | -0.1 | -0.3 |
| DSM-CNT | 1.8 | -0.1 | -0.1 | -0.3 |
| DSN-CNT | 0.0 | 0.0 | 0.0 | 0.0 |
`CNT-2014-OPERATIONS` |>
  filter(OPERATION %in% c("P6", "P7"),
         FREQ == "T",
         CNA_PRODUIT %in% c("DIM-CNT", "DI-CNT"),
         VALORISATION == "V") |>
  left_join(tibble(CNA_PRODUIT = c("DIM-CNT", "DI-CNT"),
                   Cna_produit_short = c("Balance commerciale Manuf.",
                                   "Balance commerciale Manuf. + Energie")),
            by = "CNA_PRODUIT") |>
  mutate(Cna_produit_short = ordered(Cna_produit_short, levels = c("Balance commerciale Manuf.",
                                                       "Balance commerciale Manuf. + Energie"))) |>
  quarter_to_date() |>
  select(Cna_produit_short, OPERATION, date, OBS_VALUE) |>
  spread(OPERATION, OBS_VALUE) |>
  left_join(gdp_quarterly, by = "date") |>
  mutate(obsValue = (P6-P7)/gdp) |>
  arrange(desc(date)) |>
  select(-P6, -P7, -gdp) |>
  ggplot() + geom_line(aes(x = date, y = obsValue, color = Cna_produit_short)) +
  theme_minimal() + xlab("") + ylab("Balance Commerciale (% du PIB)") +
  scale_x_date(breaks = seq(1940, 2100, 10) |> paste0("-01-01") |> as.Date(),
               labels = date_format("%Y")) +
  scale_y_continuous(breaks = 0.01*seq(-100, 500, 1),
                labels = percent_format(accuracy = 1)) +

  theme(legend.position = c(0.75, 0.9),
        legend.title = element_blank()) +
  geom_hline(yintercept = 0, linetype = "dashed")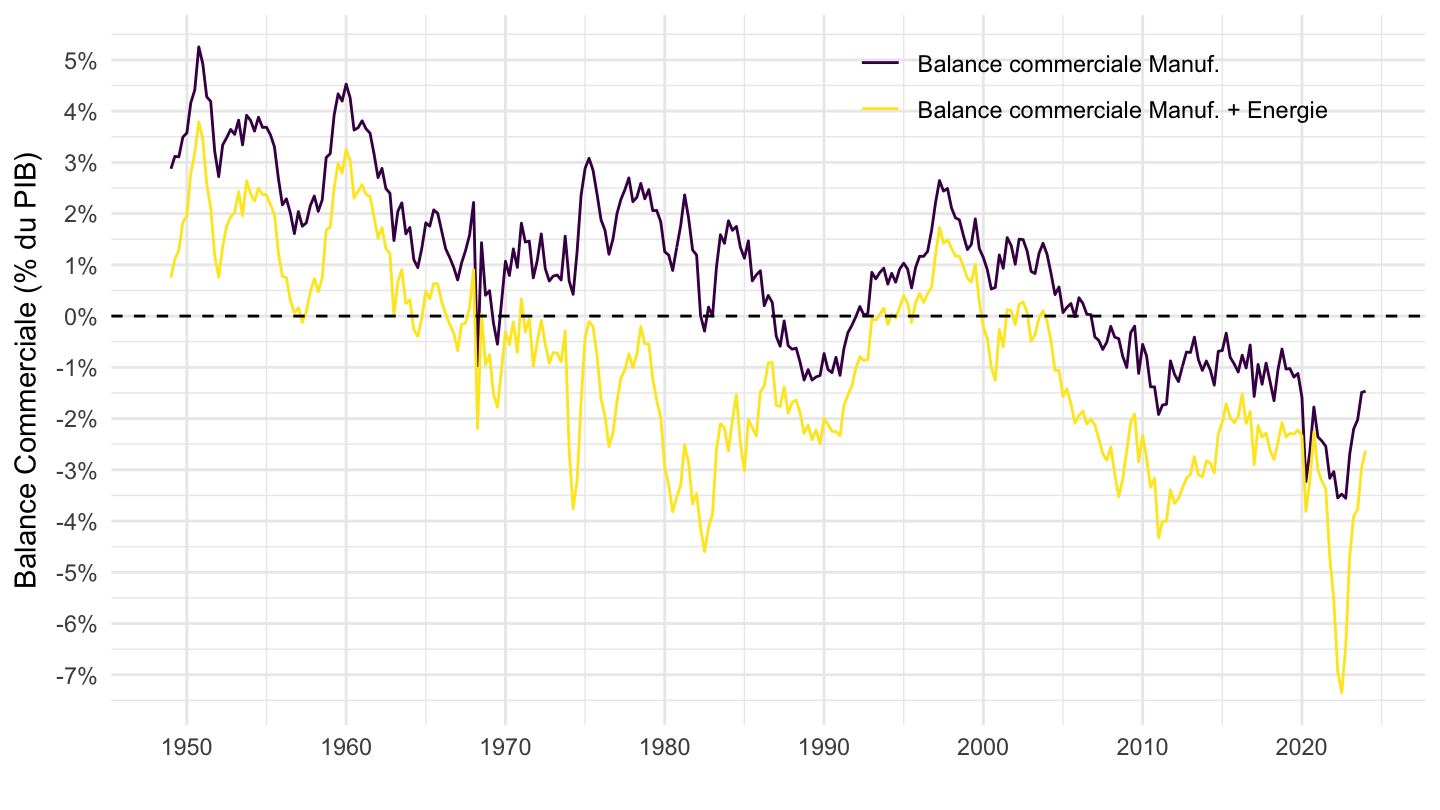
`CNT-2014-OPERATIONS` |>
  filter(OPERATION %in% c("P6", "P7"),
         FREQ == "T",
         CNA_PRODUIT %in% c("DIM-CNT", "DI-CNT"),
         VALORISATION == "V") |>
  left_join(tibble(CNA_PRODUIT = c("DIM-CNT", "DI-CNT"),
                   Cna_produit_short = c("Industrie Manufacturière",
                                   "Industrie Manufacturière + Energie")),  by = "CNA_PRODUIT") |>
  mutate(Cna_produit_short = ordered(Cna_produit_short, levels = c("Industrie Manufacturière",
                                                       "Industrie Manufacturière + Energie"))) |>
  quarter_to_date() |>
  select(Cna_produit_short, OPERATION, date, OBS_VALUE) |>
  spread(OPERATION, OBS_VALUE) |>
  left_join(gdp_quarterly, by = "date") |>
  mutate(obsValue = (P6-P7)/gdp) |>
  arrange(desc(date)) |>
  filter(date >= as.Date("1970-01-01")) |>
  ggplot() + geom_line(aes(x = date, y = obsValue, color = Cna_produit_short)) +
  theme_minimal() + xlab("") + ylab("Balance Commerciale (% du PIB)") +
  scale_x_date(breaks = seq(1940, 2100, 10) |> paste0("-01-01") |> as.Date(),
               labels = date_format("%Y")) +
  scale_y_continuous(breaks = 0.01*seq(-100, 500, 1),
                labels = percent_format(accuracy = 1)) +

  theme(legend.position = c(0.75, 0.9),
        legend.title = element_blank()) +
  geom_hline(yintercept = 0, linetype = "dashed")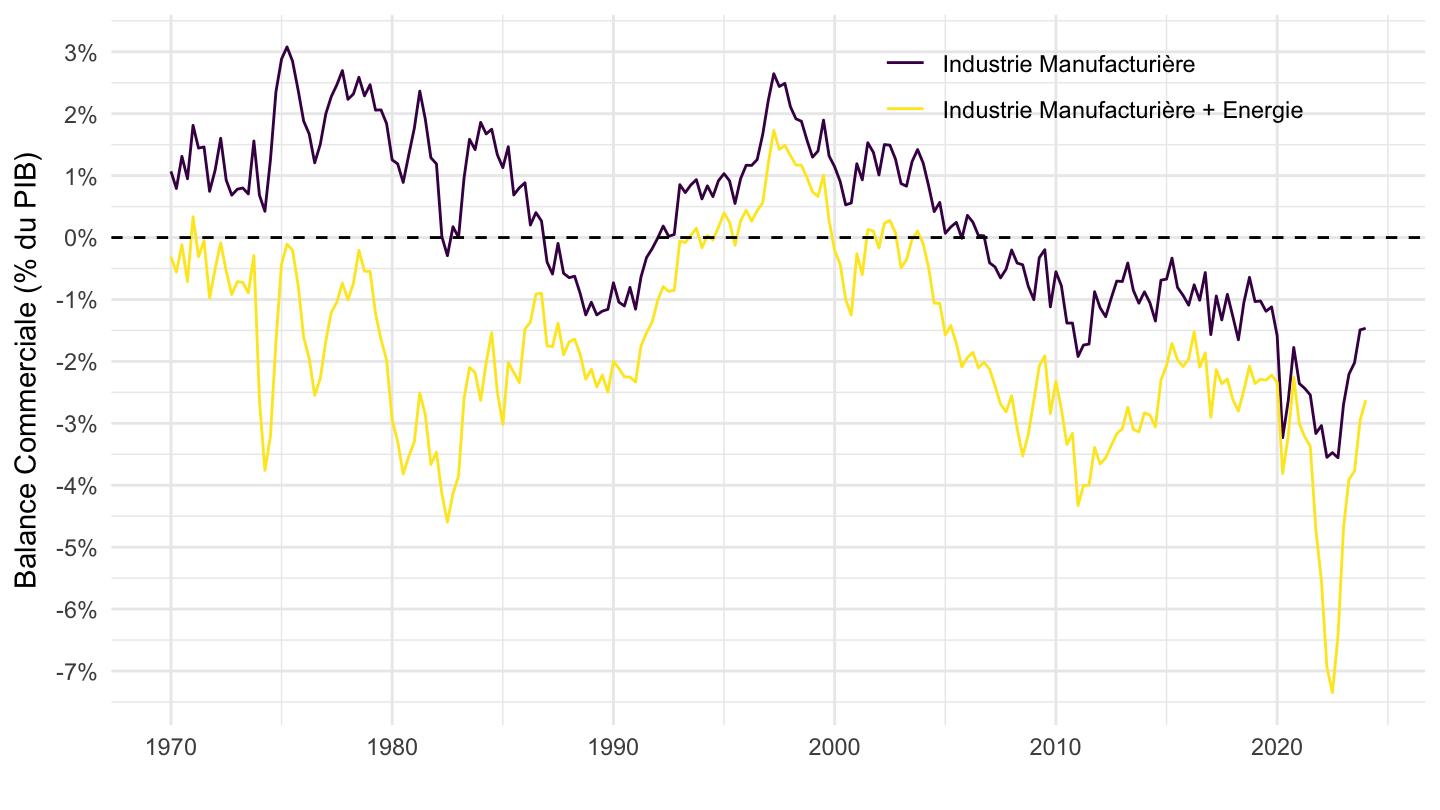
`CNT-2014-OPERATIONS` |>
  filter(OPERATION %in% c("P6", "P7"),
         FREQ == "T",
         CNA_PRODUIT %in% c("DIM-CNT", "DI-CNT"),
         VALORISATION == "V") |>
  left_join(tibble(CNA_PRODUIT = c("DIM-CNT", "DI-CNT"),
                   Cna_produit_short = c("Industrie Manufacturière",
                                   "Industrie Manufacturière + Energie")),  by = "CNA_PRODUIT") |>
  mutate(Cna_produit_short = ordered(Cna_produit_short, levels = c("Industrie Manufacturière",
                                                       "Industrie Manufacturière + Energie"))) |>
  quarter_to_date() |>
  select(Cna_produit_short, OPERATION, date, OBS_VALUE) |>
  spread(OPERATION, OBS_VALUE) |>
  left_join(gdp_quarterly, by = "date") |>
  mutate(obsValue = (P6-P7)/gdp) |>
  arrange(desc(date)) |>
  filter(date >= as.Date("1990-01-01")) |>
  ggplot() + geom_line(aes(x = date, y = obsValue, color = Cna_produit_short)) +
  theme_minimal() + xlab("") + ylab("Balance Commerciale (% du PIB)") +
  scale_x_date(breaks = seq(1940, 2100, 5) |> paste0("-01-01") |> as.Date(),
               labels = date_format("%Y")) +
  scale_y_continuous(breaks = 0.01*seq(-100, 500, 1),
                labels = percent_format(accuracy = 1)) +

  theme(legend.position = c(0.75, 0.9),
        legend.title = element_blank()) +
  geom_hline(yintercept = 0, linetype = "dashed")
`CNT-2014-OPERATIONS` |>
  filter(OPERATION %in% c("P6", "P7"),
         FREQ == "T",
         CNA_PRODUIT %in% c("DIM-CNT", "DI-CNT", "DB-CNT"),
         VALORISATION == "V") |>
  left_join(tibble(CNA_PRODUIT = c("DIM-CNT", "DI-CNT", "DB-CNT"),
                   Cna_produit_short = c("Industrie Manufacturière",
                                   "Industrie (Industrie Manuf. + Energie)",
                                   "Biens (Industrie + Agriculture)")),  by = "CNA_PRODUIT") |>
  mutate(Cna_produit_short = ordered(Cna_produit_short, levels = c("Industrie Manufacturière",
                                                       "Industrie (Industrie Manuf. + Energie)",
                                                       "Biens (Industrie + Agriculture)"))) |>
  quarter_to_date() |>
  select(Cna_produit_short, OPERATION, date, OBS_VALUE) |>
  spread(OPERATION, OBS_VALUE) |>
  left_join(gdp_quarterly, by = "date") |>
  mutate(obsValue = (P6-P7)/gdp) |>
  arrange(desc(date)) |>
  ggplot() + geom_line(aes(x = date, y = obsValue, color = Cna_produit_short)) +
  theme_minimal() + xlab("") + ylab("Balance Commerciale (% du PIB)") +
  scale_x_date(breaks = seq(1940, 2100, 10) |> paste0("-01-01") |> as.Date(),
               labels = date_format("%Y")) +
  scale_y_continuous(breaks = 0.01*seq(-100, 500, 1),
                labels = percent_format(accuracy = 1)) +

  theme(legend.position = c(0.75, 0.9),
        legend.title = element_blank()) +
  geom_hline(yintercept = 0, linetype = "dashed")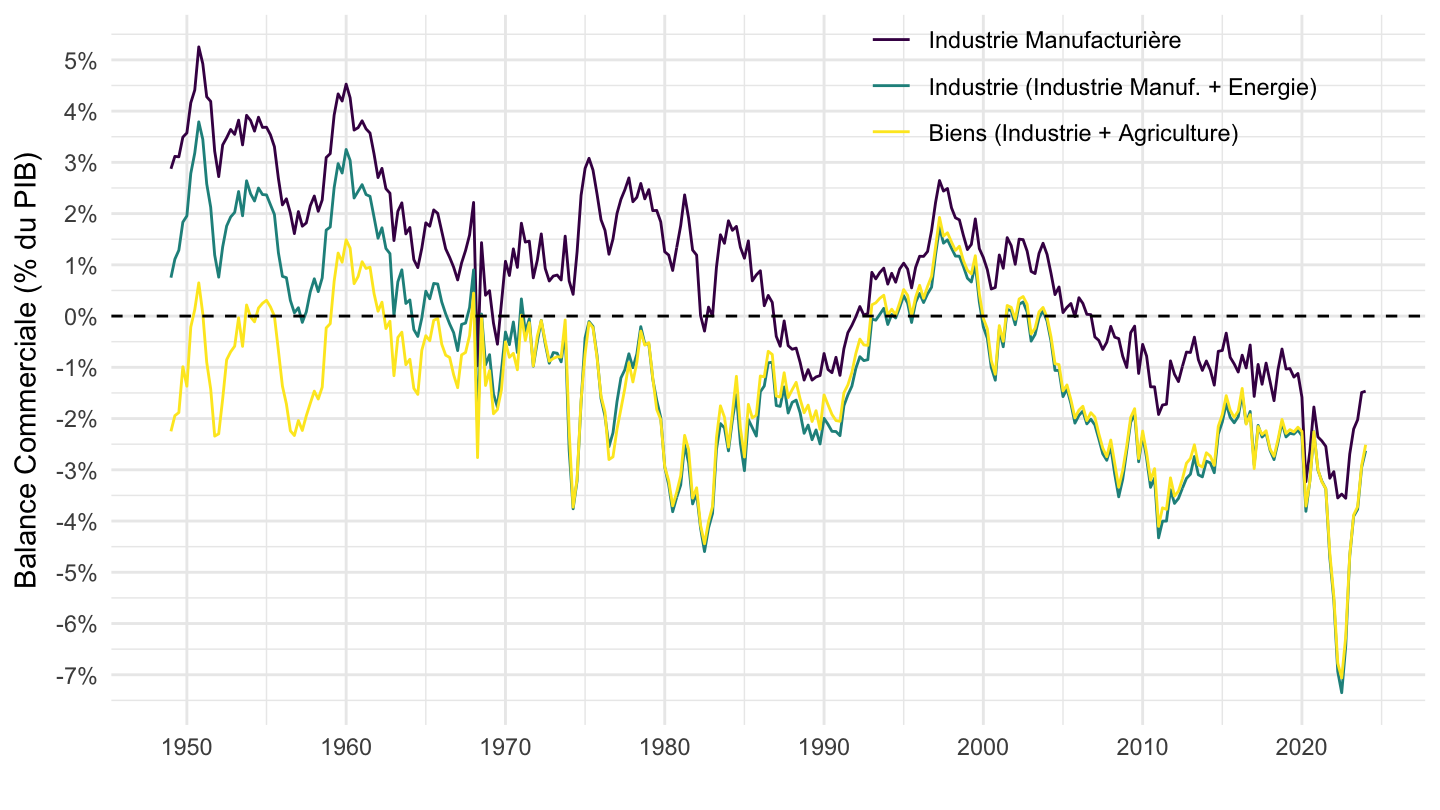
`CNT-2014-OPERATIONS` |>
  filter(OPERATION %in% c("P6", "P7"),
         FREQ == "T",
         CNA_PRODUIT %in% c("DIM-CNT", "DI-CNT", "DB-CNT"),
         VALORISATION == "V") |>

  quarter_to_date() |>
  select(CNA_PRODUIT, OPERATION, date, OBS_VALUE) |>
  spread(OPERATION, OBS_VALUE) |>
  left_join(gdp_quarterly, by = "date") |>
  mutate(obsValue = (P6-P7)/gdp) |>
  arrange(desc(date)) |>
  filter(date >= as.Date("1970-01-01")) |>
  ggplot() + geom_line(aes(x = date, y = obsValue, color = CNA_PRODUIT)) +
  theme_minimal() + xlab("") + ylab("Exportations Nettes (% du PIB)") +
  scale_x_date(breaks = seq(1940, 2100, 5) |> paste0("-01-01") |> as.Date(),
               labels = date_format("%Y")) +
  scale_y_continuous(breaks = 0.01*seq(-100, 500, 1),
                labels = percent_format(accuracy = 1)) +

  theme(legend.position = c(0.8, 0.9),
        legend.title = element_blank()) +
  geom_hline(yintercept = 0, linetype = "dashed")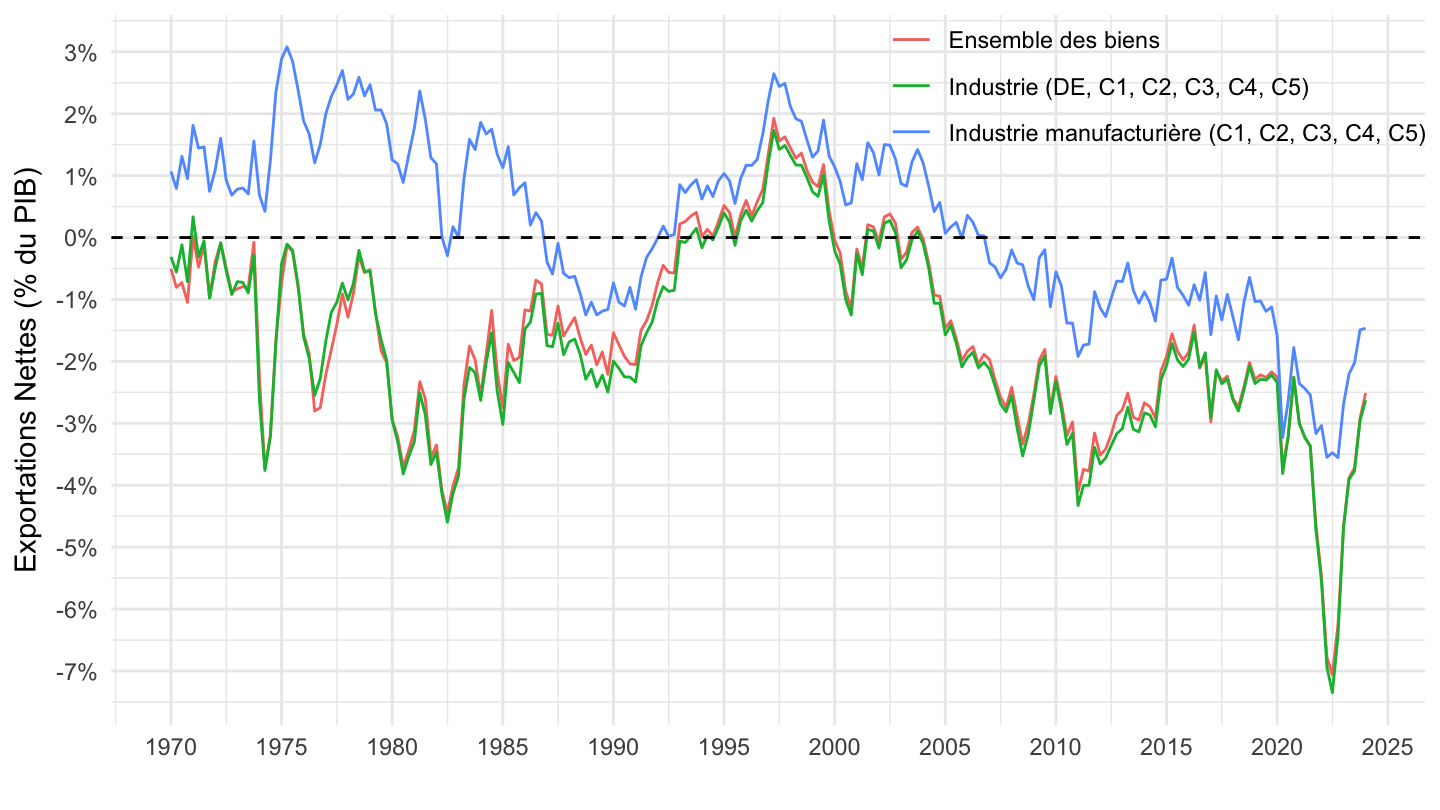
`CNT-2014-OPERATIONS` |>
  filter(OPERATION %in% c("P6", "P7"),
         FREQ == "T",
         CNA_PRODUIT %in% c("DIM-CNT", "DI-CNT", "DB-CNT"),
         VALORISATION == "V") |>

  quarter_to_date() |>
  select(CNA_PRODUIT, OPERATION, date, OBS_VALUE) |>
  spread(OPERATION, OBS_VALUE) |>
  left_join(gdp_quarterly, by = "date") |>
  mutate(obsValue = (P6-P7)/gdp) |>
  arrange(desc(date)) |>
  filter(date >= as.Date("1980-01-01")) |>
  ggplot() + geom_line(aes(x = date, y = obsValue, color = CNA_PRODUIT)) +
  theme_minimal() + xlab("") + ylab("Exportations Nettes (% du PIB)") +
  scale_x_date(breaks = seq(1940, 2100, 5) |> paste0("-01-01") |> as.Date(),
               labels = date_format("%Y")) +
  scale_y_continuous(breaks = 0.01*seq(-100, 500, 1),
                labels = percent_format(accuracy = 1)) +

  theme(legend.position = c(0.75, 0.9),
        legend.title = element_blank()) +
  geom_hline(yintercept = 0, linetype = "dashed")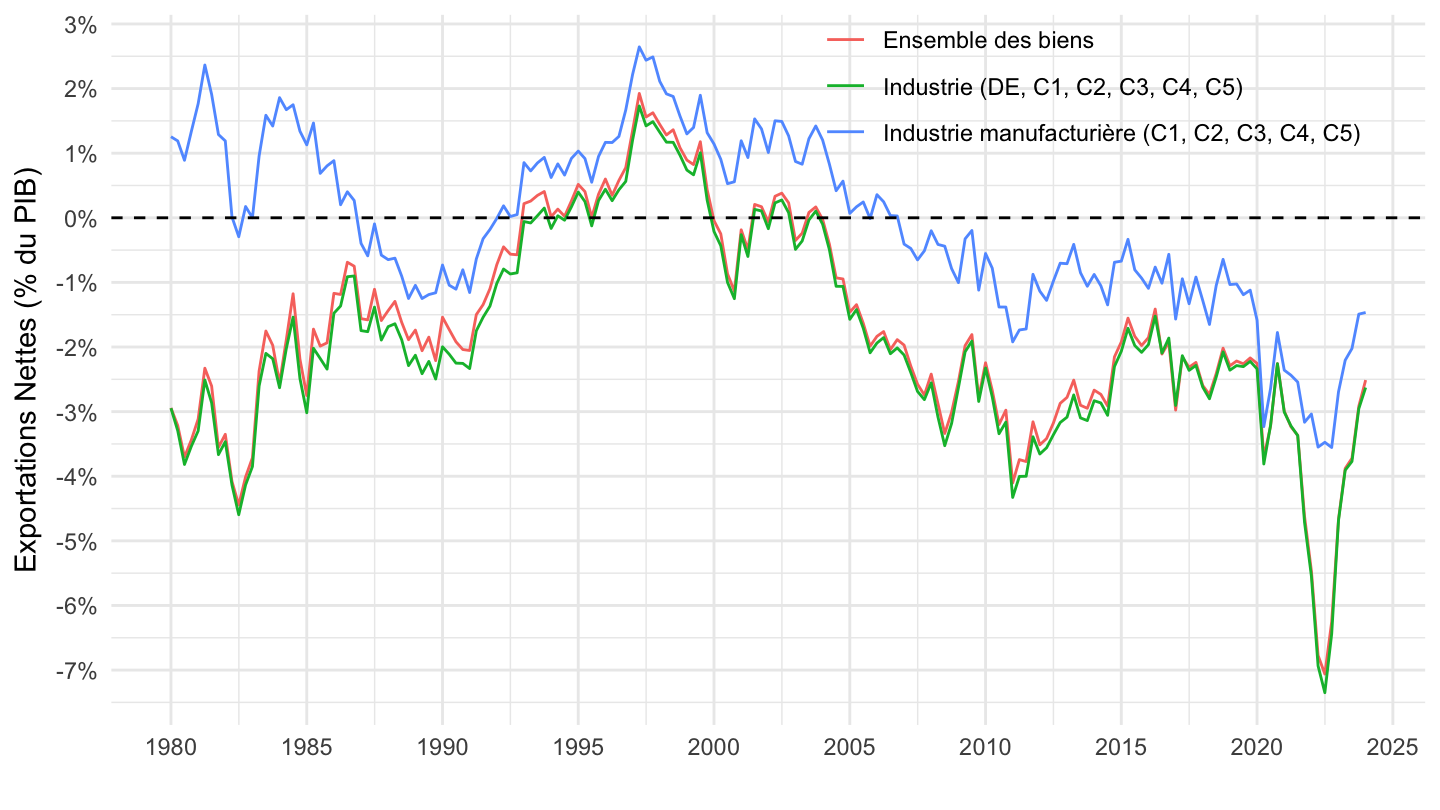
`CNT-2014-OPERATIONS` |>
  filter(OPERATION %in% c("P6", "P7"),
         FREQ == "T",
         CNA_PRODUIT %in% c("DIM-CNT", "DI-CNT", "DB-CNT"),
         VALORISATION == "V") |>

  quarter_to_date() |>
  select(CNA_PRODUIT, OPERATION, date, OBS_VALUE) |>
  spread(OPERATION, OBS_VALUE) |>
  left_join(gdp_quarterly, by = "date") |>
  transmute(CNA_PRODUIT, date,
            `% du PIB` = 100*(P6-P7)/gdp) |>
  group_by(CNA_PRODUIT) |>
  arrange(`% du PIB`) |>
  head(3) |>
print_table_conditional()| CNA_PRODUIT | date | % du PIB |
|---|---|---|
| DI-CNT | 2022-07-01 | -7.349884 |
| DB-CNT | 2022-07-01 | -7.061350 |
| DI-CNT | 2022-04-01 | -6.935217 |
`CNT-2014-OPERATIONS` |>
  filter(OPERATION %in% c("P6", "P7"),
         FREQ == "T",
         CNA_PRODUIT %in% c("DIM-CNT"),
         VALORISATION == "V") |>

  quarter_to_date() |>
  select(CNA_PRODUIT, OPERATION, date, OBS_VALUE) |>
  spread(OPERATION, OBS_VALUE) |>
  left_join(gdp_quarterly, by = "date") |>
  mutate(value = (P6-P7)/gdp) |>
  ggplot() + geom_line(aes(x = date, y = value)) +
  theme_minimal() + xlab("") + ylab("Exportations Nettes, Industrie manufacturière (% du PIB)") +
  scale_x_date(breaks = seq(1940, 2100, 10) |> paste0("-01-01") |> as.Date(),
               labels = date_format("%Y")) +
  scale_y_continuous(breaks = 0.01*seq(-100, 500, 1),
                labels = percent_format(accuracy = 1)) +

  theme(legend.position = c(0.75, 0.9),
        legend.title = element_blank()) +
  geom_hline(yintercept = 0, linetype = "dashed")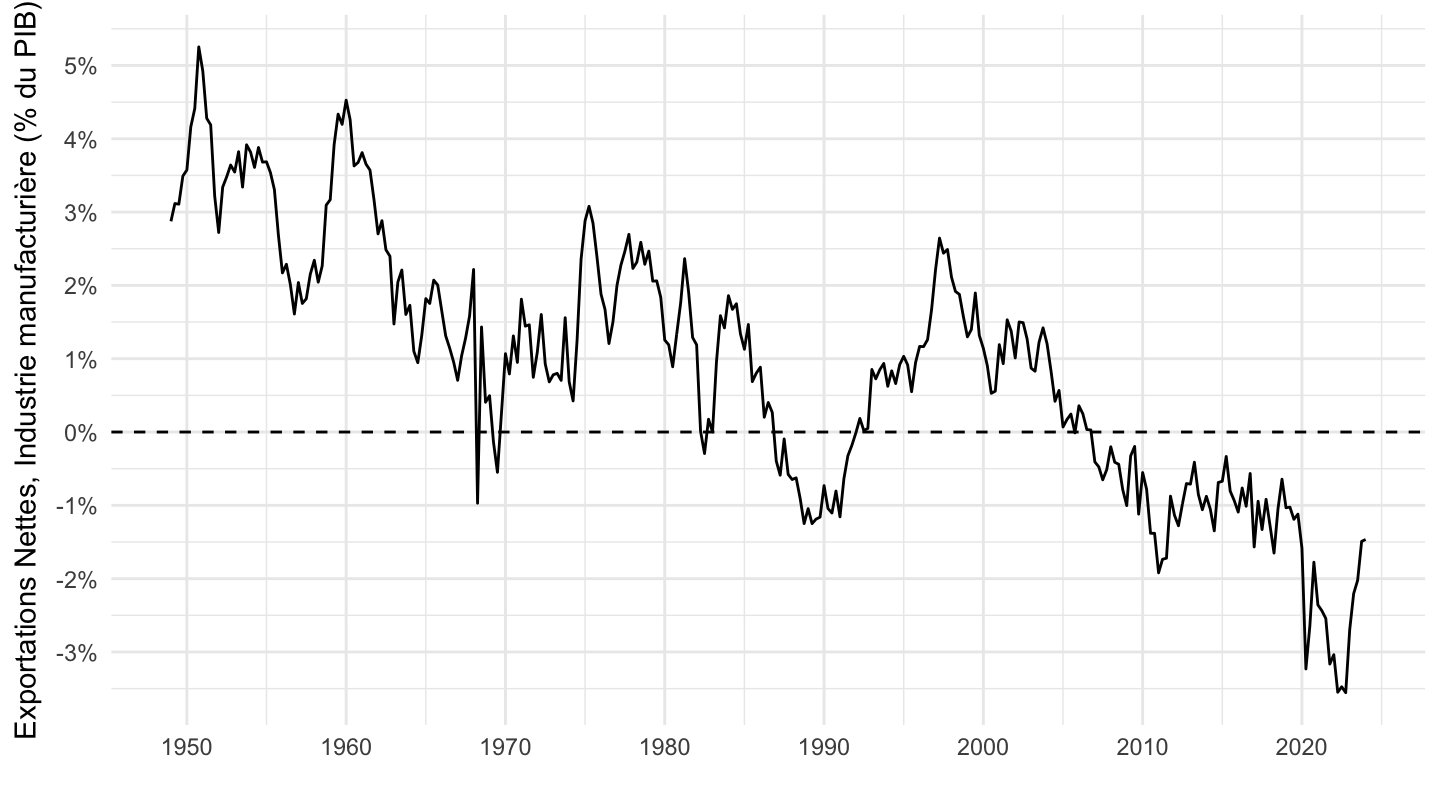
`CNT-2014-OPERATIONS` |>
  filter(OPERATION %in% c("P6", "P7"),
         FREQ == "T",
         CNA_PRODUIT %in% c("A17-AZ", "A17-C1"),
         VALORISATION == "V") |>

  quarter_to_date() |>
  select(CNA_PRODUIT, OPERATION, date, OBS_VALUE) |>
  spread(OPERATION, OBS_VALUE) |>
  left_join(gdp_quarterly, by = "date") |>
  ggplot() + geom_line(aes(x = date, y = (P6-P7)/gdp, color = CNA_PRODUIT)) +
  theme_minimal() + xlab("") + ylab("Exportations Nettes (% du PIB)") +
  scale_x_date(breaks = seq(1940, 2100, 5) |> paste0("-01-01") |> as.Date(),
               labels = date_format("%Y")) +
  scale_y_continuous(breaks = 0.01*seq(-100, 500, .5),
                labels = percent_format(accuracy = .1)) +

  theme(legend.position = c(0.55, 0.2),
        legend.title = element_blank()) +
  geom_hline(yintercept = 0, linetype = "dashed")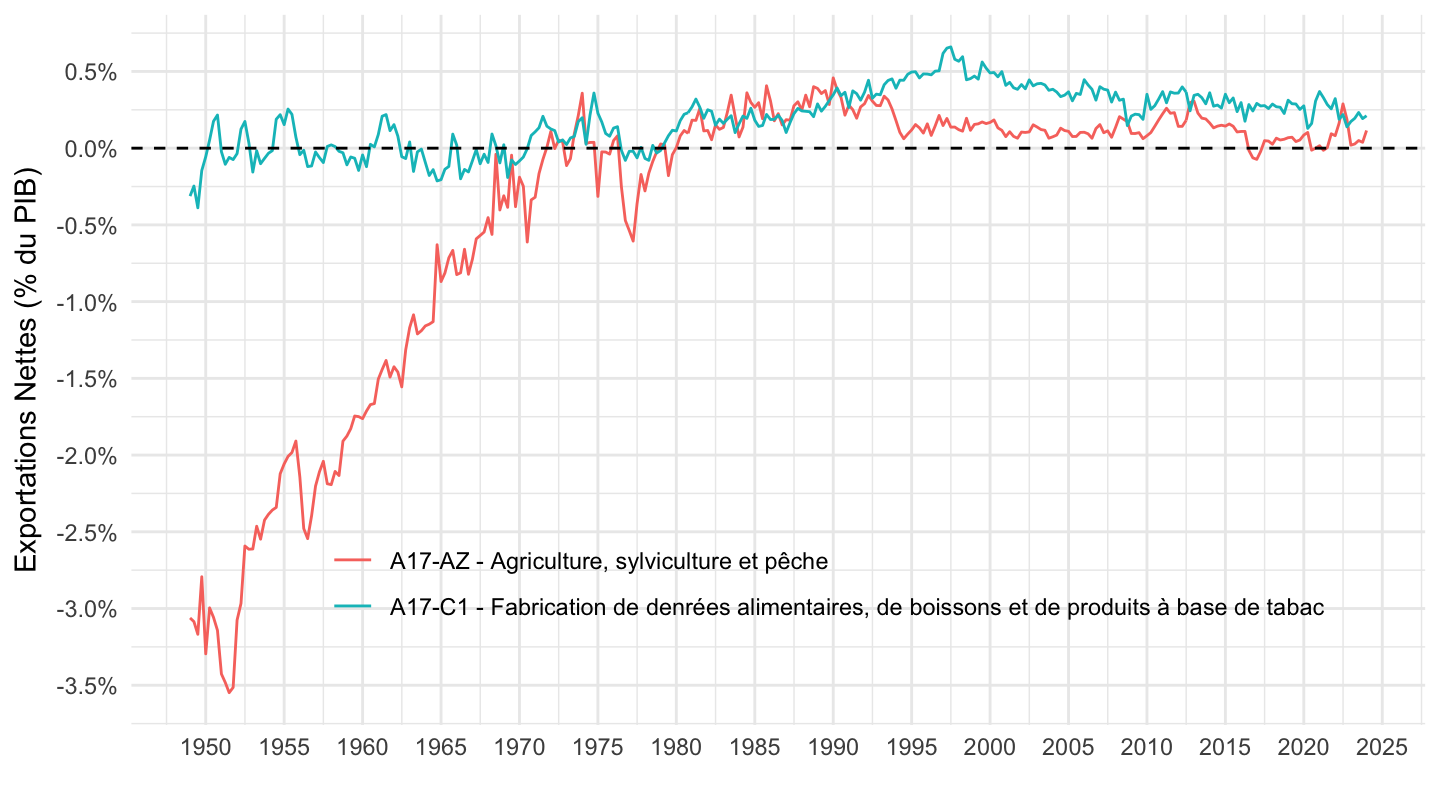
`CNT-2014-OPERATIONS` |>
  filter(OPERATION %in% c("P6", "P7"),
         FREQ == "T",
         CNA_PRODUIT %in% c("A17-AZ", "DIM-CNT", "DI-CNT", "DB-CNT"),
         VALORISATION == "V") |>

  quarter_to_date() |>
  select(CNA_PRODUIT, OPERATION, date, OBS_VALUE) |>
  spread(OPERATION, OBS_VALUE) |>
  left_join(gdp_quarterly, by = "date") |>
  ggplot() + geom_line(aes(x = date, y = (P6-P7)/gdp, color = CNA_PRODUIT)) +
  theme_minimal() + xlab("") + ylab("Exportations Nettes (% du PIB)") +
  scale_x_date(breaks = seq(1940, 2100, 5) |> paste0("-01-01") |> as.Date(),
               labels = date_format("%Y")) +
  scale_y_continuous(breaks = 0.01*seq(-100, 500, 1),
                labels = percent_format(accuracy = 1)) +

  theme(legend.position = c(0.75, 0.9),
        legend.title = element_blank()) +
  geom_hline(yintercept = 0, linetype = "dashed")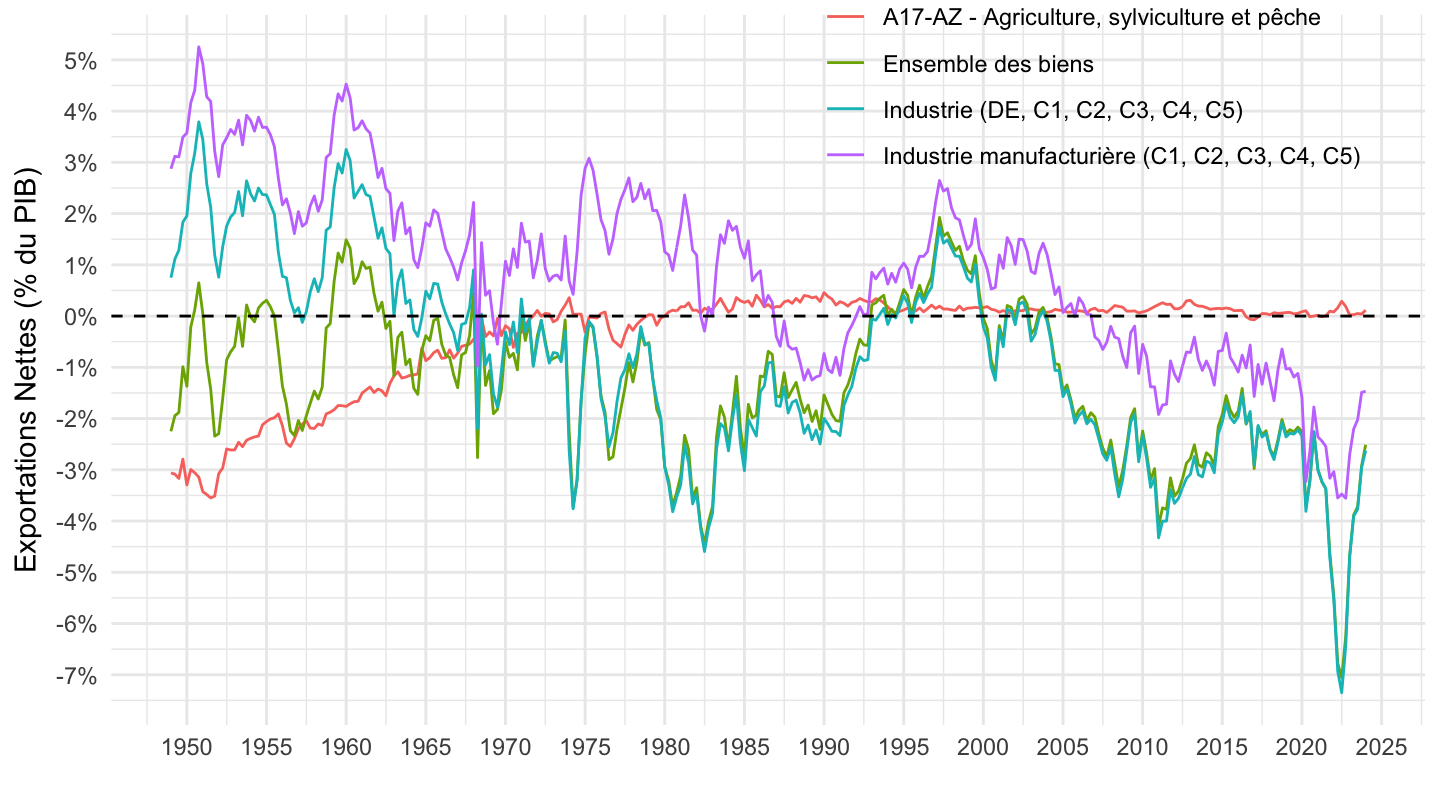
`CNT-2014-OPERATIONS` |>
  filter(OPERATION %in% c("P6", "P7"),
         FREQ == "T",
         CNA_PRODUIT %in% c("DIM-CNT", "DI-CNT"),
         VALORISATION == "V") |>

  quarter_to_date() |>
  filter(date >= as.Date("1995-01-01")) |>
  arrange(date) |>
  select(CNA_PRODUIT, OPERATION, date, OBS_VALUE) |>
  spread(OPERATION, OBS_VALUE) |>
  left_join(gdp_quarterly, by = "date") |>
  ggplot() + geom_line(aes(x = date, y = (P6-P7)/gdp, color = CNA_PRODUIT)) +
  theme_minimal() + xlab("") + ylab("% du PIB") +
  scale_x_date(breaks = seq(1940, 2100, 2) |> paste0("-01-01") |> as.Date(),
               labels = date_format("%Y")) +
  scale_y_continuous(breaks = 0.01*seq(-100, 500, 1),
                labels = percent_format(accuracy = 1)) +

  theme(legend.position = c(0.65, 0.9),
        legend.title = element_blank()) +
  geom_hline(yintercept = 0, linetype = "dashed")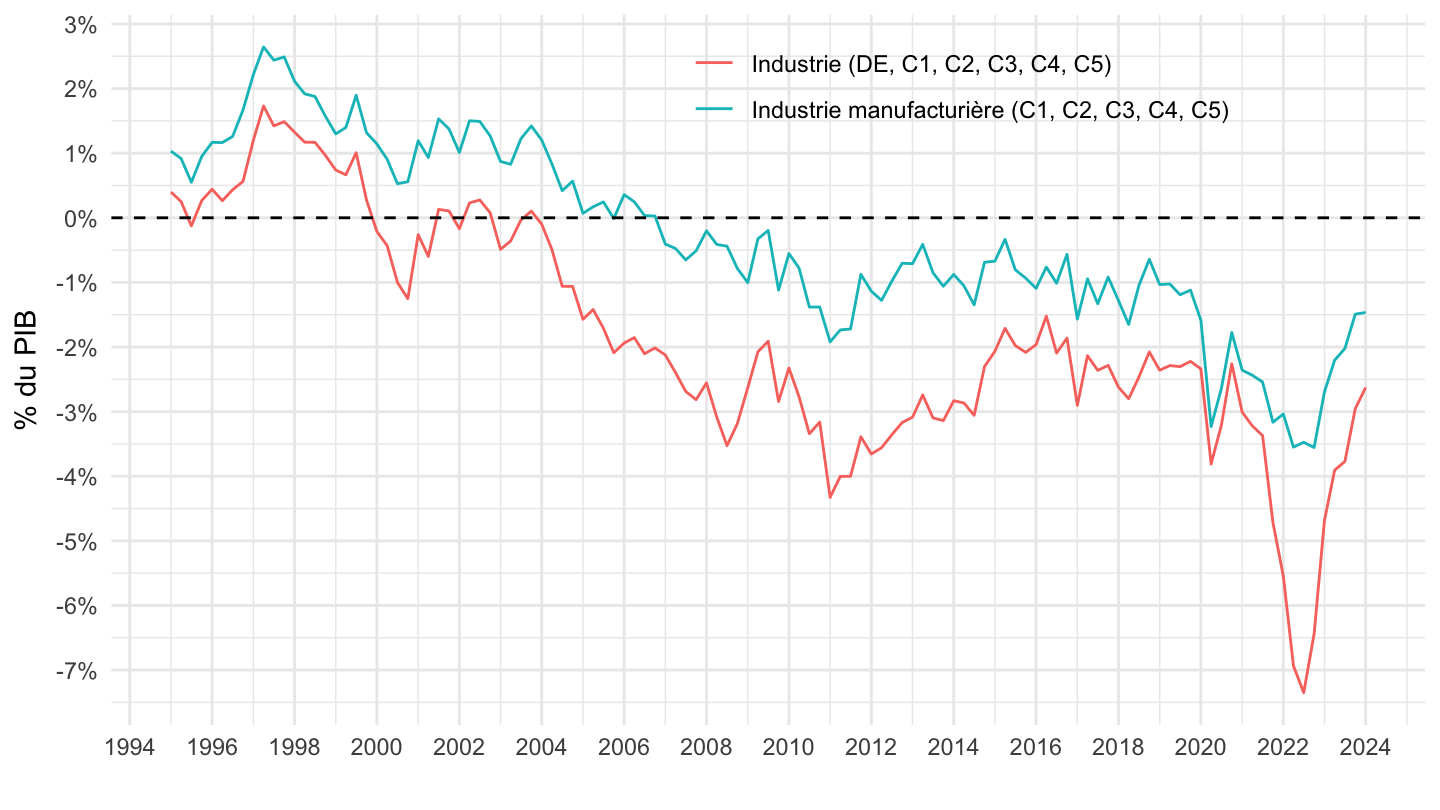
`CNT-2014-OPERATIONS` |>
  filter(OPERATION %in% c("P6", "P7"),
         FREQ == "T",
         CNA_PRODUIT %in% c("DIM-CNT", "DI-CNT"),
         VALORISATION == "V") |>

  quarter_to_date() |>
  arrange(date) |>
  filter(date >= as.Date("1954-01-01"),
         date <= as.Date("1962-01-01")) |>
  select(CNA_PRODUIT, OPERATION, date, OBS_VALUE) |>
  spread(OPERATION, OBS_VALUE) |>
  left_join(gdp_quarterly, by = "date") |>
  ggplot() + geom_line(aes(x = date, y = (P6-P7)/gdp, color = CNA_PRODUIT)) +
  theme_minimal() + xlab("") + ylab("Exportations Nettes (% du PIB)") +
  scale_x_date(breaks = seq(1940, 2100, 1) |> paste0("-01-01") |> as.Date(),
               labels = date_format("%Y")) +
  scale_y_continuous(breaks = 0.01*seq(-100, 500, 1),
                labels = percent_format(accuracy = 1)) +

  theme(legend.position = c(0.65, 0.9),
        legend.title = element_blank()) +
  geom_hline(yintercept = 0, linetype = "dashed")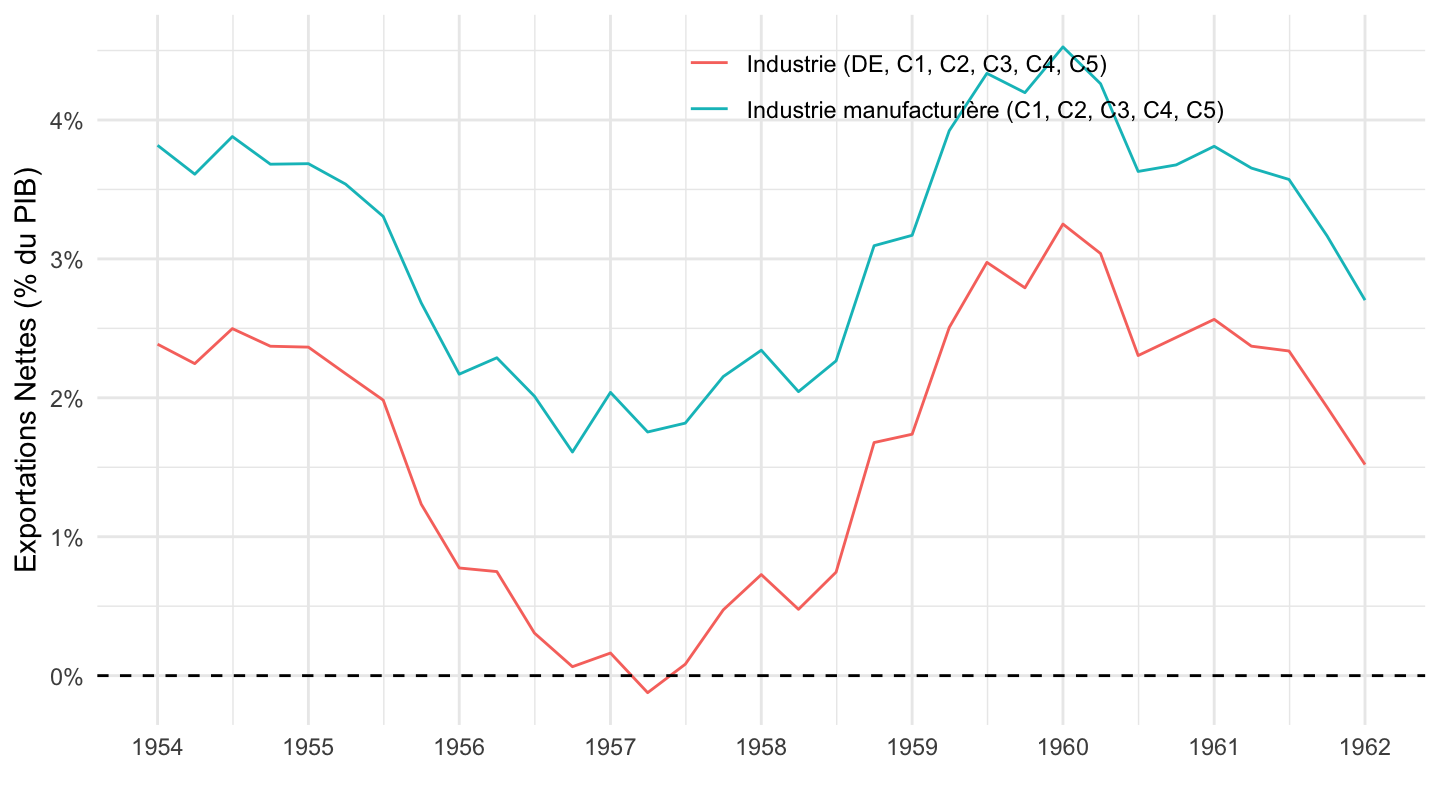
`CNT-2014-OPERATIONS` |>
  filter(OPERATION %in% c("P6", "P7"),
         FREQ == "T",
         CNA_PRODUIT %in% c("DIM-CNT", "DI-CNT"),
         VALORISATION == "V") |>

  quarter_to_date() |>
  arrange(date) |>
  filter(date >= as.Date("2017-04-01")) |>
  select(CNA_PRODUIT, OPERATION, date, OBS_VALUE) |>
  spread(OPERATION, OBS_VALUE) |>
  left_join(gdp_quarterly, by = "date") |>
  ggplot() + geom_line(aes(x = date, y = (P6-P7)/gdp, color = CNA_PRODUIT)) +
  theme_minimal() + xlab("") + ylab("Exportations Nettes (% du PIB)") +
  scale_x_date(breaks = seq(1940, 2100, 1) |> paste0("-01-01") |> as.Date(),
               labels = date_format("%Y")) +
  scale_y_continuous(breaks = 0.01*seq(-100, 500, .5),
                labels = percent_format(accuracy = .1)) +

  theme(legend.position = c(0.65, 0.9),
        legend.title = element_blank()) +
  geom_hline(yintercept = 0, linetype = "dashed")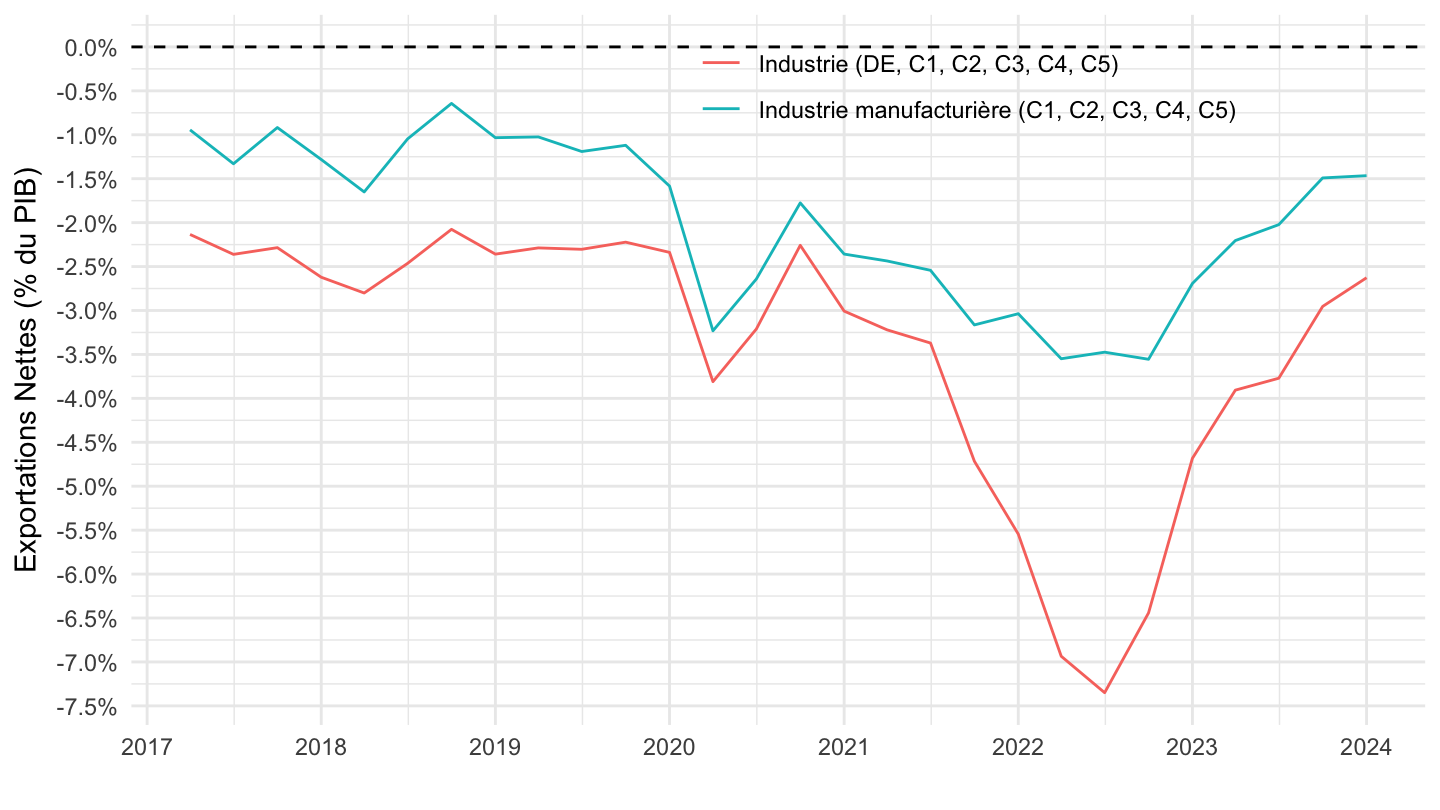
`CNT-2014-OPERATIONS` |>
  filter(OPERATION %in% c("P6", "P7"),
         FREQ == "T",
         CNA_PRODUIT %in% c("DIM-CNT", "DI-CNT"),
         VALORISATION == "L") |>

  quarter_to_date() |>
  arrange(date) |>
  #filter(date >= as.Date("2017-04-01")) %>%
  select(CNA_PRODUIT, OPERATION, date, OBS_VALUE) |>
  spread(OPERATION, OBS_VALUE) |>
  ggplot() + geom_line(aes(x = date, y = (P6-P7)/1000, color = CNA_PRODUIT)) +
  theme_minimal() + xlab("") + ylab("Exportations Nettes (Mds€ / trimestre)") +
  scale_x_date(breaks = seq(1940, 2100, 5) |> paste0("-01-01") |> as.Date(),
               labels = date_format("%Y")) +
  scale_y_continuous(breaks = seq(-100, 500, 5)) +

  theme(legend.position = c(0.25, 0.2),
        legend.title = element_blank()) +
  geom_hline(yintercept = 0, linetype = "dashed")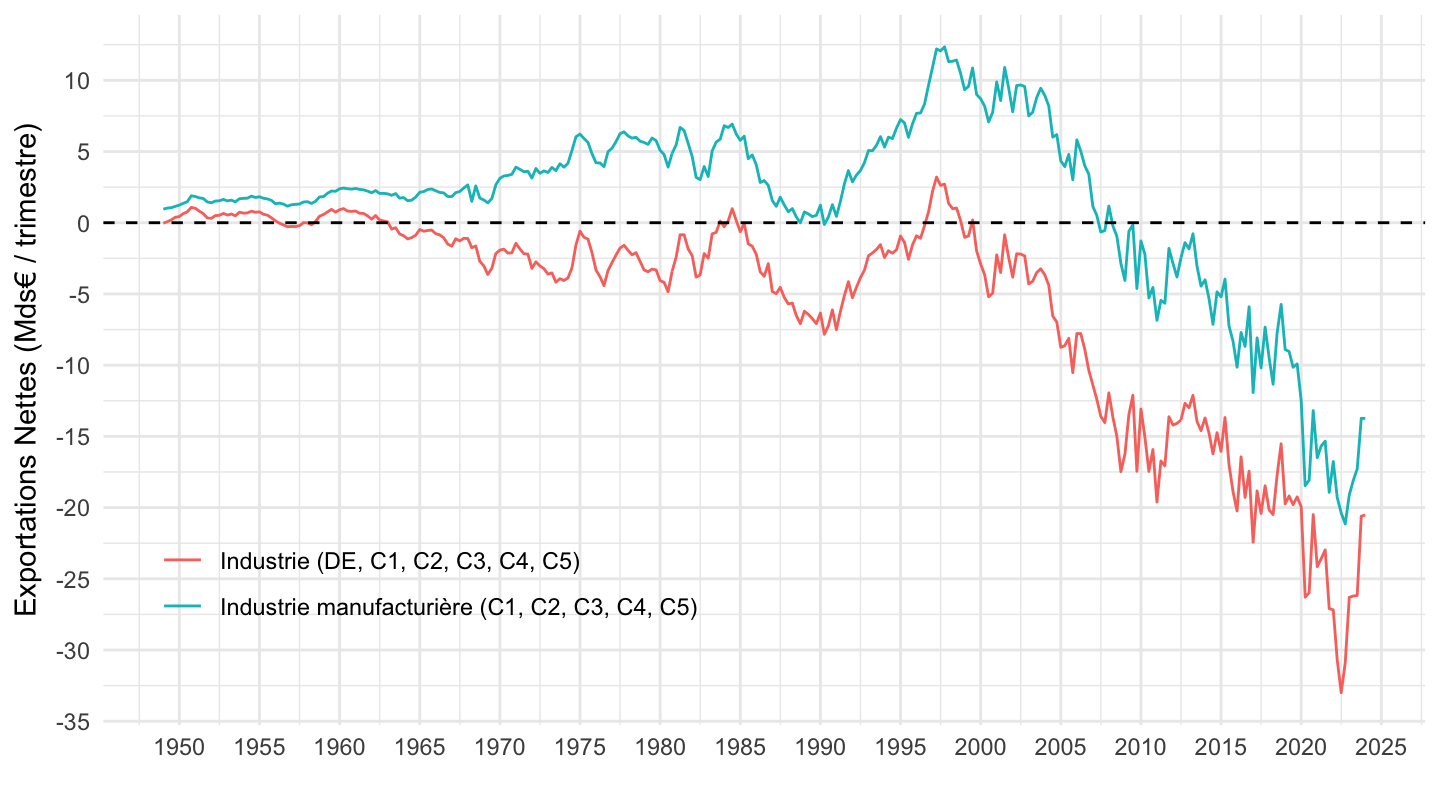
`CNT-2014-OPERATIONS` |>
  filter(OPERATION %in% c("P6", "P7"),
         FREQ == "T",
         CNA_PRODUIT %in% c("DIM-CNT", "DI-CNT"),
         VALORISATION == "L") |>

  quarter_to_date() |>
  arrange(date) |>
  #filter(date >= as.Date("2017-04-01")) %>%
  select(CNA_PRODUIT, OPERATION, date, OBS_VALUE) |>
  spread(OPERATION, OBS_VALUE) |>
  ggplot() + geom_line(aes(x = date, y = 4*(P6-P7)/1000, color = CNA_PRODUIT)) +
  theme_minimal() + xlab("") + ylab("Exportations Nettes (Mds€ / an)") +
  scale_x_date(breaks = seq(1940, 2100, 5) |> paste0("-01-01") |> as.Date(),
               labels = date_format("%Y")) +
  scale_y_continuous(breaks = seq(-200, 500, 20),
                     labels = dollar_format(pre = "", su = " Mds€")) +

  theme(legend.position = c(0.25, 0.2),
        legend.title = element_blank()) +
  geom_hline(yintercept = 0, linetype = "dashed")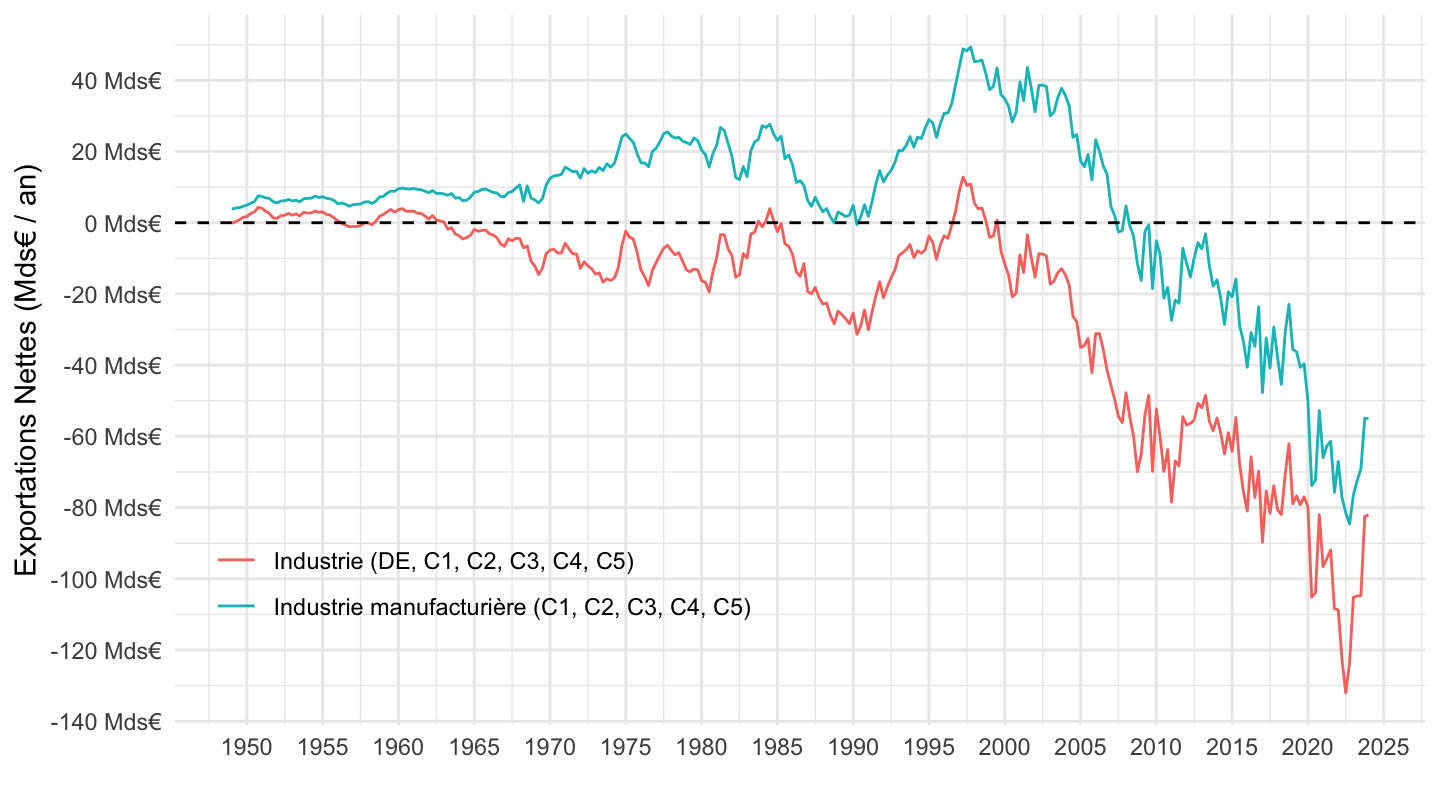
`CNT-2014-OPERATIONS` |>
  filter(OPERATION %in% c("P6", "P7"),
         FREQ == "T",
         CNA_PRODUIT %in% c("DS-CNT", "DB-CNT"),
         VALORISATION == "V") |>

  quarter_to_date() |>
  select(CNA_PRODUIT, OPERATION, date, OBS_VALUE) |>
  spread(OPERATION, OBS_VALUE) |>
  left_join(gdp_quarterly, by = "date") |>
  ggplot() + geom_line(aes(x = date, y = (P6-P7)/gdp, color = CNA_PRODUIT)) +
  theme_minimal() + xlab("") + ylab("Exportations Nettes (% du PIB)") +
  scale_x_date(breaks = seq(1940, 2100, 5) |> paste0("-01-01") |> as.Date(),
               labels = date_format("%Y")) +
  scale_y_continuous(breaks = 0.01*seq(-100, 500, 1),
                labels = percent_format(accuracy = 1)) +

  theme(legend.position = c(0.85, 0.9),
        legend.title = element_blank()) +
  geom_hline(yintercept = 0, linetype = "dashed")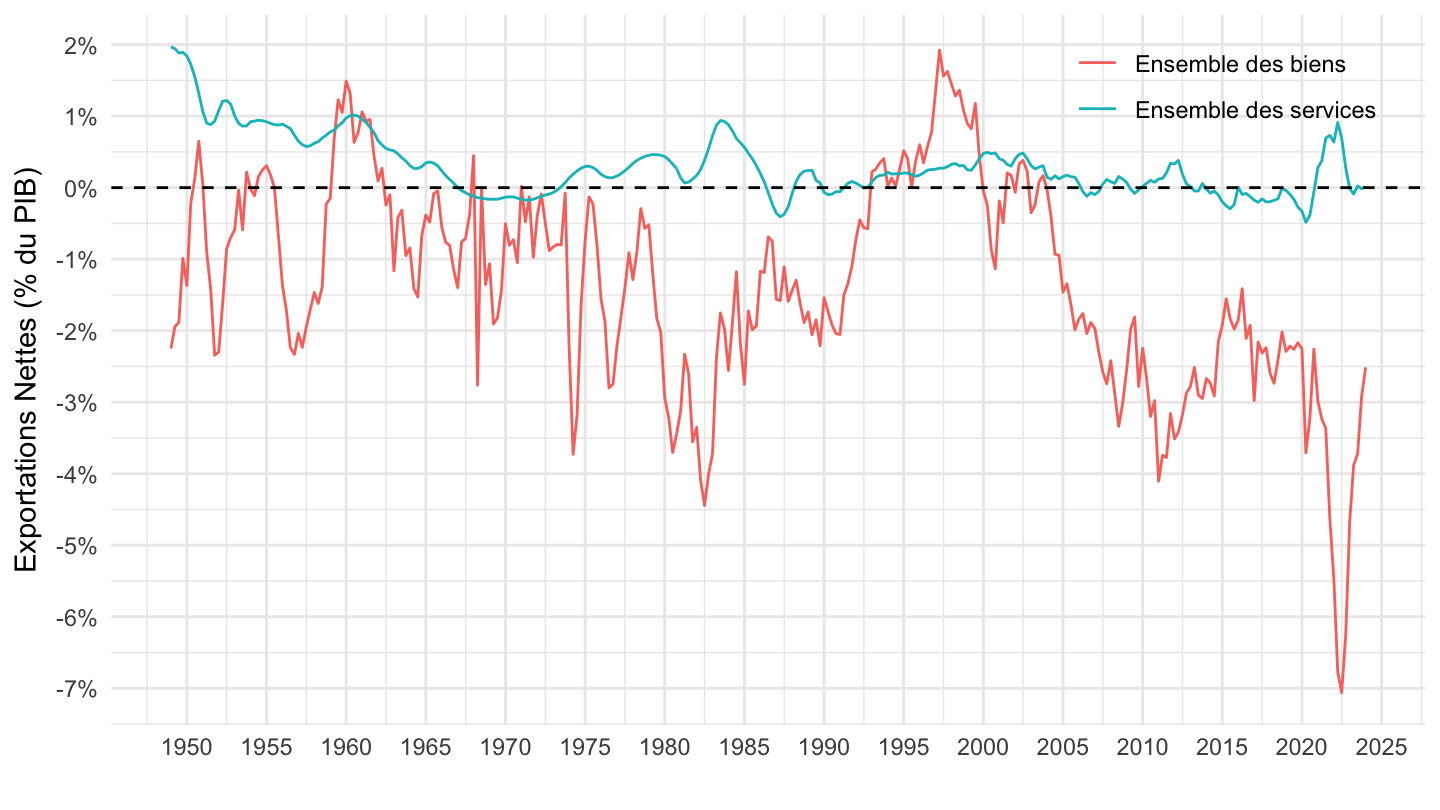
`CNT-2014-OPERATIONS` |>
  filter(OPERATION %in% c("P6", "P7"),
         FREQ == "T",
         CNA_PRODUIT %in% c("DSM-CNT", "DB-CNT"),
         VALORISATION == "V") |>

  quarter_to_date() |>
  select(CNA_PRODUIT, OPERATION, date, OBS_VALUE) |>
  spread(OPERATION, OBS_VALUE) |>
  left_join(gdp_quarterly, by = "date") |>
  mutate(obsValue = (P6-P7)/gdp) |>
  ggplot() + geom_line(aes(x = date, y = obsValue, color = CNA_PRODUIT)) +
  theme_minimal() + xlab("") + ylab("Exportations Nettes (% du PIB)") +
  scale_x_date(breaks = seq(1940, 2100, 5) |> paste0("-01-01") |> as.Date(),
               labels = date_format("%Y")) +
  scale_y_continuous(breaks = 0.01*seq(-100, 500, 1),
                labels = percent_format(accuracy = 1)) +

  theme(legend.position = c(0.85, 0.9),
        legend.title = element_blank()) +
  geom_hline(yintercept = 0, linetype = "dashed")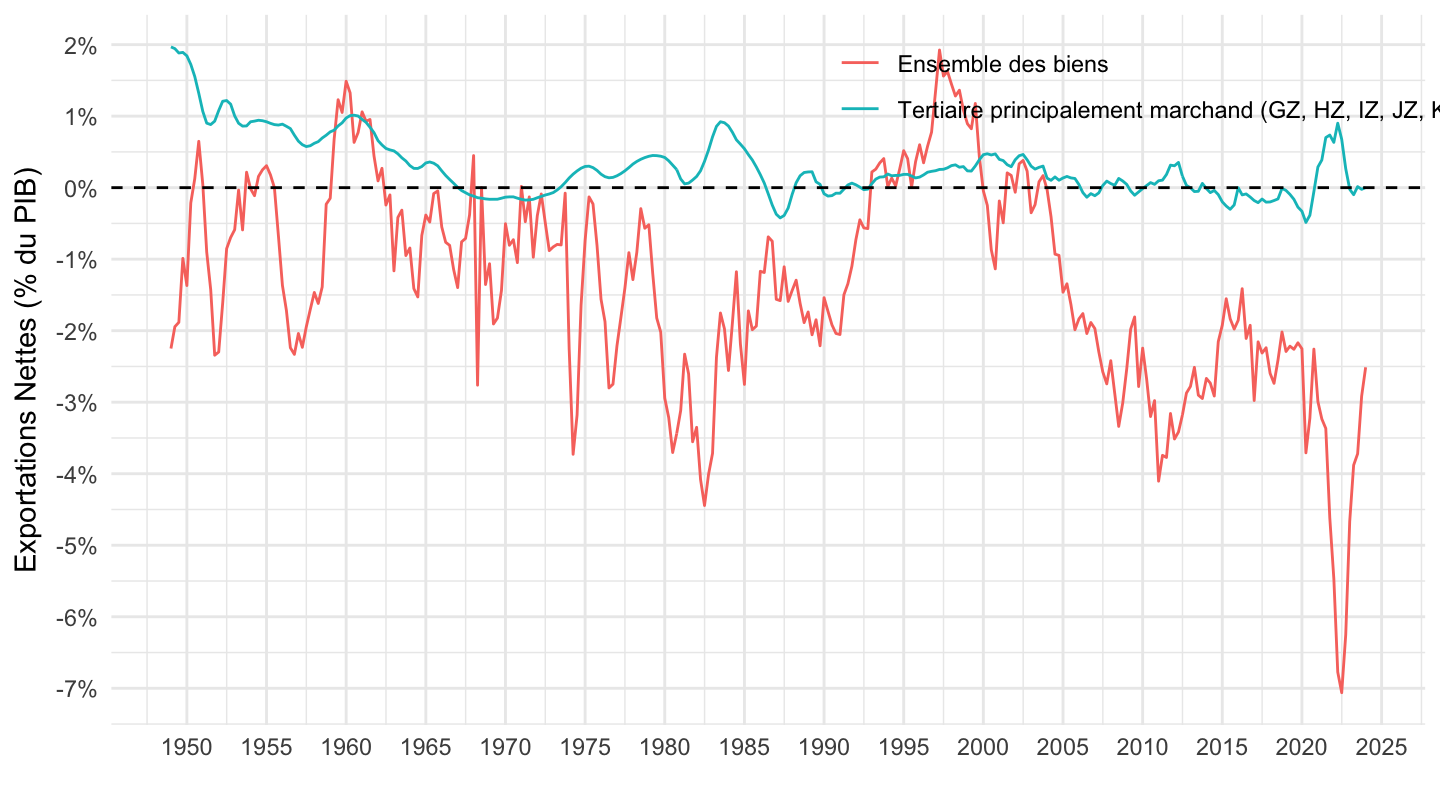
`CNT-2014-OPERATIONS` |>
  filter(OPERATION %in% c("P6", "P7"),
         FREQ == "T",
         CNA_PRODUIT %in% c("DS-CNT", "DB-CNT", "D-CNT"),
         VALORISATION == "V") |>

  quarter_to_date() |>
  select(CNA_PRODUIT, OPERATION, date, OBS_VALUE) |>
  spread(OPERATION, OBS_VALUE) |>
  left_join(gdp_quarterly, by = "date") |>
  ggplot() + geom_line(aes(x = date, y = (P6-P7)/gdp, color = CNA_PRODUIT)) +
  theme_minimal() + xlab("") + ylab("Exportations Nettes (% du PIB)") +
  scale_x_date(breaks = seq(1940, 2100, 5) |> paste0("-01-01") |> as.Date(),
               labels = date_format("%Y")) +
  scale_y_continuous(breaks = 0.01*seq(-100, 500, 1),
                labels = percent_format(accuracy = 1)) +

  theme(legend.position = c(0.85, 0.9),
        legend.title = element_blank()) +
  geom_hline(yintercept = 0, linetype = "dashed")
`CNT-2014-OPERATIONS` |>
  filter(OPERATION %in% c("P6", "P7"),
         FREQ == "T",
         CNA_PRODUIT %in% c("A17-HZ", "DS-CNT"),
         VALORISATION == "V") |>

  quarter_to_date() |>
  select(CNA_PRODUIT, OPERATION, date, OBS_VALUE) |>
  spread(OPERATION, OBS_VALUE) |>
  left_join(gdp_quarterly, by = "date") |>
  ggplot() + geom_line(aes(x = date, y = (P6-P7)/gdp, color = CNA_PRODUIT)) +
  theme_minimal() + xlab("") + ylab("% du PIB") +
  scale_x_date(breaks = seq(1940, 2100, 5) |> paste0("-01-01") |> as.Date(),
               labels = date_format("%Y")) +
  scale_y_continuous(breaks = 0.01*seq(-100, 500, .2),
                labels = percent_format(accuracy = .1)) +

  theme(legend.position = c(0.75, 0.9),
        legend.title = element_blank()) +
  geom_hline(yintercept = 0, linetype = "dashed")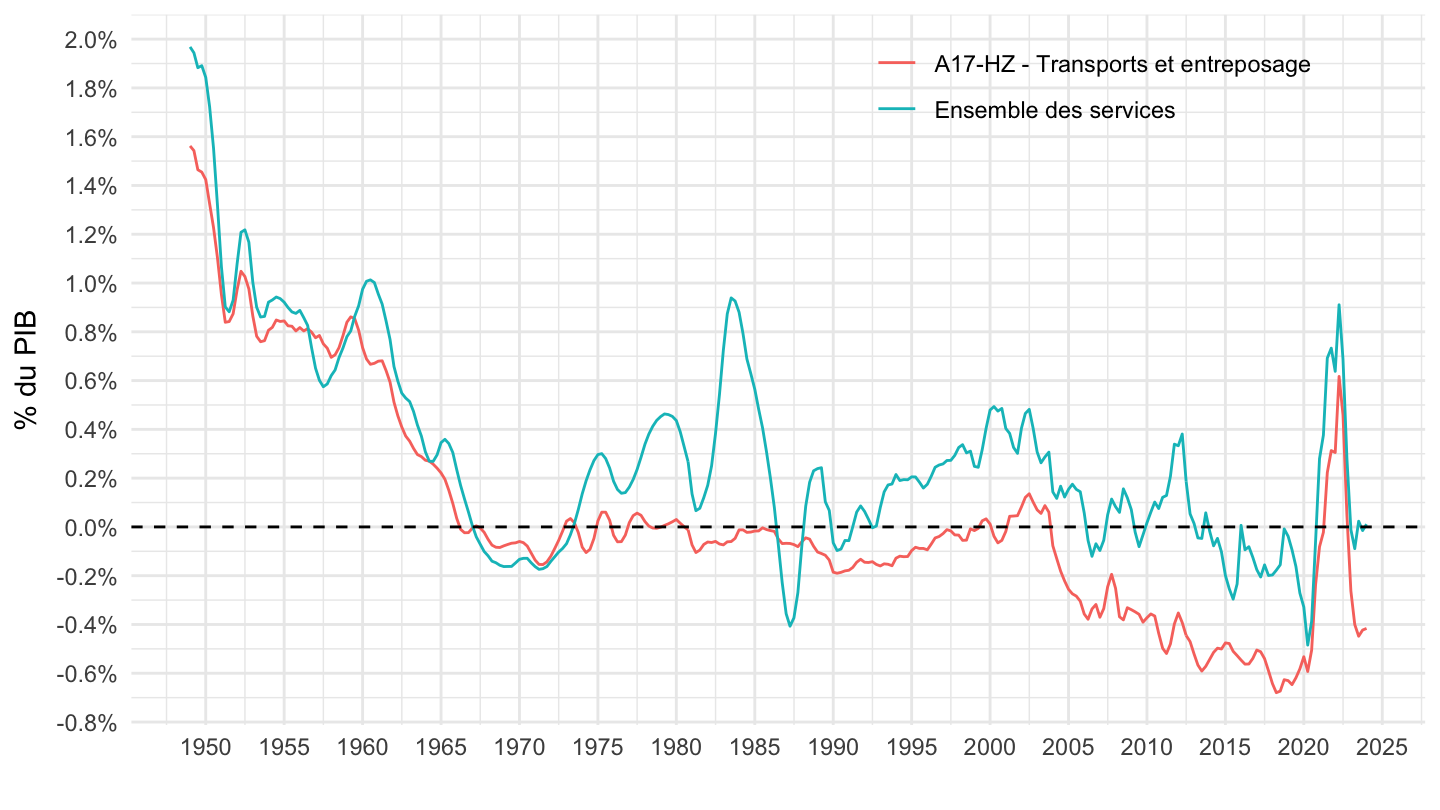
`CNT-2014-OPERATIONS` |>
  filter(OPERATION %in% c("P6", "P7"),
         FREQ == "T",
         CNA_PRODUIT %in% c("A17-C3", "A17-C2", "A17-C5"),
         VALORISATION == "V") |>

  quarter_to_date() |>
  select(CNA_PRODUIT, OPERATION, date, OBS_VALUE) |>
  spread(OPERATION, OBS_VALUE) |>
  left_join(gdp_quarterly, by = "date") |>
  ggplot() + geom_line(aes(x = date, y = (P6-P7)/gdp, color = CNA_PRODUIT)) +
  theme_minimal() + xlab("") + ylab("% du PIB") +
  scale_x_date(breaks = seq(1940, 2100, 5) |> paste0("-01-01") |> as.Date(),
               labels = date_format("%Y")) +
  scale_y_continuous(breaks = 0.01*seq(-100, 500, .5),
                labels = percent_format(accuracy = .1),
                limits = c(-0.02, 0.05)) +

  theme(legend.position = c(0.45, 0.9),
        legend.title = element_blank()) +
  geom_hline(yintercept = 0, linetype = "dashed")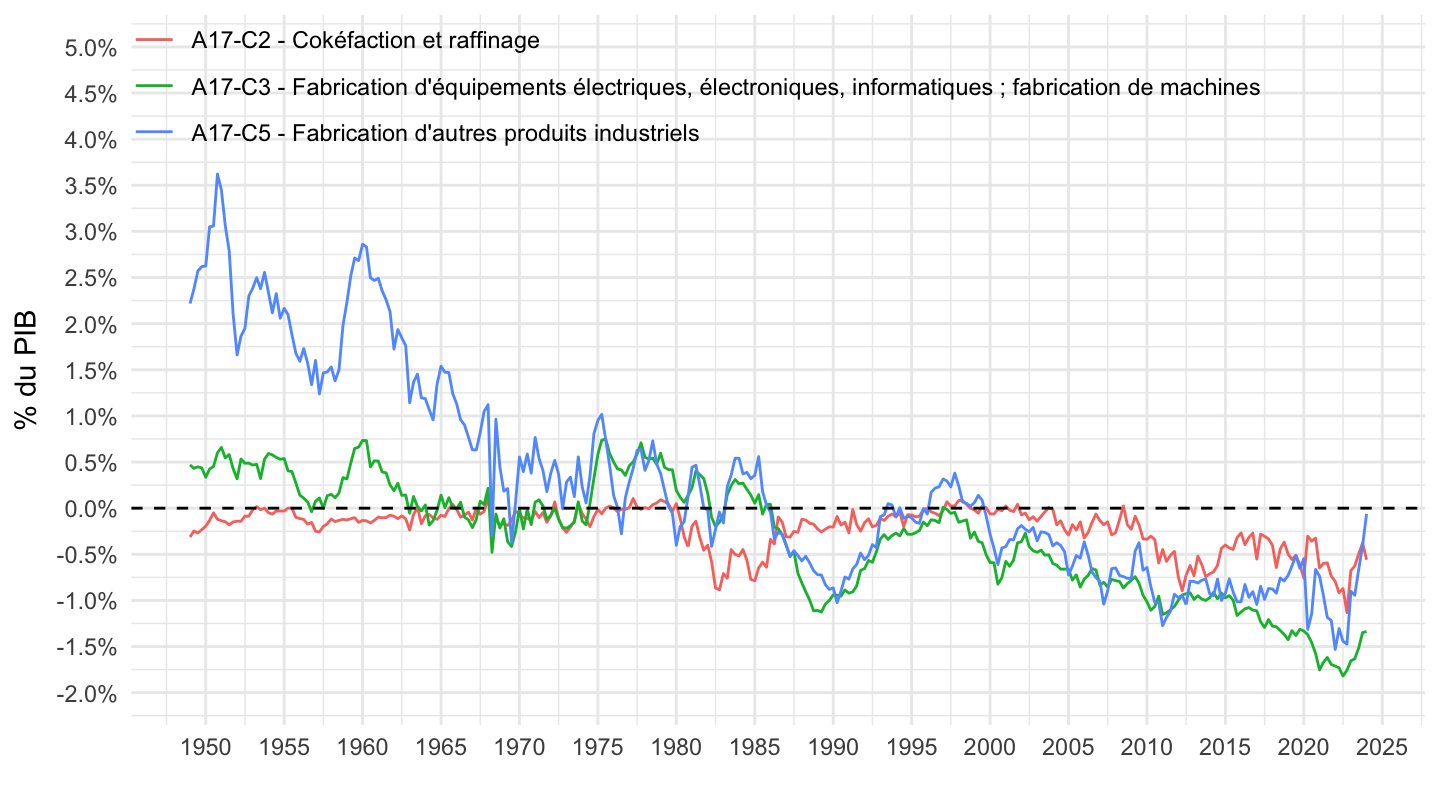
`CNT-2014-OPERATIONS` |>
  filter(OPERATION %in% c("P6", "P7"),
         FREQ == "T",
         CNA_PRODUIT %in% c("A17-C3", "A17-C1", "A17-C2", "A17-C5", "A17-C4"),
         VALORISATION == "V") |>

  quarter_to_date() |>
  select(CNA_PRODUIT, OPERATION, date, OBS_VALUE) |>
  spread(OPERATION, OBS_VALUE) |>
  left_join(gdp_quarterly, by = "date") |>
  ggplot() + geom_line(aes(x = date, y = (P6-P7)/gdp, color = CNA_PRODUIT)) +
  theme_minimal() + xlab("") + ylab("% du PIB") +
  scale_x_date(breaks = seq(1940, 2100, 5) |> paste0("-01-01") |> as.Date(),
               labels = date_format("%Y")) +
  scale_y_continuous(breaks = 0.01*seq(-100, 500, .5),
                labels = percent_format(accuracy = .1),
                limits = c(-0.02, 0.05)) +

  theme(legend.position = c(0.45, 0.9),
        legend.title = element_blank()) +
  geom_hline(yintercept = 0, linetype = "dashed")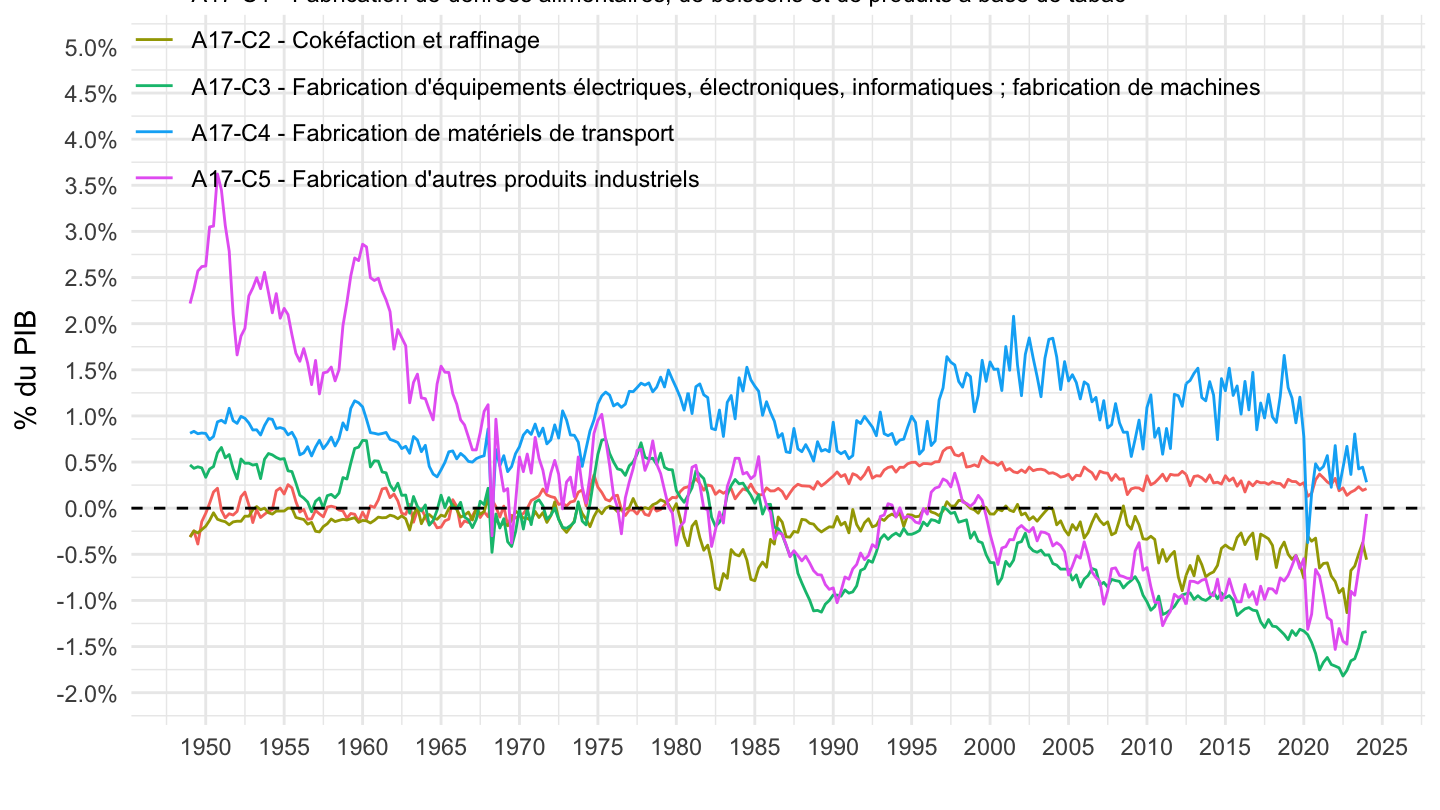
`CNT-2014-OPERATIONS` |>
  filter(OPERATION %in% c("P6", "P7"),
         FREQ == "T",
         CNA_PRODUIT %in% c("DSM-CNT", "DSN-CNT", "A17-PCAFAB"),
         VALORISATION == "V") |>

  quarter_to_date() |>
  select(CNA_PRODUIT, OPERATION, date, OBS_VALUE) |>
  spread(OPERATION, OBS_VALUE) |>
  left_join(gdp_quarterly, by = "date") |>
  ggplot() + geom_line(aes(x = date, y = (P6-P7)/gdp, color = CNA_PRODUIT)) +
  theme_minimal() + xlab("") + ylab("Exportations Nettes (% du PIB)") +
  scale_x_date(breaks = seq(1940, 2100, 5) |> paste0("-01-01") |> as.Date(),
               labels = date_format("%Y")) +
  scale_y_continuous(breaks = 0.01*seq(-100, 500, .1),
                labels = percent_format(accuracy = .1)) +

  theme(legend.position = c(0.35, 0.9),
        legend.title = element_blank()) +
  geom_hline(yintercept = 0, linetype = "dashed")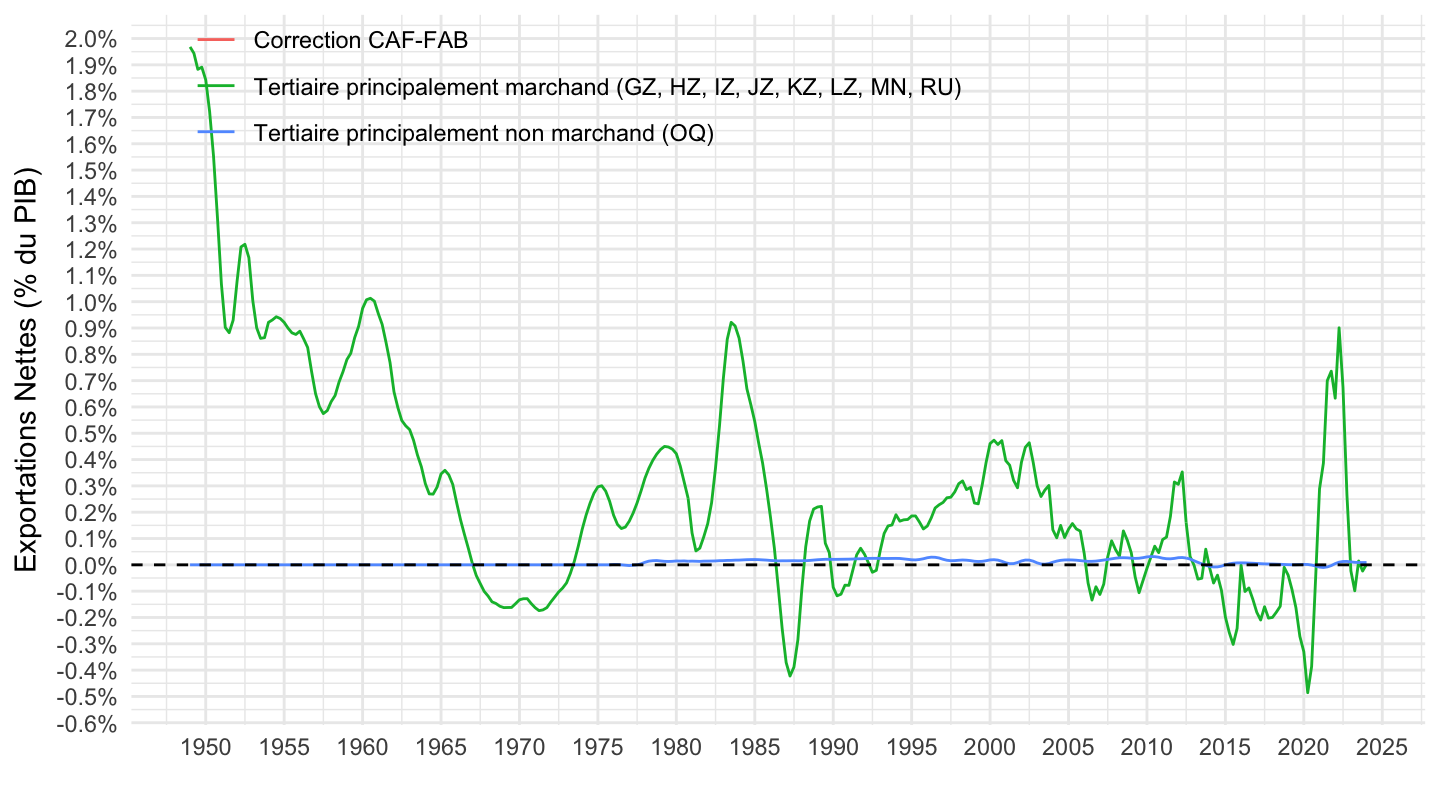
`CNT-2014-OPERATIONS` |>
  filter(OPERATION %in% c("P6", "P7"),
         FREQ == "T",
         CNA_PRODUIT %in% c("A17-GZ", "A17-JZ", "A17-KZ"),
         VALORISATION == "V") |>

  quarter_to_date() |>
  select(CNA_PRODUIT, OPERATION, date, OBS_VALUE) |>
  spread(OPERATION, OBS_VALUE) |>
  left_join(gdp_quarterly, by = "date") |>
  ggplot() + geom_line(aes(x = date, y = (P6-P7)/gdp, color = CNA_PRODUIT)) +
  theme_minimal() + xlab("") + ylab("Exportations Nettes (% du PIB)") +
  scale_x_date(breaks = seq(1940, 2100, 5) |> paste0("-01-01") |> as.Date(),
               labels = date_format("%Y")) +
  scale_y_continuous(breaks = 0.01*seq(-100, 500, .1),
                labels = percent_format(accuracy = .1)) +

  theme(legend.position = c(0.35, 0.9),
        legend.title = element_blank()) +
  geom_hline(yintercept = 0, linetype = "dashed")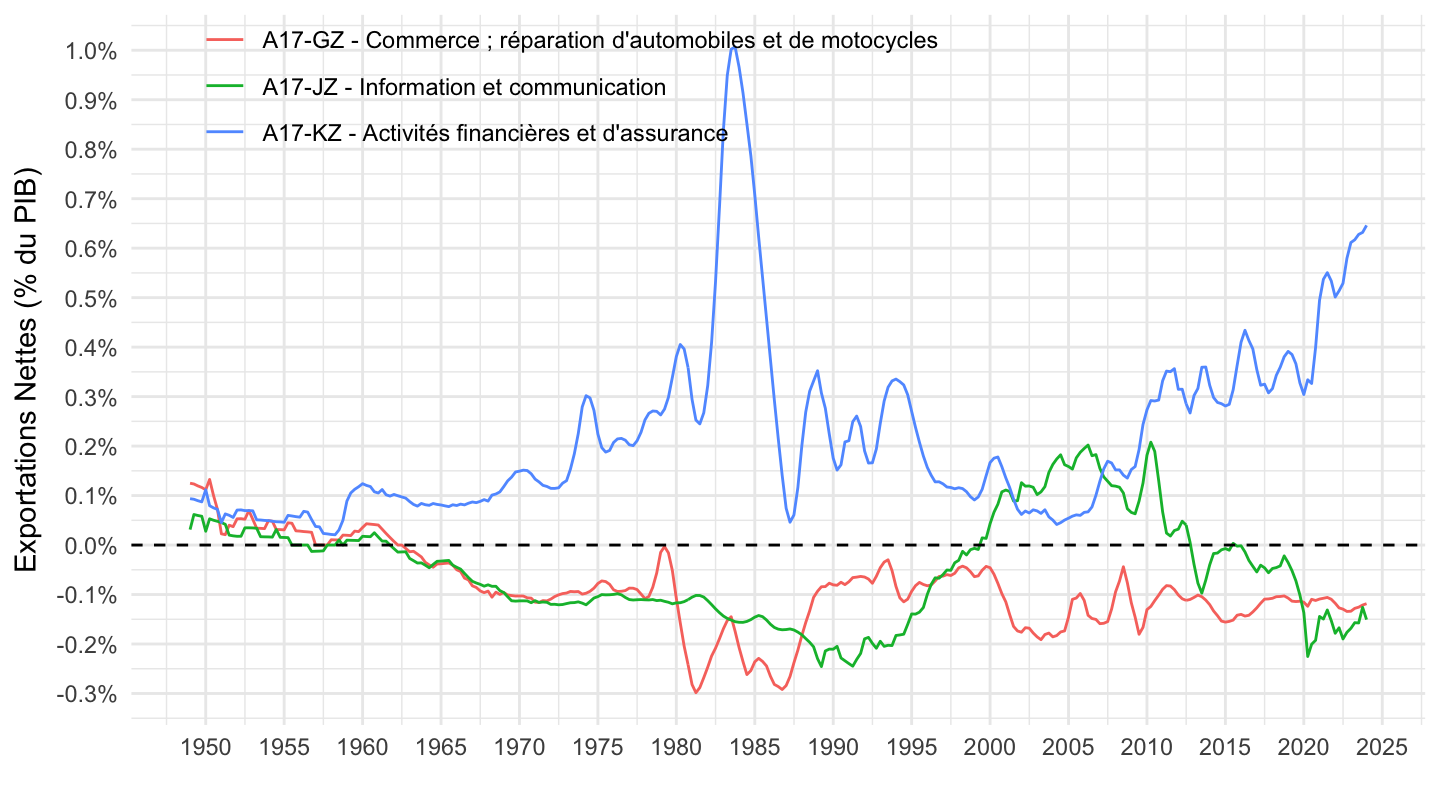
`CNT-2014-OPERATIONS` |>
  filter(OPERATION %in% c("P6", "P7"),
         FREQ == "T",
         CNA_PRODUIT %in% c("DS-CNT", "DB-CNT", "A17-HZ"),
         VALORISATION == "V") |>

  quarter_to_date() |>
  select(CNA_PRODUIT, OPERATION, date, OBS_VALUE) |>
  spread(OPERATION, OBS_VALUE) |>
  left_join(gdp_quarterly, by = "date") |>
  ggplot() + geom_line(aes(x = date, y = (P6-P7)/gdp, color = CNA_PRODUIT)) +
  theme_minimal() + xlab("") + ylab("Exportations Nettes (% du PIB)") +
  scale_x_date(breaks = seq(1940, 2100, 5) |> paste0("-01-01") |> as.Date(),
               labels = date_format("%Y")) +
  scale_y_continuous(breaks = 0.01*seq(-100, 500, .5),
                labels = percent_format(accuracy = .1)) +

  theme(legend.position = c(0.5, 0.9),
        legend.title = element_blank()) +
  geom_hline(yintercept = 0, linetype = "dashed")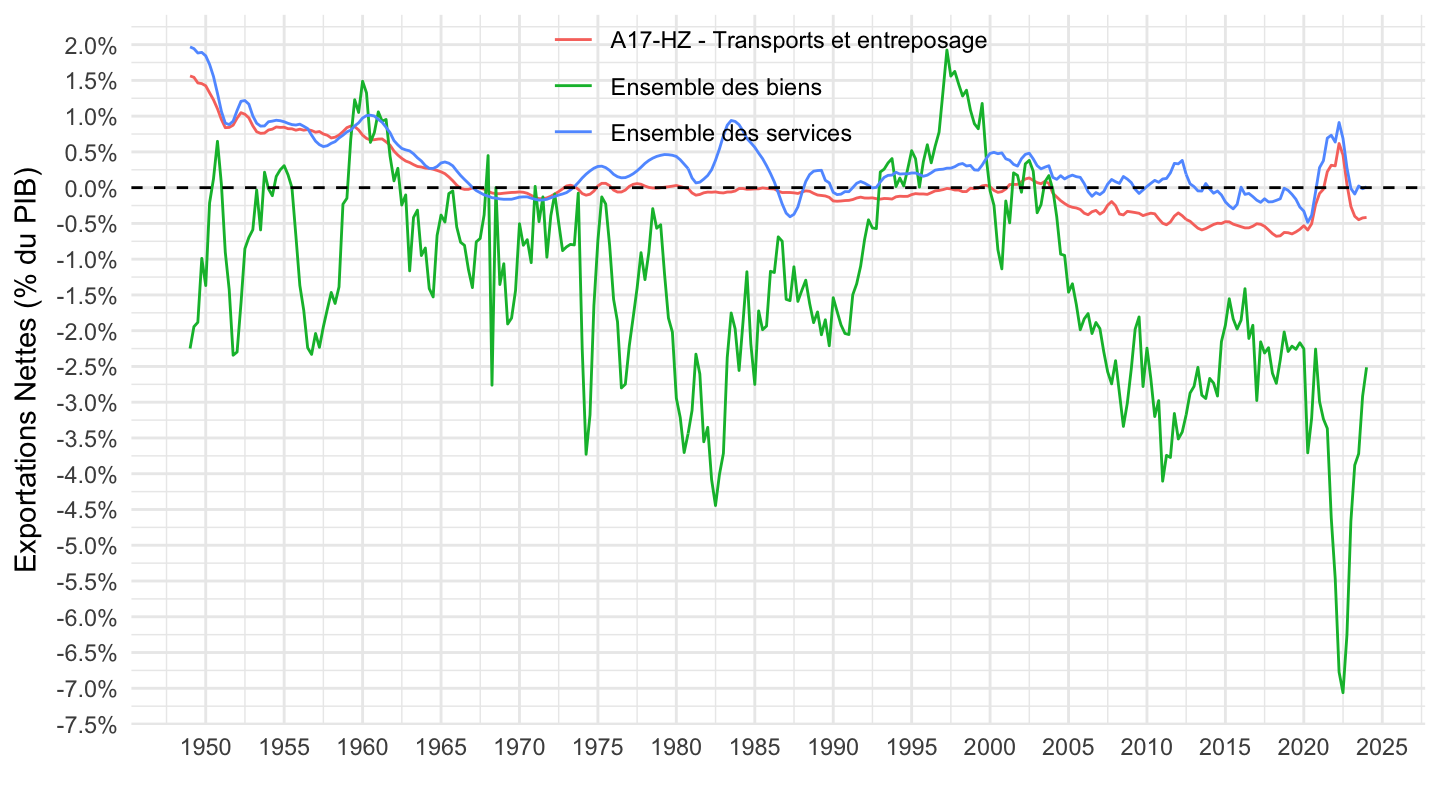
`CNT-2014-OPERATIONS` |>
  filter(OPERATION %in% c("P6", "P7"),
         FREQ == "T",
         CNA_PRODUIT %in% c("DS-CNT", "DB-CNT", "A17-HZ"),
         VALORISATION == "V") |>

  quarter_to_date() |>
  select(CNA_PRODUIT, OPERATION, date, OBS_VALUE) |>
  spread(OPERATION, OBS_VALUE) |>
  left_join(gdp_quarterly, by = "date") |>
  ggplot() + geom_line(aes(x = date, y = (P6-P7)/gdp, color = CNA_PRODUIT)) +
  theme_minimal() + xlab("") + ylab("Exportations Nettes (% du PIB)") +
  scale_x_date(breaks = seq(1940, 2100, 5) |> paste0("-01-01") |> as.Date(),
               labels = date_format("%Y")) +
  scale_y_continuous(breaks = 0.01*seq(-100, 500, .5),
                labels = percent_format(accuracy = .1)) +

  theme(legend.position = c(0.5, 0.9),
        legend.title = element_blank()) +
  geom_hline(yintercept = 0, linetype = "dashed")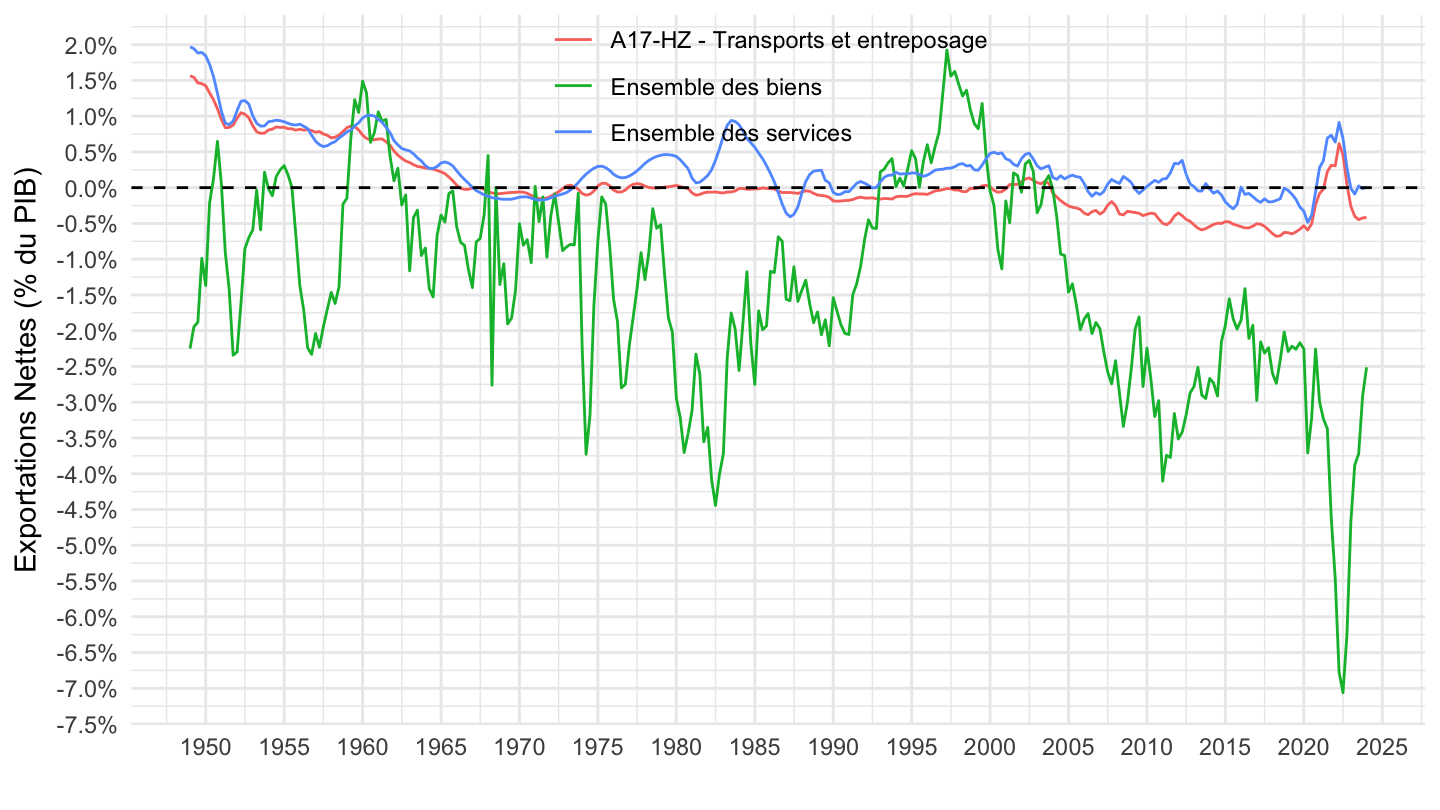
`CNT-2014-OPERATIONS` |>
  filter(OPERATION %in% c("P6", "P7"),
         FREQ == "T",
         CNA_PRODUIT %in% c("A17-RU", "A17-MN", "A17-HZ"),
         VALORISATION == "V") |>

  quarter_to_date() |>
  select(CNA_PRODUIT, OPERATION, date, OBS_VALUE) |>
  spread(OPERATION, OBS_VALUE) |>
  left_join(gdp_quarterly, by = "date") |>
  ggplot() + geom_line(aes(x = date, y = (P6-P7)/gdp, color = CNA_PRODUIT)) +
  theme_minimal() + xlab("") + ylab("Exportations Nettes (% du PIB)") +
  scale_x_date(breaks = seq(1940, 2100, 5) |> paste0("-01-01") |> as.Date(),
               labels = date_format("%Y")) +
  scale_y_continuous(breaks = 0.01*seq(-100, 500, .5),
                labels = percent_format(accuracy = .1)) +

  theme(legend.position = c(0.5, 0.9),
        legend.title = element_blank()) +
  geom_hline(yintercept = 0, linetype = "dashed")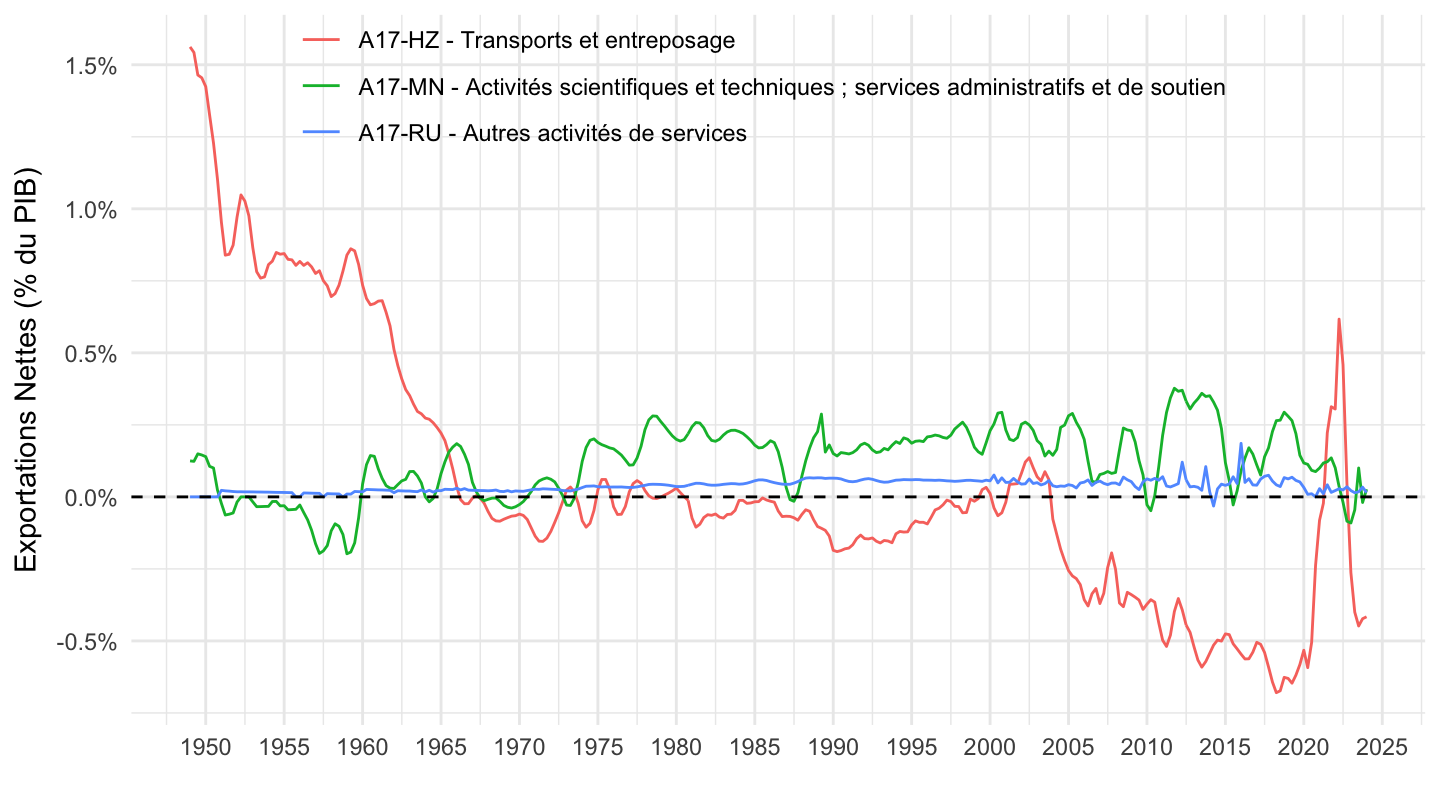
`CNT-2014-OPERATIONS` |>
  filter(OPERATION %in% c("P6", "P7"),
         FREQ == "T",
         CNA_PRODUIT %in% c("A17-HZ"),
         VALORISATION == "V") |>

  quarter_to_date() |>
  left_join(gdp_quarterly, by = "date") |>
  ggplot() + geom_line(aes(x = date, y = OBS_VALUE/gdp, color = OPERATION)) +
  theme_minimal() + xlab("") + ylab("Transports et entreposage (% du PIB)") +
  scale_x_date(breaks = seq(1940, 2100, 5) |> paste0("-01-01") |> as.Date(),
               labels = date_format("%Y")) +
  scale_y_continuous(breaks = 0.01*seq(-100, 500, .2),
                labels = percent_format(accuracy = .1)) +

  theme(legend.position = c(0.5, 0.9),
        legend.title = element_blank())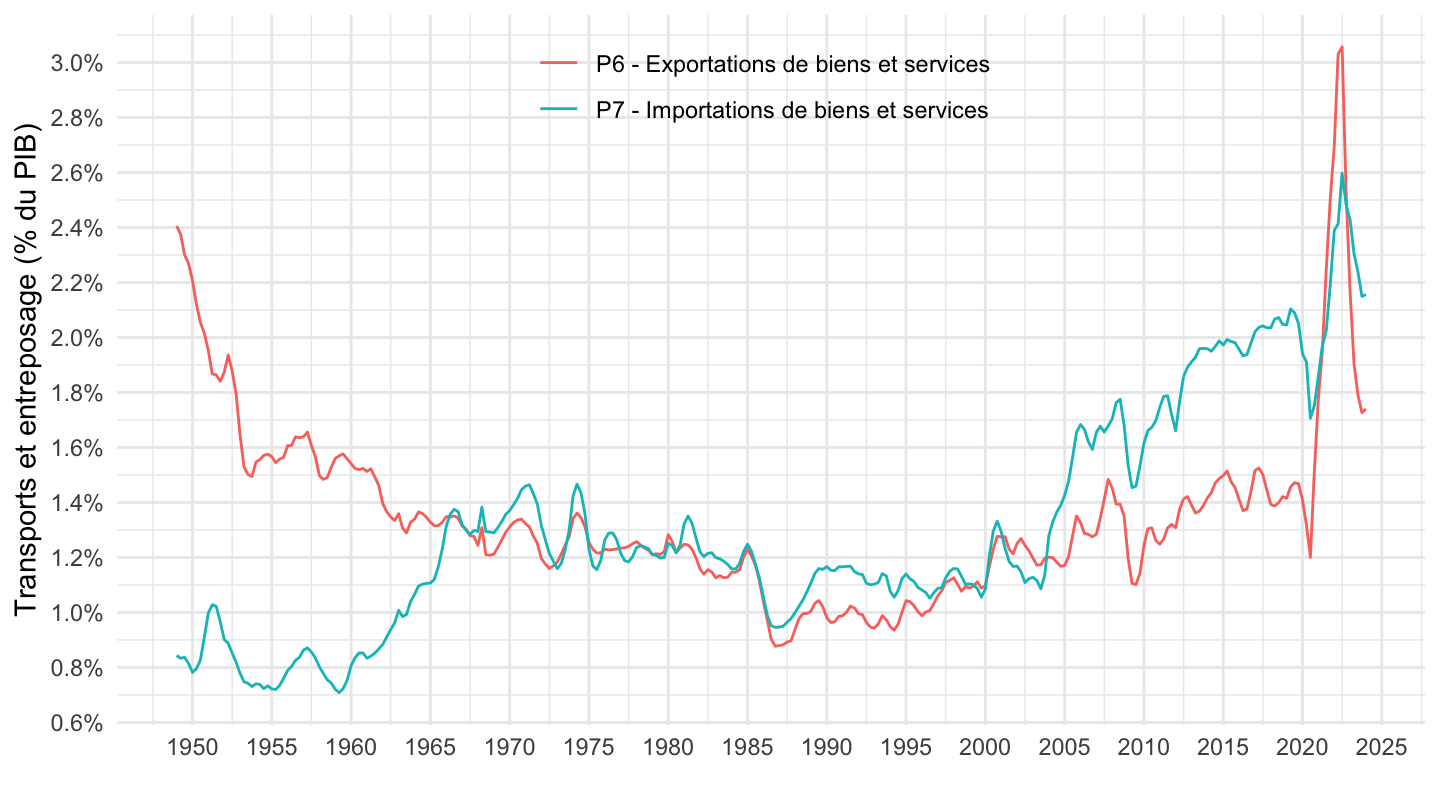
`CNT-2014-OPERATIONS` |>
  filter(OPERATION %in% c("P6", "P7"),
         FREQ == "T",
         CNA_PRODUIT %in% c("A17-KZ"),
         VALORISATION == "V") |>

  quarter_to_date() |>
  left_join(gdp_quarterly, by = "date") |>
  ggplot() + geom_line(aes(x = date, y = OBS_VALUE/gdp, color = OPERATION)) +
  theme_minimal() + xlab("") + ylab("Activités financi!res et assurances (% du PIB)") +
  scale_x_date(breaks = seq(1940, 2100, 5) |> paste0("-01-01") |> as.Date(),
               labels = date_format("%Y")) +
  scale_y_continuous(breaks = 0.01*seq(-100, 500, .2),
                labels = percent_format(accuracy = .1)) +

  theme(legend.position = c(0.8, 0.9),
        legend.title = element_blank())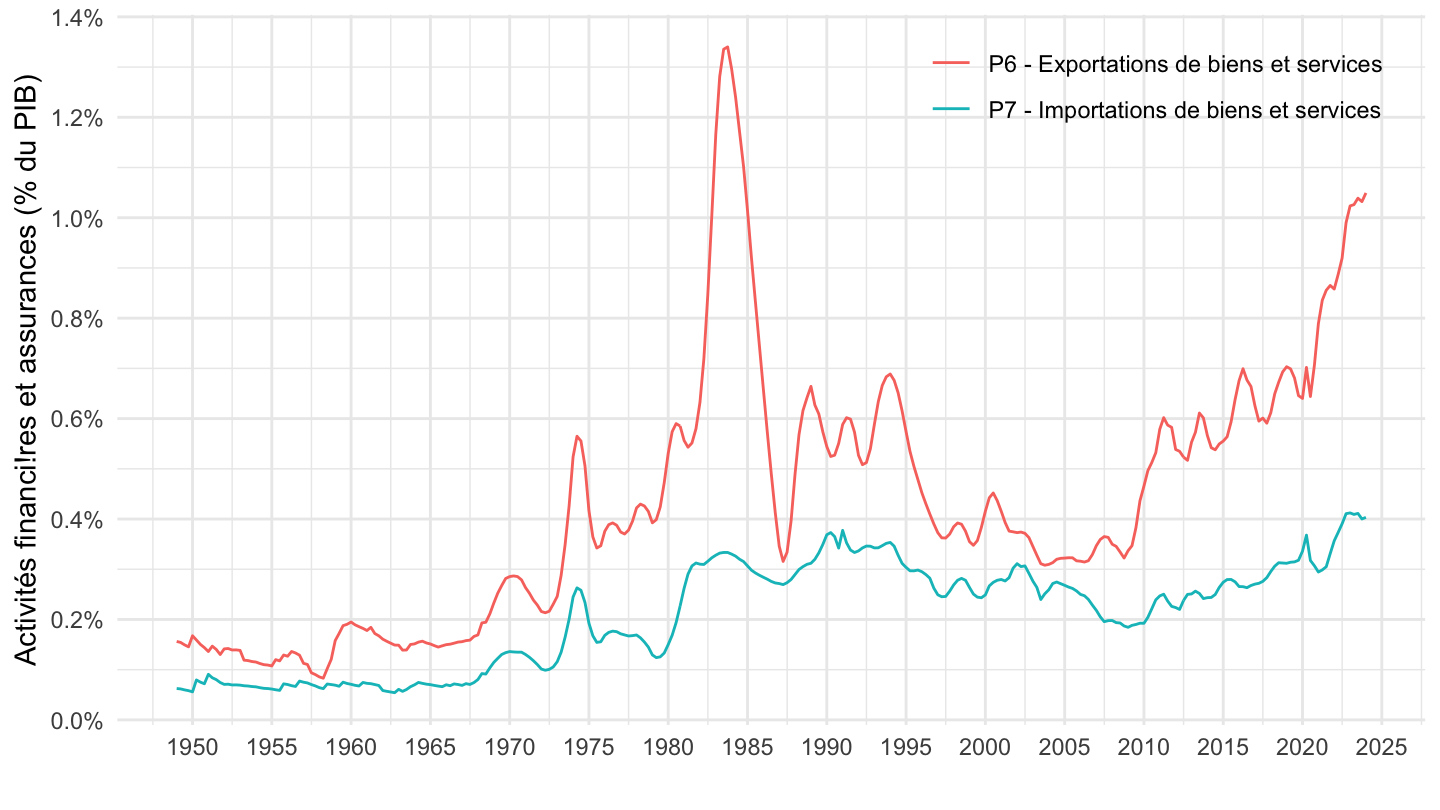
i_g("bib/douanes/3T2022/tableaux-exportations.png")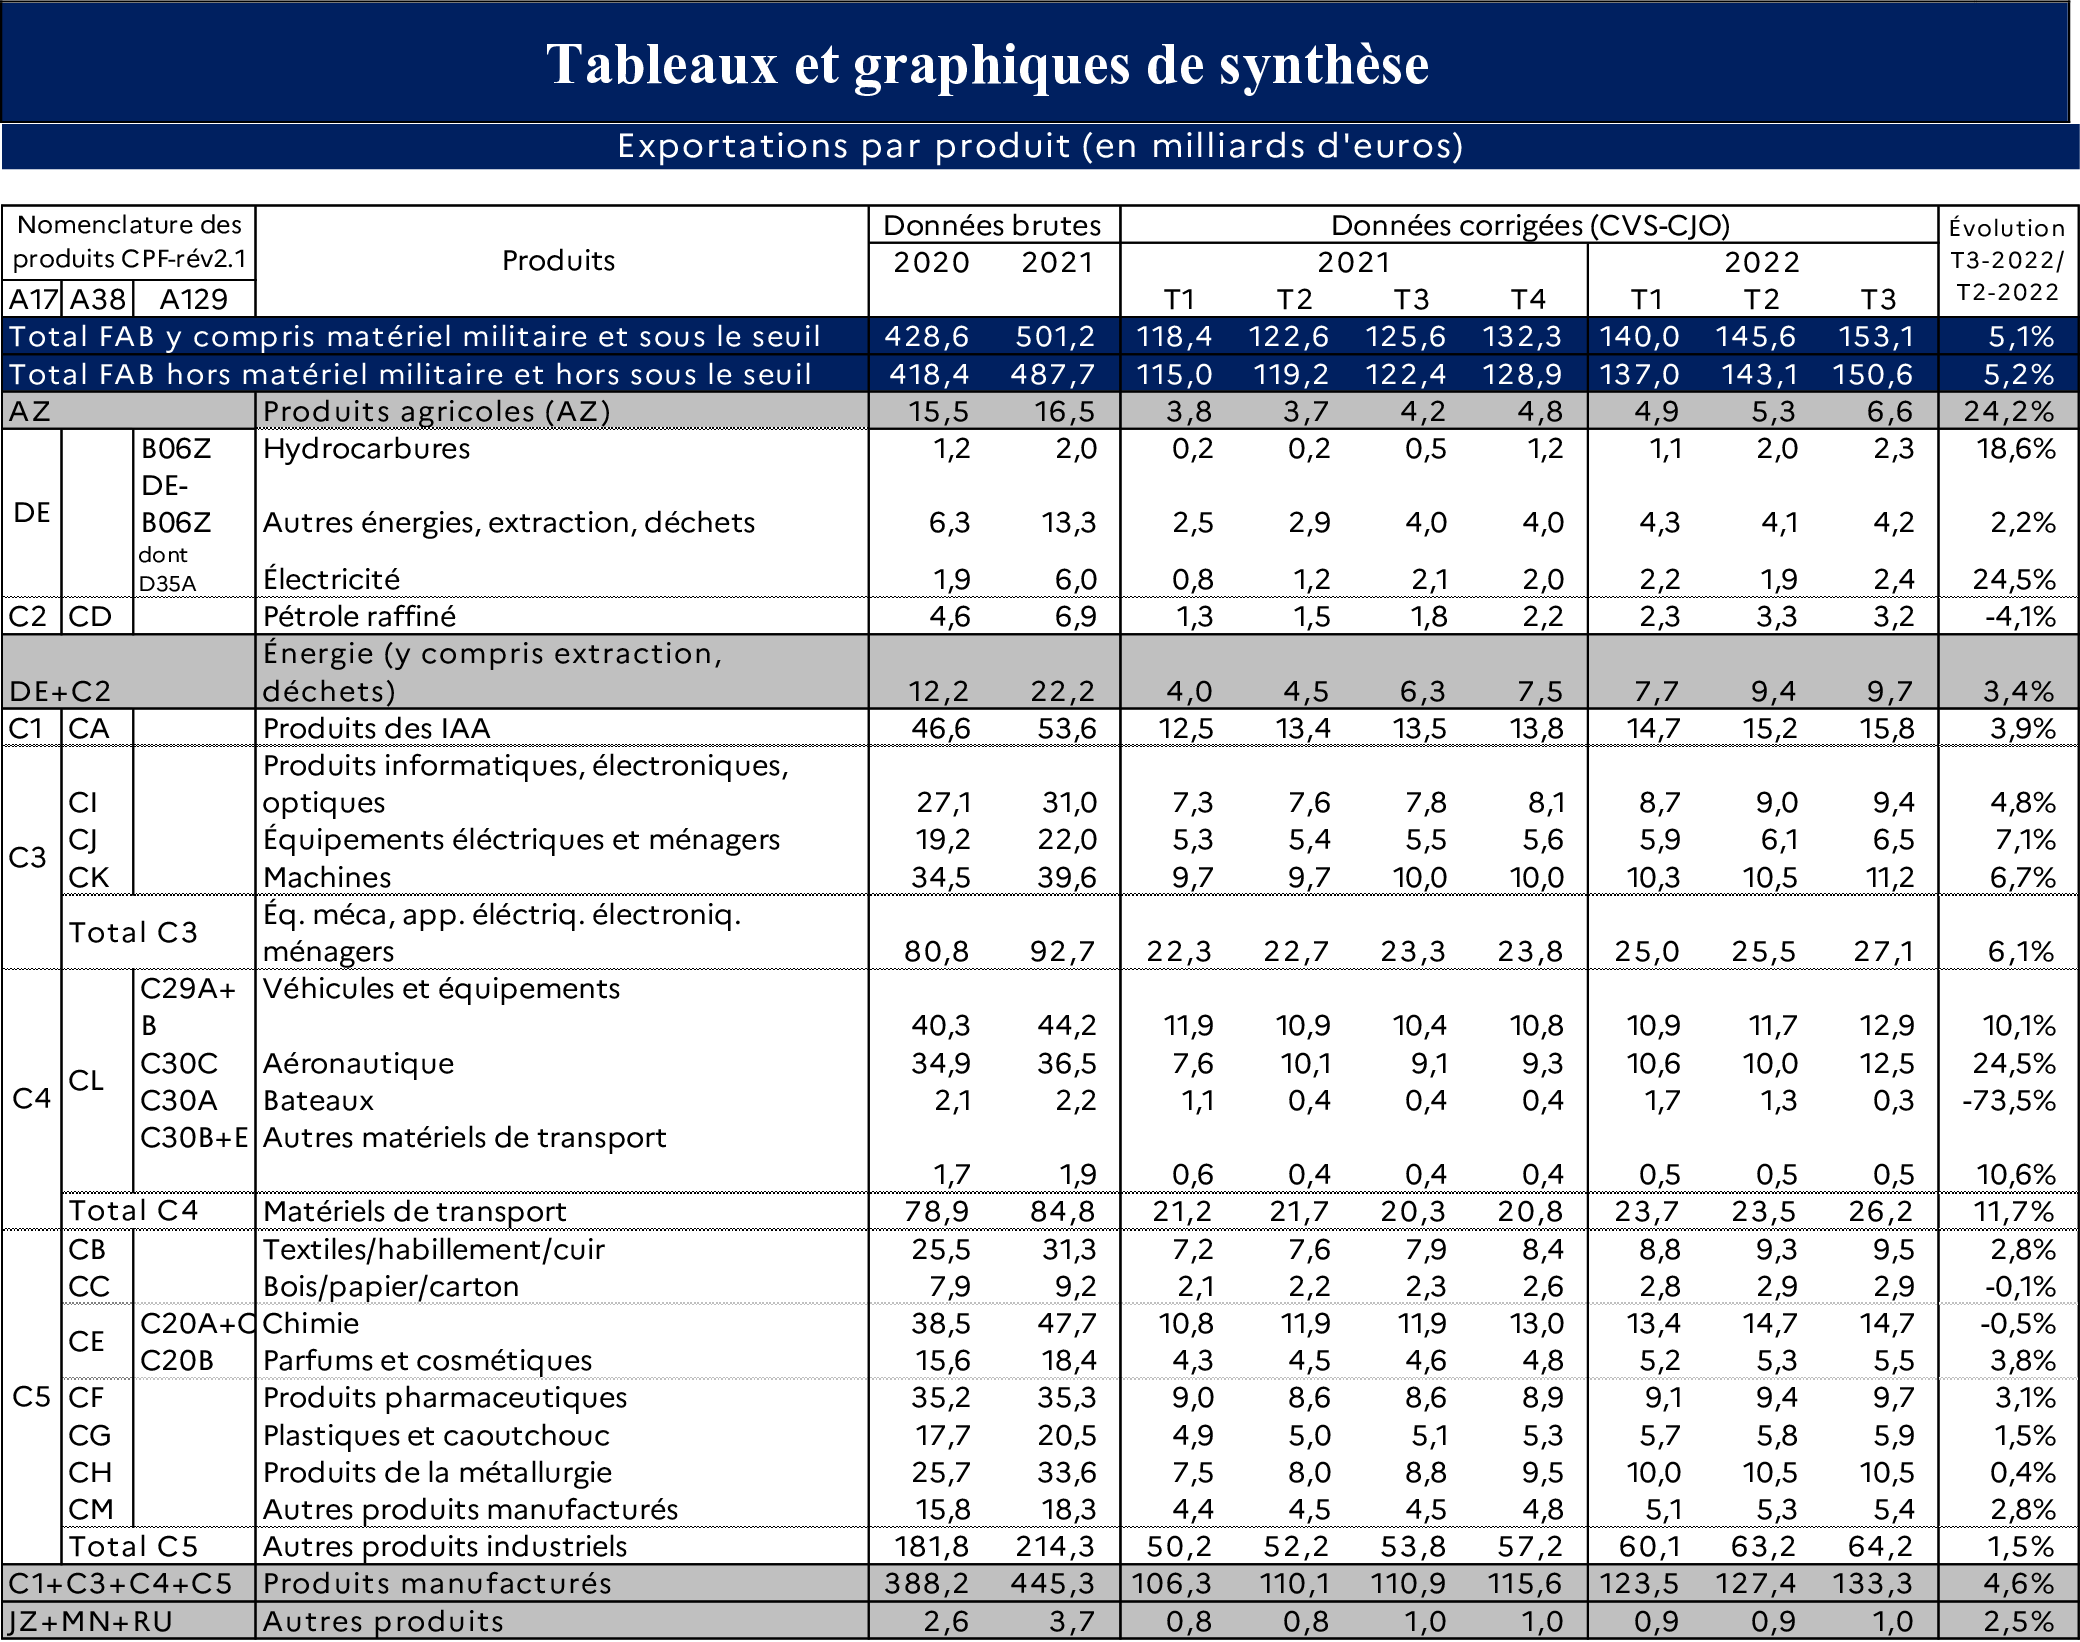
`CNT-2014-OPERATIONS` |>
  filter(OPERATION %in% c("P6"),
         FREQ == "T",
         TIME_PERIOD == "2022-Q3") |>


  mutate(OBS_VALUE = OBS_VALUE / 1000) |>
  select(CNA_PRODUIT, Valorisation, OBS_VALUE) |>
  spread(Valorisation, OBS_VALUE) |>
  arrange(-`Valeurs aux prix courants`) |>
print_table_conditional()| CNA_PRODUIT | Valeurs aux prix courants | Volumes aux prix de l'année précédente chaînés |
|---|---|---|
| DB-CNT | 161.455 | 127.674 |
| DI-CNT | 154.863 | 123.140 |
| DIM-CNT | 145.847 | 120.815 |
| A17-C5 | 68.803 | 56.478 |
| DS-CNT | 60.482 | 46.898 |
| DSM-CNT | 60.213 | 46.660 |
| A17-C4 | 30.496 | 24.997 |
| A17-C3 | 26.378 | 23.701 |
| A17-MN | 23.401 | 20.818 |
| A17-HZ | 20.394 | 10.178 |
| A17-C1 | 15.874 | 12.629 |
| A17-PCHTR | 15.585 | 13.562 |
| A17-DE | 9.016 | 2.732 |
| A17-JZ | 7.272 | 7.409 |
| A17-AZ | 6.592 | 4.510 |
| A17-KZ | 6.134 | 5.646 |
| A17-C2 | 4.297 | 2.749 |
| A17-GZ | 1.904 | 1.838 |
| A17-RU | 1.107 | 1.018 |
| A17-OQ | 0.269 | 0.234 |
| DSN-CNT | 0.269 | 0.234 |
`CNT-2014-OPERATIONS` |>
  filter(OPERATION %in% c("P6"),
         FREQ == "T",
         CNA_PRODUIT %in% c("DIM-CNT", "DI-CNT", "DB-CNT")) |>


  quarter_to_date() |>
  mutate(OBS_VALUE = OBS_VALUE / 1000) |>
  ggplot() + geom_line(aes(x = date, y = OBS_VALUE, color = CNA_PRODUIT, linetype = VALORISATION)) +
  theme_minimal() + xlab("") + ylab("Exportations, Mds€, valeurs ou volumes") +
  scale_x_date(breaks = seq(1940, 2100, 10) |> paste0("-01-01") |> as.Date(),
               labels = date_format("%Y")) +
  scale_linetype_manual(values = c("dashed", "solid")) +
  scale_y_continuous(breaks = seq(-100, 500, 10),
                     labels = dollar_format(pre = "", su = " Mds€")) +
  theme(legend.position = c(0.25, 0.75),
        legend.title = element_blank())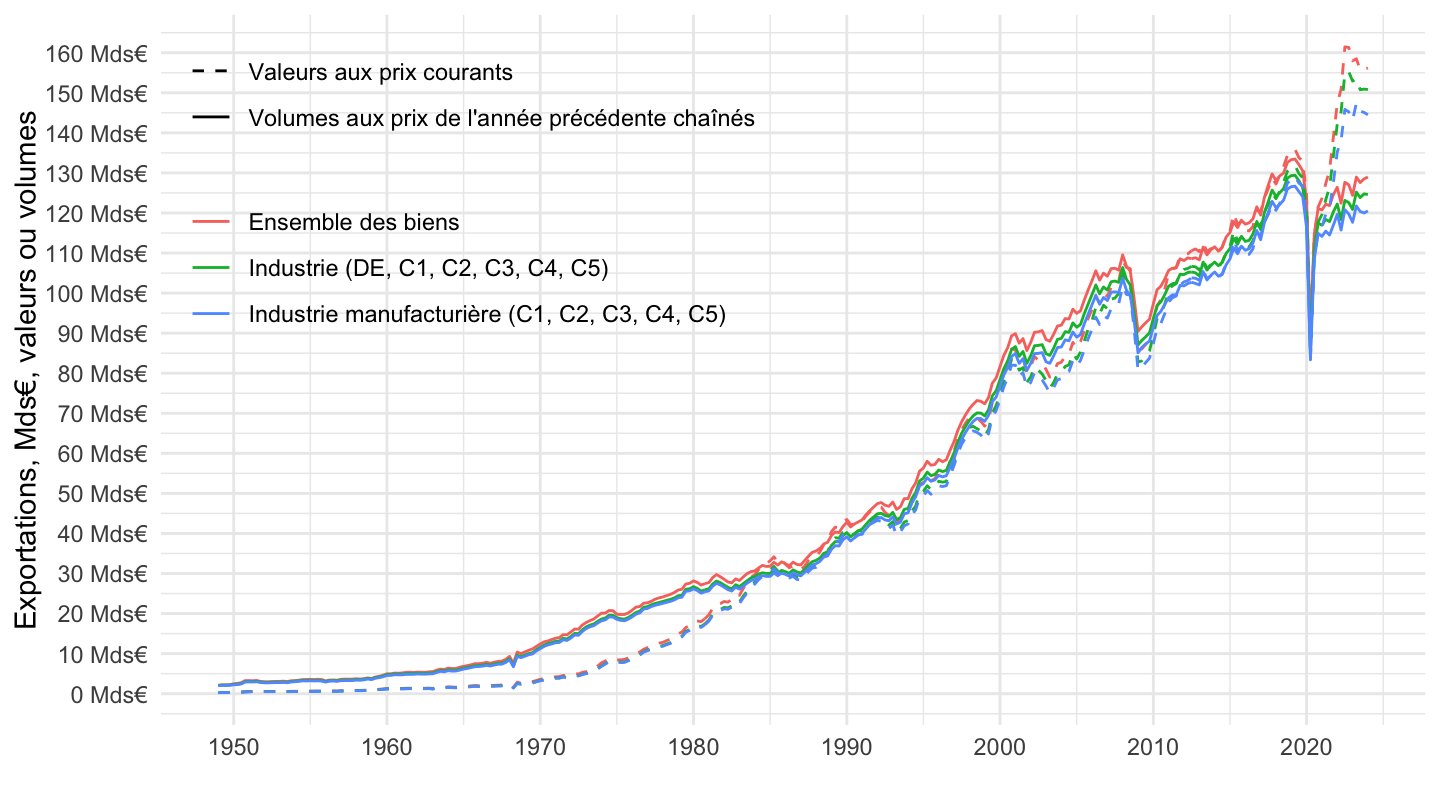
`CNT-2014-OPERATIONS` |>
  filter(OPERATION %in% c("P6"),
         FREQ == "T",
         CNA_PRODUIT %in% c("DIM-CNT", "DI-CNT", "DB-CNT")) |>


  quarter_to_date() |>
  filter(date >= as.Date("1995-01-01")) |>
  mutate(OBS_VALUE = OBS_VALUE / 1000) |>
  ggplot() + geom_line(aes(x = date, y = OBS_VALUE, color = CNA_PRODUIT, linetype = VALORISATION)) +
  theme_minimal() + xlab("") + ylab("Exportations, Mds€, valeurs ou volumes") +
  scale_x_date(breaks = seq(1940, 2100, 5) |> paste0("-01-01") |> as.Date(),
               labels = date_format("%Y")) +
  scale_linetype_manual(values = c("dashed", "solid")) +
  scale_y_continuous(breaks = seq(-100, 500, 10),
                     labels = dollar_format(pre = "", su = " Mds€")) +
  theme(legend.position = c(0.25, 0.8),
        legend.title = element_blank())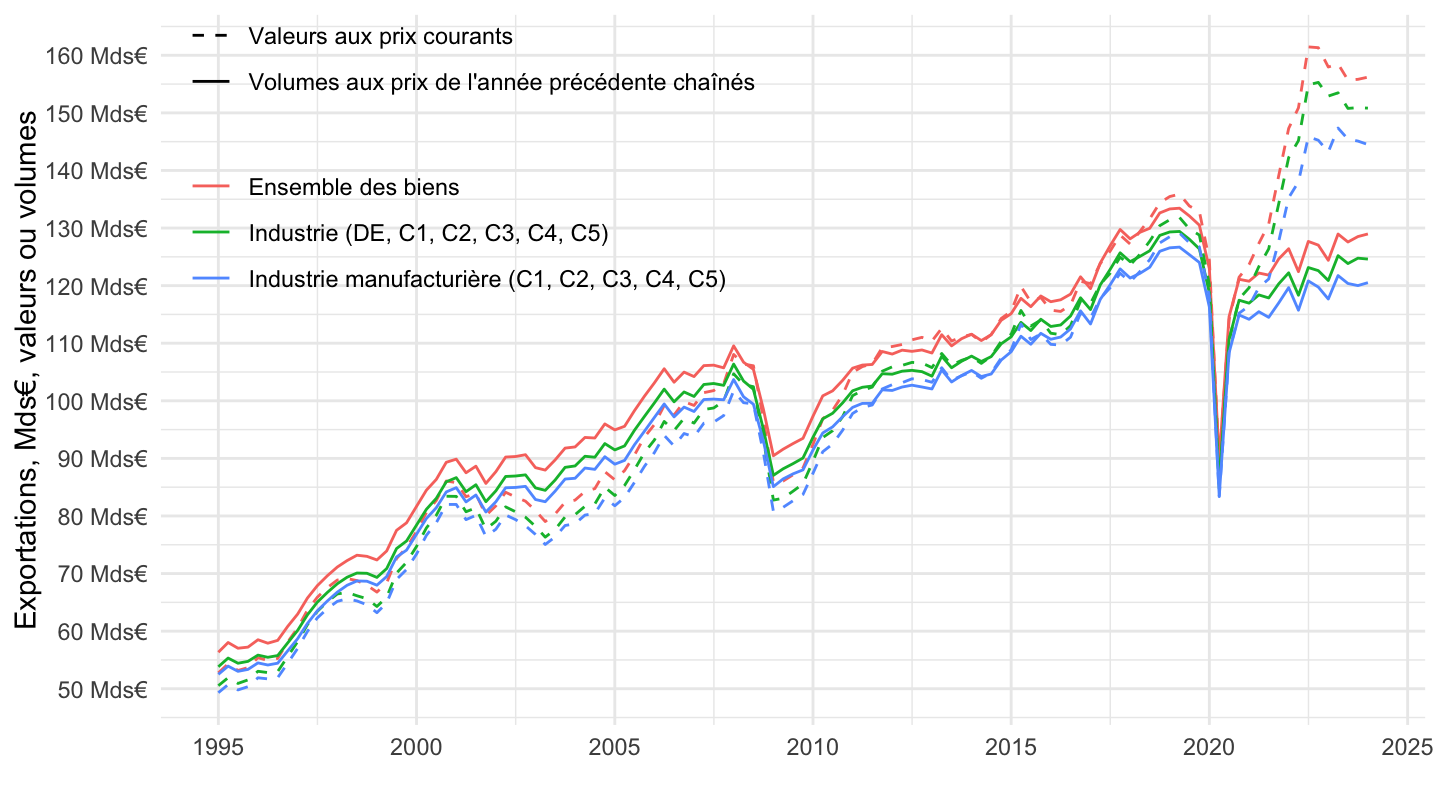
`CNT-2014-OPERATIONS` |>
  filter(OPERATION %in% c("P6"),
         FREQ == "T",
         CNA_PRODUIT %in% c("DIM-CNT", "DI-CNT", "DB-CNT")) |>


  quarter_to_date() |>
  filter(date >= as.Date("2000-01-01")) |>
  mutate(OBS_VALUE = OBS_VALUE / 1000) |>
  ggplot() + geom_line(aes(x = date, y = OBS_VALUE, color = CNA_PRODUIT, linetype = VALORISATION)) +
  theme_minimal() + xlab("") + ylab("Exportations, Mds€, valeurs ou volumes") +
  scale_x_date(breaks = seq(1940, 2100, 2) |> paste0("-01-01") |> as.Date(),
               labels = date_format("%Y")) +
  scale_linetype_manual(values = c("dashed", "solid")) +
  scale_y_continuous(breaks = seq(-100, 500, 10),
                     labels = dollar_format(pre = "", su = " Mds€")) +
  theme(legend.position = c(0.25, 0.8),
        legend.title = element_blank())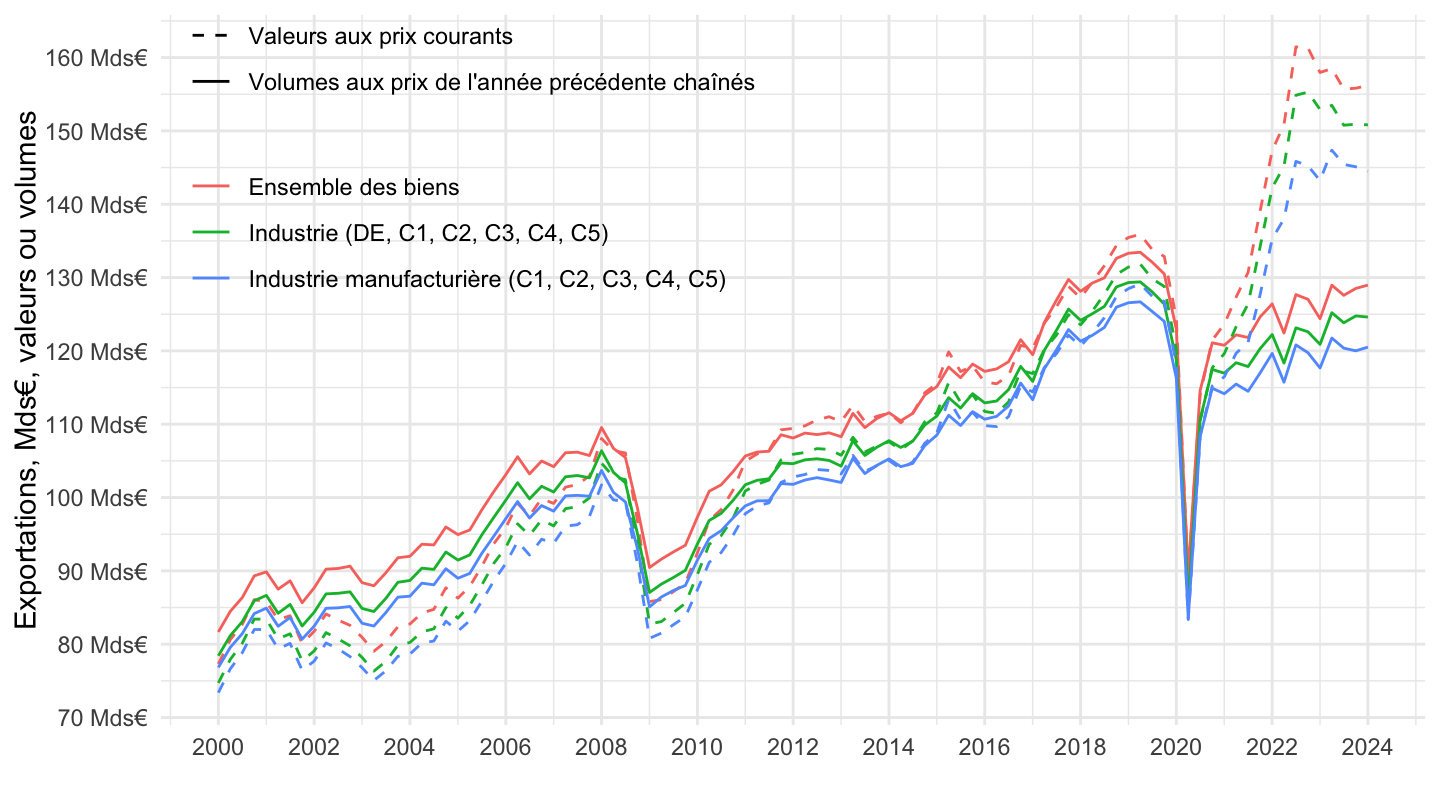
`CNT-2014-OPERATIONS` |>
  filter(OPERATION %in% c("P6"),
         FREQ == "T",
         CNA_PRODUIT %in% c("DIM-CNT", "DI-CNT", "DB-CNT")) |>


  quarter_to_date() |>
  filter(date >= as.Date("2017-07-01")) |>
  mutate(OBS_VALUE = OBS_VALUE / 1000) |>
  ggplot() + geom_line(aes(x = date, y = OBS_VALUE, color = CNA_PRODUIT, linetype = VALORISATION)) +
  theme_minimal() + xlab("") + ylab("Exportations, Mds€, valeurs ou volumes") +
  scale_x_date(breaks = seq(1940, 2100, 1) |> paste0("-01-01") |> as.Date(),
               labels = date_format("%Y")) +
  scale_linetype_manual(values = c("dashed", "solid")) +
  scale_y_continuous(breaks = seq(-100, 500, 10),
                     labels = dollar_format(pre = "", su = " Mds€")) +
  theme(legend.position = c(0.25, 0.25),
        legend.title = element_blank())
`CNT-2014-OPERATIONS` |>
  filter(OPERATION %in% c("P6"),
         FREQ == "T",
         CNA_PRODUIT %in% c("A17-C1", "A17-C2", "A17-C3", "A17-C4", "A17-C5")) |>
  quarter_to_date() |>
  mutate(OBS_VALUE = OBS_VALUE / 1000) |>
  ggplot() + geom_line(aes(x = date, y = OBS_VALUE, color = CNA_PRODUIT, linetype = VALORISATION)) +
  theme_minimal() + xlab("") + ylab("Exportations, Mds€, valeurs ou volumes") +
  scale_x_date(breaks = seq(1940, 2100, 10) |> paste0("-01-01") |> as.Date(),
               labels = date_format("%Y")) +
  scale_linetype_manual(values = c("dashed", "solid")) +
  scale_y_continuous(breaks = seq(-100, 500, 10),
                     labels = dollar_format(pre = "", su = " Mds€")) +
  theme(legend.position = c(0.47, 0.75),
        legend.title = element_blank())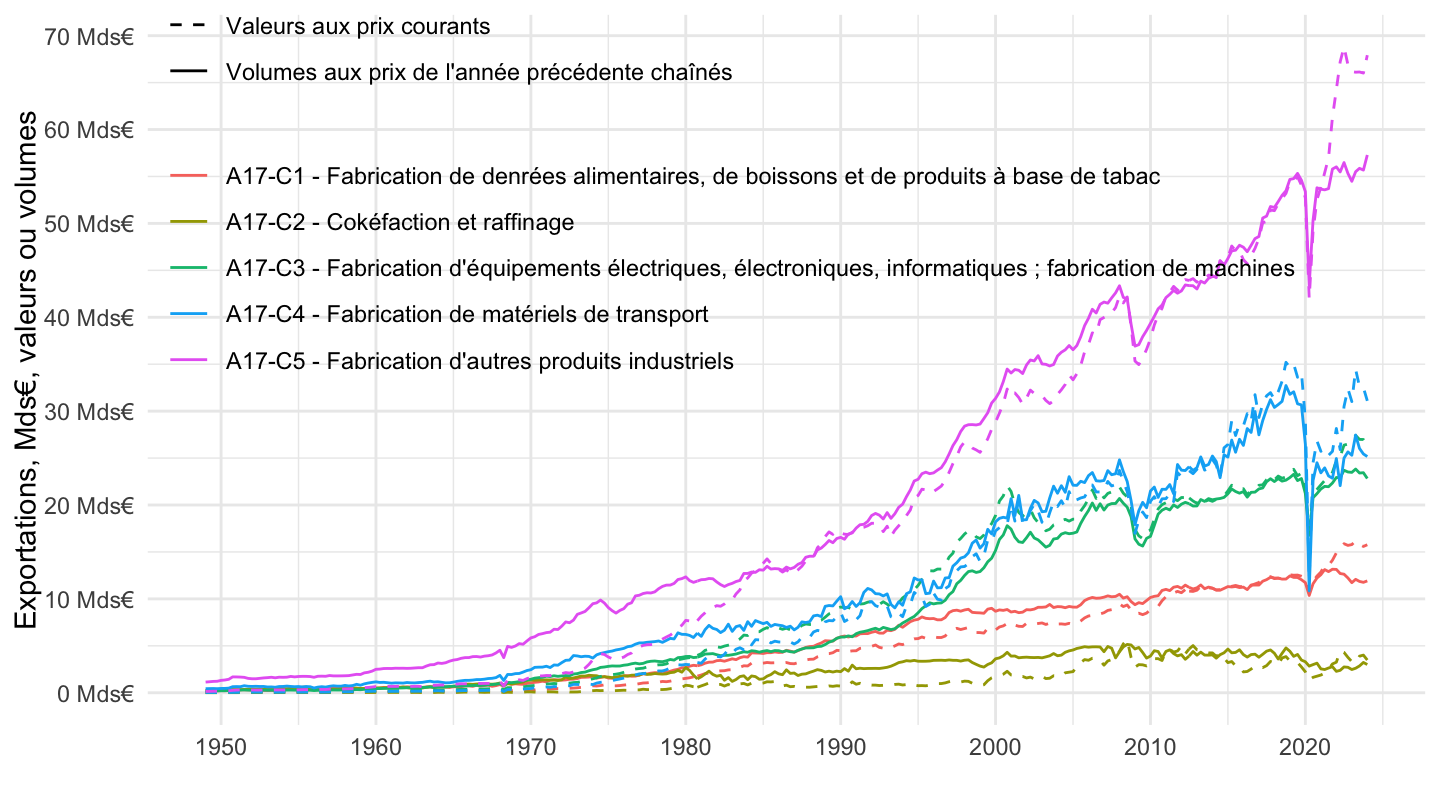
`CNT-2014-OPERATIONS` |>
  filter(OPERATION %in% c("P6"),
         FREQ == "T",
         CNA_PRODUIT %in% c("A17-C1", "A17-C2", "A17-C3", "A17-C4", "A17-C5")) |>
  quarter_to_date() |>
  filter(date >= as.Date("1995-01-01")) |>
  mutate(OBS_VALUE = OBS_VALUE / 1000) |>
  ggplot() + geom_line(aes(x = date, y = OBS_VALUE, color = CNA_PRODUIT, linetype = VALORISATION)) +
  theme_minimal() + xlab("") + ylab("Exportations, Mds€, valeurs ou volumes") +
  scale_x_date(breaks = seq(1940, 2100, 5) |> paste0("-01-01") |> as.Date(),
               labels = date_format("%Y")) +
  scale_linetype_manual(values = c("dashed", "solid")) +
  scale_y_continuous(breaks = seq(-100, 500, 10),
                     labels = dollar_format(pre = "", su = " Mds€")) +
  theme(legend.position = c(0.47, 0.75),
        legend.title = element_blank())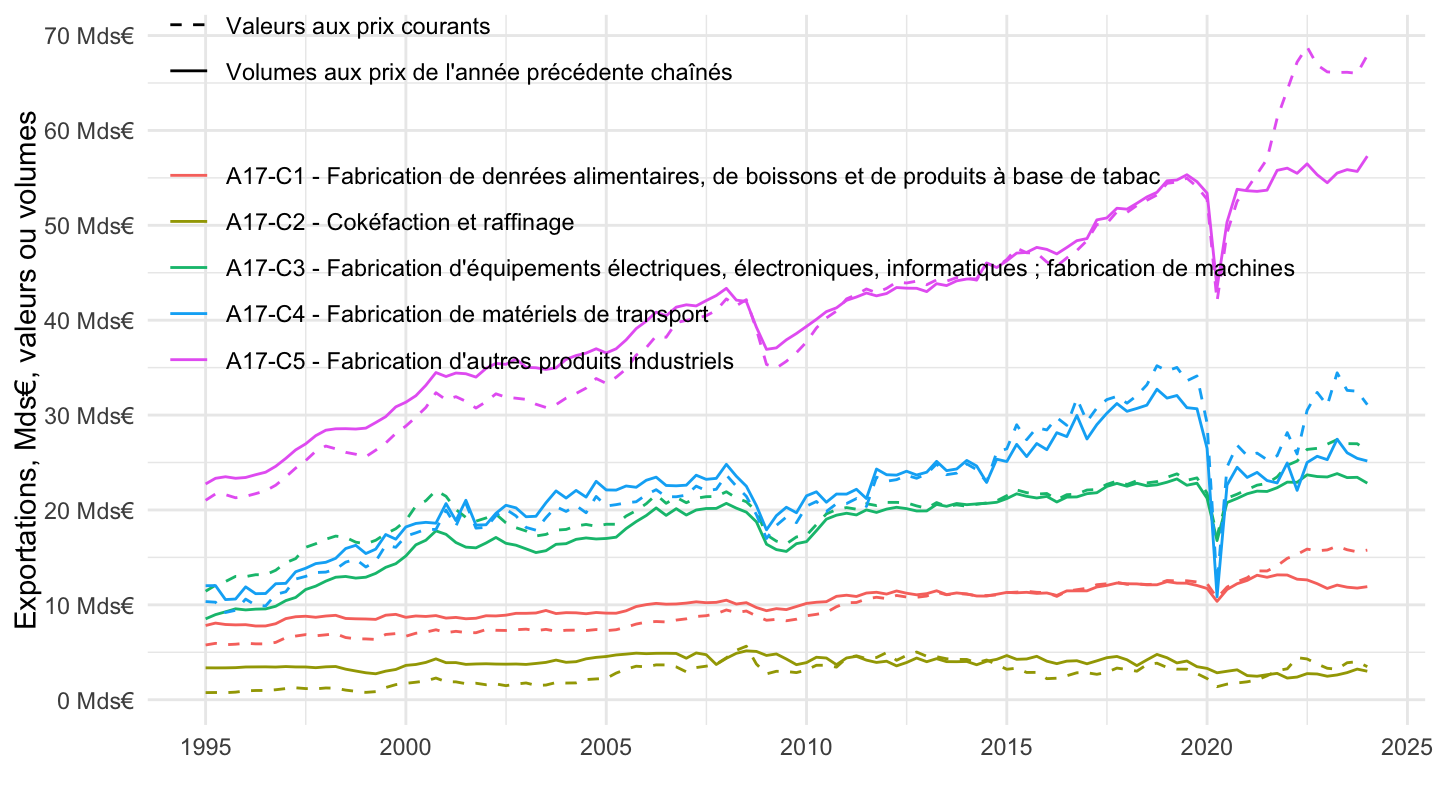
`CNT-2014-OPERATIONS` |>
  filter(OPERATION %in% c("P6"),
         FREQ == "T",
         CNA_PRODUIT %in% c("A17-C1", "A17-C2", "A17-C3", "A17-C4", "A17-C5")) |>
  quarter_to_date() |>
  filter(date >= as.Date("2000-01-01")) |>
  mutate(OBS_VALUE = OBS_VALUE / 1000) |>
  ggplot() + geom_line(aes(x = date, y = OBS_VALUE, color = CNA_PRODUIT, linetype = VALORISATION)) +
  theme_minimal() + xlab("") + ylab("Exportations, Mds€, valeurs ou volumes") +
  scale_x_date(breaks = seq(1940, 2100, 2) |> paste0("-01-01") |> as.Date(),
               labels = date_format("%Y")) +
  scale_linetype_manual(values = c("dashed", "solid")) +
  scale_y_continuous(breaks = seq(-100, 500, 10),
                     labels = dollar_format(pre = "", su = " Mds€")) +
  theme(legend.position = c(0.47, 0.75),
        legend.title = element_blank())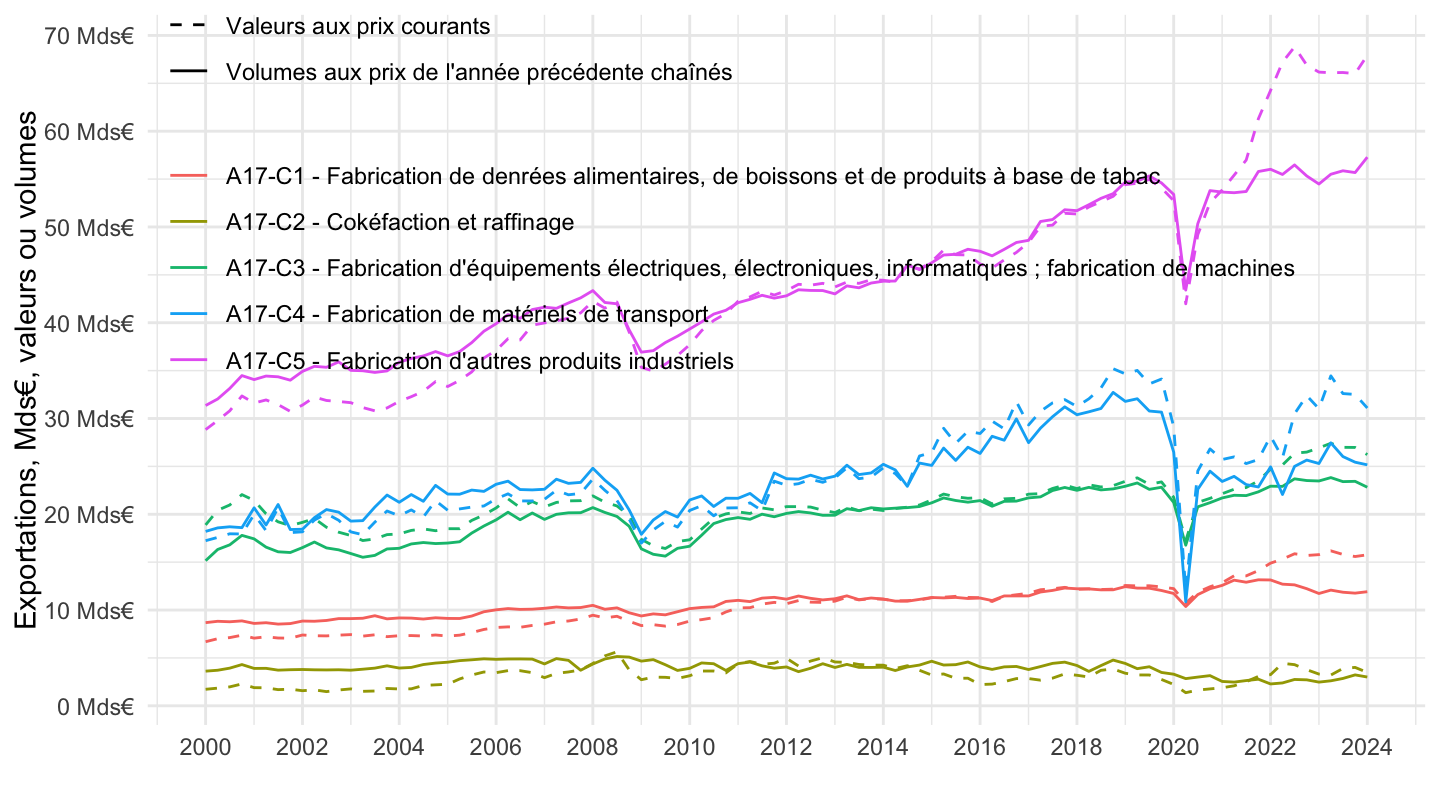
`CNT-2014-OPERATIONS` |>
  filter(OPERATION %in% c("P6"),
         FREQ == "T",
         CNA_PRODUIT %in% c("A17-C1", "A17-C2", "A17-C3", "A17-C4", "A17-C5")) |>
  quarter_to_date() |>
  filter(date >= as.Date("2017-07-01")) |>
  mutate(OBS_VALUE = OBS_VALUE / 1000) |>
  ggplot() + geom_line(aes(x = date, y = OBS_VALUE, color = CNA_PRODUIT, linetype = VALORISATION)) +
  theme_minimal() + xlab("") + ylab("Exportations, Mds€, valeurs ou volumes") +
  scale_x_date(breaks = seq(1940, 2100, 1) |> paste0("-01-01") |> as.Date(),
               labels = date_format("%Y")) +
  scale_linetype_manual(values = c("dashed", "solid")) +
  scale_y_continuous(breaks = seq(-100, 500, 10),
                     labels = dollar_format(pre = "", su = " Mds€")) +
  theme(legend.position = c(0.47, 0.75),
        legend.title = element_blank())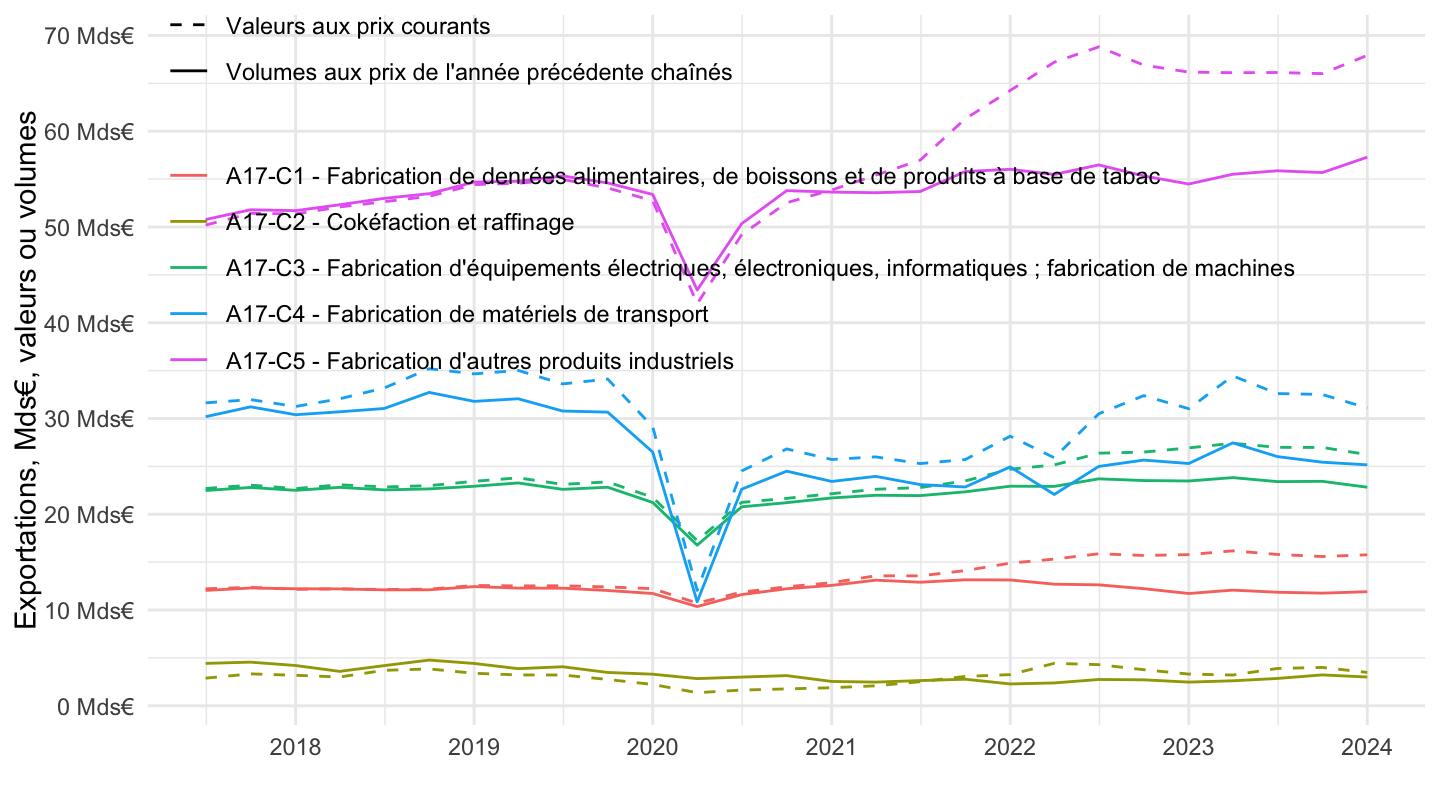
`CNT-2014-OPERATIONS` |>
  filter(OPERATION %in% c("P7"),
         FREQ == "T",
         TIME_PERIOD == "2022-Q3") |>
  mutate(OBS_VALUE = OBS_VALUE / 1000) |>
  select(CNA_PRODUIT, Valorisation, OBS_VALUE) |>
  spread(Valorisation, OBS_VALUE) |>
  arrange(-`Valeurs aux prix courants`) |>
print_table_conditional()| CNA_PRODUIT | Valeurs aux prix courants | Volumes aux prix de l'année précédente chaînés |
|---|---|---|
| DB-CNT | 208.566 | 159.657 |
| DI-CNT | 203.899 | 156.136 |
| DIM-CNT | 169.028 | 141.186 |
| A17-C5 | 78.424 | 62.376 |
| DS-CNT | 55.891 | 47.716 |
| DSM-CNT | 55.707 | 47.436 |
| A17-C3 | 38.517 | 36.495 |
| A17-DE | 34.870 | 14.158 |
| A17-C4 | 27.568 | 23.908 |
| A17-MN | 23.524 | 20.918 |
| A17-HZ | 17.326 | 12.320 |
| A17-C1 | 14.411 | 11.275 |
| A17-C2 | 10.108 | 6.583 |
| A17-PCHTR | 9.497 | 8.263 |
| A17-JZ | 8.538 | 8.369 |
| A17-AZ | 4.667 | 3.546 |
| A17-GZ | 2.768 | 2.670 |
| A17-KZ | 2.605 | 2.443 |
| A17-RU | 0.946 | 0.857 |
| A17-OQ | 0.184 | 0.278 |
| DSN-CNT | 0.184 | 0.278 |
| A17-PCAFAB | -6.653 | -3.433 |
`CNT-2014-OPERATIONS` |>
  filter(OPERATION %in% c("P7"),
         FREQ == "T",
         CNA_PRODUIT %in% c("DIM-CNT", "DI-CNT", "DB-CNT")) |>
  quarter_to_date() |>
  mutate(OBS_VALUE = OBS_VALUE / 1000) |>
  ggplot() + geom_line(aes(x = date, y = OBS_VALUE, color = Cna_produit, linetype = Valorisation)) +
  theme_minimal() + xlab("") + ylab("Exportations, Mds€, valeurs ou volumes") +
  scale_x_date(breaks = seq(1940, 2100, 10) |> paste0("-01-01") |> as.Date(),
               labels = date_format("%Y")) +
  scale_linetype_manual(values = c("dashed", "solid")) +
  scale_y_continuous(breaks = seq(-100, 500, 10),
                     labels = dollar_format(pre = "", su = " Mds€")) +
  theme(legend.position = c(0.25, 0.75),
        legend.title = element_blank())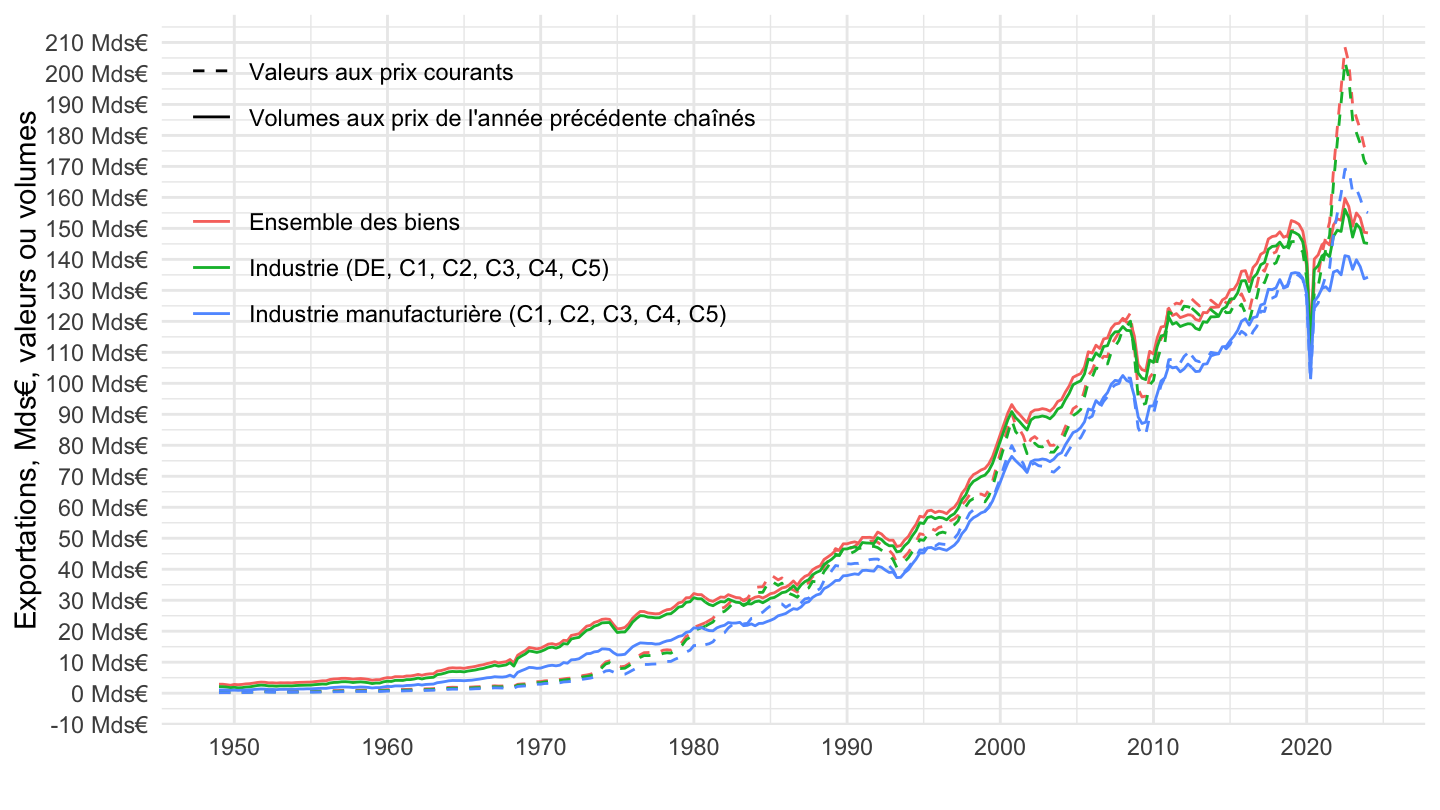
`CNT-2014-OPERATIONS` |>
  filter(OPERATION %in% c("P7"),
         FREQ == "T",
         CNA_PRODUIT %in% c("DIM-CNT", "DI-CNT", "DB-CNT")) |>
  quarter_to_date() |>
  filter(date >= as.Date("1995-01-01")) |>
  mutate(OBS_VALUE = OBS_VALUE / 1000) |>
  ggplot() + geom_line(aes(x = date, y = OBS_VALUE, color = Cna_produit, linetype = Valorisation)) +
  theme_minimal() + xlab("") + ylab("Exportations, Mds€, valeurs ou volumes") +
  scale_x_date(breaks = seq(1940, 2100, 5) |> paste0("-01-01") |> as.Date(),
               labels = date_format("%Y")) +
  scale_linetype_manual(values = c("dashed", "solid")) +
  scale_y_continuous(breaks = seq(-100, 500, 10),
                     labels = dollar_format(pre = "", su = " Mds€")) +
  theme(legend.position = c(0.25, 0.8),
        legend.title = element_blank())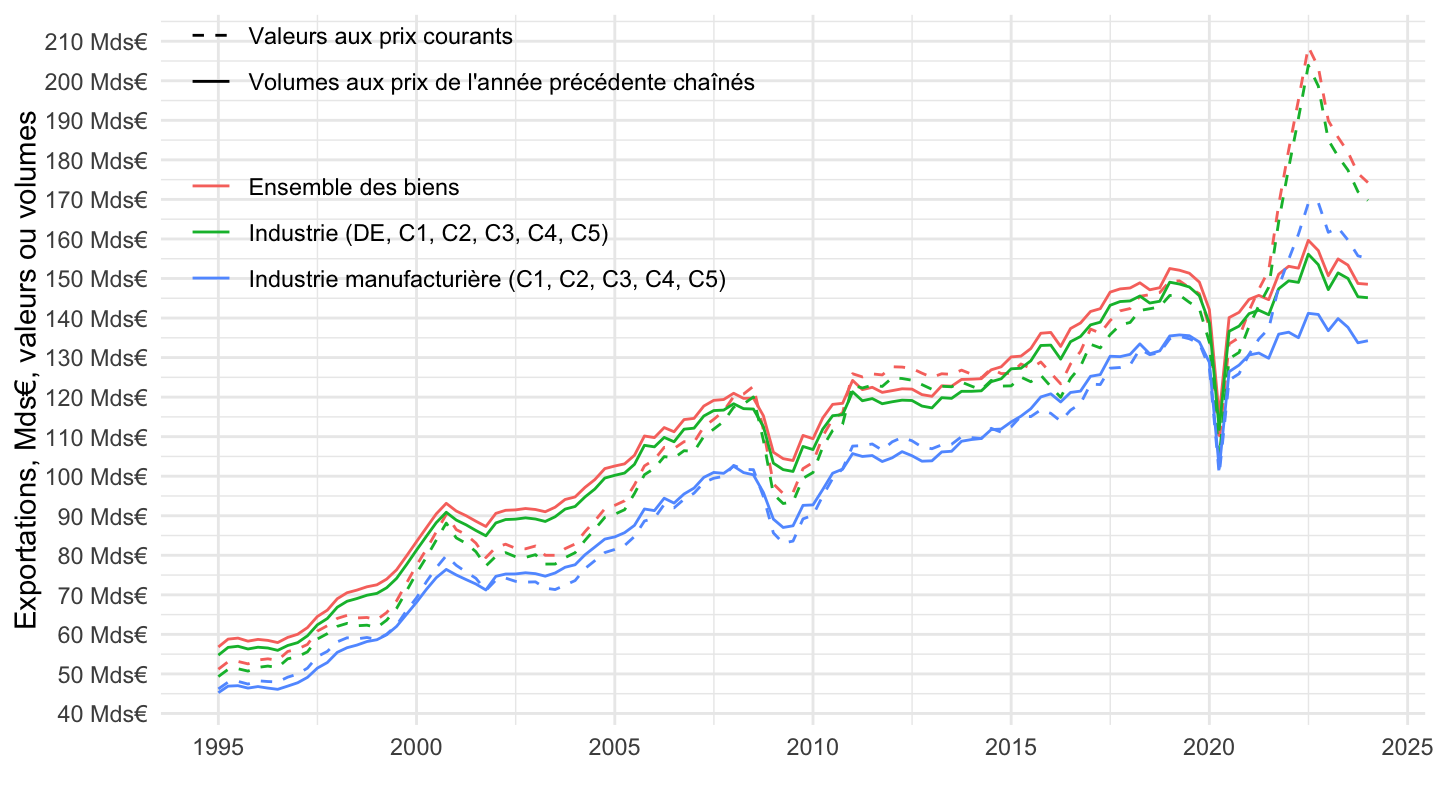
`CNT-2014-OPERATIONS` |>
  filter(OPERATION %in% c("P7"),
         FREQ == "T",
         CNA_PRODUIT %in% c("DIM-CNT", "DI-CNT", "DB-CNT")) |>
  quarter_to_date() |>
  filter(date >= as.Date("2000-01-01")) |>
  mutate(OBS_VALUE = OBS_VALUE / 1000) |>
  ggplot() + geom_line(aes(x = date, y = OBS_VALUE, color = Cna_produit, linetype = Valorisation)) +
  theme_minimal() + xlab("") + ylab("Exportations, Mds€, valeurs ou volumes") +
  scale_x_date(breaks = seq(1940, 2100, 2) |> paste0("-01-01") |> as.Date(),
               labels = date_format("%Y")) +
  scale_linetype_manual(values = c("dashed", "solid")) +
  scale_y_continuous(breaks = seq(-100, 500, 10),
                     labels = dollar_format(pre = "", su = " Mds€")) +
  theme(legend.position = c(0.25, 0.8),
        legend.title = element_blank())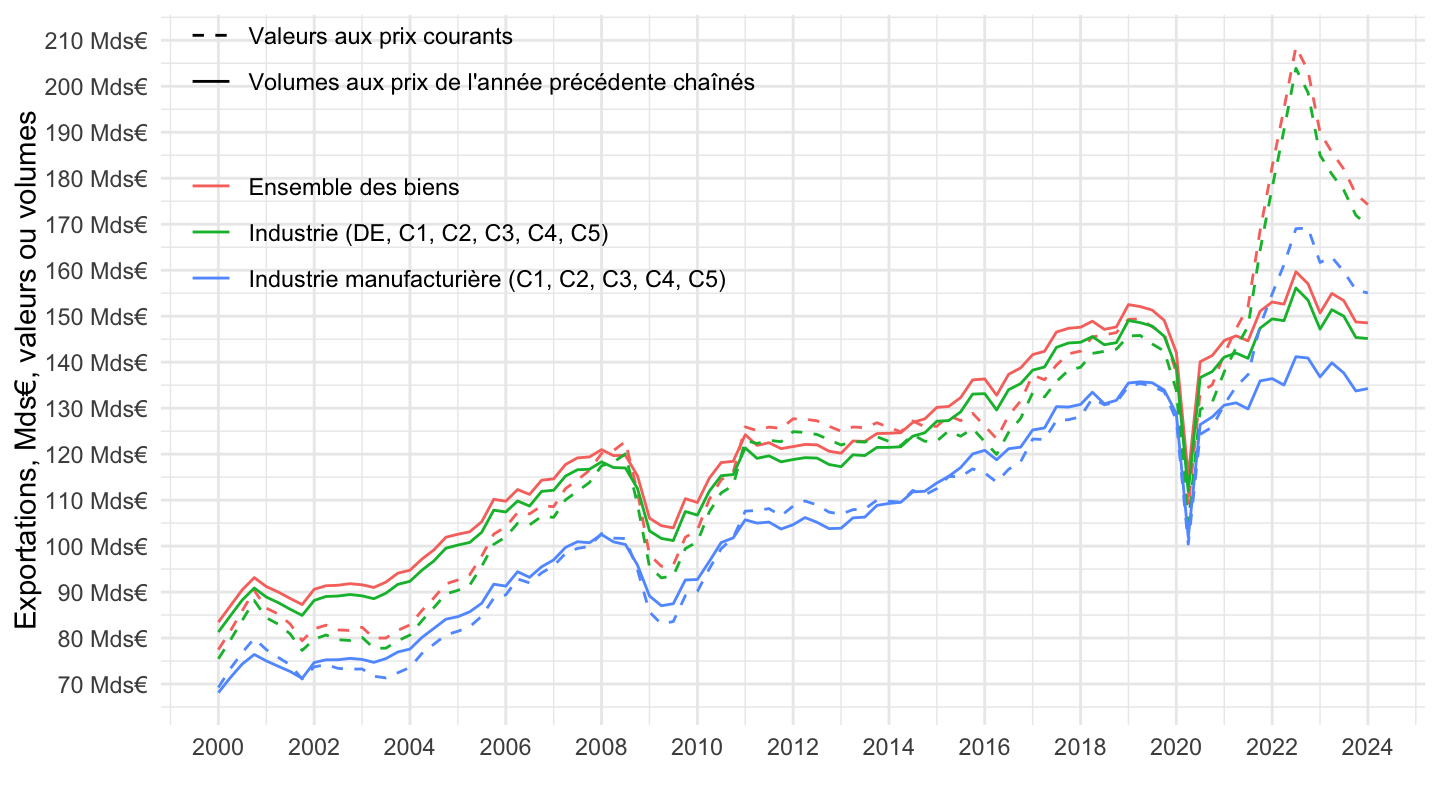
`CNT-2014-OPERATIONS` |>
  filter(OPERATION %in% c("P7"),
         FREQ == "T",
         CNA_PRODUIT %in% c("DIM-CNT", "DI-CNT", "DB-CNT")) |>
  quarter_to_date() |>
  filter(date >= as.Date("2017-07-01")) |>
  mutate(OBS_VALUE = OBS_VALUE / 1000) |>
  ggplot() + geom_line(aes(x = date, y = OBS_VALUE, color = Cna_produit, linetype = Valorisation)) +
  theme_minimal() + xlab("") + ylab("Exportations, Mds€, valeurs ou volumes") +
  scale_x_date(breaks = seq(1940, 2100, 1) |> paste0("-01-01") |> as.Date(),
               labels = date_format("%Y")) +
  scale_linetype_manual(values = c("dashed", "solid")) +
  scale_y_continuous(breaks = seq(-100, 500, 10),
                     labels = dollar_format(pre = "", su = " Mds€")) +
  theme(legend.position = c(0.3, 0.8),
        legend.title = element_blank())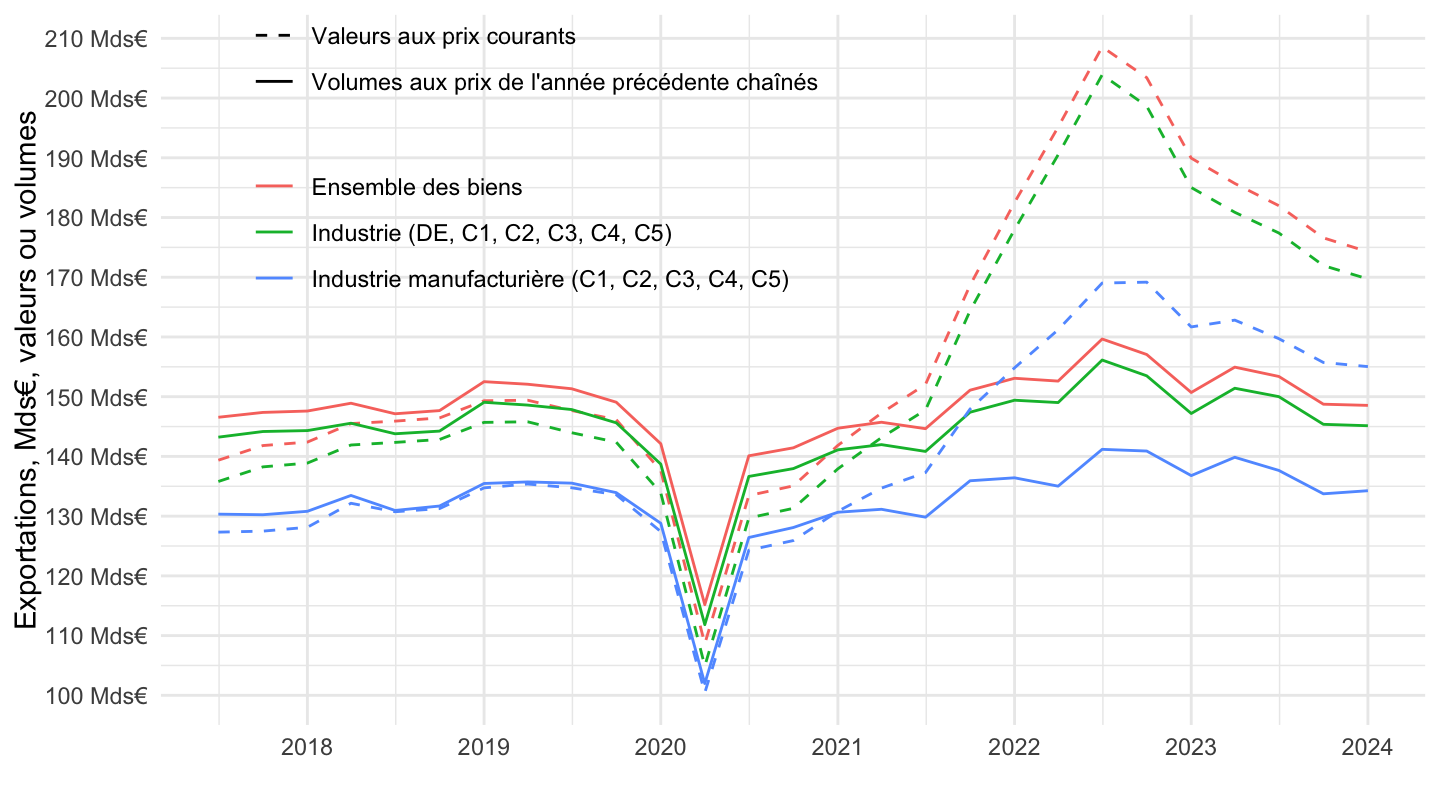
`CNT-2014-OPERATIONS` |>
  filter(OPERATION %in% c("P7"),
         FREQ == "T",
         CNA_PRODUIT %in% c("A17-C1", "A17-C2", "A17-C3", "A17-C4", "A17-C5")) |>
  quarter_to_date() |>
  mutate(OBS_VALUE = OBS_VALUE / 1000) |>
  ggplot() + geom_line(aes(x = date, y = OBS_VALUE, color = Cna_produit, linetype = Valorisation)) +
  theme_minimal() + xlab("") + ylab("Exportations, Mds€, valeurs ou volumes") +
  scale_x_date(breaks = seq(1940, 2100, 10) |> paste0("-01-01") |> as.Date(),
               labels = date_format("%Y")) +
  scale_linetype_manual(values = c("dashed", "solid")) +
  scale_y_continuous(breaks = seq(-100, 500, 10),
                     labels = dollar_format(pre = "", su = " Mds€")) +
  theme(legend.position = c(0.47, 0.75),
        legend.title = element_blank())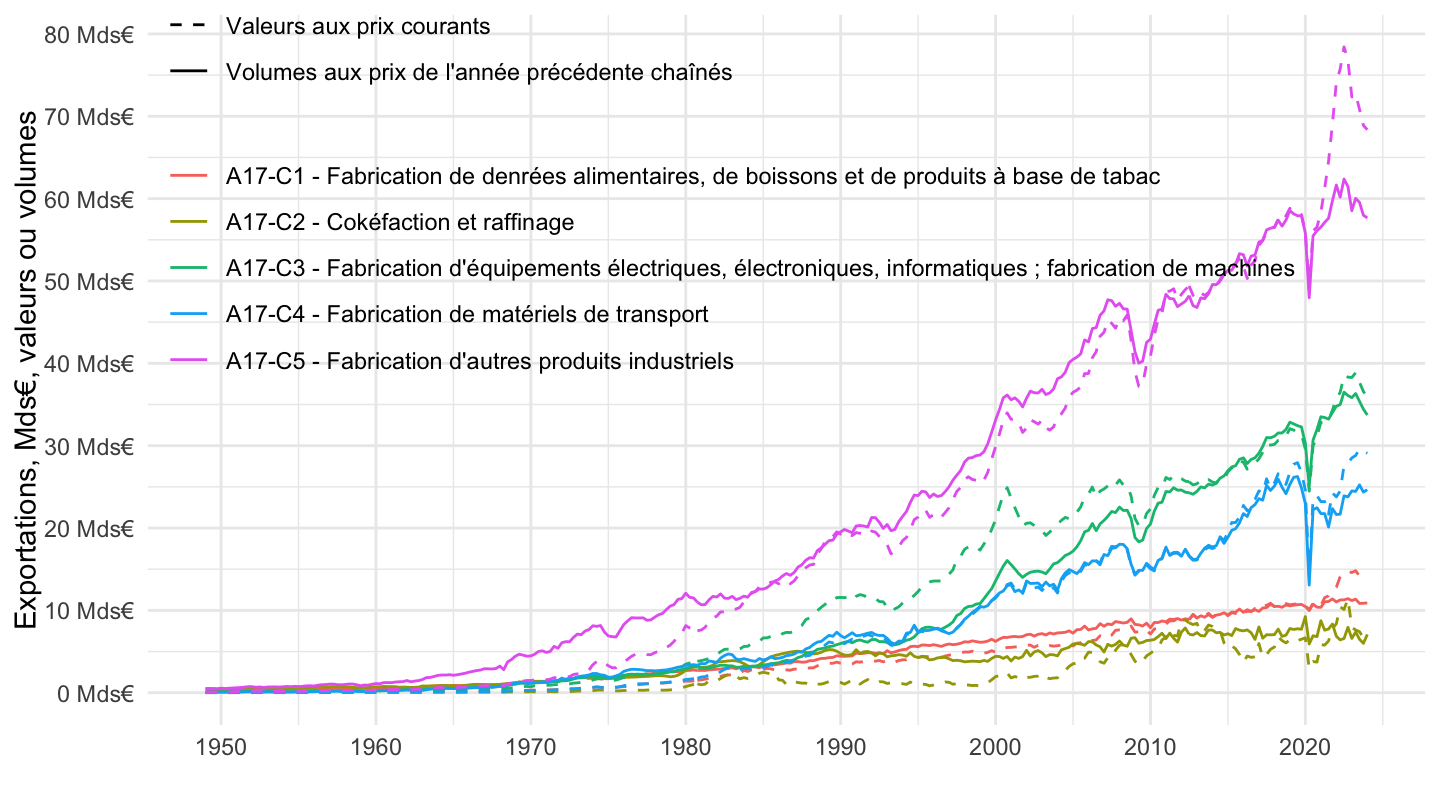
`CNT-2014-OPERATIONS` |>
  filter(OPERATION %in% c("P7"),
         FREQ == "T",
         CNA_PRODUIT %in% c("A17-C1", "A17-C2", "A17-C3", "A17-C4", "A17-C5")) |>
  quarter_to_date() |>
  filter(date >= as.Date("1995-01-01")) |>
  mutate(OBS_VALUE = OBS_VALUE / 1000) |>
  ggplot() + geom_line(aes(x = date, y = OBS_VALUE, color = Cna_produit, linetype = Valorisation)) +
  theme_minimal() + xlab("") + ylab("Exportations, Mds€, valeurs ou volumes") +
  scale_x_date(breaks = seq(1940, 2100, 5) |> paste0("-01-01") |> as.Date(),
               labels = date_format("%Y")) +
  scale_linetype_manual(values = c("dashed", "solid")) +
  scale_y_continuous(breaks = seq(-100, 500, 10),
                     labels = dollar_format(pre = "", su = " Mds€")) +
  theme(legend.position = c(0.47, 0.75),
        legend.title = element_blank())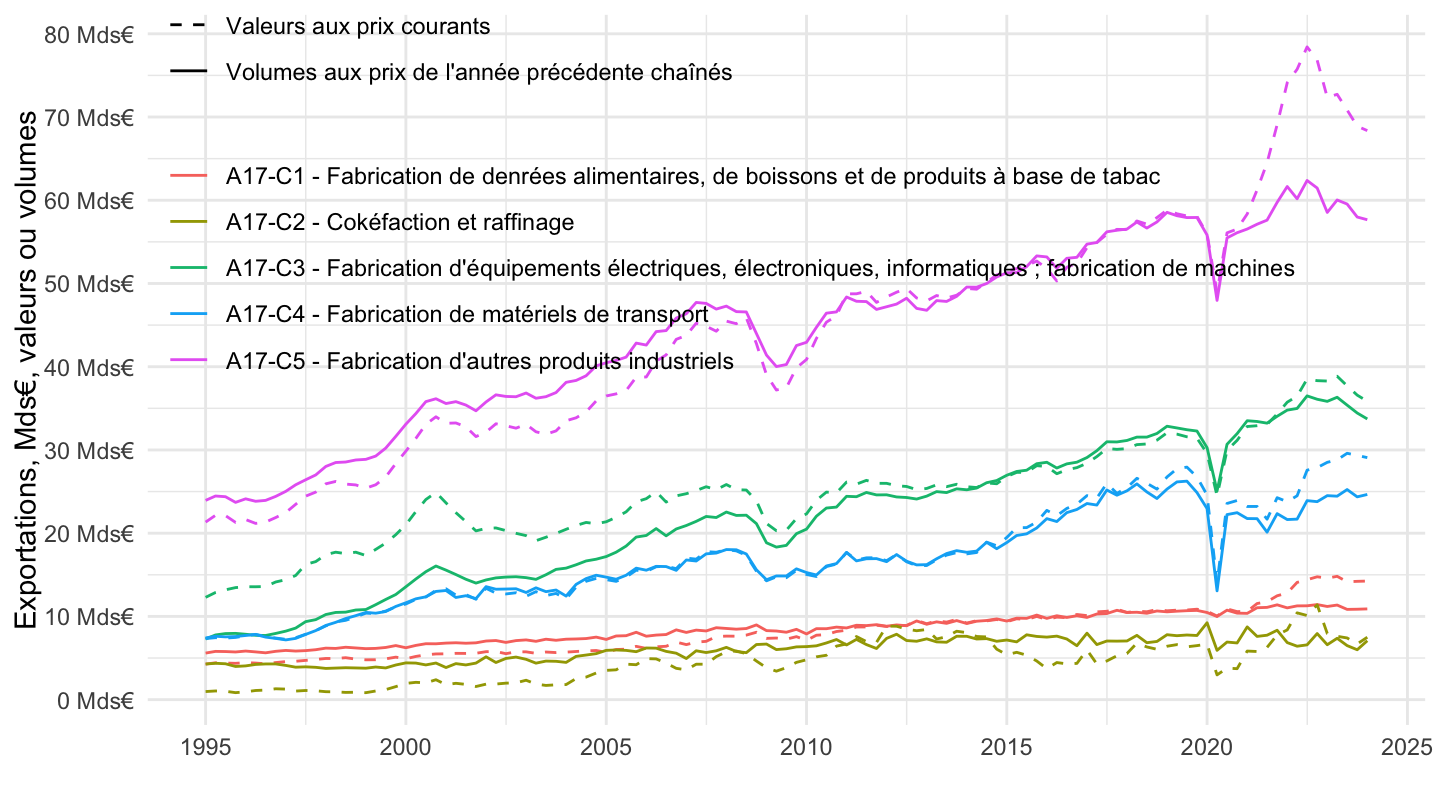
`CNT-2014-OPERATIONS` |>
  filter(OPERATION %in% c("P7"),
         FREQ == "T",
         CNA_PRODUIT %in% c("A17-C1", "A17-C2", "A17-C3", "A17-C4", "A17-C5")) |>
  quarter_to_date() |>
  filter(date >= as.Date("2000-01-01")) |>
  mutate(OBS_VALUE = OBS_VALUE / 1000) |>
  ggplot() + geom_line(aes(x = date, y = OBS_VALUE, color = Cna_produit, linetype = Valorisation)) +
  theme_minimal() + xlab("") + ylab("Exportations, Mds€, valeurs ou volumes") +
  scale_x_date(breaks = seq(1940, 2100, 2) |> paste0("-01-01") |> as.Date(),
               labels = date_format("%Y")) +
  scale_linetype_manual(values = c("dashed", "solid")) +
  scale_y_continuous(breaks = seq(-100, 500, 10),
                     labels = dollar_format(pre = "", su = " Mds€")) +
  theme(legend.position = c(0.47, 0.75),
        legend.title = element_blank())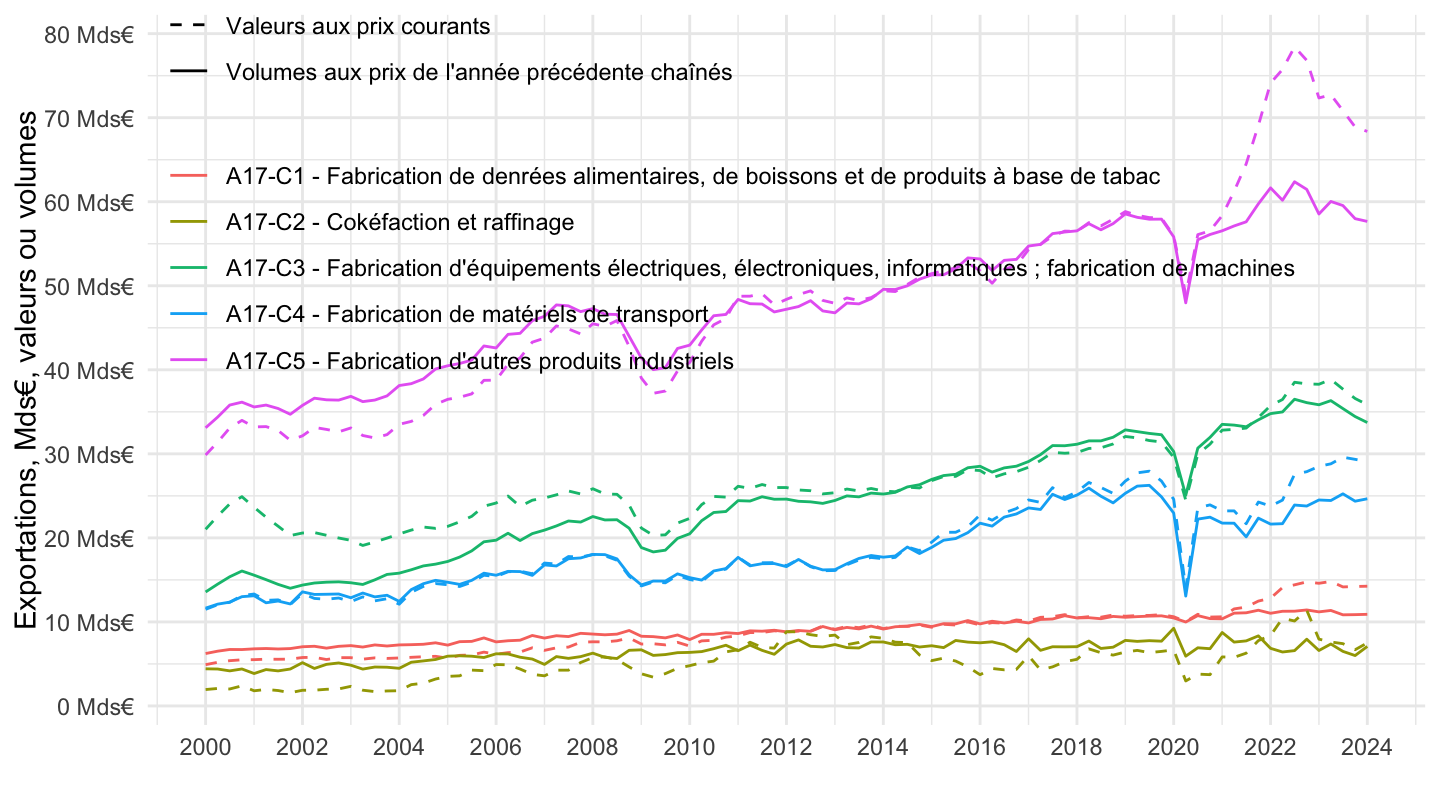
`CNT-2014-OPERATIONS` |>
  filter(OPERATION %in% c("P7"),
         FREQ == "T",
         CNA_PRODUIT %in% c("A17-C1", "A17-C2", "A17-C3", "A17-C4", "A17-C5")) |>
  quarter_to_date() |>
  filter(date >= as.Date("2017-07-01")) |>
  mutate(OBS_VALUE = OBS_VALUE / 1000) |>
  ggplot() + geom_line(aes(x = date, y = OBS_VALUE, color = Cna_produit, linetype = Valorisation)) +
  theme_minimal() + xlab("") + ylab("Exportations, Mds€, valeurs ou volumes") +
  scale_x_date(breaks = seq(1940, 2100, 1) |> paste0("-01-01") |> as.Date(),
               labels = date_format("%Y")) +
  scale_linetype_manual(values = c("dashed", "solid")) +
  scale_y_continuous(breaks = seq(-100, 500, 10),
                     labels = dollar_format(pre = "", su = " Mds€")) +
  theme(legend.position = c(0.47, 0.75),
        legend.title = element_blank())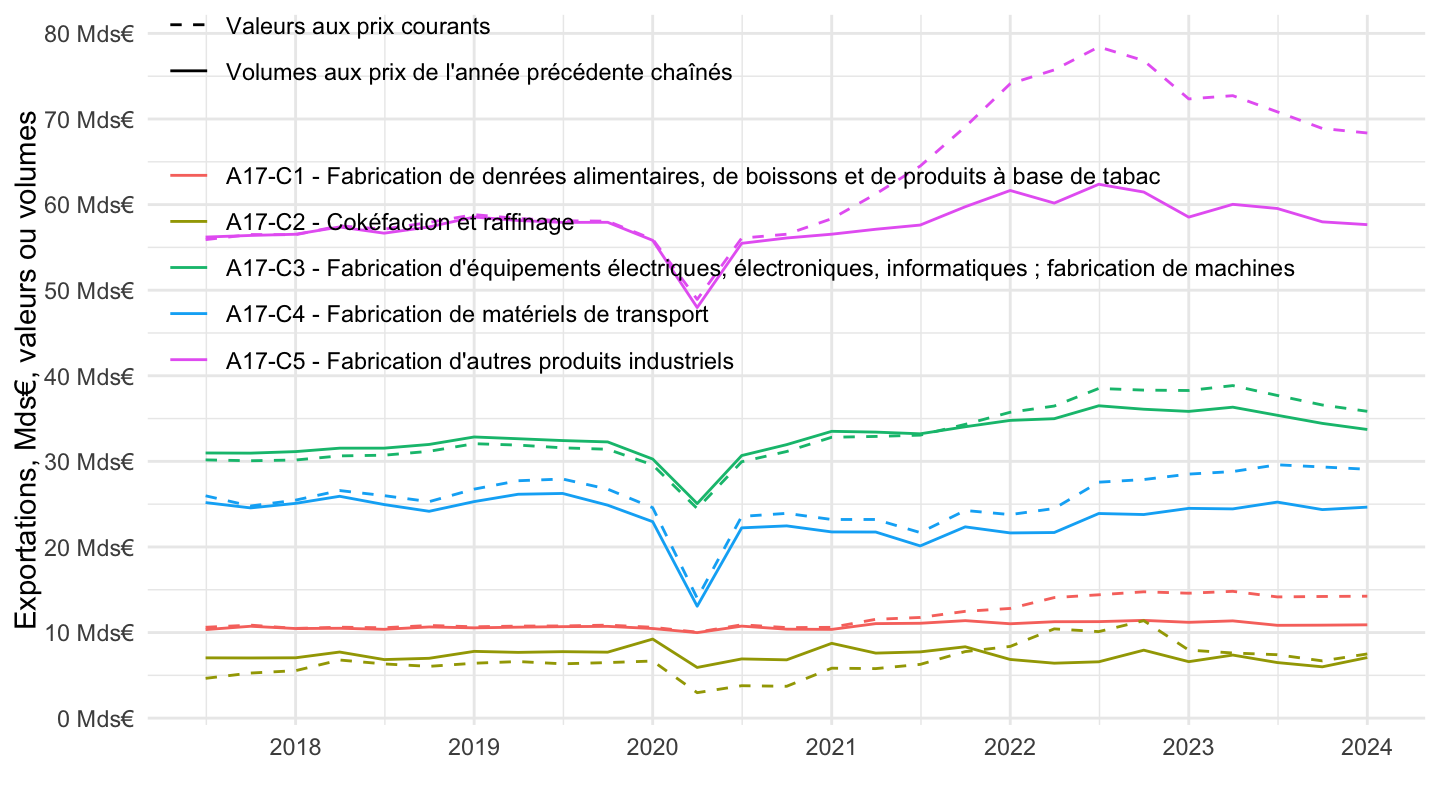
`CNT-2014-OPERATIONS` |>
  filter(OPERATION %in% c("P6", "P7"),
         FREQ == "T",
         TIME_PERIOD == "2022-Q3",
         VALORISATION == "V") |>
  mutate(OBS_VALUE = OBS_VALUE / 1000) |>
  select(CNA_PRODUIT, Cna_produit, Operation, OBS_VALUE) |>
  spread(Operation, OBS_VALUE) |>
  arrange(-`P6 - Exportations de biens et services`) |>
print_table_conditional()| CNA_PRODUIT | Cna_produit | P6 - Exportations de biens et services | P7 - Importations de biens et services |
|---|---|---|---|
| DB-CNT | Ensemble des biens | 161.455 | 208.566 |
| DI-CNT | Industrie (DE, C1, C2, C3, C4, C5) | 154.863 | 203.899 |
| DIM-CNT | Industrie manufacturière (C1, C2, C3, C4, C5) | 145.847 | 169.028 |
| A17-C5 | A17-C5 - Fabrication d'autres produits industriels | 68.803 | 78.424 |
| DS-CNT | Ensemble des services | 60.482 | 55.891 |
| DSM-CNT | Tertiaire principalement marchand (GZ, HZ, IZ, JZ, KZ, LZ, MN, RU) | 60.213 | 55.707 |
| A17-C4 | A17-C4 - Fabrication de matériels de transport | 30.496 | 27.568 |
| A17-C3 | A17-C3 - Fabrication d'équipements électriques, électroniques, informatiques ; fabrication de machines | 26.378 | 38.517 |
| A17-MN | A17-MN - Activités scientifiques et techniques ; services administratifs et de soutien | 23.401 | 23.524 |
| A17-HZ | A17-HZ - Transports et entreposage | 20.394 | 17.326 |
| A17-C1 | A17-C1 - Fabrication de denrées alimentaires, de boissons et de produits à base de tabac | 15.874 | 14.411 |
| A17-PCHTR | Produits consommés hors du territoire de résidence | 15.585 | 9.497 |
| A17-DE | A17-DE - Industries extractives, énergie, eau, gestion des déchets et dépollution | 9.016 | 34.870 |
| A17-JZ | A17-JZ - Information et communication | 7.272 | 8.538 |
| A17-AZ | A17-AZ - Agriculture, sylviculture et pêche | 6.592 | 4.667 |
| A17-KZ | A17-KZ - Activités financières et d'assurance | 6.134 | 2.605 |
| A17-C2 | A17-C2 - Cokéfaction et raffinage | 4.297 | 10.108 |
| A17-GZ | A17-GZ - Commerce ; réparation d'automobiles et de motocycles | 1.904 | 2.768 |
| A17-RU | A17-RU - Autres activités de services | 1.107 | 0.946 |
| A17-OQ | A17-OQ - Administration publique, enseignement, santé humaine et action sociale | 0.269 | 0.184 |
| DSN-CNT | Tertiaire principalement non marchand (OQ) | 0.269 | 0.184 |
| A17-PCAFAB | Correction CAF-FAB | NA | -6.653 |
`CNT-2014-OPERATIONS` |>
  filter(OPERATION %in% c("D211"),
         FREQ == "T",
         TIME_PERIOD %in% c("2023-Q1", "2023-Q2", "2022-Q1", "2022-Q2"),
         VALORISATION == "V") |>
  select(Cna_produit, TIME_PERIOD, OBS_VALUE) |>
  spread(TIME_PERIOD, OBS_VALUE) |>
  mutate(`(2023-Q1+2023-Q2)/(2022-Q1+2022-Q2)-1` = percent((`2023-Q1` + `2023-Q2`)/(`2022-Q1` + `2022-Q2`)-1)) |>
  arrange(-`2023-Q1`) |>
print_table_conditional()| Cna_produit | 2022-Q1 | 2022-Q2 | 2023-Q1 | 2023-Q2 | (2023-Q1+2023-Q2)/(2022-Q1+2022-Q2)-1 |
|---|---|---|---|---|---|
| Ensemble des services | 25004 | 25503 | 25818 | 26057 | 2.71% |
| Ensemble des biens | 23824 | 24411 | 25300 | 25308 | 4.92% |
| Industrie (DE, C1, C2, C3, C4, C5) | 23253 | 23833 | 24674 | 24681 | 4.82% |
| Industrie manufacturière (C1, C2, C3, C4, C5) | 20511 | 21005 | 21667 | 21625 | 4.28% |
| Tertiaire principalement marchand (GZ, HZ, IZ, JZ, KZ, LZ, MN, RU) | 16827 | 17169 | 17230 | 17469 | 2.07% |
| A17-C5 - Fabrication d'autres produits industriels | 7815 | 7924 | 8106 | 8148 | 3.27% |
| A17-FZ - Construction | 7554 | 7714 | 7955 | 7949 | 4.17% |
| A17-MN - Activités scientifiques et techniques ; services administratifs et de soutien | 5645 | 5695 | 5711 | 5756 | 1.12% |
| A17-C1 - Fabrication de denrées alimentaires, de boissons et de produits à base de tabac | 4257 | 4348 | 4552 | 4591 | 6.25% |
| A17-C4 - Fabrication de matériels de transport | 3458 | 3537 | 3907 | 3970 | 12.61% |
| A17-C2 - Cokéfaction et raffinage | 2973 | 3162 | 3031 | 2866 | -3.88% |
| A17-DE - Industries extractives, énergie, eau, gestion des déchets et dépollution | 2742 | 2827 | 3007 | 3056 | 8.87% |
| A17-IZ - Hébergement et restauration | 2650 | 2927 | 2949 | 3046 | 7.50% |
| A17-JZ - Information et communication | 2718 | 2734 | 2817 | 2847 | 3.89% |
| A17-C3 - Fabrication d'équipements électriques, électroniques, informatiques ; fabrication de machines | 2008 | 2034 | 2070 | 2050 | 1.93% |
| A17-HZ - Transports et entreposage | 1434 | 1441 | 1478 | 1512 | 4.00% |
| A17-RU - Autres activités de services | 1296 | 1338 | 1394 | 1419 | 6.80% |
| A17-KZ - Activités financières et d'assurance | 1499 | 1428 | 1282 | 1294 | -11.99% |
| A17-LZ - Activités immobilières | 839 | 856 | 809 | 800 | -5.07% |
| A17-GZ - Commerce ; réparation d'automobiles et de motocycles | 746 | 751 | 789 | 795 | 5.81% |
| A17-OQ - Administration publique, enseignement, santé humaine et action sociale | 623 | 620 | 633 | 639 | 2.33% |
| Tertiaire principalement non marchand (OQ) | 623 | 620 | 633 | 639 | 2.33% |
| A17-AZ - Agriculture, sylviculture et pêche | 571 | 578 | 627 | 627 | 9.14% |