Code
t_5407 %>%
  filter(year == "2020") %>%
  select(-year) %>%
{if (is_html_output()) datatable(., filter = 'top', rownames = F) else .}Data - INSEE
t_5407 %>%
filter(year == "2020") %>%
select(-year) %>%
{if (is_html_output()) datatable(., filter = 'top', rownames = F) else .}t_5407 %>%
filter(sector %in% c("A5.AZ", "A5.GU", "A5.BE", "A5.OQ")) %>%
year_to_date2 %>%
left_join(gdp, by = "date") %>%
ggplot + geom_line(aes(x = date, y = value / gdp, color = Sector)) +
theme_minimal() + xlab("") + ylab("% du PIB") +
scale_x_date(breaks = seq(1940, 2020, 5) %>% paste0("-01-01") %>% as.Date,
labels = date_format("%y")) +
scale_y_continuous(breaks = 0.01*seq(-100, 500, 1),
labels = percent_format(accuracy = 1)) +
scale_color_manual(values = viridis(5)[1:4]) +
theme(legend.position = c(0.65, 0.9),
legend.title = element_blank()) +
geom_hline(yintercept = 0, linetype = "dashed")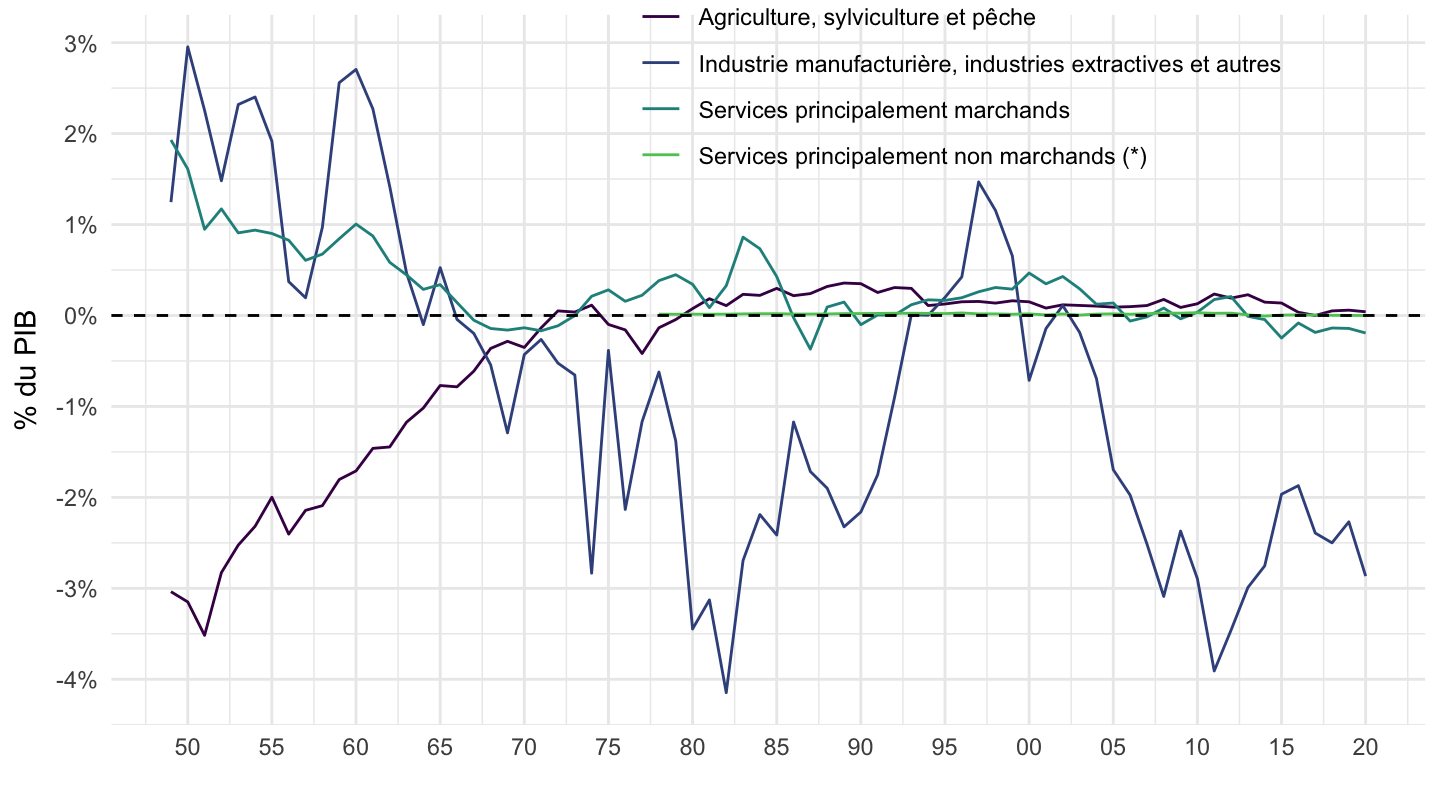
t_5407 %>%
  filter(sector %in% c("A17.DE", "A5.BE")) %>%
  year_to_date2 %>%
  select(-Sector) %>%
  spread(sector, value) %>%
  mutate(A5.BE_A17.DE = A5.BE - A17.DE) %>%
  gather(sector, value, -date) %>%
  left_join(sector, by = "sector") %>%
  mutate(Sector = ifelse(sector == "A5.BE_A17.DE", "Industrie manufacturière", Sector)) %>%
  left_join(gdp, by = "date") %>%
  ggplot + geom_line(aes(x = date, y = value / gdp, color = Sector)) +
  theme_minimal() + xlab("") + ylab("% du PIB") +
  scale_x_date(breaks = seq(1940, 2020, 5) %>% paste0("-01-01") %>% as.Date,
               labels = date_format("%y")) +
  scale_y_continuous(breaks = 0.01*seq(-100, 500, 1),
                labels = percent_format(accuracy = 1)) +
  scale_color_manual(values = viridis(4)[1:3]) +
  theme(legend.position = c(0.65, 0.9),
        legend.title = element_blank()) +
  geom_hline(yintercept = 0, linetype = "dashed")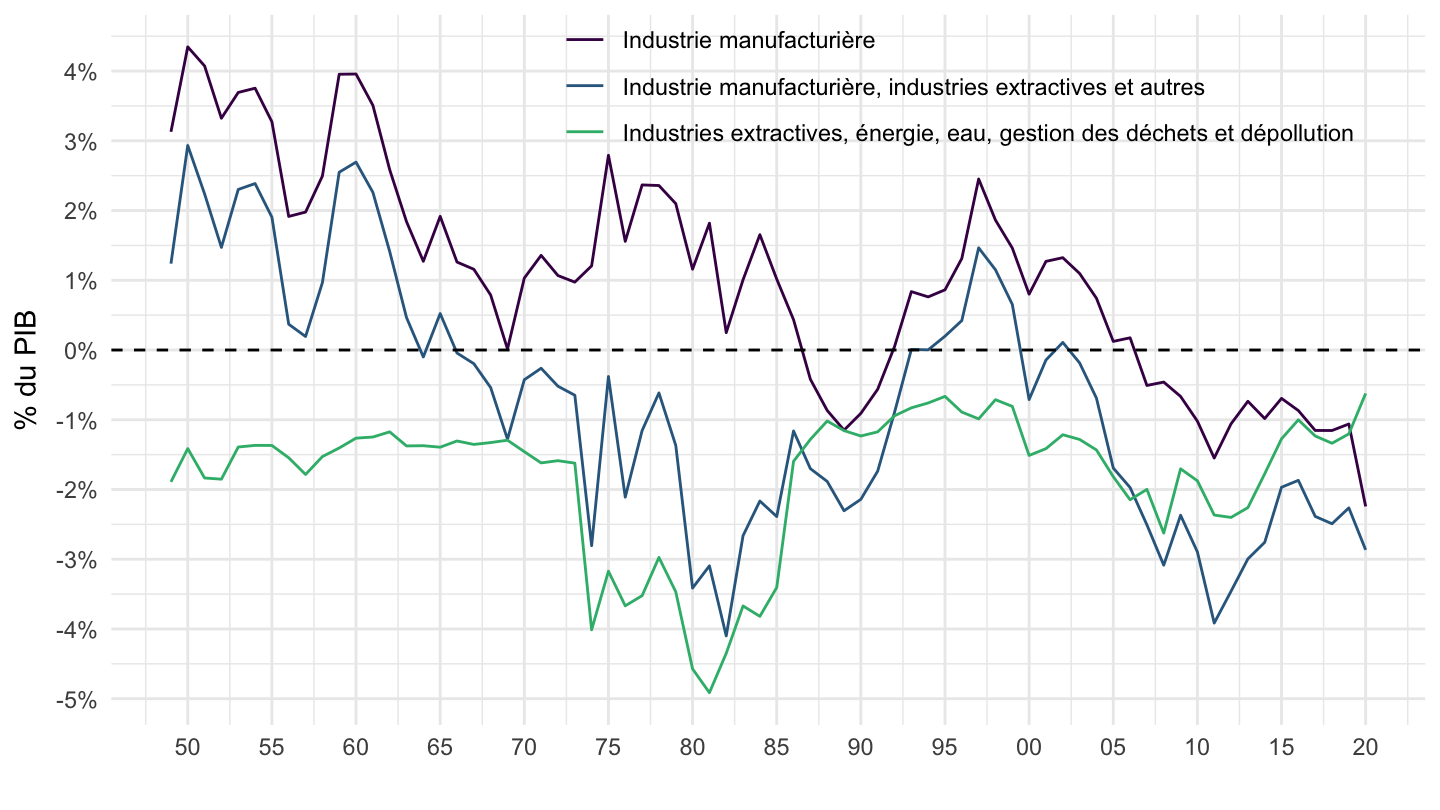
t_5407 %>%
  filter(sector %in% c("A5.BE", "A5.GU", "A5.AZ")) %>%
  year_to_date2 %>%
  left_join(gdp, by = "date") %>%
  ggplot + geom_line(aes(x = date, y = value / gdp, color = Sector)) +
  theme_minimal() + xlab("") + ylab("% du PIB") +
  scale_x_date(breaks = seq(1940, 2020, 5) %>% paste0("-01-01") %>% as.Date,
               labels = date_format("%y")) +
  scale_y_continuous(breaks = 0.01*seq(-100, 500, 1),
                labels = percent_format(accuracy = 1)) +
  scale_color_manual(values = viridis(4)[1:3]) +
  theme(legend.position = c(0.65, 0.9),
        legend.title = element_blank()) +
  geom_hline(yintercept = 0, linetype = "dashed")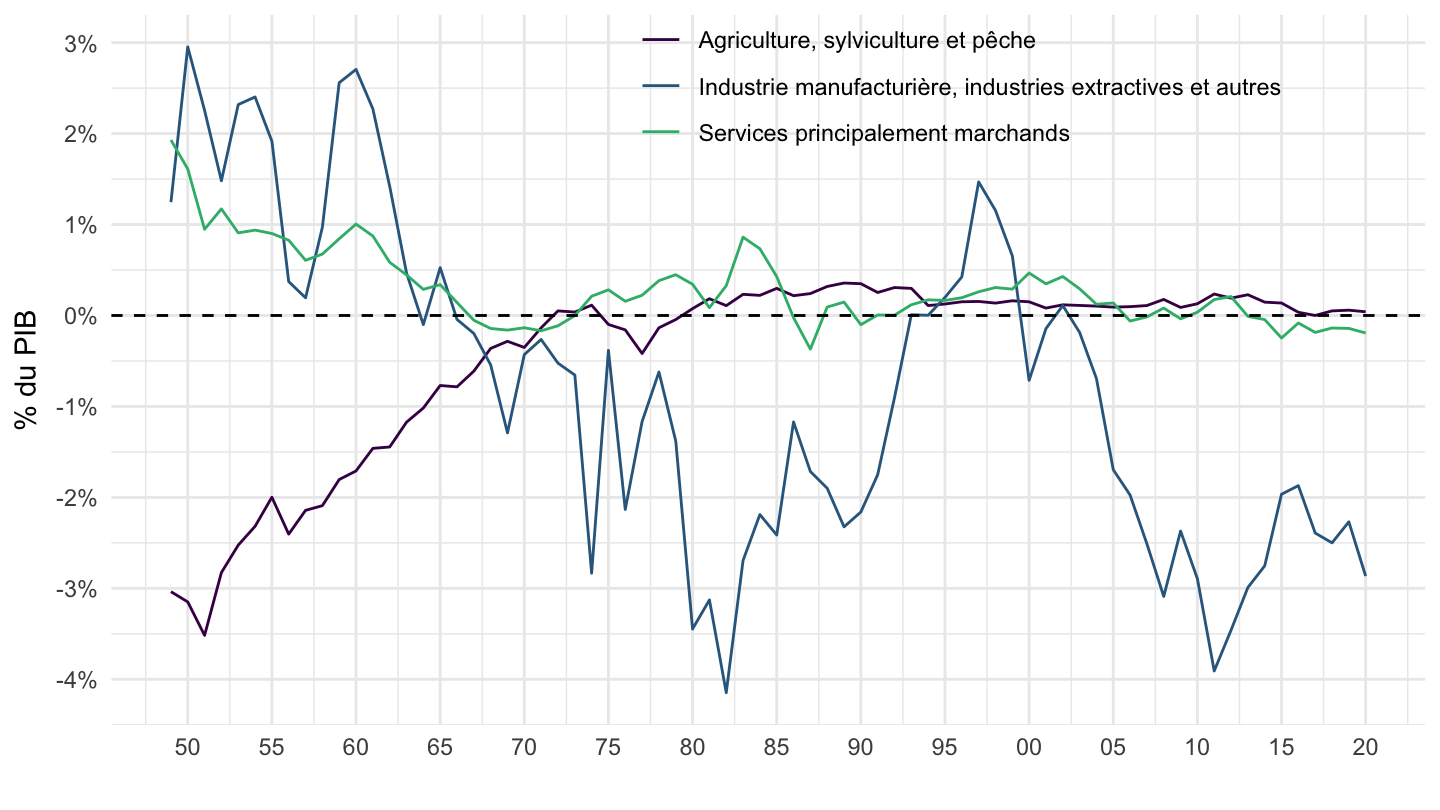
t_5407 %>%
  filter(sector %in% c("A17.C1", "A17.C2")) %>%
  year_to_date2 %>%
  left_join(gdp, by = "date") %>%
  ggplot + geom_line(aes(x = date, y = value / gdp, color = Sector)) +
  theme_minimal() + xlab("") + ylab("% du PIB") +
  scale_x_date(breaks = seq(1940, 2020, 5) %>% paste0("-01-01") %>% as.Date,
               labels = date_format("%y")) +
  scale_y_continuous(breaks = 0.01*seq(-100, 500, .1),
                labels = percent_format(accuracy = .1)) +
  scale_color_manual(values = viridis(4)[1:3]) +
  theme(legend.position = c(0.45, 0.9),
        legend.title = element_blank()) +
  geom_hline(yintercept = 0, linetype = "dashed")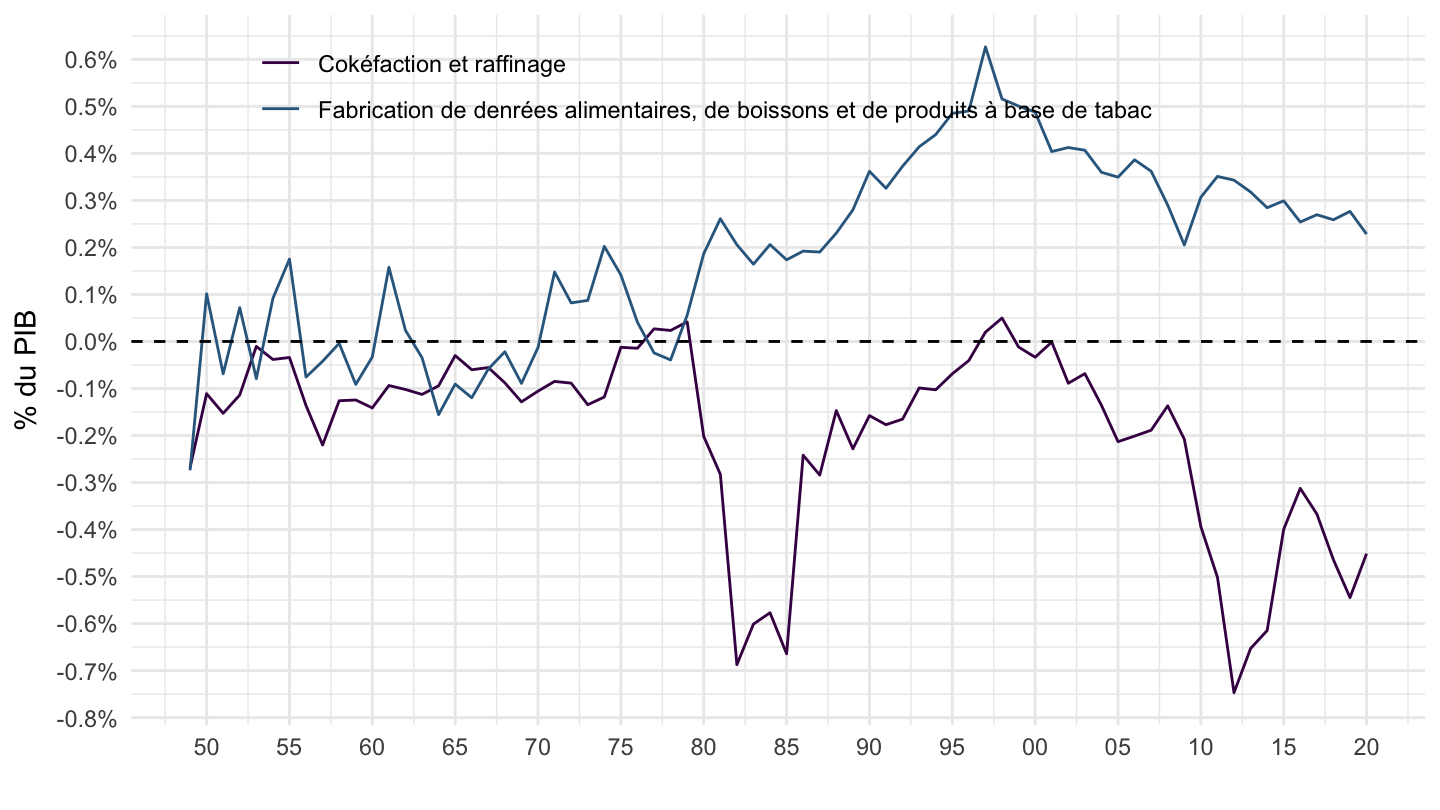
t_5407 %>%
  filter(sector %in% c("A5.BE", "A17.C3", "A17.C5")) %>%
  year_to_date2 %>%
  left_join(gdp, by = "date") %>%
  ggplot + geom_line(aes(x = date, y = value / gdp, color = Sector)) +
  theme_minimal() + xlab("") + ylab("Solde extérieur (% du PIB)") +
  scale_x_date(breaks = seq(1940, 2020, 5) %>% paste0("-01-01") %>% as.Date,
               labels = date_format("%y")) +
  scale_y_continuous(breaks = 0.01*seq(-100, 500, 1),
                labels = percent_format(accuracy = 1),
                limits = c(-0.045, 0.05)) +
  scale_color_manual(values = viridis(4)[1:3]) +
  theme(legend.position = c(0.5, 0.9),
        legend.title = element_blank()) +
  geom_hline(yintercept = 0, linetype = "dashed")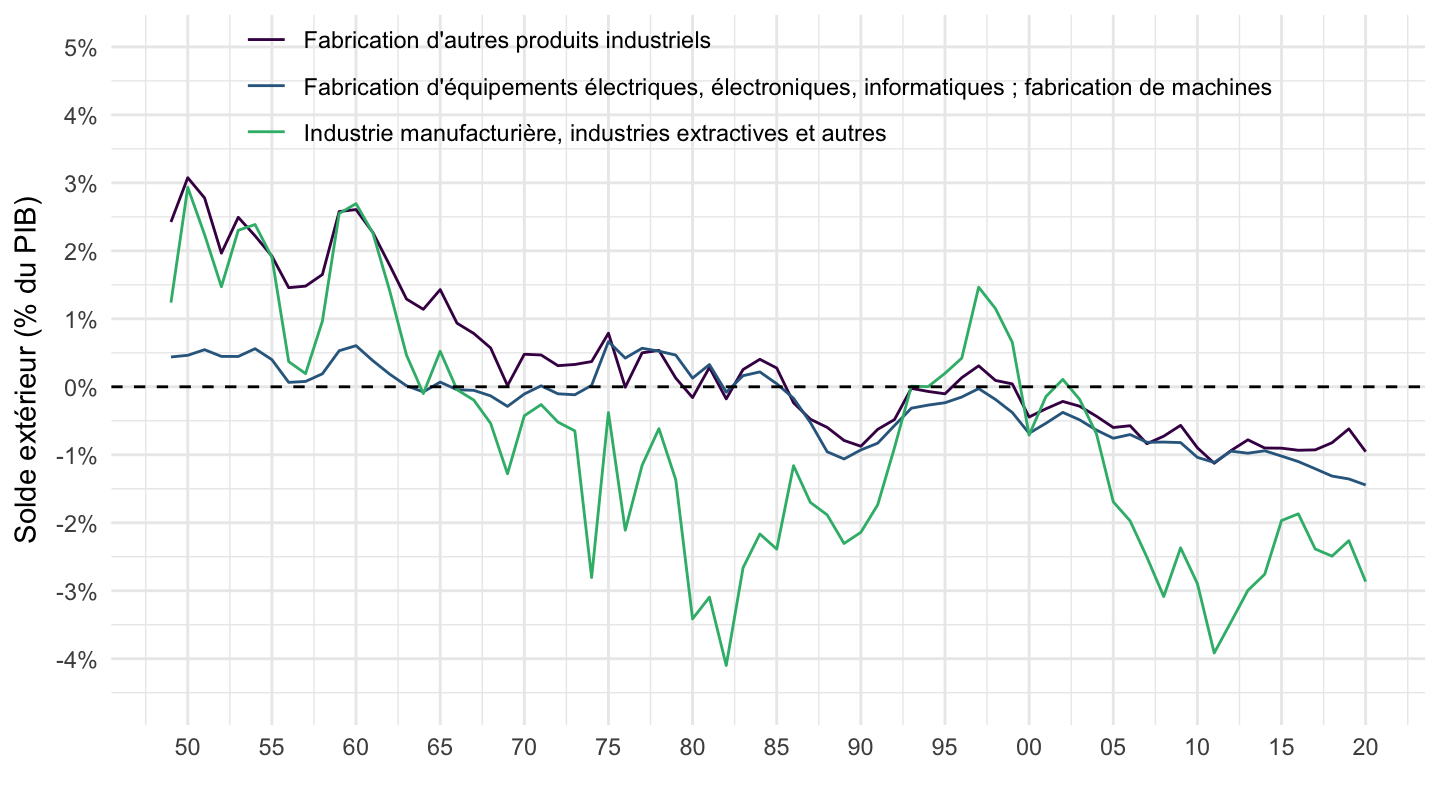
t_5407 %>%
  filter(sector %in% c("A5.BE", "A17.C3", "A17.C5")) %>%
  year_to_date2 %>%
  left_join(gdp, by = "date") %>%
  filter(date >= as.Date("1997-01-01")) %>%
  ggplot + geom_line(aes(x = date, y = value / gdp, color = Sector)) +
  theme_minimal() + xlab("") + ylab("Solde extérieur (% du PIB)") +
  scale_x_date(breaks = seq(1940, 2020, 1) %>% paste0("-01-01") %>% as.Date,
               labels = date_format("%y")) +
  scale_y_continuous(breaks = 0.01*seq(-100, 500, 1),
                labels = percent_format(accuracy = 1),
                limits = c(-0.045, 0.025)) +
  scale_color_manual(values = viridis(4)[1:3]) +
  theme(legend.position = c(0.5, 0.9),
        legend.title = element_blank()) +
  geom_hline(yintercept = 0, linetype = "dashed")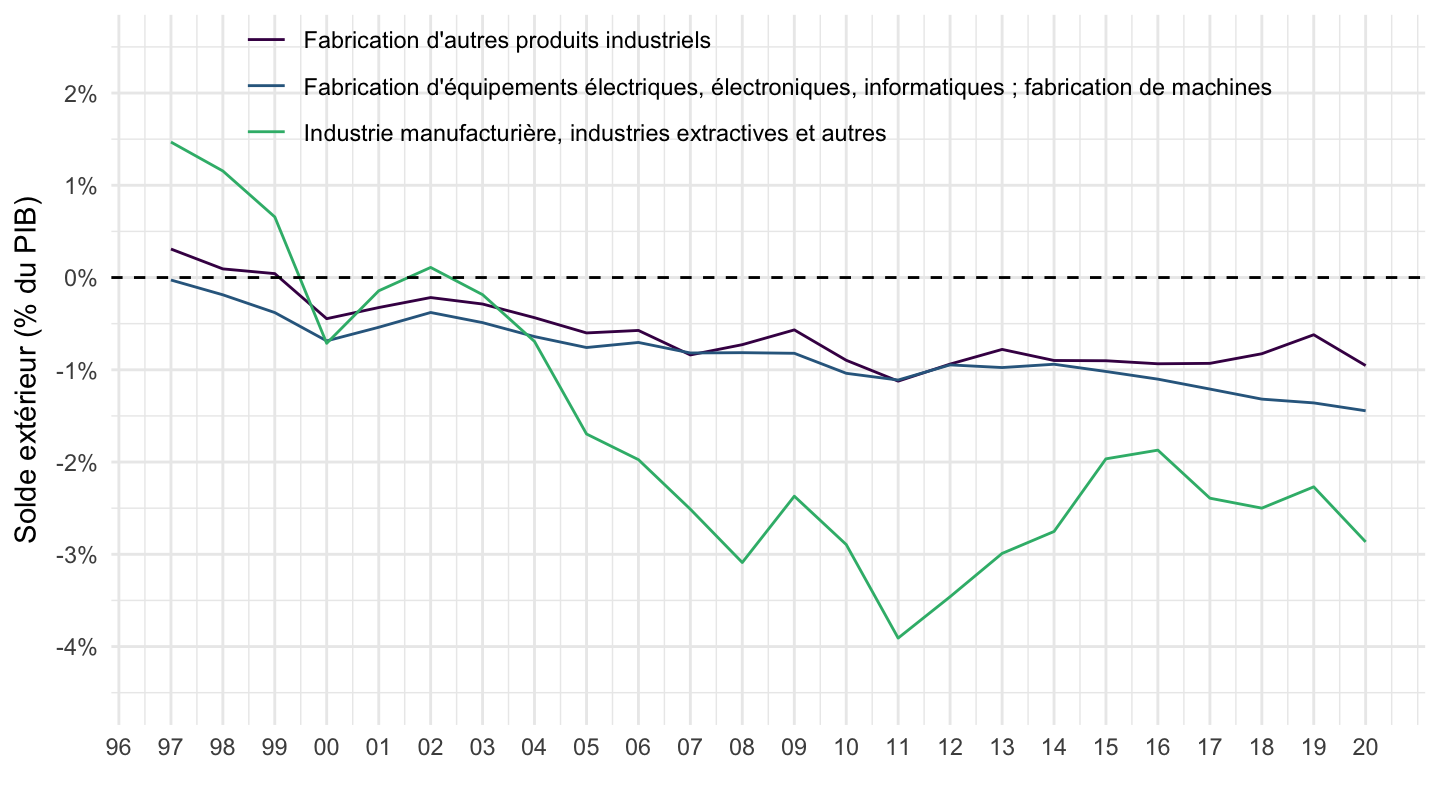
t_5407 %>%
  filter(sector %in% c("A17.C3", "A17.C4", "A17.C5")) %>%
  year_to_date2 %>%
  left_join(gdp, by = "date") %>%
  ggplot + geom_line(aes(x = date, y = value / gdp, color = Sector)) +
  theme_minimal() + xlab("") + ylab("% du PIB") +
  scale_x_date(breaks = seq(1940, 2020, 5) %>% paste0("-01-01") %>% as.Date,
               labels = date_format("%y")) +
  scale_y_continuous(breaks = 0.01*seq(-100, 500, 1),
                labels = percent_format(accuracy = 1)) +
  scale_color_manual(values = viridis(4)[1:3]) +
  theme(legend.position = c(0.65, 0.9),
        legend.title = element_blank()) +
  geom_hline(yintercept = 0, linetype = "dashed")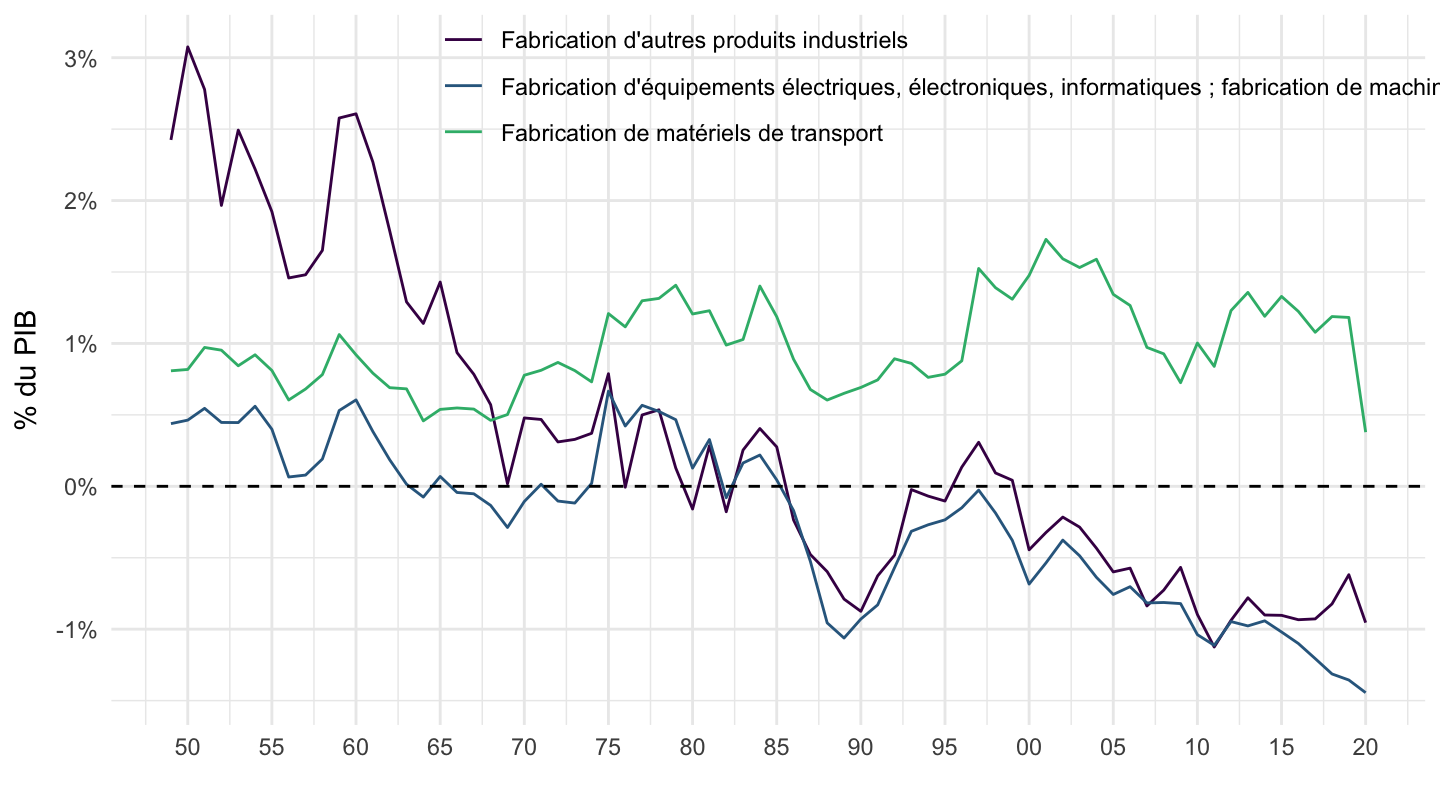
t_5407 %>%
  filter(sector %in% c("A38.CI", "A38.CJ", "A38.CK")) %>%
  year_to_date2 %>%
  left_join(gdp, by = "date") %>%
  ggplot + geom_line(aes(x = date, y = value / gdp, color = Sector)) +
  theme_minimal() + xlab("") + ylab("% du PIB") +
  scale_x_date(breaks = seq(1940, 2020, 5) %>% paste0("-01-01") %>% as.Date,
               labels = date_format("%y")) +
  scale_y_continuous(breaks = 0.01*seq(-100, 500, .2),
                labels = percent_format(accuracy = .1)) +
  scale_color_manual(values = viridis(4)[1:3]) +
  theme(legend.position = c(0.65, 0.9),
        legend.title = element_blank()) +
  geom_hline(yintercept = 0, linetype = "dashed")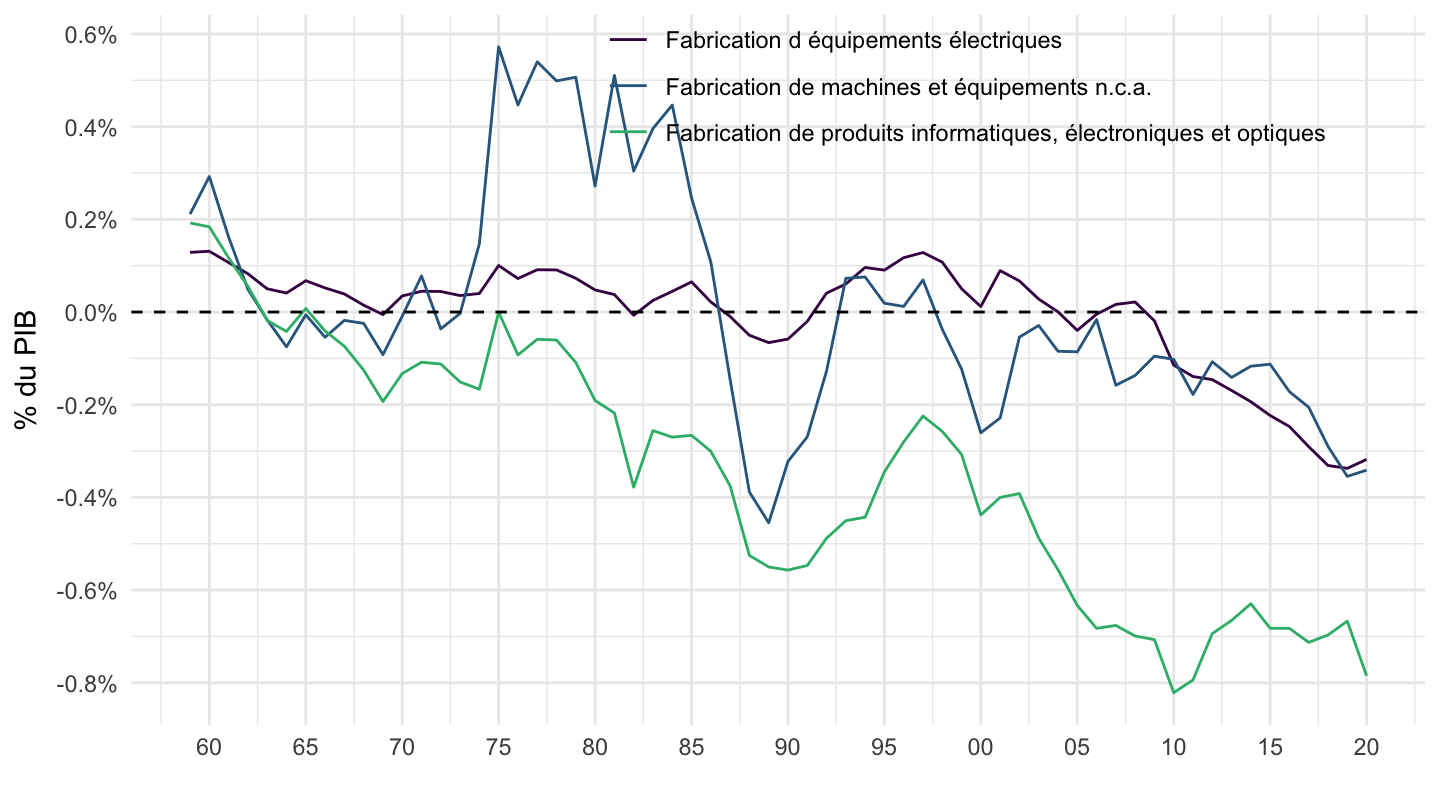
t_5407 %>%
  filter(sector %in% c("A38.CB", "A38.CC", "A38.CE")) %>%
  year_to_date2 %>%
  left_join(gdp, by = "date") %>%
  ggplot + geom_line(aes(x = date, y = value / gdp, color = Sector)) +
  theme_minimal() + xlab("") + ylab("% du PIB") +
  scale_x_date(breaks = seq(1940, 2020, 5) %>% paste0("-01-01") %>% as.Date,
               labels = date_format("%y")) +
  scale_y_continuous(breaks = 0.01*seq(-100, 500, .2),
                labels = percent_format(accuracy = .1)) +
  scale_color_manual(values = viridis(4)[1:3]) +
  theme(legend.position = c(0.65, 0.9),
        legend.title = element_blank()) +
  geom_hline(yintercept = 0, linetype = "dashed")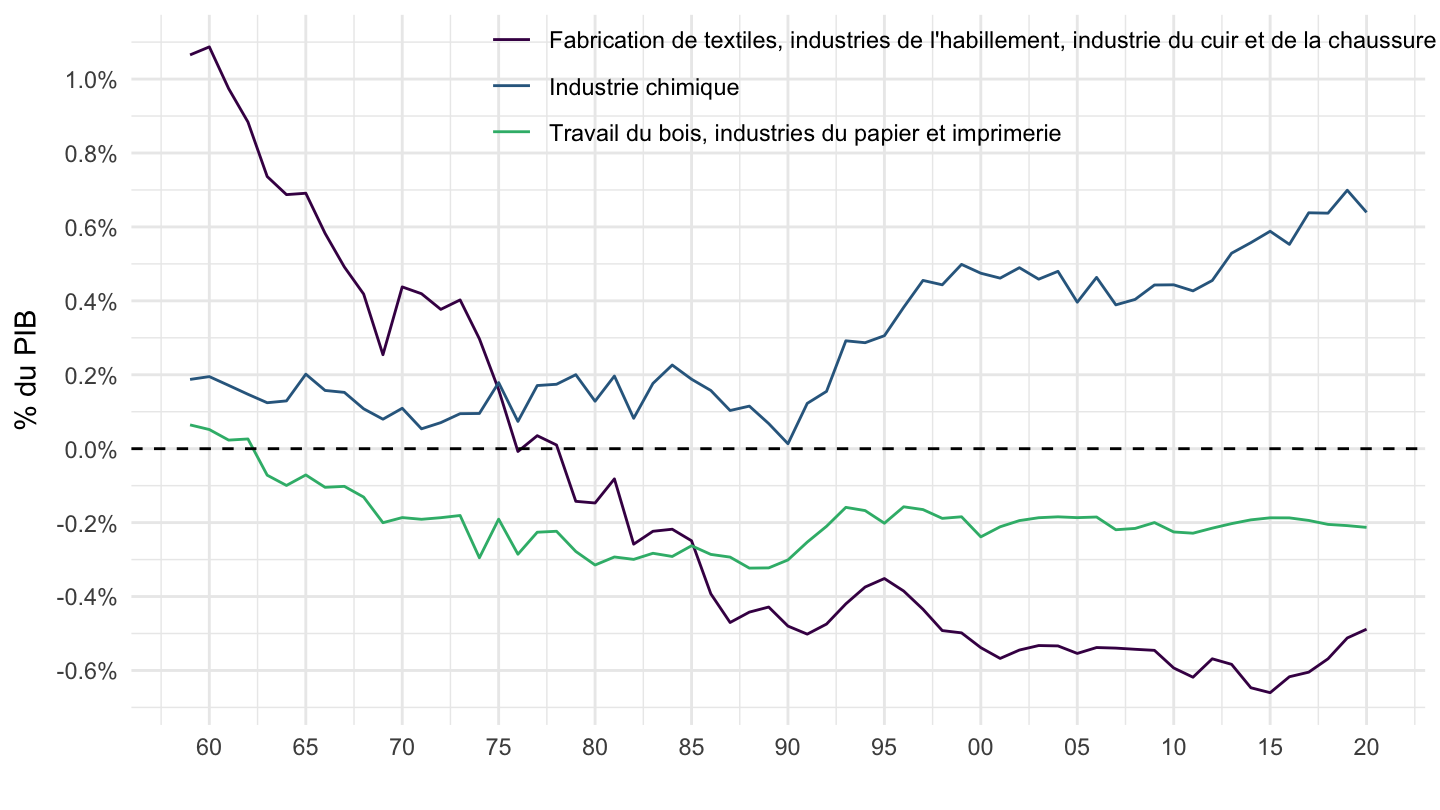
t_5407 %>%
  filter(sector %in% c("A38.CF", "A38.CG", "A38.CH")) %>%
  year_to_date2 %>%
  left_join(gdp, by = "date") %>%
  ggplot + geom_line(aes(x = date, y = value / gdp, color = Sector)) +
  theme_minimal() + xlab("") + ylab("% du PIB") +
  scale_x_date(breaks = seq(1940, 2020, 5) %>% paste0("-01-01") %>% as.Date,
               labels = date_format("%y")) +
  scale_y_continuous(breaks = 0.01*seq(-100, 500, .2),
                labels = percent_format(accuracy = .1)) +
  scale_color_manual(values = viridis(4)[1:3]) +
  theme(legend.position = c(0.65, 0.9),
        legend.title = element_blank()) +
  geom_hline(yintercept = 0, linetype = "dashed")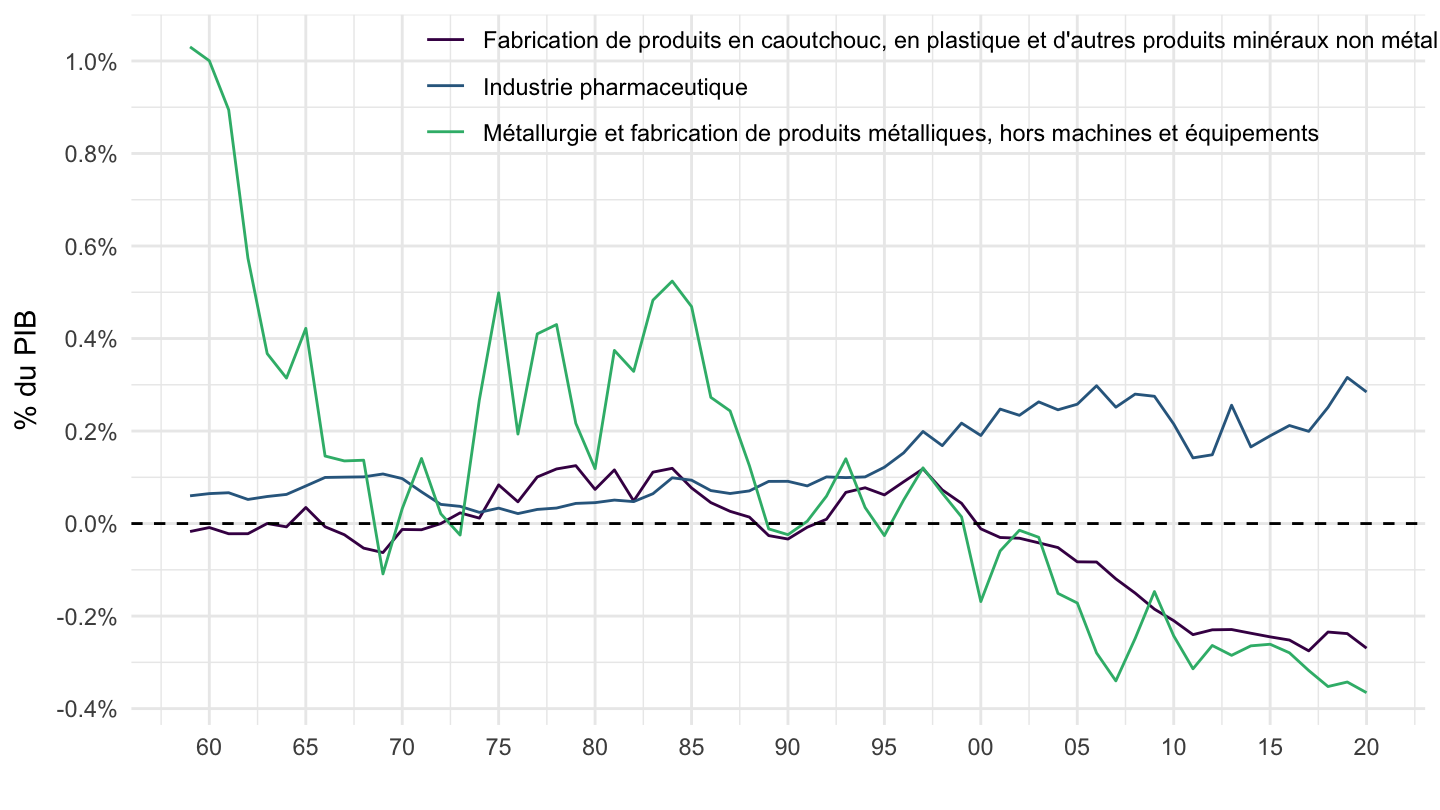
t_5407 %>%
  filter(sector %in% c("A38.CF", "A38.CG", "A38.CH", "A38.CM")) %>%
  year_to_date2 %>%
  left_join(gdp, by = "date") %>%
  ggplot + geom_line(aes(x = date, y = value / gdp, color = Sector)) +
  theme_minimal() + xlab("") + ylab("% du PIB") +
  scale_x_date(breaks = seq(1940, 2020, 5) %>% paste0("-01-01") %>% as.Date,
               labels = date_format("%y")) +
  scale_y_continuous(breaks = 0.01*seq(-100, 500, .2),
                labels = percent_format(accuracy = .1)) +
  scale_color_manual(values = viridis(5)[1:4]) +
  theme(legend.position = c(0.5, 0.9),
        legend.title = element_blank()) +
  geom_hline(yintercept = 0, linetype = "dashed")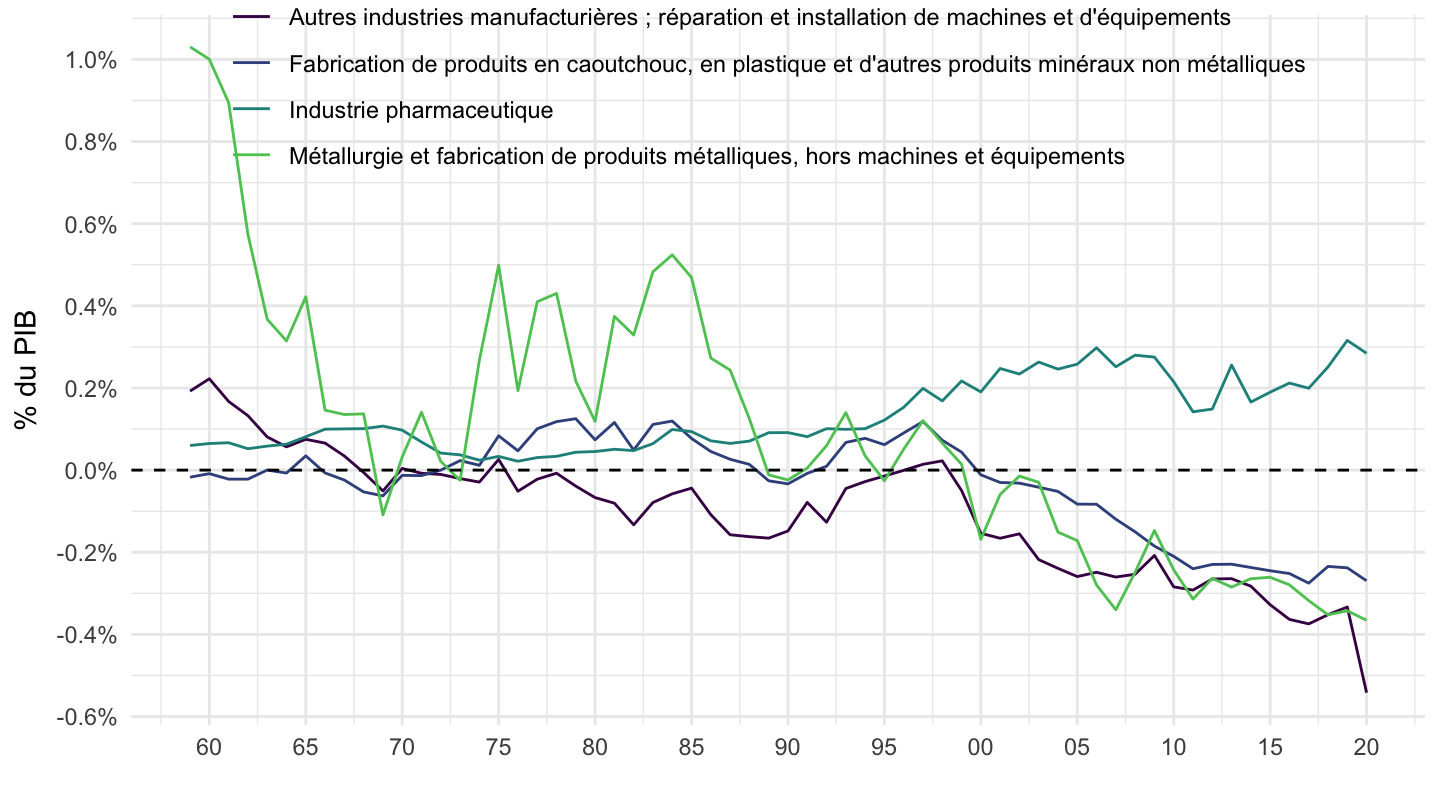
t_5407 %>%
  filter(sector %in% c("A17.HZ", "A17.GZ")) %>%
  year_to_date2 %>%
  left_join(gdp, by = "date") %>%
  ggplot + geom_line(aes(x = date, y = value / gdp, color = Sector)) +
  theme_minimal() + xlab("") + ylab("% du PIB") +
  scale_x_date(breaks = seq(1940, 2020, 5) %>% paste0("-01-01") %>% as.Date,
               labels = date_format("%y")) +
  scale_y_continuous(breaks = 0.01*seq(-100, 500, .2),
                labels = percent_format(accuracy = .1)) +
  scale_color_manual(values = viridis(5)[1:4]) +
  theme(legend.position = c(0.5, 0.9),
        legend.title = element_blank()) +
  geom_hline(yintercept = 0, linetype = "dashed")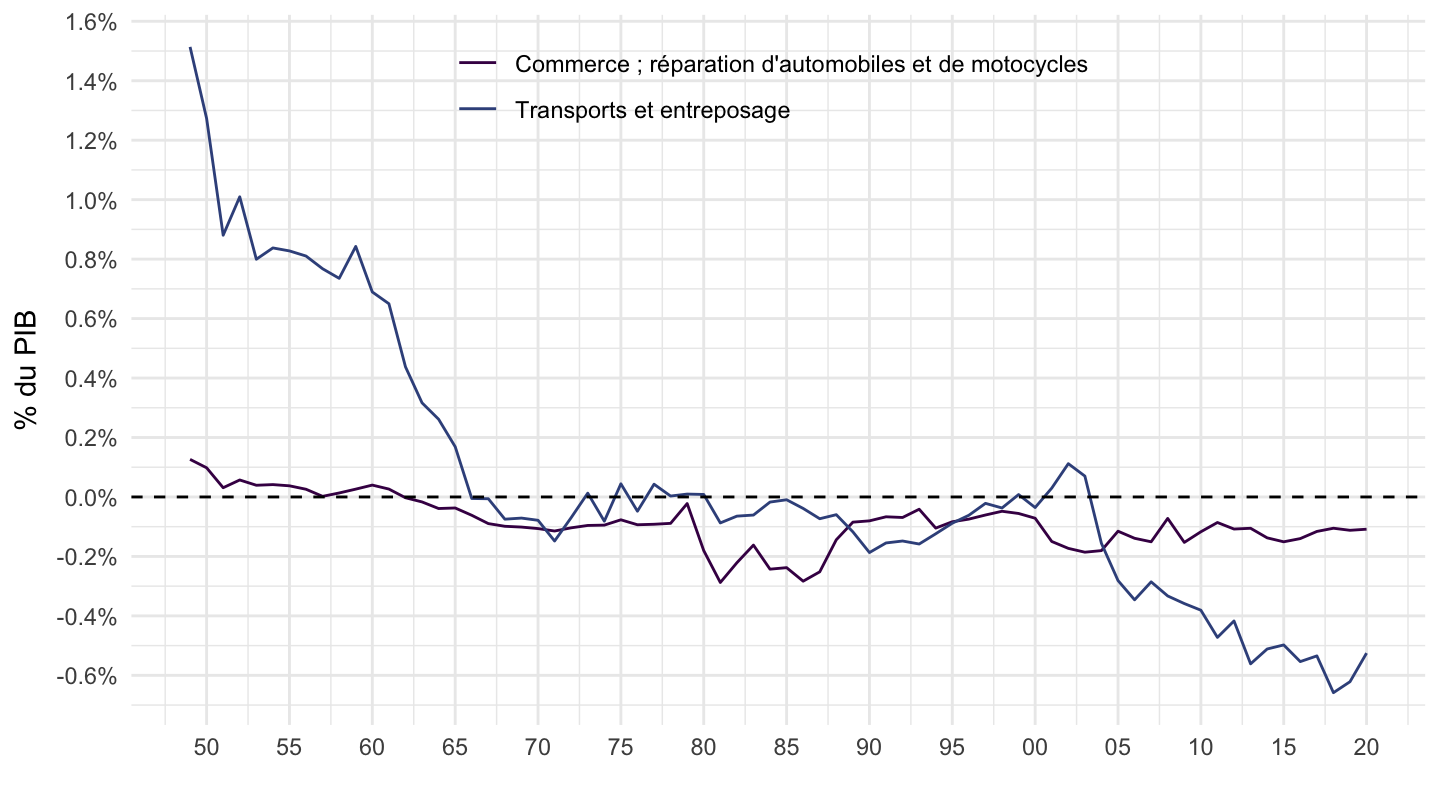
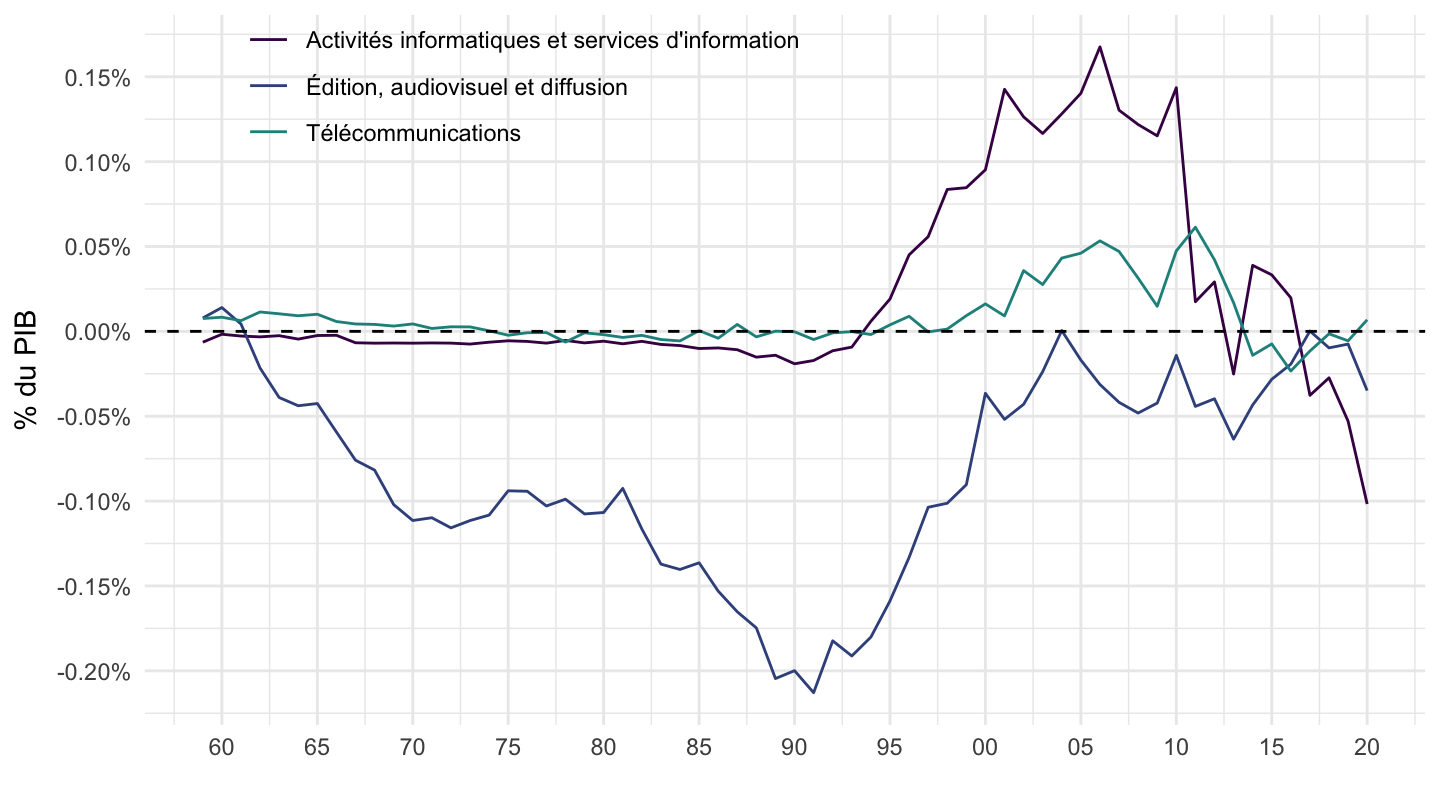
t_5407 %>%
  filter(sector %in% c("A38.JA", "A38.JB", "A38.JC")) %>%
  year_to_date2 %>%
  left_join(gdp, by = "date") %>%
  ggplot + geom_line(aes(x = date, y = value / gdp, color = Sector)) +
  theme_minimal() + xlab("") + ylab("% du PIB") +
  scale_x_date(breaks = seq(1940, 2020, 5) %>% paste0("-01-01") %>% as.Date,
               labels = date_format("%y")) +
  scale_y_continuous(breaks = 0.01*seq(-100, 500, .05),
                labels = percent_format(accuracy = .01)) +
  scale_color_manual(values = viridis(5)[1:4]) +
  theme(legend.position = c(0.3, 0.9),
        legend.title = element_blank()) +
  geom_hline(yintercept = 0, linetype = "dashed")