Country level - volume (in TEUs) of containers handled in main ports, by loading status - mar_mg_am_cvh
Data - Eurostat
Info
Last observation: Annual: 2024 (N = 103)
First observation: Annual: 1997 (N = 14)
Last data update: 23 jul 2026, 22:43. Last compile: 24 jul 2026, 02:32
Structure
unit
Code
load_data("eurostat/unit_fr.RData")
mar_mg_am_cvh %>%

  group_by(unit, Unit) %>%
  summarise(Nobs = n()) %>%
  arrange(-Nobs) %>%
{if (is_html_output()) print_table(.) else .}| unit | Unit | Nobs |
|---|---|---|
| THS_TEU | Thousand twenty-foot equivalent unit (TEU) | 1398 |
| RT_PRE | Growth rate on previous period (t/t-1) | 1331 |
Conteneurs
Table
Code
mar_mg_am_cvh %>%
  filter(unit == "THS_TEU",
         time == "2019") %>%
  select( -unit, -time) %>%


  select(-loadstat) %>%
  spread(Loadstat, values) %>%
  arrange(`Total loaded and empty`) %>%
  mutate(Flag = gsub(" ", "-", str_to_lower(gsub(" ", "-", Rep_mar))),
         Flag = paste0('<img src="../../icon/flag/vsmall/', Flag, '.png" alt="Flag">')) %>%
  select(Flag, everything()) %>%
  {if (is_html_output()) datatable(., filter = 'top', rownames = F, escape = F) else .}
Pleins + Vides
Linear
Code
mar_mg_am_cvh %>%
  filter(loadstat == "TOTAL",
         unit == "THS_TEU",
         rep_mar %in% c("NL", "FR", "IT", "DE", "ES", "UK", "BE", "EL")) %>%
  select(-loadstat, -unit) %>%

  year_to_date %>%
  left_join(colors, by = c("Rep_mar" = "country")) %>%
  rename(Geo = Rep_mar) %>%
  mutate(values = values / 10^3) %>%
  ggplot + geom_line(aes(x = date, y = values, color = color)) +
  scale_color_identity() + theme_minimal() + xlab("") + ylab("Mille équivalent vingt pieds (EVP)") + add_8flags +
  scale_x_date(breaks = seq(1940, 2100, 5) %>% paste0("-01-01") %>% as.Date,
               labels = date_format("%Y")) +
  scale_y_continuous(breaks = seq(0, 20, 2))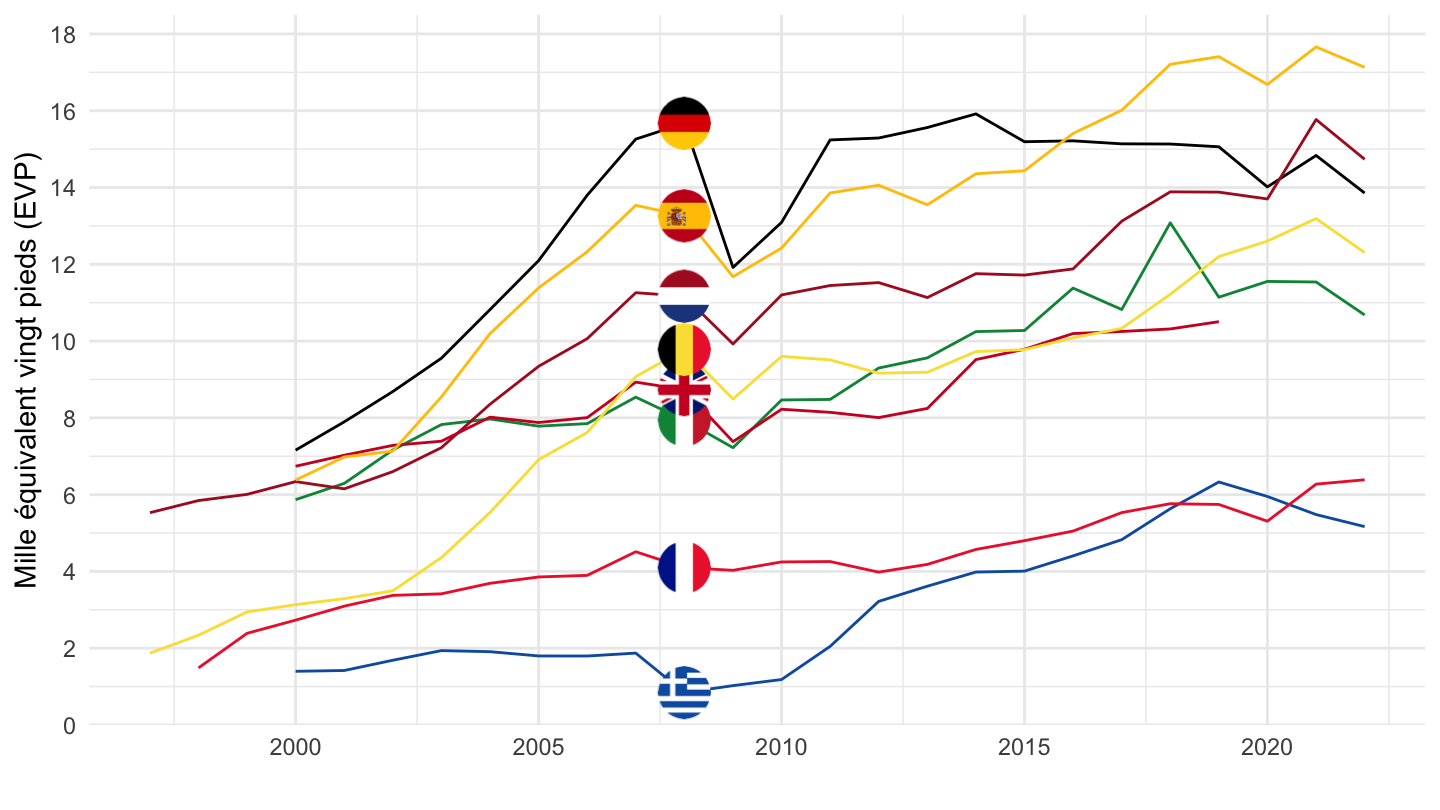
Base-100
Code
mar_mg_am_cvh %>%
  filter(loadstat == "TOTAL",
         unit == "THS_TEU",
         rep_mar %in% c("NL", "FR", "IT", "DE", "ES", "UK", "BE", "EL")) %>%
  select(-loadstat, -unit) %>%

  year_to_date %>%
  filter(date >= as.Date("2000-01-01")) %>%
  left_join(colors, by = c("Rep_mar" = "country")) %>%
  rename(Geo = Rep_mar) %>%
  group_by(Geo) %>%
  arrange(date) %>%
  mutate(values = 100*values / values[1]) %>%
  ggplot + geom_line(aes(x = date, y = values, color = color)) +
  scale_color_identity() + theme_minimal() + xlab("") + ylab("Mille équivalent vingt pieds (EVP)") + add_8flags +
  scale_x_date(breaks = seq(1940, 2100, 5) %>% paste0("-01-01") %>% as.Date,
               labels = date_format("%Y")) +
  scale_y_log10(breaks = seq(50,1000, 50))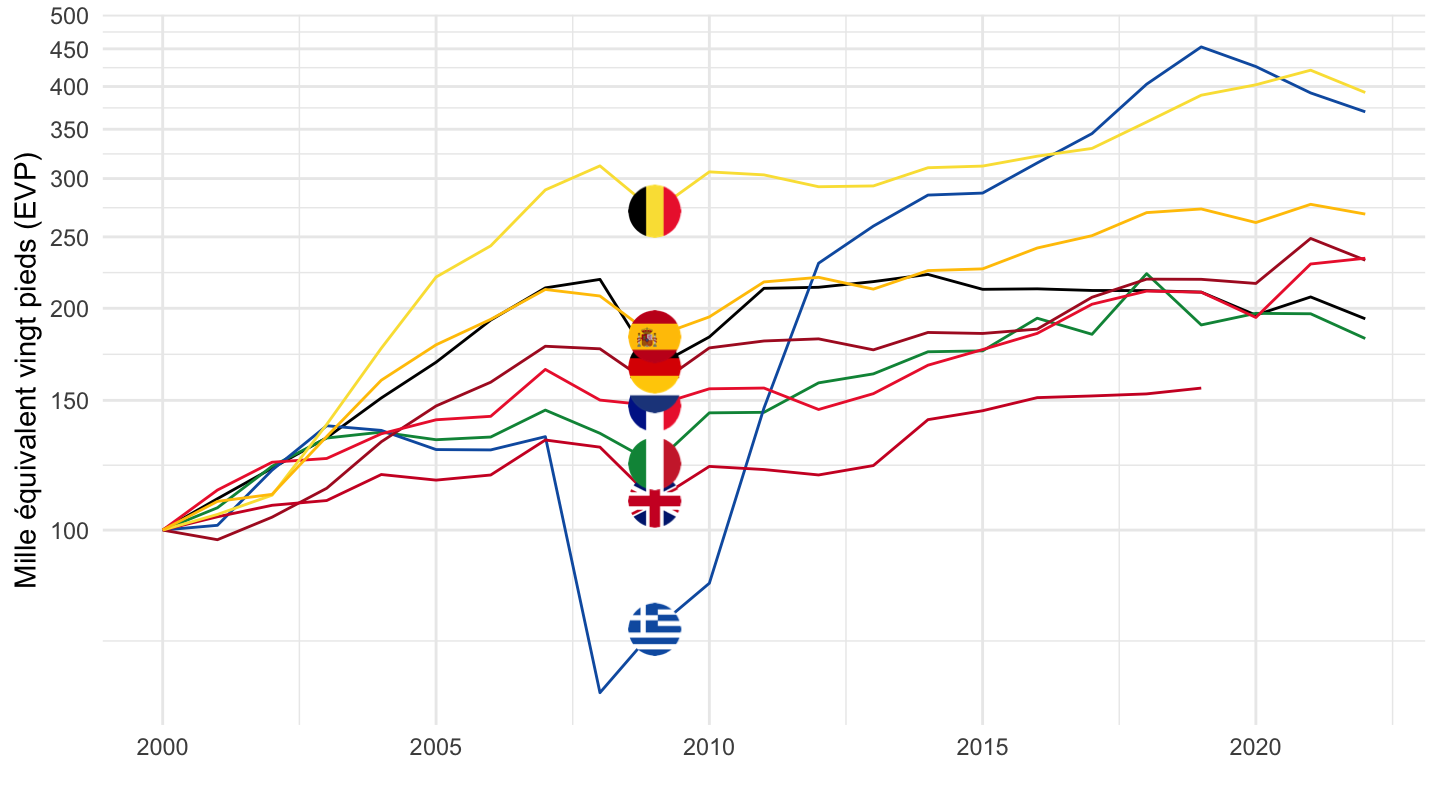
Log
Code
mar_mg_am_cvh %>%
  filter(loadstat == "TOTAL",
         unit == "THS_TEU",
         rep_mar %in% c("NL", "FR", "IT", "DE", "ES", "UK", "BE", "EL")) %>%
  select(-loadstat, -unit) %>%

  year_to_date %>%
  left_join(colors, by = c("Rep_mar" = "country")) %>%
  rename(Geo = Rep_mar) %>%
  mutate(values = values / 10^3) %>%
  ggplot + geom_line(aes(x = date, y = values, color = color)) +
  scale_color_identity() + theme_minimal() + xlab("") + ylab("") + add_8flags +
  scale_x_date(breaks = seq(1940, 2100, 2) %>% paste0("-01-01") %>% as.Date,
               labels = date_format("%Y")) +
  scale_y_log10(breaks = seq(0, 20, 2))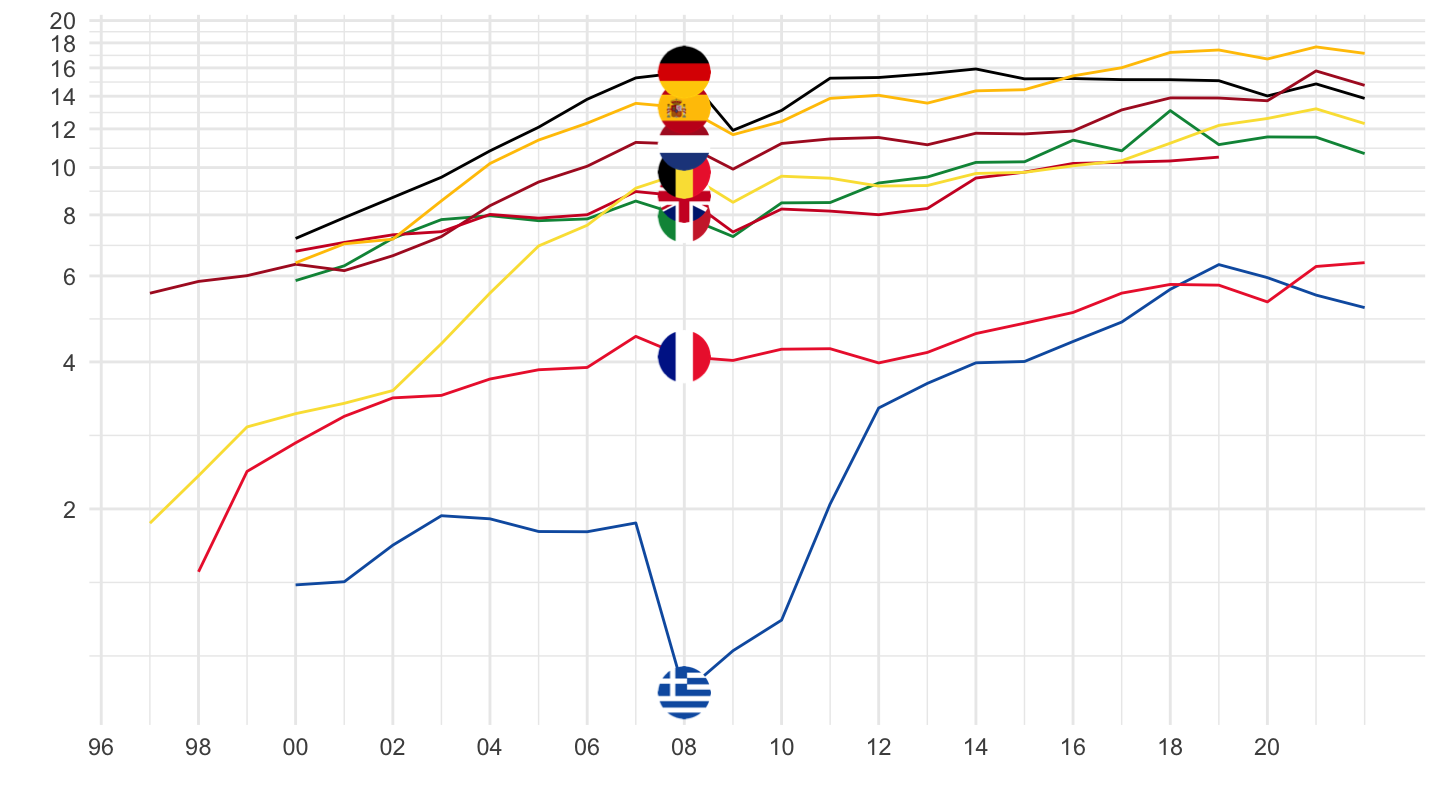
Vides
Code
mar_mg_am_cvh %>%
  filter(loadstat == "EMPTY",
         unit == "THS_TEU",
         rep_mar %in% c("NL", "FR", "IT", "DE", "ES", "UK", "BE", "EL")) %>%
  select(-loadstat, -unit) %>%

  year_to_date %>%
  left_join(colors, by = c("Rep_mar" = "country")) %>%
  rename(Geo = Rep_mar) %>%
  mutate(values = values / 10^3) %>%
  ggplot + geom_line(aes(x = date, y = values, color = color)) +
  scale_color_identity() + theme_minimal() + xlab("") + ylab("") + add_8flags +
  scale_x_date(breaks = seq(1940, 2100, 2) %>% paste0("-01-01") %>% as.Date,
               labels = date_format("%Y")) +
scale_y_continuous(breaks = seq(0, 20, 1))![]()