Last observation: juin 2026 (N = 180)
First observation: janv. 2012 (N = 46)
Last data update: 24 oct. 2026, 00:01
Last compile: 24 oct. 2026, 00:02
credithab_statistiques_mensuelles |>
  group_by(Variable, Line) |>
  summarise(Nobs = n()) |>
  arrange(Line) |>
print_table_conditional()credithab_statistiques_mensuelles |>
group_by(date) |>
summarise(Nobs = n()) |>
arrange(desc(date)) |>
print_table_conditional()# Série(s) identifiée(s) par leur numéro de ligne dans le xlsx (`Line`)
graph_credithab <- function(lines, labels = NULL, ylab = "", pct = FALSE,
from = "2012-01-01", legend = length(lines) > 1) {
d <- credithab_statistiques_mensuelles |>
filter(Line %in% lines, date >= as.Date(from))
d$Serie <- factor(d$Line, levels = lines, labels = labels %||% lines)
g <- ggplot(d) + geom_line(aes(x = date, y = value, color = Serie)) +
theme_minimal() + xlab("") + ylab(ylab) +
scale_color_manual(values = viridis(length(lines) + 1)[seq_along(lines)]) +
scale_x_date(date_breaks = "1 year", date_labels = "%Y") +
theme(legend.title = element_blank(),
legend.position = if (legend) "bottom" else "none")
g + if (pct) scale_y_continuous(labels = percent_format(accuracy = 1)) else
scale_y_continuous(labels = label_number(big.mark = " "))
}credithab_statistiques_mensuelles |>
filter(Line == 6) |>
arrange(date) |>
mutate(ma12 = slider::slide_dbl(value, mean, .before = 11, .complete = TRUE)) |>
ggplot(aes(x = date)) +
geom_line(aes(y = value, color = "Production mensuelle")) +
geom_line(aes(y = ma12, color = "Moyenne mobile sur 12 mois"), linewidth = 1) +
theme_minimal() + xlab("") + ylab("Millions d'euros") +
scale_color_manual(values = viridis(3)[c(2, 1)]) +
scale_x_date(date_breaks = "1 year", date_labels = "%Y") +
scale_y_continuous(labels = label_number(big.mark = " ")) +
theme(legend.title = element_blank(), legend.position = "bottom")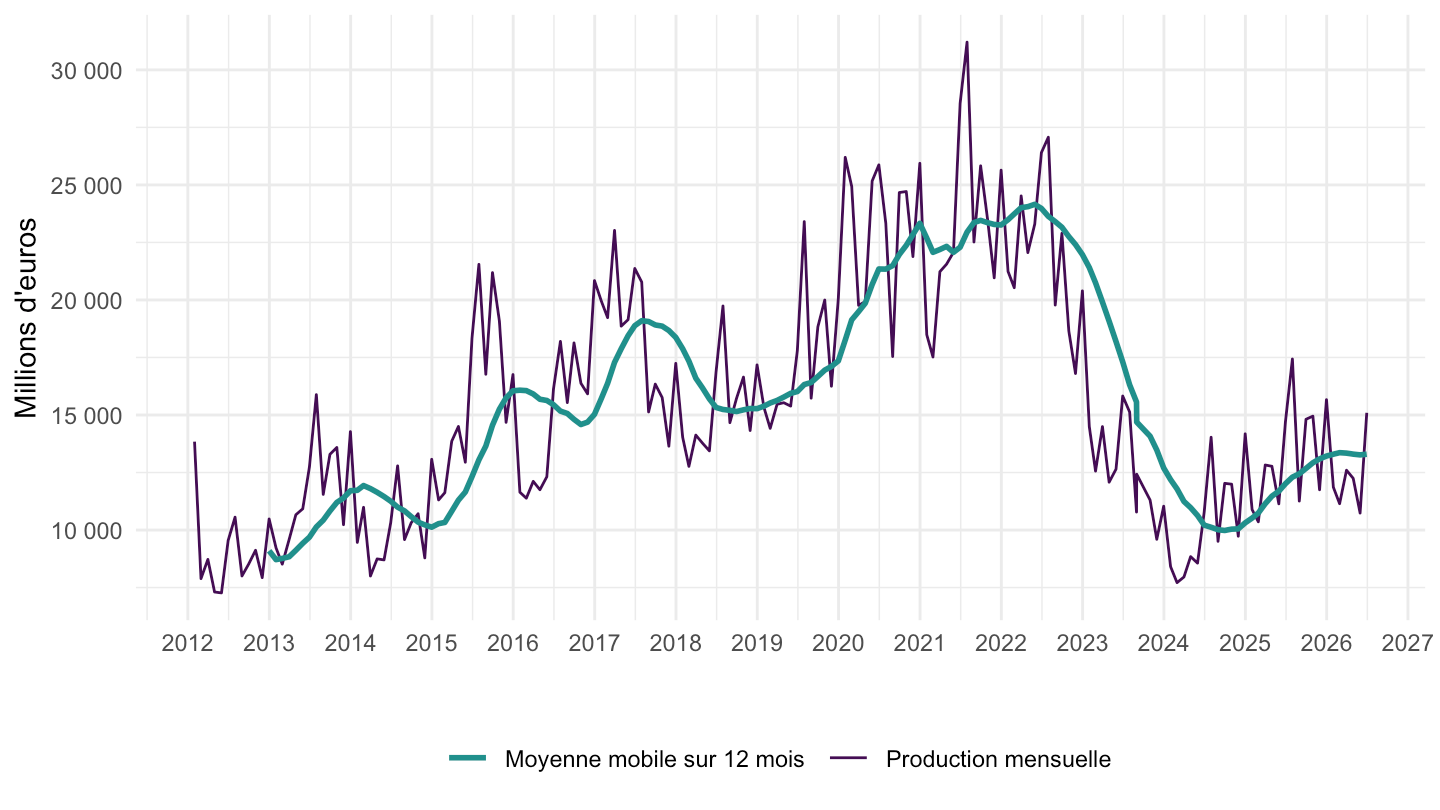
credithab_statistiques_mensuelles |>
  filter(Line == 6) |>
  arrange(date) |>
  mutate(ga = value / lag(value, 12) - 1) |>
  filter(!is.na(ga)) |>
  ggplot(aes(x = date, y = ga)) + geom_col(fill = viridis(3)[2]) +
  theme_minimal() + xlab("") + ylab("Glissement annuel (%)") +
  scale_x_date(date_breaks = "1 year", date_labels = "%Y") +
  scale_y_continuous(labels = percent_format(accuracy = 1))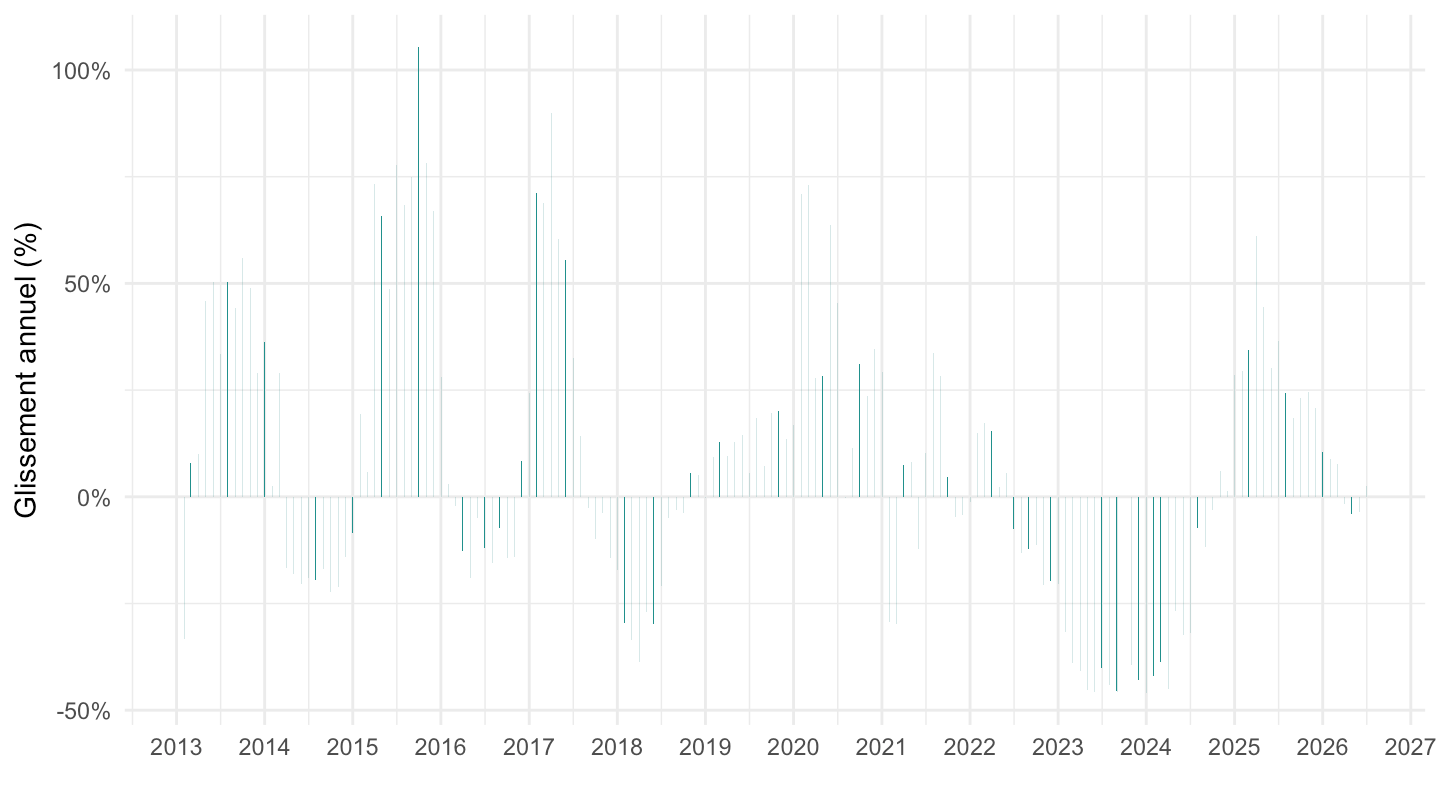
graph_credithab(10, ylab = "Nombre d'opérations par mois")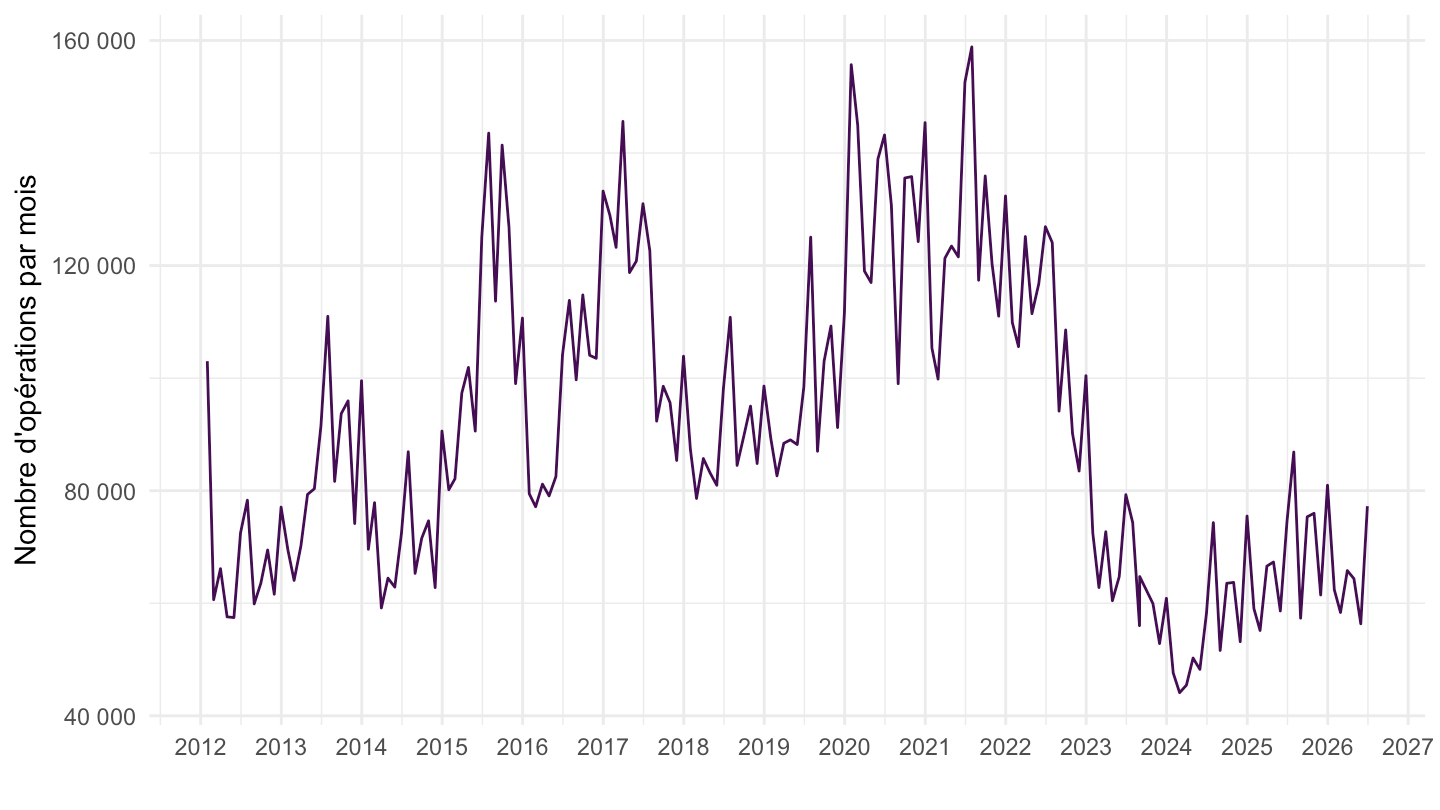
graph_credithab(c(37, 38, 42, 43, 39),
                c("Primo-accédants", "Résidence principale hors primo-accédants",
                  "Investissement locatif", "Autres crédits",
                  "Rachats de crédits externes"),
                ylab = "Part de la production (%)", pct = TRUE)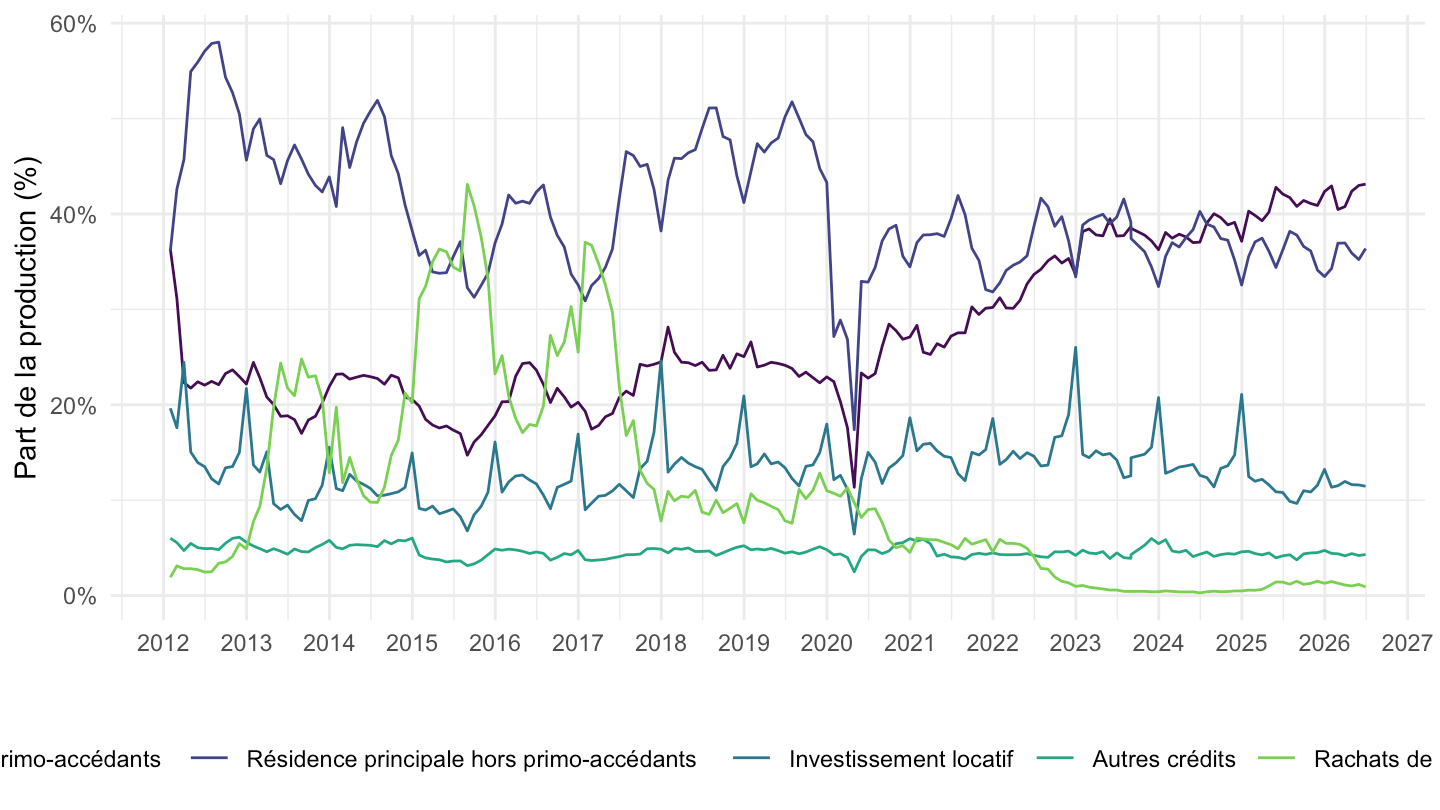
graph_credithab(c(45, 46, 47, 48),
                c("Paris", "Île-de-France hors Paris", "Province", "Outre-mer"),
                ylab = "Part de la production (%)", pct = TRUE, from = "2020-01-01")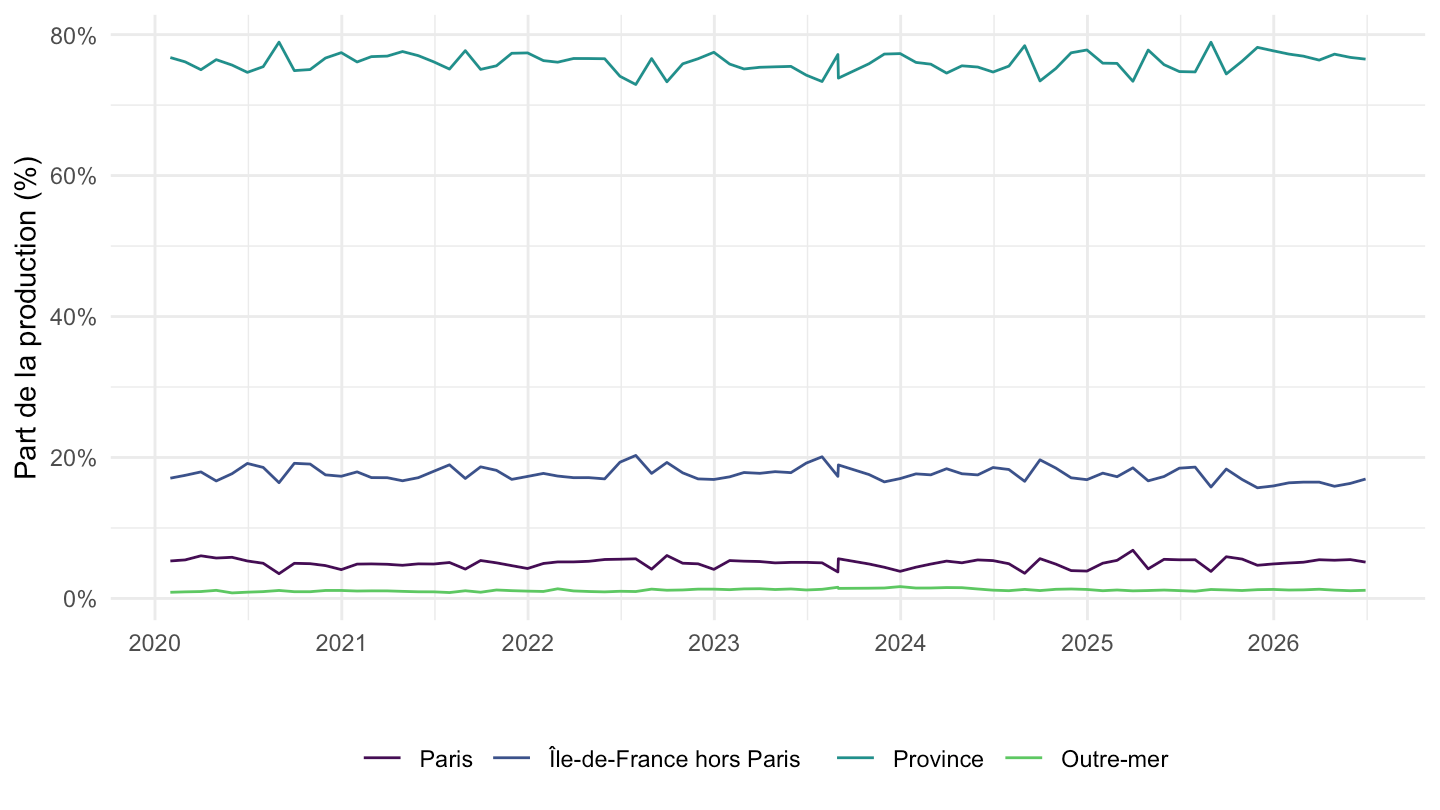
graph_credithab(c(20, 21, 22),
                c("Taux fixe", "Taux variable", "Taux mixte"),
                ylab = "Part de la production (%)", pct = TRUE, from = "2020-01-01")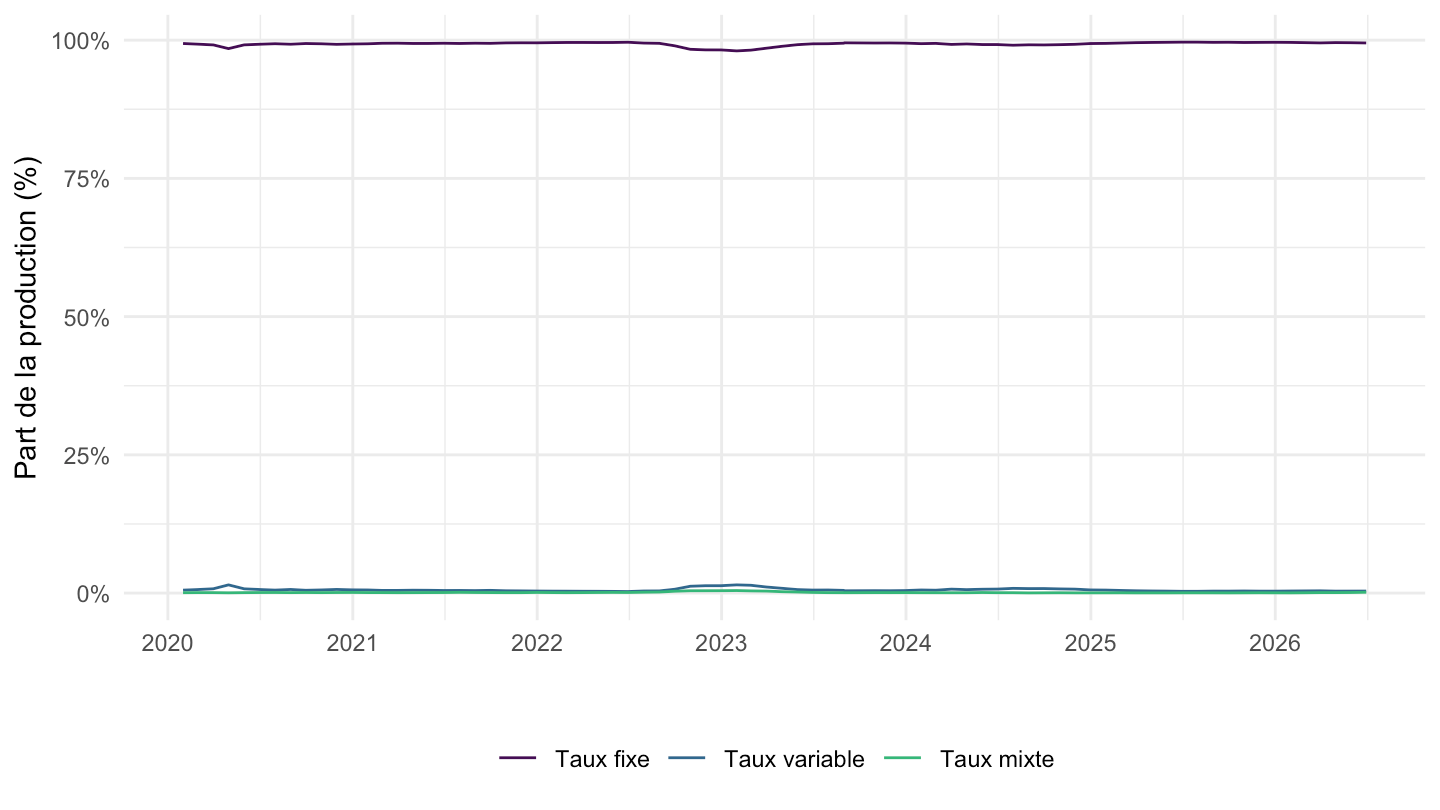
graph_credithab(c(52, 54, 55, 59),
                c("Ensemble (hors rachats, renégociations et regroupements)",
                  "Primo-accédants", "Résidence principale hors primo-accédants",
                  "Investissement locatif"),
                ylab = "Prêt moyen (euros)")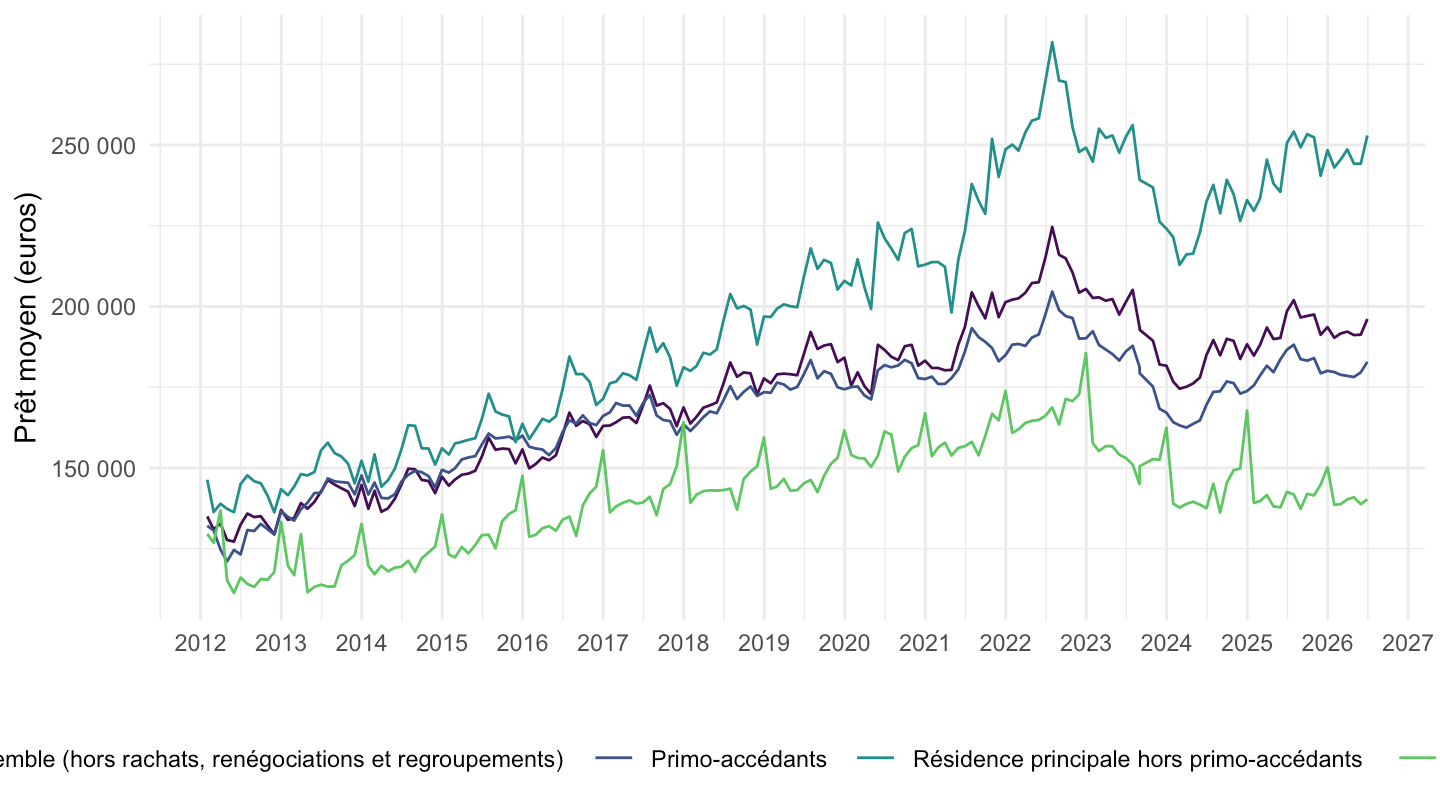
graph_credithab(c(69, 71, 72, 76),
                c("Ensemble (hors rachats, renégociations et regroupements)",
                  "Primo-accédants", "Résidence principale hors primo-accédants",
                  "Investissement locatif"),
                ylab = "Durée initiale moyenne (années)")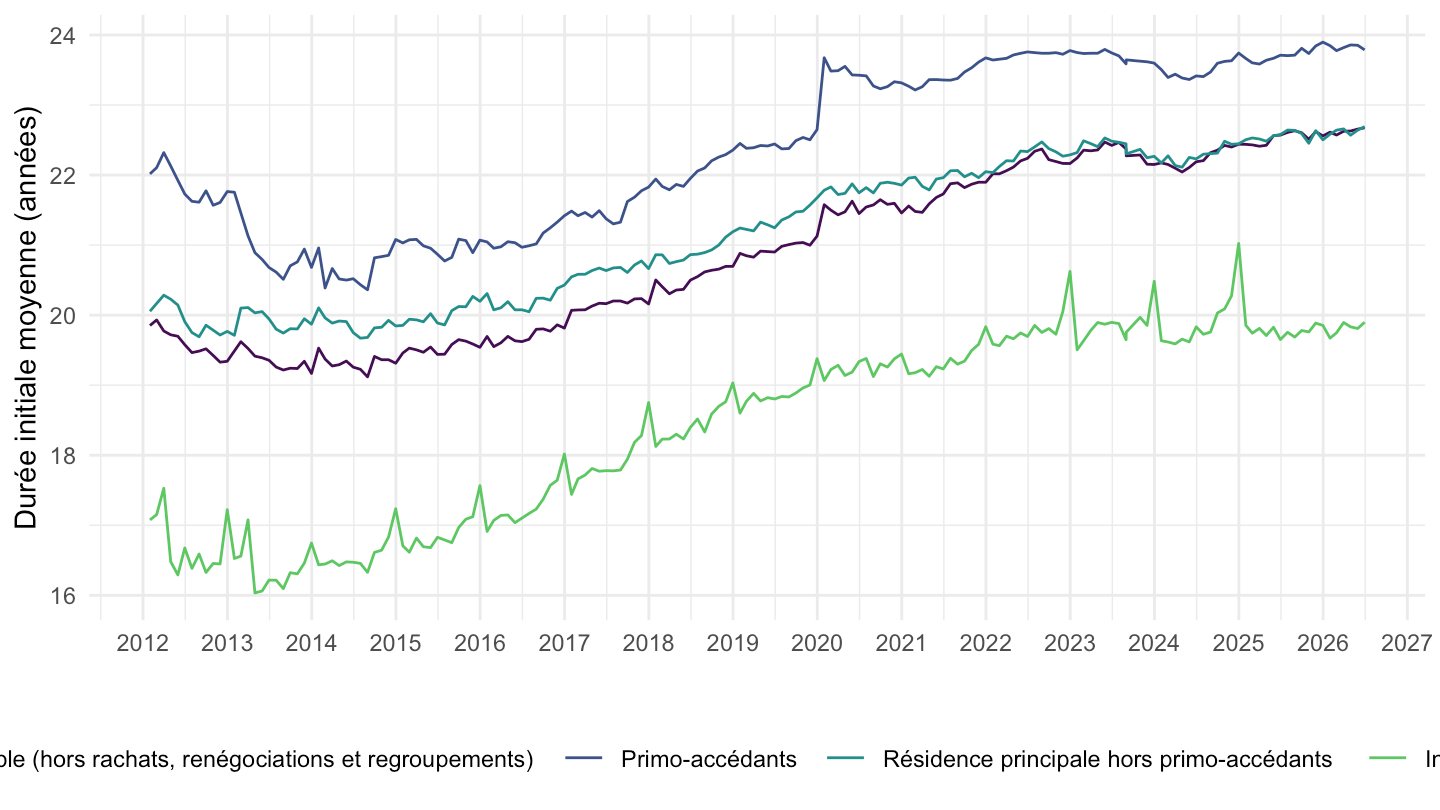
graph_credithab(c(85, 86, 87, 88, 90),
                c("≤ 10 ans", "10-15 ans", "15-20 ans", "20-25 ans", "> 25 ans"),
                ylab = "Part de la production (%)", pct = TRUE, from = "2020-01-01")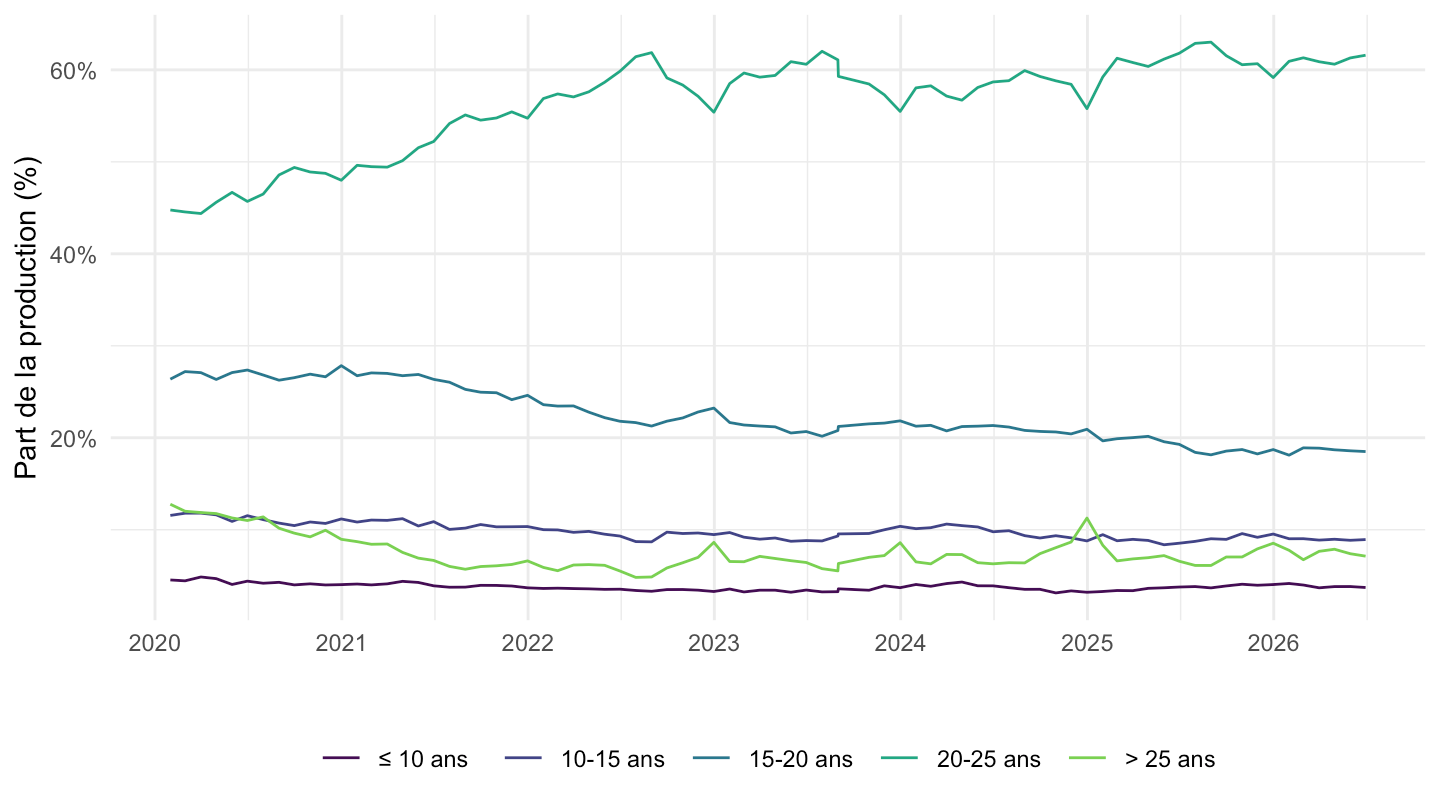
graph_credithab(c(97, 99, 100),
                c("Ensemble (hors rachats, renégociations et regroupements)",
                  "Primo-accédants", "Résidence principale hors primo-accédants"),
                ylab = "Revenus annuels moyens (euros)", from = "2020-01-01")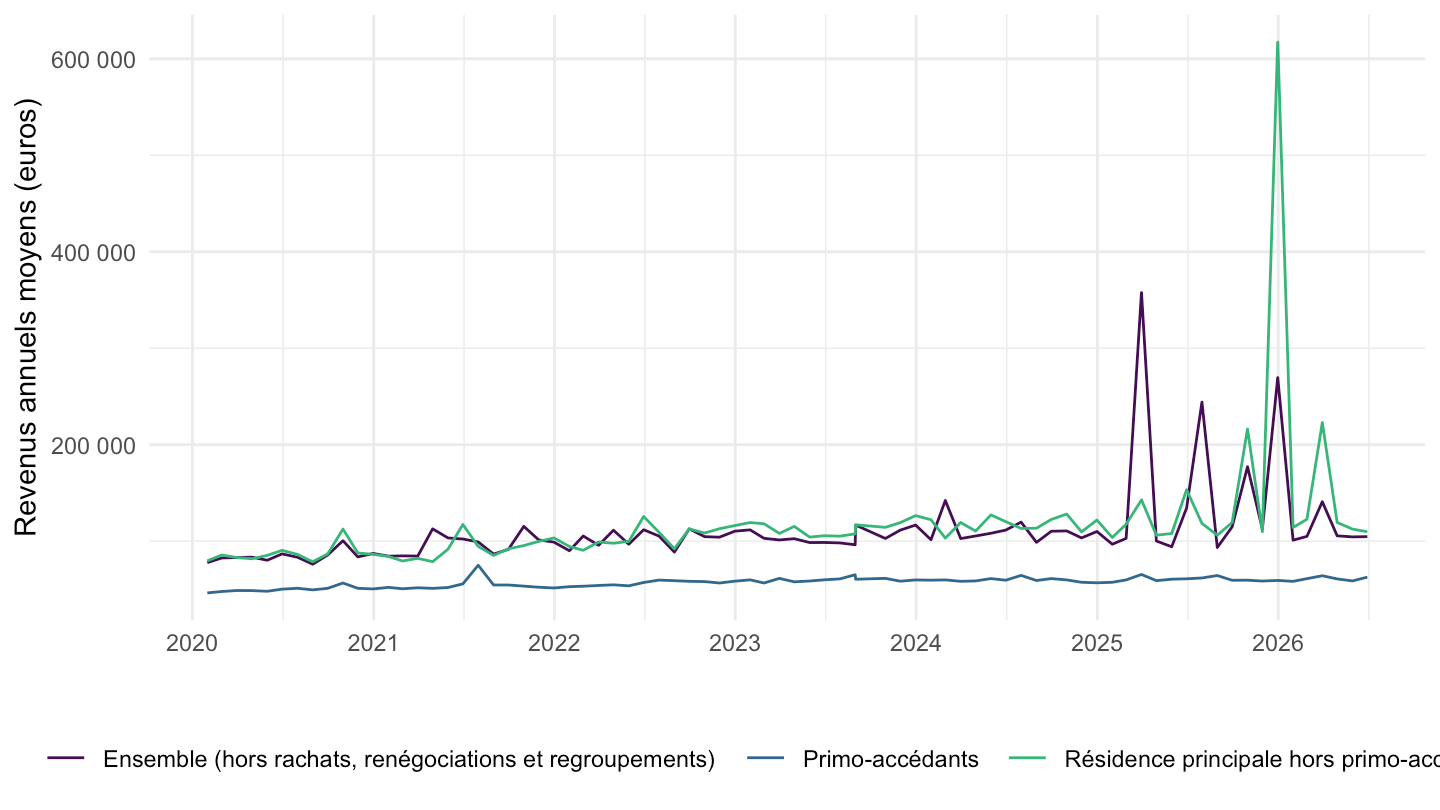
graph_credithab(c(121, 123, 124),
                c("Ensemble (hors rachats, renégociations et regroupements)",
                  "Primo-accédants", "Résidence principale hors primo-accédants"),
                ylab = "Taux d'effort moyen (%)", pct = TRUE)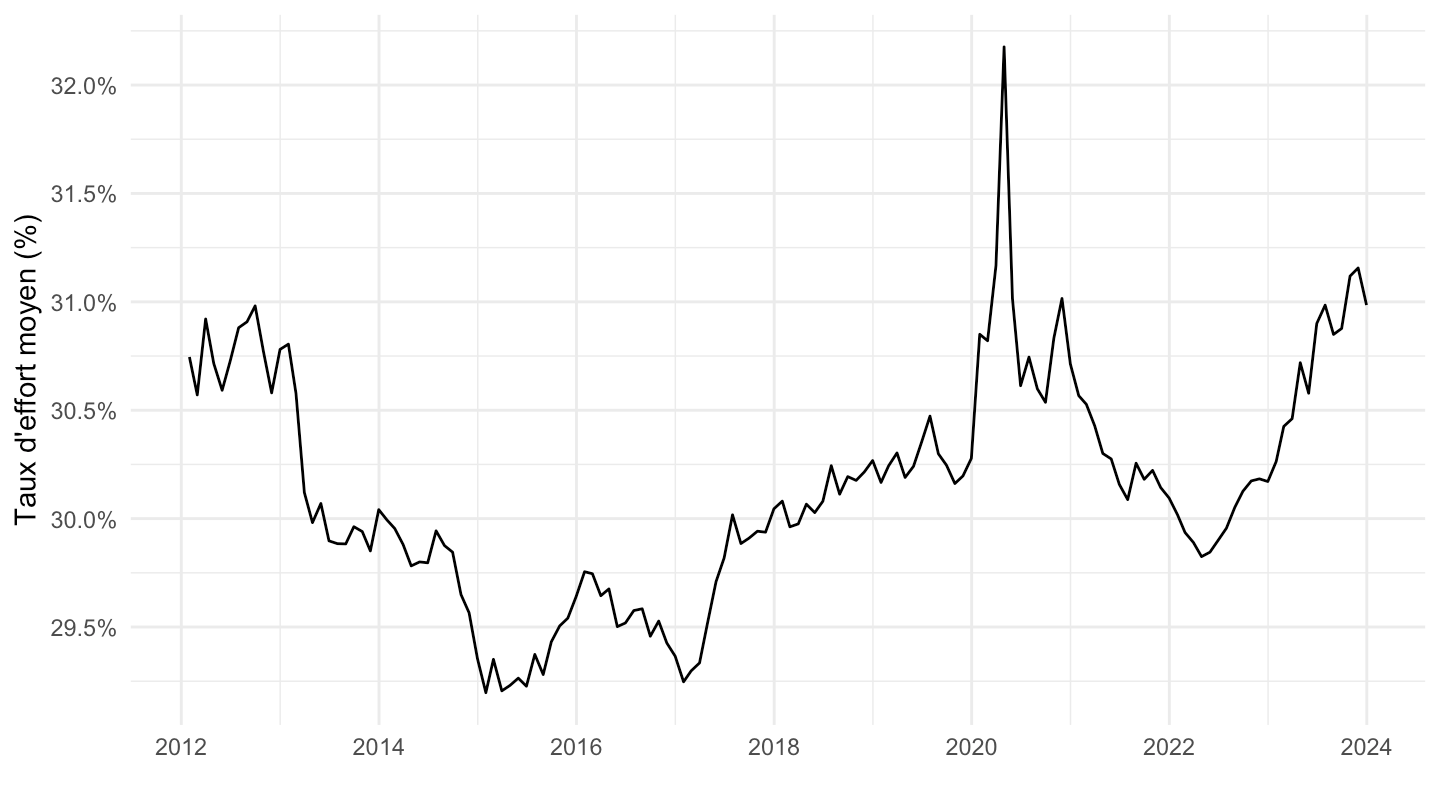
graph_credithab(c(179, 181, 182),
                c("Ensemble (hors rachats, renégociations et regroupements)",
                  "Primo-accédants", "Résidence principale hors primo-accédants"),
                ylab = "LTV moyenne (%)", pct = TRUE)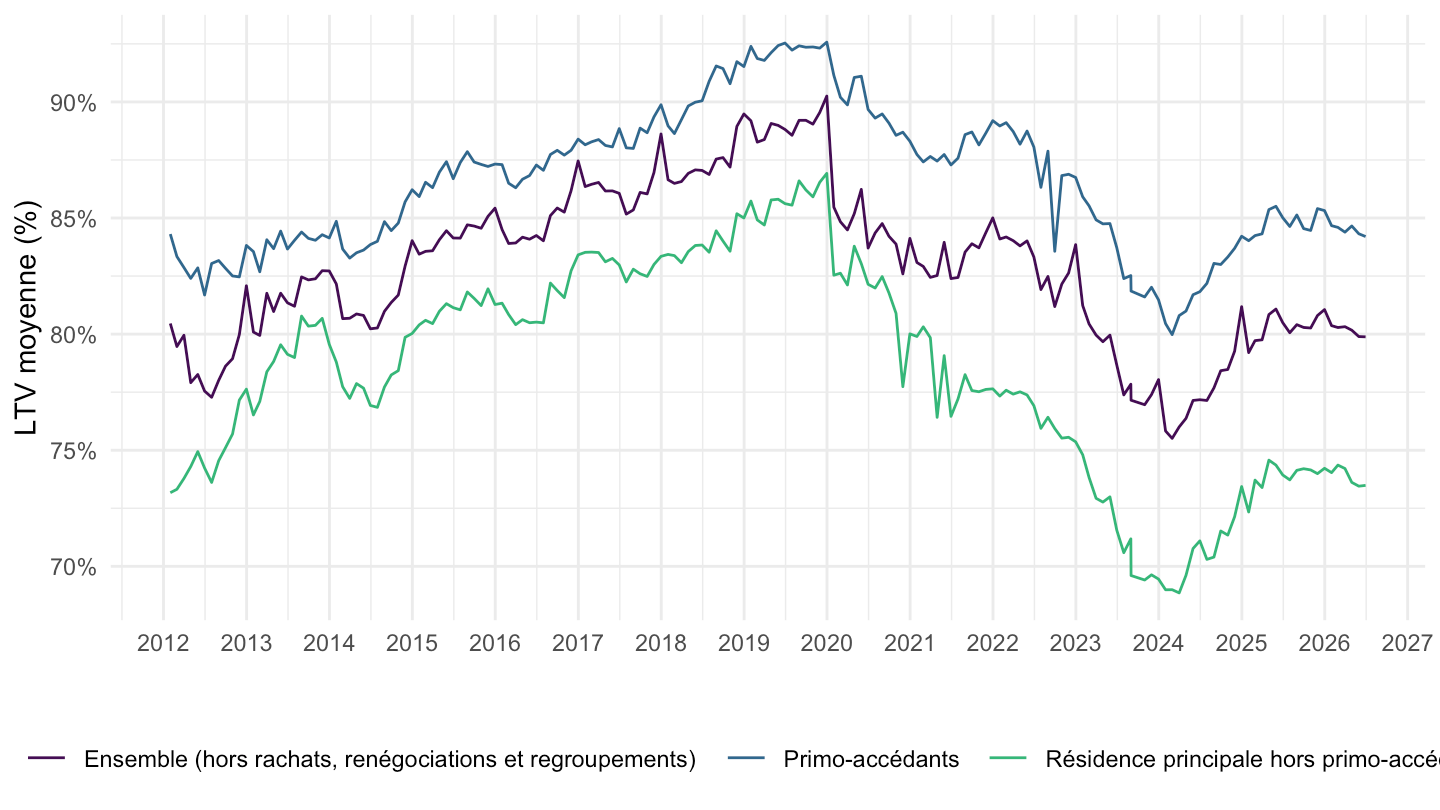
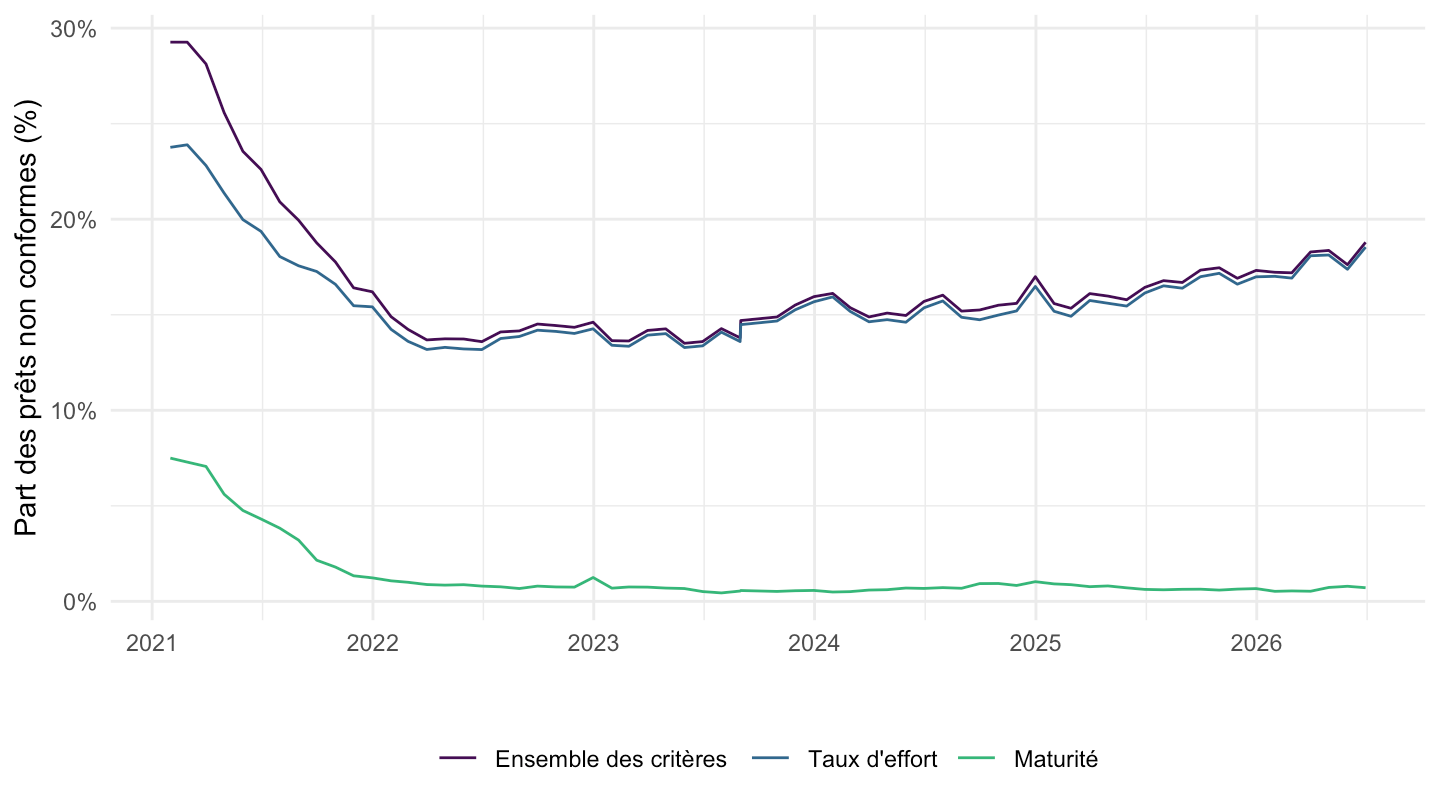
graph_credithab(c(203, 207, 213),
                c("Ensemble des critères", "Taux d'effort", "Maturité"),
                ylab = "Part des prêts non conformes (%)", pct = TRUE, from = "2021-01-01")