
Last data update: 14 oct. 2026, 06:33
Last compile: 14 oct. 2026, 06:46
Spreads quotidiens reconstitués à partir des rendements 10 ans de clôture (bonds.parquet) : rendement du pays moins rendement du Bund.
sel <- c("France", "Italie", "Espagne", "Grèce", "Portugal", "Belgique")
sym <- c("France" = "France", "Italie" = "Italy", "Espagne" = "Spain",
         "Grèce" = "Greece", "Portugal" = "Portugal", "Belgique" = "Belgium")
start <- as.Date("2026-07-01")

bd <- read_parquet("bonds.parquet") |>
  filter(symbol %in% paste(c(unname(sym), "Germany"), "10Y"), Date >= start) |>
  mutate(pays = sub(" 10Y$", "", symbol)) |>
  select(pays, Date, Close) |>
  tidyr::pivot_wider(names_from = pays, values_from = Close)

d <- purrr::imap_dfr(sym, function(en, fr)
  tibble(country = fr, date = bd$Date,
         spread_bund = (bd[[en]] - bd$Germany) * 100)) |>
  filter(!is.na(spread_bund)) |>
  mutate(country_en = to_en(country), slug = to_slug(country_en),
         flag_img = ifelse(is.na(slug), NA_character_,
                           file.path("..", "..", "icon", "flag", "round",
                                     paste0(slug, ".png")))) |>
  add_flag_color("country_en")

span <- as.numeric(diff(range(d$date)))
gap  <- 0.085 * diff(range(d$spread_bund, na.rm = TRUE))

ends <- d |> group_by(country) |> slice_max(date, n = 1) |>
  ungroup() |> arrange(spread_bund)
y <- ends$spread_bund
for (i in seq_along(y)[-1]) if (y[i] - y[i - 1] < gap) y[i] <- y[i - 1] + gap
ends$y_lab <- y - mean(y - ends$spread_bund)

ggplot(d, aes(date, spread_bund)) +
  geom_line(aes(color = color, group = country), linewidth = 0.8) +
  geom_segment(data = ends, aes(x = date, xend = date + span * 0.025,
                                y = spread_bund, yend = y_lab, color = color),
               linewidth = 0.3) +
  ggimage::geom_image(
    data = ends, inherit.aes = FALSE, na.rm = TRUE,
    aes(x = date + span * 0.047, y = y_lab, image = flag_img),
    size = 0.03, asp = 1.8) +
  geom_text(
    data = ends,
    aes(x = date + span * 0.075, y = y_lab, label = country, color = color),
    hjust = 0, size = 3.3) +
  scale_color_identity() +
  scale_y_continuous(breaks = seq(0, 200, 10)) +
  scale_x_date(expand = expansion(mult = c(0.01, 0.17)),
               breaks = seq.Date(start, Sys.Date(), by = "month"),
               minor_breaks = seq.Date(start, Sys.Date(), by = "week"),
               labels = date_format("%b %Y")) +
  theme_minimal() + xlab("") + ylab("Spread vs Bund 10 ans (pb)")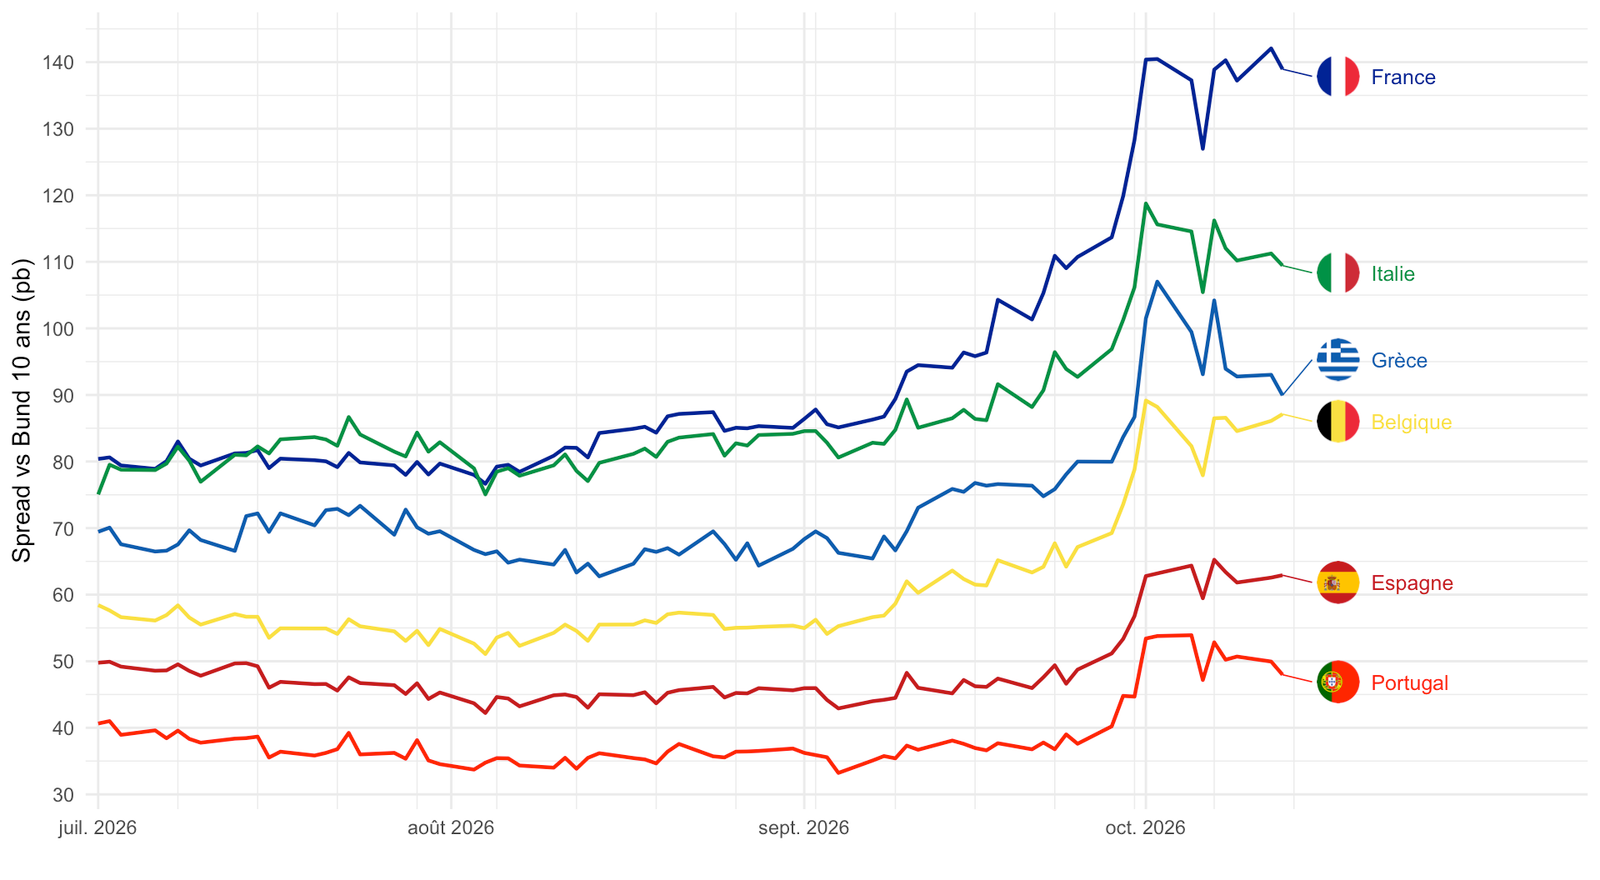
sel <- c("France", "Italie", "Espagne", "Grèce", "Portugal", "Belgique")
d <- spreads |> filter(country %in% sel)

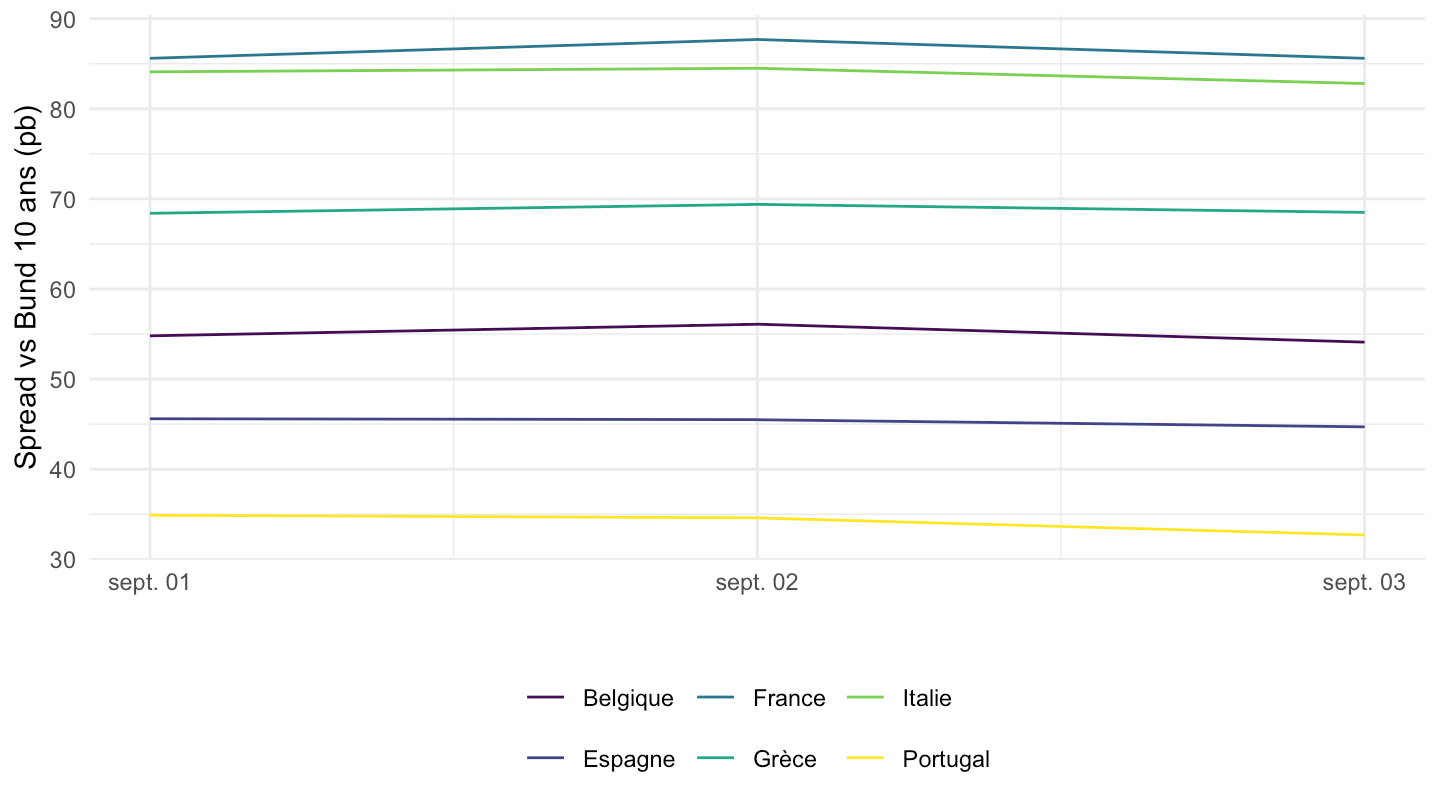
if (n_distinct(d$scraped_date) < 2) {
  knitr::asis_output(paste0(
    "_Série trop courte (", n_distinct(d$scraped_date),
    " relevé) — le graphique se remplira au fil des instantanés quotidiens._"))
} else {
  d    <- add_flag_color(d, "country_en")
  span <- as.numeric(diff(range(d$scraped_date)))
  gap  <- 0.07 * diff(range(d$spread_bund, na.rm = TRUE))

  ends <- d |> group_by(country) |> slice_max(scraped_date, n = 1) |>
    ungroup() |> arrange(spread_bund)
  y <- ends$spread_bund
  for (i in seq_along(y)[-1]) if (y[i] - y[i - 1] < gap) y[i] <- y[i - 1] + gap
  ends$y_lab <- y - mean(y - ends$spread_bund)

  ggplot(d, aes(scraped_date, spread_bund)) +
    geom_line(aes(color = color, group = country), linewidth = 0.7) +
    ggimage::geom_image(
      data = ends, inherit.aes = FALSE, na.rm = TRUE,
      aes(x = scraped_date + span * 0.03 + 0.4, y = y_lab, image = flag_img),
      size = 0.05, asp = 1.5) +
    geom_text(
      data = ends,
      aes(x = scraped_date + span * 0.07 + 0.9, y = y_lab, label = country,
          color = color),
      hjust = 0, size = 3) +
    scale_color_identity() +
    scale_y_continuous(breaks = seq(0, 200, 10)) +
    scale_x_date(expand = expansion(mult = c(0.02, 0.24)),
                 breaks = seq.Date(as.Date("2026-09-01"), Sys.Date()),
                 labels = date_format("%d %b %Y")) +
    theme_minimal() + xlab("") + ylab("Spread vs Bund 10 ans (pb)") +
    theme(axis.text.x = element_text(angle = 45, vjust = 1, hjust = 1))
}
euro <- c("France", "Italie", "Espagne", "Pays-Bas", "Grèce")

spreads |>
  filter(scraped_date == last_day, country %in% euro) |>
  add_flag_color("country_en") |>
  bar_flags(flag_size = 0.07)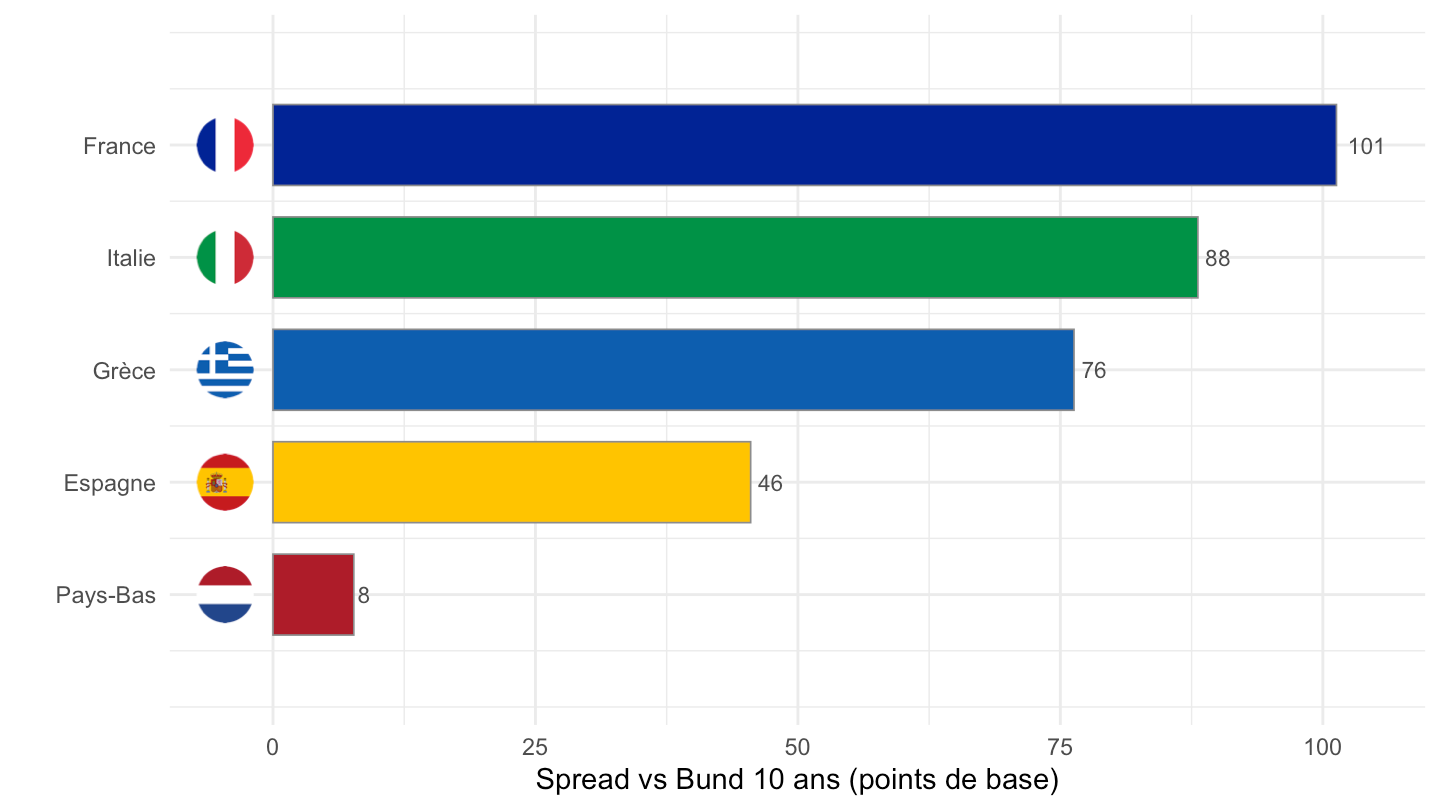
euro <- c("France", "Italie", "Espagne", "Portugal", "Belgique", "Pays-Bas",
          "Grèce", "Autriche", "Irlande", "Finlande", "Slovaquie", "Slovénie",
          "Lituanie", "Chypre", "Croatie", "Malte")

spreads |>
  filter(scraped_date == last_day, country %in% euro) |>
  add_flag_color("country_en") |>
  bar_flags()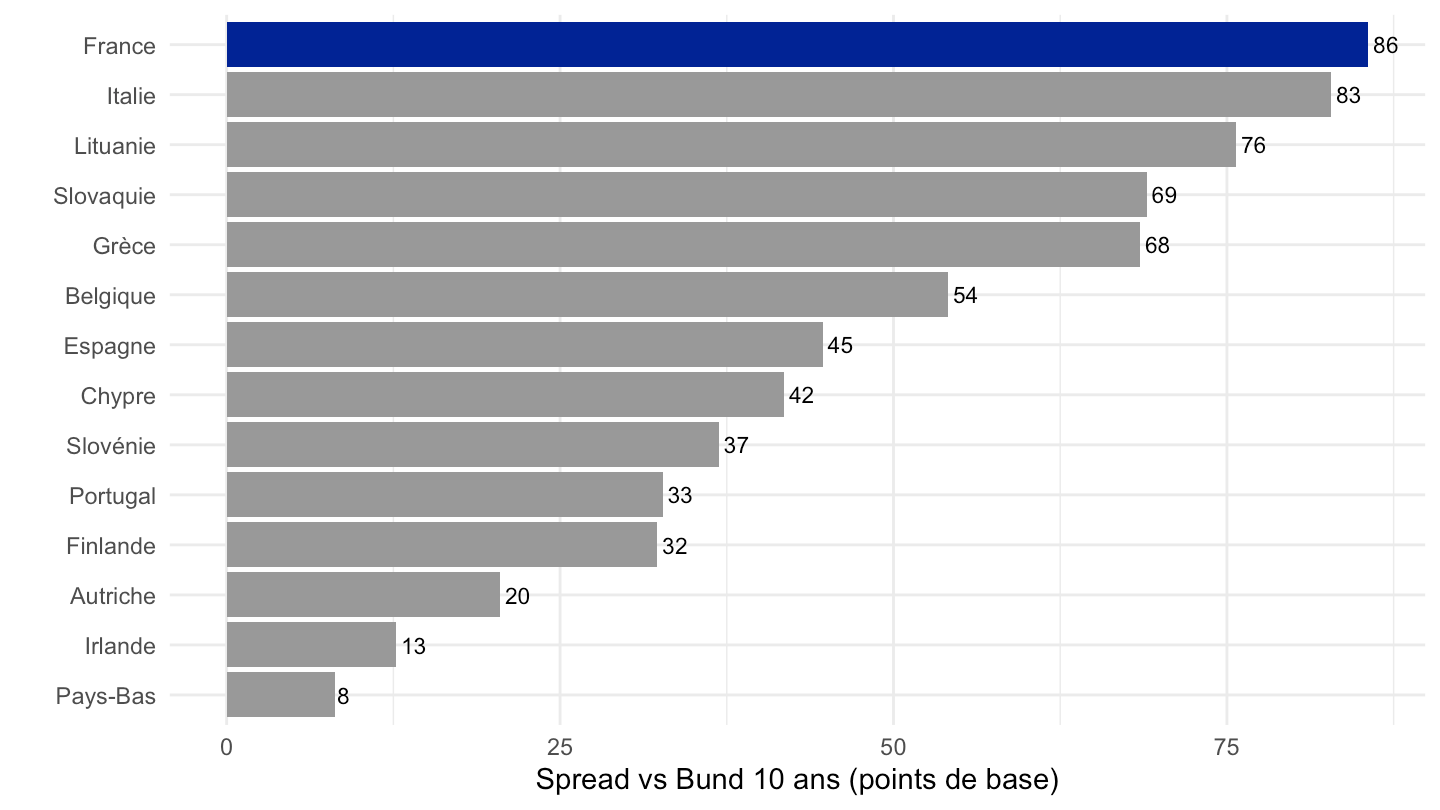
Spread OAT 10 ans - Bund 10 ans, quotidien (investing.com). Il est quasi nul avant 2007 ; il décolle avec la crise financière de 2008.
bonds_fr_de <- read_parquet("bonds.parquet") |>
  filter(symbol %in% c("France 10Y", "Germany 10Y"), Date >= as.Date("2005-01-01")) |>
  select(symbol, Date, Close) |>
  tidyr::pivot_wider(names_from = symbol, values_from = Close) |>
  transmute(Date, spread = (`France 10Y` - `Germany 10Y`) * 100) |>
  filter(!is.na(spread))

events <- tibble::tribble(
  ~date,        ~y,  ~label,
  "2008-12-01",  72, "Crise financière de\n2007-2009",
  "2010-09-01", 100, "Crise de la Z€\n de 2011-12",
  "2012-09-01", 168, "Draghi :\n« Whatever\nit takes »",
  "2017-04-01",  98, "Élection 2017\n(menaces de Frexit)",
  "2020-03-15",  88, "Lagarde :\n« We are not\nhere to close\nspreads »",
  "2024-06-01", 108, "Dissolution\n2024") |>
  mutate(date = as.Date(date))

ggplot(bonds_fr_de, aes(Date, spread)) +
  geom_line(color = "black", linewidth = 0.5) +
  geom_text(data = events, aes(x = date, y = y, label = label),
            size = 3, lineheight = 0.9, color = "grey20") +
  scale_x_date(breaks = seq.Date(as.Date("2005-01-01"), Sys.Date(), by = "1 years"),
               labels = date_format("%Y")) +
  scale_y_continuous(breaks = seq(0, 200, 20)) +
  theme_minimal() + xlab("") +
  ylab("Spread OAT-Bund 10 ans (points de base)")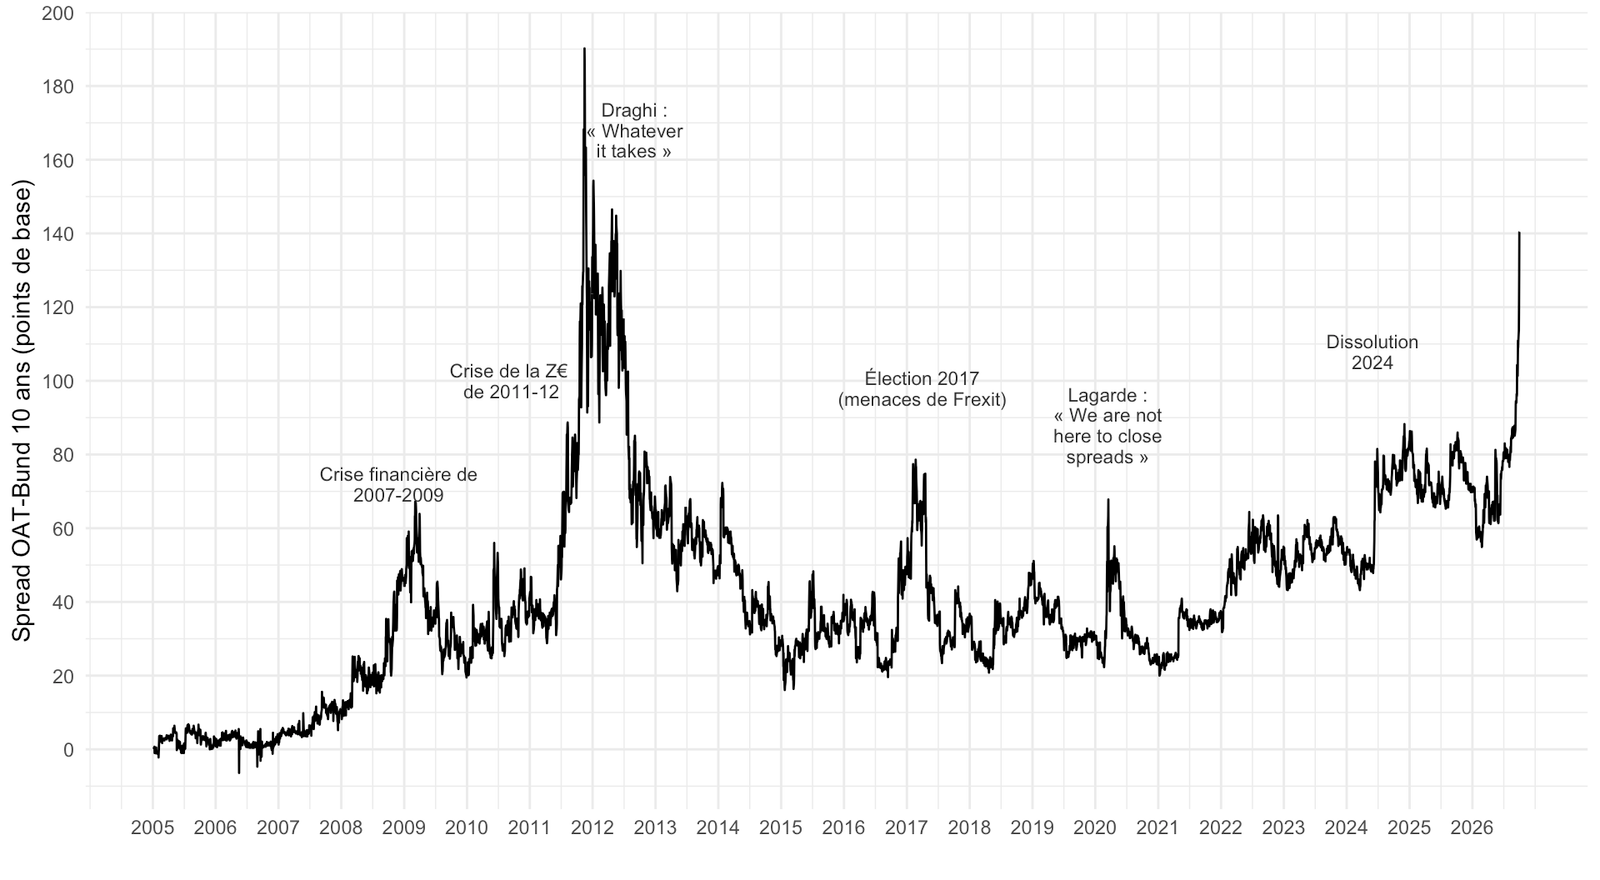
ggplot(bonds_fr_de, aes(Date, spread)) +
  annotate("rect", xmin = as.Date(-Inf), xmax = as.Date(Inf), ymin = 60, ymax = 100,
           fill = "grey90", alpha = 0.8) +
  geom_line(color = "#8B4A42", linewidth = 0.5) +
  geom_text(data = events, aes(x = date, y = y, label = label),
            size = 3, lineheight = 0.9, color = "grey20") +
  scale_x_date(breaks = seq.Date(as.Date("2005-01-01"), Sys.Date(), by = "2 years"),
               labels = date_format("%Y")) +
  scale_y_continuous(breaks = seq(0, 200, 20)) +
  theme_minimal() + xlab("") +
  ylab("Spread OAT-Bund 10 ans (points de base)")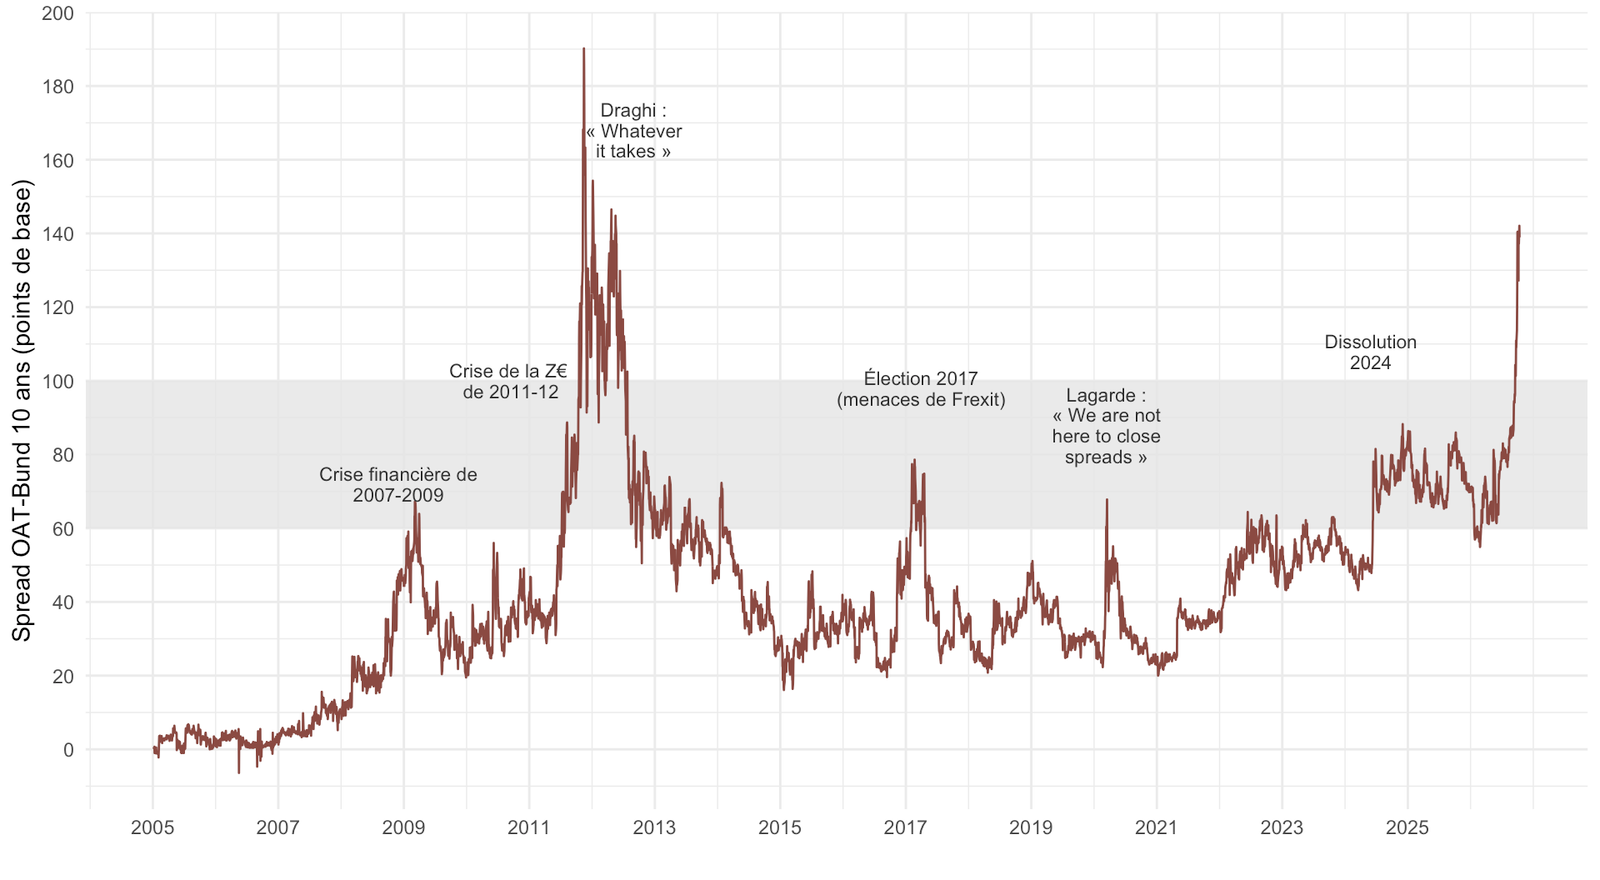
Variation du spread OAT-Bund 10 ans par rapport au dernier jour avant la hausse (J0), en jours de bourse (J+1, J+2, …). Les chocs de 2017, de mars 2020 (déclaration de Lagarde le 12 mars, à J+11) et de 2024 sont rapides ; l’épisode actuel est beaucoup plus progressif.
episodes <- tibble::tribble(
  ~episode,                                   ~j0,          ~color,
  "Crise des dettes souveraines (J0 = 3 juin 2011)", "2011-09-03", "#7A5195",
  "Élection 2017 (J0 = 24 janv. 2017)",       "2017-01-24", "#2E6DA4",
  "« Not here to close spreads » (J0 = 25 févr. 2020)", "2020-02-25", "#D98C1F",
  "Dissolution 2024 (J0 = 7 juin 2024)",      "2024-06-07", "#2F9E6B",
  "Épisode actuel (J0 = 1er juin 2026)",      "2026-06-01", "#8B2E2E") |>
  mutate(j0 = as.Date(j0))

ep <- purrr::pmap_dfr(episodes, function(episode, j0, color) {
  d <- bonds_fr_de |> filter(Date >= j0)
  tibble(episode = episode, color = color, Date = d$Date,
         jour = seq_len(nrow(d)) - 1L, delta = d$spread - d$spread[1])
}) |>
  filter(jour <= 90)

ends <- ep |> group_by(episode) |> slice_max(jour, n = 1) |> ungroup()

ggplot(ep, aes(jour, delta, color = color, group = episode)) +
  geom_hline(yintercept = 0, color = "grey60") +
  geom_line(linewidth = 0.9) +
  geom_point(data = ends, size = 2) +
  geom_text(data = ends, aes(label = paste0(sprintf("%+.0f", delta), " pb")),
            hjust = -0.2, size = 3.3, show.legend = FALSE) +
  scale_color_identity(guide = "legend", breaks = episodes$color,
                       labels = episodes$episode) +
  scale_x_continuous(breaks = seq(0, 90, 10), labels = function(x) paste0("J+", x),
                     expand = expansion(mult = c(0.01, 0.06))) +
  theme_minimal() + xlab("Jours de bourse depuis J0") +
  ylab("Variation du spread depuis J0 (pb)") +
  theme(legend.position = c(0.02, 0.98), legend.justification = c(0, 1),
        legend.title = element_blank())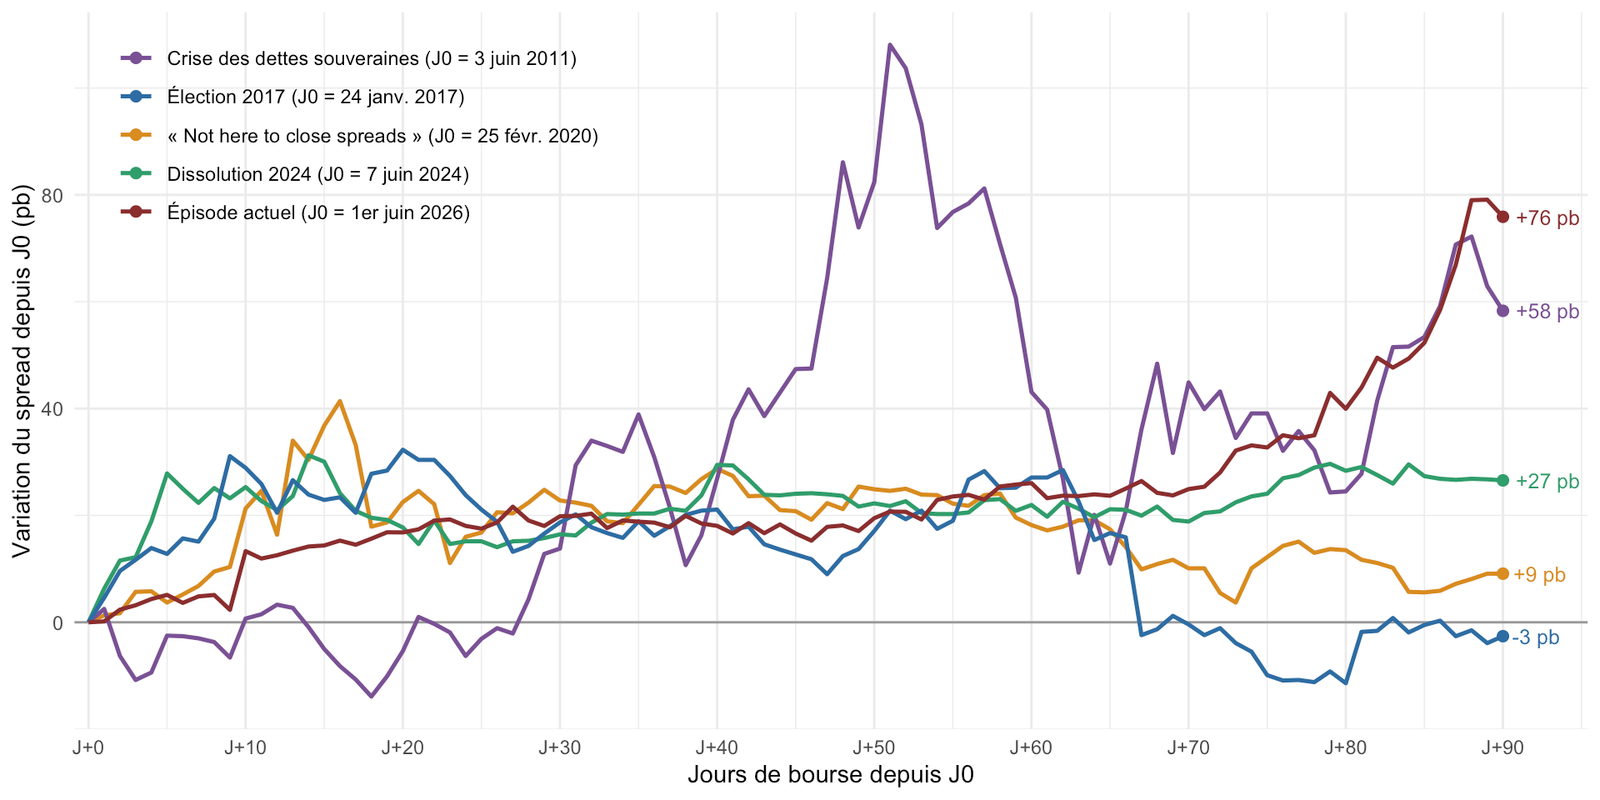
spreads |>
  filter(scraped_date == last_day, !is.na(spread_bund)) |>
  add_flag_color("country_en") |>
  bar_flags(flag_size = 0.055, asp = 0.30, txt_size = 2, label_size = 7)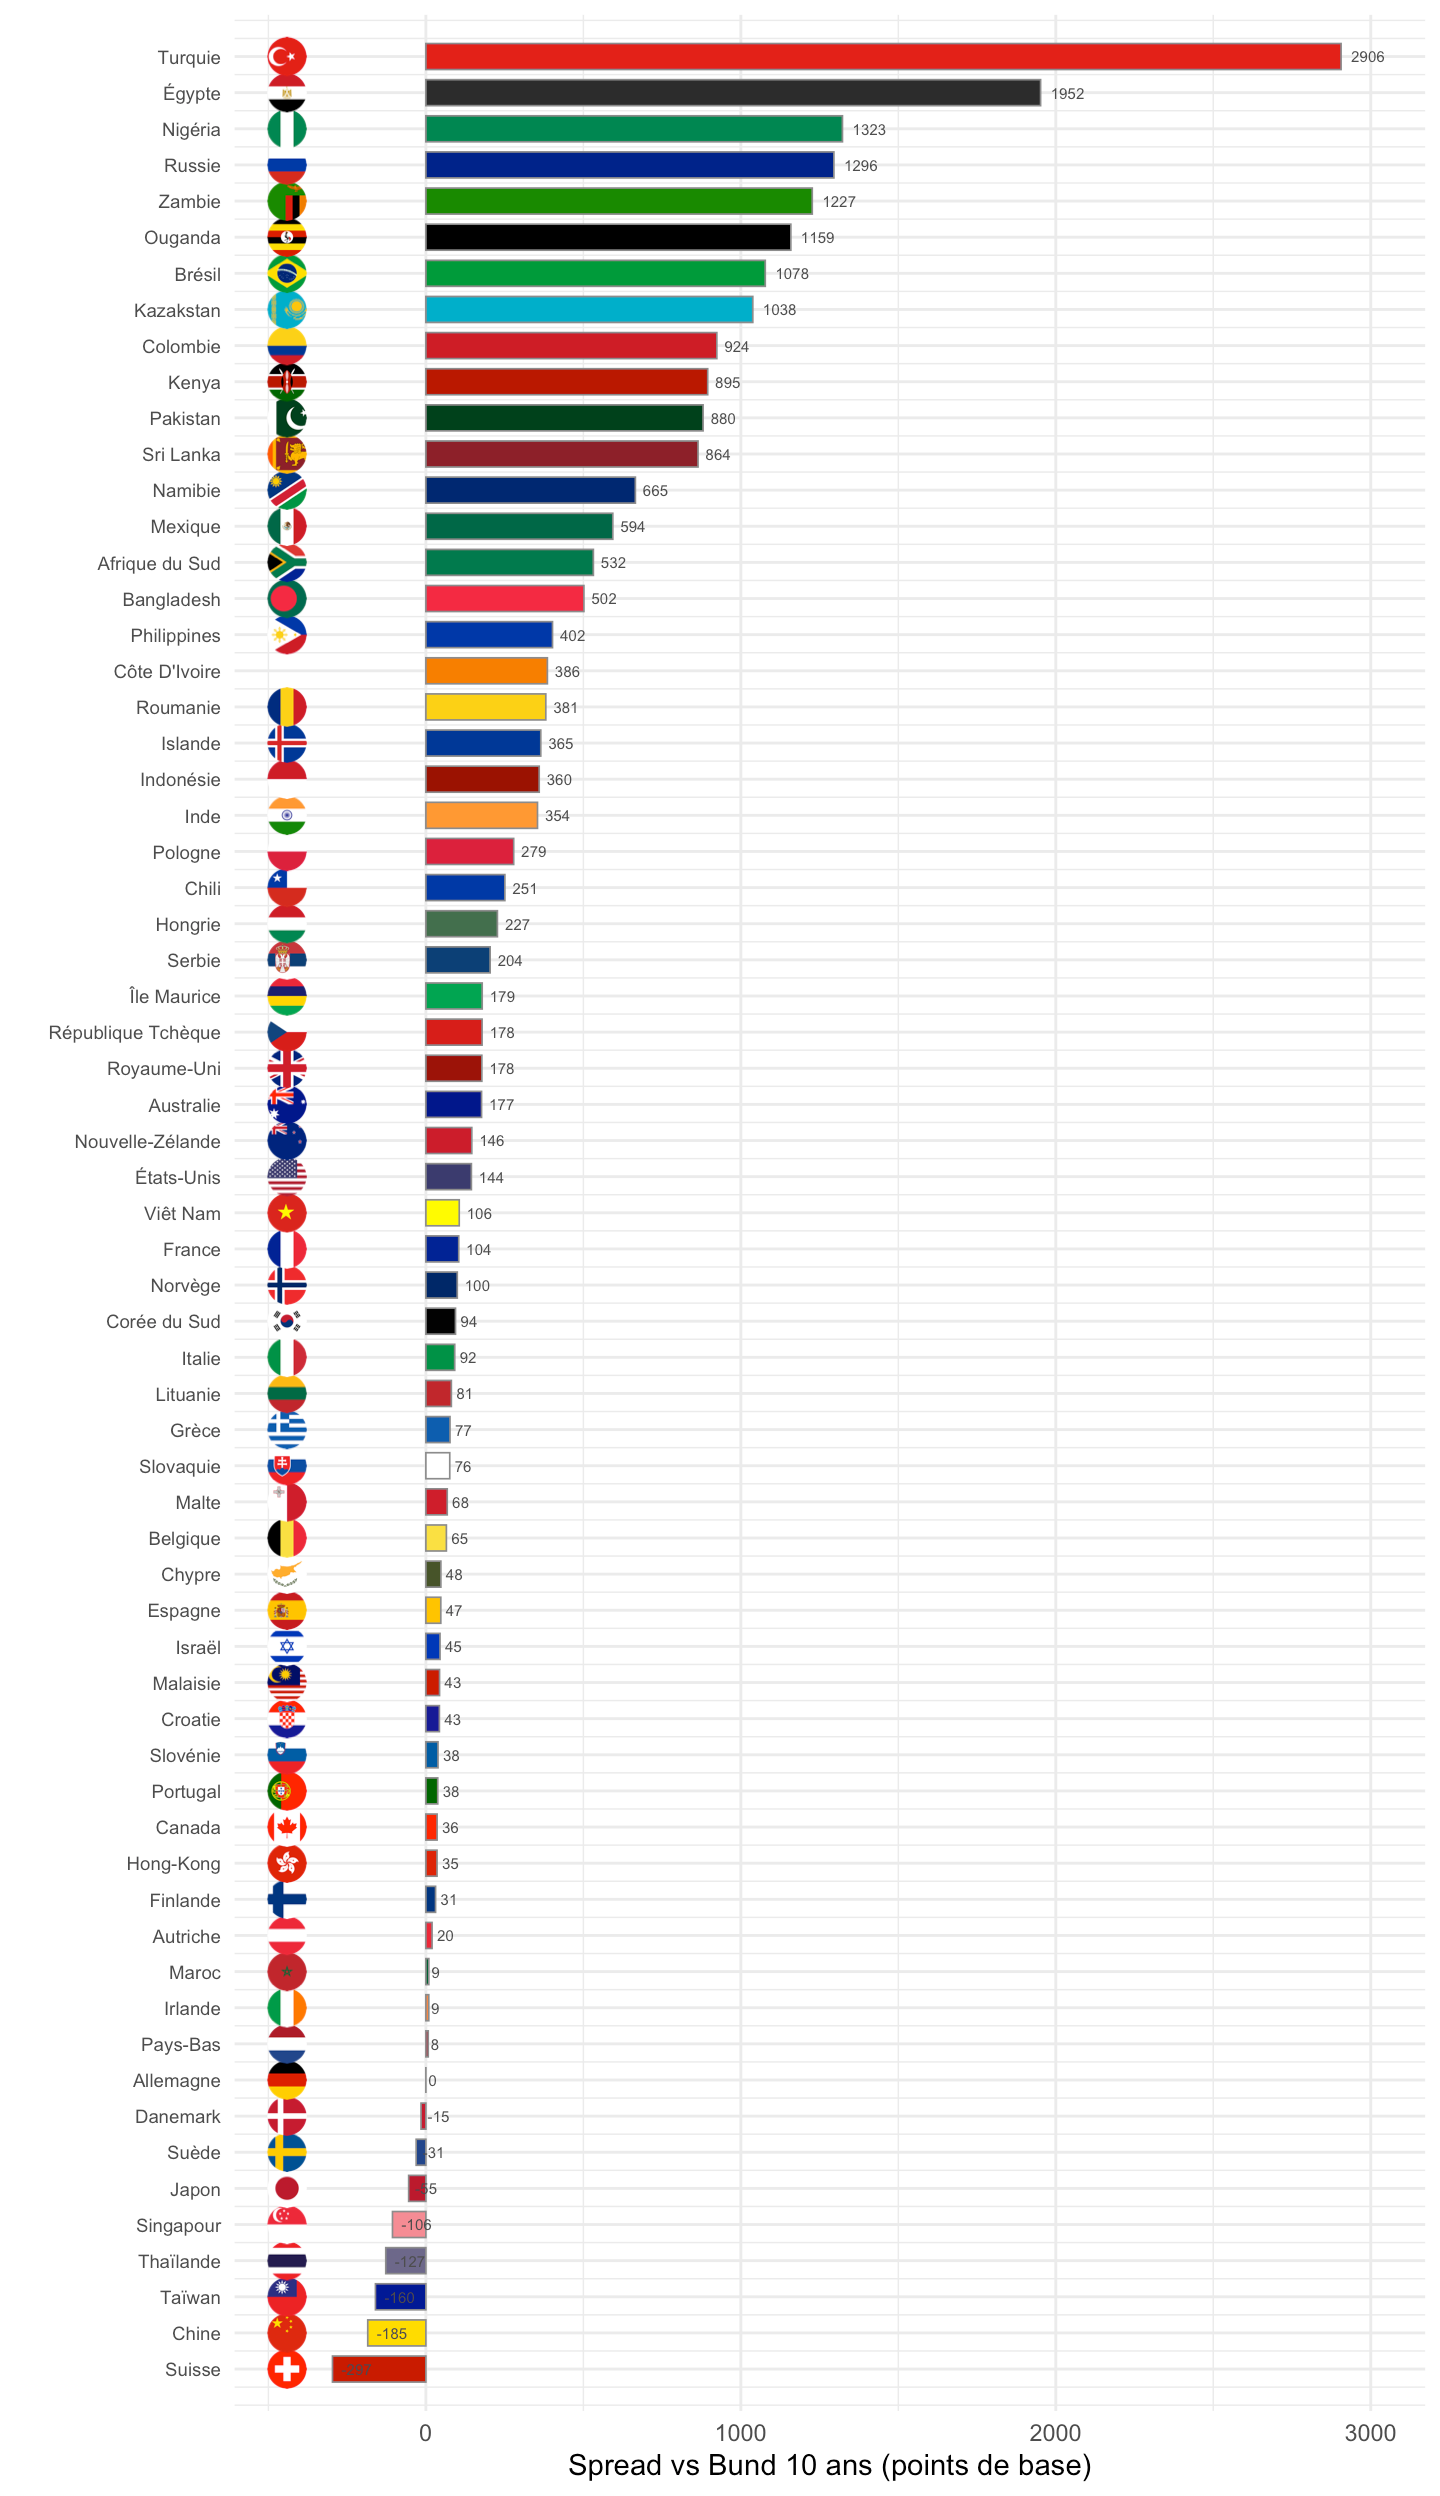
tbl <- spreads |>
  filter(scraped_date == last_day) |>
  mutate(Pays = ifelse(
    is.na(slug), country,
    sprintf('<span style="white-space:nowrap"><img src="../../icon/flag/round/%s.png" width="17" style="vertical-align:-3px;margin-right:6px">%s</span>',
            slug, country))) |>
  transmute(Pays,
            `Taux 10 ans` = yield,
            `Var.` = chg,
            `Vs. Bund` = spread_bund,
            `Vs. T-Note` = spread_tnote,
            Heure = quote_time) |>
  arrange(`Vs. Bund`)

if (knitr::is_html_output()) {
  DT::datatable(tbl, filter = "top", rownames = FALSE, escape = FALSE,
                options = list(columnDefs = list(list(width = "150px", targets = 0))))
} else {
  tbl |> mutate(Pays = gsub("<[^>]*>", "", Pays))
}
Source : investing.com, instantané du 14 octobre 2026.
| source | dataset | Title | Updated |
|---|---|---|---|
| source | dataset | Title | Updated |
|---|---|---|---|





