
Last observation: 2031 (N = 184)
First observation: 1980 (N = 11)
Last data update: 09 oct. 2026, 22:15
Last compile: 09 oct. 2026, 22:44
G_XWDG_G01_GDP_PT |>
  left_join(FREQ, by =  "FREQ") |>
  group_by(FREQ, Freq) |>
  summarise(Nobs = n()) |>
  arrange(-Nobs) |>
print_table_conditional()| FREQ | Freq | Nobs |
|---|---|---|
| A | Annual | 6992 |
G_XWDG_G01_GDP_PT |>
  left_join(REF_AREA, by = "REF_AREA") |>
  group_by(REF_AREA, Ref_area) |>
  summarise(Nobs = n()) |>
  arrange(-Nobs) |>
  mutate(Flag = gsub(" ", "-", str_to_lower(gsub(" ", "-", Ref_area))),
         Flag = paste0('<img src="../../icon/flag/vsmall/', Flag, '.png" alt="Flag">')) |>
  select(Flag, everything()) %>%
{if (is_html_output()) datatable(., filter = 'top', rownames = F, escape = F) else .}G_XWDG_G01_GDP_PT |>
group_by(TIME_PERIOD) |>
summarise(Nobs = n()) |>
arrange(desc(TIME_PERIOD)) |>
print_table_conditional()G_XWDG_G01_GDP_PT |>
filter(TIME_PERIOD == "2018") |>
left_join(REF_AREA, by = "REF_AREA") |>
select(REF_AREA, Ref_area, OBS_VALUE) |>
arrange(-OBS_VALUE) |>
na.omit() %>%
mutate_at(vars(3), funs(paste0(round(as.numeric(.), 1), " %"))) |>
mutate(Flag = gsub(" ", "-", str_to_lower(gsub(" ", "-", Ref_area))),
Flag = paste0('<img src="../../icon/flag/vsmall/', Flag, '.png" alt="Flag">')) |>
select(Flag, everything()) %>%
{if (is_html_output()) datatable(., filter = 'top', rownames = F, escape = F) else .}plot <- G_XWDG_G01_GDP_PT |>
filter(REF_AREA %in% c("US", "U2")) |>
year_to_date2() |>
filter(date >= as.Date("1999-01-01")) |>
left_join(REF_AREA, by = "REF_AREA") |>
mutate(Ref_area = ifelse(REF_AREA == "U2", "Europe", "United States")) |>
add_flag_color("Ref_area") |>
mutate(OBS_VALUE = OBS_VALUE/100) |>
rename(Counterpart_area = Ref_area) |>
#filter(date <= as.Date("2021-01-01")) %>%
ggplot() + geom_line(aes(x = date, y = OBS_VALUE, color = color)) +
theme_minimal() + xlab("") + ylab("Dette publique brute, % du PIB") +
scale_color_identity() + add_flags +
scale_x_date(breaks = c(seq(1999, 2100, 5), seq(1997, 2100, 5)) |> paste0("-01-01") |> as.Date(),
labels = date_format("%Y")) +
scale_y_continuous(breaks = 0.01*seq(-10, 400, 10),
labels = percent_format(accuracy = 1))
save(plot, file = "G_XWDG_G01_GDP_PT_files/figure-html/US-U2-1.RData")
plot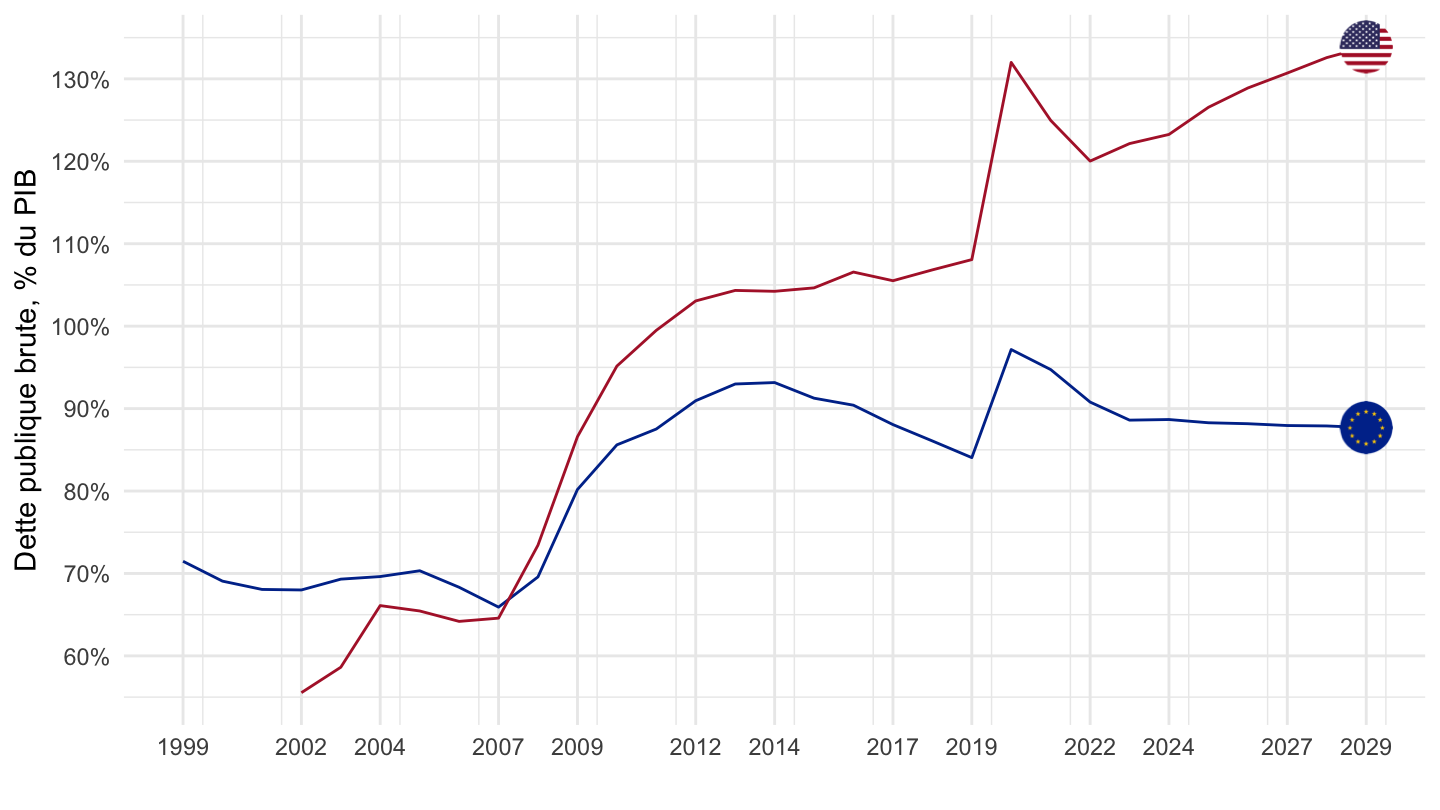
plot <- G_XWDG_G01_GDP_PT |>
  filter(REF_AREA %in% c("US", "U2")) |>
  year_to_date2() |>
  filter(date >= as.Date("1999-01-01"),
         date <= as.Date("2023-01-01")) |>
  mutate(Ref_area = ifelse(REF_AREA == "U2", "Zone euro", "États-Unis")) |>
  #filter(date <= as.Date("2021-01-01")) %>%
    mutate(OBS_VALUE = OBS_VALUE/100) |>
  add_flag_color("Ref_area") |>
ggplot() + scale_color_identity() + add_flags + geom_line(aes(x = date, y = OBS_VALUE, color = color)) +
  theme_minimal() + xlab("") + ylab("") +
  scale_x_date(breaks = c(seq(1999, 2100, 5), seq(1997, 2100, 5)) |> paste0("-01-01") |> as.Date(),
               labels = date_format("%Y")) +
  scale_y_continuous(breaks = 0.01*seq(-10, 400, 10),
                     labels = percent_format(accuracy = 1)) +
  geom_rect(data = nber_recessions |>
              filter(Peak > as.Date("1999-01-01")),
            aes(xmin = Peak, xmax = Trough, ymin = -Inf, ymax = +Inf),
            fill = '#B22234', alpha = 0.1)  +
  geom_rect(data = cepr_recessions |>
              filter(Peak > as.Date("1999-01-01")),
            aes(xmin = Peak, xmax = Trough, ymin = -Inf, ymax = +Inf),
            fill = '#003399', alpha = 0.1) +
  theme(legend.position = c(0.26, 0.8),
        legend.title = element_blank()) +
  labs(caption = "Source: Fonds Monétaire International, Fiscal Monitor, NBER, CEPR")


save(plot, file = "G_XWDG_G01_GDP_PT_files/figure-html/US-U2-1999-2023-1.RData")

plot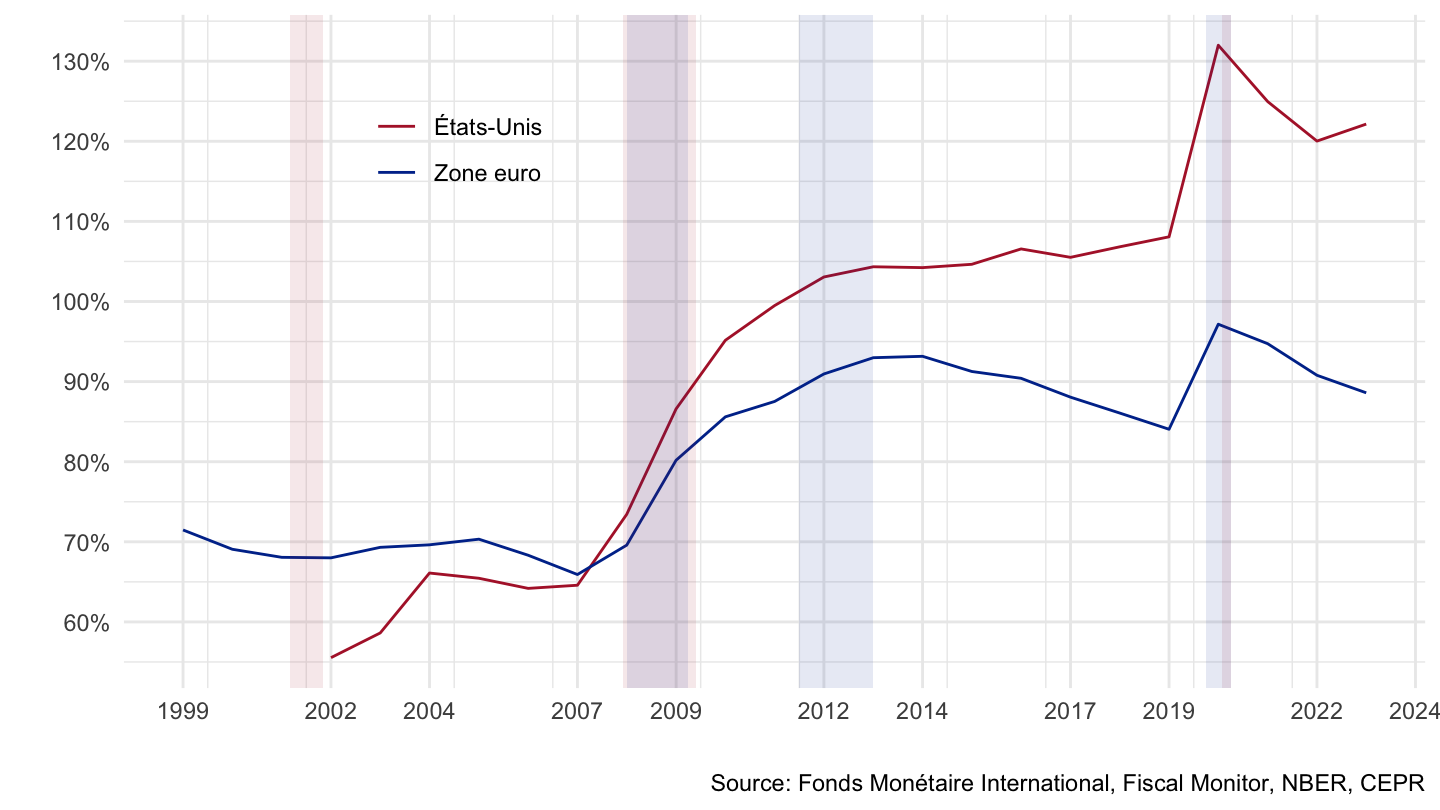
plot <- G_XWDG_G01_GDP_PT |>
  filter(REF_AREA %in% c("US", "U2")) |>
  year_to_date2() |>
  filter(date >= as.Date("1999-01-01")) |>
  mutate(Ref_area = ifelse(REF_AREA == "U2", "Europe", "United States")) |>
  #filter(date <= as.Date("2021-01-01")) %>%
    mutate(OBS_VALUE = OBS_VALUE/100) |>
  add_flag_color("Ref_area") |>
ggplot() + scale_color_identity() + add_flags + geom_line(aes(x = date, y = OBS_VALUE, color = color)) +
  theme_minimal() + xlab("") + ylab("Debt / GDP Ratio") +
  scale_x_date(breaks = c(seq(1999, 2100, 5), seq(1997, 2100, 5)) |> paste0("-01-01") |> as.Date(),
               labels = date_format("%Y")) +
  scale_y_continuous(breaks = 0.01*seq(-10, 400, 10),
                     labels = percent_format(accuracy = 1)) +
  geom_rect(data = nber_recessions |>
              filter(Peak > as.Date("1999-01-01")),
            aes(xmin = Peak, xmax = Trough, ymin = -Inf, ymax = +Inf),
            fill = '#B22234', alpha = 0.1)  +
  geom_rect(data = cepr_recessions |>
              filter(Peak > as.Date("1999-01-01")),
            aes(xmin = Peak, xmax = Trough, ymin = -Inf, ymax = +Inf),
            fill = '#003399', alpha = 0.1) +
  theme(legend.position = c(0.26, 0.8),
        legend.title = element_blank()) +
  labs(caption = "Source: IMF, Fiscal Monitor, NBER, CEPR")


save(plot, file = "G_XWDG_G01_GDP_PT_files/figure-html/US-U2-1999-2023-english-1.RData")

plot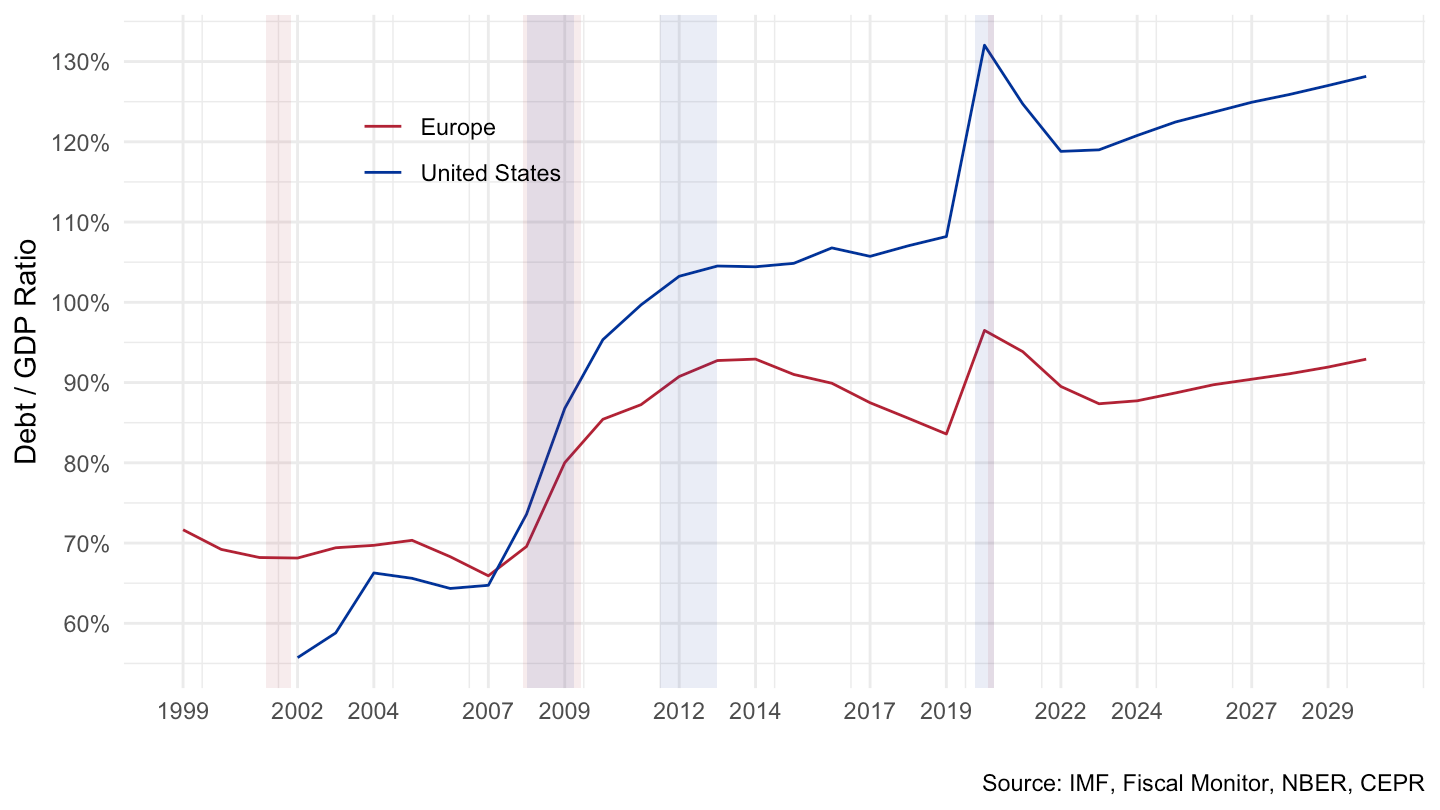
G_XWDG_G01_GDP_PT |>
  filter(REF_AREA %in% c("FR", "IT", "US", "DE", "ES")) |>
  year_to_date2() |>
  left_join(REF_AREA,  by = "REF_AREA") |>
  add_flag_color("Ref_area") |>
  mutate(OBS_VALUE = OBS_VALUE/100) |>
  rename(Counterpart_area = Ref_area) |>
  #filter(date <= as.Date("2021-01-01")) %>%
  ggplot() + geom_line(aes(x = date, y = OBS_VALUE, color = color)) +
  theme_minimal() + xlab("") + ylab("Dette publique brute, % du PIB") +
  scale_color_identity() + add_flags +
  scale_x_date(breaks = seq(1990, 2100, 5) |> paste0("-01-01") |> as.Date(),
               labels = date_format("%Y")) +
  scale_y_continuous(breaks = 0.01*seq(-10, 400, 10),
                     labels = percent_format(accuracy = 1))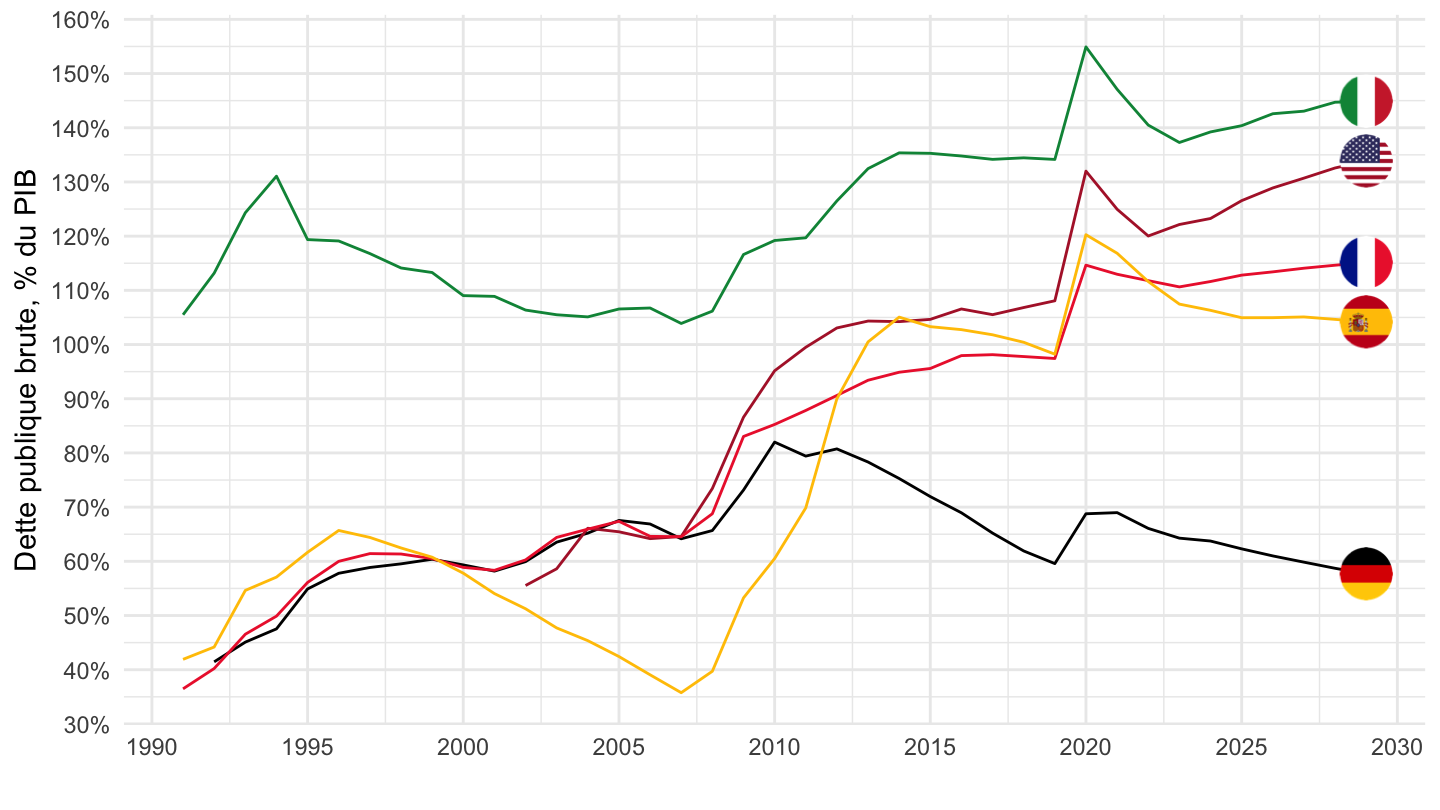
G_XWDG_G01_GDP_PT |>
  filter(REF_AREA %in% c("FR", "IT", "US", "DE", "ES")) |>
  year_to_date2() |>
  filter(date >= as.Date("1995-01-01")) |>
  left_join(REF_AREA,  by = "REF_AREA") |>
  add_flag_color("Ref_area") |>
  mutate(OBS_VALUE = OBS_VALUE/100) |>
  rename(Counterpart_area = Ref_area) |>
  #filter(date <= as.Date("2021-01-01")) %>%
  ggplot() + geom_line(aes(x = date, y = OBS_VALUE, color = color)) +
  theme_minimal() + xlab("") + ylab("Dette publique brute, % du PIB") +
  scale_color_identity() + add_flags +
  scale_x_date(breaks = seq(1995, 2100, 5) |> paste0("-01-01") |> as.Date(),
               labels = date_format("%Y")) +
  scale_y_continuous(breaks = 0.01*seq(-10, 400, 10),
                     labels = percent_format(accuracy = 1))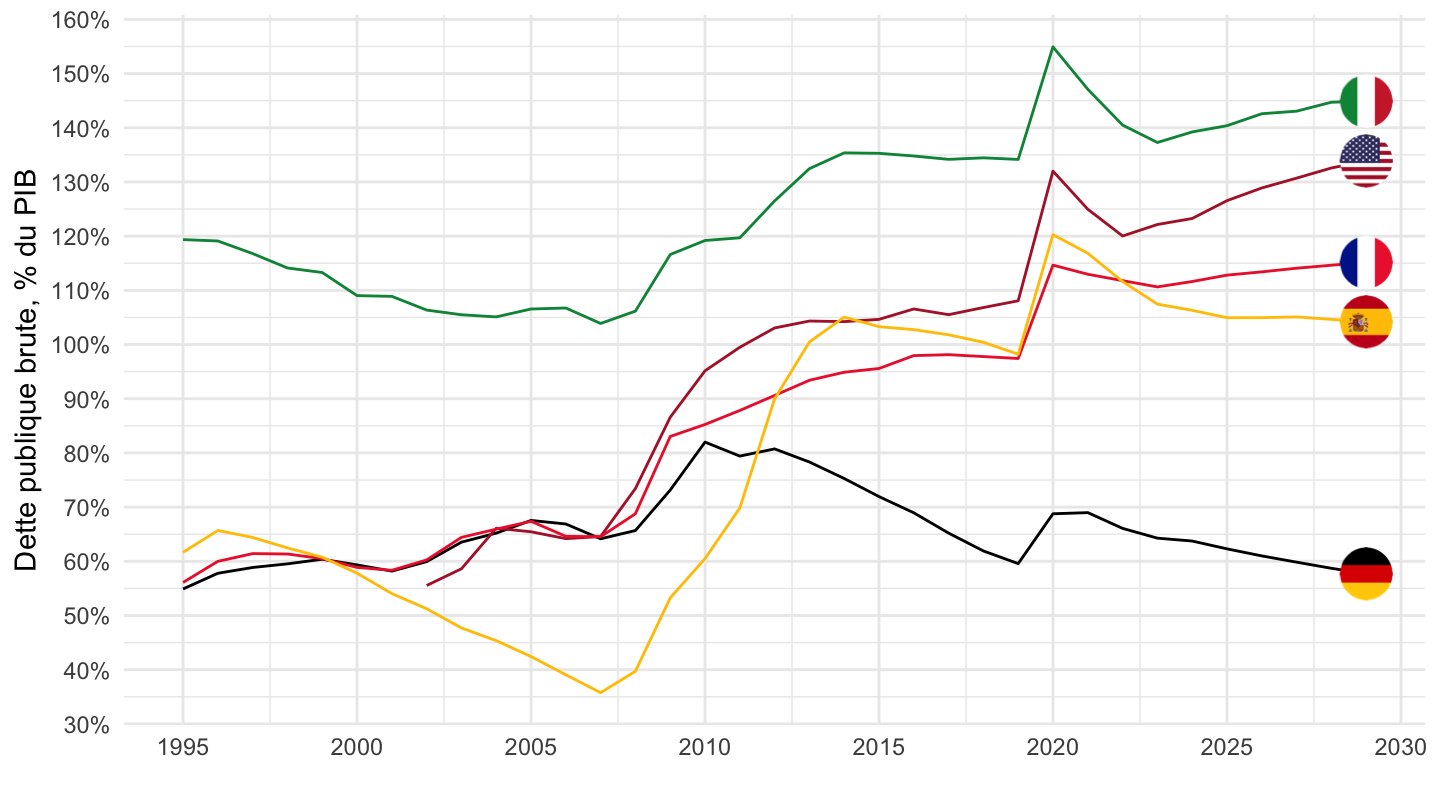
G_XWDG_G01_GDP_PT |>
  filter(REF_AREA %in% c("FR", "IT", "US", "DE", "ES")) |>
  year_to_date2() |>
  filter(date >= as.Date("1995-01-01")) |>
  left_join(REF_AREA,  by = "REF_AREA") |>
  add_flag_color("Ref_area") |>
  mutate(OBS_VALUE = OBS_VALUE/100) |>
  rename(Counterpart_area = Ref_area) |>
  #filter(date <= as.Date("2021-01-01")) %>%
  ggplot() + geom_line(aes(x = date, y = OBS_VALUE, color = color)) +
  theme_minimal() + xlab("") + ylab("Dette publique brute, années de PIB") +
  scale_color_identity() + add_flags +
  scale_x_date(breaks = seq(1995, 2100, 5) |> paste0("-01-01") |> as.Date(),
               labels = date_format("%Y")) +
  scale_y_continuous(breaks = seq(0, 400, 0.2),
                     labels = dollar_format(accuracy = .1, prefix = "", suffix = " années"))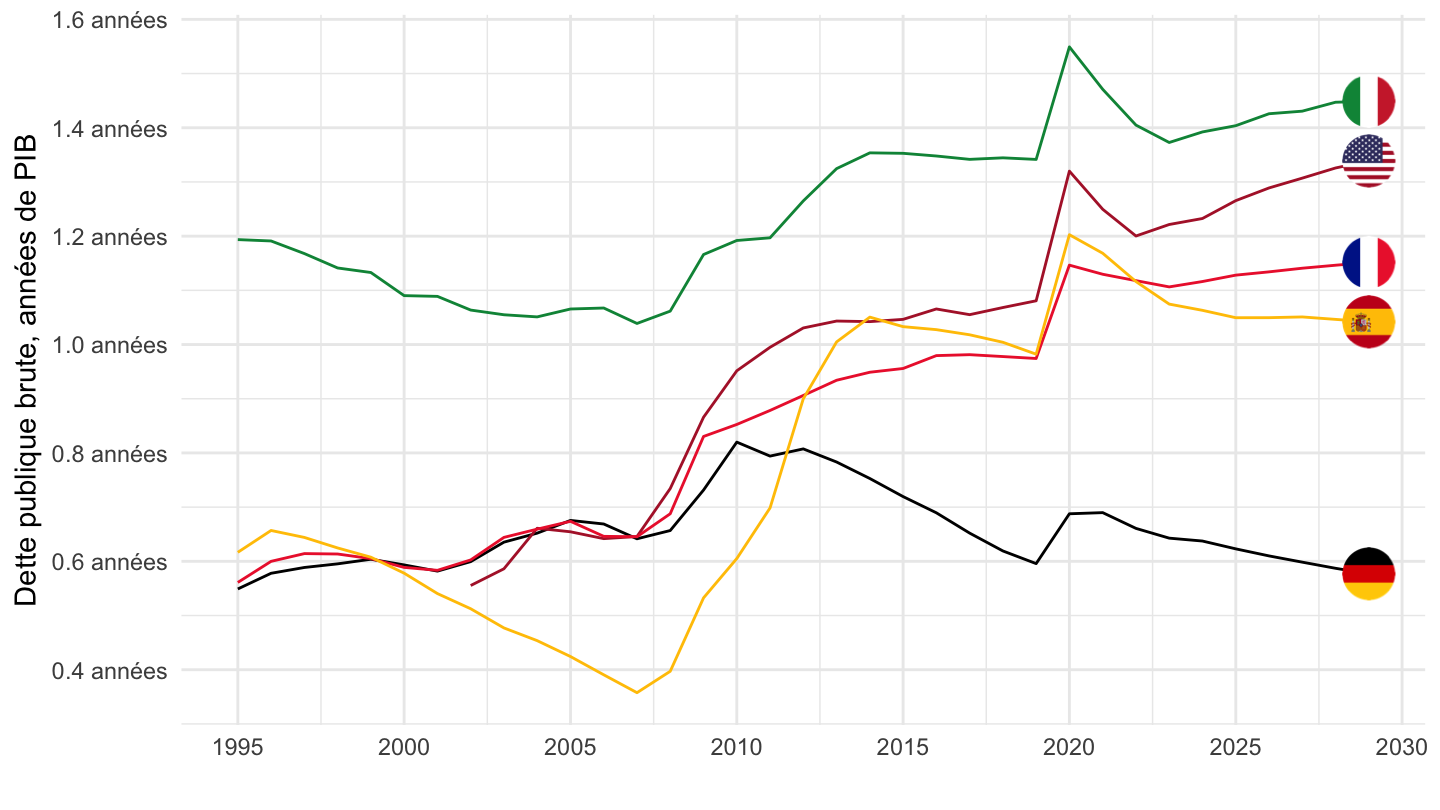
G_XWDG_G01_GDP_PT |>
  filter(REF_AREA %in% c("FR", "IT", "US", "DE", "ES")) |>
  year_to_date2() |>
  filter(date >= as.Date("1999-01-01")) |>
  left_join(REF_AREA,  by = "REF_AREA") |>
  add_flag_color("Ref_area") |>
  mutate(OBS_VALUE = OBS_VALUE/100) |>
  rename(Counterpart_area = Ref_area) |>
  #filter(date <= as.Date("2021-01-01")) %>%
  ggplot() + geom_line(aes(x = date, y = OBS_VALUE, color = color)) +
  theme_minimal() + xlab("") + ylab("Dette publique brute, % du PIB") +
  scale_color_identity() + add_flags +
  scale_x_date(breaks = seq(1995, 2100, 5) |> paste0("-01-01") |> as.Date(),
               labels = date_format("%Y")) +
  scale_y_continuous(breaks = 0.01*seq(-10, 400, 10),
                     labels = percent_format(accuracy = 1))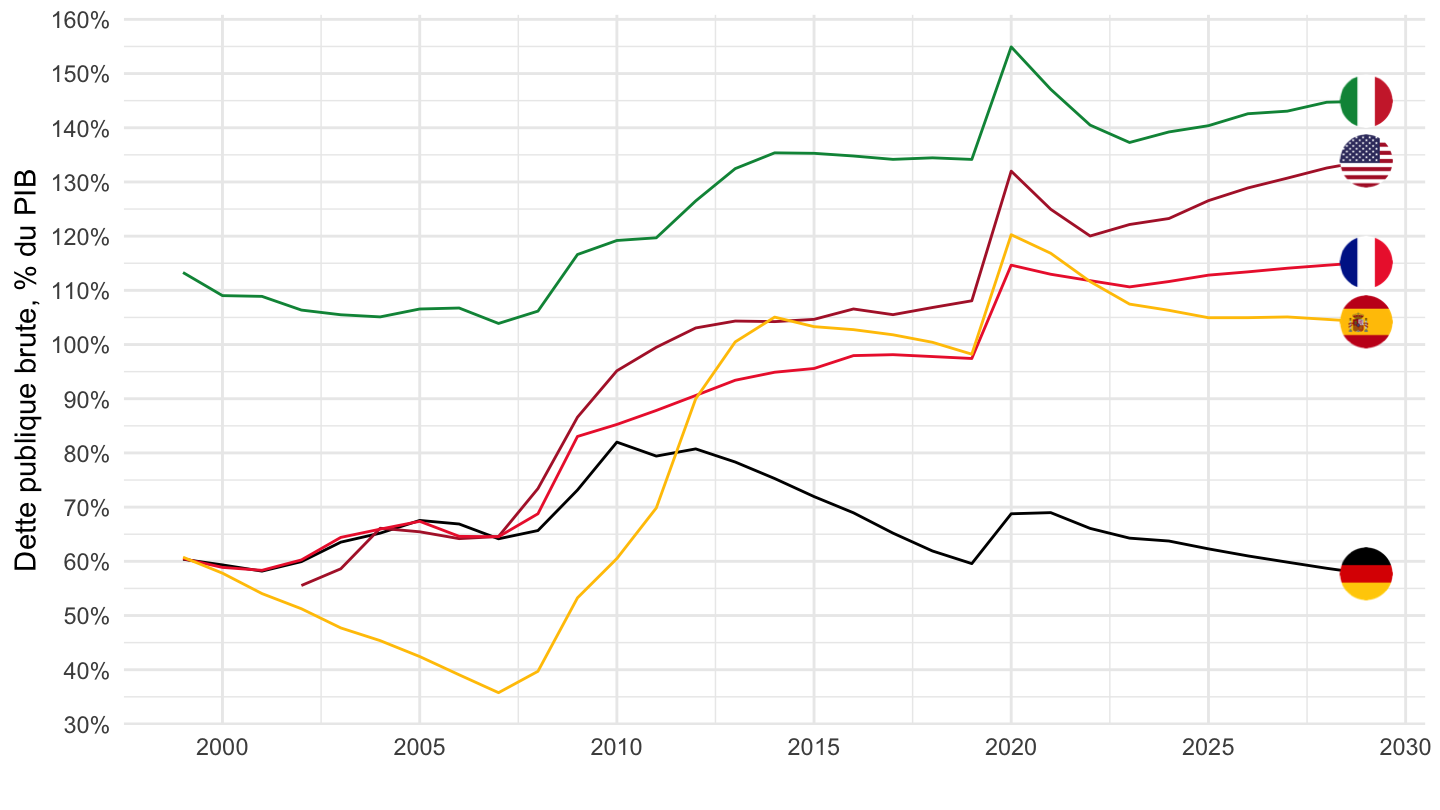
G_XWDG_G01_GDP_PT |>
  filter(REF_AREA %in% c("FR", "IT", "US", "DE", "ES")) |>
  year_to_date2() |>
  filter(date >= as.Date("2005-01-01")) |>
  left_join(REF_AREA,  by = "REF_AREA") |>
  add_flag_color("Ref_area") |>
  mutate(OBS_VALUE = OBS_VALUE/100) |>
  rename(Counterpart_area = Ref_area) |>
  #filter(date <= as.Date("2021-01-01")) %>%
  ggplot() + geom_line(aes(x = date, y = OBS_VALUE, color = color)) +
  theme_minimal() + xlab("") + ylab("Dette publique brute, % du PIB") +
  scale_color_identity() + add_flags +
  scale_x_date(breaks = seq(1990, 2100, 2) |> paste0("-01-01") |> as.Date(),
               labels = date_format("%Y")) +
  scale_y_continuous(breaks = 0.01*seq(-10, 400, 10),
                     labels = percent_format(accuracy = 1))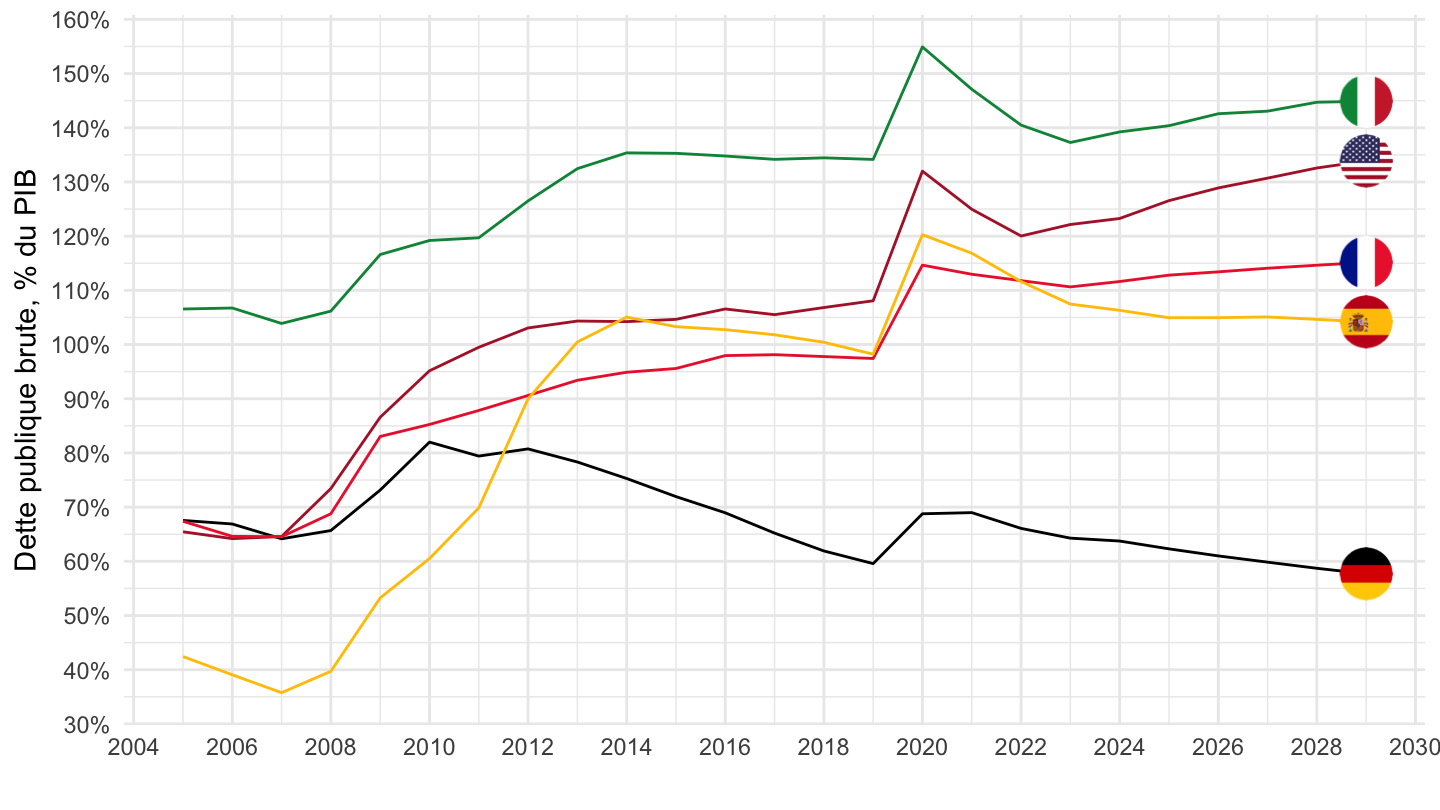
G_XWDG_G01_GDP_PT |>
  filter(REF_AREA %in% c("FR", "IT", "US", "DE", "JP")) |>
  year_to_date2() |>
  left_join(REF_AREA,  by = "REF_AREA") |>
  add_flag_color("Ref_area") |>
  mutate(OBS_VALUE = OBS_VALUE/100) |>
  rename(Counterpart_area = Ref_area) |>
  ggplot() + geom_line(aes(x = date, y = OBS_VALUE, color = color)) +
  theme_minimal() + xlab("") + ylab("Dette publique brute, % du PIB") +
  scale_color_identity() + add_flags +
  scale_x_date(breaks = seq(1990, 2100, 5) |> paste0("-01-01") |> as.Date(),
               labels = date_format("%Y")) +
  scale_y_continuous(breaks = 0.01*seq(-10, 400, 10),
                     labels = percent_format(accuracy = 1))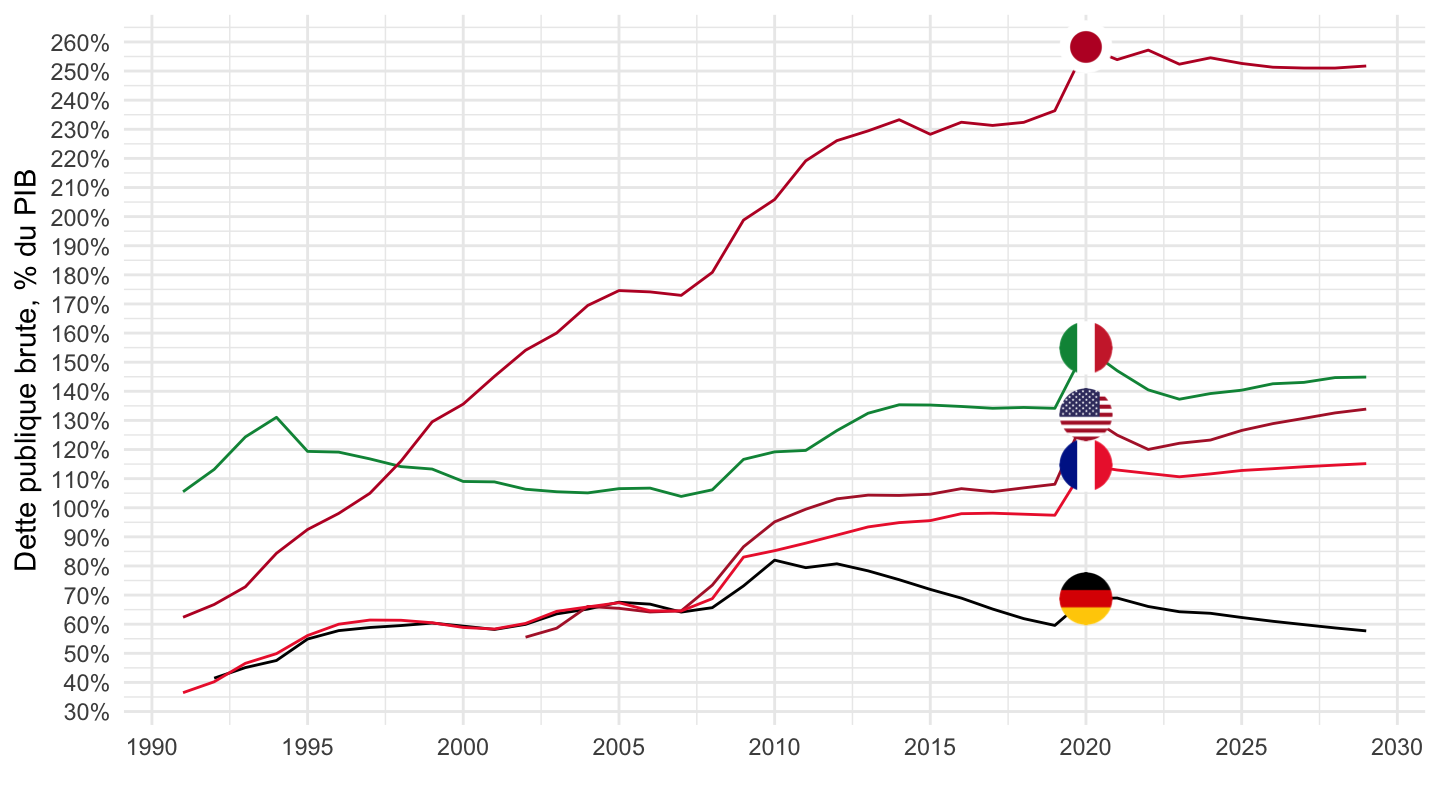
| source | dataset | Title | Updated |
|---|---|---|---|
| source | dataset | Title | Updated |
|---|---|---|---|





