
Last data update: 16 oct. 2026, 06:34
Last compile: 16 oct. 2026, 06:46
Instantané quotidien de https://www.investing.com/rates-bonds/world-government-bonds : taux souverain « live » par pays et par maturité. symbol (ex. France 10Y) correspond au symbol de bonds.parquet (historique).
maturity_years <- function(m) {
  n <- readr::parse_number(m)
  dplyr::case_when(m == "Overnight" ~ 1 / 365,
                   grepl("W$", m)   ~ n / 52,
                   grepl("M$", m)   ~ n / 12,
                   grepl("Y$", m)   ~ n,
                   TRUE ~ NA_real_)
}
last_day <- max(sovereign_yields$scraped_date)sovereign_yields |>
filter(scraped_date == last_day) |>
transmute(Pays = country, Maturité = maturity, `Taux` = yield,
`Var.` = chg, `Var. %` = chg_pct, Heure = quote_time) |>
arrange(Pays, maturity_years(Maturité)) |>
print_table_conditional()Source : investing.com, instantané du 16 octobre 2026.
sy <- read_parquet("sovereign_yields.parquet")
maturity_years <- function(m) {
  n <- readr::parse_number(m)
  dplyr::case_when(m == "Overnight" ~ 1 / 365, grepl("W$", m) ~ n / 52,
                   grepl("M$", m) ~ n / 12, grepl("Y$", m) ~ n, TRUE ~ NA_real_)
}
pays <- c("France", "Germany", "Italy", "Spain", "U.S.", "U.K.")
sy |>
  filter(scraped_date == max(scraped_date), country %in% pays) |>
  mutate(t = maturity_years(maturity)) |>
  filter(!is.na(t), t <= 30) |>
  ggplot(aes(x = t, y = yield, color = country)) +
  geom_line() + geom_point(size = 1) +
  theme_minimal() + xlab("Maturité (années)") + ylab("Taux (%)") +
  scale_x_log10(breaks = c(0.08, 0.25, 0.5, 1, 2, 5, 10, 20, 30)) +
  scale_color_flag(pays) +
  theme(legend.position =c(0.3, 0.9),
        legend.title = element_blank(),
        legend.direction = "horizontal")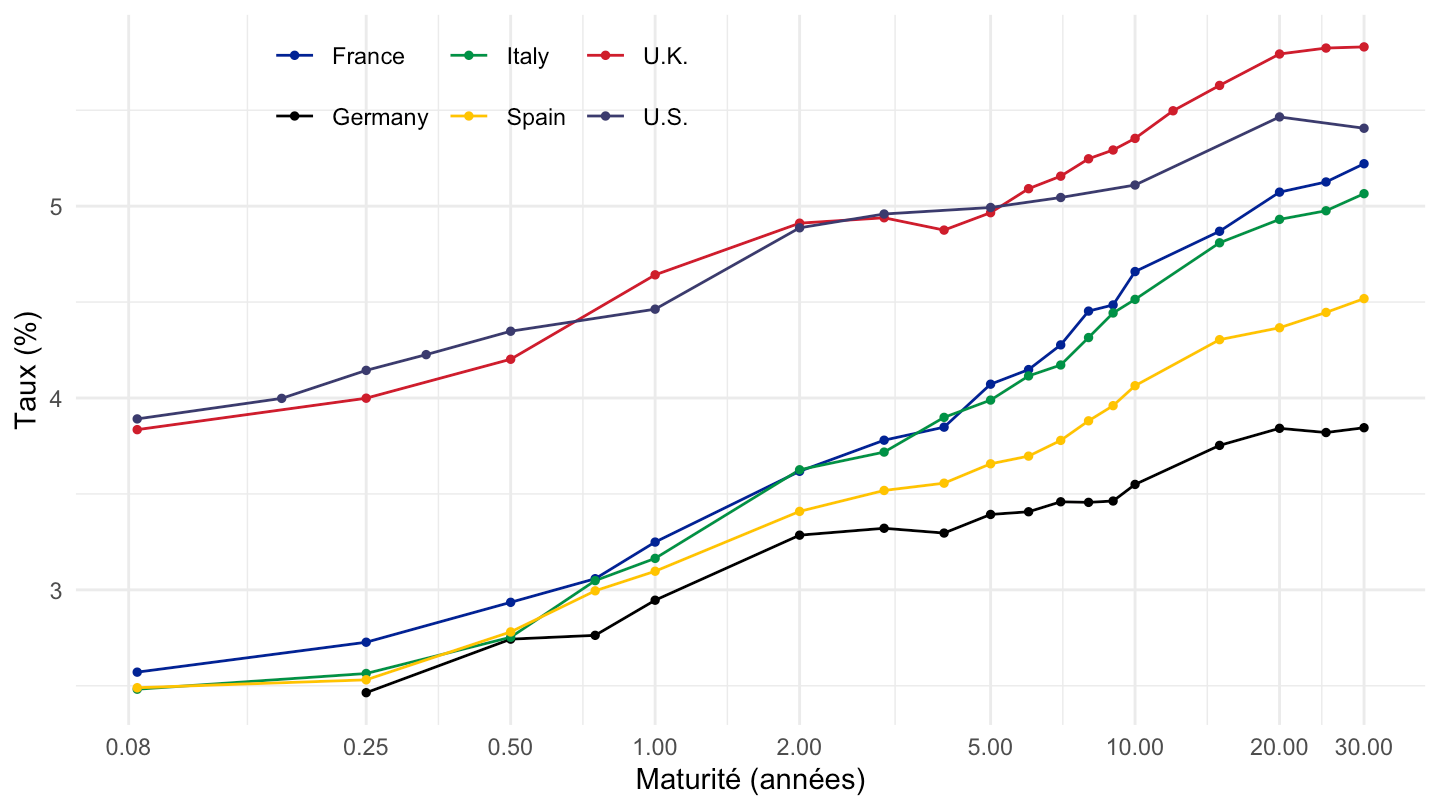
maturity_years <- function(m) {
  n <- readr::parse_number(m)
  dplyr::case_when(m == "Overnight" ~ 1 / 365, grepl("W$", m) ~ n / 52,
                   grepl("M$", m) ~ n / 12, grepl("Y$", m) ~ n, TRUE ~ NA_real_)
}
pays <- c("France", "Portugal", "Italy", "Spain", "Greece")
sy |>
  filter(scraped_date == max(scraped_date), country %in% pays) |>
  mutate(t = maturity_years(maturity)) |>
  filter(!is.na(t), t <= 30) |>
  ggplot(aes(x = t, y = yield, color = country)) +
  geom_line() + geom_point(size = 1) +
  theme_minimal() + xlab("Maturité (années)") + ylab("Taux (%)") +
  scale_x_log10(breaks = c(0.08, 0.25, 0.5, 1, 2, 5, 10, 20, 30)) +
  scale_color_flag(pays) +
  theme(legend.position =c(0.35, 0.9),
        legend.title = element_blank(),
        legend.direction = "horizontal")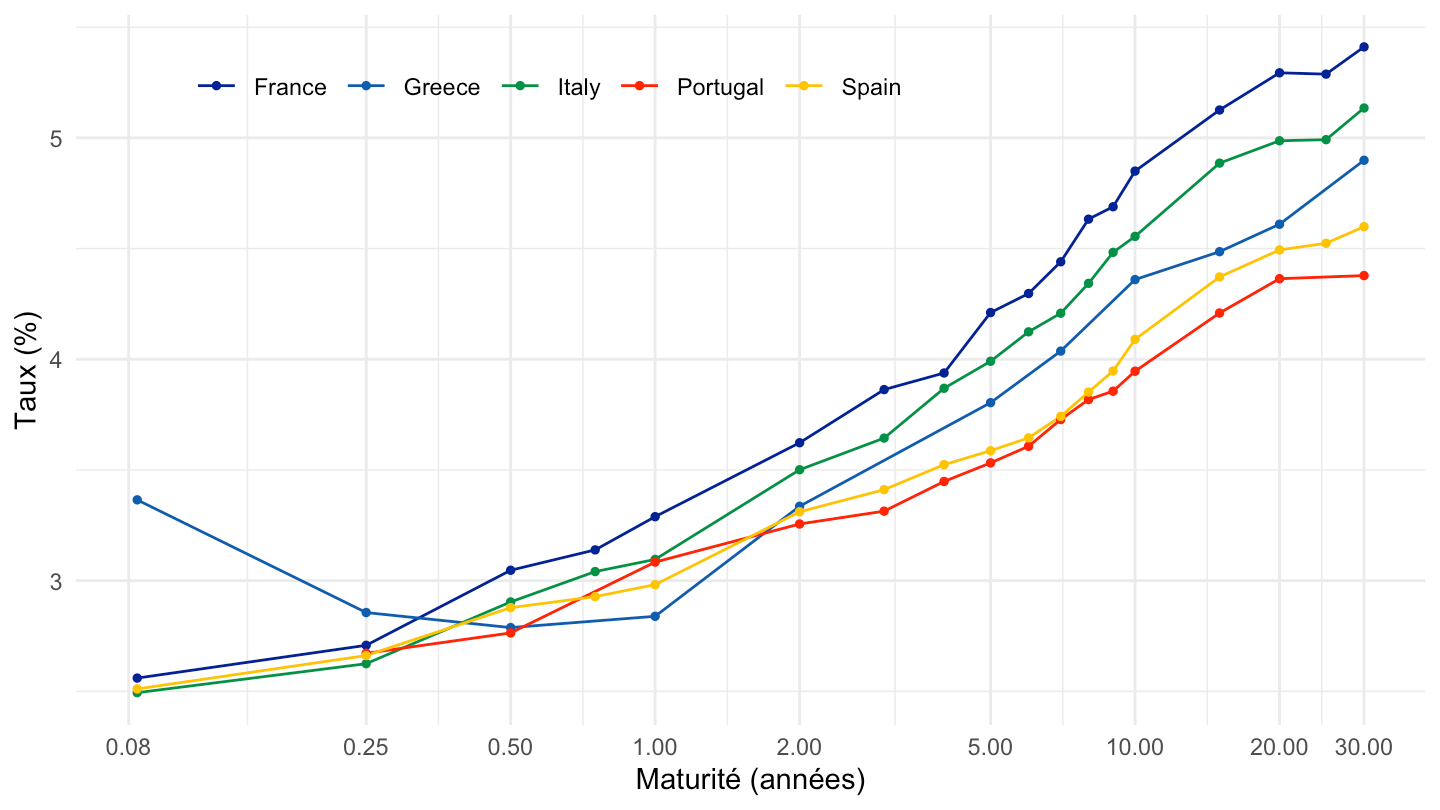
sel <- c("France", "Germany", "Italy", "Spain", "U.S.", "U.K.")

sovereign_yields |>
  filter(scraped_date == last_day, country %in% sel) |>
  mutate(t = maturity_years(maturity)) |>
  filter(!is.na(t), t <= 30) |>
  ggplot(aes(x = t, y = yield, color = country)) +
  geom_line() + geom_point(size = 1) +
  theme_minimal() + xlab("Maturité (années)") + ylab("Taux (%)") +
  scale_x_log10(breaks = c(0.25, 0.5, 1, 2, 5, 10, 20, 30)) +
  scale_color_viridis_d() +
  theme(legend.position = "bottom", legend.title = element_blank())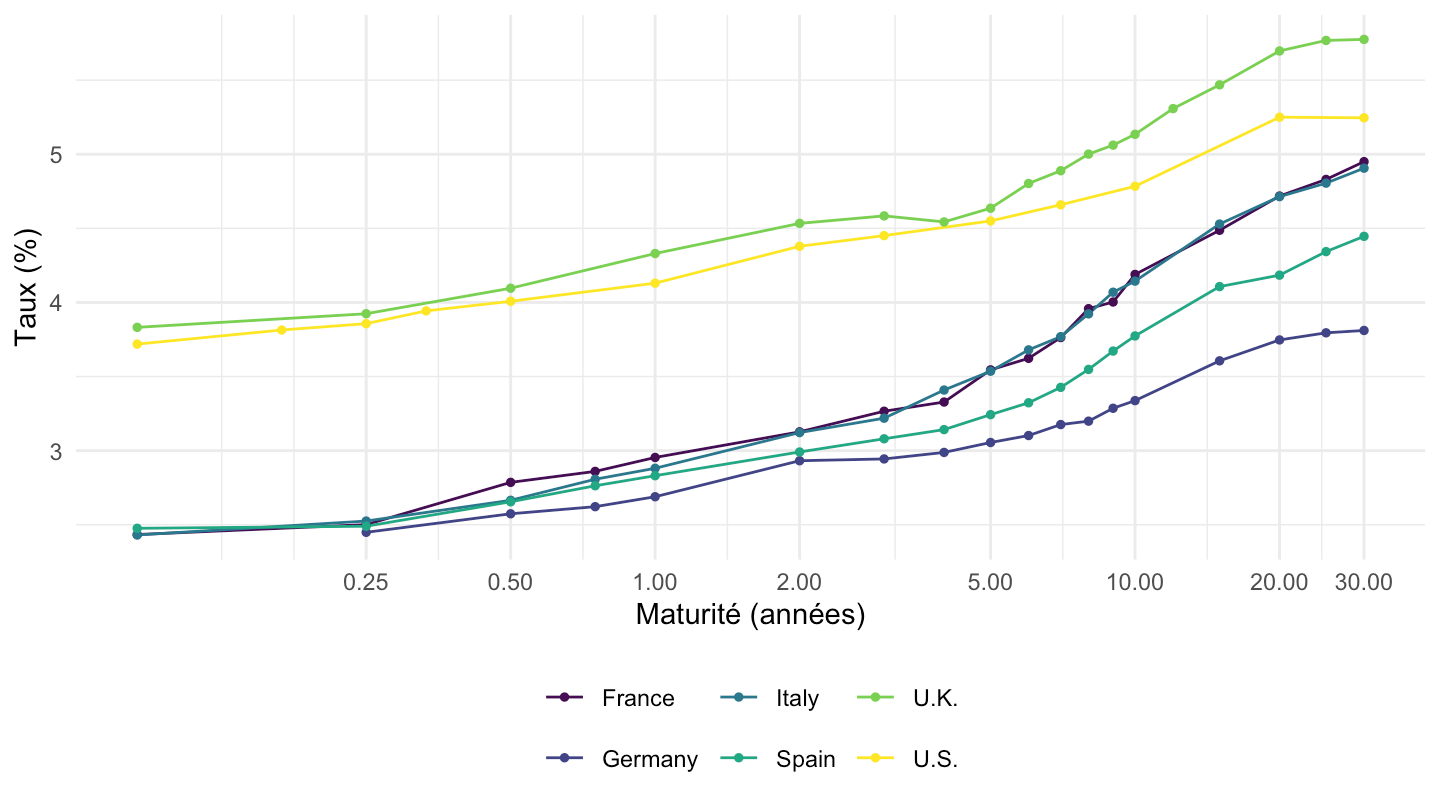
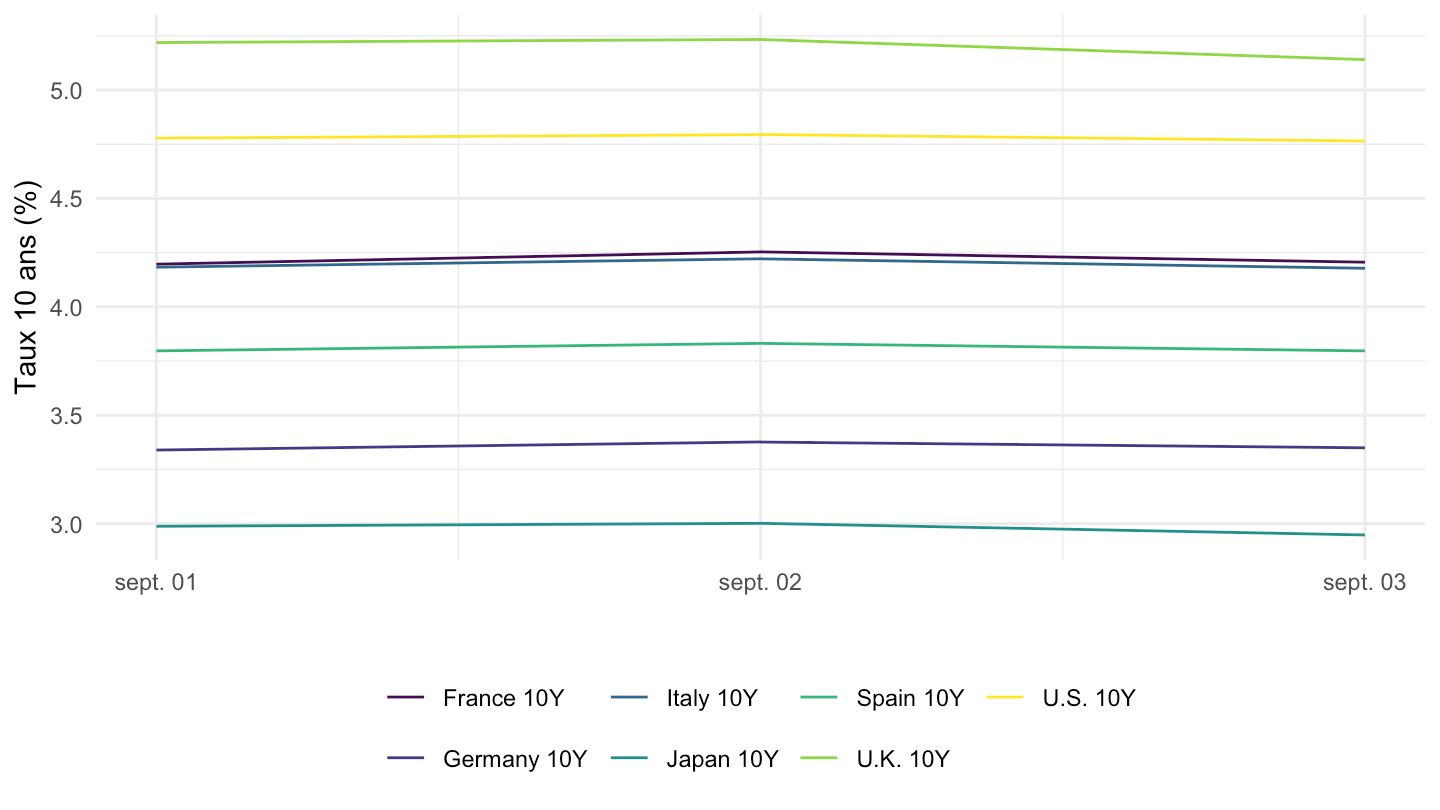
sel <- c("France 10Y", "Germany 10Y", "Italy 10Y", "Spain 10Y",
         "U.S. 10Y", "U.K. 10Y", "Japan 10Y")
d <- sovereign_yields |> filter(symbol %in% sel)

if (n_distinct(d$scraped_date) < 2) {
  knitr::asis_output(paste0(
    "_Série trop courte (", n_distinct(d$scraped_date),
    " relevé) — voir `bonds.parquet` pour l'historique complet._"))
} else {
  d |>
    ggplot() + geom_line(aes(x = scraped_date, y = yield, color = symbol)) +
    theme_minimal() + xlab("") + ylab("Taux 10 ans (%)") +
    scale_color_viridis_d() +
    theme(legend.position = "bottom", legend.title = element_blank())
}
| source | dataset | Title | Updated |
|---|---|---|---|



