| source | dataset | Title | .html | .rData |
|---|---|---|---|---|
| insee | COMPTES-ETAT | Budget de l’État | 2026-02-16 | 2026-02-15 |
Budget de l’État
Data - INSEE
Info
Publications
Code
tibble(date = "2023-07-31", key = "20942") %>%
  add_row(date = "2023-08-31", key = "21072") %>%
  add_row(date = "2023-06-30", key = "21005") %>%
  mutate(pdf = paste0('<a  target=_blank href=https://www.budget.gouv.fr/documentation/file-download/', key, ' > pdf </a>')) %>%
  select(-key) %>%
  arrange(desc(date)) %>%
{if (is_html_output()) datatable(., filter = 'top', rownames = F, escape = F) else .}- Situation mensuelle sur le budget de l’Etat. html /31 mai 2023 https://www.budget.gouv.fr/documentation/file-download/21005
https://www.budget.gouv.fr/documentation/file-download/21005
https://www.budget.gouv.fr/documentation/file-download/21072
Données sur la dette publique
| Title | source | dataset | .html | .RData |
|---|---|---|---|---|
| Debt | gfd | debt | 2021-08-22 | 2021-03-01 |
| Historical Public Debt Database | imf | HPDD | 2026-02-21 | NA |
| Dette et déficit des administrations publiques au sens de Maastricht | insee | CNA-2014-DETTE-APU | 2026-02-21 | 2026-02-21 |
| Budget de l’État | insee | COMPTES-ETAT | 2026-02-21 | 2026-02-21 |
| Dette des administrations publiques au sens de Maastricht | insee | DETTE-TRIM-APU-2020 | 2026-02-21 | 2026-02-21 |
| 3.217 – Principaux impôts par catégorie (En milliards d'euros) | insee | T_3217 | 2026-02-21 | 2025-09-29 |
| 7.301 – Compte des administrations publiques (S13) (En milliards d'euros) | insee | T_7301 | 2026-02-21 | 2025-10-24 |
| Dépenses, recettes et besoin de financement des administrations publiques - valeurs aux prix courants | insee | t_compteapu_val | 2026-02-21 | 2026-01-10 |
LAST_UPDATE
Code
`COMPTES-ETAT` %>%
  group_by(LAST_UPDATE) %>%
  summarise(Nobs = n()) %>%
  arrange(desc(LAST_UPDATE)) %>%
print_table_conditional()| LAST_UPDATE | Nobs |
|---|---|
| 2026-02-03 | 816 |
Last
Code
`COMPTES-ETAT` %>%
  filter(TIME_PERIOD == max(TIME_PERIOD)) %>%
  select(TIME_PERIOD, INDICATEUR, TITLE_FR, OBS_VALUE) %>%
print_table_conditional()| TIME_PERIOD | INDICATEUR | TITLE_FR | OBS_VALUE |
|---|---|---|---|
| 2025-12 | DEP | Situation mensuelle du budget de l'État - Dépenses - Cumul depuis le début de l'année | 510230 |
| 2025-12 | REC | Situation mensuelle du budget de l'État - Recettes - Cumul depuis le début de l'année | 387743 |
| 2025-12 | SCS | Situation mensuelle du budget de l'État - Solde des comptes spéciaux - Cumul depuis le début de l'année | -2255 |
| 2025-12 | SGE | Situation mensuelle du budget de l'État - Solde général d'exécution - Cumul depuis le début de l'année | -124742 |
INDICATEUR
Code
`COMPTES-ETAT` %>%
  left_join(INDICATEUR,  by = "INDICATEUR") %>%
  group_by(INDICATEUR, Indicateur) %>%
  summarise(Nobs = n()) %>%
  arrange(-Nobs) %>%
print_table_conditional()| INDICATEUR | Indicateur | Nobs |
|---|---|---|
| DEP | Dépenses | 204 |
| REC | Recettes | 204 |
| SCS | Solde des comptes spéciaux | 204 |
| SGE | Solde général d'exécution | 204 |
TIME_PERIOD
Code
`COMPTES-ETAT` %>%
  group_by(TIME_PERIOD) %>%
  summarise(Nobs = n()) %>%
  arrange(desc(TIME_PERIOD)) %>%
  print_table_conditional()
Solde général d’exécution
Tous
Euros courants
Code
n_year <- year(Sys.Date()) - 2009
Sys.setlocale("LC_TIME", "fr_CA.UTF-8")
# [1] "fr_CA.UTF-8"Code
`COMPTES-ETAT` %>%
  filter(INDICATEUR %in% c("SGE")) %>%
  month_to_date %>%
  mutate(date_year = ymd(paste(last_year, month(date), day(date))),
         year = paste0(year(date))) %>%
  select(date_year, year, OBS_VALUE) %>%
  arrange(date_year, year) %>%
  ggplot(.) + theme_minimal() + xlab("") + ylab("Solde général d'exécution (€ courants)") +
  geom_line(aes(x = date_year, y = OBS_VALUE/1000, color = year)) +
  theme(legend.title = element_blank(),
        legend.position = "none",
        axis.text.x = element_text(angle = 45, vjust = 1, hjust = 1),
        legend.direction = "horizontal",
        axis.text=element_text(size=12),
        axis.title=element_text(size=12,face="bold")) +
  scale_colour_manual(values = c(viridis(n_year), "red")) +
  scale_linetype_manual(values = c("solid", "dashed", "solid", "dashed", "solid")) +
  scale_x_date(breaks = "1 month",
               labels = date_format("%B")) +
  scale_y_continuous(breaks = seq(-900, 900, 20),
                     labels = scales::dollar_format(pre = "", su = " Md€")) +
  geom_text_repel(data = . %>%
                    filter(year == last_year) %>%
                    tail(1),
                  aes(x = date_year, y = OBS_VALUE/1000, label = year),
                  fontface ="plain", color = "red", size = 4) +
  geom_text_repel(data = . %>%
                    filter(date_year == as.Date(paste0(last_year, "-12-01"))),
                  aes(x = date_year, y = OBS_VALUE/1000, label = year),
                  fontface ="plain", color = viridis(n_year), size = 4)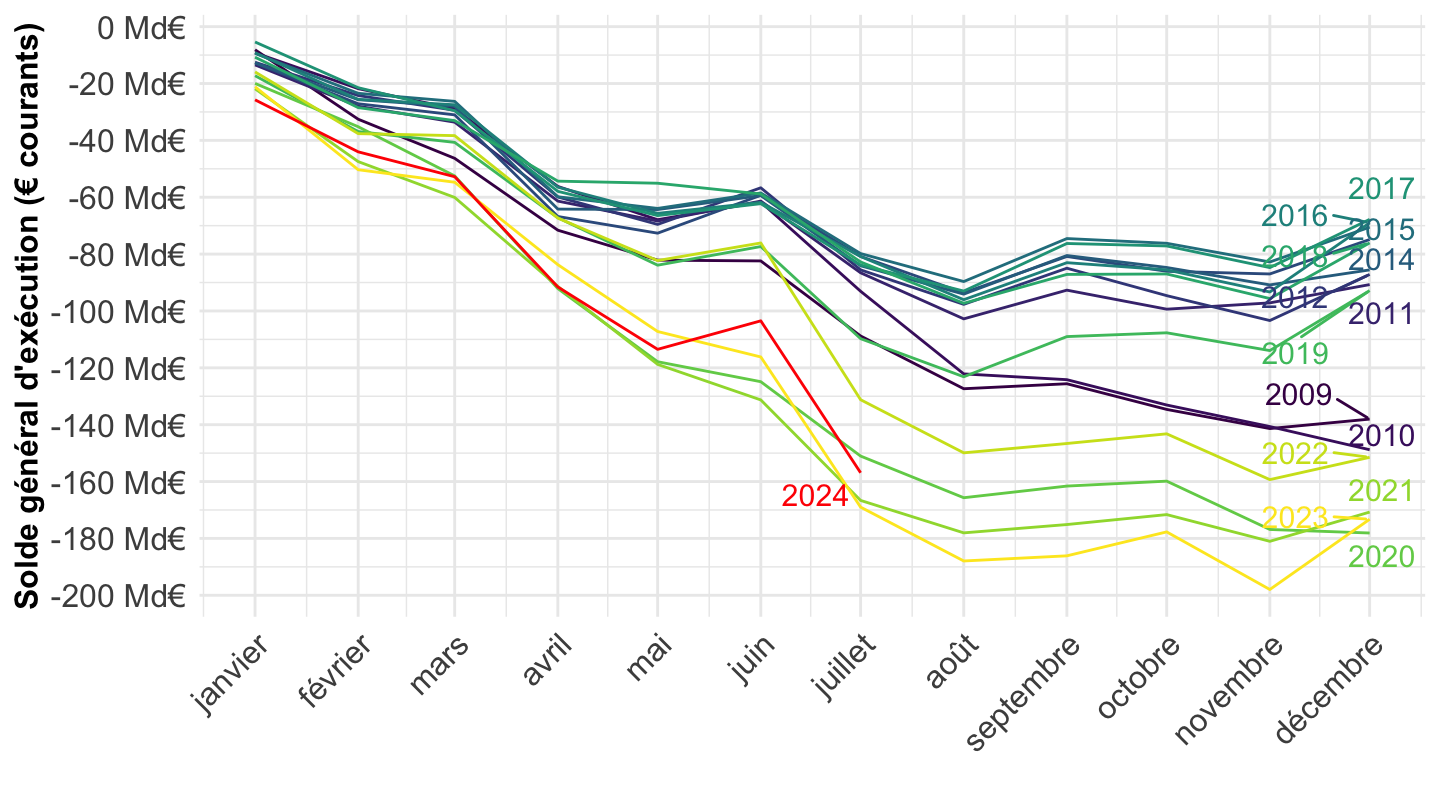
Euros constants
Code
Sys.setlocale("LC_TIME", "fr_CA.UTF-8")# [1] "fr_CA.UTF-8"Code
`COMPTES-ETAT` %>%
  filter(INDICATEUR %in% c("SGE")) %>%
  month_to_date %>%
  select(date, OBS_VALUE) %>%
  left_join(`IPCH-IPC-2015-ensemble` %>%
              select(date, INDICATEUR, OBS_VALUE) %>%
              spread(INDICATEUR, OBS_VALUE) %>%
              arrange(desc(date)), by = "date") %>%
  mutate(OBS_VALUE = IPC[1]*OBS_VALUE/IPC) %>%
  mutate(date_year = ymd(paste(last_year, month(date), day(date))),
         year = paste0(year(date))) %>%
  select(date_year, year, OBS_VALUE) %>%
  arrange(date_year, year) %>%
  ggplot(.) + theme_minimal() + xlab("") + ylab("Solde général d'exécution (€ constants)") +
  geom_line(aes(x = date_year, y = OBS_VALUE/1000, color = year)) +
  theme(legend.title = element_blank(),
        legend.position = "none",
        axis.text.x = element_text(angle = 45, vjust = 1, hjust = 1),
        legend.direction = "horizontal",
        axis.text=element_text(size=12),
        axis.title=element_text(size=12,face="bold")) +
  scale_colour_manual(values = c(viridis(n_year), "red")) +
  scale_linetype_manual(values = c("solid", "dashed", "solid", "dashed", "solid")) +
  scale_x_date(breaks = "1 month",
               labels = date_format("%B")) +
  scale_y_continuous(breaks = seq(-900, 900, 20),
                     labels = scales::dollar_format(pre = "", su = " Md€")) +
  geom_text_repel(data = . %>%
                    filter(year == last_year) %>%
                    tail(1),
                  aes(x = date_year, y = OBS_VALUE/1000, label = year),
                  fontface ="plain", color = "red", size = 4) +
  geom_text_repel(data = . %>%
                    filter(date_year == as.Date(paste0(last_year, "-12-01"))),
                  aes(x = date_year, y = OBS_VALUE/1000, label = year),
                  fontface ="plain", color = viridis(n_year), size = 4)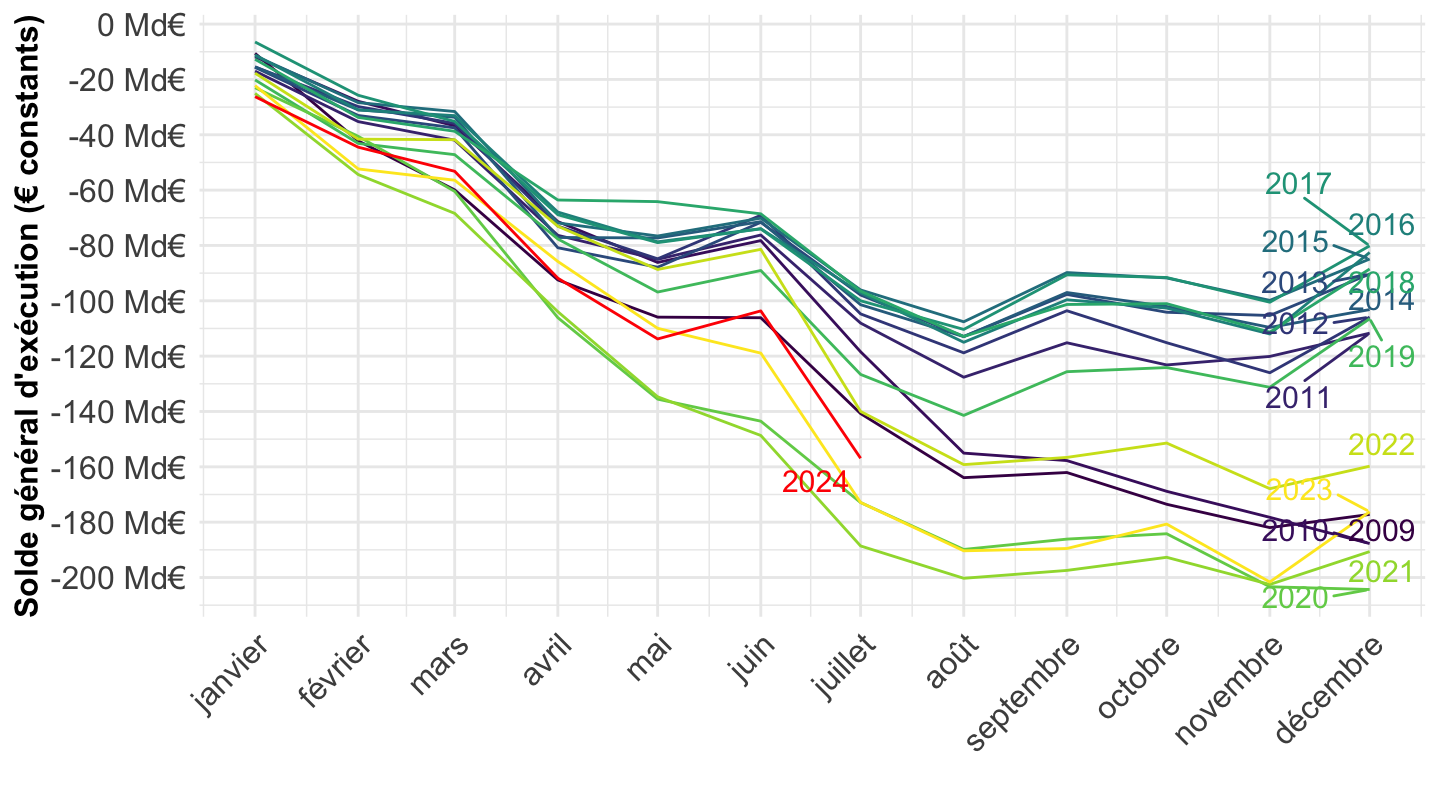
% du PIB
Code
Sys.setlocale("LC_TIME", "fr_CA.UTF-8")# [1] "fr_CA.UTF-8"Code
`COMPTES-ETAT` %>%
  filter(INDICATEUR %in% c("SGE")) %>%
  month_to_date %>%
  select(date, OBS_VALUE) %>%
  mutate(year = year(date)) %>%
  left_join(gdp %>%
              transmute(gdp, year = year(date)), by = "year") %>%
  mutate(OBS_VALUE = OBS_VALUE/(gdp*1000)) %>%
  mutate(date_year = ymd(paste(last_year, month(date), day(date))),
         year = paste0(year(date))) %>%
  select(date_year, year, OBS_VALUE) %>%
  arrange(date_year, year) %>%
  ggplot(.) + theme_minimal() + xlab("") + ylab("Solde général d'exécution (% du PIB)") +
  geom_line(aes(x = date_year, y = OBS_VALUE, color = year)) +
  theme(legend.title = element_blank(),
        legend.position = "none",
        axis.text.x = element_text(angle = 45, vjust = 1, hjust = 1),
        legend.direction = "horizontal",
        axis.text=element_text(size=12),
        axis.title=element_text(size=12,face="bold")) +
  scale_colour_manual(values = c(viridis(n_year), "red")) +
  scale_linetype_manual(values = c("solid", "dashed", "solid", "dashed", "solid")) +
  scale_x_date(breaks = "1 month",
               labels = date_format("%B")) +
  scale_y_continuous(breaks = 0.01*seq(-10, 0, 1),
                     labels = percent_format(acc = 1)) +
  geom_text_repel(data = . %>%
                    filter(year == last_year) %>%
                    tail(1),
                  aes(x = date_year, y = OBS_VALUE, label = year),
                  fontface ="plain", color = "red", size = 4) +
  geom_text_repel(data = . %>%
                    filter(date_year == as.Date(paste0(last_year, "-12-01"))),
                  aes(x = date_year, y = OBS_VALUE, label = year),
                  fontface ="plain", color = viridis(n_year), size = 4)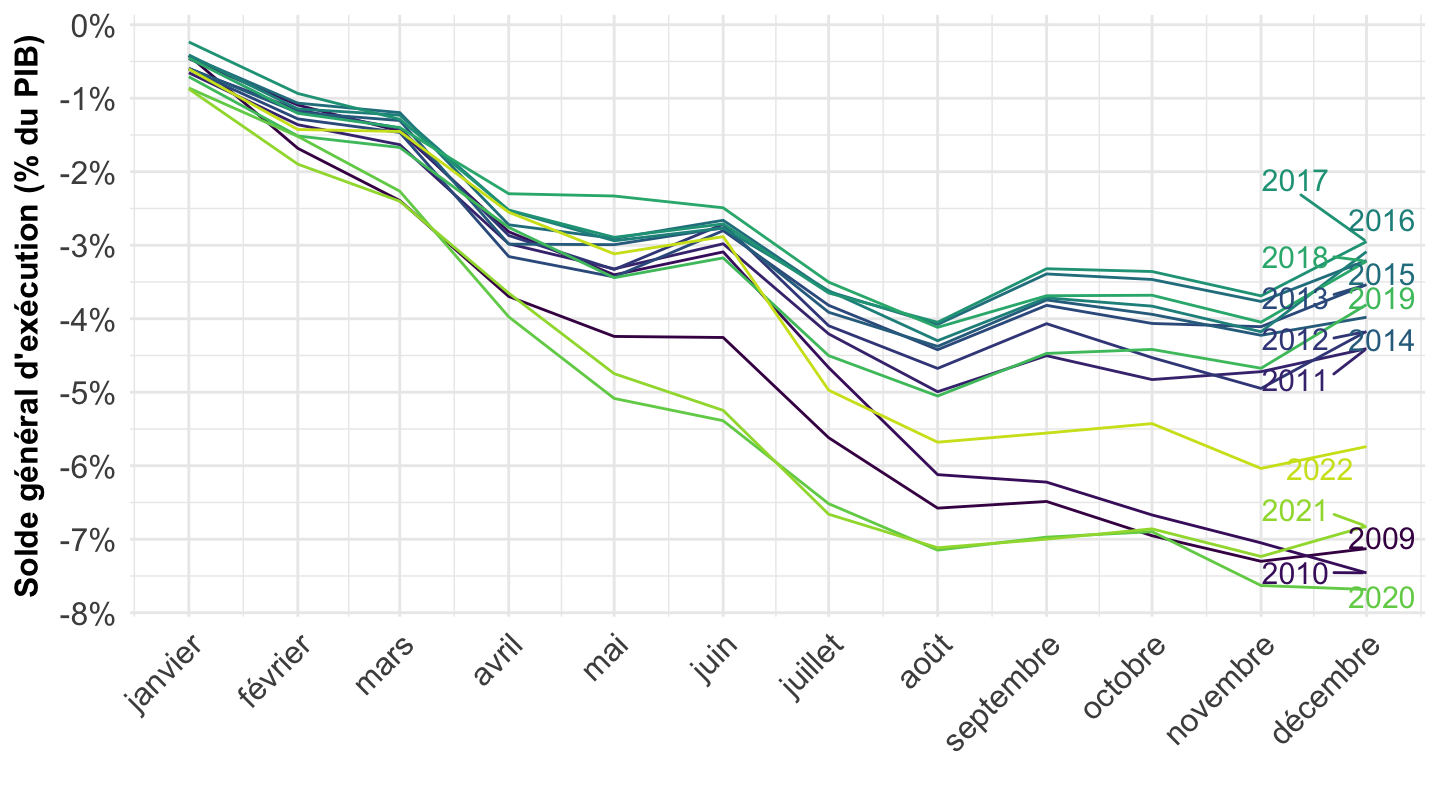
2015-
Code
n_year <- year(Sys.Date()) - 2015
Sys.setlocale("LC_TIME", "fr_CA.UTF-8")
# [1] "fr_CA.UTF-8"Code
`COMPTES-ETAT` %>%
  filter(INDICATEUR %in% c("SGE")) %>%
  month_to_date %>%
  filter(date >= as.Date("2015-01-01")) %>%
  mutate(date_year = ymd(paste(last_year, month(date), day(date))),
         year = paste0(year(date))) %>%
  select(date_year, year, OBS_VALUE) %>%
  arrange(date_year, year) %>%
  ggplot(.) + theme_minimal() + xlab("") + ylab("Solde général d'exécution") +
  geom_line(aes(x = date_year, y = OBS_VALUE/1000, color = year)) +
  theme(legend.title = element_blank(),
        legend.position = "none",
        axis.text.x = element_text(angle = 45, vjust = 1, hjust = 1),
        legend.direction = "horizontal",
        axis.text=element_text(size=12),
        axis.title=element_text(size=12,face="bold")) +
  scale_colour_manual(values = c(viridis(n_year), "red")) +
  scale_linetype_manual(values = c("solid", "dashed", "solid", "dashed", "solid")) +
  scale_x_date(breaks = "1 month",
               labels = date_format("%B")) +
  scale_y_continuous(breaks = seq(-900, 900, 20),
                     labels = scales::dollar_format(pre = "", su = " Md€")) +
  geom_text_repel(data = . %>%
                    filter(year == last_year) %>%
                    tail(1),
                  aes(x = date_year, y = OBS_VALUE/1000, label = year),
                  fontface ="plain", color = "red", size = 4) +
  geom_text_repel(data = . %>%
                    filter(date_year == as.Date(paste0(last_year, "-12-01"))),
                  aes(x = date_year, y = OBS_VALUE/1000, label = year),
                  fontface ="plain", color = viridis(n_year), size = 4)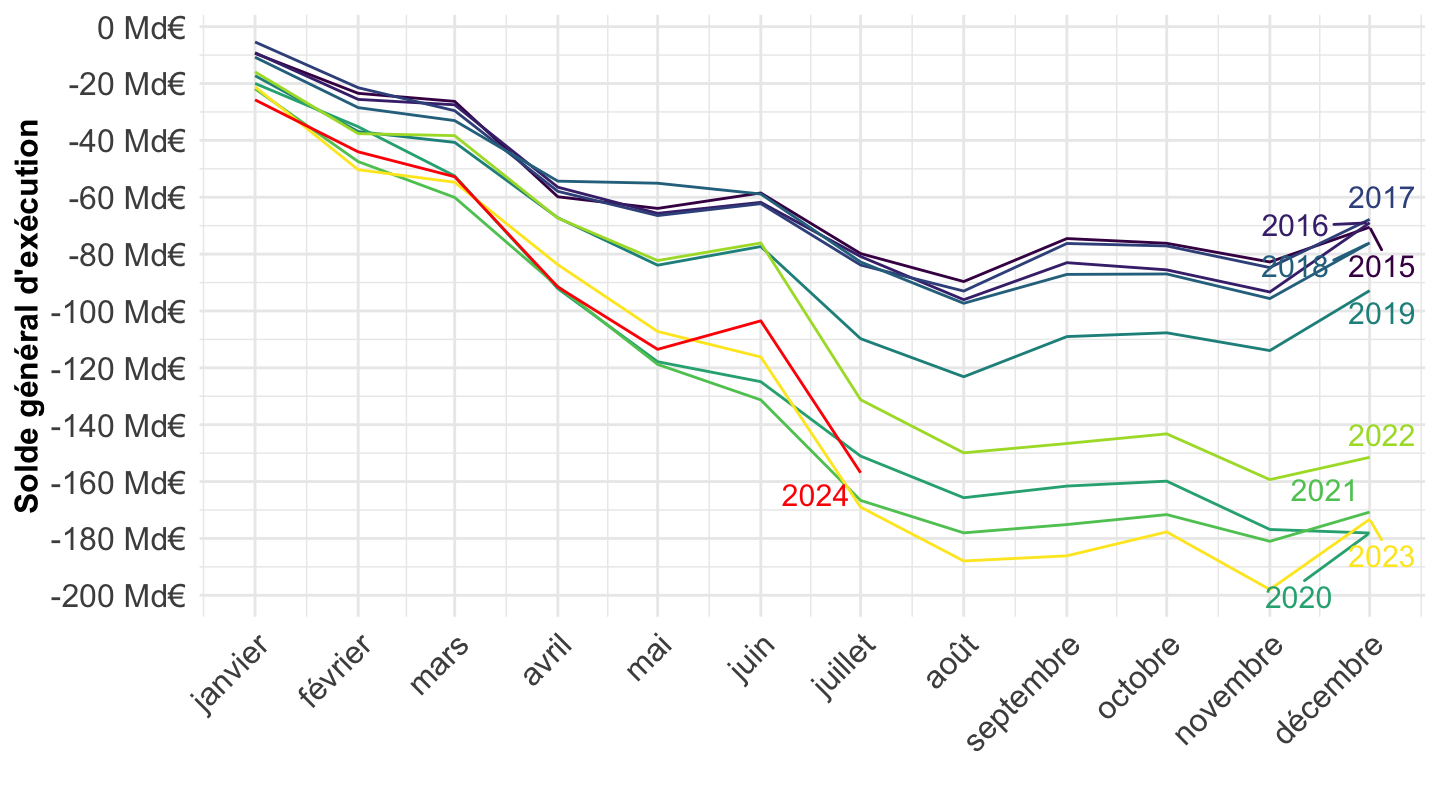
2017-
Code
`COMPTES-ETAT` %>%
  filter(INDICATEUR %in% c("SGE")) %>%
  month_to_date %>%
  filter(date >= as.Date("2017-01-01")) %>%
  ggplot(.) + theme_minimal() + xlab("") + ylab("") +
  geom_line(aes(x = date, y = OBS_VALUE/1000)) +
  theme(legend.title = element_blank(),
        legend.position = c(0.7, 0.9)) +
  scale_x_date(breaks = seq(1920, 2025, 1) %>% paste0("-01-01") %>% as.Date(),
               labels = date_format("%Y")) +
  scale_y_continuous(breaks = seq(-900, 900, 20),
                     labels = scales::dollar_format(pre = "", su = "Mds€"))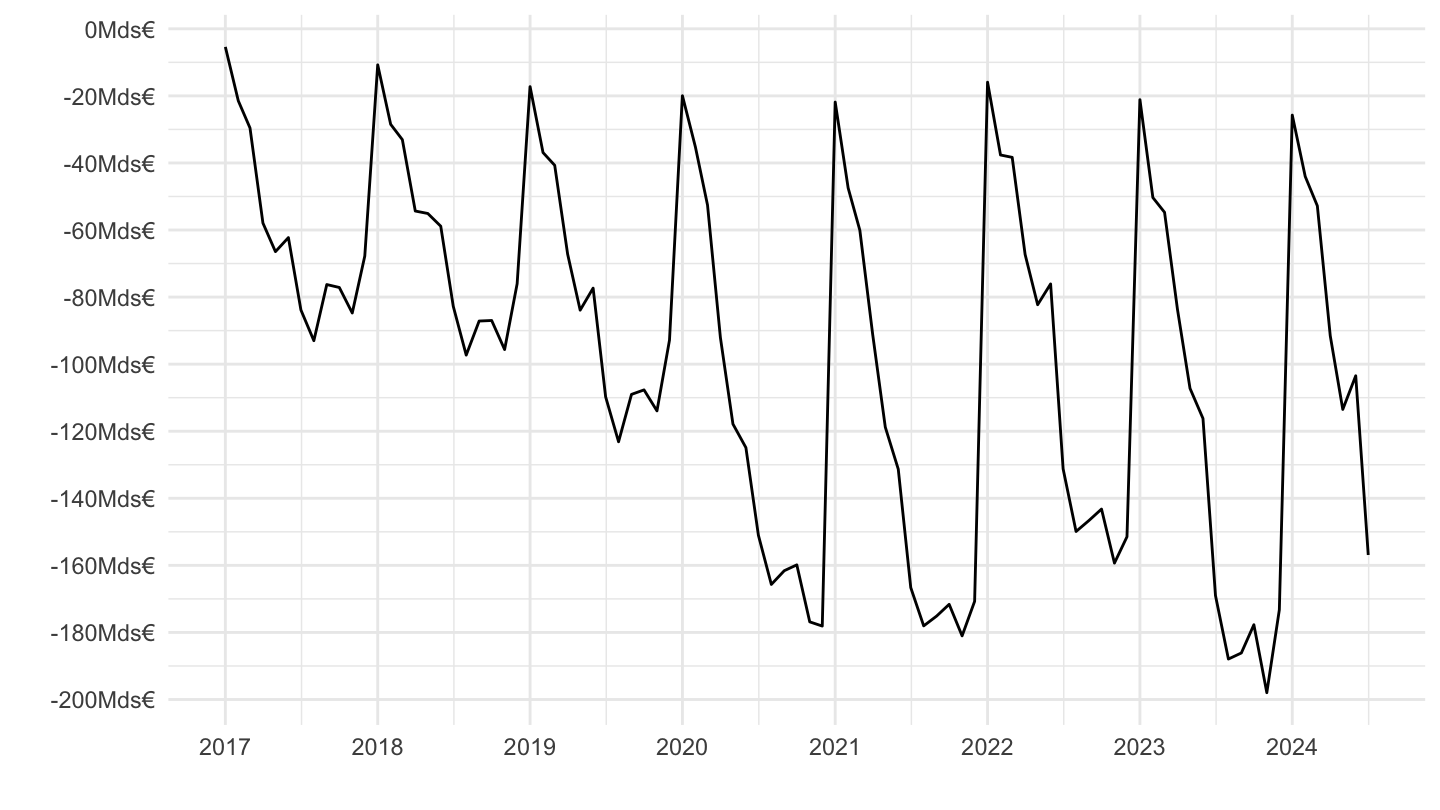
2018-
Code
n_year <- year(Sys.Date()) - 2018
Sys.setlocale("LC_TIME", "fr_CA.UTF-8")
# [1] "fr_CA.UTF-8"Code
`COMPTES-ETAT` %>%
  filter(INDICATEUR %in% c("SGE")) %>%
  month_to_date %>%
  filter(date >= as.Date("2018-01-01")) %>%
  mutate(date_year = ymd(paste(last_year, month(date), day(date))),
         year = paste0(year(date))) %>%
  select(date_year, year, OBS_VALUE) %>%
  arrange(date_year, year) %>%
  ggplot(.) + theme_minimal() + xlab("") + ylab("Solde général d'exécution") +
  geom_line(aes(x = date_year, y = OBS_VALUE/1000, color = year)) +
  theme(legend.title = element_blank(),
        legend.position = "none",
        axis.text.x = element_text(angle = 45, vjust = 1, hjust = 1),
        legend.direction = "horizontal",
        axis.text=element_text(size=12),
        axis.title=element_text(size=14,face="bold")) +
  scale_colour_manual(values = c(viridis(n_year), "red")) +
  scale_linetype_manual(values = c("solid", "dashed", "solid", "dashed", "solid")) +
  scale_x_date(breaks = "1 month",
               labels = date_format("%B")) +
  scale_y_continuous(breaks = seq(-900, 900, 20),
                     labels = scales::dollar_format(pre = "", su = " Md€")) +
  geom_text_repel(data = . %>%
                    filter(year == last_year) %>%
                    tail(1),
                  aes(x = date_year, y = OBS_VALUE/1000, label = year),
                  fontface ="plain", color = "red", size = 4) +
  geom_text_repel(data = . %>%
                    filter(date_year == as.Date(paste0(last_year, "-12-01"))),
                  aes(x = date_year, y = OBS_VALUE/1000, label = year),
                  fontface ="plain", color = viridis(n_year), size = 4)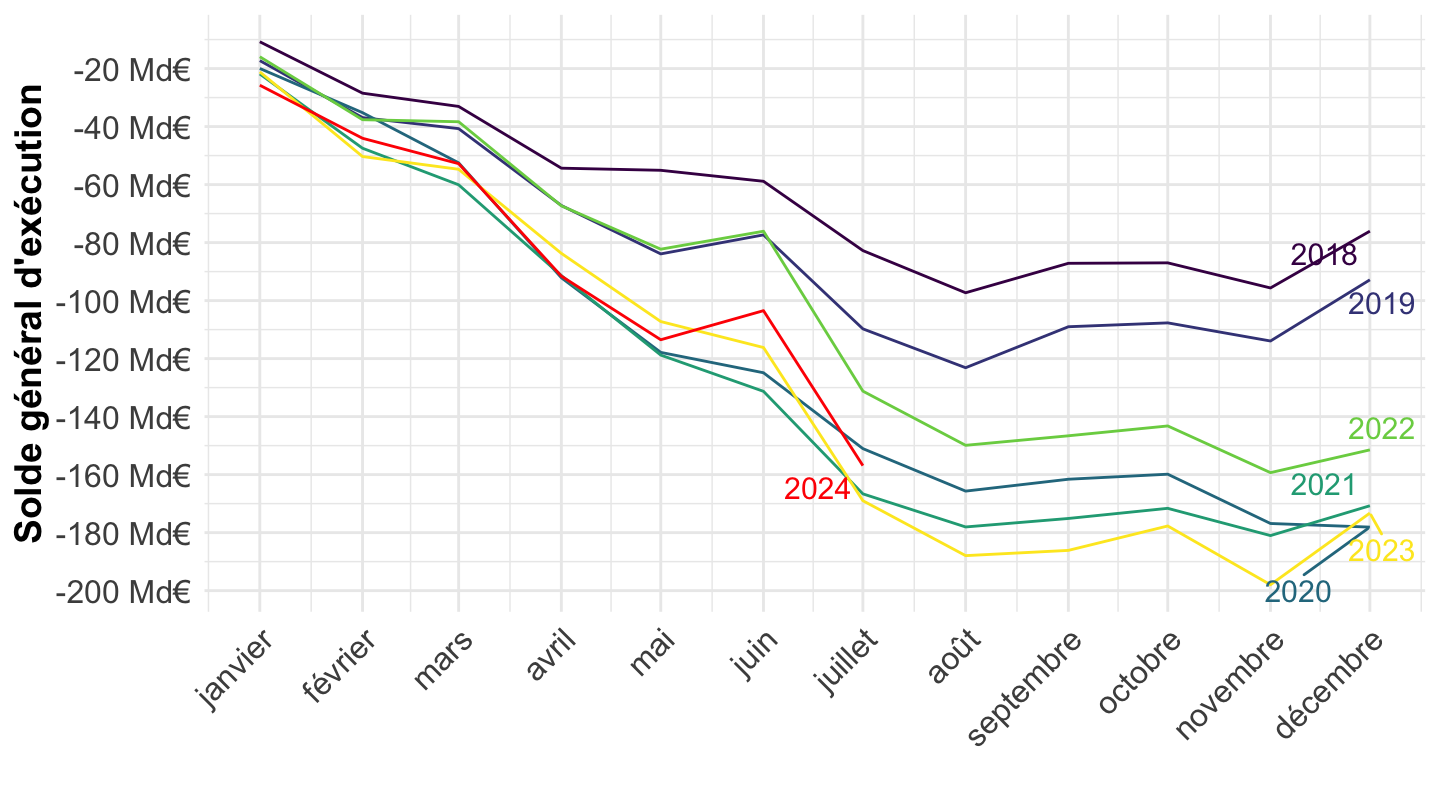
Dépenses
2009-
Code
n_year <- year(Sys.Date()) - 2009
Sys.setlocale("LC_TIME", "fr_CA.UTF-8")
# [1] "fr_CA.UTF-8"Code
`COMPTES-ETAT` %>%
  filter(INDICATEUR %in% c("DEP")) %>%
  month_to_date %>%
  filter(date >= as.Date("2009-01-01")) %>%
  mutate(date_year = ymd(paste(last_year, month(date), day(date))),
         year = paste0(year(date))) %>%
  select(date_year, year, OBS_VALUE) %>%
  arrange(date_year, year) %>%
  ggplot(.) + theme_minimal() + xlab("") + ylab("Dépenses") +
  geom_line(aes(x = date_year, y = OBS_VALUE/1000, color = year)) +
  theme(legend.title = element_blank(),
        legend.position = "none",
        axis.text.x = element_text(angle = 45, vjust = 1, hjust = 1),
        legend.direction = "horizontal",
        axis.text=element_text(size=12),
        axis.title=element_text(size=14,face="bold")) +
  scale_colour_manual(values = c(viridis(n_year), "red")) +
  scale_linetype_manual(values = c("solid", "dashed", "solid", "dashed", "solid")) +
  scale_x_date(breaks = "1 month",
               labels = date_format("%B")) +
  scale_y_continuous(breaks = seq(-900, 900, 50),
                     labels = scales::dollar_format(pre = "", su = " Md€")) +
  geom_text_repel(data = . %>%
                    filter(year == last_year) %>%
                    tail(1),
                  aes(x = date_year, y = OBS_VALUE/1000, label = year),
                  fontface ="plain", color = "red", size = 4) +
  geom_text_repel(data = . %>%
                    filter(date_year == as.Date(paste0(last_year, "-12-01"))),
                  aes(x = date_year, y = OBS_VALUE/1000, label = year),
                  fontface ="plain", color = viridis(n_year), size = 4)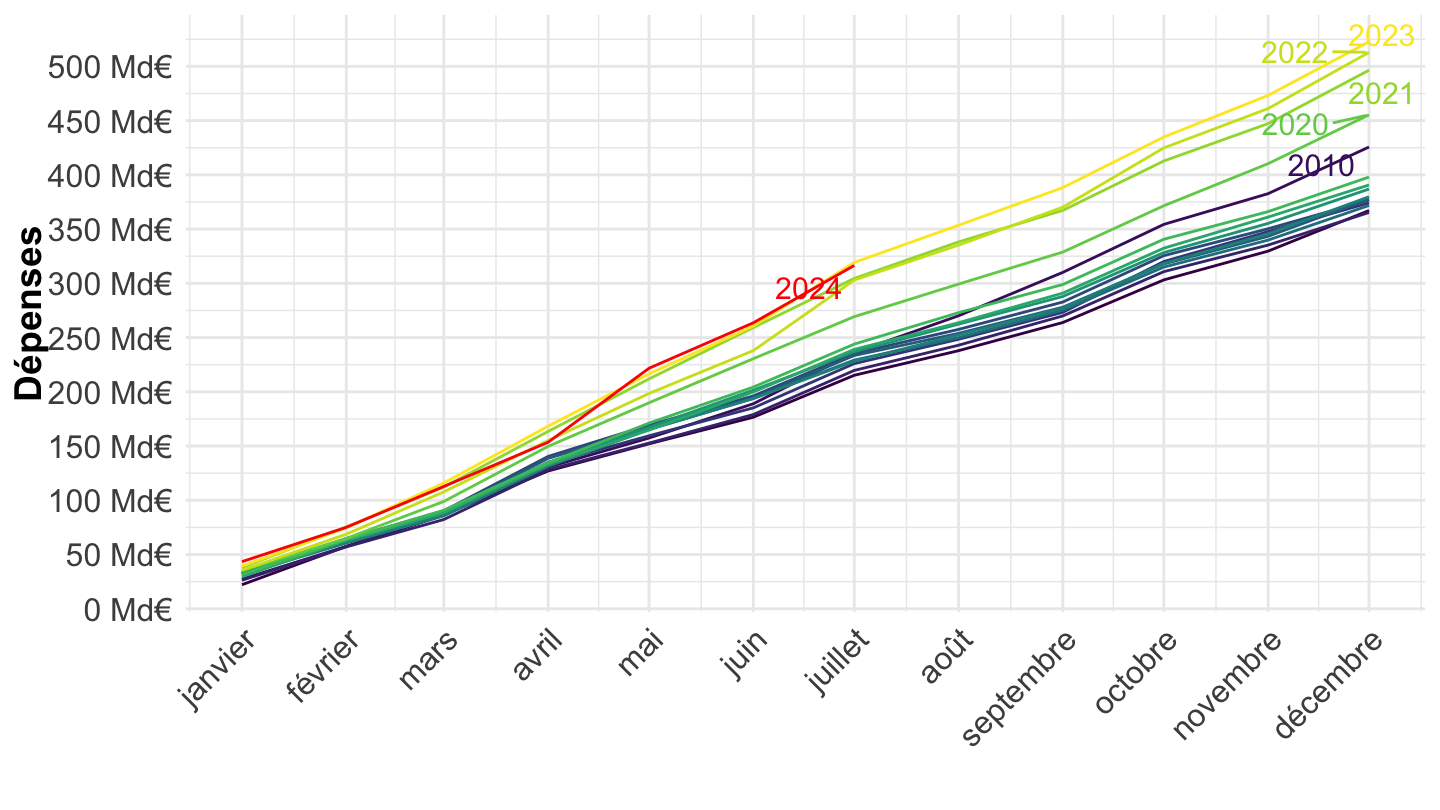
2016-
Code
n_year <- year(Sys.Date()) - 2016
Sys.setlocale("LC_TIME", "fr_CA.UTF-8")
# [1] "fr_CA.UTF-8"Code
`COMPTES-ETAT` %>%
  filter(INDICATEUR %in% c("DEP")) %>%
  month_to_date %>%
  filter(date >= as.Date("2016-01-01")) %>%
  mutate(date_year = ymd(paste(last_year, month(date), day(date))),
         year = paste0(year(date))) %>%
  select(date_year, year, OBS_VALUE) %>%
  arrange(date_year, year) %>%
  ggplot(.) + theme_minimal() + xlab("") + ylab("Dépenses") +
  geom_line(aes(x = date_year, y = OBS_VALUE/1000, color = year)) +
  theme(legend.title = element_blank(),
        legend.position = "none",
        axis.text.x = element_text(angle = 45, vjust = 1, hjust = 1),
        legend.direction = "horizontal",
        axis.text=element_text(size=12),
        axis.title=element_text(size=14,face="bold")) +
  scale_colour_manual(values = c(viridis(n_year), "red")) +
  scale_linetype_manual(values = c("solid", "dashed", "solid", "dashed", "solid")) +
  scale_x_date(breaks = "1 month",
               labels = date_format("%B")) +
  scale_y_continuous(breaks = seq(-900, 900, 50),
                     labels = scales::dollar_format(pre = "", su = " Md€")) +
  geom_text_repel(data = . %>%
                    filter(year == last_year) %>%
                    tail(1),
                  aes(x = date_year, y = OBS_VALUE/1000, label = year),
                  fontface ="plain", color = "red", size = 4) +
  geom_text_repel(data = . %>%
                    filter(date_year == as.Date(paste0(last_year, "-12-01"))),
                  aes(x = date_year, y = OBS_VALUE/1000, label = year),
                  fontface ="plain", color = viridis(n_year), size = 4)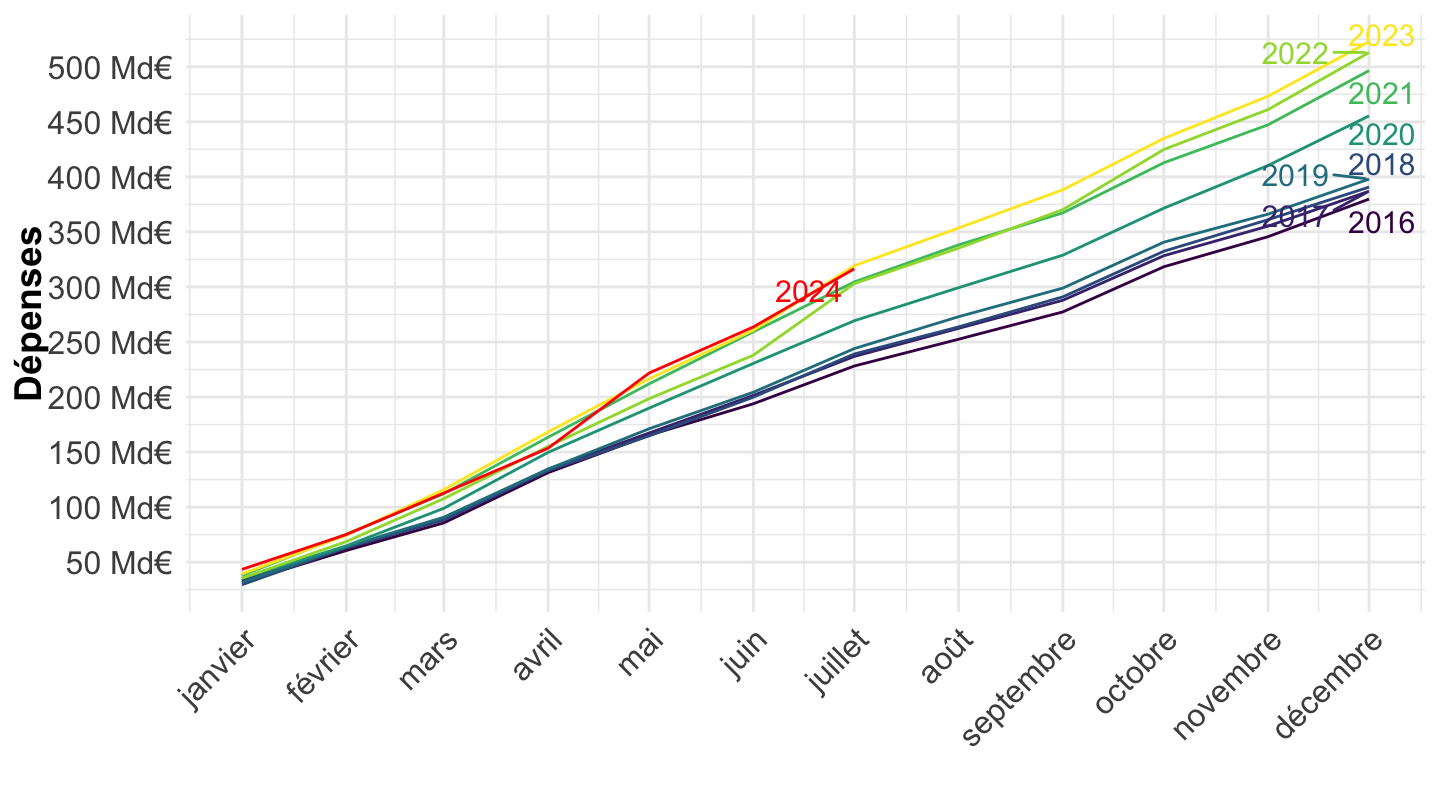
2018-
Code
n_year <- year(Sys.Date()) - 2018
Sys.setlocale("LC_TIME", "fr_CA.UTF-8")
# [1] "fr_CA.UTF-8"Code
`COMPTES-ETAT` %>%
  filter(INDICATEUR %in% c("DEP")) %>%
  month_to_date %>%
  filter(date >= as.Date("2018-01-01")) %>%
  mutate(date_year = ymd(paste(last_year, month(date), day(date))),
         year = paste0(year(date))) %>%
  select(date_year, year, OBS_VALUE) %>%
  arrange(date_year, year) %>%
  ggplot(.) + theme_minimal() + xlab("") + ylab("Dépenses") +
  geom_line(aes(x = date_year, y = OBS_VALUE/1000, color = year)) +
  theme(legend.title = element_blank(),
        legend.position = "none",
        axis.text.x = element_text(angle = 45, vjust = 1, hjust = 1),
        legend.direction = "horizontal",
        axis.text=element_text(size=12),
        axis.title=element_text(size=14,face="bold")) +
  scale_colour_manual(values = c(viridis(n_year), "red")) +
  scale_linetype_manual(values = c("solid", "dashed", "solid", "dashed", "solid")) +
  scale_x_date(breaks = "1 month",
               labels = date_format("%B")) +
  scale_y_continuous(breaks = seq(-900, 900, 50),
                     labels = scales::dollar_format(pre = "", su = " Md€")) +
  geom_text_repel(data = . %>%
                    filter(year == last_year) %>%
                    tail(1),
                  aes(x = date_year, y = OBS_VALUE/1000, label = year),
                  fontface ="plain", color = "red", size = 4) +
  geom_text_repel(data = . %>%
                    filter(date_year == as.Date(paste0(last_year, "-12-01"))),
                  aes(x = date_year, y = OBS_VALUE/1000, label = year),
                  fontface ="plain", color = viridis(n_year), size = 4)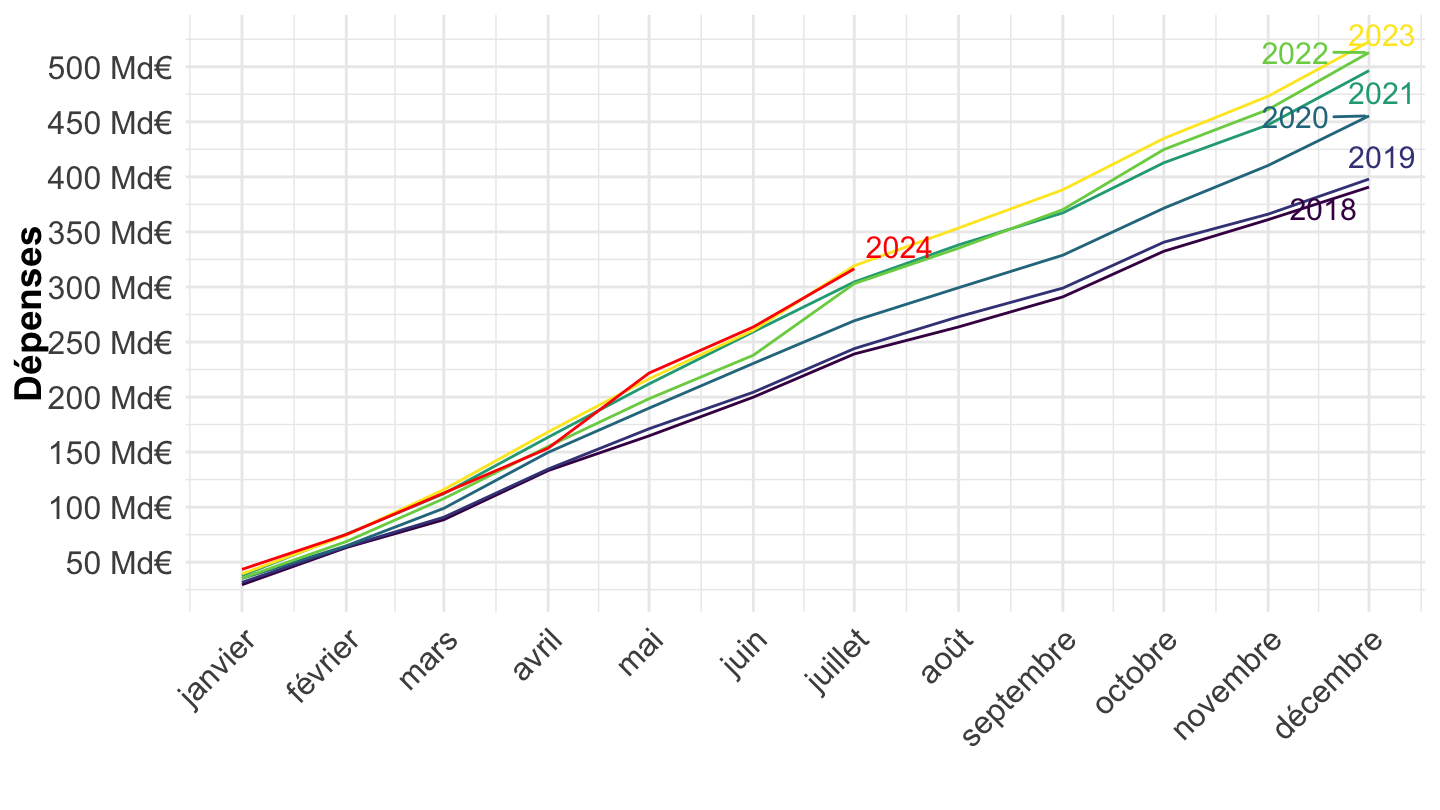
Recettes
2009-
Code
n_year <- year(Sys.Date()) - 2009
Sys.setlocale("LC_TIME", "fr_CA.UTF-8")
# [1] "fr_CA.UTF-8"Code
`COMPTES-ETAT` %>%
  filter(INDICATEUR %in% c("REC")) %>%
  month_to_date %>%
  filter(date >= as.Date("2009-01-01")) %>%
  mutate(date_year = ymd(paste(last_year, month(date), day(date))),
         year = paste0(year(date))) %>%
  select(date_year, year, OBS_VALUE) %>%
  arrange(date_year, year) %>%
  ggplot(.) + theme_minimal() + xlab("") + ylab("Recettes") +
  geom_line(aes(x = date_year, y = OBS_VALUE/1000, color = year)) +
  theme(legend.title = element_blank(),
        legend.position = "none",
        axis.text.x = element_text(angle = 45, vjust = 1, hjust = 1),
        legend.direction = "horizontal",
        axis.text=element_text(size=12),
        axis.title=element_text(size=14,face="bold")) +
  scale_colour_manual(values = c(viridis(n_year), "red")) +
  scale_linetype_manual(values = c("solid", "dashed", "solid", "dashed", "solid")) +
  scale_x_date(breaks = "1 month",
               labels = date_format("%B")) +
  scale_y_continuous(breaks = seq(-900, 900, 50),
                     labels = scales::dollar_format(pre = "", su = " Md€")) +
  geom_text_repel(data = . %>%
                    filter(year == last_year) %>%
                    tail(1),
                  aes(x = date_year, y = OBS_VALUE/1000, label = year),
                  fontface ="plain", color = "red", size = 4) +
  geom_text_repel(data = . %>%
                    filter(date_year == as.Date(paste0(last_year, "-12-01"))),
                  aes(x = date_year, y = OBS_VALUE/1000, label = year),
                  fontface ="plain", color = viridis(n_year), size = 4)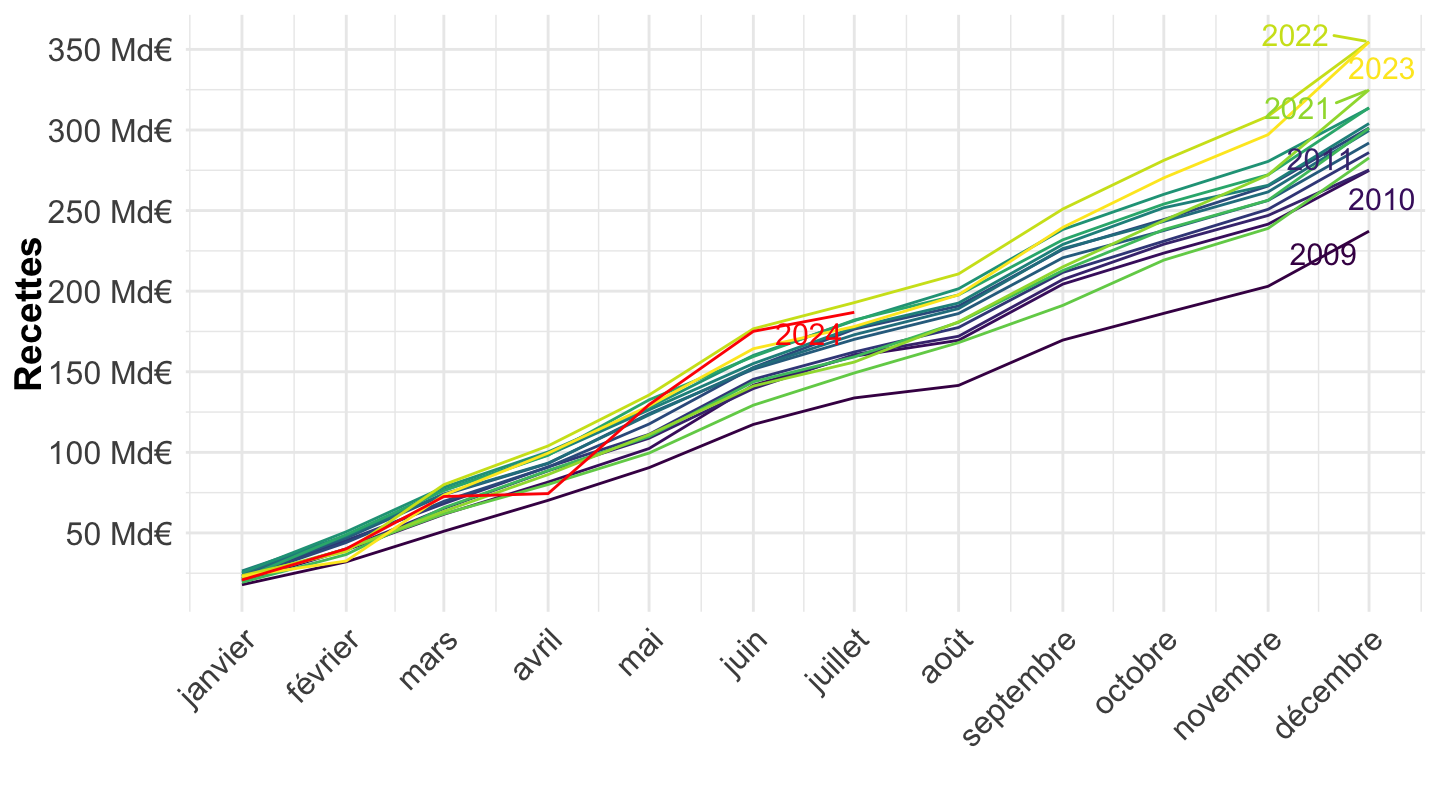
2018-
Code
n_year <- year(Sys.Date()) - 2018
Sys.setlocale("LC_TIME", "fr_CA.UTF-8")
# [1] "fr_CA.UTF-8"Code
`COMPTES-ETAT` %>%
  filter(INDICATEUR %in% c("REC")) %>%
  month_to_date %>%
  filter(date >= as.Date("2018-01-01")) %>%
  mutate(date_year = ymd(paste(last_year, month(date), day(date))),
         year = paste0(year(date))) %>%
  select(date_year, year, OBS_VALUE) %>%
  arrange(date_year, year) %>%
  ggplot(.) + theme_minimal() + xlab("") + ylab("Recettes") +
  geom_line(aes(x = date_year, y = OBS_VALUE/1000, color = year)) +
  theme(legend.title = element_blank(),
        legend.position = "none",
        axis.text.x = element_text(angle = 45, vjust = 1, hjust = 1),
        legend.direction = "horizontal",
        axis.text=element_text(size=12),
        axis.title=element_text(size=14,face="bold")) +
  scale_colour_manual(values = c(viridis(n_year), "red")) +
  scale_linetype_manual(values = c("solid", "dashed", "solid", "dashed", "solid")) +
  scale_x_date(breaks = "1 month",
               labels = date_format("%B")) +
  scale_y_continuous(breaks = seq(-900, 900, 50),
                     labels = scales::dollar_format(pre = "", su = " Md€")) +
  geom_text_repel(data = . %>%
                    filter(year == last_year) %>%
                    tail(1),
                  aes(x = date_year, y = OBS_VALUE/1000, label = year),
                  fontface ="plain", color = "red", size = 4) +
  geom_text_repel(data = . %>%
                    filter(date_year == as.Date(paste0(last_year, "-12-01"))),
                  aes(x = date_year, y = OBS_VALUE/1000, label = year),
                  fontface ="plain", color = viridis(n_year), size = 4)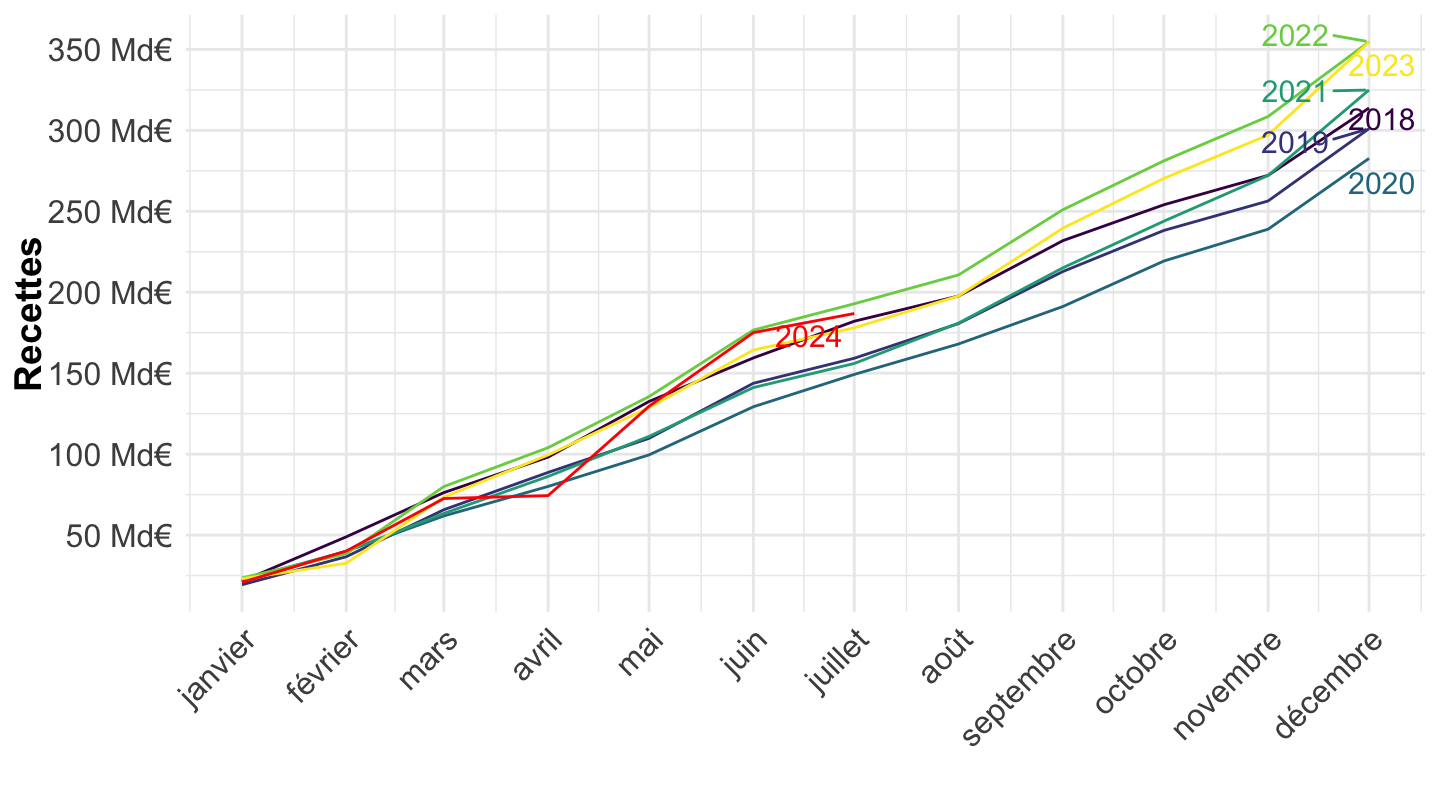
Dépenses, Recettes
Tous
Code
`COMPTES-ETAT` %>%
  filter(INDICATEUR %in% c("DEP", "REC")) %>%
  month_to_date %>%
  left_join(INDICATEUR,  by = "INDICATEUR") %>%
  ggplot(.) + theme_minimal() + xlab("") + ylab("") +
  geom_line(aes(x = date, y = OBS_VALUE/1000, color = Indicateur)) +

  theme(legend.title = element_blank(),
        legend.position = c(0.7, 0.9)) +
  scale_x_date(breaks = seq(1920, 2025, 1) %>% paste0("-01-01") %>% as.Date(),
               labels = date_format("%Y")) +
  scale_y_continuous(breaks = seq(0, 900, 50),
                     labels = scales::dollar_format(pre = "", su = "Mds€"))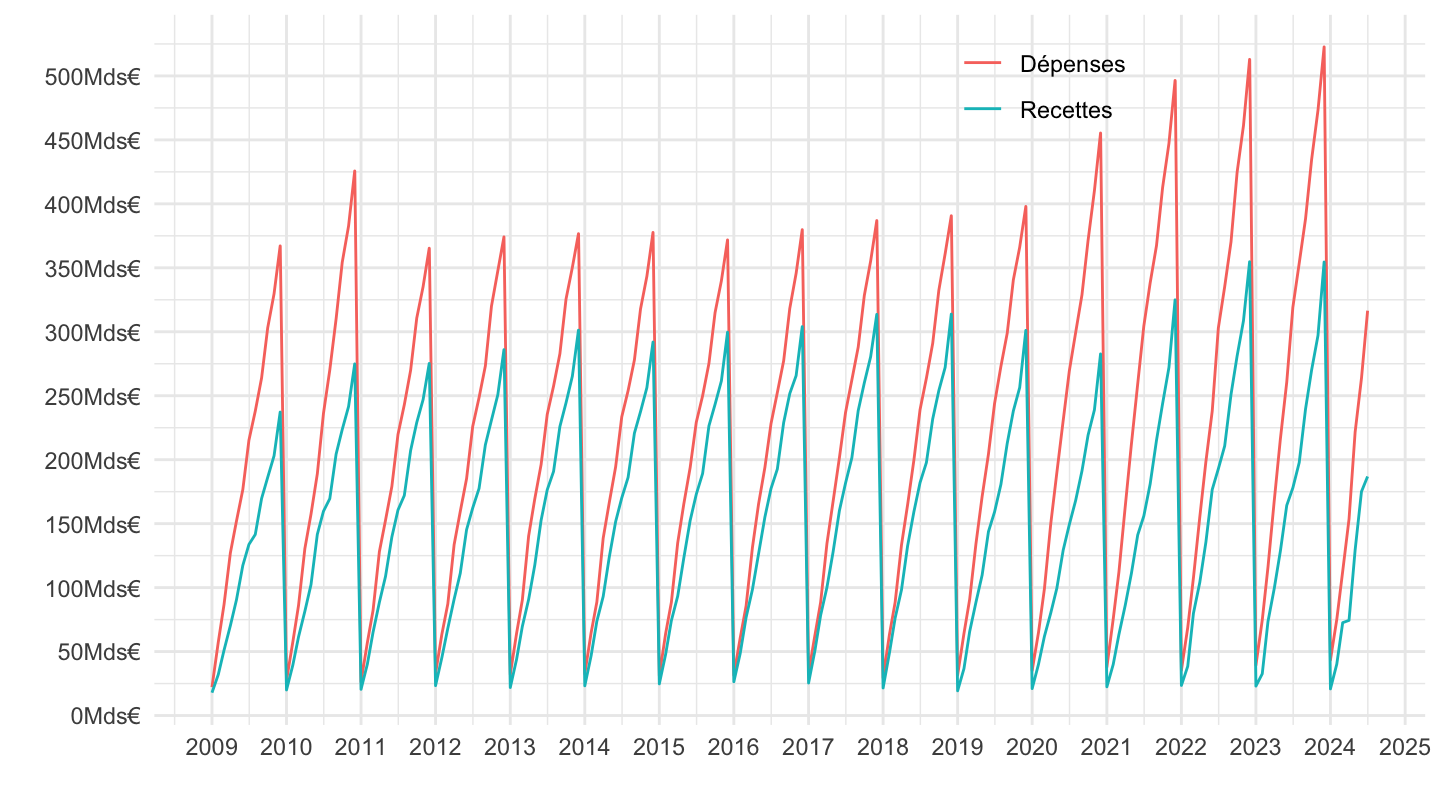
2017-
Code
`COMPTES-ETAT` %>%
  filter(INDICATEUR %in% c("DEP", "REC")) %>%
  month_to_date %>%
  filter(date >= as.Date("2017-01-01")) %>%
  left_join(INDICATEUR,  by = "INDICATEUR") %>%
  ggplot(.) + theme_minimal() + xlab("") + ylab("") +
  geom_line(aes(x = date, y = OBS_VALUE/1000, color = Indicateur)) +

  theme(legend.title = element_blank(),
        legend.position = c(0.2, 0.9)) +
  scale_x_date(breaks = seq(1920, 2025, 1) %>% paste0("-01-01") %>% as.Date(),
               labels = date_format("%Y")) +
  scale_y_continuous(breaks = seq(0, 900, 50),
                     labels = scales::dollar_format(pre = "", su = "Mds€"))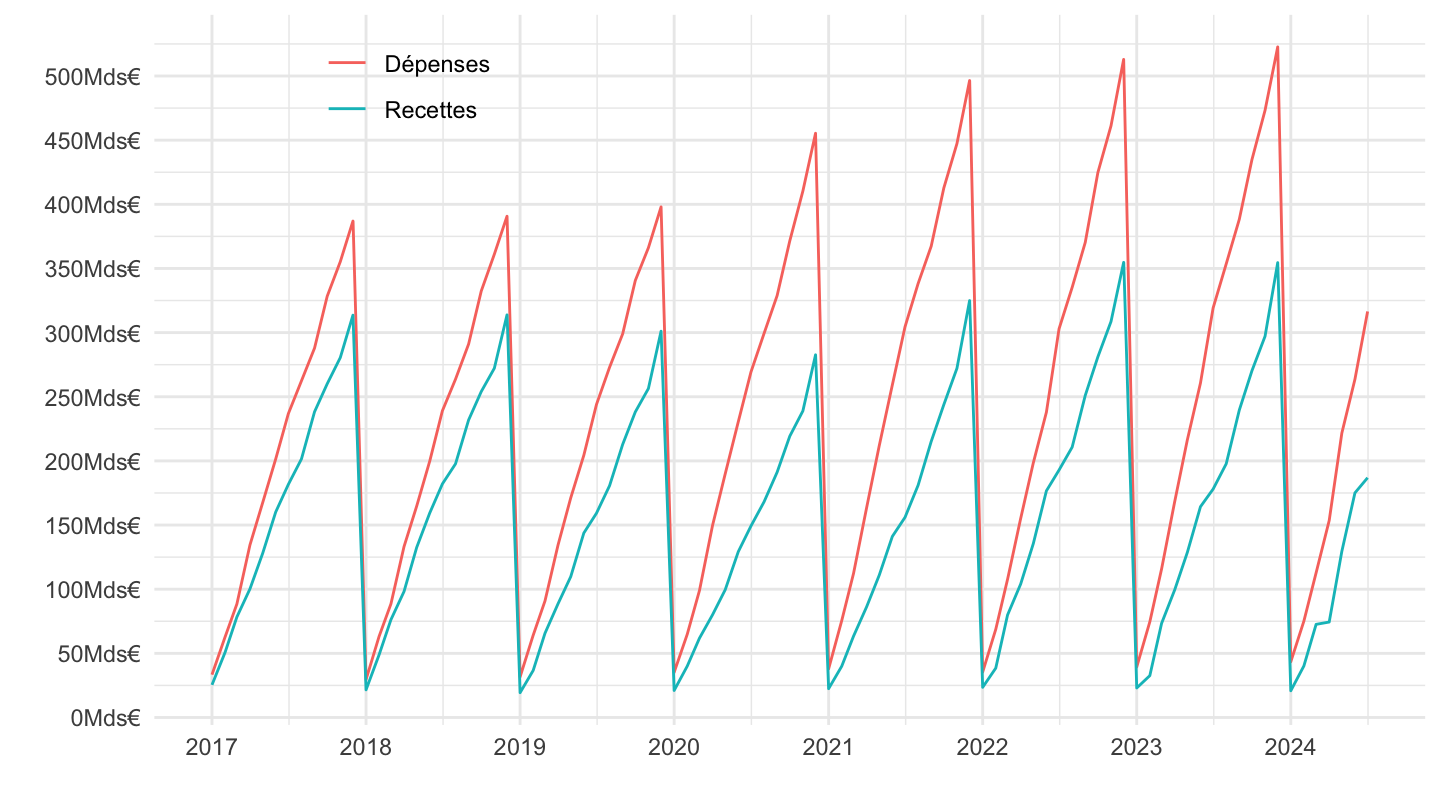
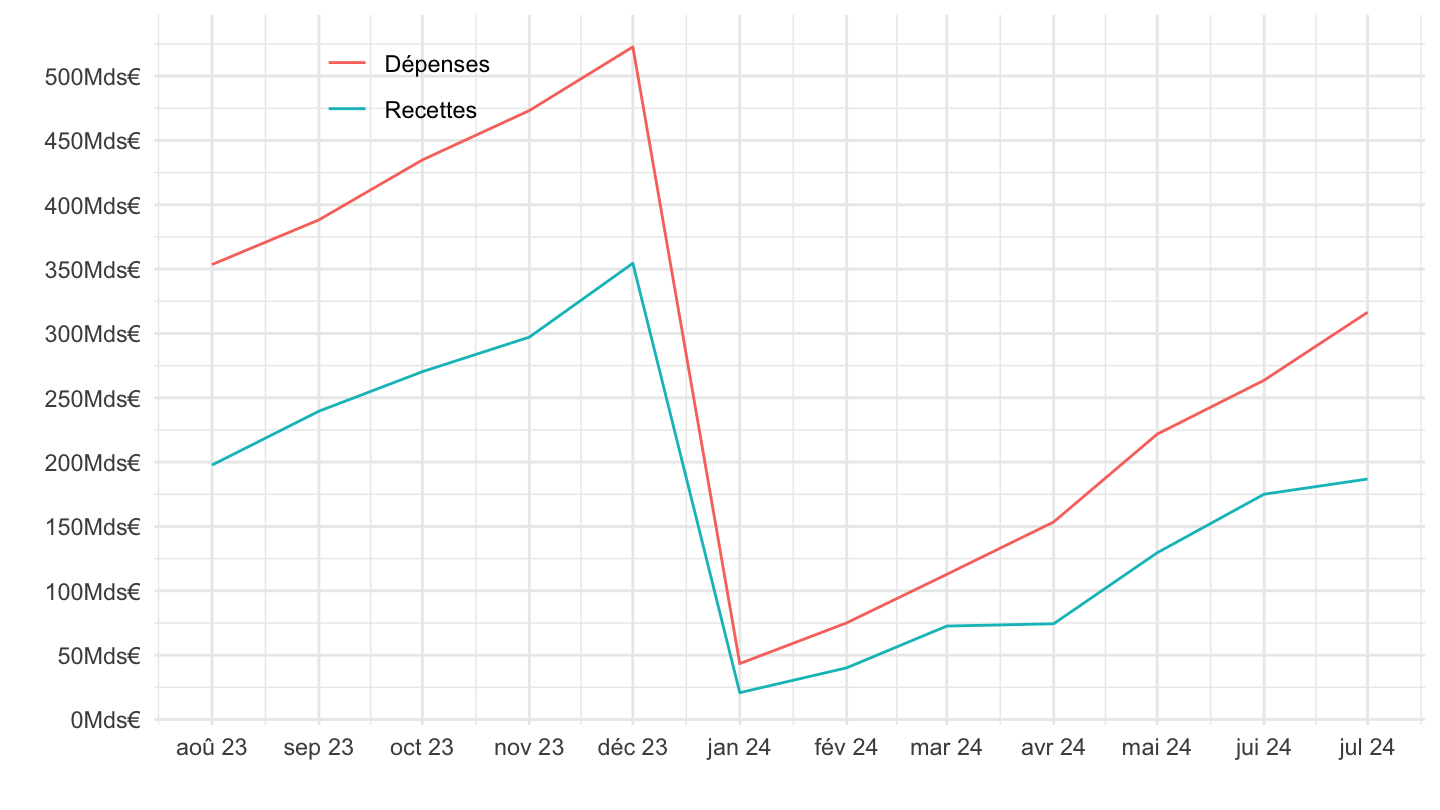
Last year
Code
`COMPTES-ETAT` %>%
  filter(INDICATEUR %in% c("DEP", "REC")) %>%
  month_to_date %>%
  group_by(INDICATEUR) %>%
  arrange(date) %>%
  do(tail(., n = 12)) %>%
  left_join(INDICATEUR,  by = "INDICATEUR") %>%
  ggplot(.) + theme_minimal() + xlab("") + ylab("") +
  geom_line(aes(x = date, y = OBS_VALUE/1000, color = Indicateur)) +
  theme(legend.title = element_blank(),
        legend.position = c(0.2, 0.9)) +
  scale_x_date(breaks = "1 month",
               labels = date_format("%b %y")) +
  scale_y_continuous(breaks = seq(0, 900, 50),
                     labels = scales::dollar_format(pre = "", su = "Mds€"))