Last observation: 2025 (N = 50)
First observation: 1959 (N = 50)
Last data update: 08 sept. 2026, 14:36
Last compile: 10 oct. 2026, 01:34
t_3201 |>
  filter(year == max(year)) |>
  year_to_date2() |>
  left_join(gdp, by = "date") |>
  select(-date) |>
  mutate(value_gdp = round(100*value/gdp, 1)) |>
  select(-gdp) %>%
{if (is_html_output()) datatable(., filter = 'top', rownames = F) else .}t_3201 |>
filter(year == max(year)) |>
year_to_date2() |>
left_join(gdp, by = "date") |>
select(-date) |>
mutate(value_gdp = round(100*value/gdp, 1)) |>
select(-gdp) |>
arrange(-value) %>%
{if (is_html_output()) datatable(., filter = 'top', rownames = F) else .}t_3201 |>
filter(line %in% c(3, 20, 10)) |>
select(line,year, value) |>
spread(line, value) |>
transmute(year,
`Prestations sociales autres que transferts sociaux en nature` = `10`,
`Rémunération des salariés` = `3`,
`Rémunération des salariés -- sans cotisations sociales imputées` = `3`-`20`) |>
gather(Line, value, -year) |>
year_to_date2() |>
left_join(gdp, by = "date") |>
ggplot() + geom_line(aes(x = date, y = value / gdp, color = Line)) +
theme_minimal() + xlab("") + ylab("% du PIB") +
scale_x_date(breaks = seq(1960, 2100, 10) |> paste0("-01-01") |> as.Date(),
labels = date_format("%Y")) +
scale_y_continuous(breaks = 0.01*seq(0, 500, 1),
labels = percent_format(accuracy = 1)) +
theme(legend.position = c(0.3, 0.9),
legend.title = element_blank())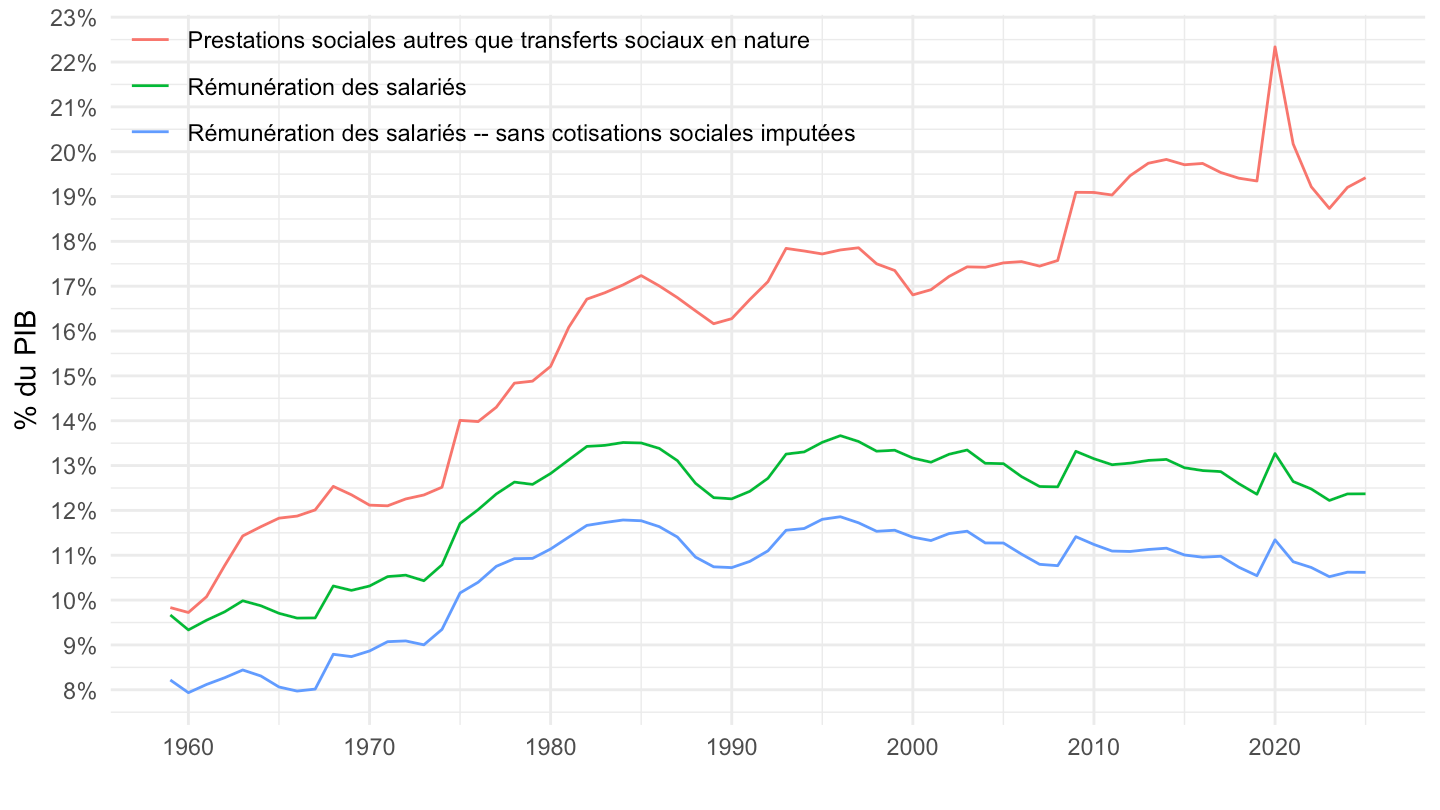
library(ggplot2)
library(scales)
library(ggrepel)

# Préparer les données
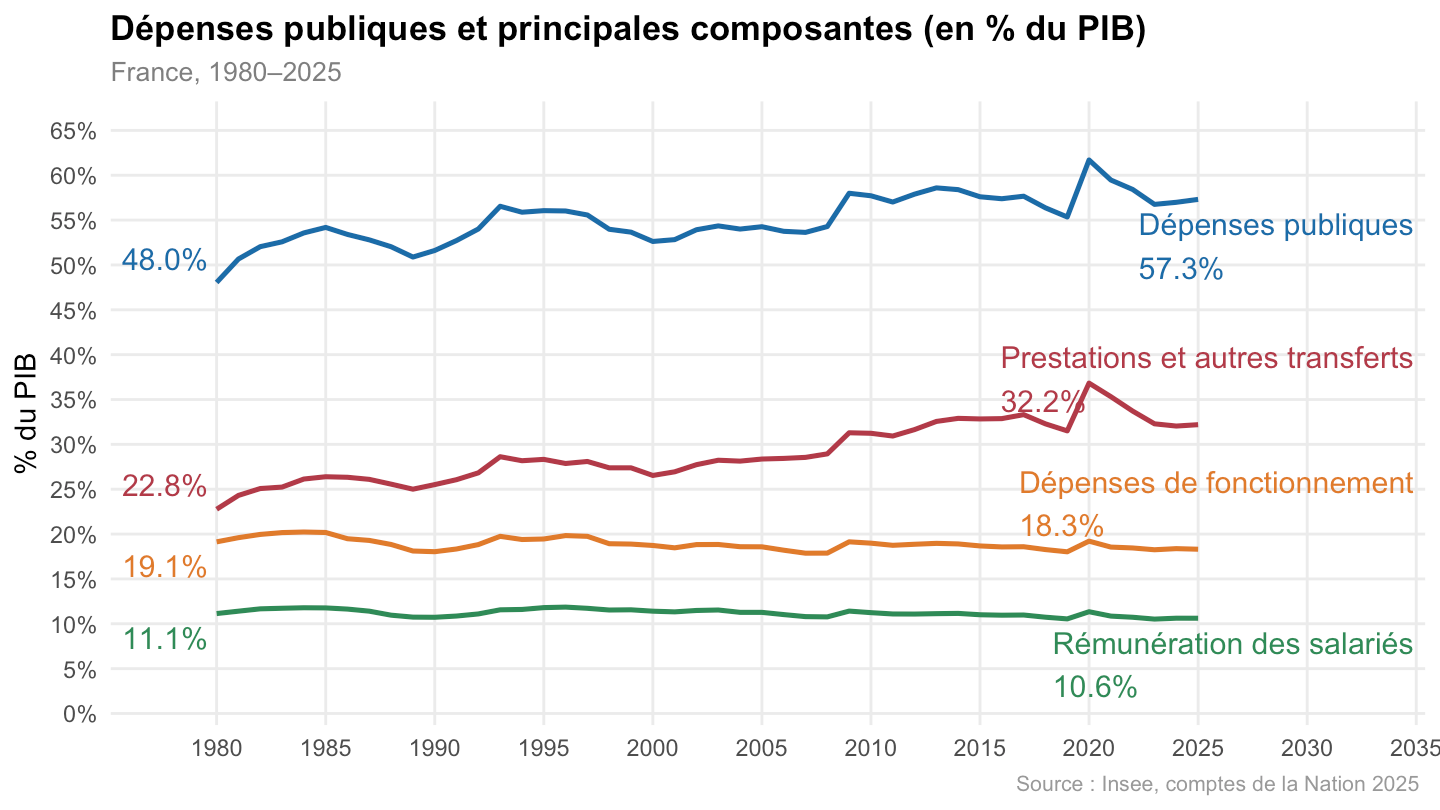
df <- t_3201 |>
  filter(line %in% c(3, 20, 1, 19, 9)) |>
  select(line, year, value) |>
  spread(line, value) |>
  transmute(
    year,
    `Dépenses publiques`               = `19`,
    `Prestations et autres transferts` = `9`,
    `Dépenses de fonctionnement`       = `1`,
    `Rémunération des salariés`        = `3` - `20`
  ) |>
  gather(Line, value, -year) |>
  year_to_date2() |>
  left_join(gdp, by = "date") |>
  filter(date >= as.Date("1980-01-01")) |>
  mutate(ratio = value / gdp)

# Labels début et fin
df_end <- df |>
  group_by(Line) |>
  filter(date == max(date)) |>
  ungroup()

df_start <- df |>
  group_by(Line) |>
  filter(date == min(date)) |>
  ungroup()

# Palette manuelle -- "Dépenses publiques" (le total) ressort en bleu,
# les trois composantes se distinguent chacune par une teinte propre
palette <- c(
  "Dépenses publiques"               = "#1B6CA8",
  "Prestations et autres transferts" = "#B23A48",
  "Dépenses de fonctionnement"       = "#E07B2A",
  "Rémunération des salariés"        = "#2E8B57"
)

ggplot(df, aes(x = date, y = ratio, color = Line)) +

  # Courbes
  geom_line(linewidth = 0.9) +

  # Labels fin de série
  geom_text_repel(
    data = df_end,
    aes(label = paste0(Line, "\n", percent(ratio, accuracy = 0.1))),
    size = 4,
    nudge_x = 365,
    direction = "y",
    hjust = 0,
    segment.size = 0.3,
    segment.color = "grey60",
    label.padding = unit(0.2, "lines"),
    box.padding   = unit(0.3, "lines"),
    show.legend   = FALSE,
    fontface = "plain"
  ) +

  # Labels début de série
  geom_text_repel(
    data = df_start,
    aes(label = percent(ratio, accuracy = 0.1)),
    size = 4,
    nudge_x = -400,
    direction = "y",
    hjust = 1,
    segment.size = 0.3,
    segment.color = "grey60",
    label.padding = unit(0.2, "lines"),
    box.padding   = unit(0.3, "lines"),
    show.legend   = FALSE,
    fontface = "plain"
  ) +

  scale_color_manual(values = palette) +
  scale_x_date(
    breaks = seq(1960, 2100, 5) |> paste0("-01-01") |> as.Date(),
    labels = date_format("%Y"),
    expand = expansion(mult = c(0.08, 0.20))
  ) +
  scale_y_continuous(
    breaks = seq(0, 0.65, by = 0.05),
    labels = percent_format(accuracy = 1),
    expand = expansion(mult = c(0.02, 0.05)),
    limits = c(0, 0.65)
  ) +

  labs(
    title    = "Dépenses publiques et principales composantes (en % du PIB)",
    subtitle = "France, 1980–2025",
    x = NULL,
    y = "% du PIB",
    caption  = "Source : Insee, comptes de la Nation 2025 "
  ) +

  theme_minimal(base_size = 11) +
  theme(
    legend.position  = "none",
    plot.title       = element_text(face = "bold", size = 13),
    plot.subtitle    = element_text(color = "grey50", size = 10),
    plot.caption     = element_text(color = "grey60", size = 8, hjust = 1),
    panel.grid.minor = element_blank(),
    panel.grid.major = element_line(color = "grey92"),
    axis.text.x      = element_text(angle = 0, hjust = 0.5)
  )
t_3201 |>
  filter(line %in% c(3, 20, 1, 19, 9)) |>
  select(line,year, value) |>
  spread(line, value) |>
  transmute(year,
            `Dépenses publiques` = `19`,
            `Prestations et autres transferts` = `9`,
            `Dépenses de fonctionnement` = `1`,
            `Rémunération des salariés -- sans cotisations sociales imputées` = `3`-`20`) |>
  gather(Line, value, -year) |>
  year_to_date2() |>
  left_join(gdp, by = "date") |>
  mutate(Line = gsub(" -- ", "\n", Line)) |>
  ggplot() + geom_line(aes(x = date, y = value / gdp, color = Line)) +
  theme_minimal() + xlab("") + ylab("% du PIB") +
  scale_x_date(breaks = seq(1960, 2100, 10) |> paste0("-01-01") |> as.Date(),
               labels = date_format("%Y")) +
  scale_y_continuous(breaks = 0.01*seq(0, 500, 5),
                labels = percent_format(accuracy = 1)) +

  theme(legend.position = "none",
        legend.title = element_blank()) +
  geom_label(data = . %>% filter(date %in% c(max(date), min(date))),
                  aes(x = date, y = value/gdp, label = percent(value / gdp, 0.1), color = Line),
                  fontface ="plain") +
  geom_label(data = . %>% filter(date %in% as.Date("1995-01-01")),
                  aes(x = date, y = value/gdp, label = Line, color = Line),
                  fontface ="plain")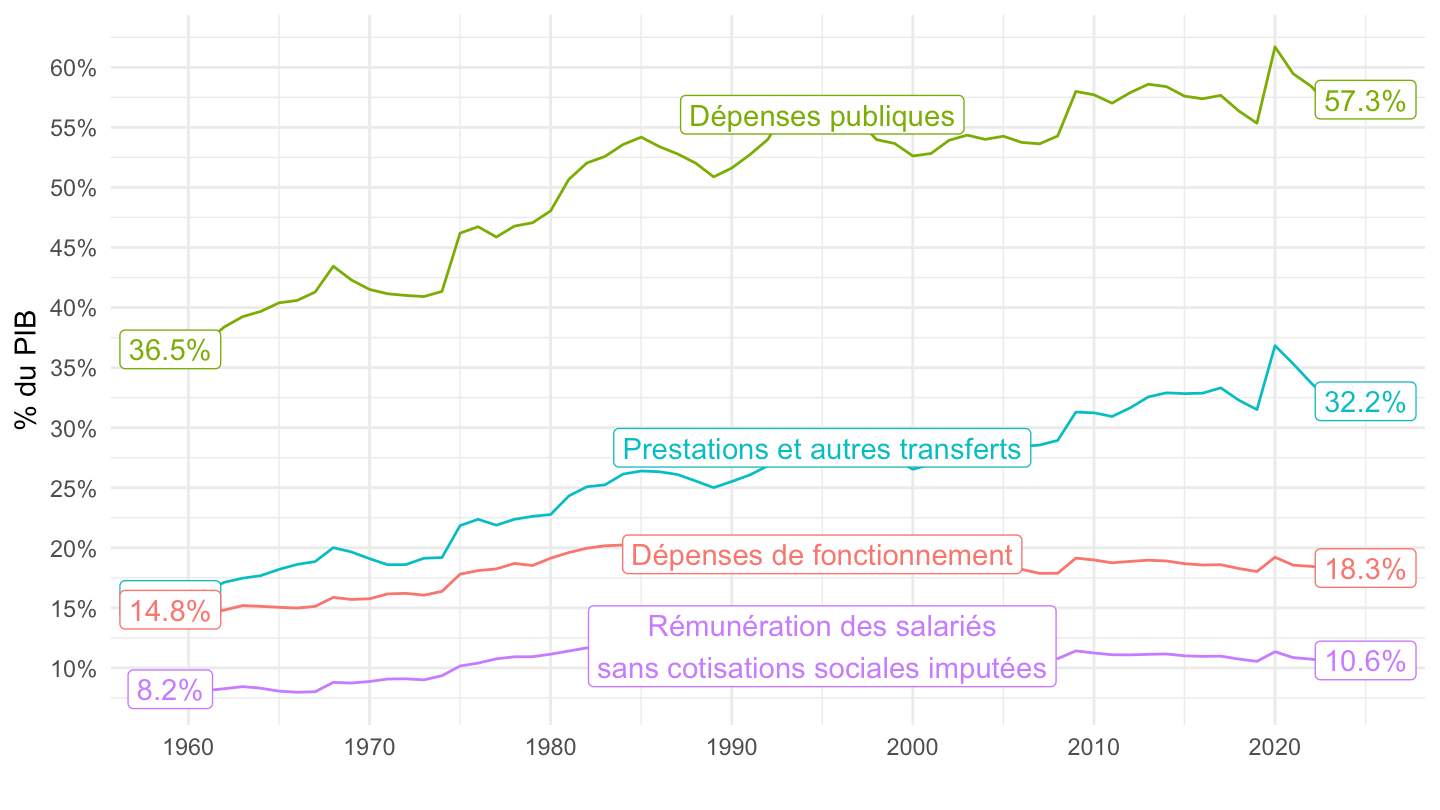
t_3201 |>
  filter(line %in% c(3, 20, 1, 19, 9)) |>
  select(line,year, value) |>
  spread(line, value) |>
  transmute(year,
            `Dépenses publiques` = `19`,
            `Prestations et autres transferts` = `9`,
            `Dépenses de fonctionnement` = `1`,
            `Rémunération des salariés -- sans cotisations sociales imputées` = `3`-`20`) |>
  gather(Line, value, -year) |>
  year_to_date2() |>
  left_join(gdp, by = "date") |>
  filter(date >= as.Date("1979-01-01")) |>
  ggplot() + geom_line(aes(x = date, y = value / gdp, color = Line)) +
  theme_minimal() + xlab("") + ylab("% du PIB") +
  scale_x_date(breaks = seq(1960, 2100, 5) |> paste0("-01-01") |> as.Date(),
               labels = date_format("%Y")) +
  scale_y_continuous(breaks = 0.01*seq(0, 500, 0.5),
                labels = percent_format(accuracy = .1)) +

  theme(legend.position = c(0.6, 0.5),
        legend.title = element_blank()) +
  geom_label(data = . %>% filter(date == max(date)),
                  aes(x = date, y = value/gdp, label = percent(value / gdp, 0.1), color = Line),
                  fontface ="plain")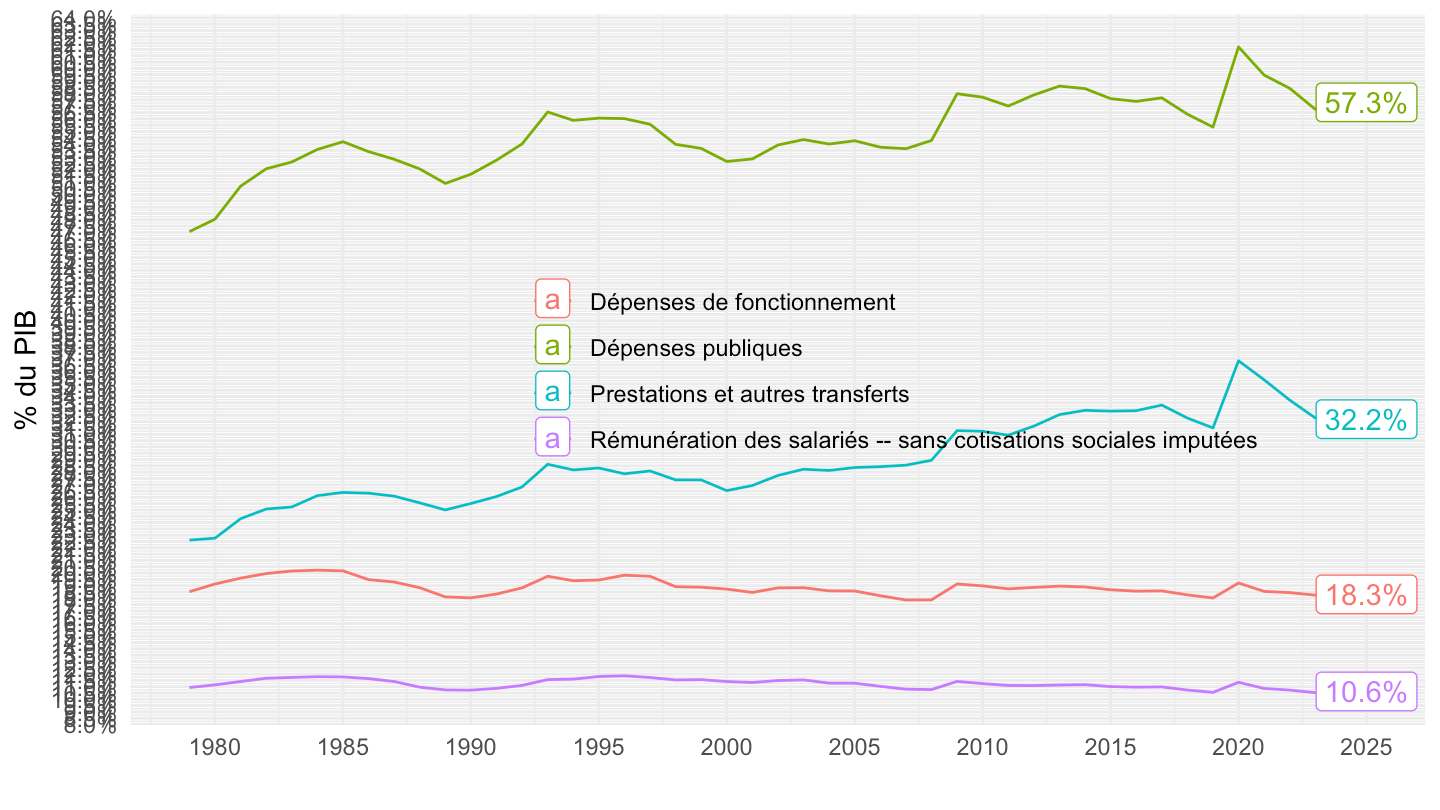
t_3201 |>
  filter(line %in% c(3, 20, 1, 19, 9)) |>
  select(line,year, value) |>
  spread(line, value) |>
  transmute(year,
            `Dépenses publiques` = `19`,
            `Prestations et autres transferts` = `9`,
            `Dépenses de fonctionnement` = `1`,
            `Rémunération des salariés -- sans cotisations sociales imputées` = `3`-`20`) |>
  gather(Line, value, -year) |>
  year_to_date2() |>
  left_join(gdp, by = "date") |>
  filter(date >= as.Date("1995-01-01")) |>
  ggplot() + geom_line(aes(x = date, y = value / gdp, color = Line)) +
  theme_minimal() + xlab("") + ylab("% du PIB") +
  scale_x_date(breaks = seq(1960, 2100, 5) |> paste0("-01-01") |> as.Date(),
               labels = date_format("%Y")) +
  scale_y_continuous(breaks = 0.01*seq(0, 500, 0.5),
                labels = percent_format(accuracy = .1)) +

  theme(legend.position = c(0.6, 0.5),
        legend.title = element_blank()) +
  geom_label(data = . %>% filter(date == max(date)),
                  aes(x = date, y = value/gdp, label = percent(value / gdp, 0.1), color = Line),
                  fontface ="plain")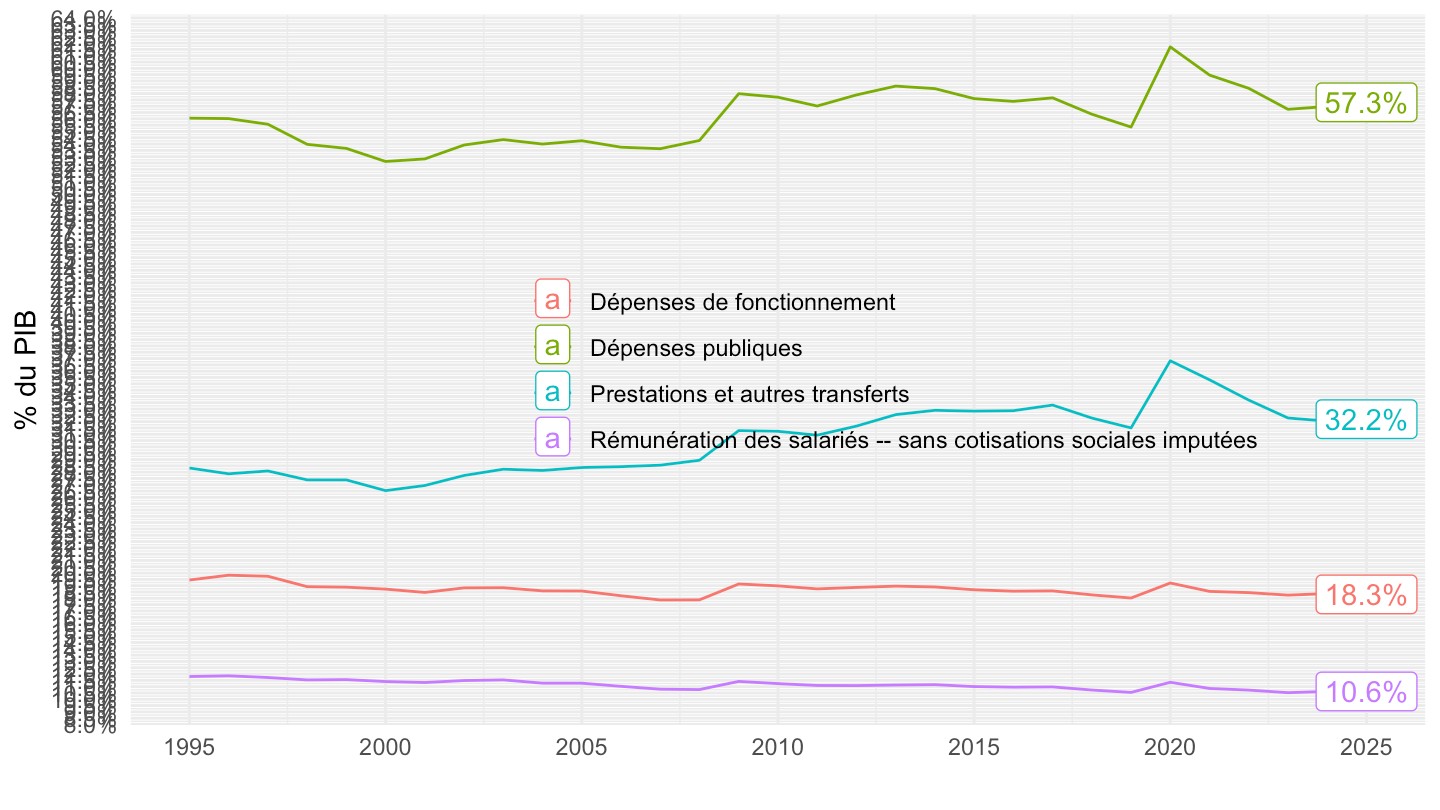
t_3201 |>
  filter(line %in% c(3, 20, 1, 19, 9)) |>
  select(line,year, value) |>
  spread(line, value) |>
  transmute(year,
            `Dépenses publiques` = `19`,
            `Prestations et autres transferts` = `9`,
            `Dépenses de fonctionnement` = `1`,
            `Rémunération des salariés -- sans cotisations sociales imputées` = `3`-`20`) |>
  gather(Line, value, -year) |>
  year_to_date2() |>
  left_join(gdp, by = "date") |>
  filter(date >= as.Date("1997-01-01")) |>
  ggplot() + geom_line(aes(x = date, y = value / gdp, color = Line)) +
  theme_minimal() + xlab("") + ylab("% du PIB") +
  scale_x_date(breaks = seq(1997, 2100, 2) |> paste0("-01-01") |> as.Date(),
               labels = date_format("%Y")) +
  scale_y_continuous(breaks = 0.01*seq(0, 500, 0.5),
                labels = percent_format(accuracy = .1)) +

  theme(legend.position = c(0.6, 0.5),
        legend.title = element_blank()) +
  geom_label(data = . %>% filter(date %in% c(max(date), min(date))),
                  aes(x = date, y = value/gdp, label = percent(value / gdp, 0.1), color = Line),
                  fontface ="plain")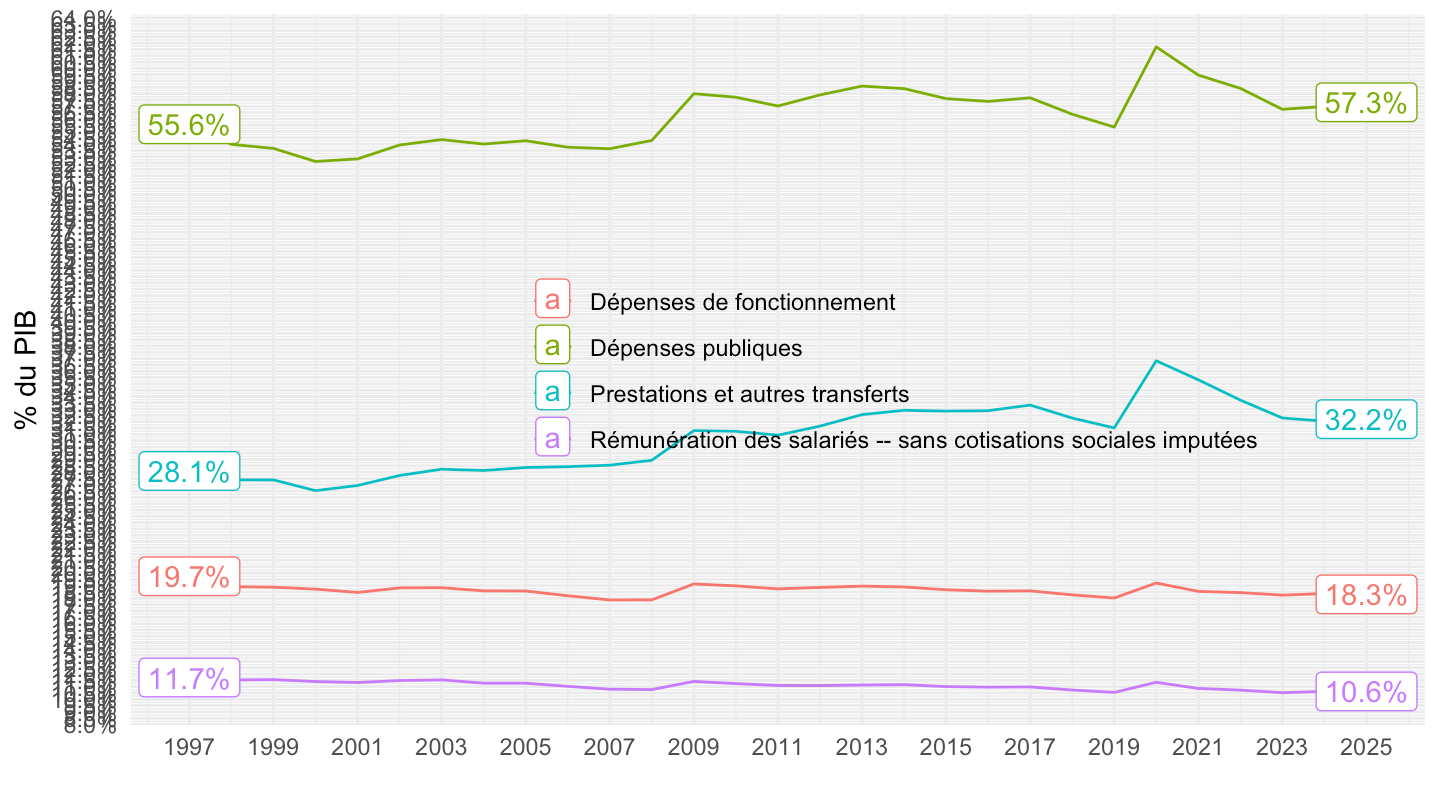
t_3201 |>
  filter(line %in% c(3, 20, 1, 19)) |>
  select(line,year, value) |>
  spread(line, value) |>
  transmute(year,
            `Dépenses publiques` = `19`,
            `Dépenses de fonctionnement` = `1`,
            `Rémunération des salariés -- sans cotisations sociales imputées` = `3`-`20`) |>
  gather(Line, value, -year) |>
  year_to_date2() |>
  left_join(gdp, by = "date") |>
  mutate(Line = gsub(" -- ", "\n", Line)) |>
  ggplot() + geom_line(aes(x = date, y = value / gdp, color = Line)) +
  theme_minimal() + xlab("") + ylab("% du PIB") +
  scale_x_date(breaks = seq(1960, 2100, 10) |> paste0("-01-01") |> as.Date(),
               labels = date_format("%Y")) +
  scale_y_continuous(breaks = 0.01*seq(0, 500, 5),
                labels = percent_format(accuracy = 1)) +

  theme(legend.position = "none",
        legend.title = element_blank()) +
  geom_label(data = . %>% filter(date %in% c(max(date), min(date))),
                  aes(x = date, y = value/gdp, label = percent(value / gdp, 0.1), color = Line),
                  fontface ="plain") +
  geom_label(data = . %>% filter(date %in% as.Date("1995-01-01")),
                  aes(x = date, y = value/gdp, label = Line, color = Line),
                  fontface ="plain")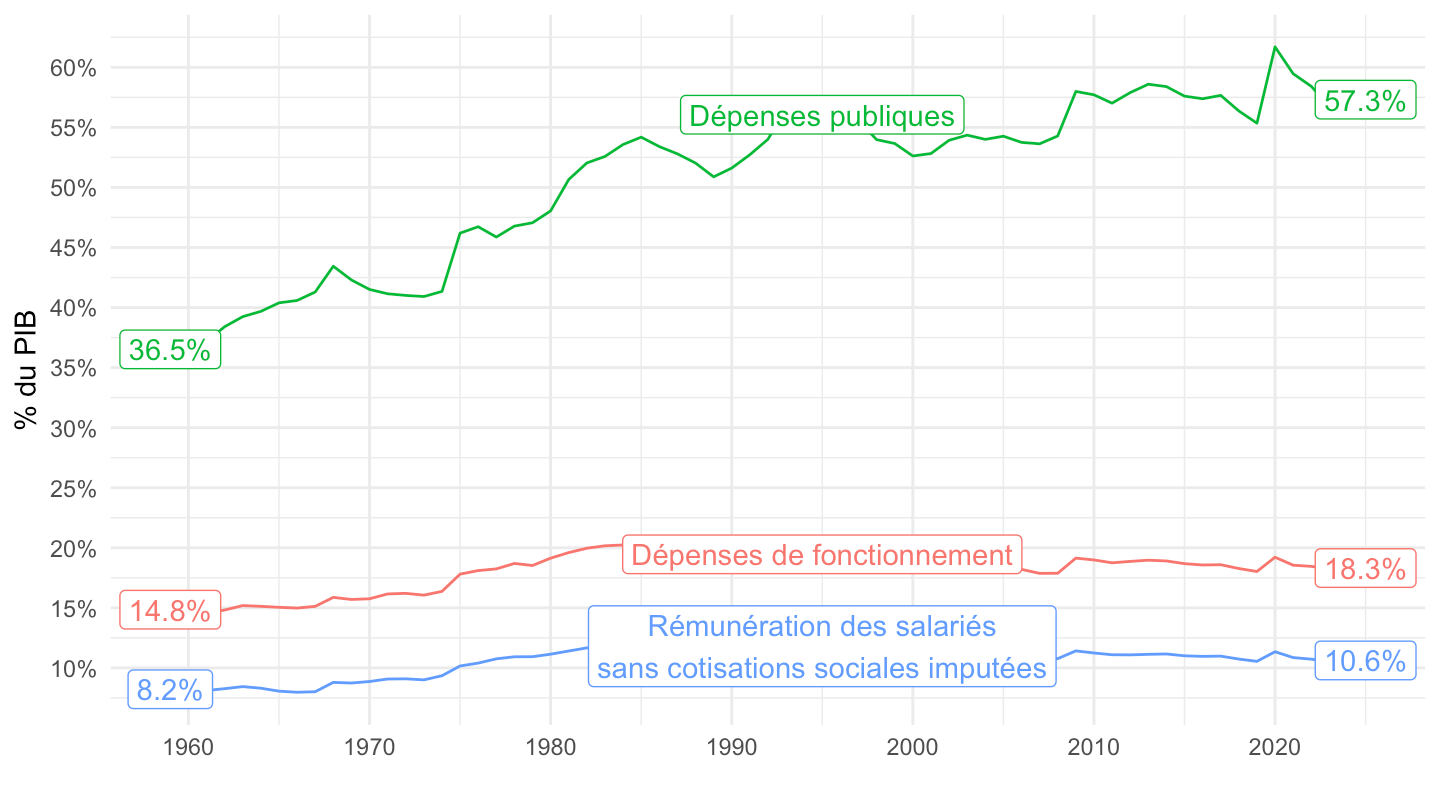
t_3201 |>
  filter(line %in% c(3, 20, 1, 19)) |>
  select(line,year, value) |>
  spread(line, value) |>
  transmute(year,
            `Dépenses publiques` = `19`,
            `Dépenses de fonctionnement` = `1`,
            `Rémunération des salariés -- sans cotisations sociales imputées` = `3`-`20`) |>
  gather(Line, value, -year) |>
  year_to_date2() |>
  left_join(gdp, by = "date") |>
  filter(date >= as.Date("1981-01-01")) |>
  mutate(Line = gsub(" -- ", "\n", Line)) |>
  ggplot() + geom_line(aes(x = date, y = value / gdp, color = Line)) +
  theme_minimal() + xlab("") + ylab("% du PIB") +
  scale_x_date(breaks = seq(1960, 2100, 10) |> paste0("-01-01") |> as.Date(),
               labels = date_format("%Y")) +
  scale_y_continuous(breaks = 0.01*seq(0, 500, 5),
                labels = percent_format(accuracy = 1)) +

  theme(legend.position = "none",
        legend.title = element_blank()) +
  geom_label(data = . %>% filter(date %in% c(max(date), min(date))),
                  aes(x = date, y = value/gdp, label = percent(value / gdp, 0.1), color = Line),
                  fontface ="plain") +
  geom_label(data = . %>% filter(date %in% as.Date("2000-01-01")),
                  aes(x = date, y = value/gdp, label = Line, color = Line),
                  fontface ="plain")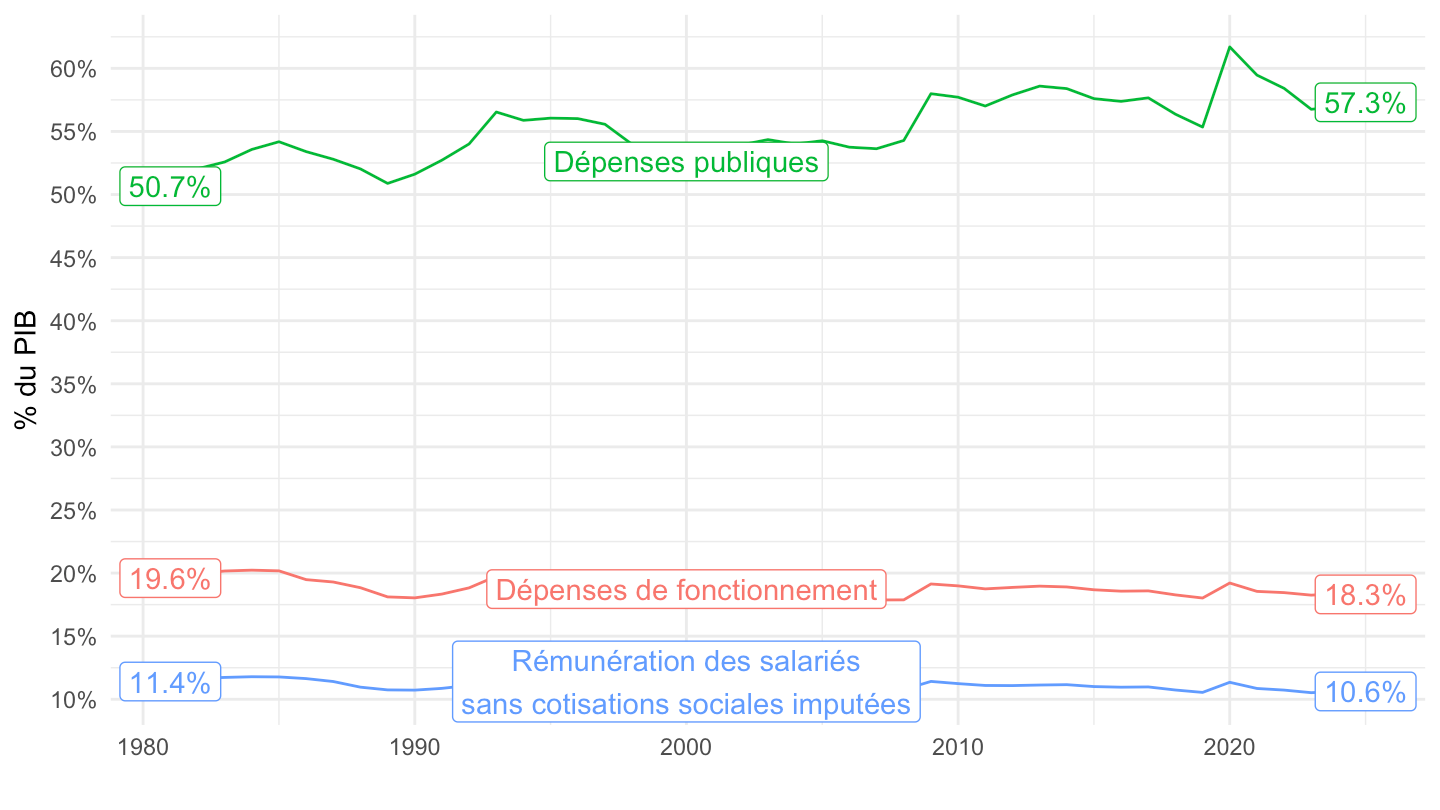
library(ggplot2)
library(scales)
library(ggrepel)

# Préparer les données
df <- t_3201 |>
  filter(line %in% c(3, 20, 1, 19)) |>
  select(line, year, value) |>
  spread(line, value) |>
  transmute(
    year,
    `Dépenses publiques`         = `19`,
    `Dépenses de fonctionnement` = `1`,
    `Rémunération des salariés`  = `3` - `20`
  ) |>
  gather(Line, value, -year) |>
  year_to_date2() |>
  left_join(gdp, by = "date") |>
  filter(date >= as.Date("1981-01-01")) |>
  mutate(ratio = value / gdp)

# Labels début et fin
df_end <- df |>
  group_by(Line) |>
  filter(date == max(date)) |>
  ungroup()

df_start <- df |>
  group_by(Line) |>
  filter(date == min(date)) |>
  ungroup()

# Palette manuelle
palette <- c(
  "Dépenses publiques"         = "#1B6CA8",
  "Dépenses de fonctionnement" = "#E07B2A",
  "Rémunération des salariés"  = "#2E8B57"
)

ggplot(df, aes(x = date, y = ratio, color = Line)) +

  # Repère crise 2008
  #geom_vline(xintercept = as.Date("2008-01-01"),
  #           linetype = "dashed", color = "grey60", linewidth = 0.4) +
  #annotate("text", x = as.Date("2008-06-01"), y = Inf,
  #         label = "2008", vjust = 1.5, hjust = 0,
  #         size = 3, color = "grey50") +

  # Courbes
  geom_line(linewidth = 0.9) +

  # Labels fin de série
  geom_text_repel(
    data = df_end,
    aes(label = paste0(Line, "\n", percent(ratio, accuracy = 0.1))),
    size = 2.8,
    nudge_x = 365,
    direction = "y",
    hjust = 0,
    segment.size = 0.3,
    segment.color = "grey60",
    label.padding = unit(0.2, "lines"),
    box.padding   = unit(0.3, "lines"),
    show.legend   = FALSE,
    fontface = "plain"
  ) +

  # Labels début de série
  geom_text_repel(
    data = df_start,
    aes(label = percent(ratio, accuracy = 0.1)),
    size = 2.8,
    nudge_x = -400,
    direction = "y",
    hjust = 1,
    segment.size = 0.3,
    segment.color = "grey60",
    label.padding = unit(0.2, "lines"),
    box.padding   = unit(0.3, "lines"),
    show.legend   = FALSE,
    fontface = "plain"
  ) +

  scale_color_manual(values = palette) +
  scale_x_date(
    breaks = seq(1960, 2100, 10) |> paste0("-01-01") |> as.Date(),
    labels = date_format("%Y"),
    expand = expansion(mult = c(0.08, 0.20))
  ) +
  scale_y_continuous(
    breaks = seq(0, 5, by = 0.05),
    labels = percent_format(accuracy = 1),
    expand = expansion(mult = c(0.02, 0.05)),
    limits = c(0, 0.65)
  ) +

  labs(
    title    = "Dépenses publiques, dépenses de fonctionnement\net rémunération des salariés (en % du PIB)",
    subtitle = "France, 1981–2024",
    x = NULL,
    y = "% du PIB",
    caption  = "Source : Insee, comptes nationaux"
  ) +

  theme_minimal(base_size = 11) +
  theme(
    legend.position  = "none",
    plot.title       = element_text(face = "bold", size = 13),
    plot.subtitle    = element_text(color = "grey50", size = 10),
    plot.caption     = element_text(color = "grey60", size = 8, hjust = 1),
    panel.grid.minor = element_blank(),
    panel.grid.major = element_line(color = "grey92"),
    axis.text.x      = element_text(angle = 0, hjust = 0.5)
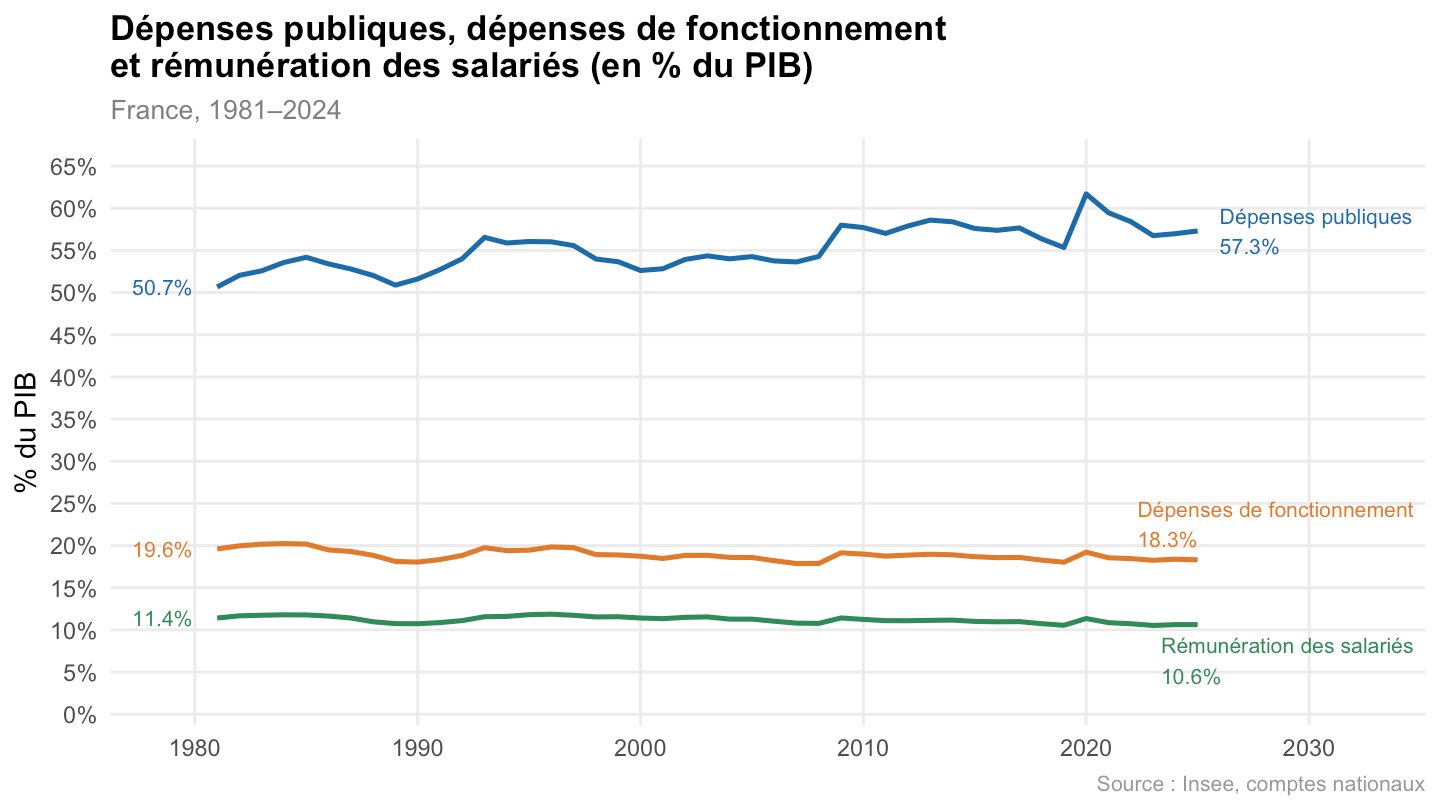
  )
t_3201 |>
  filter(line %in% c(3, 20, 1, 19)) |>
  select(line,year, value) |>
  spread(line, value) |>
  transmute(year,
            `Rémunération des salariés` = `3`,
            `Rémunération des salariés -- sans cotisations sociales imputées` = `3`-`20`) |>
  gather(Line, value, -year) |>
  year_to_date2() |>
  left_join(gdp, by = "date") |>
  filter(date >= as.Date("1979-01-01")) |>
  ggplot() + geom_line(aes(x = date, y = value / gdp, color = Line)) +
  theme_minimal() + xlab("") + ylab("% du PIB") +
  scale_x_date(breaks = seq(1960, 2100, 5) |> paste0("-01-01") |> as.Date(),
               labels = date_format("%Y")) +
  scale_y_continuous(breaks = 0.01*seq(0, 500, 0.5),
                labels = percent_format(accuracy = .1)) +

  theme(legend.position = c(0.6, 0.5),
        legend.title = element_blank()) +
  geom_label(data = . %>% filter(date == max(date)),
                  aes(x = date, y = value/gdp, label = percent(value / gdp, 0.1), color = Line),
                  fontface ="plain")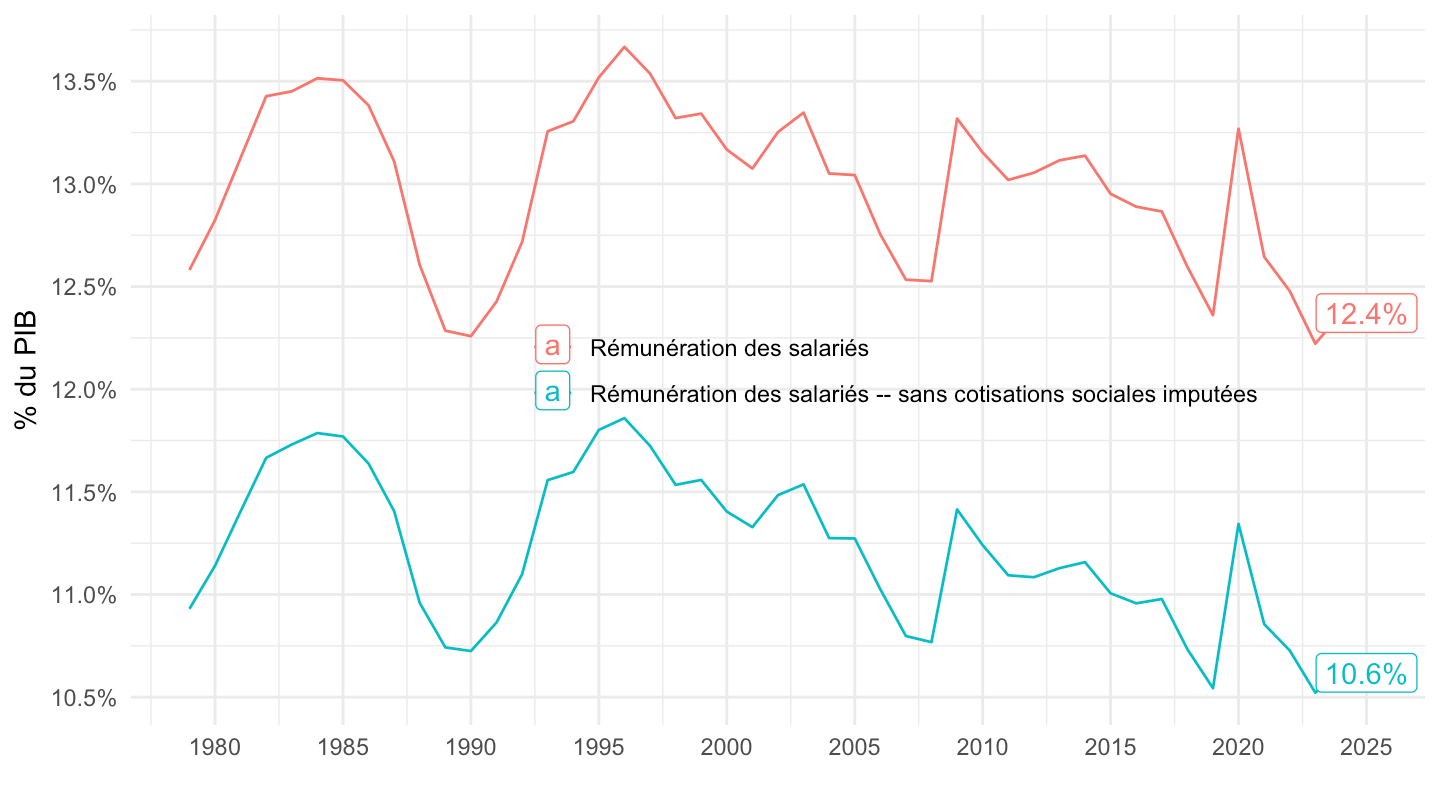
t_3201 |>
  filter(line %in% c(3, 20, 1, 19)) |>
  select(line,year, value) |>
  spread(line, value) |>
  transmute(year,
            `Rémunération des salariés` = `3`,
            `Rémunération des salariés -- sans cotisations sociales imputées` = `3`-`20`) |>
  gather(Line, value, -year) |>
  year_to_date2() |>
  left_join(gdp, by = "date") |>
  filter(date >= as.Date("1995-01-01")) |>
  ggplot() + geom_line(aes(x = date, y = value / gdp, color = Line)) +
  theme_minimal() + xlab("") + ylab("% du PIB") +
  scale_x_date(breaks = seq(1960, 2100, 5) |> paste0("-01-01") |> as.Date(),
               labels = date_format("%Y")) +
  scale_y_continuous(breaks = 0.01*seq(0, 500, 0.5),
                labels = percent_format(accuracy = .1)) +

  theme(legend.position = c(0.6, 0.5),
        legend.title = element_blank()) +
  geom_label(data = . %>% filter(date == max(date)),
                  aes(x = date, y = value/gdp, label = percent(value / gdp, 0.1), color = Line),
                  fontface ="plain")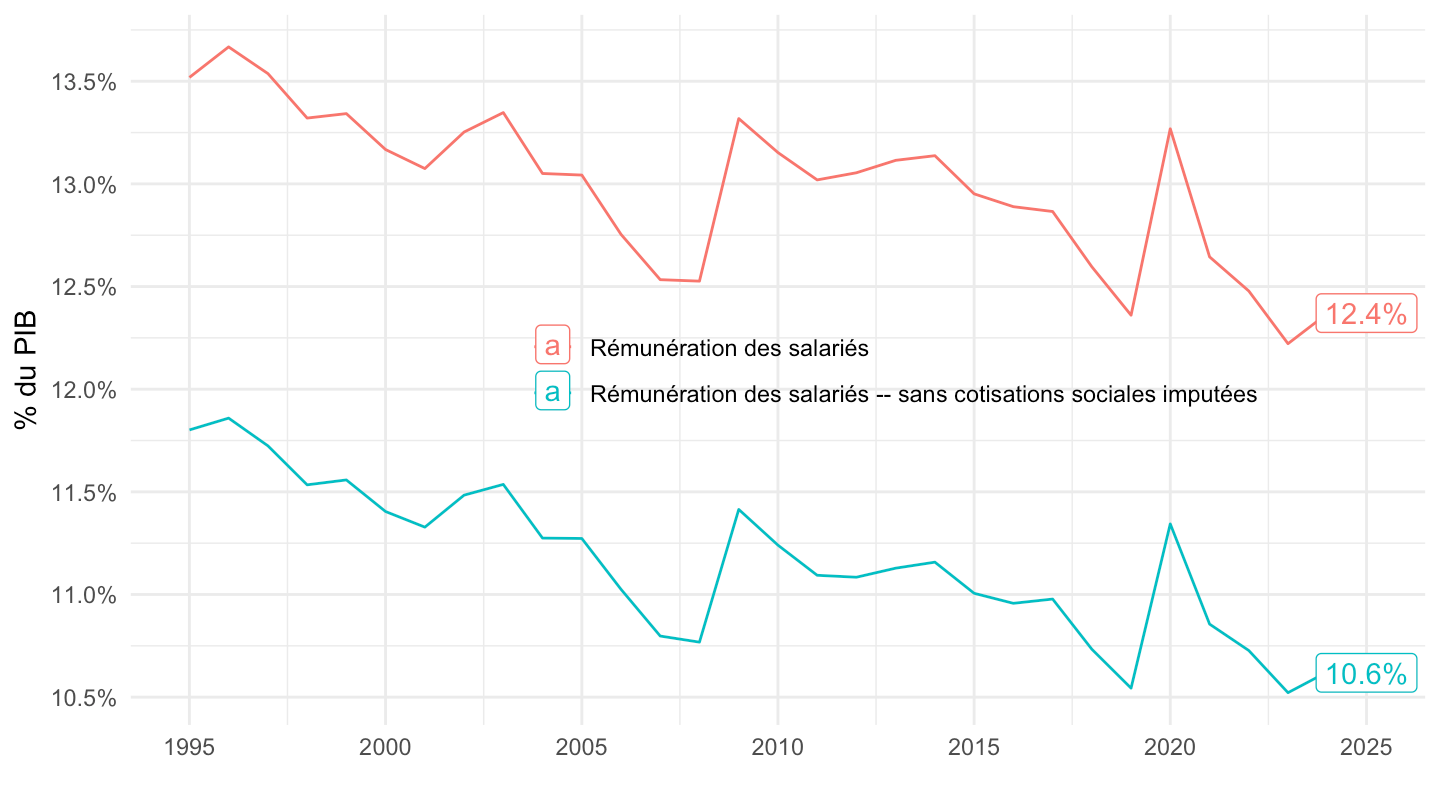
t_3201 |>
  filter(line %in% c(3, 20, 1, 19)) |>
  select(line,year, value) |>
  spread(line, value) |>
  transmute(year,
            `Rémunération des salariés` = `3`,
            `Rémunération des salariés -- sans cotisations sociales imputées` = `3`-`20`) |>
  gather(Line, value, -year) |>
  year_to_date2() |>
  left_join(gdp, by = "date") |>
  filter(date >= as.Date("1997-01-01")) |>
  ggplot() + geom_line(aes(x = date, y = value / gdp, color = Line)) +
  theme_minimal() + xlab("") + ylab("% du PIB") +
  scale_x_date(breaks = seq(1997, 2100, 2) |> paste0("-01-01") |> as.Date(),
               labels = date_format("%Y")) +
  scale_y_continuous(breaks = 0.01*seq(0, 500, 0.5),
                labels = percent_format(accuracy = .1)) +

  theme(legend.position = c(0.6, 0.5),
        legend.title = element_blank()) +
  geom_label(data = . %>% filter(date %in% c(max(date), min(date))),
                  aes(x = date, y = value/gdp, label = percent(value / gdp, 0.1), color = Line),
                  fontface ="plain")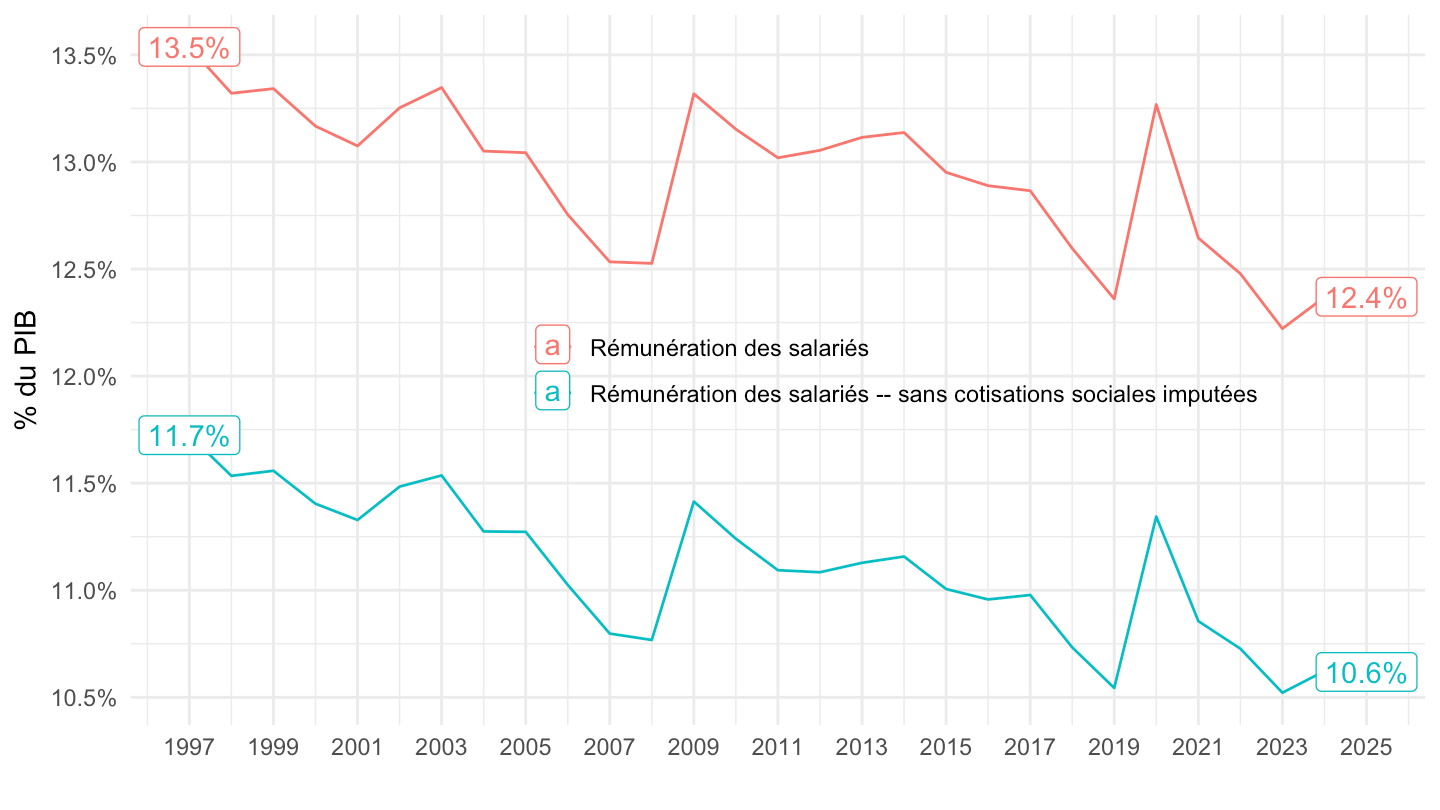
t_3201 |>
  filter(line %in% c(3, 20)) |>
  select(line,year, value) |>
  spread(line, value) |>
  transmute(year,
            `Rémunération des salariés` = `3`,
            `Rémunération des salariés -- sans cotisations sociales imputées` = `3`-`20`) |>
  gather(Line, value, -year) |>
  year_to_date2() |>
  left_join(gdp, by = "date") |>
  ggplot() + geom_line(aes(x = date, y = value / gdp, color = Line)) +
  theme_minimal() + xlab("") + ylab("% du PIB") +
  scale_x_date(breaks = seq(1960, 2100, 10) |> paste0("-01-01") |> as.Date(),
               labels = date_format("%Y")) +
  scale_y_continuous(breaks = 0.01*seq(0, 500, 1),
                labels = percent_format(accuracy = 1)) +

  theme(legend.position = c(0.75, 0.5),
        legend.title = element_blank())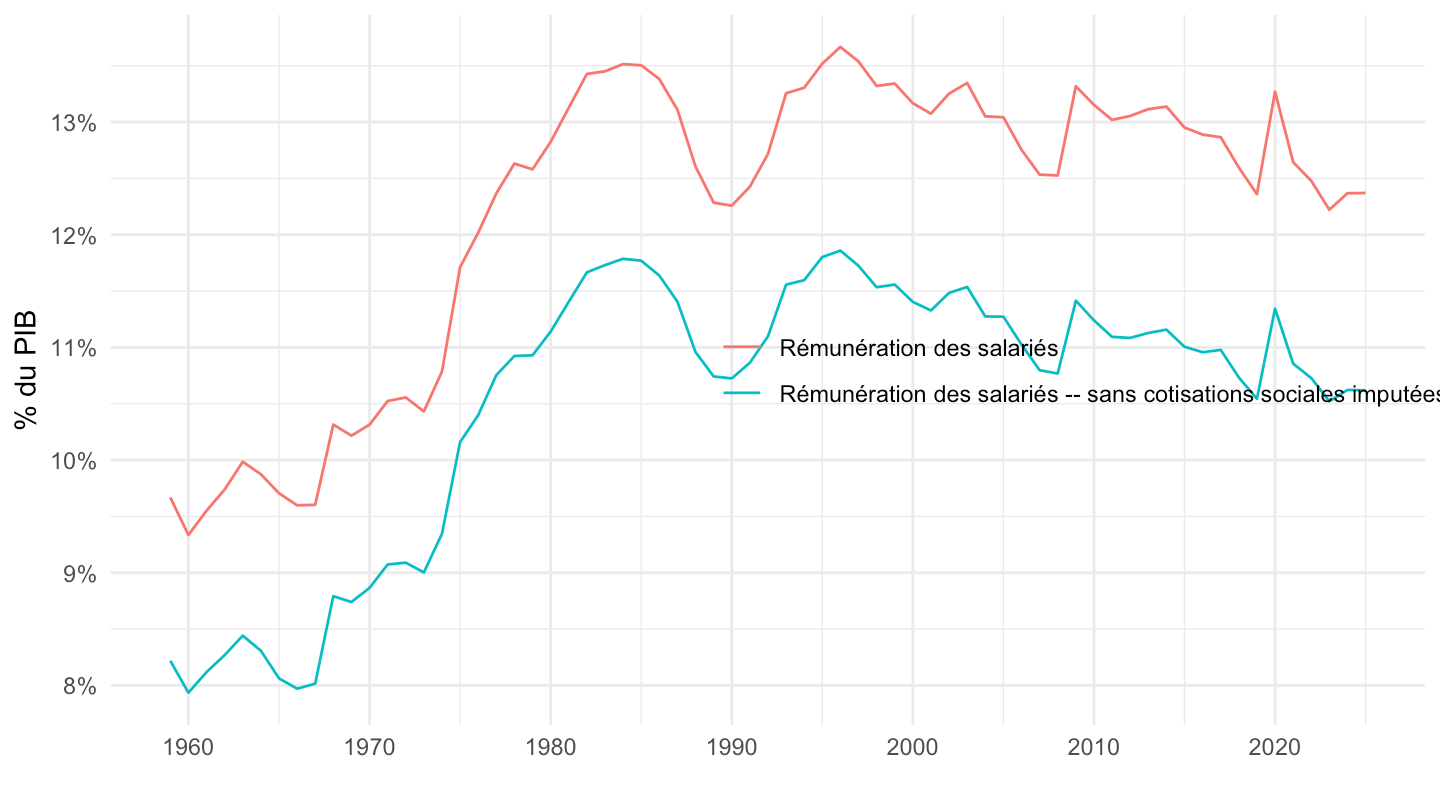
t_3201 |>
  filter(line %in% c(3, 20)) |>
  select(line,year, value) |>
  spread(line, value) |>
  transmute(year,
            `Rémunération des salariés` = `3`,
            `Rémunération des salariés -- sans cotisations sociales imputées` = `3`-`20`) |>
  gather(Line, value, -year) |>
  year_to_date2() |>
  left_join(gdp, by = "date") |>
  filter(date >= as.Date("1979-01-01")) |>
  ggplot() + geom_line(aes(x = date, y = value / gdp, color = Line)) +
  theme_minimal() + xlab("") + ylab("% du PIB") +
  scale_x_date(breaks = seq(1960, 2100, 5) |> paste0("-01-01") |> as.Date(),
               labels = date_format("%Y")) +
  scale_y_continuous(breaks = 0.01*seq(0, 500, 0.5),
                labels = percent_format(accuracy = .1)) +

  theme(legend.position = c(0.6, 0.5),
        legend.title = element_blank()) +
  geom_label(data = . %>% filter(date == max(date)),
                  aes(x = date, y = value/gdp, label = percent(value / gdp, 0.1), color = Line),
                  fontface ="plain")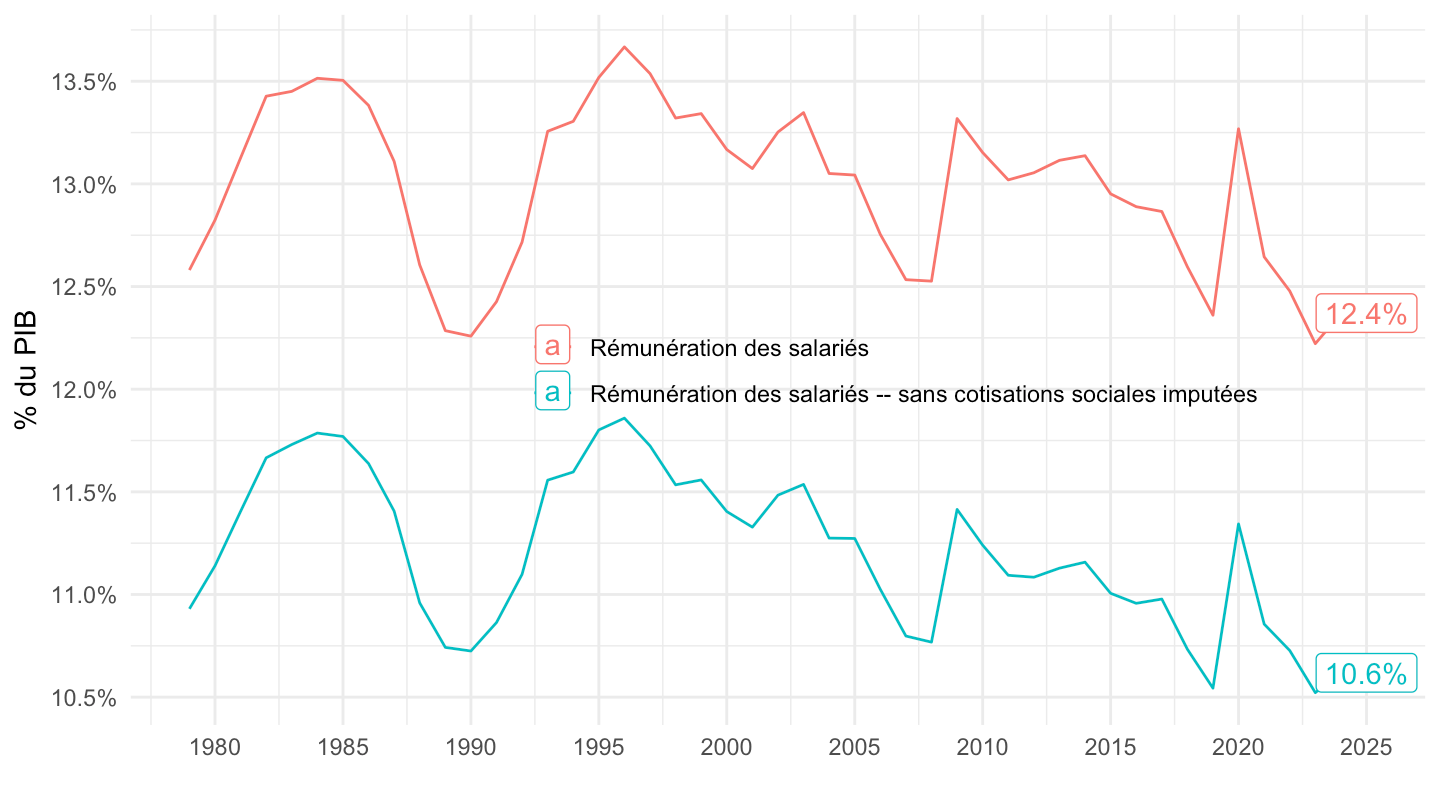
t_3201 |>
  filter(line %in% c(3, 20)) |>
  select(line,year, value) |>
  spread(line, value) |>
  transmute(year,
            `Rémunération des salariés` = `3`,
            `Rémunération des salariés -- sans cotisations sociales imputées` = `3`-`20`) |>
  gather(Line, value, -year) |>
  year_to_date2() |>
  left_join(gdp, by = "date") |>
  filter(date >= as.Date("1995-01-01")) |>
  ggplot() + geom_line(aes(x = date, y = value / gdp, color = Line)) +
  theme_minimal() + xlab("") + ylab("% du PIB") +
  scale_x_date(breaks = seq(1960, 2100, 5) |> paste0("-01-01") |> as.Date(),
               labels = date_format("%Y")) +
  scale_y_continuous(breaks = 0.01*seq(0, 500, 0.5),
                labels = percent_format(accuracy = .1)) +

  theme(legend.position = c(0.6, 0.5),
        legend.title = element_blank()) +
  geom_label(data = . %>% filter(date == max(date)),
                  aes(x = date, y = value/gdp, label = percent(value / gdp, 0.1), color = Line),
                  fontface ="plain")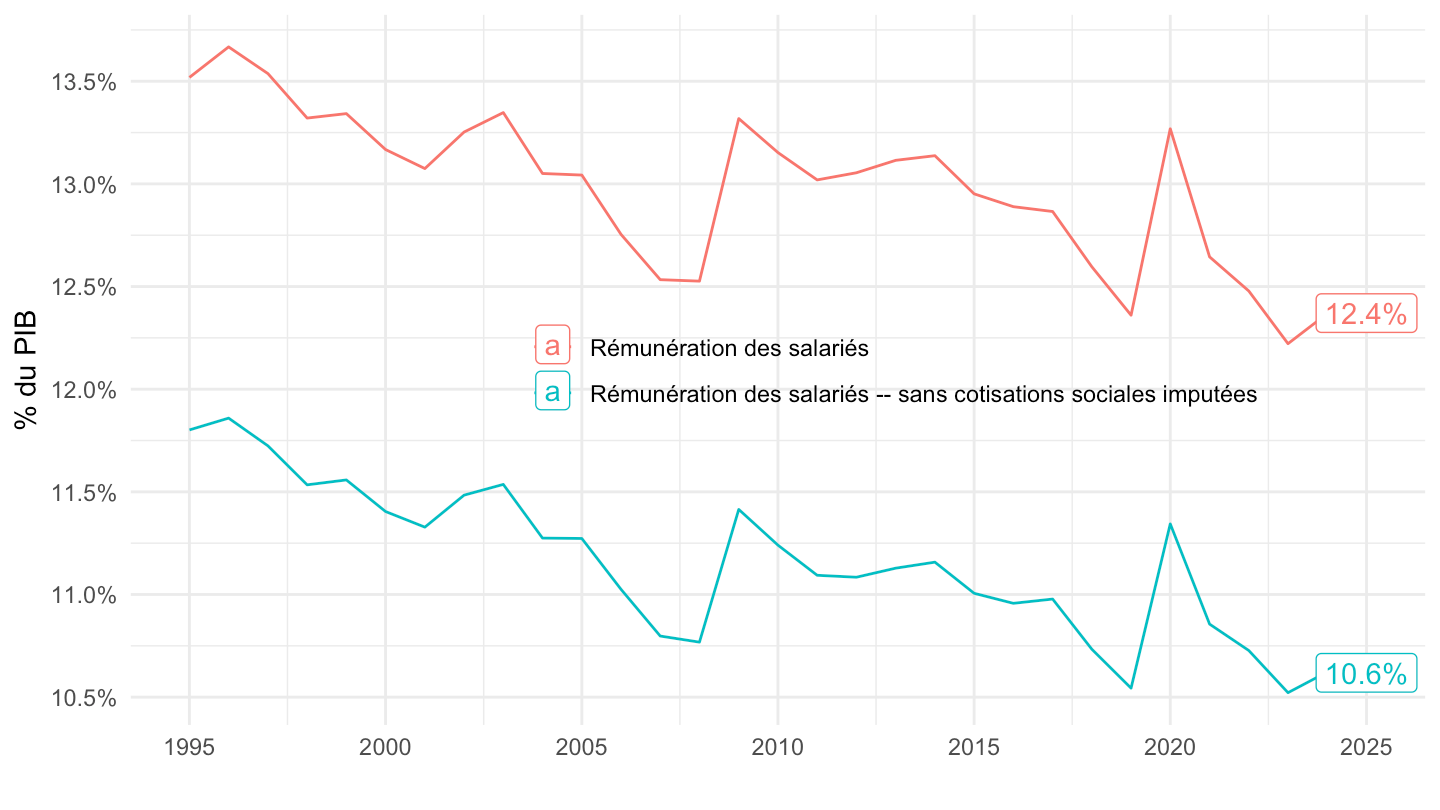
t_3201 |>
  filter(line %in% c(3, 20)) |>
  select(line,year, value) |>
  spread(line, value) |>
  transmute(year,
            `Rémunération des salariés` = `3`,
            `Rémunération des salariés -- sans cotisations sociales imputées` = `3`-`20`) |>
  gather(Line, value, -year) |>
  year_to_date2() |>
  left_join(gdp, by = "date") |>
  filter(date >= as.Date("1997-01-01")) |>
  ggplot() + geom_line(aes(x = date, y = value / gdp, color = Line)) +
  theme_minimal() + xlab("") + ylab("% du PIB") +
  scale_x_date(breaks = seq(1997, 2100, 2) |> paste0("-01-01") |> as.Date(),
               labels = date_format("%Y")) +
  scale_y_continuous(breaks = 0.01*seq(0, 500, 0.5),
                labels = percent_format(accuracy = .1)) +

  theme(legend.position = c(0.6, 0.5),
        legend.title = element_blank()) +
  geom_label(data = . %>% filter(date %in% c(max(date), min(date))),
                  aes(x = date, y = value/gdp, label = percent(value / gdp, 0.1), color = Line),
                  fontface ="plain")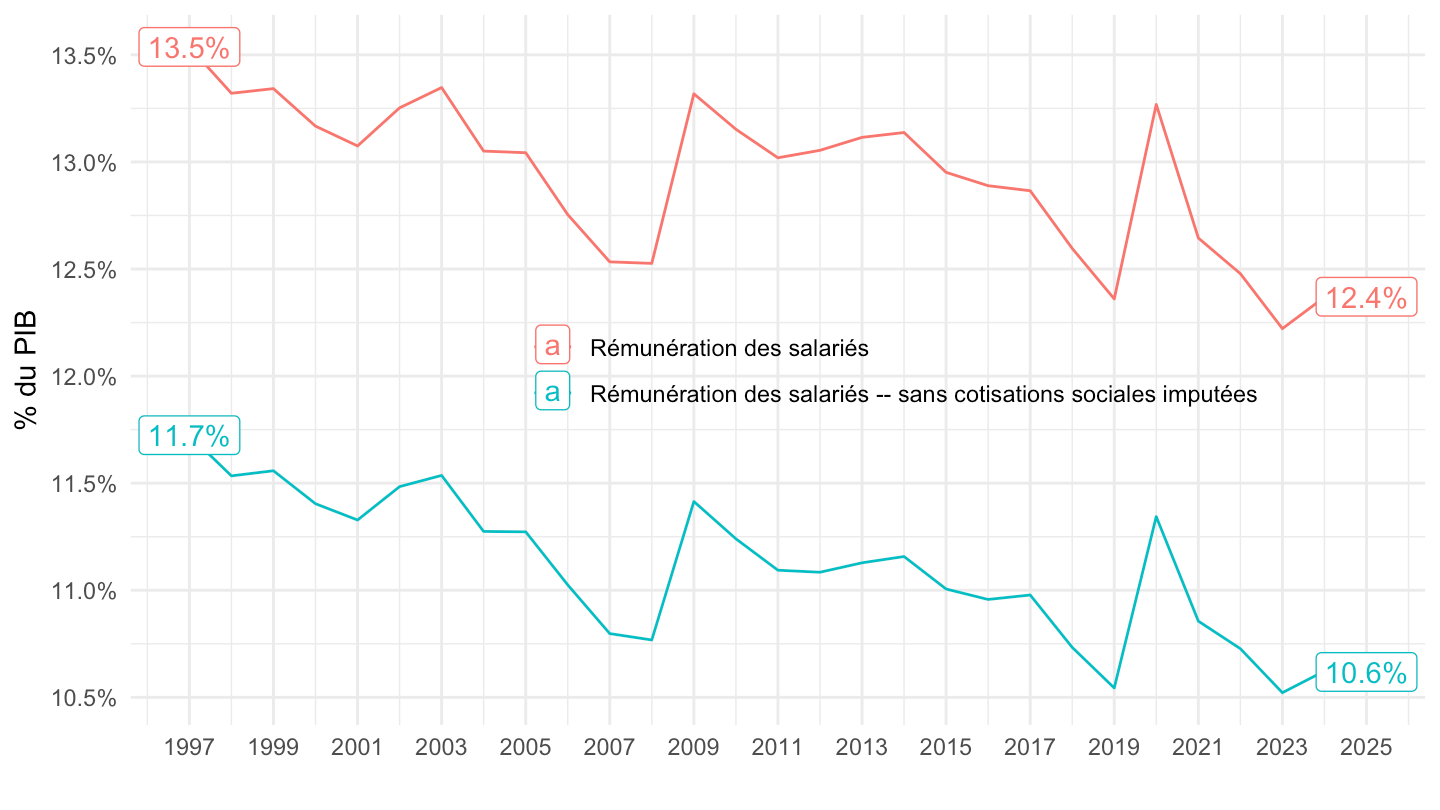
t_3201 |>
  filter(line %in% c(1, 19)) |>
  year_to_date2() |>
  left_join(gdp, by = "date") |>
  ggplot() + geom_line(aes(x = date, y = value / gdp, color = Line)) +
  theme_minimal() + xlab("") + ylab("% du PIB") +
  scale_x_date(breaks = seq(1960, 2100, 10) |> paste0("-01-01") |> as.Date(),
               labels = date_format("%Y")) +
  scale_y_continuous(breaks = 0.01*seq(0, 500, 5),
                labels = percent_format(accuracy = 1)) +

  theme(legend.position = c(0.75, 0.5),
        legend.title = element_blank())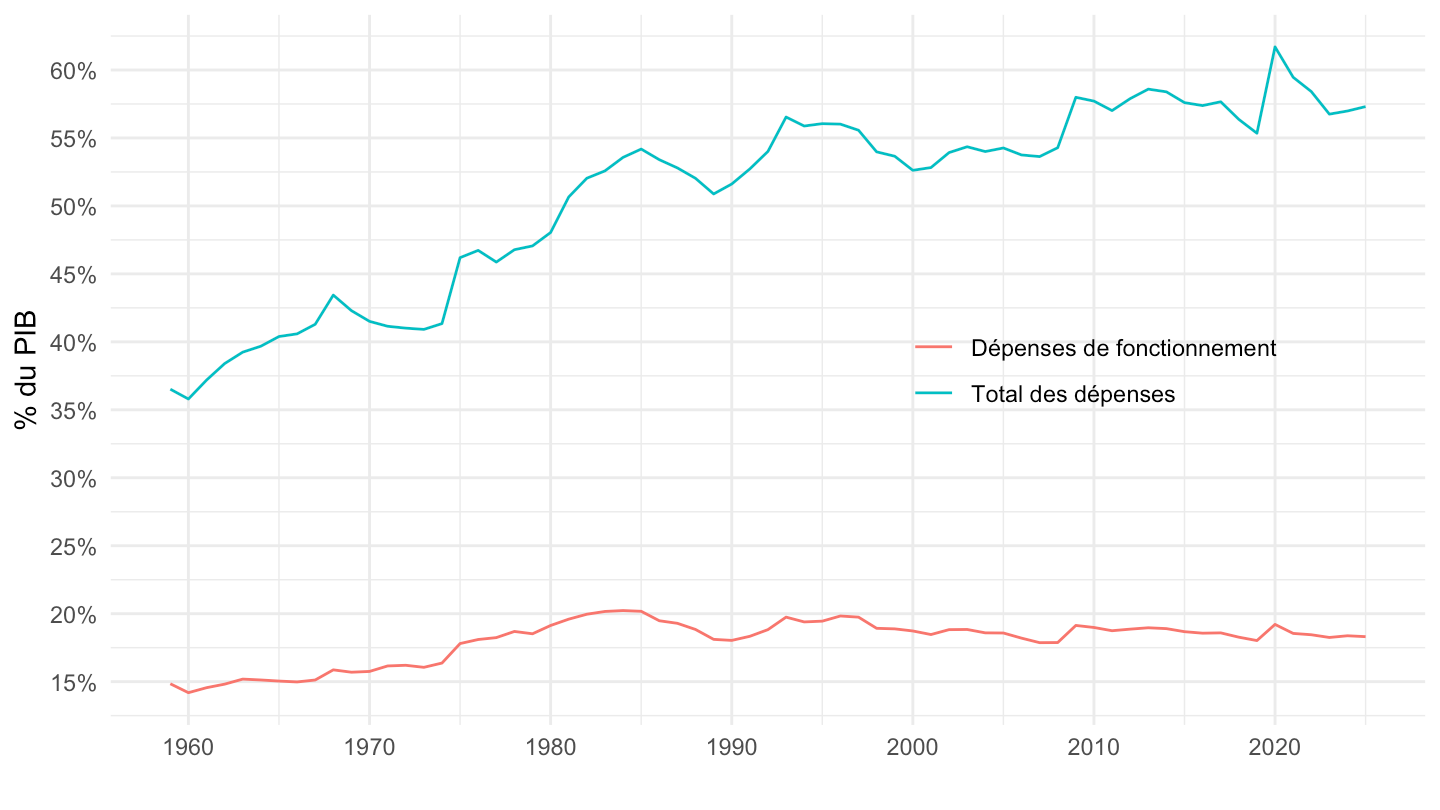
t_3201 |>
  filter(line %in% c(1, 19)) |>
  year_to_date2() |>
  left_join(gdp, by = "date") |>
  filter(date >= as.Date("1978-01-01")) |>
  ggplot() + geom_line(aes(x = date, y = value / gdp, color = Line)) +
  theme_minimal() + xlab("") + ylab("% du PIB") +
  scale_x_date(breaks = seq(1960, 2100, 10) |> paste0("-01-01") |> as.Date(),
               labels = date_format("%Y")) +
  scale_y_continuous(breaks = 0.01*seq(0, 500, 5),
                labels = percent_format(accuracy = 1)) +

  theme(legend.position = c(0.75, 0.5),
        legend.title = element_blank())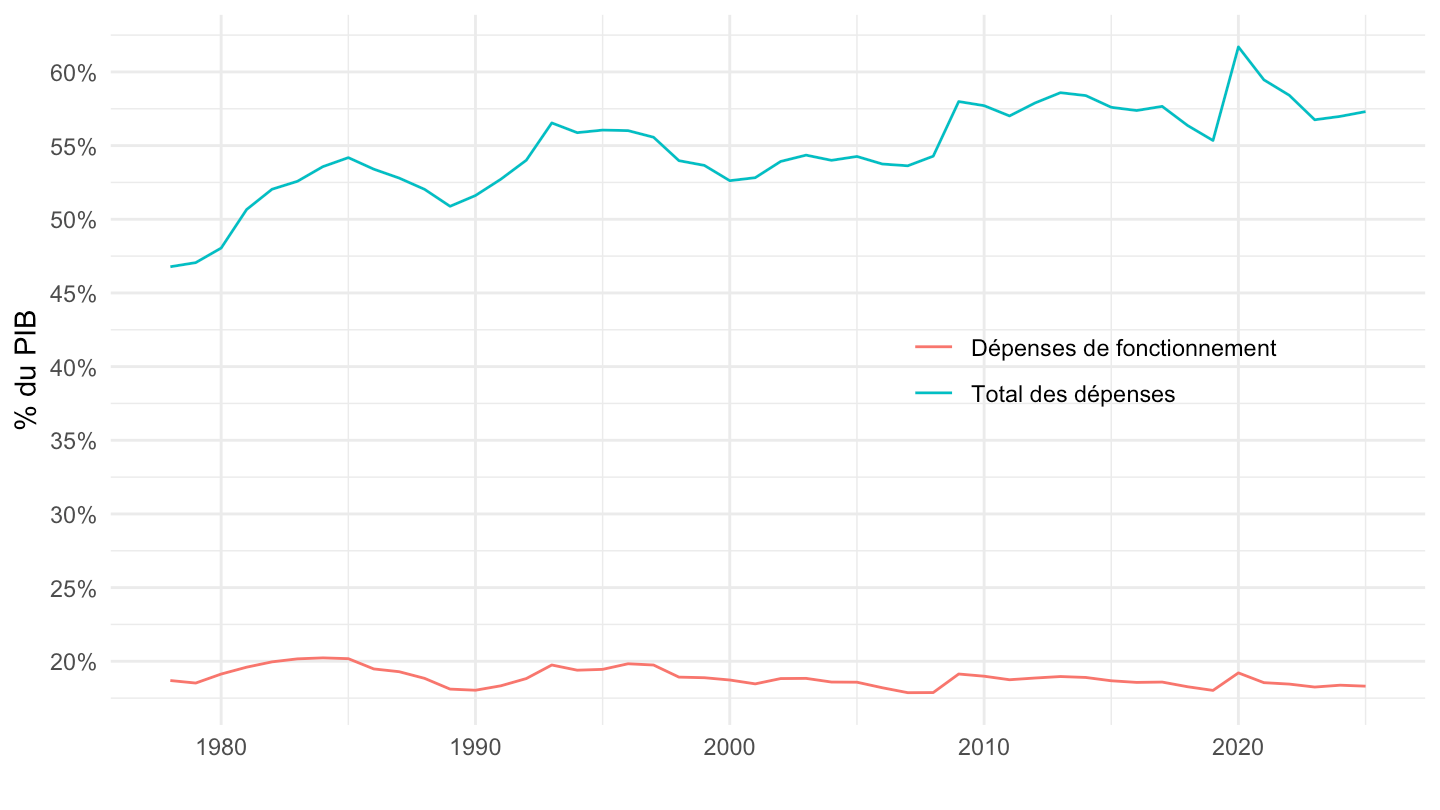
t_3201 |>
  filter(line %in% c(1, 19)) |>
  year_to_date2() |>
  left_join(gdp, by = "date") |>
  filter(date >= as.Date("1995-01-01")) |>
  ggplot() + geom_line(aes(x = date, y = value / gdp, color = Line)) +
  theme_minimal() + xlab("") + ylab("% du PIB") +
  scale_x_date(breaks = seq(1960, 2100, 5) |> paste0("-01-01") |> as.Date(),
               labels = date_format("%Y")) +
  scale_y_continuous(breaks = 0.01*seq(0, 500, 5),
                labels = percent_format(accuracy = 1)) +

  theme(legend.position = c(0.75, 0.5),
        legend.title = element_blank())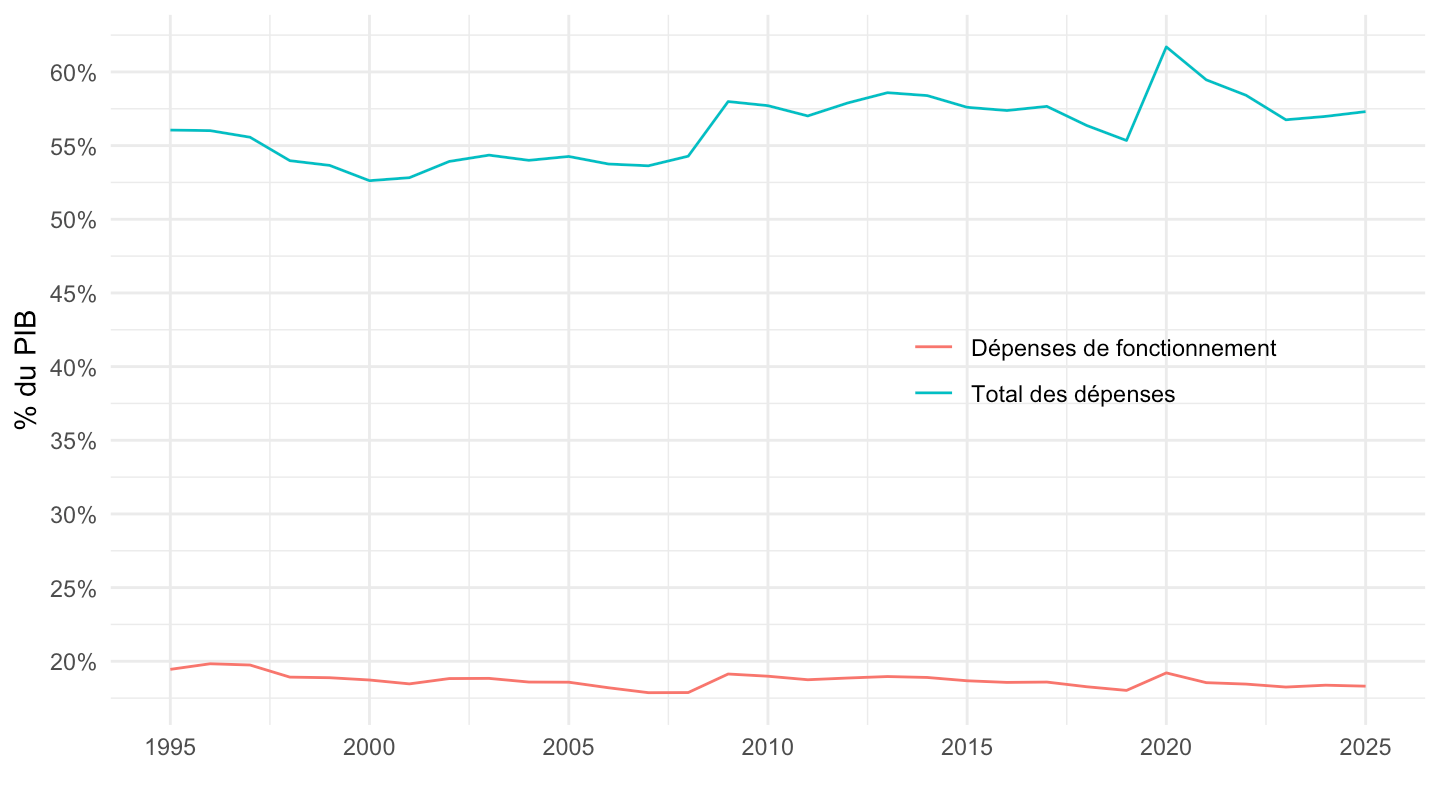
t_3201 |>
  filter(line %in% c(1, 20)) |>
  select(line,year, value) |>
  spread(line, value) |>
  transmute(year,
            `Dépenses de fonctionnement ` = `1`,
            `Dépenses de fonctionnement  -- sans cotisations sociales imputées` = `1`-`20`) |>
  gather(Line, value, -year) |>
  year_to_date2() |>
  left_join(gdp, by = "date") |>
  filter(date >= as.Date("1995-01-01")) |>
  ggplot() + geom_line(aes(x = date, y = value / gdp, color = Line)) +
  theme_minimal() + xlab("") + ylab("% du PIB") +
  scale_x_date(breaks = seq(1960, 2100, 5) |> paste0("-01-01") |> as.Date(),
               labels = date_format("%Y")) +
  scale_y_continuous(breaks = 0.01*seq(0, 500, 0.5),
                labels = percent_format(accuracy = .1)) +

  theme(legend.position = c(0.6, 0.5),
        legend.title = element_blank()) +
  geom_label(data = . %>% filter(date == max(date)),
                  aes(x = date, y = value/gdp, label = percent(value / gdp, 0.1), color = Line),
                  fontface ="plain")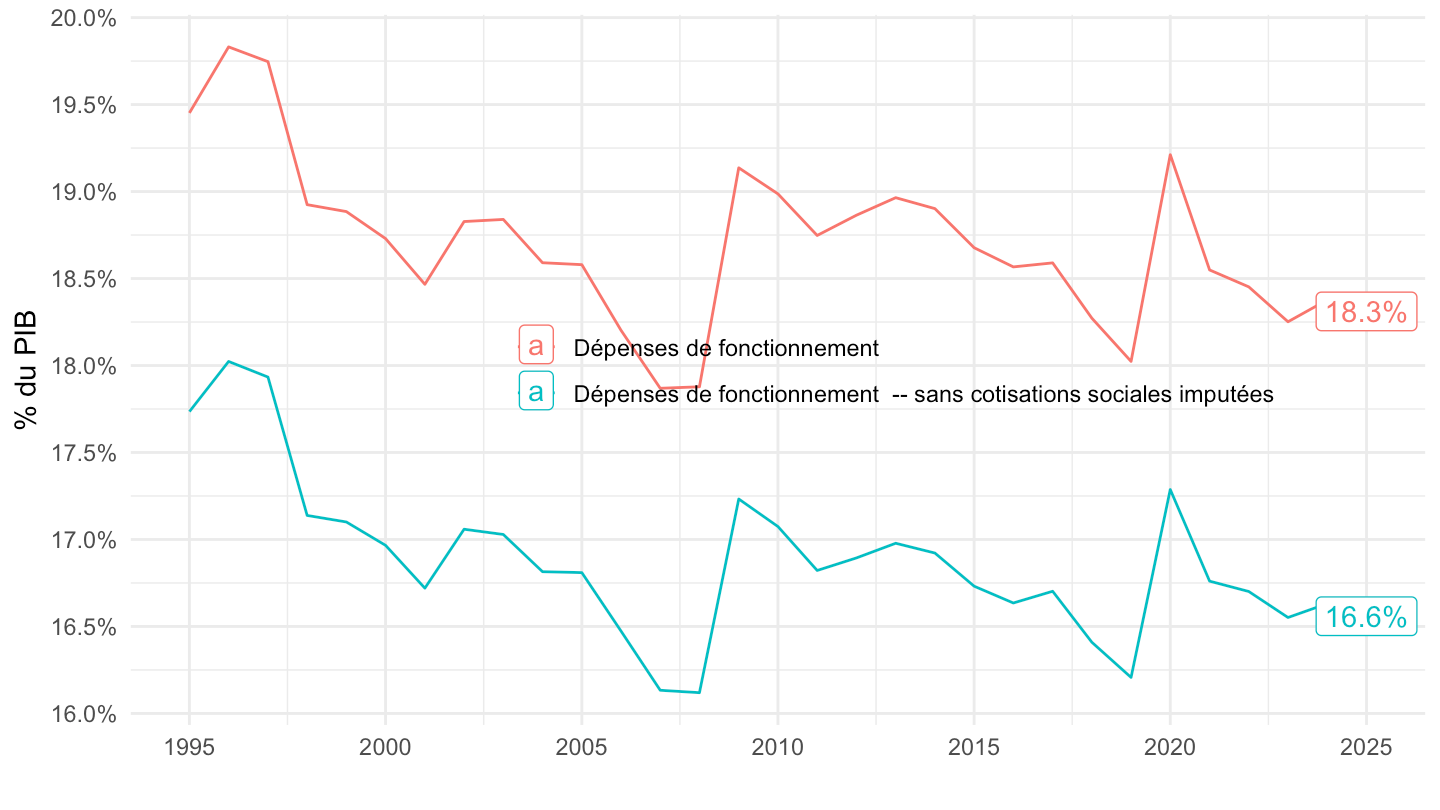
t_3201 |>
  filter(line %in% c(1)) |>
  year_to_date2() |>
  left_join(gdp, by = "date") |>
  ggplot() + geom_line(aes(x = date, y = value / gdp)) +
  theme_minimal() + xlab("") + ylab("Dépenses de fonctionnement (% du PIB)") +
  scale_x_date(breaks = seq(1960, 2100, 10) |> paste0("-01-01") |> as.Date(),
               labels = date_format("%Y")) +
  scale_y_continuous(breaks = 0.01*seq(0, 500, 1),
                labels = percent_format(accuracy = 1)) +

  theme(legend.position = c(0.75, 0.15),
        legend.title = element_blank())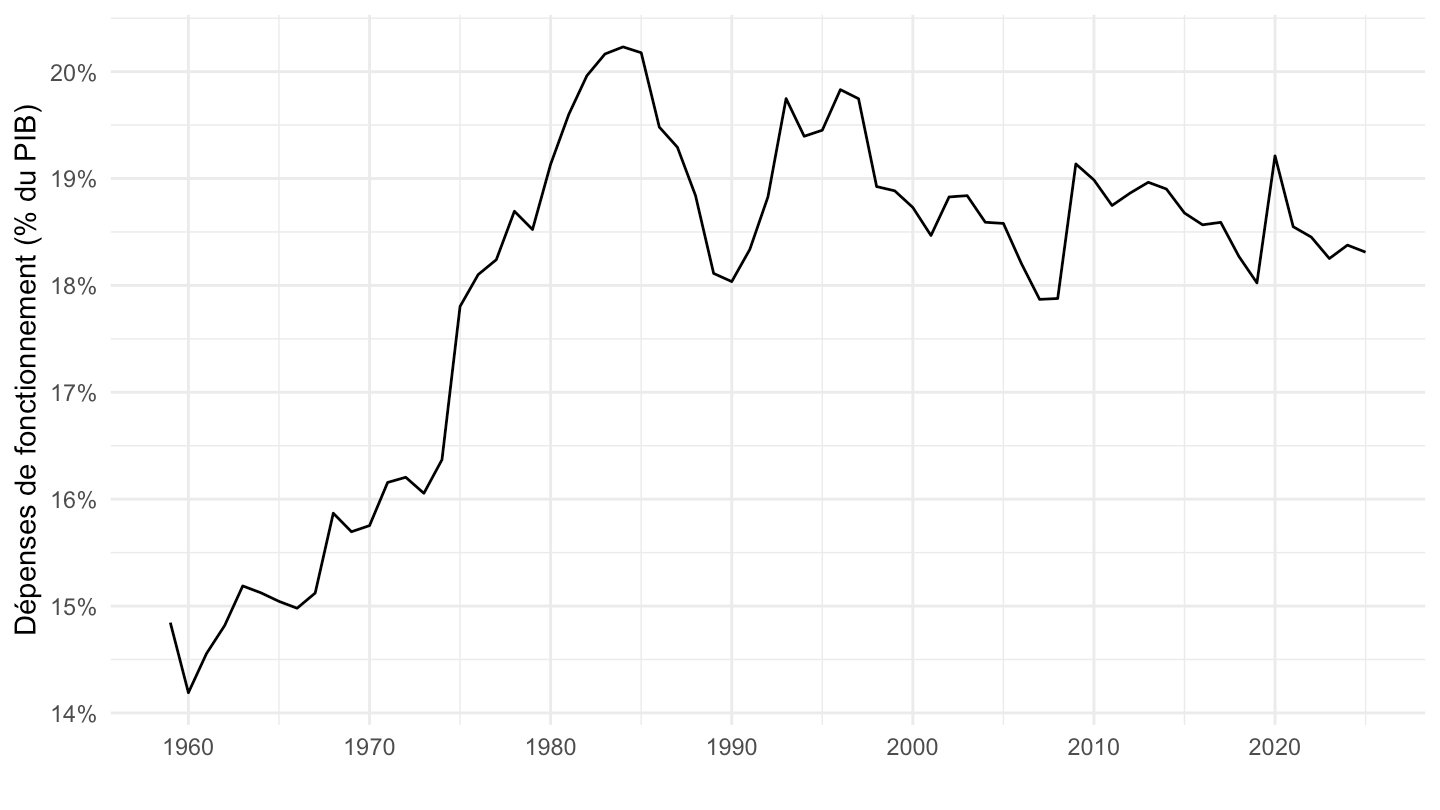
t_3201 |>
  filter(line %in% c(1)) |>
  year_to_date2() |>
  left_join(gdp, by = "date") |>
  filter(date >= as.Date("1979-01-01")) |>
  ggplot() + geom_line(aes(x = date, y = value / gdp)) +
  theme_minimal() + xlab("") + ylab("Dépenses de fonctionnement (% du PIB)") +
  scale_x_date(breaks = seq(1960, 2100, 5) |> paste0("-01-01") |> as.Date(),
               labels = date_format("%Y")) +
  scale_y_continuous(breaks = 0.01*seq(0, 500, 1),
                labels = percent_format(accuracy = 1)) +

  theme(legend.position = c(0.75, 0.15),
        legend.title = element_blank())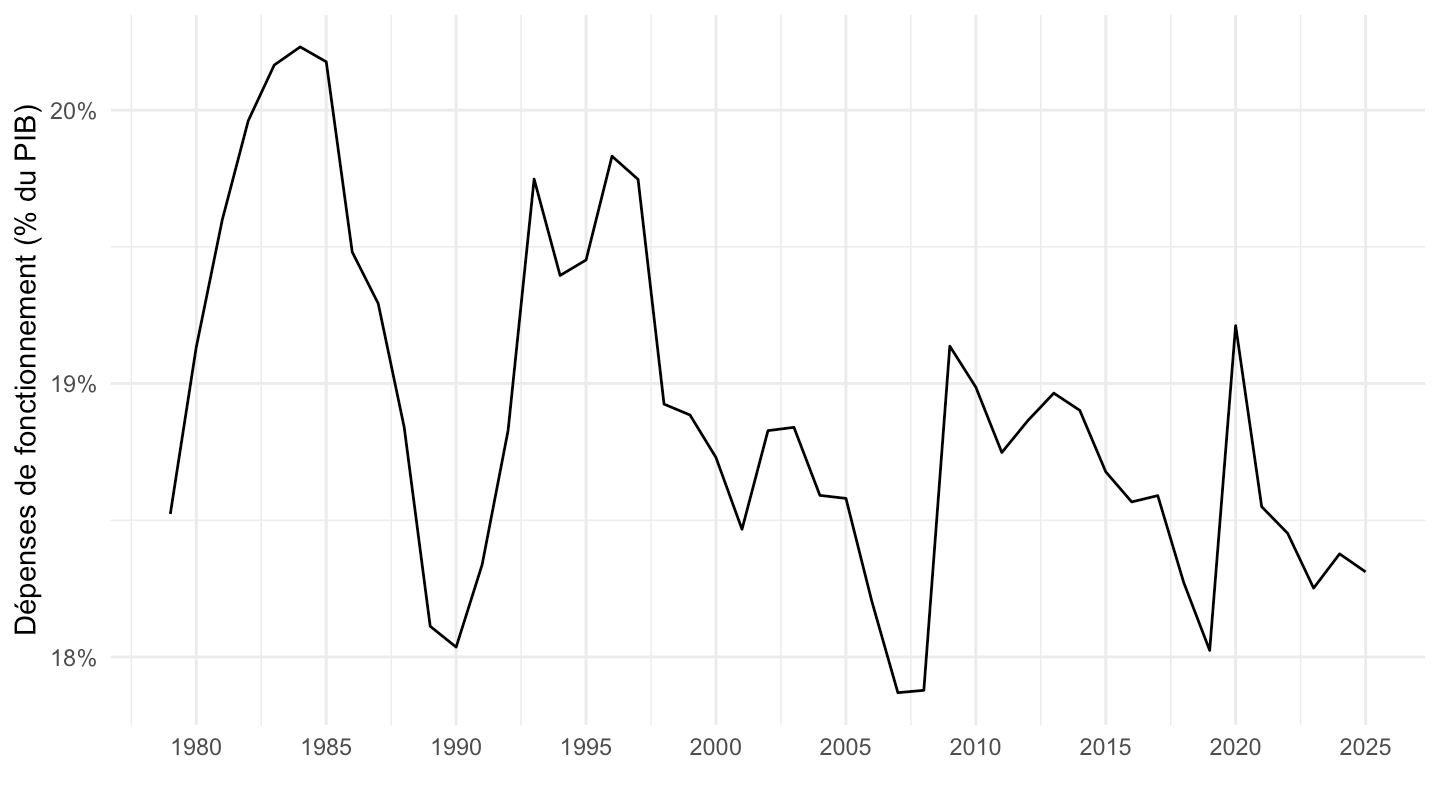
t_3201 |>
  filter(line %in% c(19)) |>
  year_to_date2() |>
  left_join(gdp, by = "date") |>
  ggplot() + geom_line(aes(x = date, y = value / gdp)) +
  theme_minimal() + xlab("") + ylab("% du PIB") +
  scale_x_date(breaks = seq(1960, 2100, 10) |> paste0("-01-01") |> as.Date(),
               labels = date_format("%Y")) +
  scale_y_continuous(breaks = 0.01*seq(0, 500, 1),
                labels = percent_format(accuracy = 1)) +

  theme(legend.position = c(0.75, 0.15),
        legend.title = element_blank())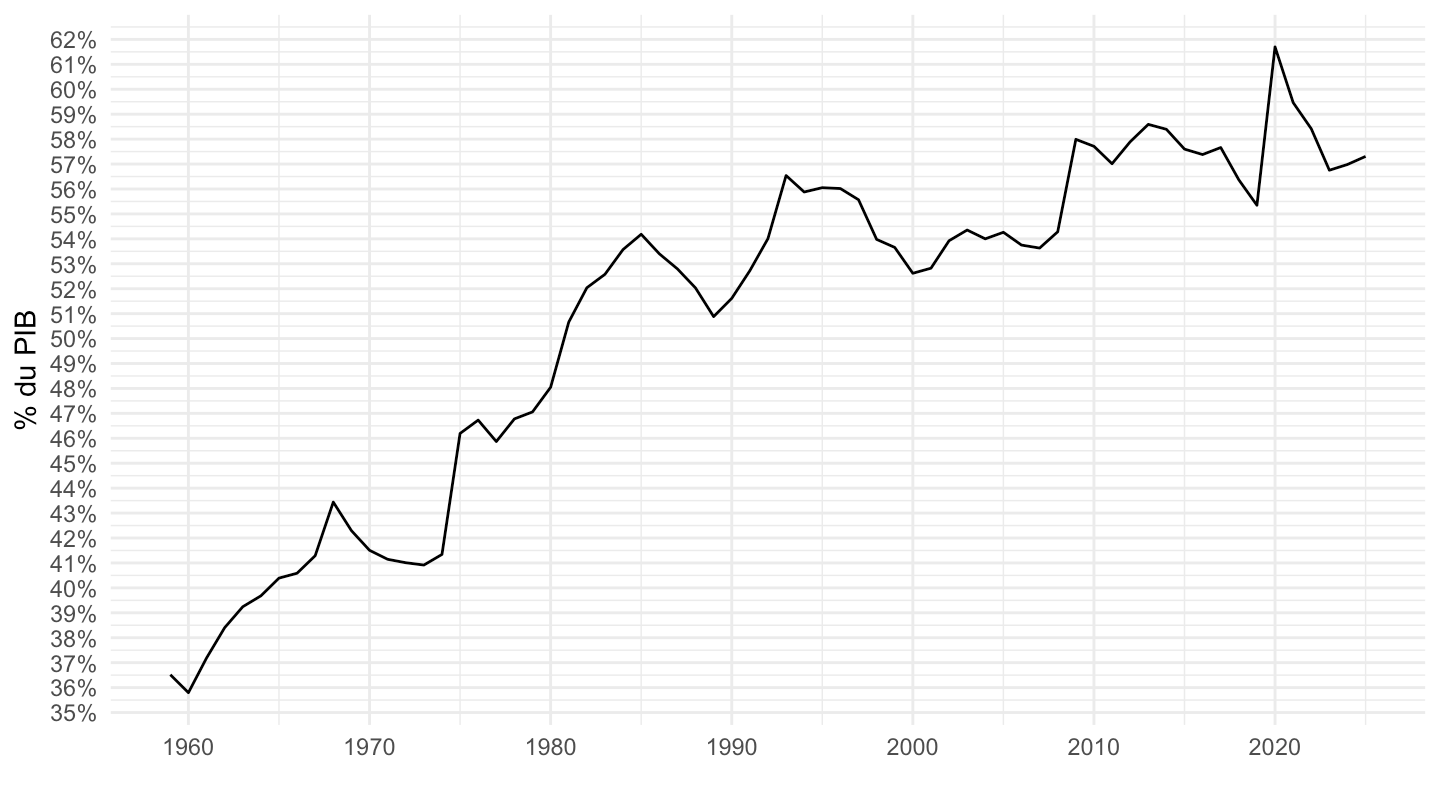
t_3201 |>
  filter(line %in% c(19)) |>
  year_to_date2() |>
  left_join(gdp, by = "date") |>
  filter(date >= as.Date("1979-01-01")) |>
  ggplot() + geom_line(aes(x = date, y = value / gdp)) +
  theme_minimal() + xlab("") + ylab("% du PIB") +
  scale_x_date(breaks = seq(1960, 2100, 5) |> paste0("-01-01") |> as.Date(),
               labels = date_format("%Y")) +
  scale_y_continuous(breaks = 0.01*seq(0, 500, 1),
                labels = percent_format(accuracy = 1)) +

  theme(legend.position = c(0.75, 0.15),
        legend.title = element_blank())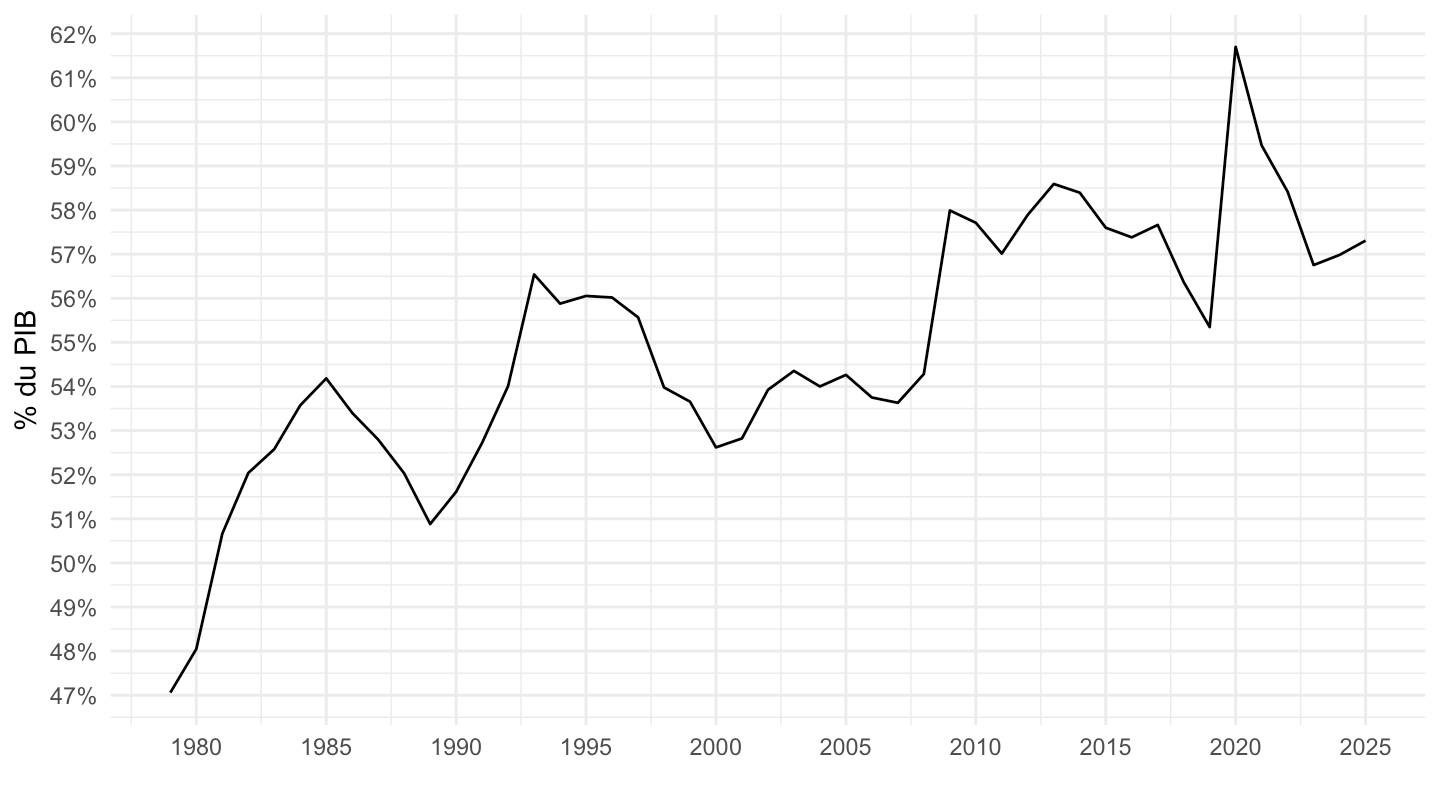
t_3201 |>
  filter(line %in% c(19)) |>
  year_to_date2() |>
  left_join(gdp, by = "date") |>
  filter(date >= as.Date("2000-01-01")) |>
  ggplot() + geom_line(aes(x = date, y = value / gdp)) +
  theme_minimal() + xlab("") + ylab("% du PIB") +
  scale_x_date(breaks = seq(1960, 2100, 2) |> paste0("-01-01") |> as.Date(),
               labels = date_format("%Y")) +
  scale_y_continuous(breaks = 0.01*seq(0, 500, 1),
                labels = percent_format(accuracy = 1)) +

  theme(legend.position = c(0.75, 0.15),
        legend.title = element_blank())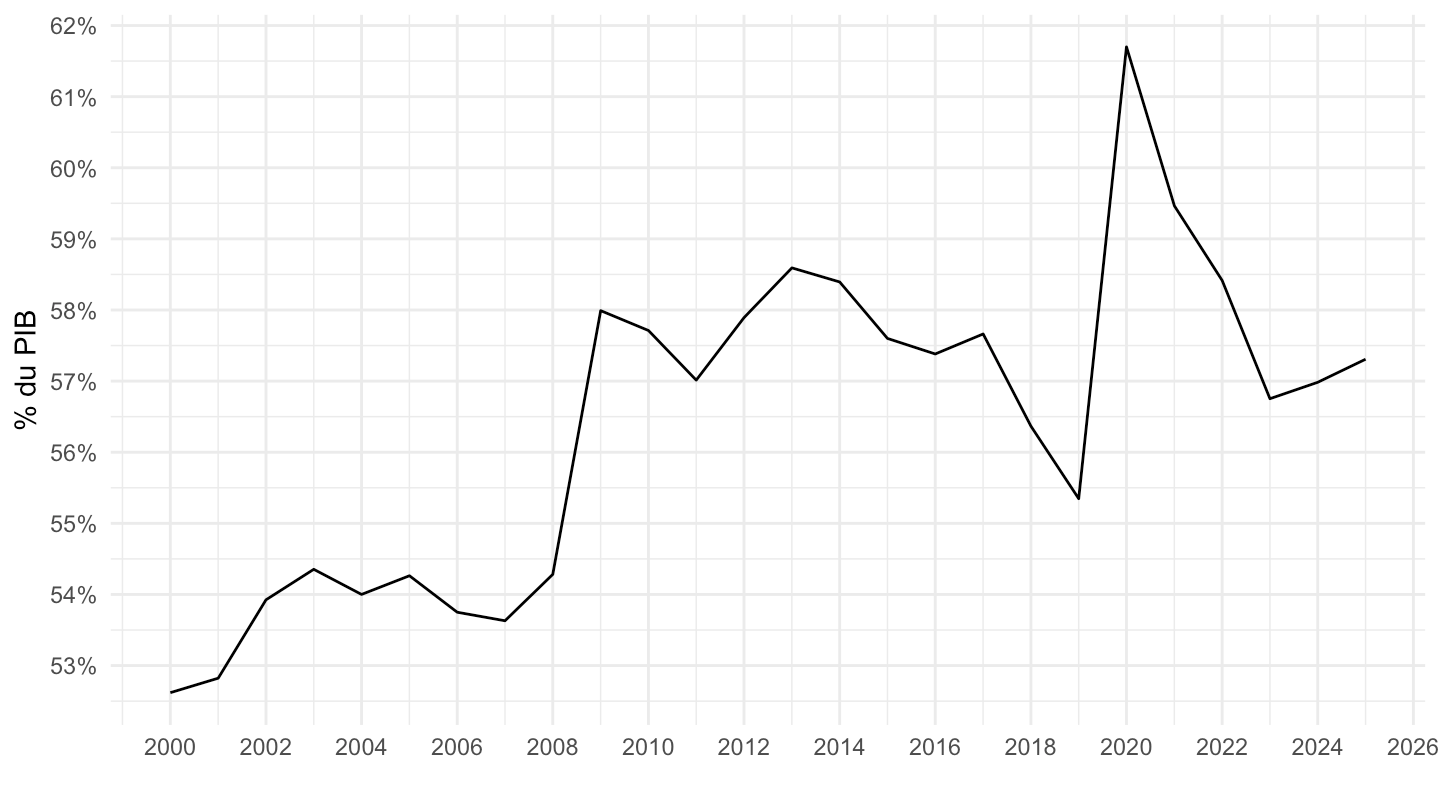
t_3201 |>
  filter(line %in% c(44, 19)) |>
  year_to_date2() |>
  left_join(gdp, by = "date") |>
  ggplot() + geom_line(aes(x = date, y = value / gdp, color = Line)) +
  theme_minimal() + xlab("") + ylab("% du PIB") +
  scale_x_date(breaks = seq(1960, 2100, 10) |> paste0("-01-01") |> as.Date(),
               labels = date_format("%Y")) +
  scale_y_continuous(breaks = 0.01*seq(0, 500, 1),
                labels = percent_format(accuracy = 1)) +

  theme(legend.position = c(0.75, 0.15),
        legend.title = element_blank())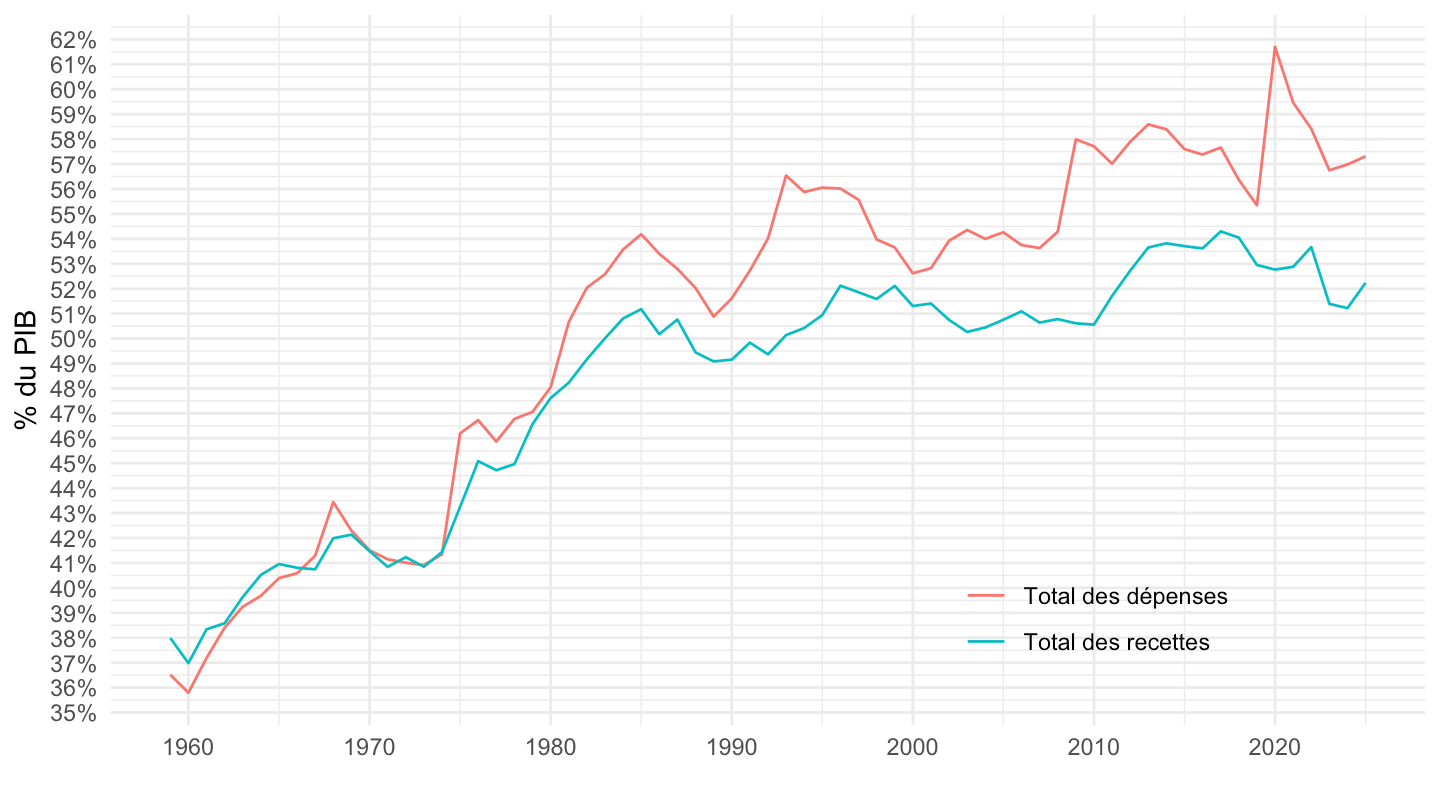
t_3201 |>
  filter(line %in% c(44, 19)) |>
  year_to_date2() |>
  left_join(gdp, by = "date") |>
  filter(date >= as.Date("1980-01-01")) |>
  ggplot() + geom_line(aes(x = date, y = value / gdp, color = Line)) +
  theme_minimal() + xlab("") + ylab("% du PIB") +
  scale_x_date(breaks = seq(1980, 2100, 5) |> paste0("-01-01") |> as.Date(),
               labels = date_format("%Y")) +
  scale_y_continuous(breaks = 0.01*seq(0, 500, 1),
                labels = percent_format(accuracy = 1)) +

  theme(legend.position = c(0.25, 0.85),
        legend.title = element_blank())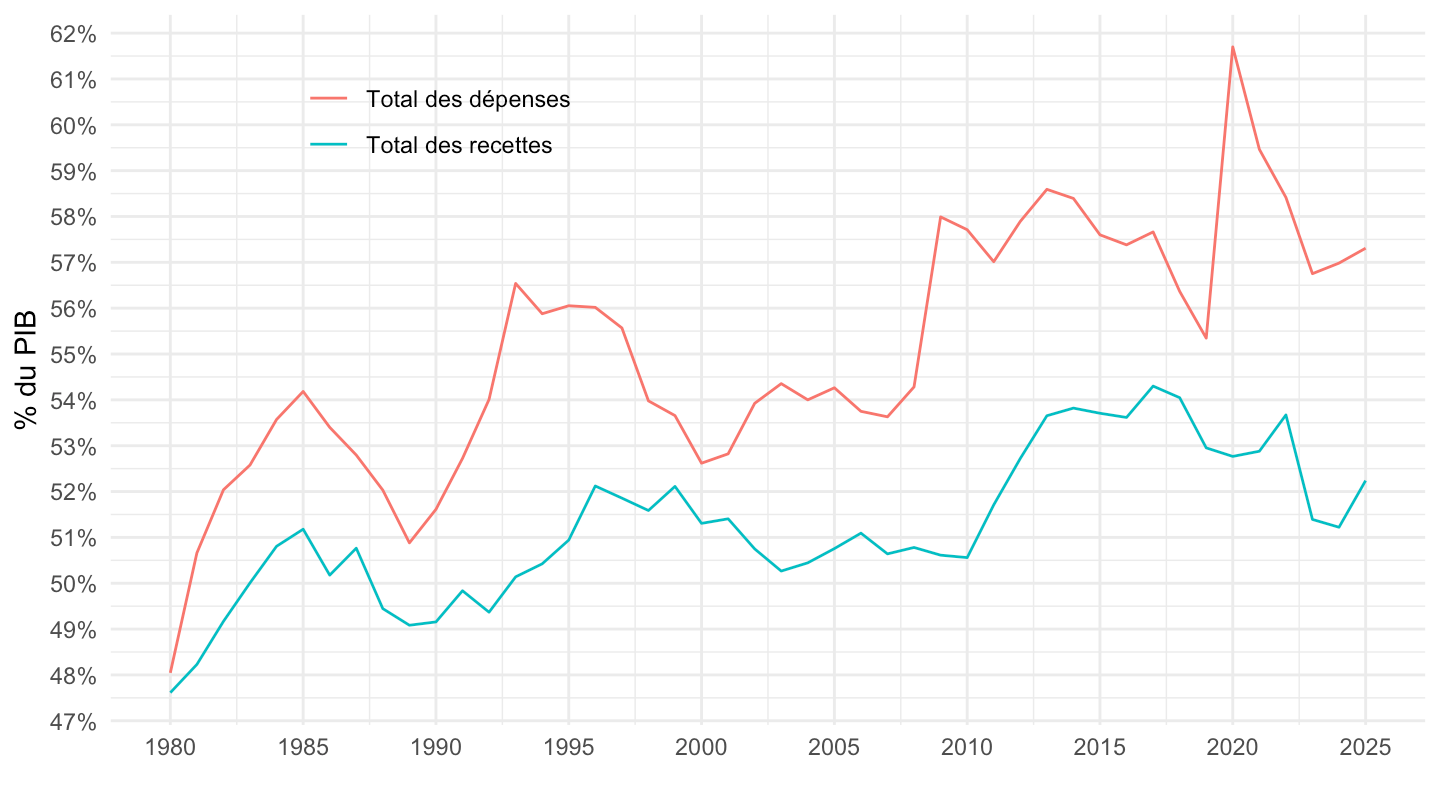
t_3201 |>
  filter(line %in% c(44, 19)) |>
  year_to_date2() |>
  left_join(gdp, by = "date") |>
  filter(date >= as.Date("1995-01-01")) |>
  ggplot() + geom_line(aes(x = date, y = value / gdp, color = Line)) +
  theme_minimal() + xlab("") + ylab("% du PIB") +
  scale_x_date(breaks = seq(1995, 2100, 2) |> paste0("-01-01") |> as.Date(),
               labels = date_format("%Y")) +
  scale_y_continuous(breaks = 0.01*seq(0, 500, 1),
                labels = percent_format(accuracy = 1)) +

  theme(legend.position = c(0.25, 0.85),
        legend.title = element_blank())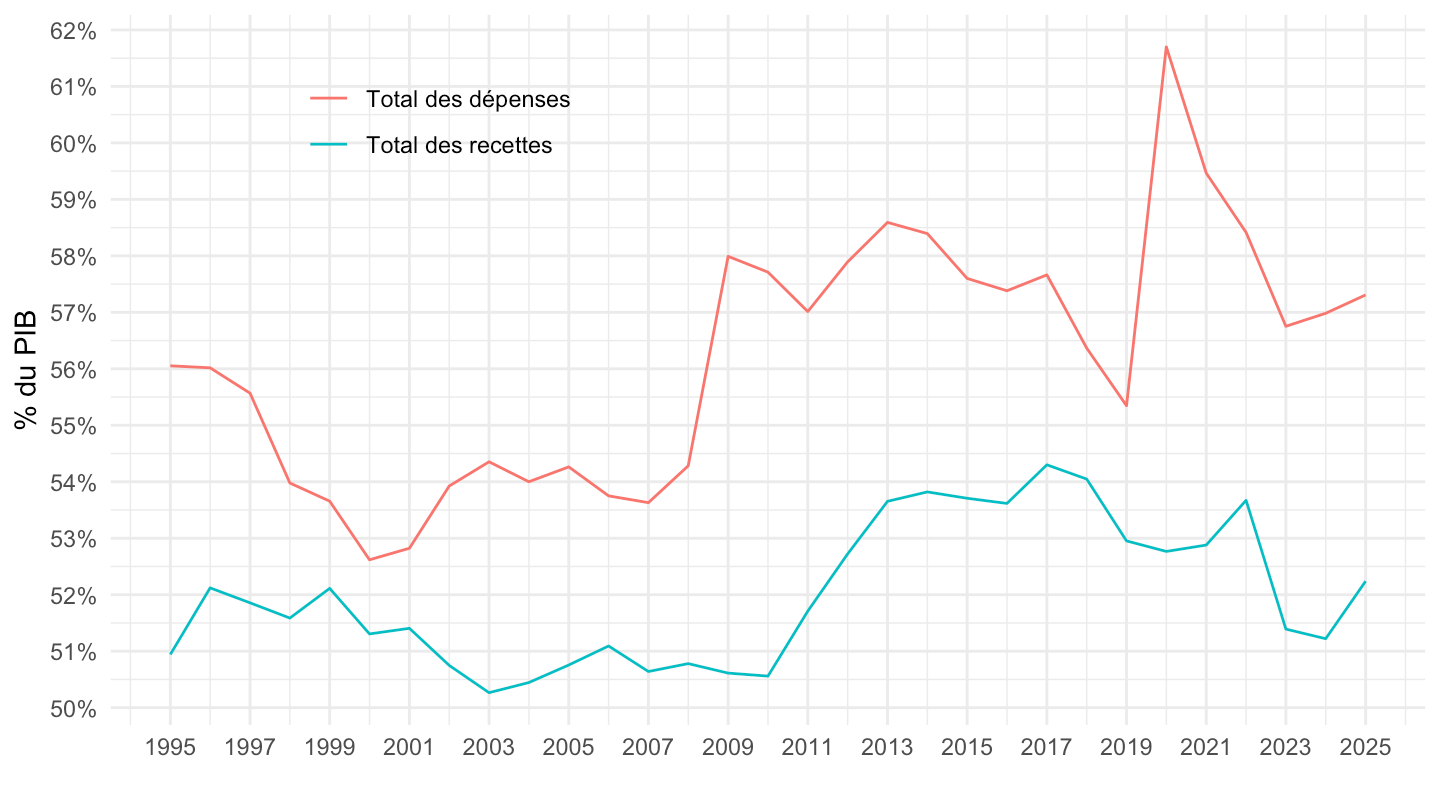
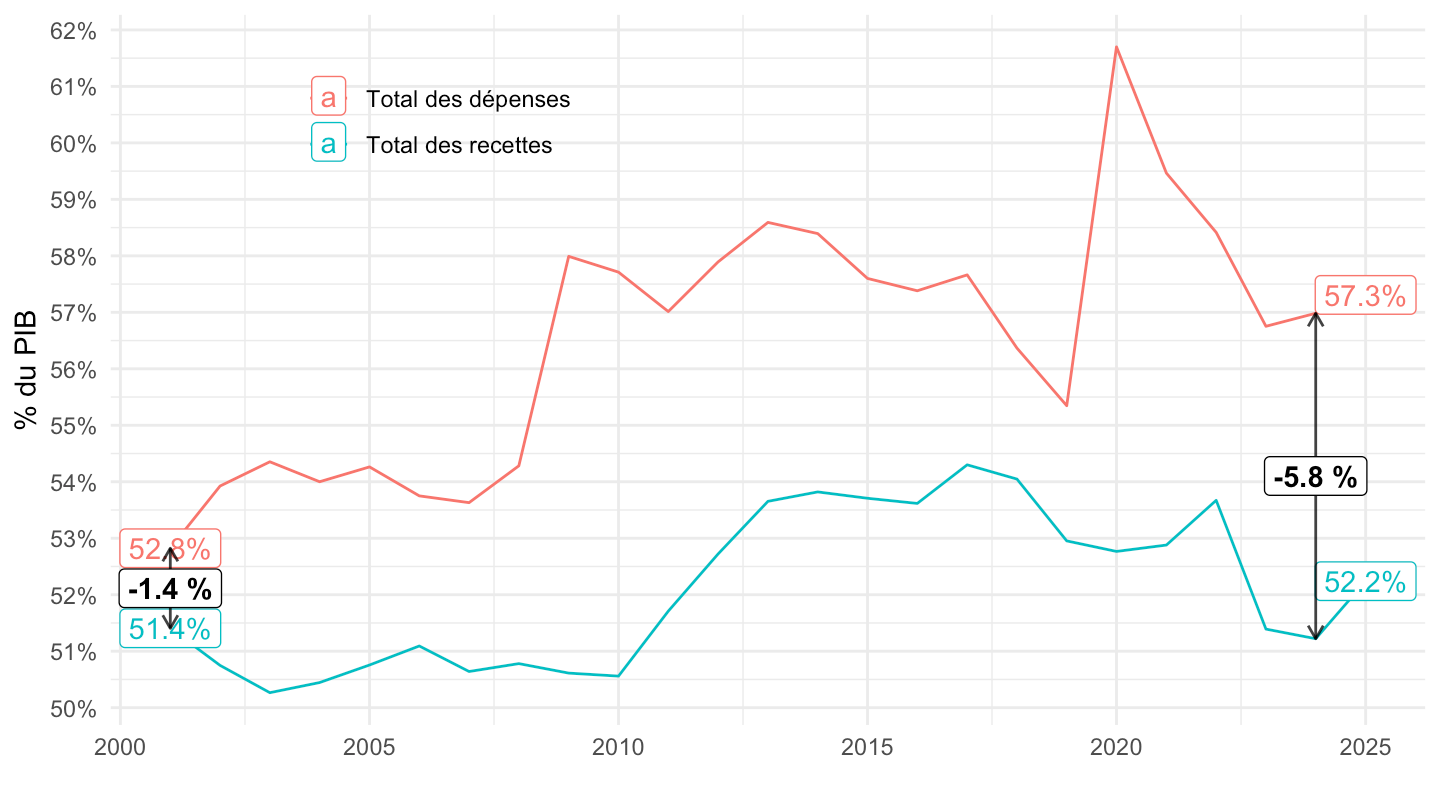
data <- t_3201 |>
  filter(line %in% c(44, 19)) |>
  year_to_date2() |>
  left_join(gdp, by = "date") |>
  filter(date >= as.Date("2001-01-01"))

delta_data <- data |>
  filter(format(date, "%Y") %in% c("2001", "2024")) |>
  group_by(date) |>
  summarise(
    y_max = max(value / gdp),
    y_min = min(value / gdp),
    delta = y_max - y_min,
    .groups = "drop"
  )

data |>
  ggplot() + geom_line(aes(x = date, y = value / gdp, color = Line)) +
  theme_minimal() + xlab("") + ylab("% du PIB") +
  scale_x_date(breaks = seq(1960, 2100, 5) |> paste0("-01-01") |> as.Date(),
               labels = date_format("%Y")) +
  scale_y_continuous(breaks = 0.01*seq(0, 500, 1),
                labels = percent_format(accuracy = 1)) +

  theme(legend.position = c(0.25, 0.85),
        legend.title = element_blank()) +
  geom_label(data = . %>% filter(date %in% c(as.Date("2001-01-01"), max(date))),
             aes(x = date, y = value / gdp, label = percent(value/gdp, acc = 0.1), color = Line))+
  geom_segment(
    data = delta_data,
    aes(x = date, xend = date, y = y_min, yend = y_max),
    arrow = arrow(length = unit(0.2, "cm"), ends = "both"),
    color = "black",
    alpha = 0.8
  ) +
  geom_label(
    data = delta_data,
    aes(x = date, y = (y_max + y_min) / 2,
        label = paste0("-", round(delta * 100, 1), " %")),
    color = "black",
    fontface = "bold"
  )
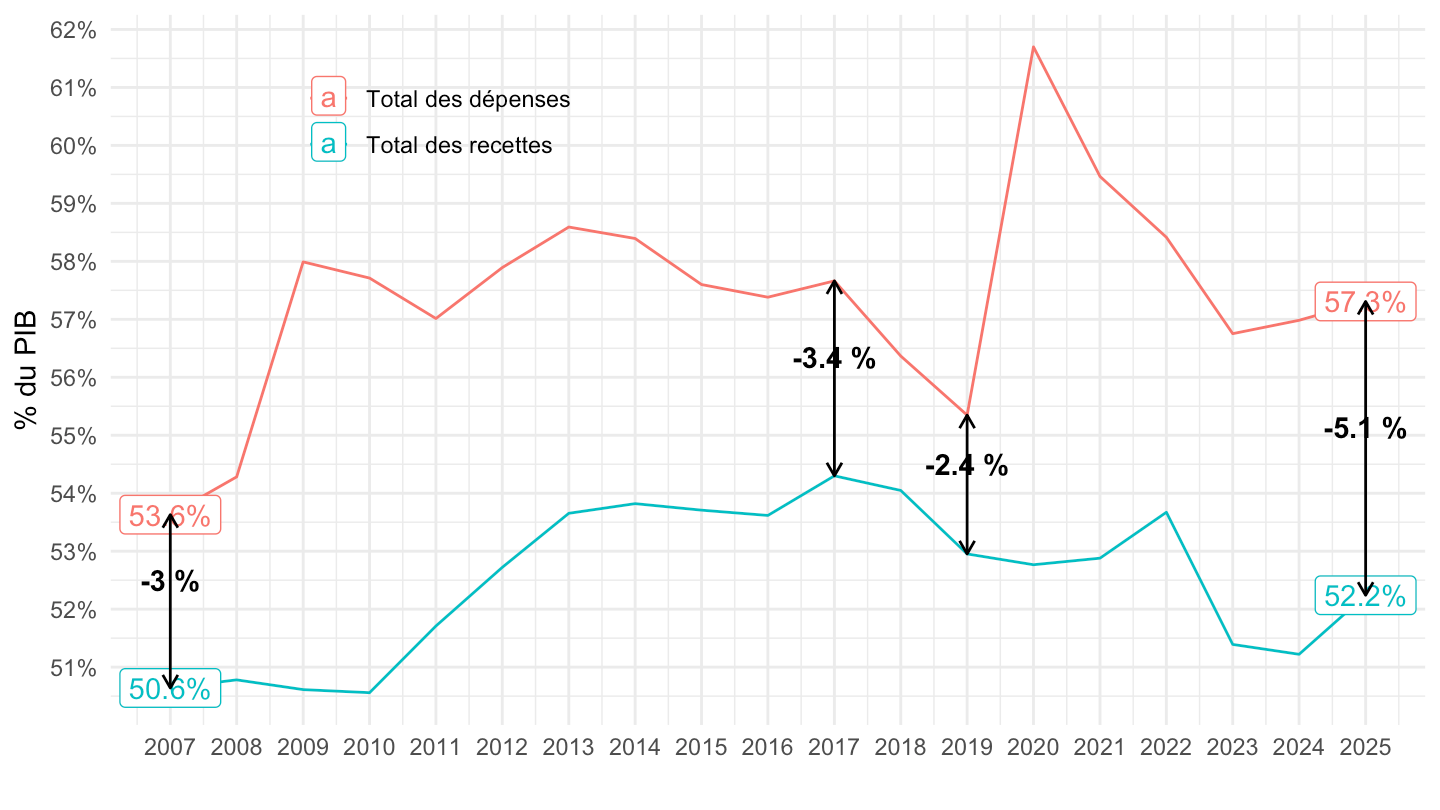
data <- t_3201 |>
  filter(line %in% c(44, 19)) |>
  year_to_date2() |>
  left_join(gdp, by = "date") |>
  filter(date >= as.Date("2007-01-01"))

delta_data <- data |>
  filter(format(date, "%Y") %in% c("2007", "2017", "2019", "2025")) |>
  group_by(date) |>
  summarise(
    y_max = max(value / gdp),
    y_min = min(value / gdp),
    delta = y_max - y_min,
    .groups = "drop"
  )

data |>
  ggplot() + geom_line(aes(x = date, y = value / gdp, color = Line)) +
  theme_minimal() + xlab("") + ylab("% du PIB") +
  scale_x_date(breaks = seq(1960, 2100, 1) |> paste0("-01-01") |> as.Date(),
               labels = date_format("%Y")) +
  scale_y_continuous(breaks = 0.01*seq(0, 500, 1),
                labels = percent_format(accuracy = 1)) +

  theme(legend.position = c(0.25, 0.85),
        legend.title = element_blank()) +
  geom_label(data = . %>% filter(date %in% c(as.Date("2007-01-01"), max(date))),
             aes(x = date, y = value / gdp, label = percent(value/gdp, acc = 0.1), color = Line))+
  geom_segment(
    data = delta_data,
    aes(x = date, xend = date, y = y_min, yend = y_max),
    arrow = arrow(length = unit(0.2, "cm"), ends = "both"),
    color = "black"
  ) +
  geom_text(
    data = delta_data,
    aes(x = date, y = (y_max + y_min) / 2,
        label = paste0("-", round(delta * 100, 1), " %")),
    color = "black",
    fontface = "bold",
    vjust = -0.5
  )
t_3201 |>
  filter(line %in% c(44, 19)) |>
  year_to_date2() |>
  left_join(gdp, by = "date") |>
  filter(date >= as.Date("2013-01-01")) |>
  ggplot() + geom_line(aes(x = date, y = value / gdp, color = Line)) +
  theme_minimal() + xlab("") + ylab("% du PIB") +
  scale_x_date(breaks = seq(1960, 2100, 1) |> paste0("-01-01") |> as.Date(),
               labels = date_format("%Y")) +
  scale_y_continuous(breaks = 0.01*seq(0, 500, 1),
                labels = percent_format(accuracy = 1)) +

  theme(legend.position = c(0.25, 0.85),
        legend.title = element_blank()) +
  geom_label(data = . %>% filter(date %in% c(as.Date("2017-01-01"), max(date))),
             aes(x = date, y = value / gdp, label = percent(value/gdp, acc = 0.1), color = Line))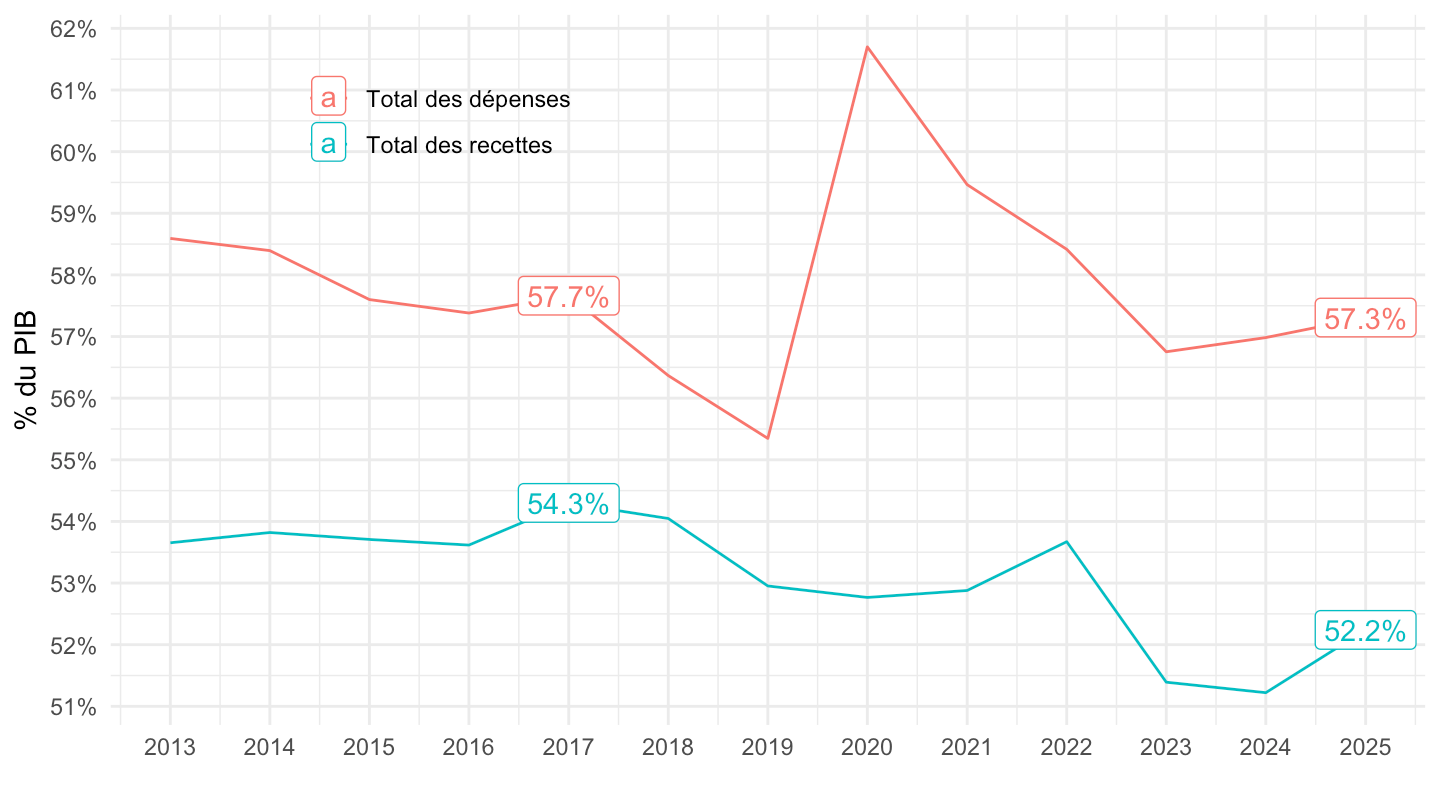
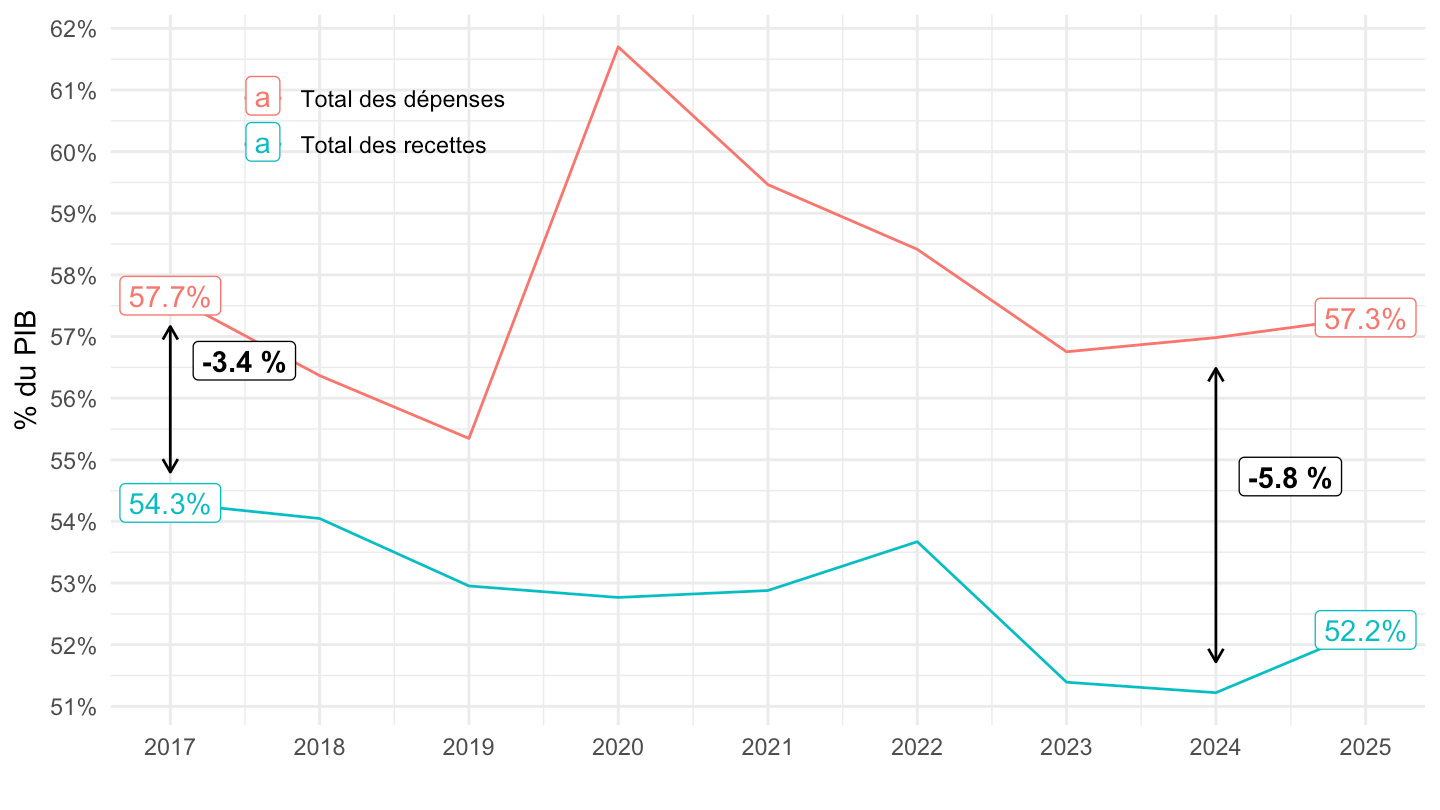
data <- t_3201 |>
  filter(line %in% c(44, 19)) |>
  year_to_date2() |>
  left_join(gdp, by = "date") |>
  filter(date >= as.Date("2017-01-01"))

delta_data <- data |>
  filter(format(date, "%Y") %in% c("2017", "2024")) |>
  group_by(date) |>
  summarise(
    y_max = max(value / gdp),
    y_min = min(value / gdp),
    delta = y_max - y_min,
    .groups = "drop"
  )


data |>
  ggplot() + geom_line(aes(x = date, y = value / gdp, color = Line)) +
  theme_minimal() + xlab("") + ylab("% du PIB") +
  scale_x_date(breaks = seq(1960, 2100, 1) |> paste0("-01-01") |> as.Date(),
               labels = date_format("%Y")) +
  scale_y_continuous(breaks = 0.01*seq(0, 500, 1),
                labels = percent_format(accuracy = 1)) +

  theme(legend.position = c(0.2, 0.85),
        legend.title = element_blank()) +
  geom_label(data = . %>% filter(date %in% c(max(date), min(date))),
             aes(x = date, y = value / gdp, label = percent(value/gdp, acc = 0.1), color = Line)) +
  geom_segment(
    data = delta_data,
    aes(x = date, xend = date, y = y_min+0.005, yend = y_max-0.005),
    arrow = arrow(length = unit(0.2, "cm"), ends = "both"),
    color = "black"
  ) +
  geom_label(
    data = delta_data,
    aes(x = date+months(6), y = (y_max + y_min) / 2,
        label = paste0("-", round(delta * 100, 1), " %")),
    color = "black",
    fontface = "bold",
    vjust = -0.5
  )
t_3201 |>
  filter(line %in% c(44)) |>
  year_to_date2() |>
  left_join(gdp, by = "date") |>
  ggplot() + geom_line(aes(x = date, y = value / gdp)) +
  theme_minimal() + xlab("") + ylab("% du PIB") +
  scale_x_date(breaks = seq(1960, 2100, 10) |> paste0("-01-01") |> as.Date(),
               labels = date_format("%Y")) +
  scale_y_continuous(breaks = 0.01*seq(0, 500, 1),
                labels = percent_format(accuracy = 1)) +

  theme(legend.position = c(0.75, 0.15),
        legend.title = element_blank())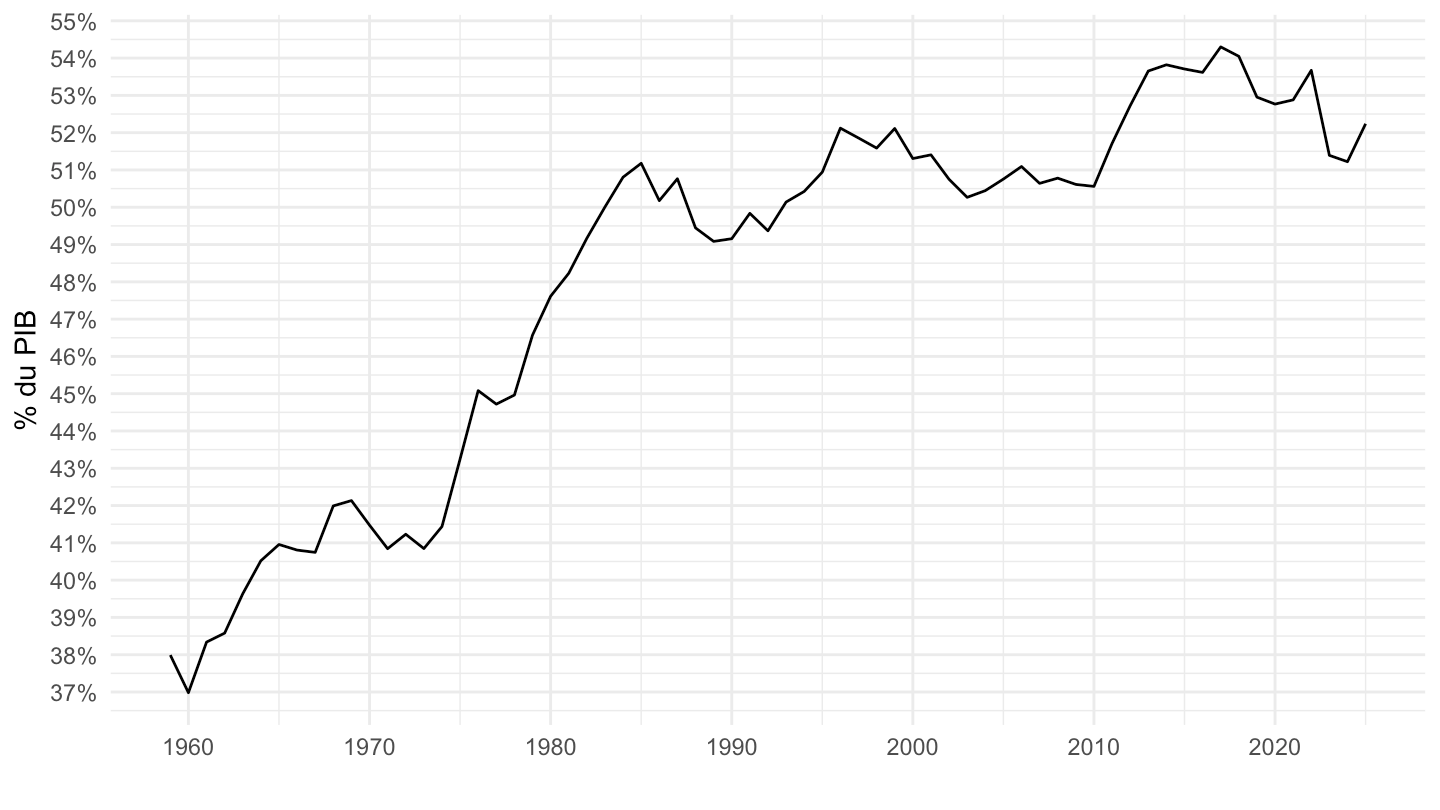
t_3201 |>
  filter(line %in% c(44)) |>
  year_to_date2() |>
  left_join(gdp, by = "date") |>
  filter(date >= as.Date("1979-01-01")) |>
  ggplot() + geom_line(aes(x = date, y = value / gdp)) +
  theme_minimal() + xlab("") + ylab("% du PIB") +
  scale_x_date(breaks = seq(1960, 2100, 5) |> paste0("-01-01") |> as.Date(),
               labels = date_format("%Y")) +
  scale_y_continuous(breaks = 0.01*seq(0, 500, 1),
                labels = percent_format(accuracy = 1)) +

  theme(legend.position = c(0.75, 0.15),
        legend.title = element_blank())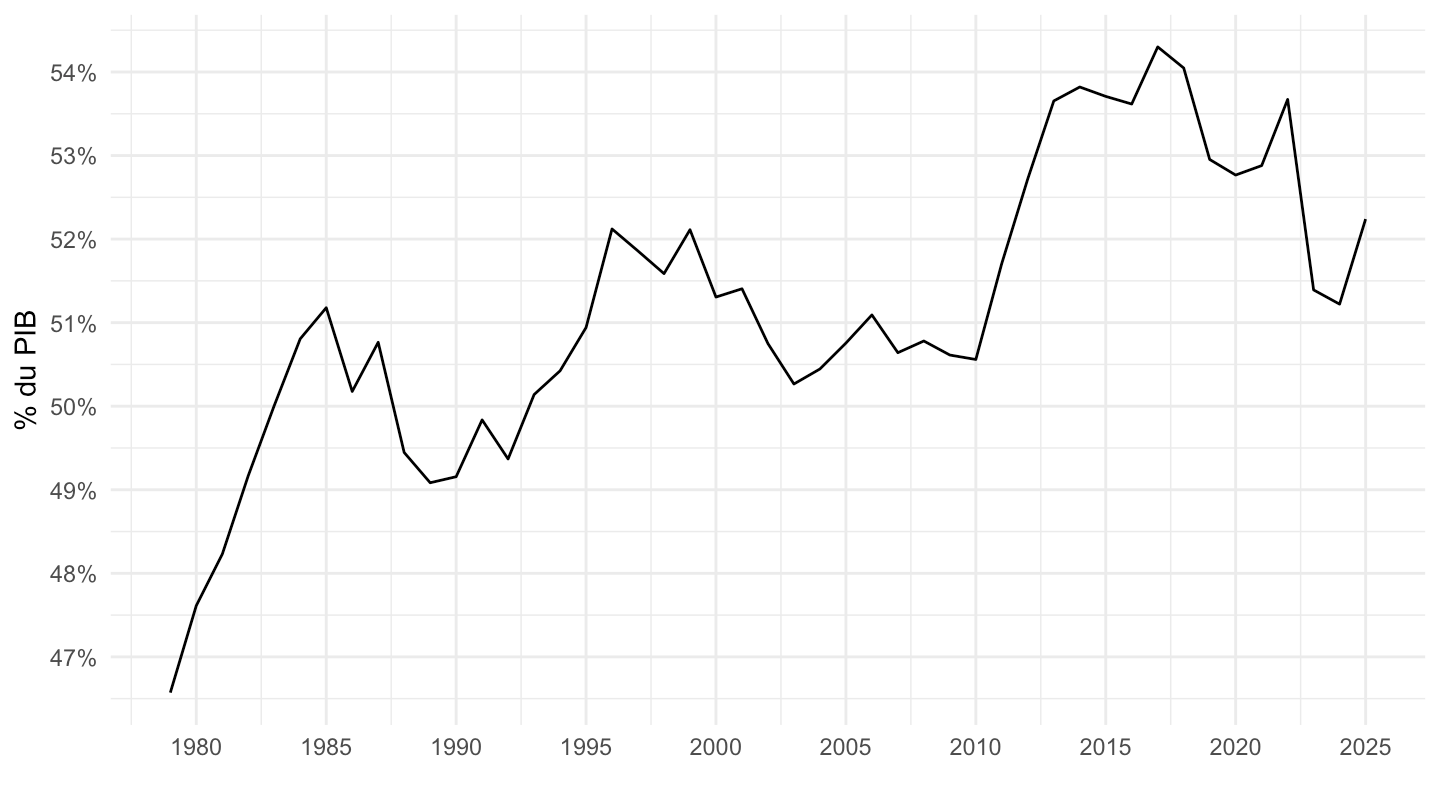
t_3201 |>
  filter(line %in% c(44)) |>
  year_to_date2() |>
  left_join(gdp, by = "date") |>
  filter(date >= as.Date("2000-01-01")) |>
  ggplot() + geom_line(aes(x = date, y = value / gdp)) +
  theme_minimal() + xlab("") + ylab("% du PIB") +
  scale_x_date(breaks = seq(1960, 2100, 2) |> paste0("-01-01") |> as.Date(),
               labels = date_format("%Y")) +
  scale_y_continuous(breaks = 0.01*seq(0, 500, 1),
                labels = percent_format(accuracy = 1)) +

  theme(legend.position = c(0.75, 0.15),
        legend.title = element_blank())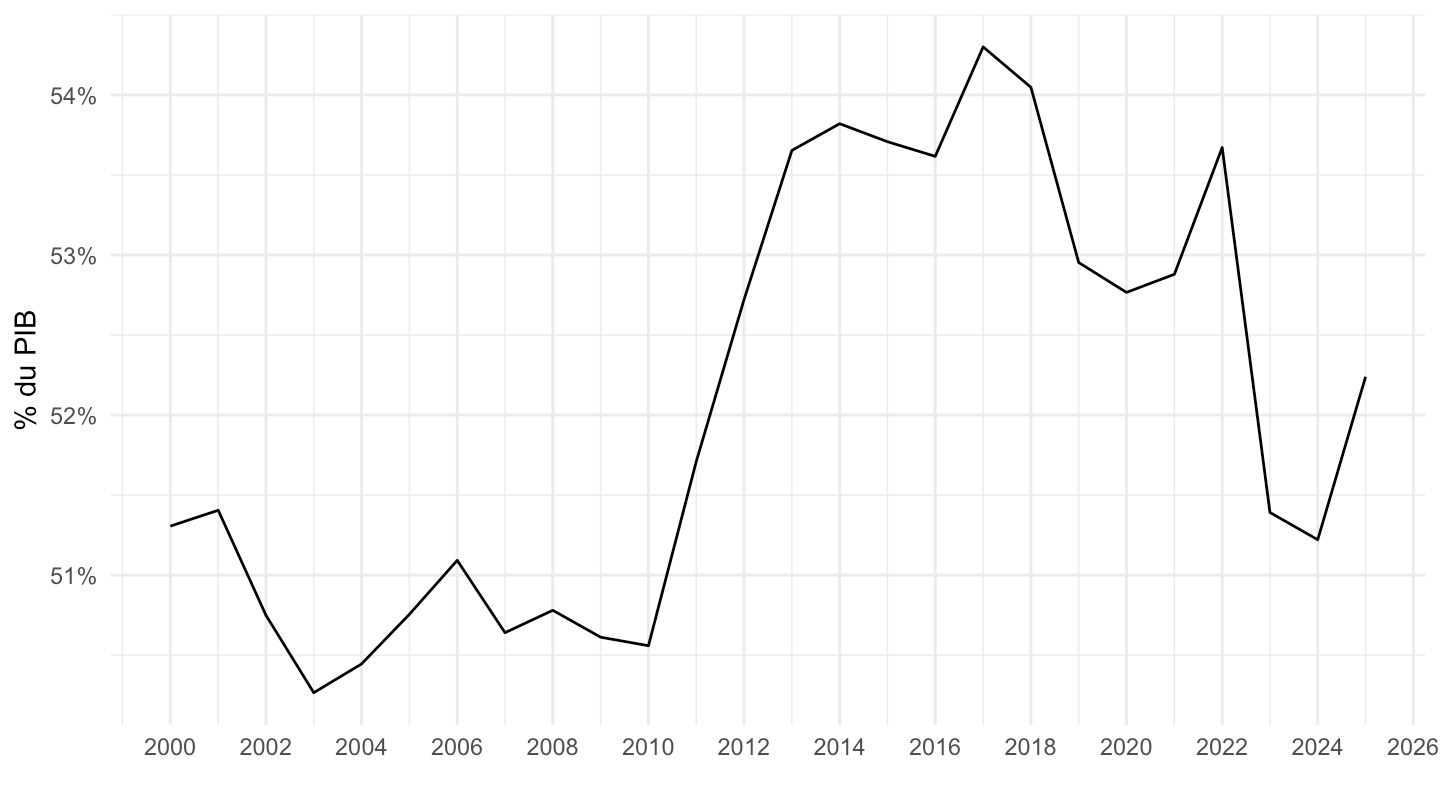
t_3201 |>
  filter(line %in% c(7)) |>
  year_to_date2() |>
  left_join(gdp, by = "date") |>
  ggplot() + geom_line(aes(x = date, y = value / gdp)) +
  theme_minimal() + xlab("") + ylab("% du PIB") +
  scale_x_date(breaks = seq(1960, 2100, 10) |> paste0("-01-01") |> as.Date(),
               labels = date_format("%Y")) +
  scale_y_continuous(breaks = 0.01*seq(0, 500, 1),
                labels = percent_format(accuracy = 1)) +

  theme(legend.position = c(0.75, 0.15),
        legend.title = element_blank())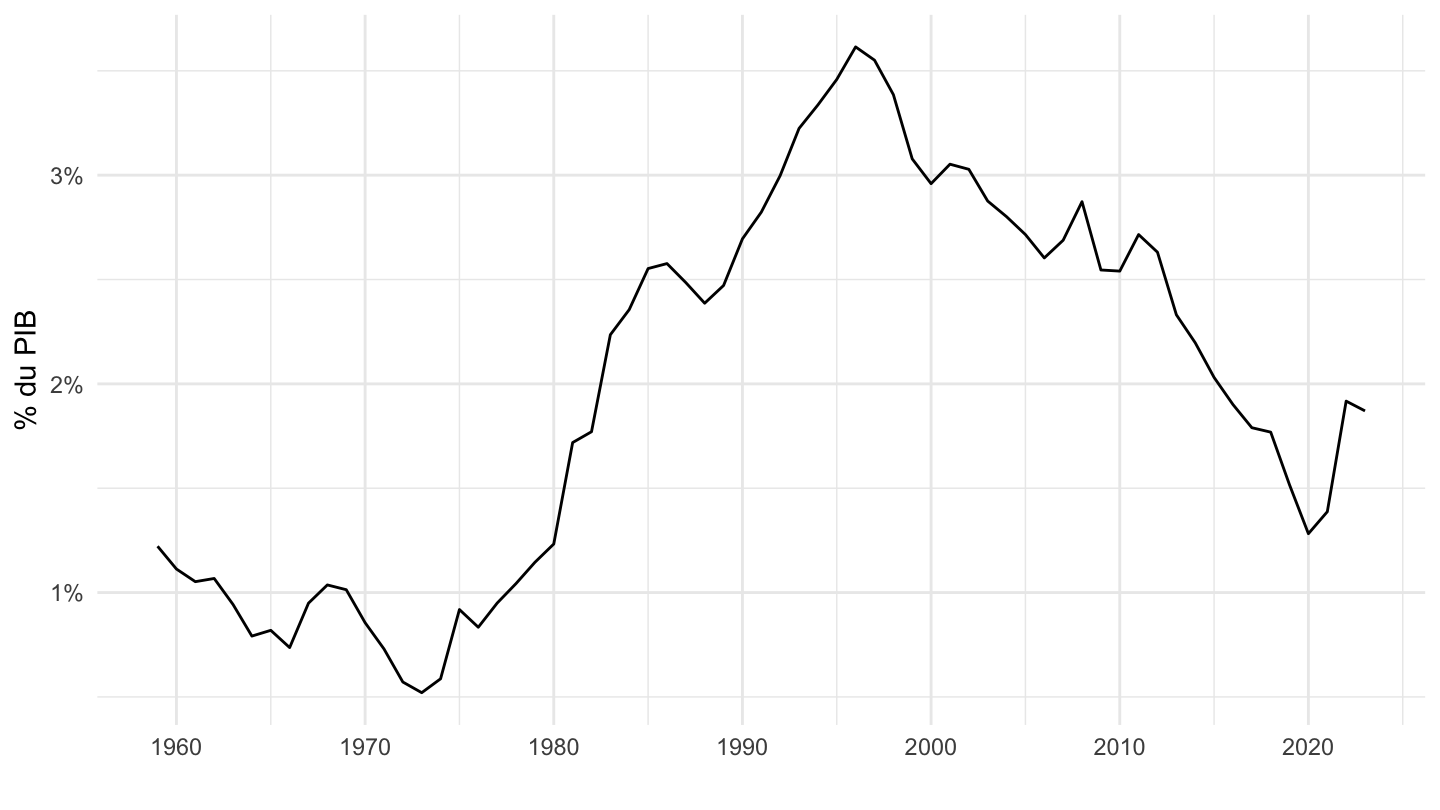
t_3201 |>
  filter(line %in% c(8)) |>
  year_to_date2() |>
  left_join(gdp, by = "date") |>
  add_row(date = as.Date("2022-01-01"), value = 53.2, gdp = 2643) |>
  ggplot() + geom_line(aes(x = date, y = value / gdp)) +
  theme_minimal() + xlab("") + ylab("Charge d'intérêts hors correction au titre des SIFIM\n% du PIB") +
  scale_x_date(breaks = seq(1960, 2100, 10) |> paste0("-01-01") |> as.Date(),
               labels = date_format("%Y")) +
  scale_y_continuous(breaks = 0.01*seq(0, 500, 1),
                labels = percent_format(accuracy = 1)) +

  theme(legend.position = c(0.75, 0.15),
        legend.title = element_blank())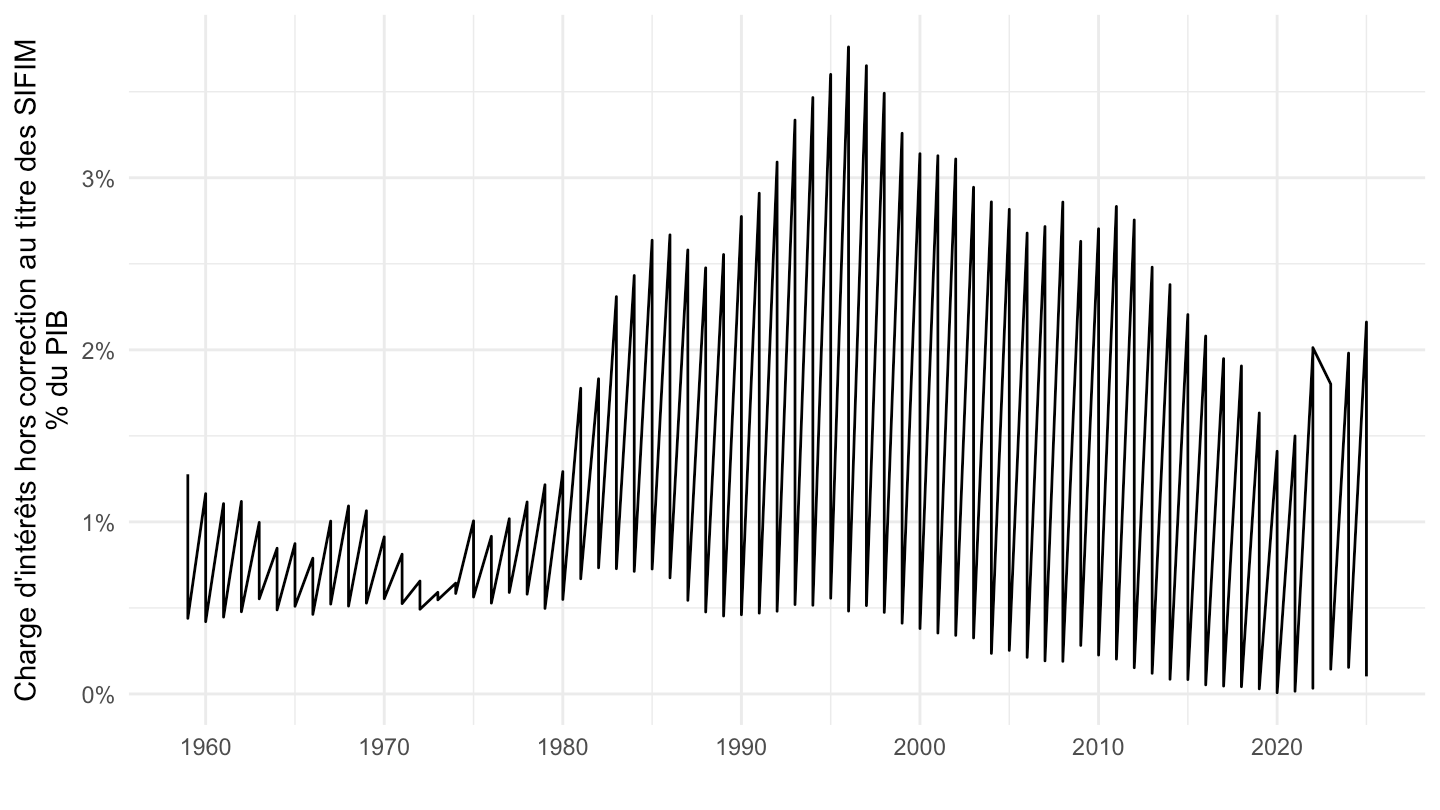
t_3201 |>
  filter(line %in% c(8, 7)) |>
  year_to_date2() |>
  left_join(gdp, by = "date") |>
  ggplot() + geom_line(aes(x = date, y = value / gdp, color = Line)) +
  theme_minimal() + xlab("") + ylab("Intérêts (% du PIB)") +
  scale_x_date(breaks = seq(1960, 2100, 10) |> paste0("-01-01") |> as.Date(),
               labels = date_format("%Y")) +
  scale_y_continuous(breaks = 0.01*seq(0, 500, 0.5),
                labels = percent_format(accuracy = .1)) +
  theme(legend.position = c(0.45, 0.85),
        legend.title = element_blank())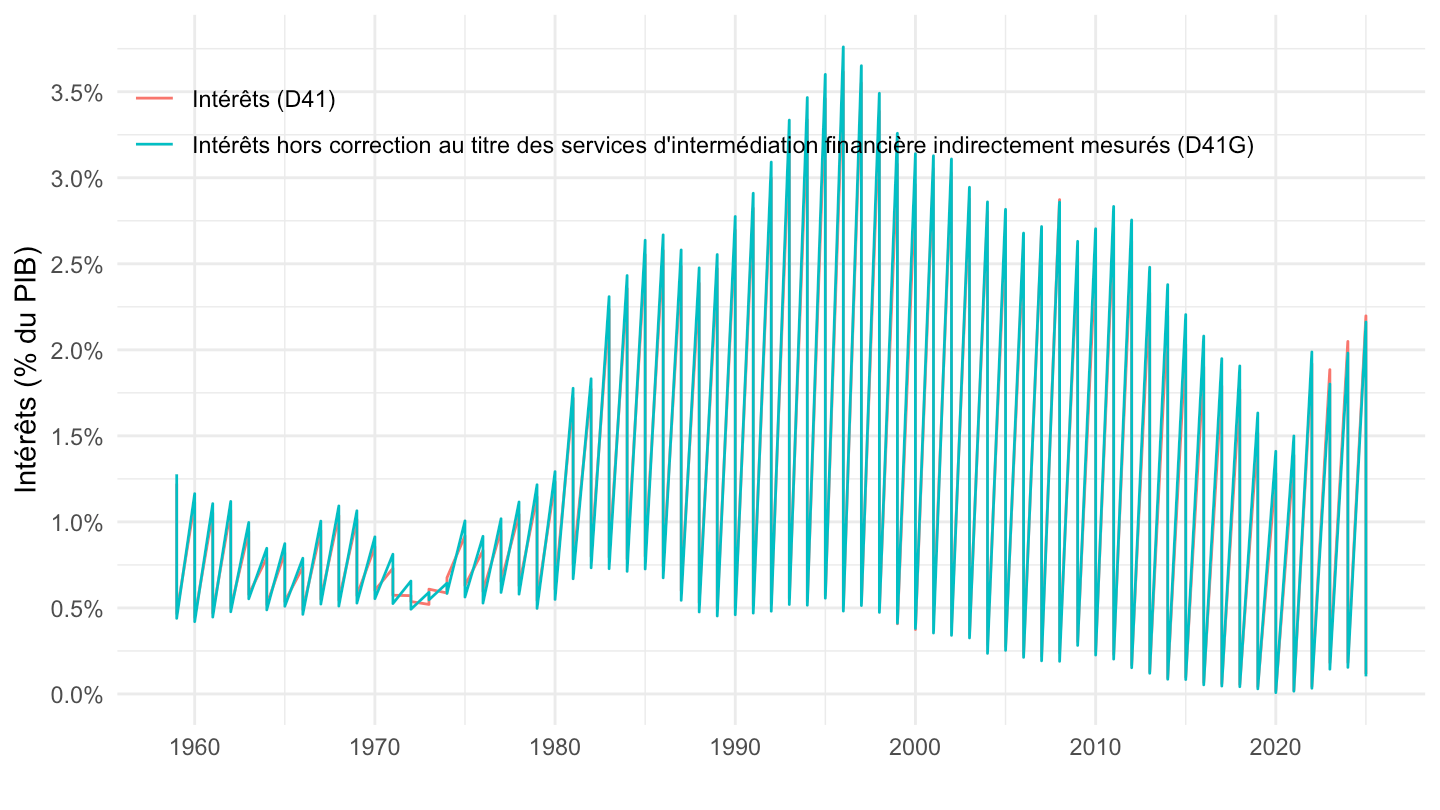
t_3201 |>
  filter(line %in% c(50)) |>
  year_to_date2() |>
  left_join(gdp, by = "date") |>
  #add_row(date = as.Date("2022-01-01"), value = -124.9, gdp = 2643) %>%
  ggplot() + geom_line(aes(x = date, y = value / gdp)) +
  theme_minimal() + xlab("") + ylab("Déficit public (% du PIB)") +
  scale_x_date(breaks = seq(1960, 2100, 10) |> paste0("-01-01") |> as.Date(),
               labels = date_format("%Y")) +
  scale_y_continuous(breaks = 0.01*seq(-50, 500, 1),
                labels = percent_format(accuracy = 1)) +

  theme(legend.position = c(0.75, 0.15),
        legend.title = element_blank())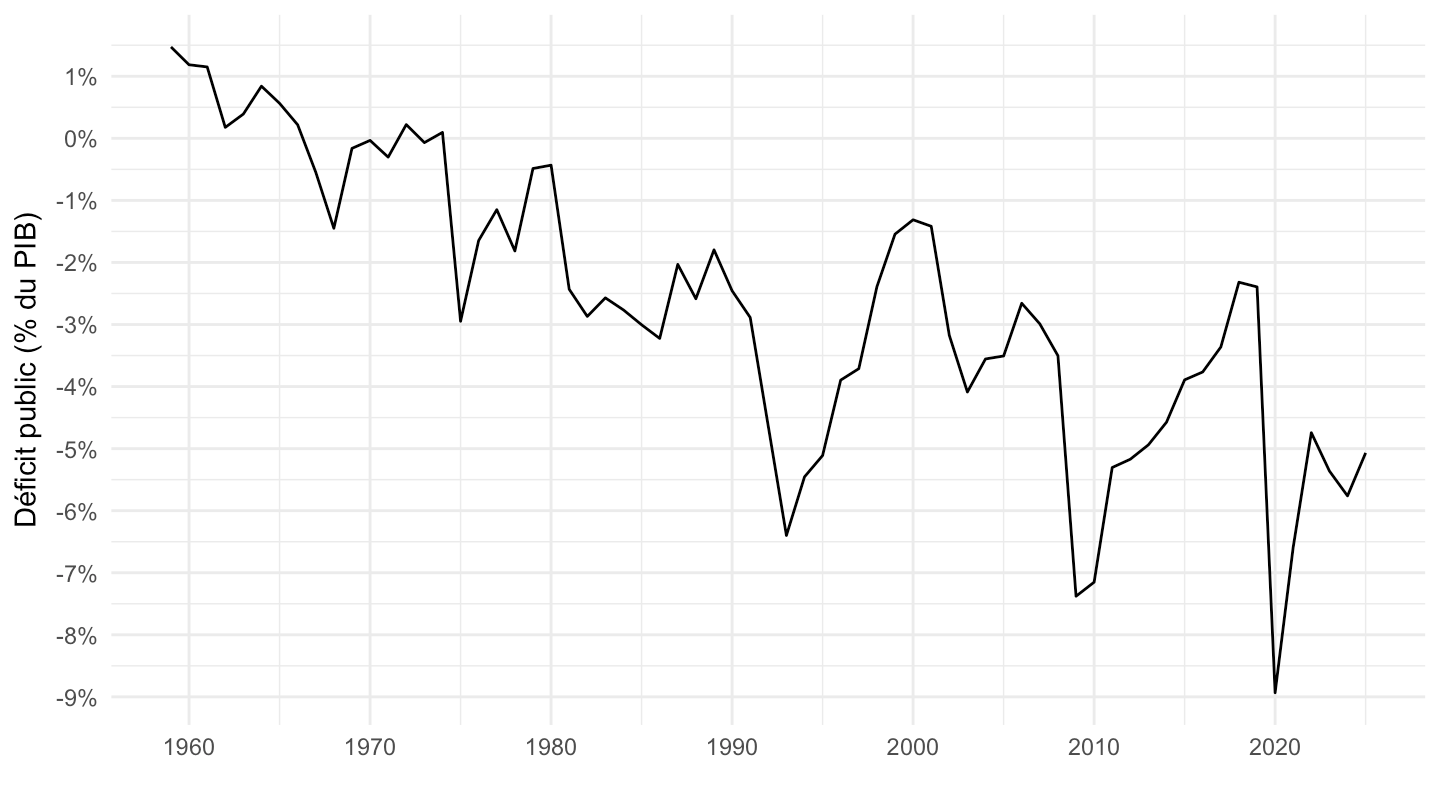
t_3201 |>
  filter(line %in% c(33)) |>
  year_to_date2() |>
  left_join(gdp, by = "date") |>
  ggplot() + geom_line(aes(x = date, y = value / gdp)) +
  theme_minimal() + xlab("") + ylab("% du PIB") +
  scale_x_date(breaks = seq(1960, 2100, 10) |> paste0("-01-01") |> as.Date(),
               labels = date_format("%Y")) +
  scale_y_continuous(breaks = 0.01*seq(0, 500, 1),
                labels = percent_format(accuracy = 1)) +

  theme(legend.position = c(0.75, 0.15),
        legend.title = element_blank())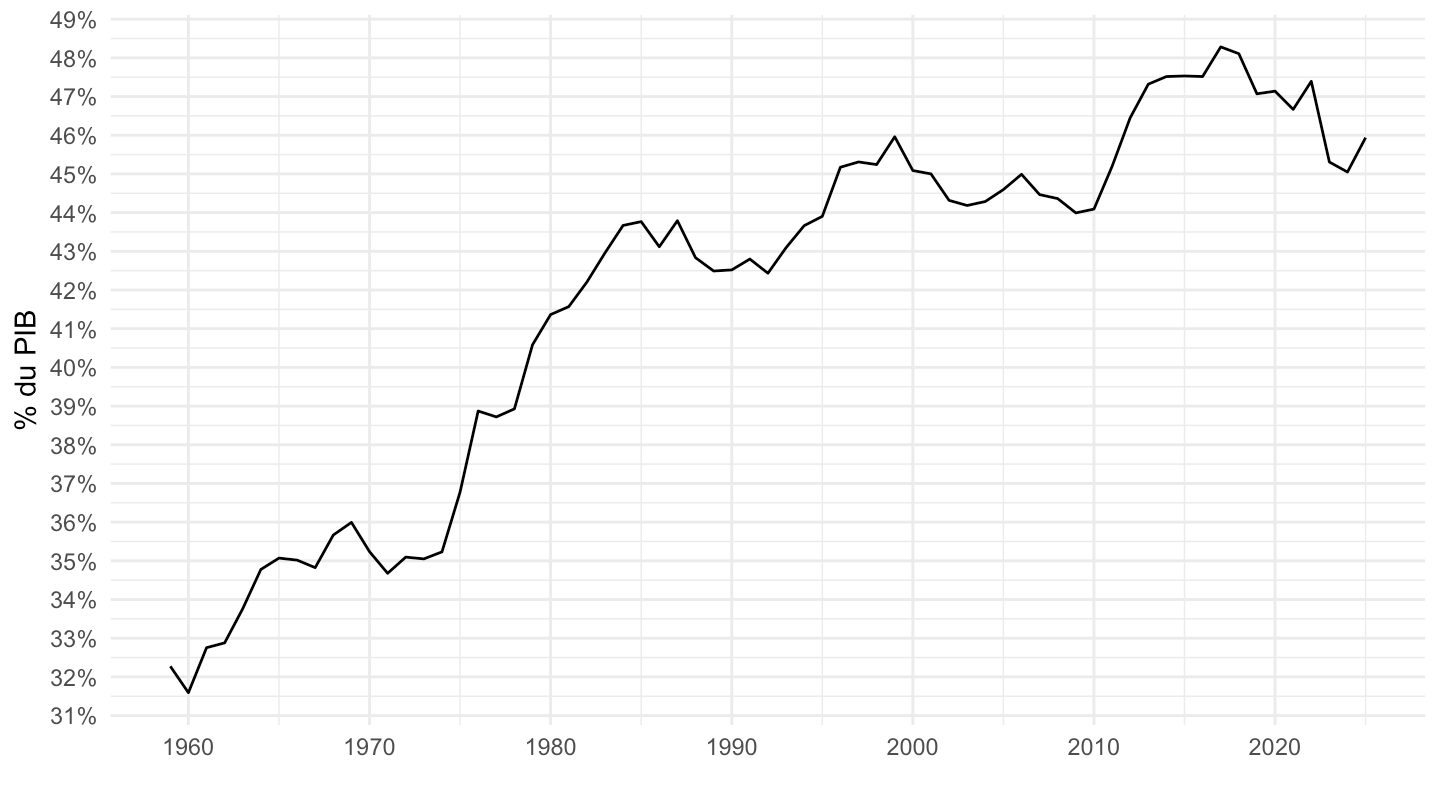
t_3201 |>
  filter(line %in% c(33)) |>
  year_to_date2() |>
  left_join(gdp, by = "date") |>
  filter(date >= as.Date("1979-01-01")) |>
  ggplot() + geom_line(aes(x = date, y = value / gdp)) +
  theme_minimal() + xlab("") + ylab("Impôts et cotisations sociales (% du PIB)") +
  scale_x_date(breaks = seq(1960, 2100, 5) |> paste0("-01-01") |> as.Date(),
               labels = date_format("%Y")) +
  scale_y_continuous(breaks = 0.01*seq(0, 500, 1),
                labels = percent_format(accuracy = 1)) +

  theme(legend.position = c(0.75, 0.15),
        legend.title = element_blank())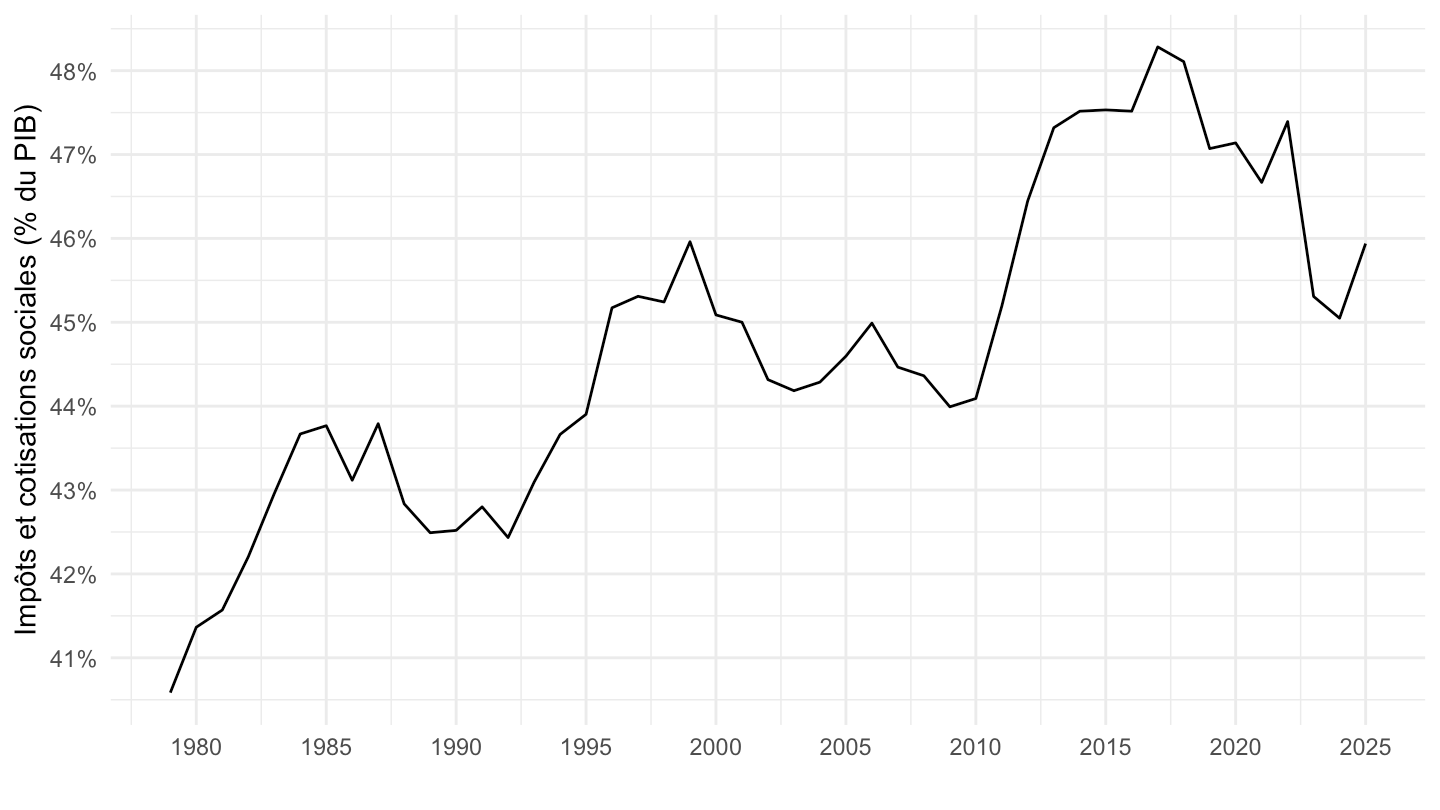
t_3201 |>
  filter(line %in% c(33)) |>
  year_to_date2() |>
  left_join(gdp, by = "date") |>
  filter(date >= as.Date("2000-01-01")) |>
  ggplot() + geom_line(aes(x = date, y = value / gdp)) +
  theme_minimal() + xlab("") + ylab("Impôts et cotisations sociales (% du PIB)") +
  scale_x_date(breaks = seq(1960, 2100, 2) |> paste0("-01-01") |> as.Date(),
               labels = date_format("%Y")) +
  scale_y_continuous(breaks = 0.01*seq(0, 500, 1),
                labels = percent_format(accuracy = 1)) +

  theme(legend.position = c(0.75, 0.15),
        legend.title = element_blank())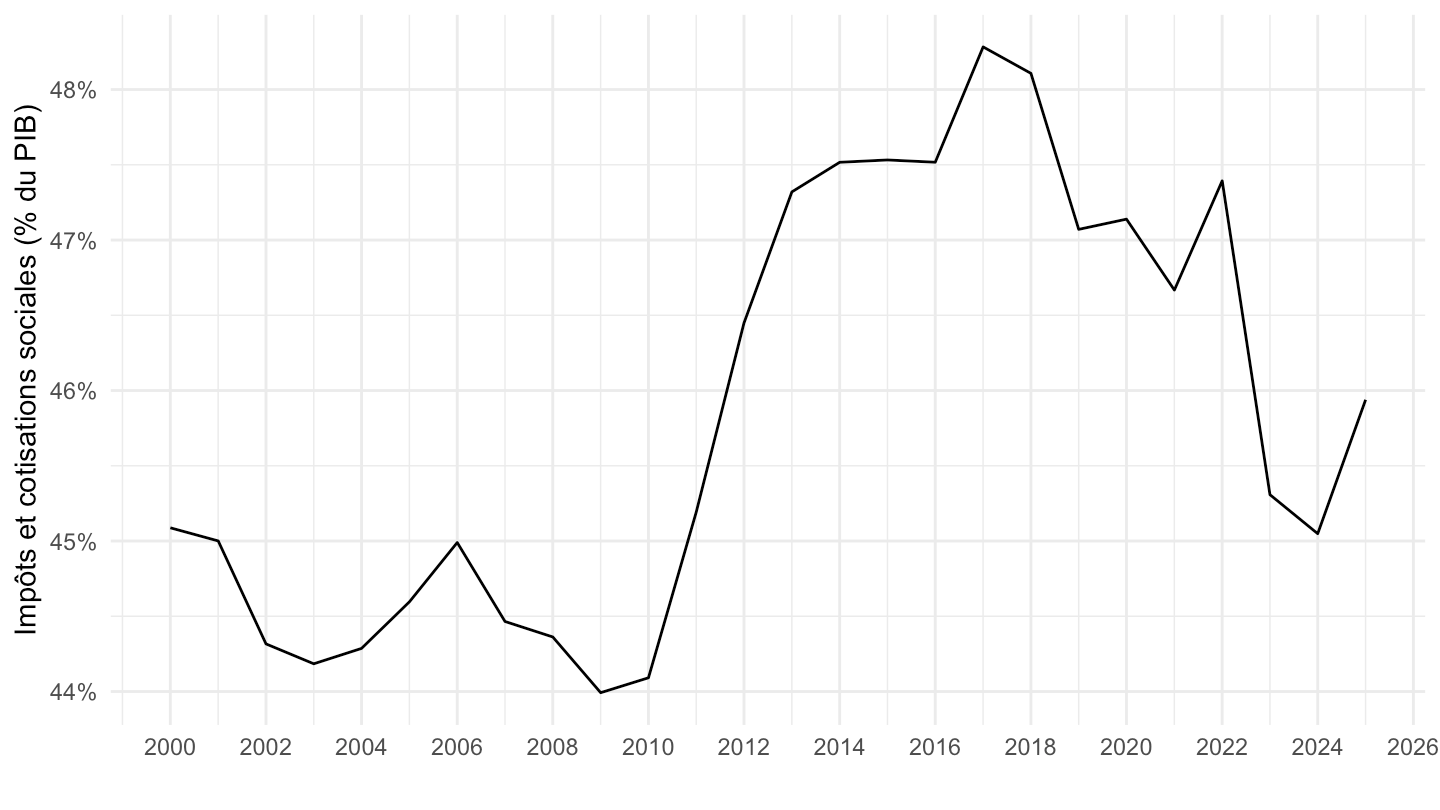
t_3201 |>
  filter(line %in% c(3, 20, 2)) |>
  select(line,year, value) |>
  spread(line, value) |>
  transmute(year,
            `Rémunération des salariés` = `3`,
            `Rémunération des salariés -- sans cotisations sociales imputées` = `3`-`20`,
            `Consommations intermédiaires` = `2`) |>
  gather(Line, value, -year) |>
  year_to_date2() |>
  left_join(gdp, by = "date") |>
  ggplot() + geom_line(aes(x = date, y = value / gdp, color = Line)) +
  theme_minimal() + xlab("") + ylab("% du PIB") +
  scale_x_date(breaks = seq(1960, 2100, 10) |> paste0("-01-01") |> as.Date(),
               labels = date_format("%Y")) +
  scale_y_continuous(breaks = 0.01*seq(0, 500, 1),
                labels = percent_format(accuracy = 1)) +

  theme(legend.position = c(0.6, 0.5),
        legend.title = element_blank()) +
  geom_label(data = . %>% filter(date %in% c(max(date), min(date), as.Date("1995-01-01"))),
                  aes(x = date, y = value/gdp, label = percent(value / gdp, 0.1), color = Line),
                  fontface ="plain")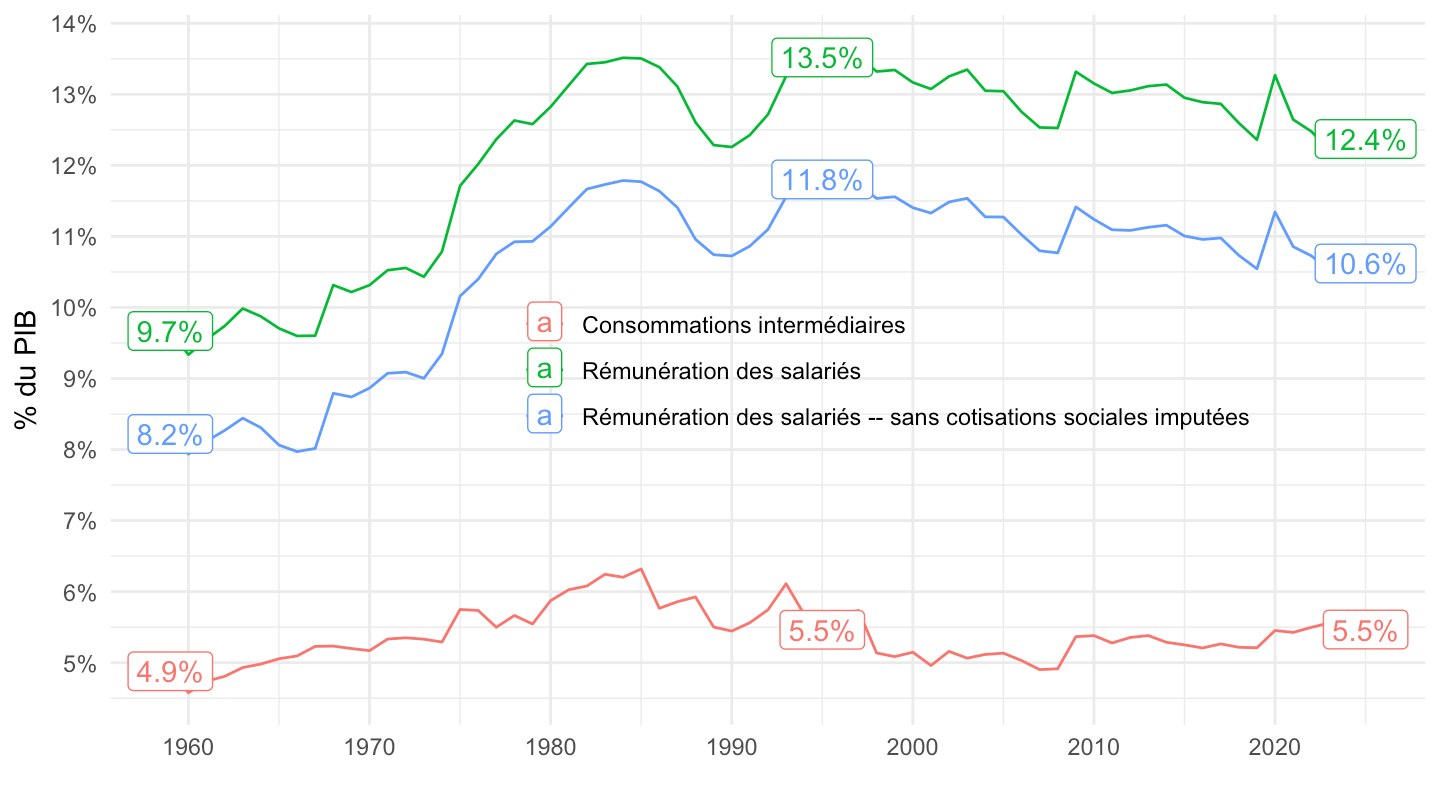
t_3201 |>
  filter(line %in% c(1, 2, 3)) |>
  year_to_date2() |>
  left_join(gdp, by = "date") |>
  mutate(value_gdp = value/gdp) |>
  ggplot() + geom_line(aes(x = date, y = value_gdp, color = Line)) +
  theme_minimal() + xlab("") + ylab("% du PIB") +
  scale_x_date(breaks = seq(1960, 2100, 10) |> paste0("-01-01") |> as.Date(),
               labels = date_format("%Y")) +
  scale_y_continuous(breaks = 0.01*seq(0, 500, 1),
                labels = percent_format(accuracy = 1),
                limits = c(0, 0.21)) +
  theme(legend.position = c(0.4, 0.14),
        legend.title = element_blank()) +
  geom_label(data = . %>% filter(date %in% c(max(date), min(date))),
             aes(x = date, y = value_gdp, color = Line, label = percent(value_gdp, acc = 0.1)))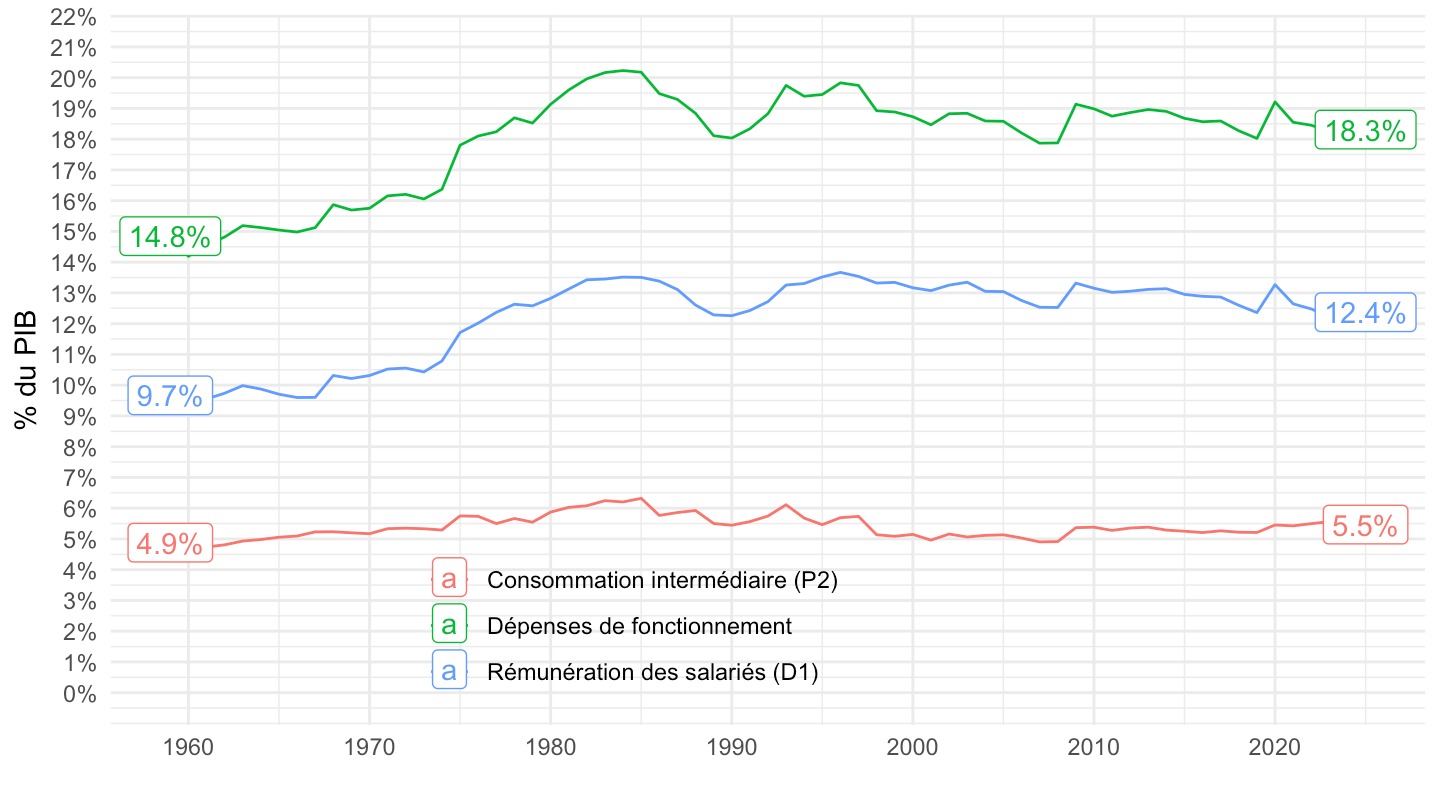
t_3201 |>
  filter(line %in% c(1, 2, 3)) |>
  year_to_date2() |>
  filter(date >= as.Date("1979-01-01")) |>
  left_join(gdp, by = "date") |>
  mutate(value_gdp = value/gdp) |>
  ggplot() + geom_line(aes(x = date, y = value_gdp, color = Line)) +
  theme_minimal() + xlab("") + ylab("% du PIB") +
  scale_x_date(breaks = seq(1960, 2100, 10) |> paste0("-01-01") |> as.Date(),
               labels = date_format("%Y")) +
  scale_y_continuous(breaks = 0.01*seq(0, 500, 1),
                labels = percent_format(accuracy = 1),
                limits = c(0, 0.21)) +
  theme(legend.position = c(0.4, 0.14),
        legend.title = element_blank()) +
  geom_label(data = . %>% filter(date %in% c(max(date), min(date))),
             aes(x = date, y = value_gdp, color = Line, label = percent(value_gdp, acc = 0.1)))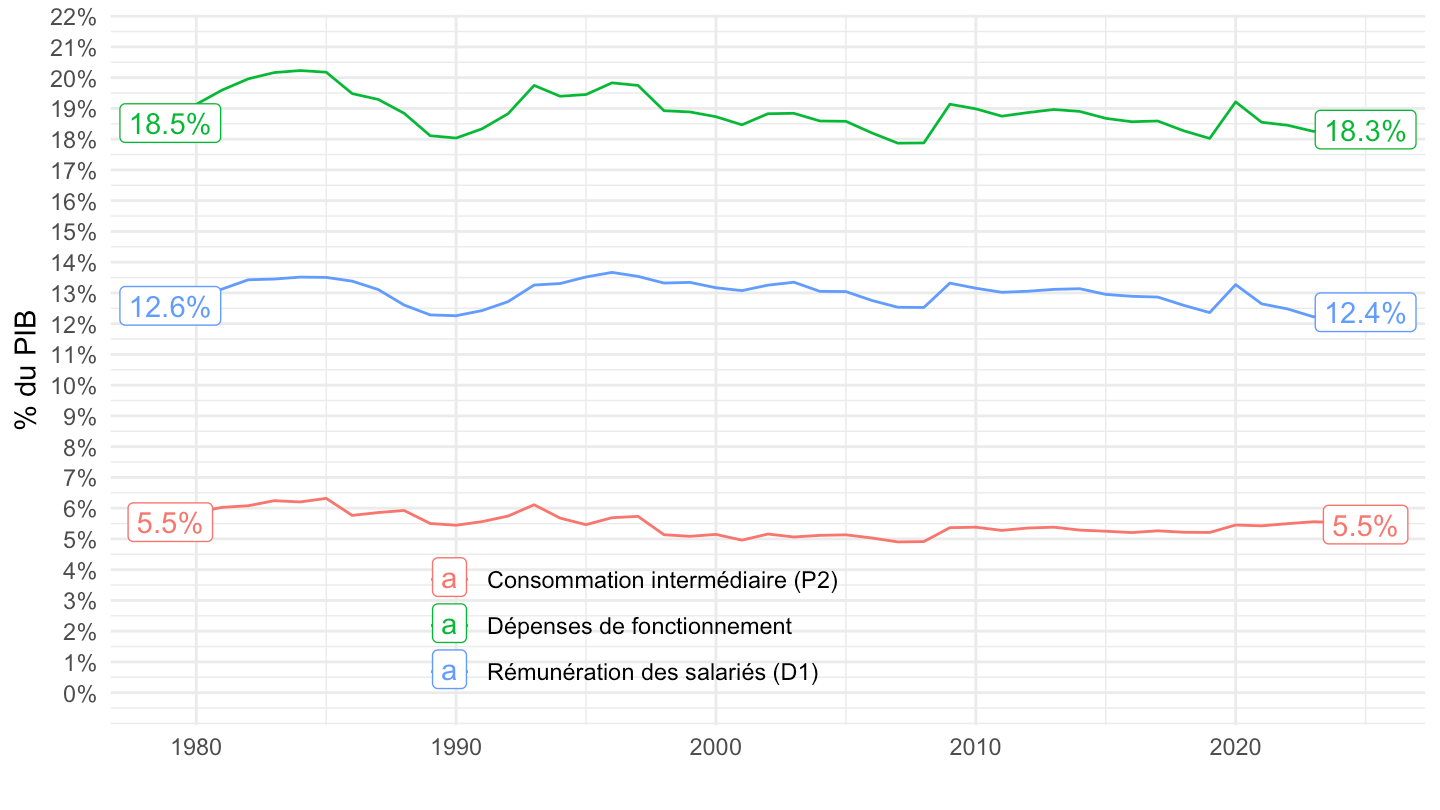
t_3201 |>
  filter(line %in% c(1, 2, 3)) |>
  year_to_date2() |>
  filter(date >= as.Date("1995-01-01")) |>
  left_join(gdp, by = "date") |>
  mutate(value_gdp = value/gdp) |>
  ggplot() + geom_line(aes(x = date, y = value_gdp, color = Line)) +
  theme_minimal() + xlab("") + ylab("% du PIB") +
  scale_x_date(breaks = seq(1960, 2100, 5) |> paste0("-01-01") |> as.Date(),
               labels = date_format("%Y")) +
  scale_y_continuous(breaks = 0.01*seq(0, 500, 1),
                labels = percent_format(accuracy = 1),
                limits = c(0, 0.21)) +
  theme(legend.position = c(0.4, 0.14),
        legend.title = element_blank()) +
  geom_label(data = . %>% filter(date %in% c(max(date), min(date))),
             aes(x = date, y = value_gdp, color = Line, label = percent(value_gdp, acc = 0.1)))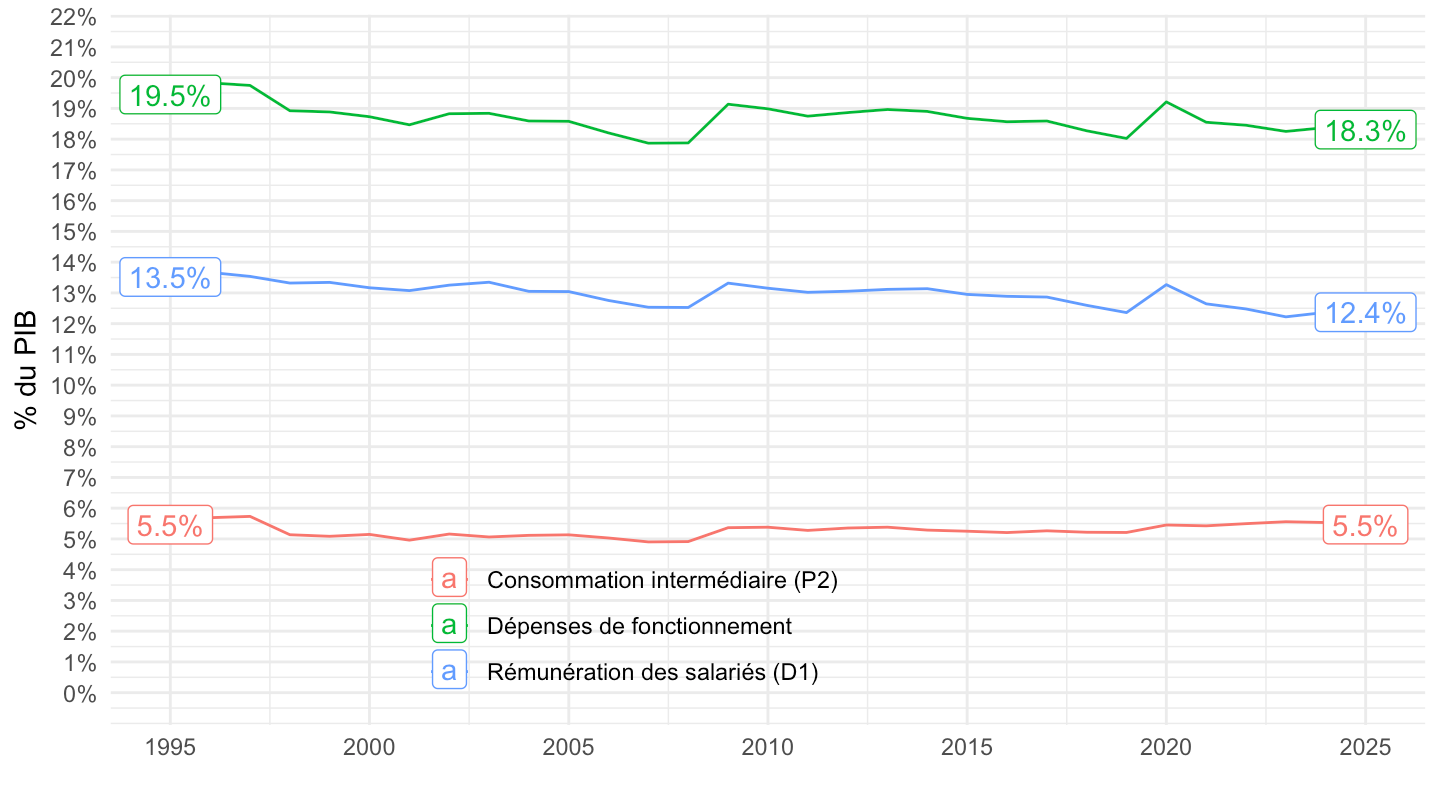
t_3201 |>
  filter(line %in% c(44, 48)) |>
  year_to_date2() |>
  left_join(gdp, by = "date") |>
  mutate(value_gdp = value/gdp) |>
  ggplot() + geom_line(aes(x = date, y = value_gdp, color = Line)) +
  theme_minimal() + xlab("") + ylab("% du PIB") +
  scale_x_date(breaks = seq(1960, 2100, 10) |> paste0("-01-01") |> as.Date(),
               labels = date_format("%Y")) +
  scale_y_continuous(breaks = 0.01*seq(0, 500, 1),
                labels = percent_format(accuracy = 1)) +
  theme(legend.position = c(0.75, 0.15),
        legend.title = element_blank()) +
  geom_label(data = . %>% filter(max(date) == date), aes(x = date, y = value_gdp, label = percent(value_gdp, acc = 0.1)))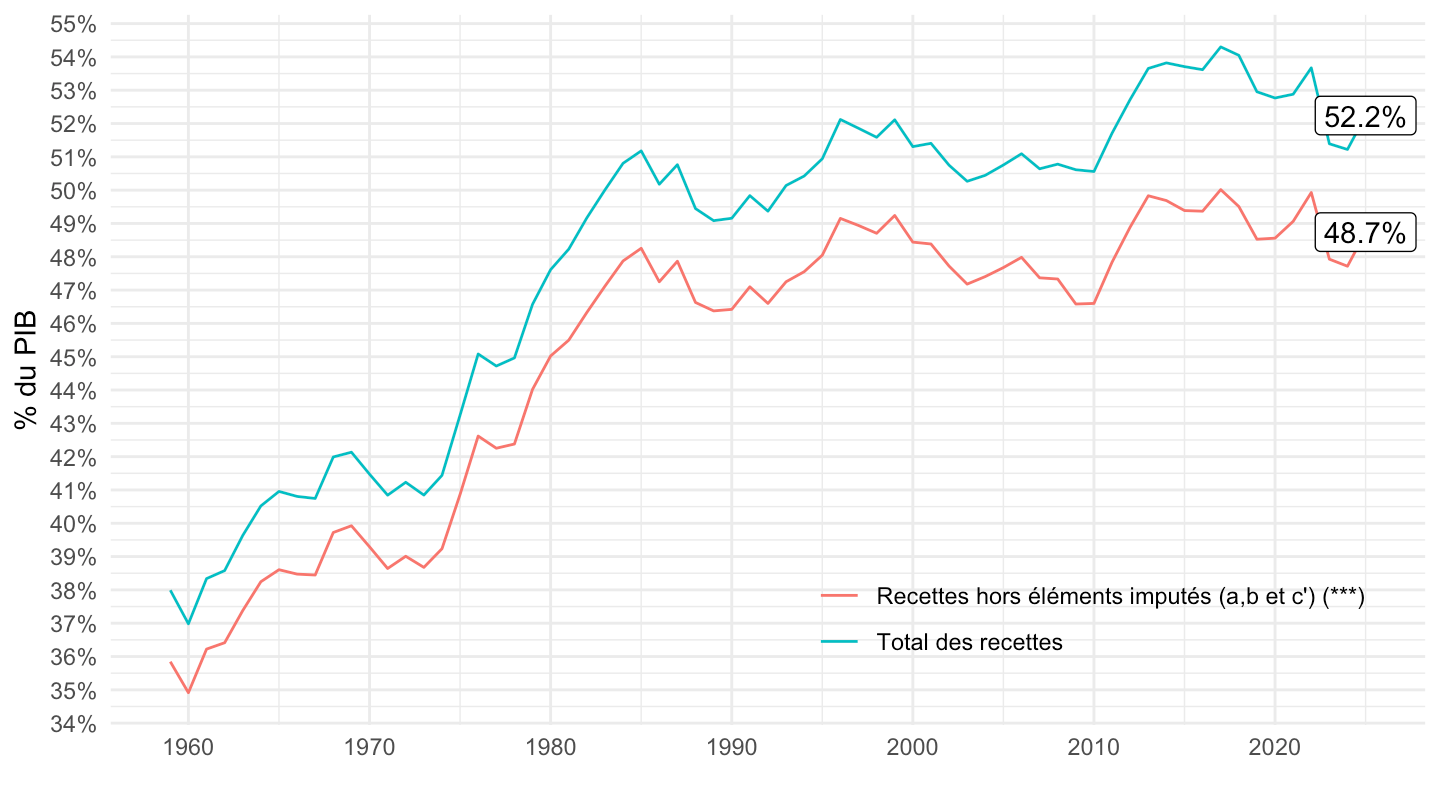
t_3201 |>
  filter(line %in% c(19, 23)) |>
  year_to_date2() |>
  left_join(gdp, by = "date") |>
  mutate(value_gdp = value/gdp) |>
  mutate(Line = ifelse(line == 23, "Total des dépenses hors éléments imputés", Line)) |>
  ggplot() + geom_line(aes(x = date, y = value_gdp, color = Line)) +
  theme_minimal() + xlab("") + ylab("Dépenses publiques (points de PIB)") +
  scale_x_date(breaks = seq(1960, 2100, 5) |> paste0("-01-01") |> as.Date(),
               labels = date_format("%Y")) +
  scale_y_continuous(breaks = 0.01*seq(0, 500, 2),
                labels = percent_format(accuracy = 1)) +
  theme(legend.position = c(0.75, 0.15),
        legend.title = element_blank()) +
  geom_label(data = . %>% filter(max(date) == date), aes(x = date, y = value_gdp, label = percent(value_gdp, acc = 0.1)))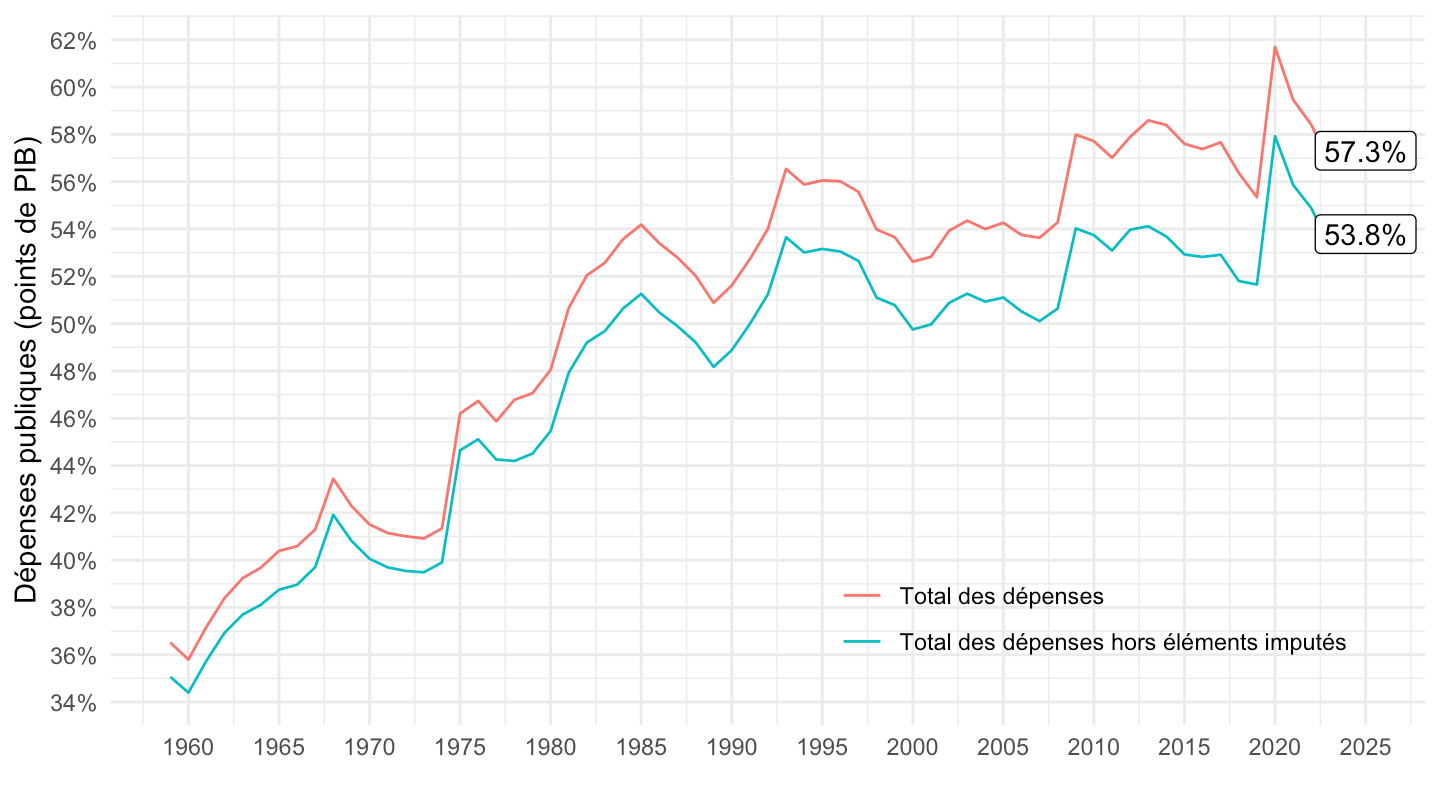
t_3201 |>
  filter(line %in% c(44, 48)) |>
  year_to_date2() |>
  left_join(gdp, by = "date") |>
  ggplot() + geom_line(aes(x = date, y = value / gdp, color = Line)) +
  theme_minimal() + xlab("") + ylab("% du PIB") +
  scale_x_date(breaks = seq(1960, 2100, 10) |> paste0("-01-01") |> as.Date(),
               labels = date_format("%Y")) +
  scale_y_continuous(breaks = 0.01*seq(0, 500, 1),
                labels = percent_format(accuracy = 1)) +
  theme(legend.position = c(0.75, 0.15),
        legend.title = element_blank())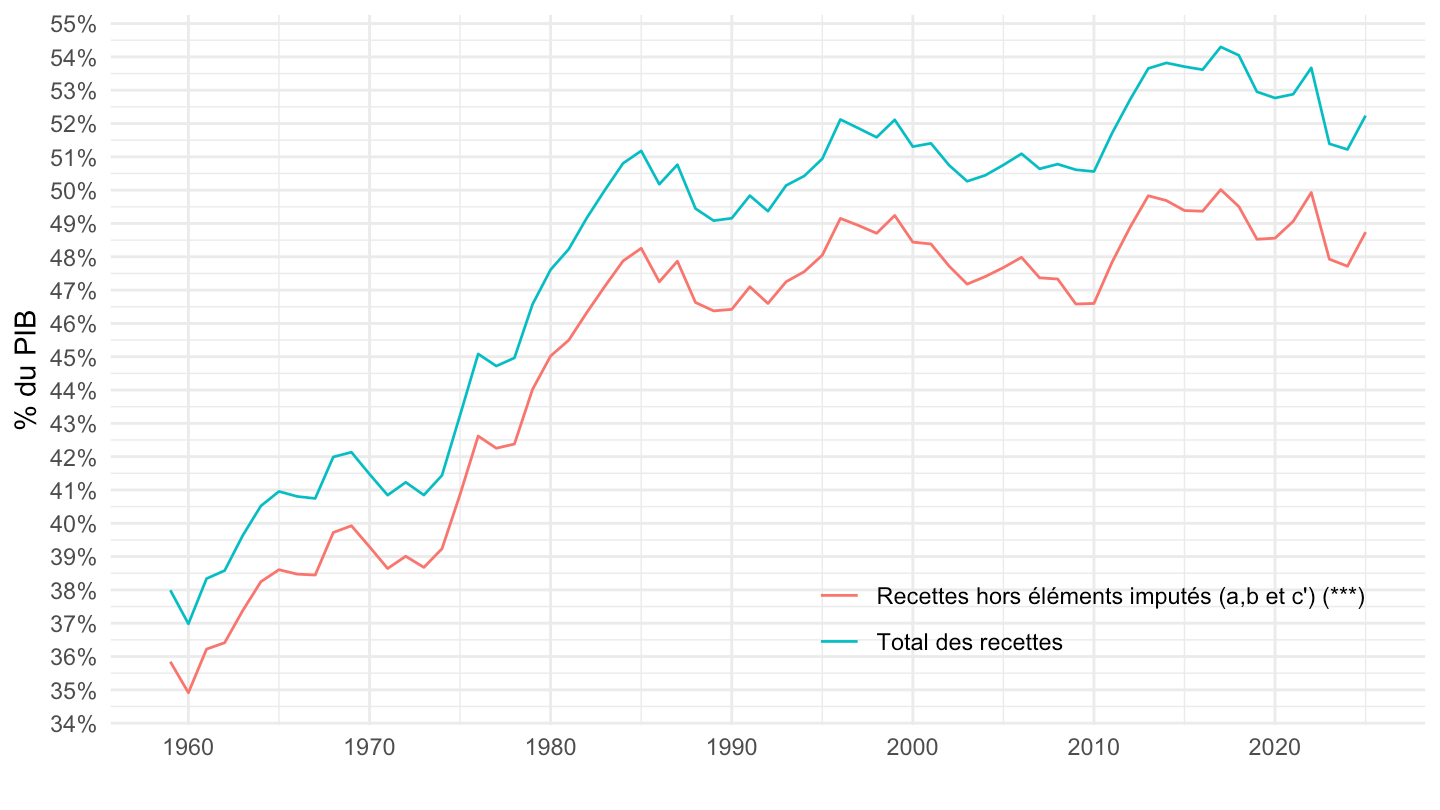
t_3201 |>
  filter(line %in% c(20)) |>
  year_to_date2() |>
  left_join(gdp, by = "date") |>
  ggplot() + geom_line(aes(x = date, y = value / gdp)) +
  theme_minimal() + xlab("") + ylab("Cotisations sociales imputées (% du PIB)") +
  scale_x_date(breaks = seq(1960, 2100, 10) |> paste0("-01-01") |> as.Date(),
               labels = date_format("%Y")) +
  scale_y_continuous(breaks = 0.01*seq(0, 500, 0.1),
                labels = percent_format(accuracy = .1)) +

  theme(legend.position = c(0.75, 0.15),
        legend.title = element_blank())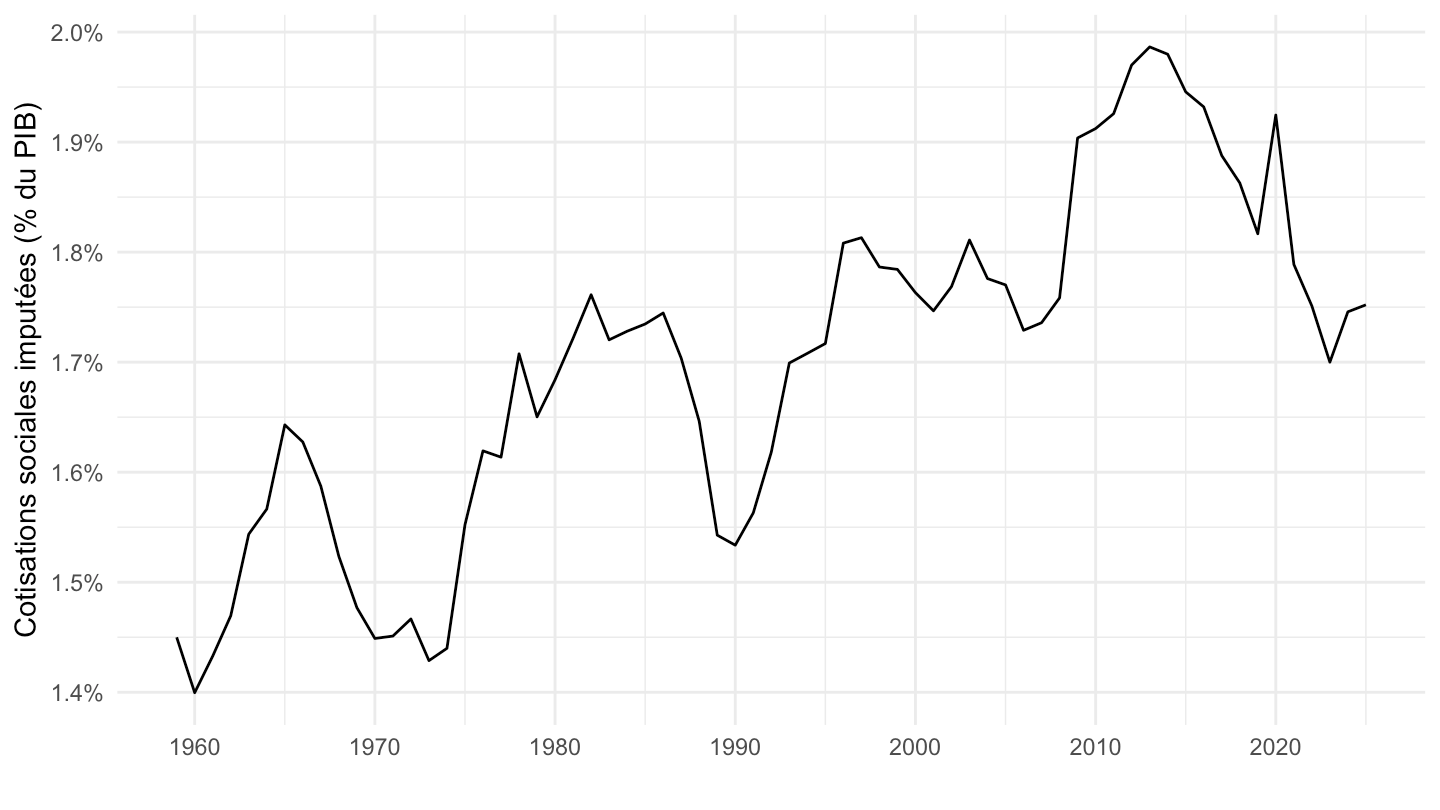
t_3201 |>
  filter(line %in% c(20, 19)) |>
  year_to_date2() |>
  select(-Line) |>
  spread(line, value) |>
  transmute(date,
            `Total des dépenses` = `19`,
            `Total des dépenses hors cotisations sociales imputées` = `19`-`20`) |>
  gather(Line, value, -date) |>
  left_join(gdp, by = "date") |>
  mutate(value_gdp = value / gdp) |>
  ggplot() + geom_line(aes(x = date, y = value / gdp, color = Line)) +
  theme_minimal() + xlab("") + ylab("Points de PIB") +
  scale_x_date(breaks = seq(1960, 2100, 5) |> paste0("-01-01") |> as.Date(),
               labels = date_format("%Y")) +
  scale_y_continuous(breaks = 0.01*seq(0, 500, 2),
                labels = percent_format(accuracy = 1)) +
  theme(legend.position = c(0.7, 0.15),
        legend.title = element_blank())+
  geom_text(data = . %>% filter(max(date) == date),
             aes(x = date, y = value_gdp, label = percent(value_gdp, acc = 0.1)))