Saving - saving
Data - Fred
Info
LAST_COMPILE
| LAST_COMPILE |
|---|
| 2026-07-25 |
Last
| date | Nobs |
|---|---|
| 2026-06-01 | 1 |
Variables - Javascript
Net lending or net borrowing (-)
All
Code
US_presidents_extract <- US_presidents %>%
  filter(start >= as.Date("1960-01-01"))
saving %>%
  filter(variable %in% c("W996RC1Q027SBEA", "W995RC1Q027SBEA", "W994RC1Q027SBEA")) %>%
  left_join(gdp_Q, by = "date") %>%
  left_join(variable, by = "variable") %>%
  mutate(value = 1000*value/gdp) %>%
  ggplot(.) +
  geom_line(aes(x = date, y = value, color = Variable)) + theme_minimal()  +
  theme(legend.title = element_blank(),
        legend.position = c(0.45, 0.9),
        axis.text.x = element_text(angle = 45, vjust = 1, hjust = 1)) +
  scale_x_date(breaks = as.Date(US_presidents_extract$start),
               labels = date_format("%Y")) +
  geom_vline(aes(xintercept = as.numeric(start)),
             data = US_presidents_extract,
             colour = "grey50", alpha = 0.5) +
  geom_rect(aes(xmin = start, xmax = end, fill = party),
         ymin = -Inf, ymax = Inf, alpha = 0.1, data = US_presidents_extract) +
  geom_text(aes(x = start, y = new, label = name),
            data = US_presidents_extract %>% mutate(new = -0.05 + 0.01 * (1:n() %% 2)),
            size = 2.5, vjust = 0, hjust = 0, nudge_x = 50) +
  # scale_fill_manual(values = viridis(3)[2:1]) +
  scale_fill_manual(values = c("white", "grey")) +
  xlab("") + ylab("Net lending or net borrowing, NIPAs (%)") +
  guides(color = guide_legend("party"), fill = FALSE) +
  scale_y_continuous(breaks = 0.01*seq(-30, 100, 2),
                     labels = scales::percent_format(accuracy = 1)) +
  geom_hline(yintercept = 0, linetype = "dashed")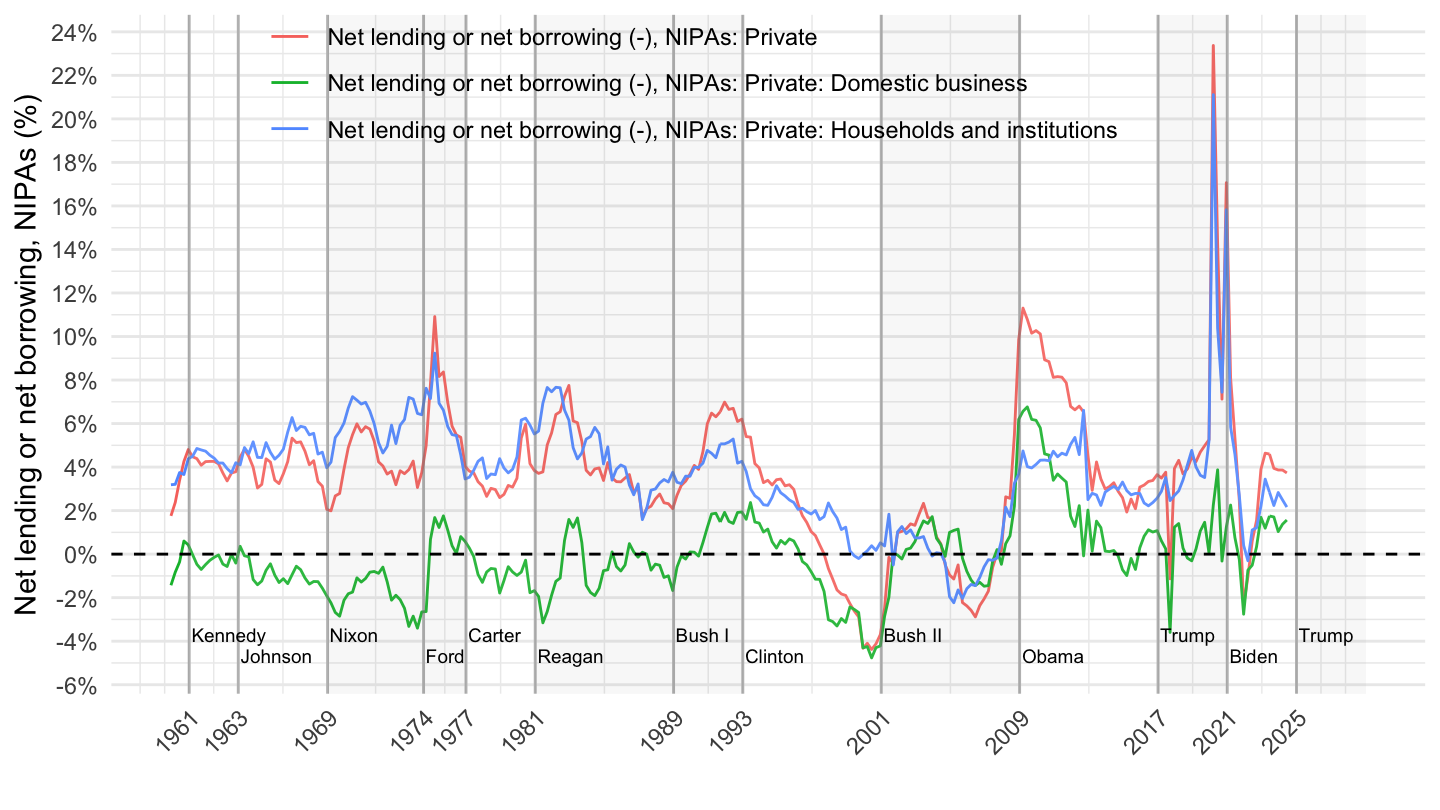
1990-
Code
US_presidents_extract <- US_presidents %>%
  filter(start >= as.Date("1990-01-01"))
saving %>%
  filter(variable %in% c("W996RC1Q027SBEA", "W995RC1Q027SBEA", "W994RC1Q027SBEA"),
         date >= as.Date("1990-01-01")) %>%
  left_join(gdp_Q, by = "date") %>%
  left_join(variable, by = "variable") %>%
  mutate(value = 1000*value/gdp) %>%
  ggplot(.) +
  geom_line(aes(x = date, y = value, color = Variable)) + theme_minimal()  +
  theme(legend.title = element_blank(),
        legend.position = c(0.45, 0.9)) +
  scale_x_date(breaks = as.Date(US_presidents_extract$start),
               labels = date_format("%Y")) +
  geom_vline(aes(xintercept = as.numeric(start)),
             data = US_presidents_extract,
             colour = "grey50", alpha = 0.5) +
  geom_rect(aes(xmin = start, xmax = end, fill = party),
         ymin = -Inf, ymax = Inf, alpha = 0.1, data = US_presidents_extract) +
  geom_text(aes(x = start, y = new, label = name),
            data = US_presidents_extract %>% mutate(new = -0.05 + 0.01 * (1:n() %% 2)),
            size = 2.5, vjust = 0, hjust = 0, nudge_x = 50) +
  # scale_fill_manual(values = viridis(3)[2:1]) +
  scale_fill_manual(values = c("white", "grey")) +
  xlab("") + ylab("Net lending or net borrowing, NIPAs (%)") +
  guides(color = guide_legend("party"), fill = FALSE) +
  scale_y_continuous(breaks = 0.01*seq(-30, 100, 2),
                     labels = scales::percent_format(accuracy = 1)) +
  geom_hline(yintercept = 0, linetype = "dashed")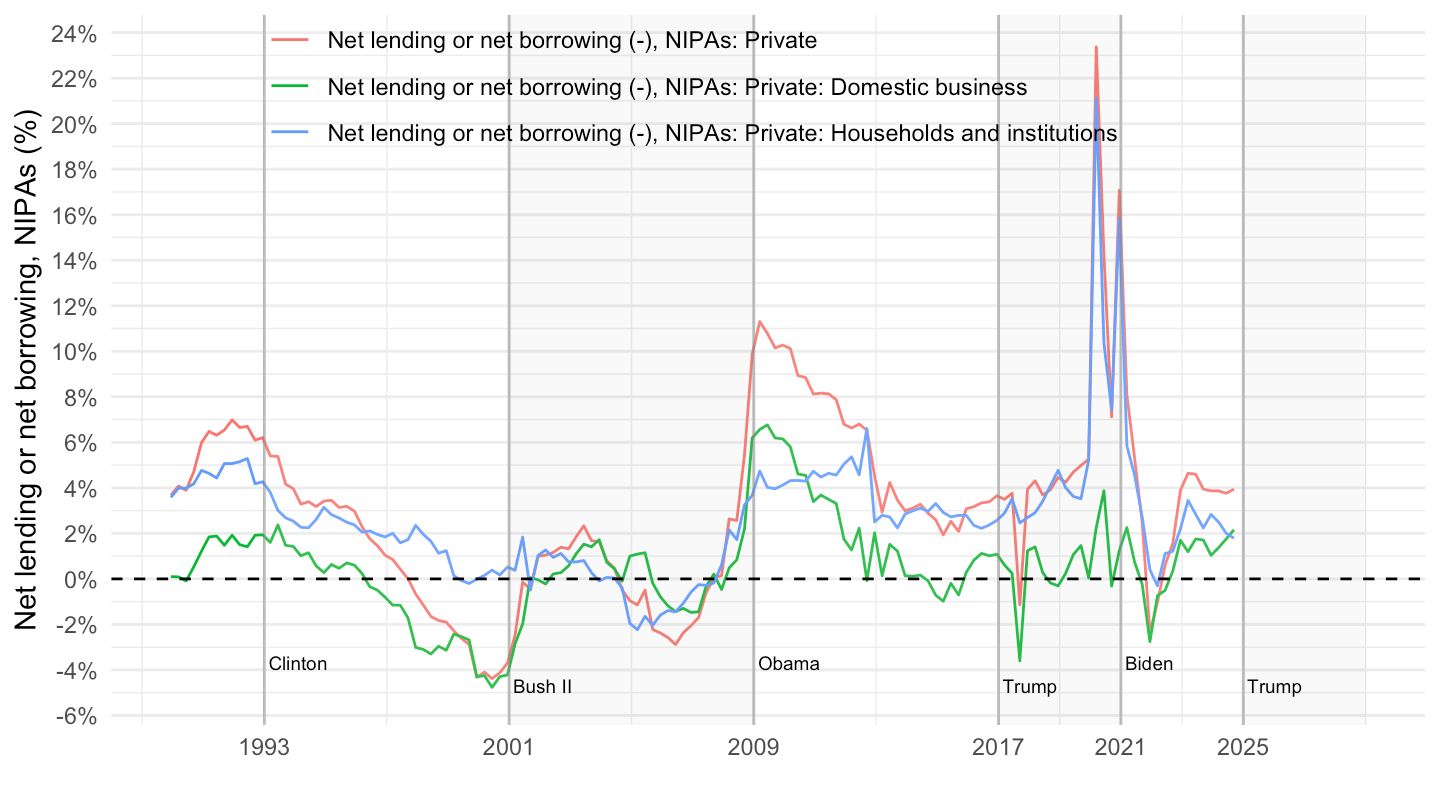
2000-
Code
US_presidents_extract <- US_presidents %>%
  filter(start >= as.Date("2000-01-01"))
saving %>%
  filter(variable %in% c("W996RC1Q027SBEA", "W995RC1Q027SBEA", "W994RC1Q027SBEA"),
         date >= as.Date("2000-01-01")) %>%
  left_join(gdp_Q, by = "date") %>%
  left_join(variable, by = "variable") %>%
  mutate(value = 1000*value/gdp) %>%
  ggplot(.) +
  geom_line(aes(x = date, y = value, color = Variable)) + theme_minimal()  +
  theme(legend.title = element_blank(),
        legend.position = c(0.45, 0.9)) +
  scale_x_date(breaks = as.Date(US_presidents_extract$start),
               labels = date_format("%Y")) +
  geom_vline(aes(xintercept = as.numeric(start)),
             data = US_presidents_extract,
             colour = "grey50", alpha = 0.5) +
  geom_rect(aes(xmin = start, xmax = end, fill = party),
         ymin = -Inf, ymax = Inf, alpha = 0.1, data = US_presidents_extract) +
  geom_text(aes(x = start, y = new, label = name),
            data = US_presidents_extract %>% mutate(new = -0.05 + 0.01 * (1:n() %% 2)),
            size = 2.5, vjust = 0, hjust = 0, nudge_x = 50) +
  # scale_fill_manual(values = viridis(3)[2:1]) +
  scale_fill_manual(values = c("white", "grey")) +
  xlab("") + ylab("Net lending or net borrowing, NIPAs (%)") +
  guides(color = guide_legend("party"), fill = FALSE) +
  scale_y_continuous(breaks = 0.01*seq(-30, 100, 2),
                     labels = scales::percent_format(accuracy = 1)) +
  geom_hline(yintercept = 0, linetype = "dashed")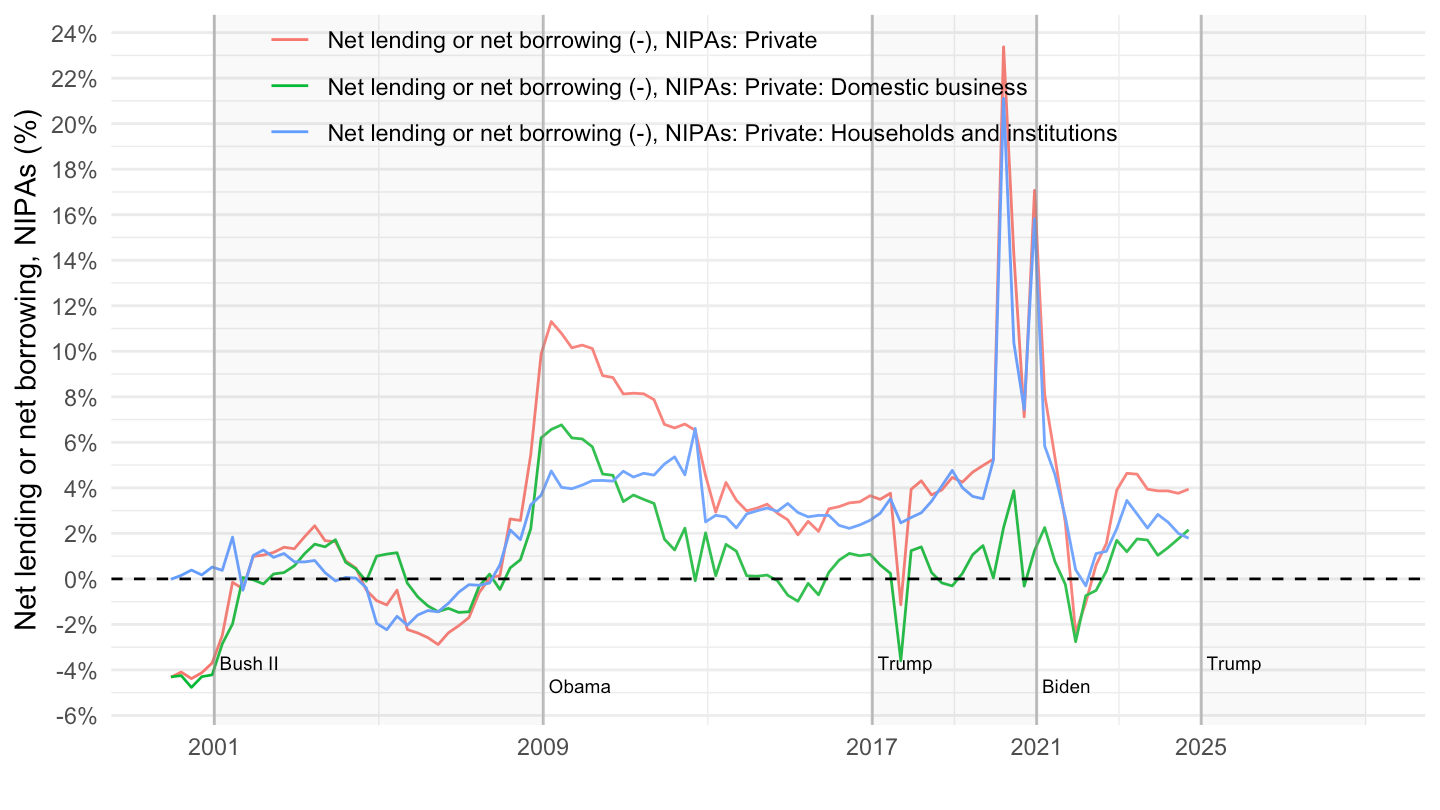
Personal Saving Rate
Personal saving rate, saving rate
All
Code
US_presidents_extract <- US_presidents %>%
  filter(start >= as.Date("1945-01-01"))

saving %>%
  filter(variable %in% c("PSAVERT", "A072RC1Q156SBEA")) %>%
  mutate(value = value / 100) %>%
  left_join(variable, by = "variable") %>%
  ggplot(.) +
  geom_line(aes(x = date, y = value, color = Variable)) + theme_minimal()  +
  theme(legend.title = element_blank(),
        legend.position = c(0.3, 0.9)) +
  scale_x_date(breaks = as.Date(US_presidents_extract$start),
               labels = date_format("%Y")) +
  geom_vline(aes(xintercept = as.numeric(start)),
             data = US_presidents_extract,
             colour = "grey50", alpha = 0.5) +
  geom_rect(aes(xmin = start, xmax = end, fill = party),
         ymin = -Inf, ymax = Inf, alpha = 0.1, data = US_presidents_extract) +
  geom_text(aes(x = start, y = new, label = name),
            data = US_presidents_extract %>% mutate(new = -0.05 + 0.01 * (1:n() %% 2)),
            size = 2.5, vjust = 0, hjust = 0, nudge_x = 50) +
  # scale_fill_manual(values = viridis(3)[2:1]) +
  scale_fill_manual(values = c("white", "grey")) +
  xlab("") + ylab("Saving rate (%)") +
  guides(color = guide_legend("party"), fill = FALSE) +
  scale_y_continuous(breaks = 0.01*seq(-30, 100, 2),
                     labels = scales::percent_format(accuracy = 1))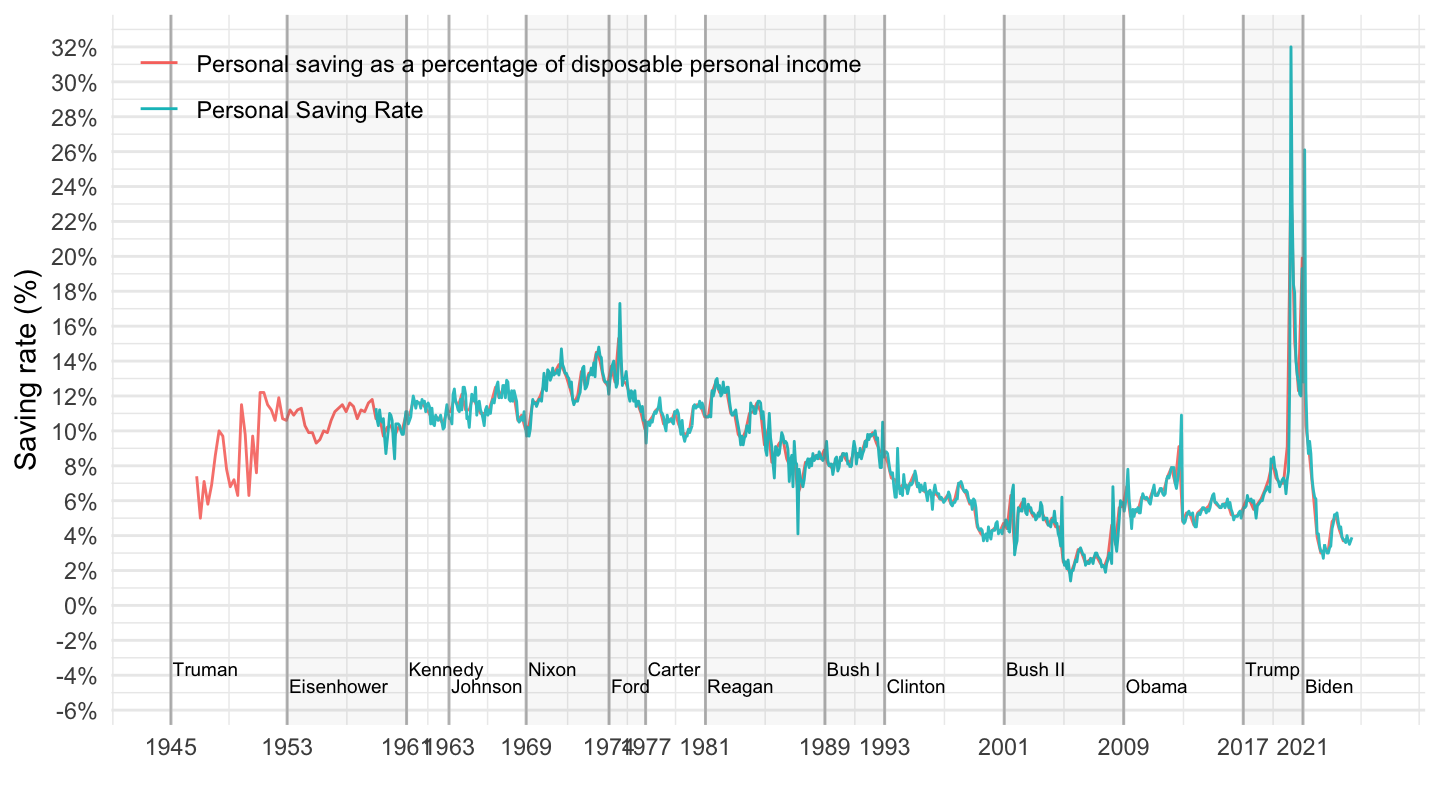
1999-
Code
US_presidents_extract <- US_presidents %>%
  filter(start >= as.Date("1999-01-01"))

saving %>%
  filter(variable %in% c("PSAVERT", "A072RC1Q156SBEA")) %>%
  mutate(value = value / 100) %>%
  left_join(variable, by = "variable") %>%
  filter(date >= as.Date("1999-01-01")) %>%
  arrange(date) %>%
  ggplot(.) +
  geom_line(aes(x = date, y = value, color = Variable)) + theme_minimal()  +
  theme(legend.title = element_blank(),
        legend.position = c(0.35, 0.9)) +
  scale_x_date(breaks = c(seq(1999, 2100, 2)) %>% paste0("-01-01") %>% as.Date,
               labels = date_format("%Y")) +
  geom_vline(aes(xintercept = as.numeric(start)),
             data = US_presidents_extract,
             colour = "grey50", alpha = 0.5) +
  geom_rect(aes(xmin = start, xmax = end, fill = party),
         ymin = -Inf, ymax = Inf, alpha = 0.1, data = US_presidents_extract) +
  geom_text(aes(x = start, y = new, label = name),
            data = US_presidents_extract %>% mutate(new = -0.05 + 0.01 * (1:n() %% 2)),
            size = 2.5, vjust = 0, hjust = 0, nudge_x = 50) +
  # scale_fill_manual(values = viridis(3)[2:1]) +
  scale_fill_manual(values = c("white", "grey")) +
  xlab("") + ylab("Saving rate (%)") +
  guides(color = guide_legend("party"), fill = FALSE) +
  scale_y_continuous(breaks = 0.01*seq(-30, 100, 2),
                     labels = scales::percent_format(accuracy = 1))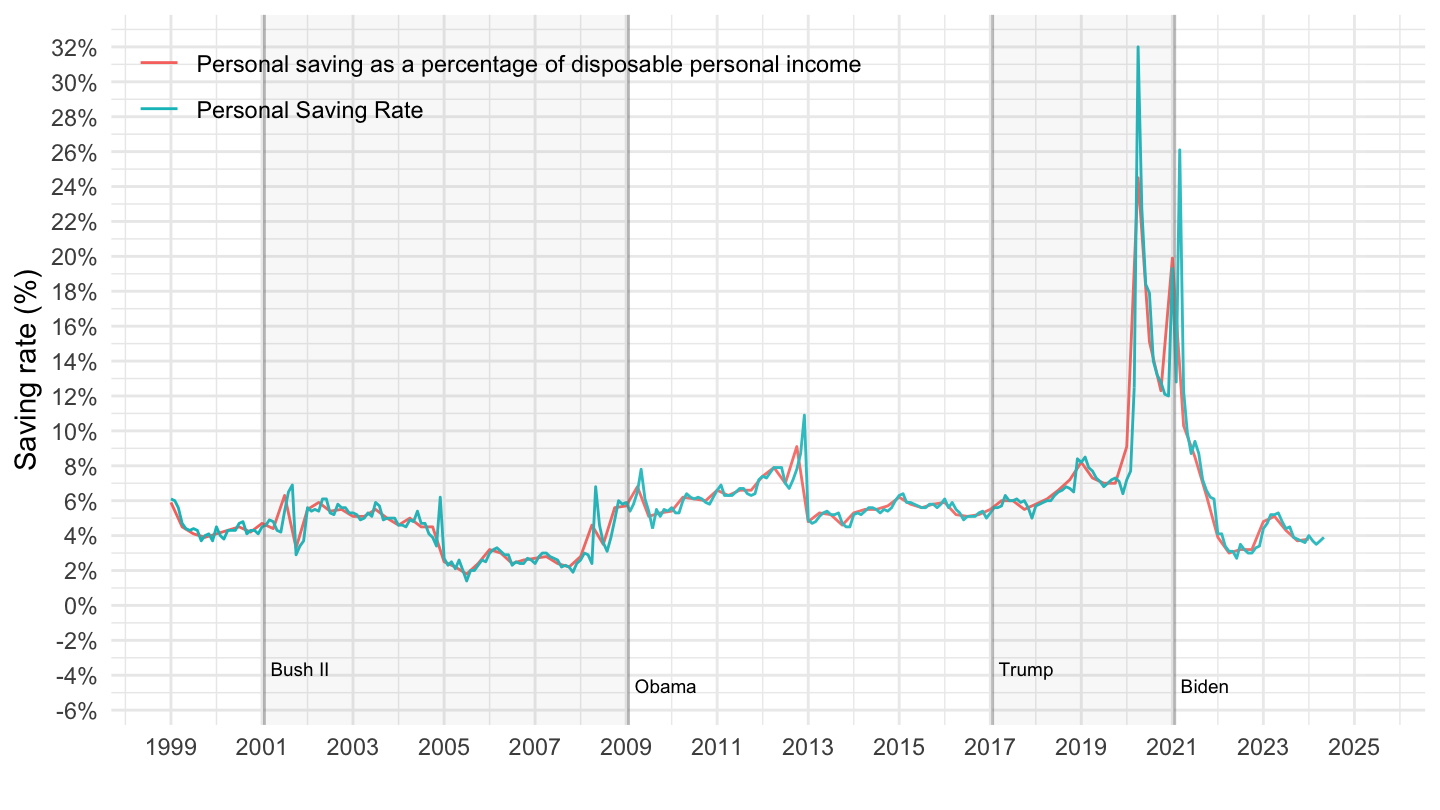
Varying definitions
Code
US_presidents_extract <- US_presidents %>%
  filter(start >= as.Date("1945-01-01"))

saving %>%
  filter(variable %in% c("PSAVERT", "W207RC1Q156SBEA", "W206RC1Q156SBEA")) %>%
  mutate(value = value / 100) %>%
  left_join(variable, by = "variable") %>%
  ggplot(.) +
  geom_line(aes(x = date, y = value, color = Variable)) + theme_minimal()  +
  theme(legend.title = element_blank(),
        legend.position = c(0.35, 0.9)) +
  scale_x_date(breaks = as.Date(US_presidents_extract$start),
               labels = date_format("%Y")) +
  geom_vline(aes(xintercept = as.numeric(start)),
             data = US_presidents_extract,
             colour = "grey50", alpha = 0.5) +
  geom_rect(aes(xmin = start, xmax = end, fill = party),
         ymin = -Inf, ymax = Inf, alpha = 0.1, data = US_presidents_extract) +
  geom_text(aes(x = start, y = new, label = name),
            data = US_presidents_extract %>% mutate(new = -0.05 + 0.01 * (1:n() %% 2)),
            size = 2.5, vjust = 0, hjust = 0, nudge_x = 50) +
  # scale_fill_manual(values = viridis(3)[2:1]) +
  scale_fill_manual(values = c("white", "grey")) +
  xlab("") + ylab("Saving rate (%)") +
  guides(color = guide_legend("party"), fill = FALSE) +
  scale_y_continuous(breaks = 0.01*seq(-30, 100, 2),
                     labels = scales::percent_format(accuracy = 1))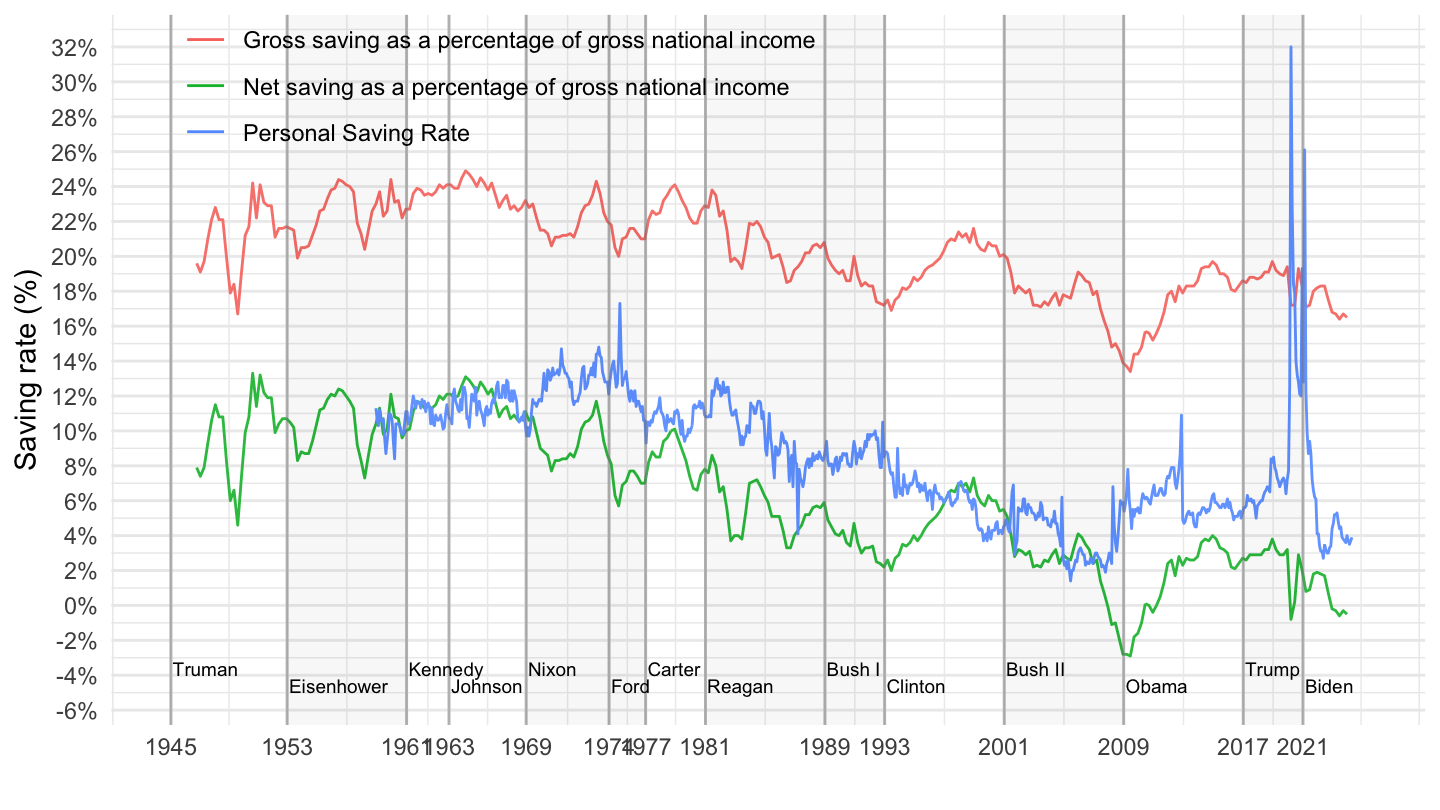
Federal Saving (% of GDP), Fed Funds
All
Code
saving %>%
  filter(variable %in% c("FYFSGDA188S", "FEDFUNDS")) %>%
  filter(date >= as.Date("1953-01-01")) %>%
  mutate(value = value / 100) %>%
  left_join(variable, by = "variable") %>%
  ggplot(.) +
  geom_line(aes(x = date, y = value, color = Variable)) + theme_minimal() +
  theme(legend.title = element_blank(),
        legend.position = c(0.4, 0.3)) +
  scale_x_date(breaks = as.Date(US_presidents_extract$start),
               labels = date_format("%Y")) +
  geom_vline(aes(xintercept = as.numeric(start)),
             data = US_presidents_extract,
             colour = "grey50", alpha = 0.5) +
  geom_rect(aes(xmin = start, xmax = end, fill = party),
         ymin = -Inf, ymax = Inf, alpha = 0.1, data = US_presidents_extract) +
  geom_text(aes(x = start, y = new, label = name),
            data = US_presidents_extract %>% mutate(new = -0.27 + 0.01 * (1:n() %% 2)),
            size = 2.5, vjust = 0, hjust = 0, nudge_x = 50) +
  # scale_fill_manual(values = viridis(3)[2:1]) +
  scale_fill_manual(values = c("white", "grey")) +
  xlab("") + ylab("%") +
  guides(color = guide_legend("party"), fill = FALSE) +
  scale_y_continuous(breaks = 0.01*seq(-30, 20, 5),
                     labels = scales::percent_format(accuracy = 1),
                     limits = c(-0.27, 0.2)) +
  geom_hline(yintercept = 0, linetype = "dashed",  color = viridis(3)[2])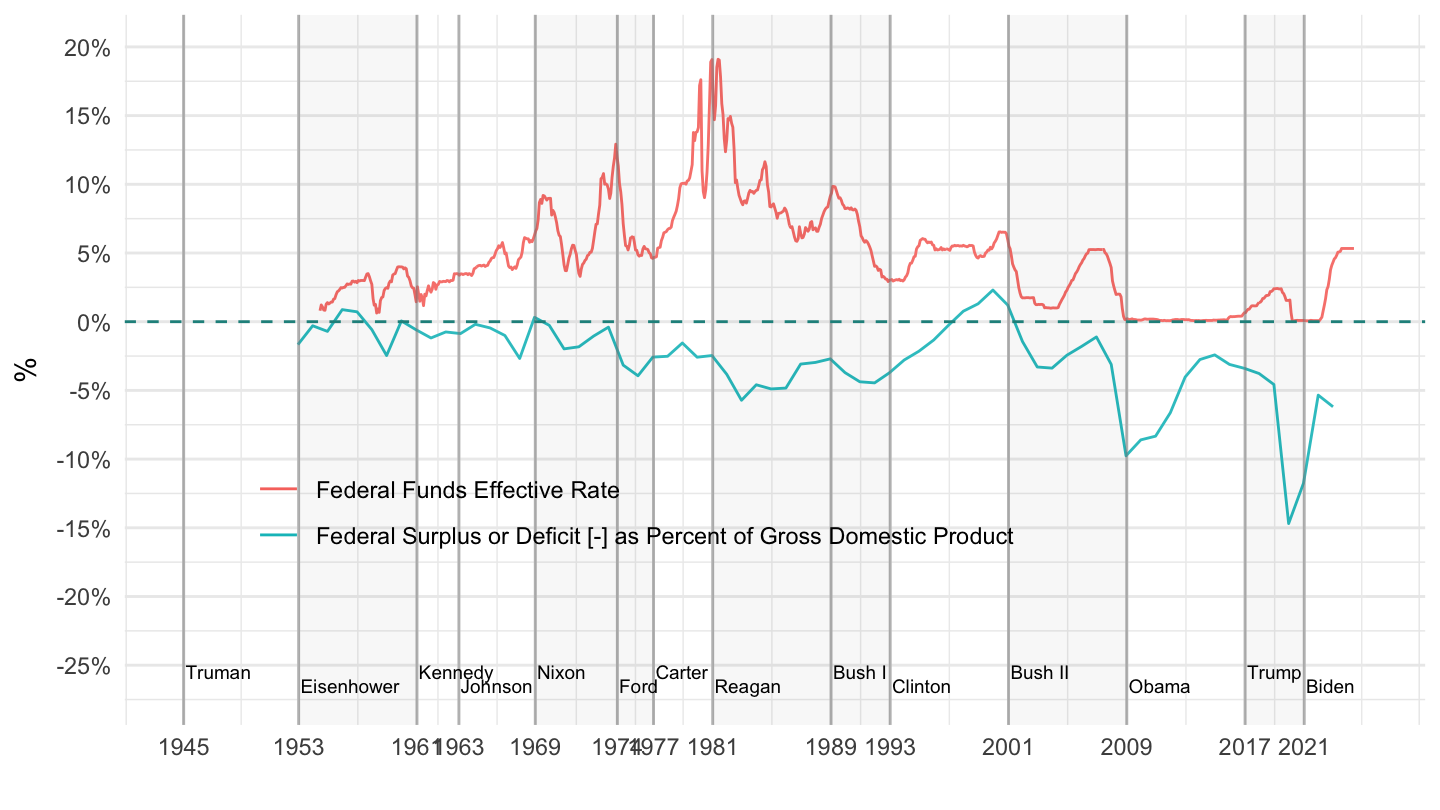
1960-2000
Code
US_presidents_extract <- US_presidents %>%
  filter(start >= as.Date("1960-01-01"),
         start <= as.Date("2000-01-01"))

saving %>%
  filter(variable %in% c("FYFSGDA188S", "FEDFUNDS")) %>%
  filter(date >= as.Date("1960-01-01"),
         date <= as.Date("2000-01-01")) %>%
  mutate(value = value / 100) %>%
  left_join(variable, by = "variable") %>%
  ggplot(.) +
  geom_line(aes(x = date, y = value, color = Variable)) + theme_minimal() +
  theme(legend.title = element_blank(),
        legend.position = c(0.4, 0.3)) +
  scale_x_date(breaks = as.Date(US_presidents_extract$start),
               labels = date_format("%Y")) +
  geom_vline(aes(xintercept = as.numeric(start)),
             data = US_presidents_extract,
             colour = "grey50", alpha = 0.5) +
  geom_rect(aes(xmin = start, xmax = end, fill = party),
         ymin = -Inf, ymax = Inf, alpha = 0.1, data = US_presidents_extract) +
  geom_text(aes(x = start, y = new, label = name),
            data = US_presidents_extract %>% mutate(new = -0.19 + 0.01 * (1:n() %% 2)),
            size = 4, vjust = 0, hjust = 0, nudge_x = 50) +
  # scale_fill_manual(values = viridis(3)[2:1]) +
  scale_fill_manual(values = c("white", "grey")) +
  xlab("") + ylab("%") +
  guides(color = guide_legend("party"), fill = FALSE) +
  scale_y_continuous(breaks = 0.01*seq(-30, 20, 5),
                     labels = scales::percent_format(accuracy = 1),
                     limits = c(-0.2, 0.2)) +
  geom_hline(yintercept = 0, linetype = "dashed",  color = viridis(3)[2])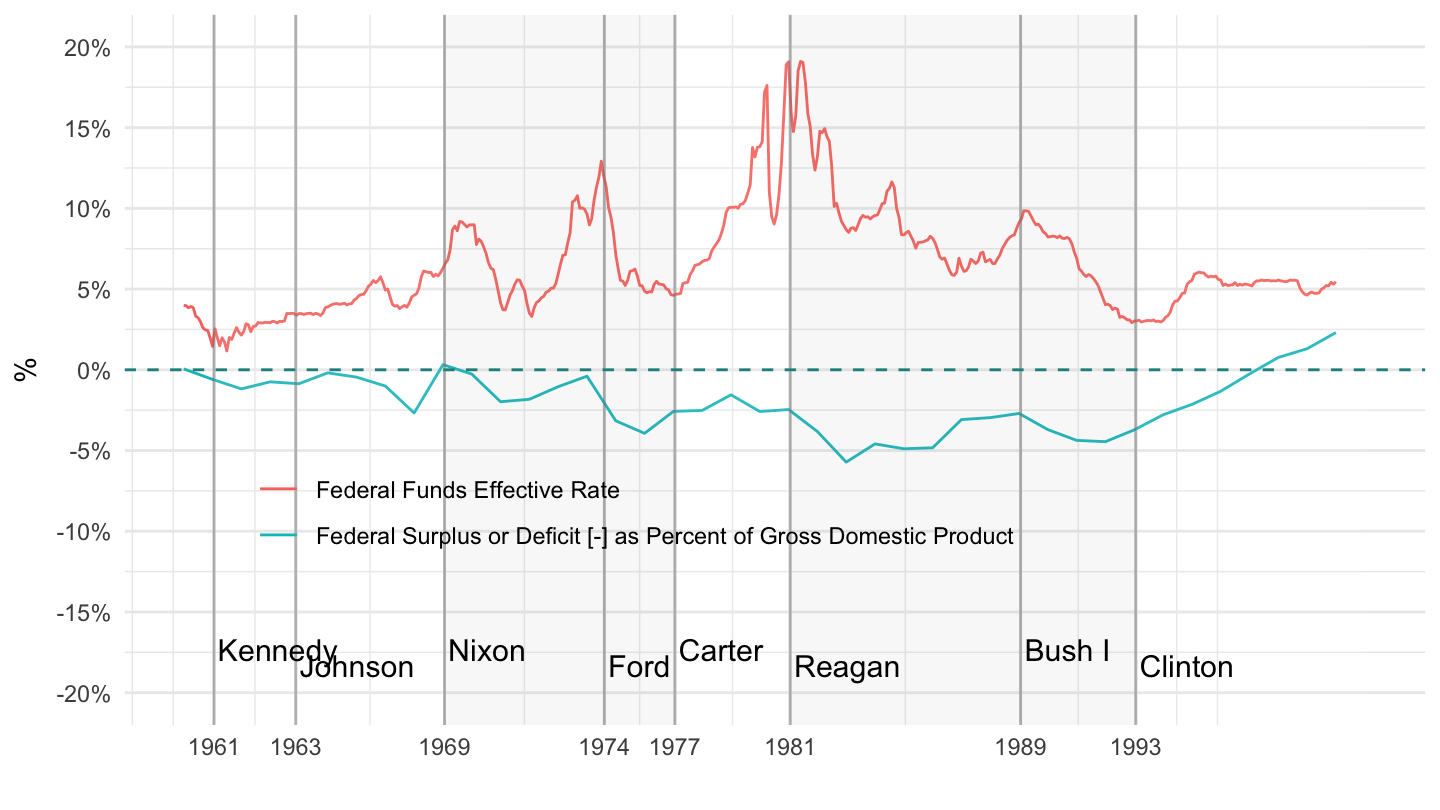
Federal Saving manually FYFSD and GDPA
All
Code
US_presidents_extract <- US_presidents %>%
  filter(start >= as.Date("1929-01-01"))

saving %>%
  filter(variable %in% c("FYFSD", "GDPA")) %>%
  select(-4, -5) %>%
  mutate(date = date %>% year,
         date = as.Date(paste0(date, "-12-31"))) %>%
  spread(variable, value) %>%
  mutate(value = FYFSD / (GDPA*1000)) %>%
  filter(date >= as.Date("1929-01-01")) %>%
  ggplot(.) +
  geom_line(aes(x = date, y = value)) + theme_minimal() +
  theme(legend.title = element_blank(),
        legend.position = c(0.3, 0.8)) +
  scale_x_date(breaks = as.Date(US_presidents_extract$start),
               labels = date_format("%y")) +
  geom_vline(aes(xintercept = as.numeric(start)),
             data = US_presidents_extract,
             colour = "grey50", alpha = 0.5) +
  geom_rect(aes(xmin = start, xmax = end, fill = party),
         ymin = -Inf, ymax = Inf, alpha = 0.1, data = US_presidents_extract) +
  geom_text(aes(x = start, y = new, label = name),
            data = US_presidents_extract %>% mutate(new = -0.27 + 0.01 * (1:n() %% 2)),
            size = 2.5, vjust = 0, hjust = 0, nudge_x = 50) +
  # scale_fill_manual(values = viridis(3)[2:1]) +
  scale_fill_manual(values = c("white", "grey")) +
  xlab("") + ylab("Budget Surplus (% of GDP)") +
  guides(color = guide_legend("party"), fill = FALSE) +
  scale_y_continuous(breaks = 0.01*seq(-30, 6, 2),
                     labels = scales::percent_format(accuracy = 1),
                     limits = c(-0.27, 0.05)) +
  geom_hline(yintercept = 0, linetype = "dashed",  color = viridis(3)[2])
1947-
Code
US_presidents_extract <- US_presidents %>%
  filter(start >= as.Date("1947-01-01"))

saving %>%
  select(-4, -5) %>%
  filter(variable %in% c("FYFSD", "GDPA")) %>%
  filter(date >= as.Date("1947-01-01")) %>%
  mutate(date = date %>% year,
         date = as.Date(paste0(date, "-12-31"))) %>%
  spread(variable, value) %>%
  mutate(value = FYFSD / (GDPA*1000)) %>%
  ggplot(.) +
  geom_line(aes(x = date, y = value)) + theme_minimal() +
  theme(legend.title = element_blank(),
        legend.position = c(0.3, 0.8)) +
  scale_x_date(breaks = as.Date(US_presidents_extract$start),
               labels = date_format("%y")) +
  geom_vline(aes(xintercept = as.numeric(start)),
             data = US_presidents_extract,
             colour = "grey50", alpha = 0.5) +
  geom_rect(aes(xmin = start, xmax = end, fill = party),
         ymin = -Inf, ymax = Inf, alpha = 0.1, data = US_presidents_extract) +
  geom_text(aes(x = start, y = new, label = name),
            data = US_presidents_extract %>% mutate(new = -0.16 + 0.01 * (1:n() %% 2)),
            size = 2.5, vjust = 0, hjust = 0, nudge_x = 50) +
  # scale_fill_manual(values = viridis(3)[2:1]) +
  scale_fill_manual(values = c("white", "grey")) +
  xlab("") + ylab("Budget Surplus (% of GDP)") +
  guides(color = guide_legend("party"), fill = FALSE) +
  scale_y_continuous(breaks = 0.01*seq(-30, 6, 2),
                     labels = scales::percent_format(accuracy = 1),
                     limits = c(-0.16, 0.05)) +
  geom_hline(yintercept = 0, linetype = "dashed",  color = viridis(3)[2])
1999-
Code
US_presidents_extract <- US_presidents %>%
  filter(start >= as.Date("1999-01-01"))

saving %>%
  select(-4, -5) %>%
  filter(variable %in% c("FYFSD", "GDPA")) %>%
  filter(date >= as.Date("1999-01-01")) %>%
  mutate(date = date %>% year,
         date = as.Date(paste0(date, "-01-01"))) %>%
  spread(variable, value) %>%
  mutate(value = FYFSD / (GDPA*1000)) %>%
  ggplot(.) +
  geom_line(aes(x = date, y = value)) + theme_minimal() +
  theme(legend.title = element_blank(),
        legend.position = c(0.3, 0.8)) +
  scale_x_date(breaks = c(seq(1999, 2100, 5), seq(1997, 2100, 5)) %>% paste0("-01-01") %>% as.Date,
               labels = date_format("%Y")) +
  geom_vline(aes(xintercept = as.numeric(start)),
             data = US_presidents_extract,
             colour = "grey50", alpha = 0.5) +
  geom_rect(aes(xmin = start, xmax = end, fill = party),
         ymin = -Inf, ymax = Inf, alpha = 0.1, data = US_presidents_extract) +
  geom_text(aes(x = start, y = new, label = name),
            data = US_presidents_extract %>% mutate(new = -0.16 + 0.01 * (1:n() %% 2)),
            size = 2.5, vjust = 0, hjust = 0, nudge_x = 50) +
  # scale_fill_manual(values = viridis(3)[2:1]) +
  scale_fill_manual(values = c("white", "grey")) +
  xlab("") + ylab("Federal Saving (% of GDP)") +
  guides(color = guide_legend("party"), fill = FALSE) +
  scale_y_continuous(breaks = 0.01*seq(-30, 6, 2),
                     labels = scales::percent_format(accuracy = 1),
                     limits = c(-0.16, 0.05)) +
  geom_hline(yintercept = 0, linetype = "dashed",  color = viridis(3)[2])
Federal Saving (FYFSGDA188S)
All
Code
US_presidents_extract <- US_presidents %>%
  filter(start >= as.Date("1923-01-01"))

saving %>%
  filter(variable %in% c("FYFSGDA188S")) %>%
  select(-4, -5) %>%
  mutate(value = value / 100) %>%
  ggplot(.) +
  geom_line(aes(x = date, y = value)) + theme_minimal() +
  theme(legend.title = element_blank(),
        legend.position = c(0.3, 0.8)) +
  scale_x_date(breaks = as.Date(US_presidents_extract$start),
               labels = date_format("%y")) +
  geom_vline(aes(xintercept = as.numeric(start)),
             data = US_presidents_extract,
             colour = "grey50", alpha = 0.5) +
  geom_rect(aes(xmin = start, xmax = end, fill = party),
         ymin = -Inf, ymax = Inf, alpha = 0.1, data = US_presidents_extract) +
  geom_text(aes(x = start, y = new, label = name),
            data = US_presidents_extract %>% mutate(new = -0.27 + 0.01 * (1:n() %% 2)),
            size = 2.5, vjust = 0, hjust = 0, nudge_x = 50) +
  # scale_fill_manual(values = viridis(3)[2:1]) +
  scale_fill_manual(values = c("white", "grey")) +
  xlab("") + ylab("Budget Surplus (% of GDP)") +
  guides(color = guide_legend("party"), fill = FALSE) +
  scale_y_continuous(breaks = 0.01*seq(-30, 6, 2),
                     labels = scales::percent_format(accuracy = 1)) +
  geom_hline(yintercept = 0, linetype = "dashed",  color = viridis(3)[2]) +
  geom_label(data = . %>% filter(date == max(date)),
             aes(x = date, y = value, label = percent(value, acc = 0.1)))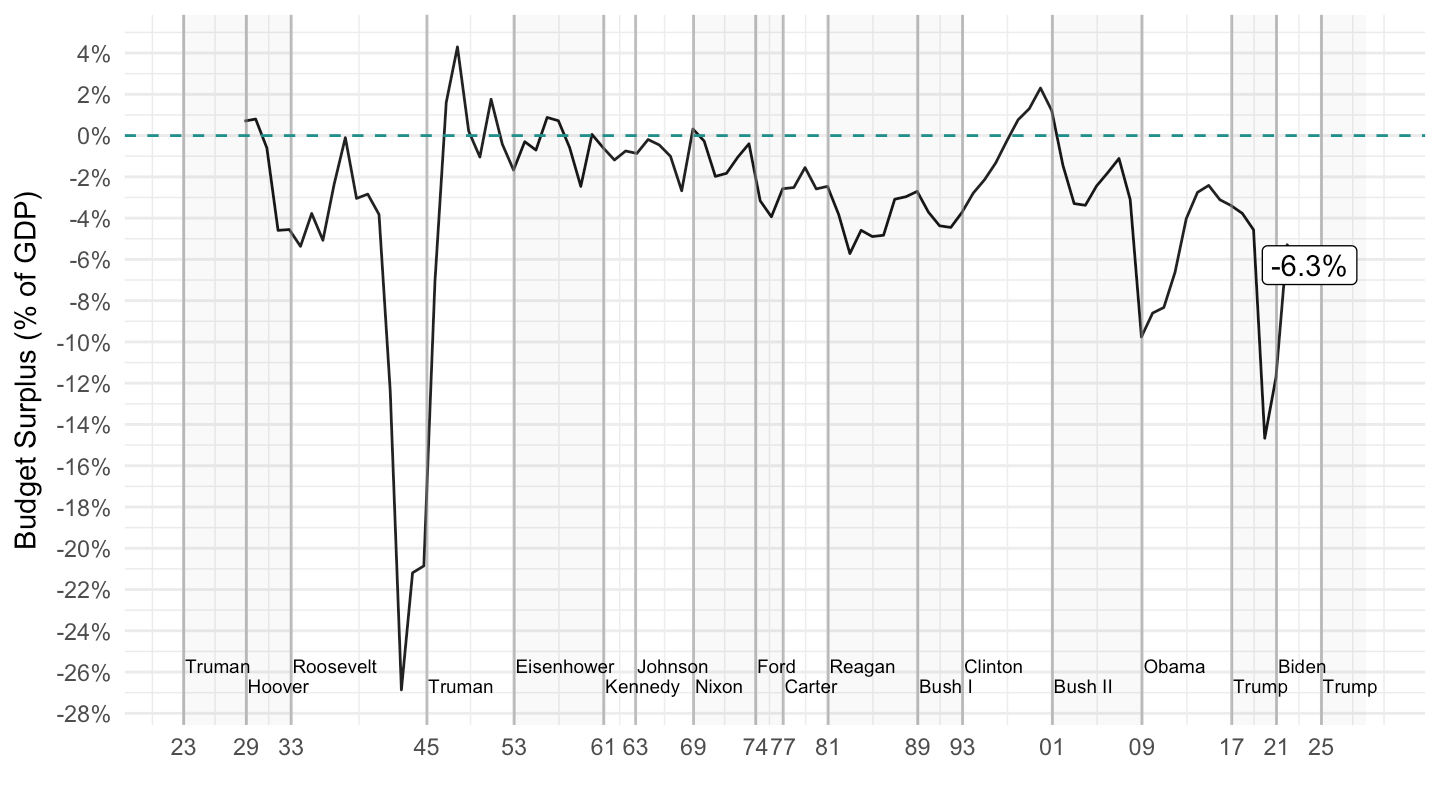
1929-
Code
US_presidents_extract <- US_presidents %>%
  filter(start >= as.Date("1929-01-01"))

saving %>%
  filter(variable %in% c("FYFSGDA188S")) %>%
  select(-4, -5) %>%
  filter(date >= as.Date("1929-01-01")) %>%
  mutate(value = value / 100) %>%
  ggplot(.) +
  geom_line(aes(x = date, y = value)) + theme_minimal() +
  theme(legend.title = element_blank(),
        legend.position = c(0.3, 0.8)) +
  scale_x_date(breaks = as.Date(US_presidents_extract$start),
               labels = date_format("%y")) +
  geom_vline(aes(xintercept = as.numeric(start)),
             data = US_presidents_extract,
             colour = "grey50", alpha = 0.5) +
  geom_rect(aes(xmin = start, xmax = end, fill = party),
         ymin = -Inf, ymax = Inf, alpha = 0.1, data = US_presidents_extract) +
  geom_text(aes(x = start, y = new, label = name),
            data = US_presidents_extract %>% mutate(new = -0.27 + 0.01 * (1:n() %% 2)),
            size = 2.5, vjust = 0, hjust = 0, nudge_x = 50) +
  # scale_fill_manual(values = viridis(3)[2:1]) +
  scale_fill_manual(values = c("white", "grey")) +
  xlab("") + ylab("Budget Surplus (% of GDP)") +
  guides(color = guide_legend("party"), fill = FALSE) +
  scale_y_continuous(breaks = 0.01*seq(-30, 6, 2),
                     labels = scales::percent_format(accuracy = 1)) +
  geom_hline(yintercept = 0, linetype = "dashed",  color = viridis(3)[2]) +
  geom_label(data = . %>% filter(date == max(date)),
             aes(x = date, y = value, label = percent(value, acc = 0.1)))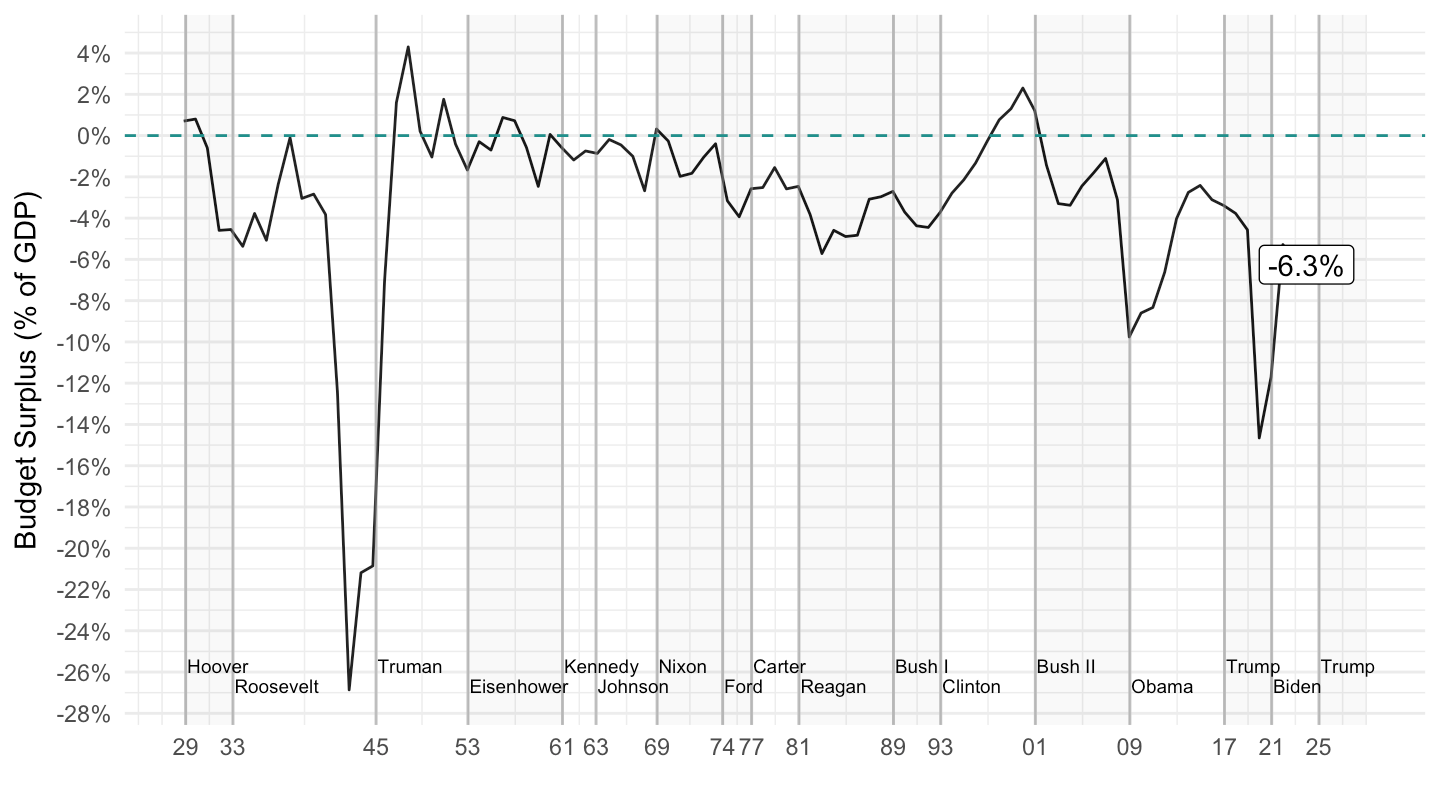
1947-
Code
US_presidents_extract <- US_presidents %>%
  filter(start >= as.Date("1945-01-01"))

saving %>%
  filter(variable %in% c("FYFSGDA188S")) %>%
  select(-4, -5) %>%
  filter(date >= as.Date("1947-01-01")) %>%
  mutate(value = value / 100) %>%
  ggplot(.) +
  geom_line(aes(x = date, y = value)) + theme_minimal() +
  theme(legend.title = element_blank(),
        legend.position = c(0.3, 0.8)) +
  scale_x_date(breaks = as.Date(US_presidents_extract$start),
               labels = date_format("%y")) +
  geom_vline(aes(xintercept = as.numeric(start)),
             data = US_presidents_extract,
             colour = "grey50", alpha = 0.5) +
  geom_rect(aes(xmin = start, xmax = end, fill = party),
         ymin = -Inf, ymax = Inf, alpha = 0.1, data = US_presidents_extract) +
  geom_text(aes(x = start, y = new, label = name),
            data = US_presidents_extract %>% mutate(new = -0.27 + 0.01 * (1:n() %% 2)),
            size = 2.5, vjust = 0, hjust = 0, nudge_x = 50) +
  # scale_fill_manual(values = viridis(3)[2:1]) +
  scale_fill_manual(values = c("white", "grey")) +
  xlab("") + ylab("Budget Surplus (% of GDP)") +
  guides(color = guide_legend("party"), fill = FALSE) +
  scale_y_continuous(breaks = 0.01*seq(-30, 6, 2),
                     labels = scales::percent_format(accuracy = 1)) +
  geom_hline(yintercept = 0, linetype = "dashed",  color = viridis(3)[2]) +
  geom_label(data = . %>% filter(date == max(date)),
             aes(x = date, y = value, label = percent(value, acc = 0.1)))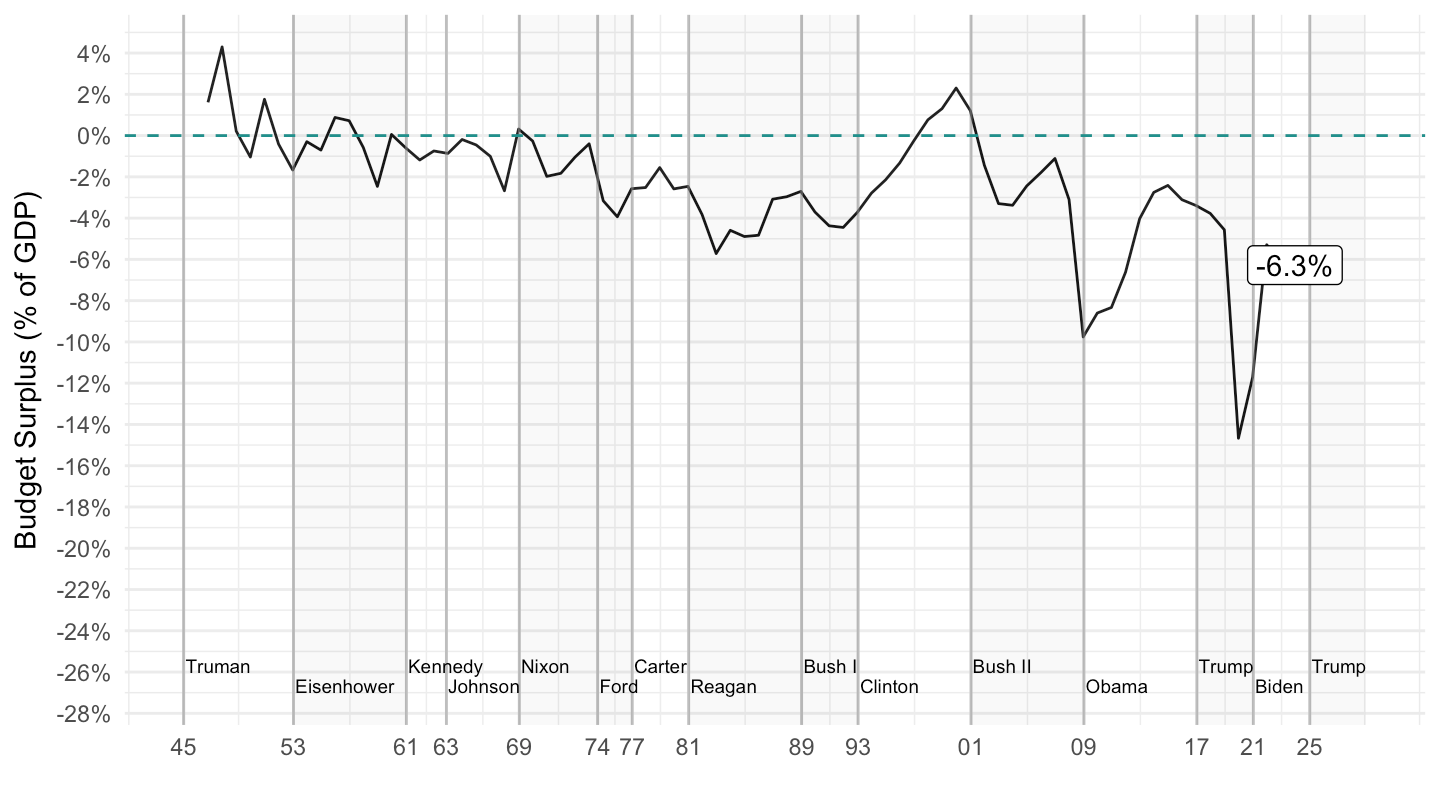
1999-
Code
US_presidents_extract <- US_presidents %>%
  filter(start >= as.Date("1999-01-01"))

saving %>%
  filter(variable %in% c("FYFSGDA188S")) %>%
  select(-4, -5) %>%
  filter(date >= as.Date("1999-01-01")) %>%
  mutate(value = value / 100) %>%
  ggplot(.) +
  geom_line(aes(x = date, y = value)) + theme_minimal() +
  theme(legend.title = element_blank(),
        legend.position = c(0.3, 0.8)) +
  scale_x_date(breaks = as.Date(US_presidents_extract$start),
               labels = date_format("%Y")) +
  geom_vline(aes(xintercept = as.numeric(start)),
             data = US_presidents_extract,
             colour = "grey50", alpha = 0.5) +
  geom_rect(aes(xmin = start, xmax = end, fill = party),
         ymin = -Inf, ymax = Inf, alpha = 0.1, data = US_presidents_extract) +
  geom_text(aes(x = start, y = new, label = name),
            data = US_presidents_extract %>% mutate(new = -0.27 + 0.01 * (1:n() %% 2)),
            size = 2.5, vjust = 0, hjust = 0, nudge_x = 50) +
  # scale_fill_manual(values = viridis(3)[2:1]) +
  scale_fill_manual(values = c("white", "grey")) +
  xlab("") + ylab("Budget Surplus (% of GDP)") +
  guides(color = guide_legend("party"), fill = FALSE) +
  scale_y_continuous(breaks = 0.01*seq(-30, 6, 2),
                     labels = scales::percent_format(accuracy = 1)) +
  geom_hline(yintercept = 0, linetype = "dashed",  color = viridis(3)[2]) +
  geom_label(data = . %>% filter(date == max(date)),
             aes(x = date, y = value, label = percent(value, acc = 0.1)))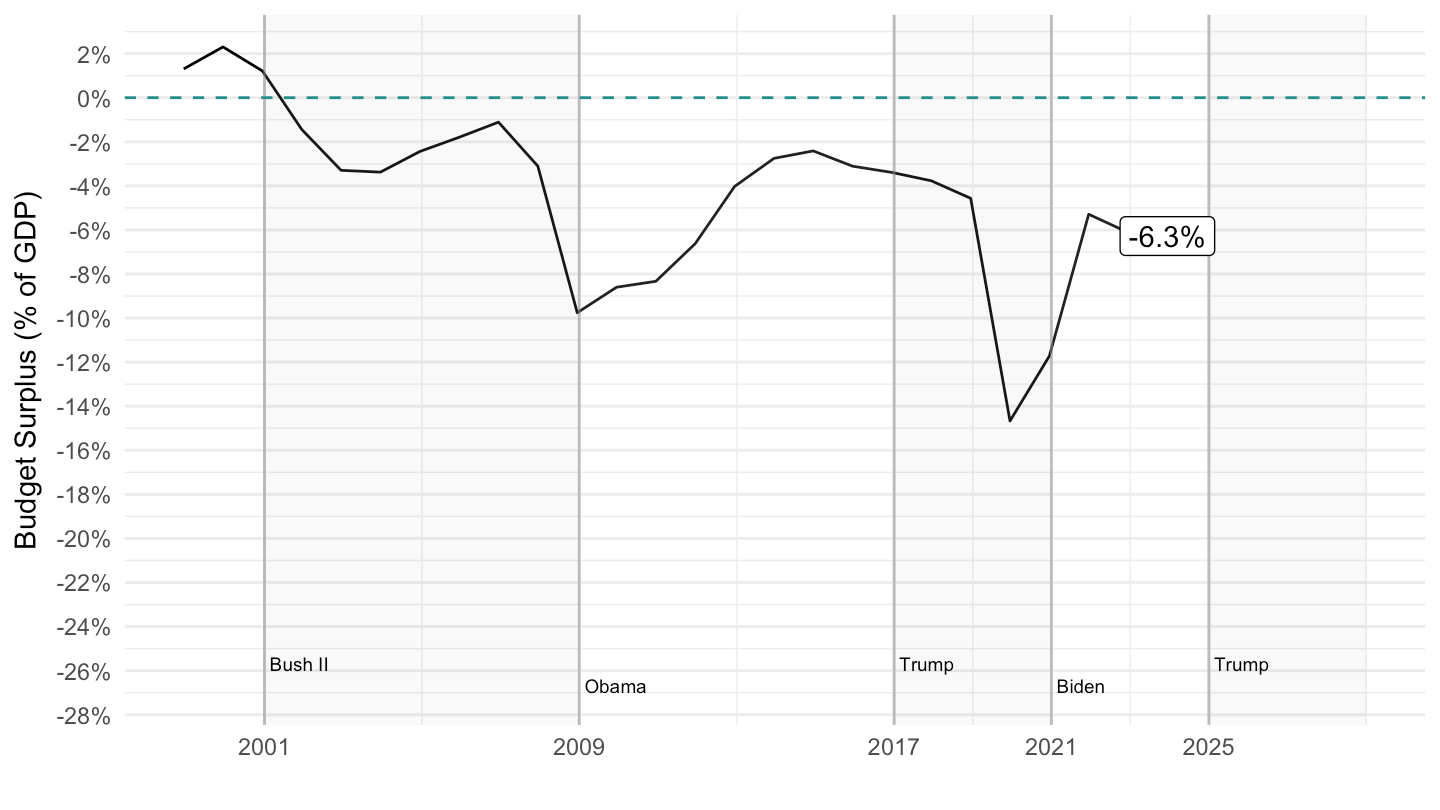
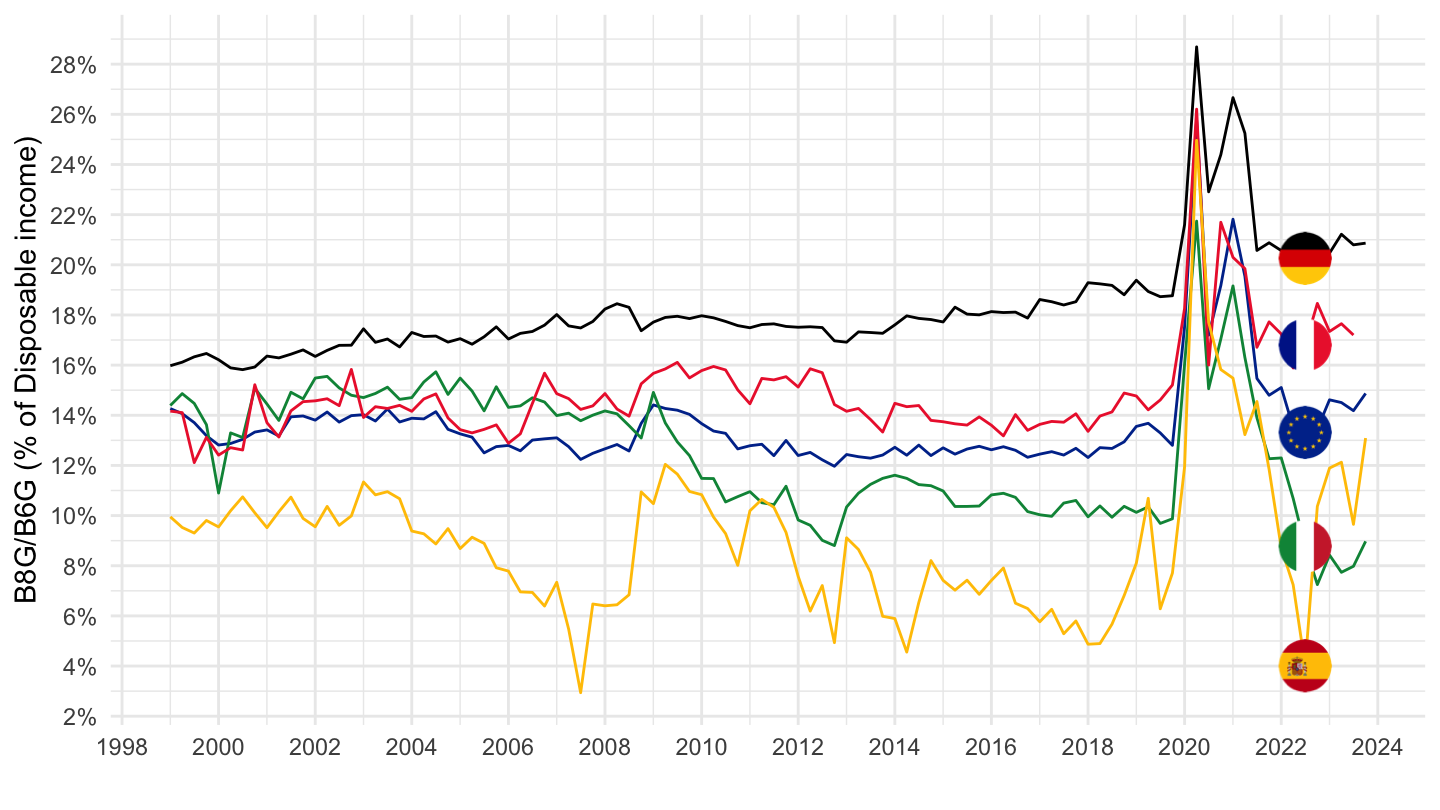
Europe
Saving Rate
Code
ig_d("eurostat", "nasq_10_nf_tr", "B8G-B6G-FR-DE-IT-ES-1999")