| source | dataset | Title | .html | .rData |
|---|---|---|---|---|
| eurostat | gov_10q_ggdebt | Quarterly government debt | 2026-07-21 | 2026-07-21 |
Quarterly government debt
Data - Eurostat
Info
LAST_COMPILE
| LAST_COMPILE |
|---|
| 2026-07-22 |
Last
Code
gov_10q_ggdebt %>%
  group_by(time) %>%
  summarise(Nobs = n()) %>%
  arrange(desc(time)) %>%
  head(1) %>%
print_table_conditional()| time | Nobs |
|---|---|
| 2025Q3 | 7613 |
unit
Code
gov_10q_ggdebt %>%
  left_join(unit, by = "unit") %>%
  group_by(unit, Unit) %>%
  summarise(Nobs = n()) %>%
  arrange(-Nobs) %>%
{if (is_html_output()) print_table(.) else .}| unit | Unit | Nobs |
|---|---|---|
| MIO_NAC | Million units of national currency | 210231 |
| MIO_EUR | Million euro | 209192 |
| PC_GDP | Percentage of gross domestic product (GDP) | 207470 |
| PC_TOT | Percentage of total | 170310 |
sector
Code
gov_10q_ggdebt %>%
  left_join(sector, by = "sector") %>%
  group_by(sector, Sector) %>%
  summarise(Nobs = n()) %>%
  arrange(-Nobs) %>%
{if (is_html_output()) print_table(.) else .}| sector | Sector | Nobs |
|---|---|---|
| S13 | General government | 172882 |
| S1312 | State government | 167540 |
| S1314 | Social security funds | 149760 |
| S1313 | Local government | 146536 |
| S1311 | Central government | 146440 |
| S13112 | Central government other than budgetary central government | 6536 |
| S13111 | Budgetary central government | 6518 |
| S11001 | Public non-financial corporations | 991 |
na_item
Code
gov_10q_ggdebt %>%
  left_join(na_item, by = "na_item") %>%
  group_by(na_item, Na_item) %>%
  summarise(Nobs = n()) %>%
  arrange(-Nobs) %>%
  {if (is_html_output()) datatable(., filter = 'top', rownames = F) else .}
geo
Code
gov_10q_ggdebt %>%
  left_join(geo, by = "geo") %>%
  group_by(geo, Geo) %>%
  summarise(Nobs = n()) %>%
  arrange(-Nobs) %>%
  mutate(Flag = gsub(" ", "-", str_to_lower(Geo)),
         Flag = paste0('<img src="../../bib/flags/vsmall/', Flag, '.png" alt="Flag">')) %>%
  select(Flag, everything()) %>%
  {if (is_html_output()) datatable(., filter = 'top', rownames = F, escape = F) else .}
time
Code
gov_10q_ggdebt %>%
  group_by(time) %>%
  summarise(Nobs = n()) %>%
  arrange(desc(time)) %>%
  print_table_conditional()
EA-19, Deficit
Code
gov_10q_ggdebt %>%
  filter(time %in% c("2022Q3", "2015Q1"),
         sector == "S13",
         unit == "PC_GDP",
         na_item == "GD") %>%
  select(geo, time, values) %>%
  spread(time, values) %>%
  left_join(geo, by = "geo") %>%
  mutate(Flag = gsub(" ", "-", str_to_lower(Geo)),
         Flag = paste0('<img src="../../bib/flags/vsmall/', Flag, '.png" alt="Flag">')) %>%
  select(Flag, Geo, geo, everything()) %>%
  arrange(-`2022Q3`) %>%
  {if (is_html_output()) datatable(., filter = 'top', rownames = F, escape = F) else .}
Last
Debt
Code
gov_10q_ggdebt %>%
  filter(sector == "S13",
         unit == "PC_GDP",
         na_item == "GD") %>%
  group_by(geo) %>%
  filter(time == max(time)) %>%
  left_join(geo, by = "geo") %>%
  select_if(~ n_distinct(.) > 1) %>%
  arrange(values) %>%
  select(geo, Geo, everything()) %>%
  print_table_conditional()
Italy, Portugal, Greece, France, Europe
Gross Debt
2005-
Code
gov_10q_ggdebt %>%
  filter(sector == "S13",
         unit == "PC_GDP",
         na_item == "GD",
         geo %in% c("IT", "PT", "EL", "FR", "EA19")) %>%
  left_join(geo, by = "geo") %>%
  quarter_to_date() %>%
  mutate(values = values / 100,
         Geo = ifelse(geo == "EA19", "Europe", Geo)) %>%
  left_join(colors, by = c("Geo" = "country")) %>%
  filter(date >= as.Date("2005-01-01")) %>%
  ggplot(.) + theme_minimal() + xlab("") + ylab("Public debt (years of GDP)") +
  geom_line(aes(x = date, y = values, color = color)) +
  scale_color_identity() + add_5flags +
  theme(legend.position = c(0.2, 0.85),
        legend.title = element_blank()) +
  scale_y_continuous(breaks = 0.01*seq(0, 260, 20),
                     labels = scales::dollar_format(acc = .1, pre = "", su = " y")) +
  scale_x_date(breaks = as.Date(paste0(seq(1990, 2025, 2), "-01-01")),
               labels = date_format("%Y"))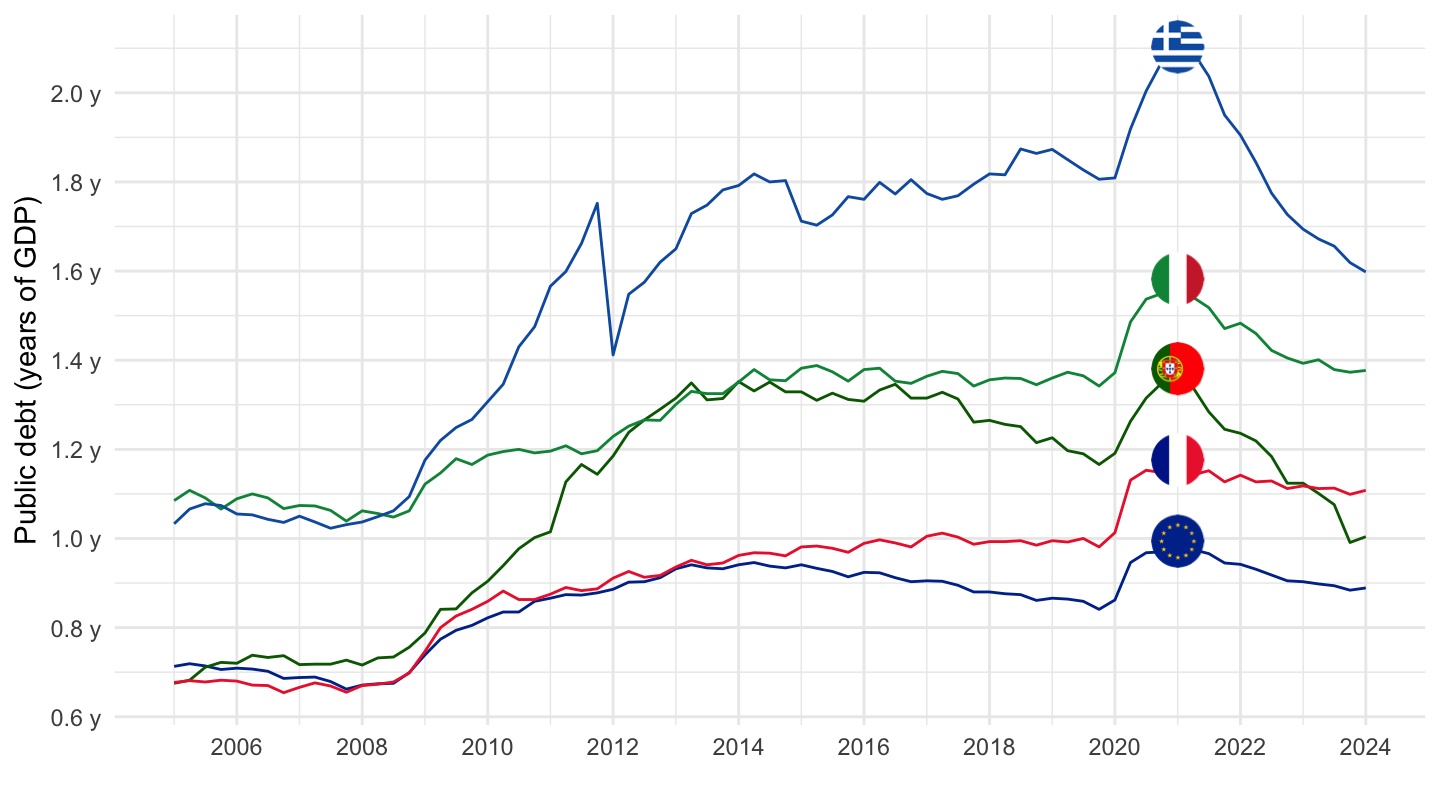
Luxembourg, Denmark, Sweden, Netherlands, Germany, France
All
English
Code
gov_10q_ggdebt %>%
  filter(sector == "S13",
         unit == "PC_GDP",
         na_item == "GD",
         geo %in% c("NL", "LU", "DK", "SE", "FR", "DE")) %>%
  left_join(geo, by = "geo") %>%
  quarter_to_date() %>%
  left_join(colors, by = c("Geo" = "country")) %>%
  mutate(values = values / 100) %>%
  ggplot(.) + theme_minimal() + xlab("") + ylab("Public debt (years of GDP)") +
  geom_line(aes(x = date, y = values, color = color)) +
  scale_color_identity() + add_6flags +
  theme(legend.position = c(0.2, 0.85),
        legend.title = element_blank()) +
  scale_y_continuous(breaks = 0.01*seq(0, 260, 10),
                     labels = scales::dollar_format(acc = .1, pre = "", su = " year")) +
  scale_x_date(breaks = as.Date(paste0(seq(1700, 2050, 2), "-01-01")),
               labels = date_format("%Y"))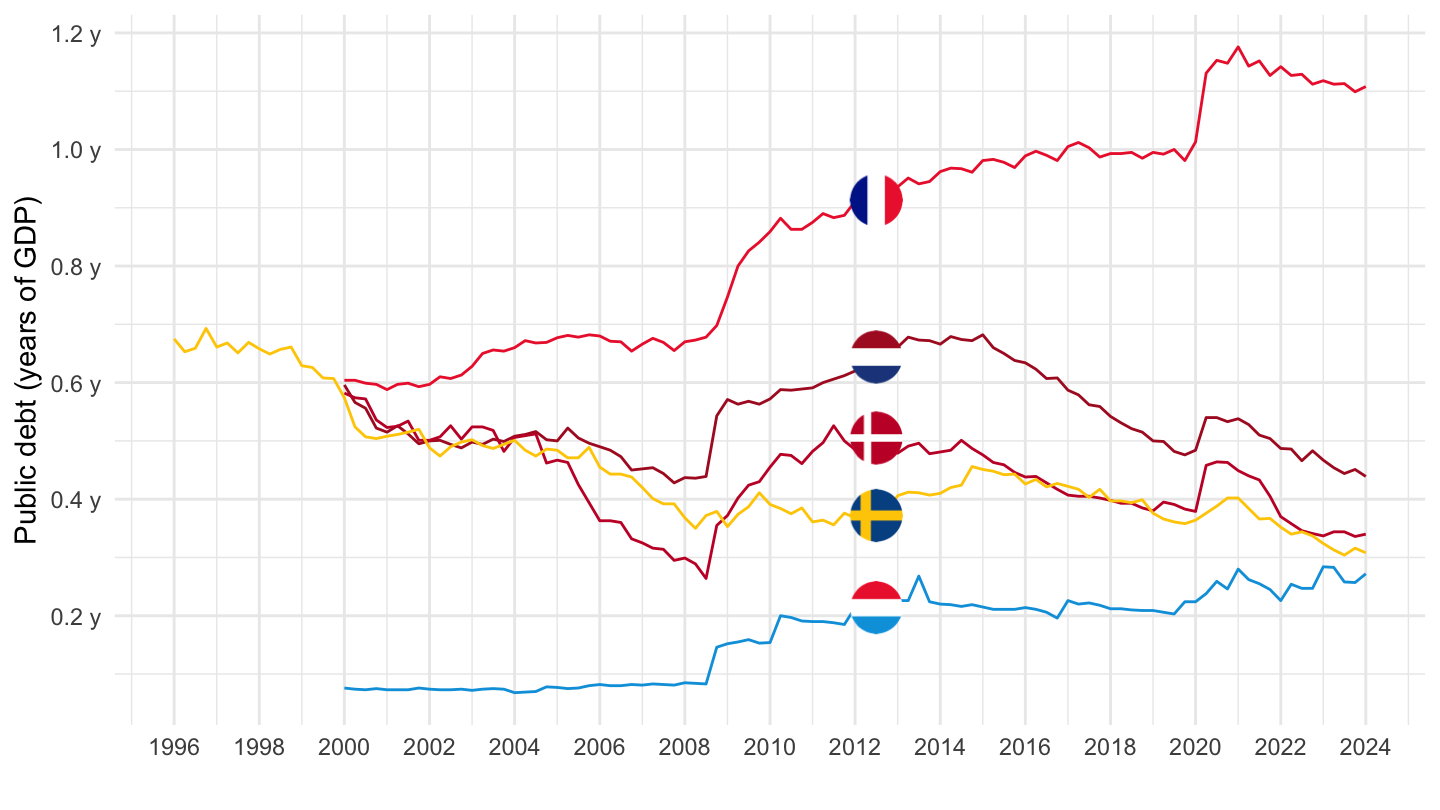
French
Code
gov_10q_ggdebt %>%
  filter(sector == "S13",
         unit == "PC_GDP",
         na_item == "GD",
         geo %in% c("NL", "LU", "DK", "SE", "FR", "DE")) %>%
  left_join(geo, by = "geo") %>%
  quarter_to_date() %>%
  left_join(colors, by = c("Geo" = "country")) %>%
  mutate(values = values / 100) %>%
  ggplot(.) + theme_minimal() + xlab("") + ylab("Dette publique (années de PIB)") +
  geom_line(aes(x = date, y = values, color = color)) +
  scale_color_identity() + add_6flags +
  theme(legend.position = c(0.2, 0.85),
        legend.title = element_blank()) +
  scale_y_continuous(breaks = 0.01*seq(0, 260, 10),
                     labels = scales::dollar_format(acc = .1, pre = "", su = " année")) +
  scale_x_date(breaks = as.Date(paste0(seq(1700, 2050, 2), "-01-01")),
               labels = date_format("%Y"))
2000-
Code
gov_10q_ggdebt %>%
  filter(sector == "S13",
         unit == "PC_GDP",
         na_item == "GD",
         geo %in% c("NL", "LU", "DK", "SE", "FR", "DE")) %>%
  left_join(geo, by = "geo") %>%
  quarter_to_date() %>%
  left_join(colors, by = c("Geo" = "country")) %>%
  mutate(values = values / 100) %>%
  filter(date >= as.Date("2000-01-01")) %>%
  ggplot(.) + theme_minimal() + xlab("") + ylab("Public debt (years of GDP)") +
  geom_line(aes(x = date, y = values, color = color)) +
  scale_color_identity() + add_6flags +
  theme(legend.position = c(0.2, 0.85),
        legend.title = element_blank()) +
  scale_y_continuous(breaks = 0.01*seq(0, 260, 10),
                     labels = scales::dollar_format(acc = .1, pre = "", su = " year")) +
  scale_x_date(breaks = as.Date(paste0(seq(1700, 2050, 2), "-01-01")),
               labels = date_format("%Y"))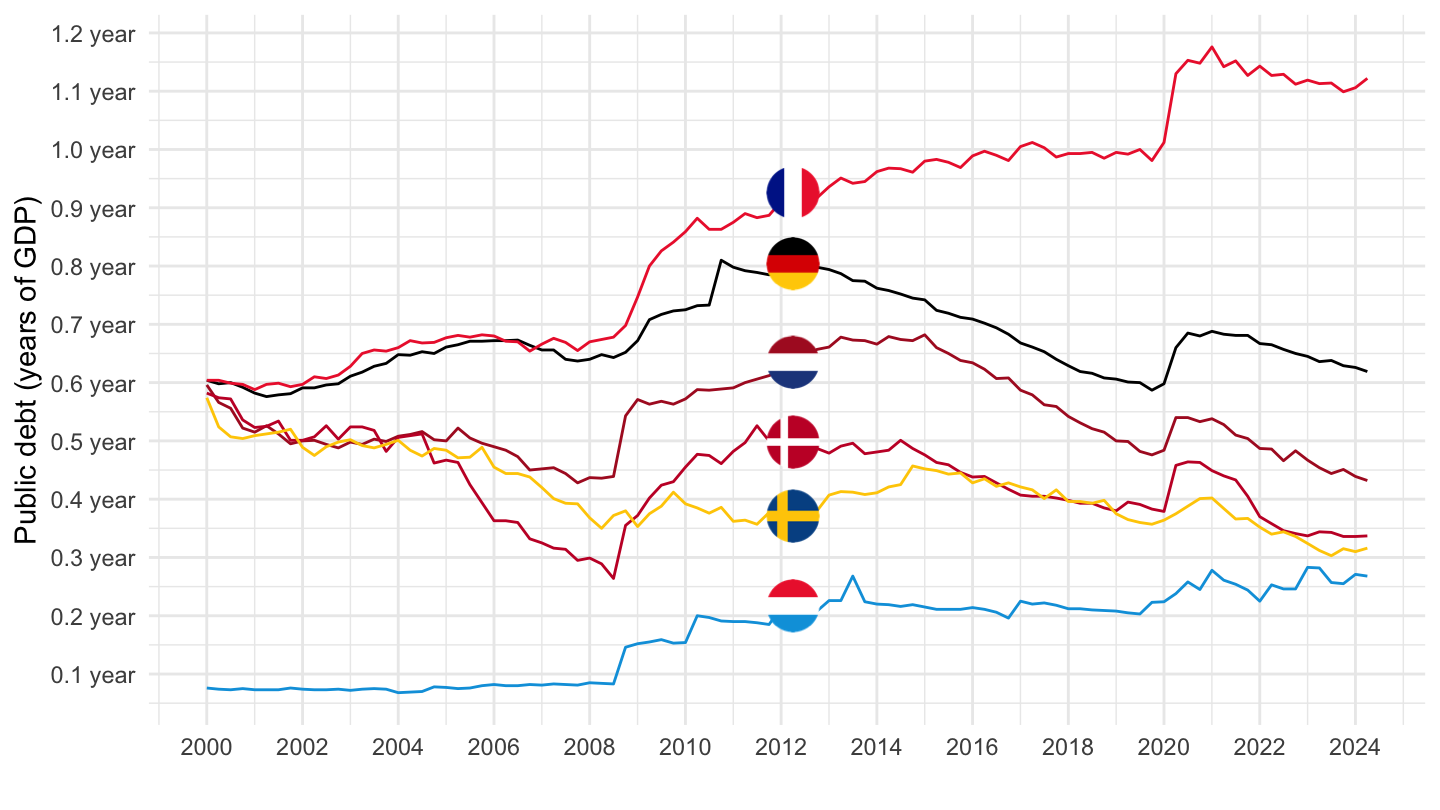
France, Germany
All
English
Code
gov_10q_ggdebt %>%
  filter(sector == "S13",
         unit == "PC_GDP",
         na_item == "GD",
         geo %in% c("FR", "DE")) %>%
  left_join(geo, by = "geo") %>%
  quarter_to_date() %>%
  left_join(colors, by = c("Geo" = "country")) %>%
  mutate(values = values / 100) %>%
  ggplot(.) + theme_minimal() + xlab("") + ylab("Public debt (years of GDP)") +
  geom_line(aes(x = date, y = values, color = color)) +
  scale_color_identity() + add_2flags +
  theme(legend.position = c(0.2, 0.85),
        legend.title = element_blank()) +
  scale_y_continuous(breaks = 0.01*seq(0, 260, 10),
                     labels = scales::dollar_format(acc = .1, pre = "", su = " y")) +
  scale_x_date(breaks = as.Date(paste0(seq(1700, 2050, 2), "-01-01")),
               labels = date_format("%Y"))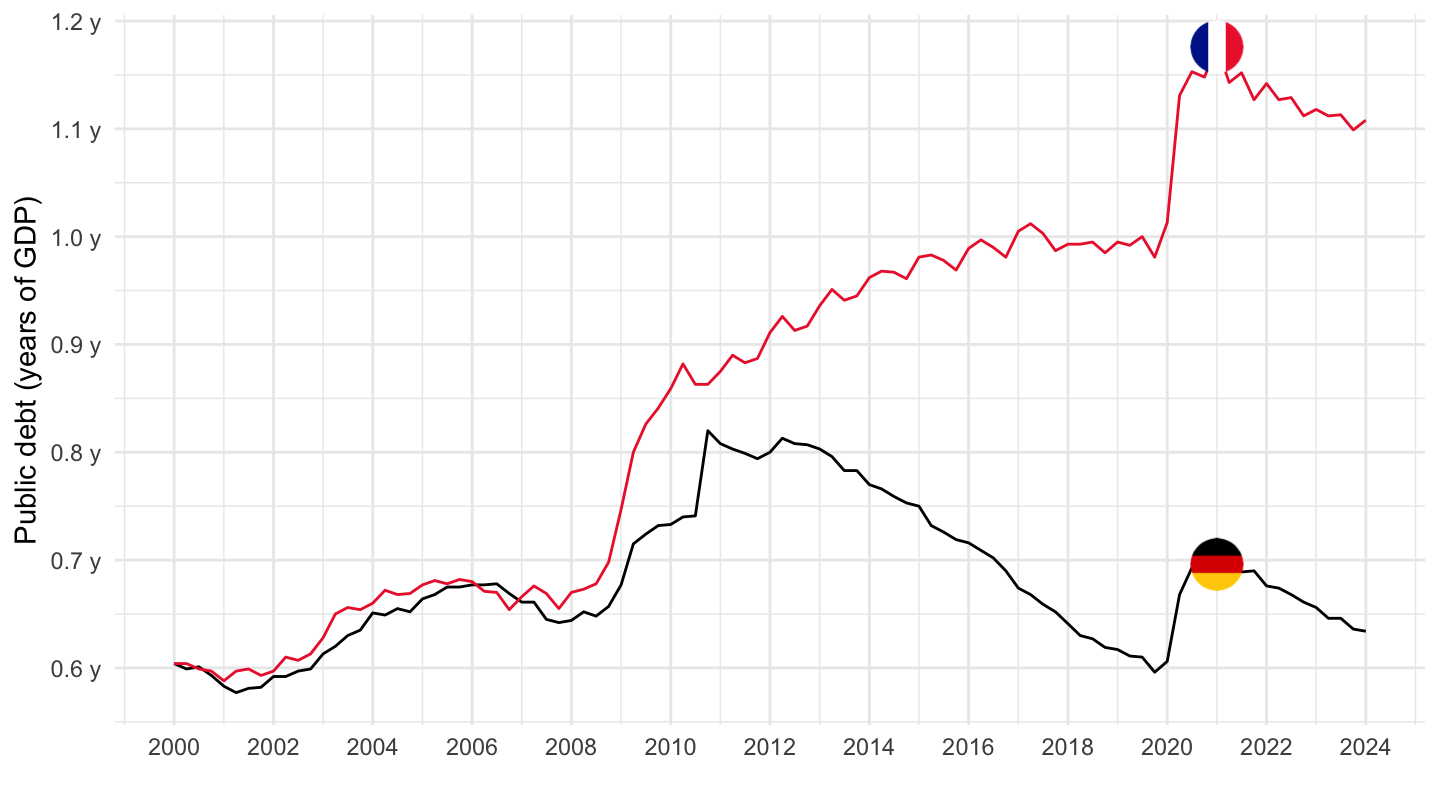
French
Code
gov_10q_ggdebt %>%
  filter(sector == "S13",
         unit == "PC_GDP",
         na_item == "GD",
         geo %in% c("FR", "DE")) %>%
  left_join(geo, by = "geo") %>%
  quarter_to_date() %>%
  left_join(colors, by = c("Geo" = "country")) %>%
  mutate(values = values / 100) %>%
  ggplot(.) + theme_minimal() + xlab("") + ylab("Dette publique (années de PIB)") +
  geom_line(aes(x = date, y = values, color = color)) +
  scale_color_identity() + add_2flags +
  theme(legend.position = c(0.2, 0.85),
        legend.title = element_blank()) +
  scale_y_continuous(breaks = 0.01*seq(0, 260, 10),
                     labels = scales::dollar_format(acc = .1, pre = "", su = " année")) +
  scale_x_date(breaks = as.Date(paste0(seq(1700, 2050, 2), "-01-01")),
               labels = date_format("%Y"))
France, Germany, Italy, Spain, Netherlands
All
Code
gov_10q_ggdebt %>%
  filter(sector == "S13",
         unit == "PC_GDP",
         na_item == "GD",
         geo %in% c("FR", "DE", "IT", "ES", "NL")) %>%
  left_join(geo, by = "geo") %>%
  quarter_to_date() %>%
  left_join(colors, by = c("Geo" = "country")) %>%
  mutate(values = values / 100) %>%
  ggplot(.) + theme_minimal() + xlab("") + ylab("Public debt (years of GDP)") +
  geom_line(aes(x = date, y = values, color = color)) +
  scale_color_identity() + add_5flags +
  theme(legend.position = c(0.2, 0.85),
        legend.title = element_blank()) +
  scale_y_continuous(breaks = 0.01*seq(0, 260, 20),
                     labels = scales::dollar_format(acc = .1, pre = "", su = " y")) +
  scale_x_date(breaks = as.Date(paste0(seq(1700, 2050, 2), "-01-01")),
               labels = date_format("%Y"))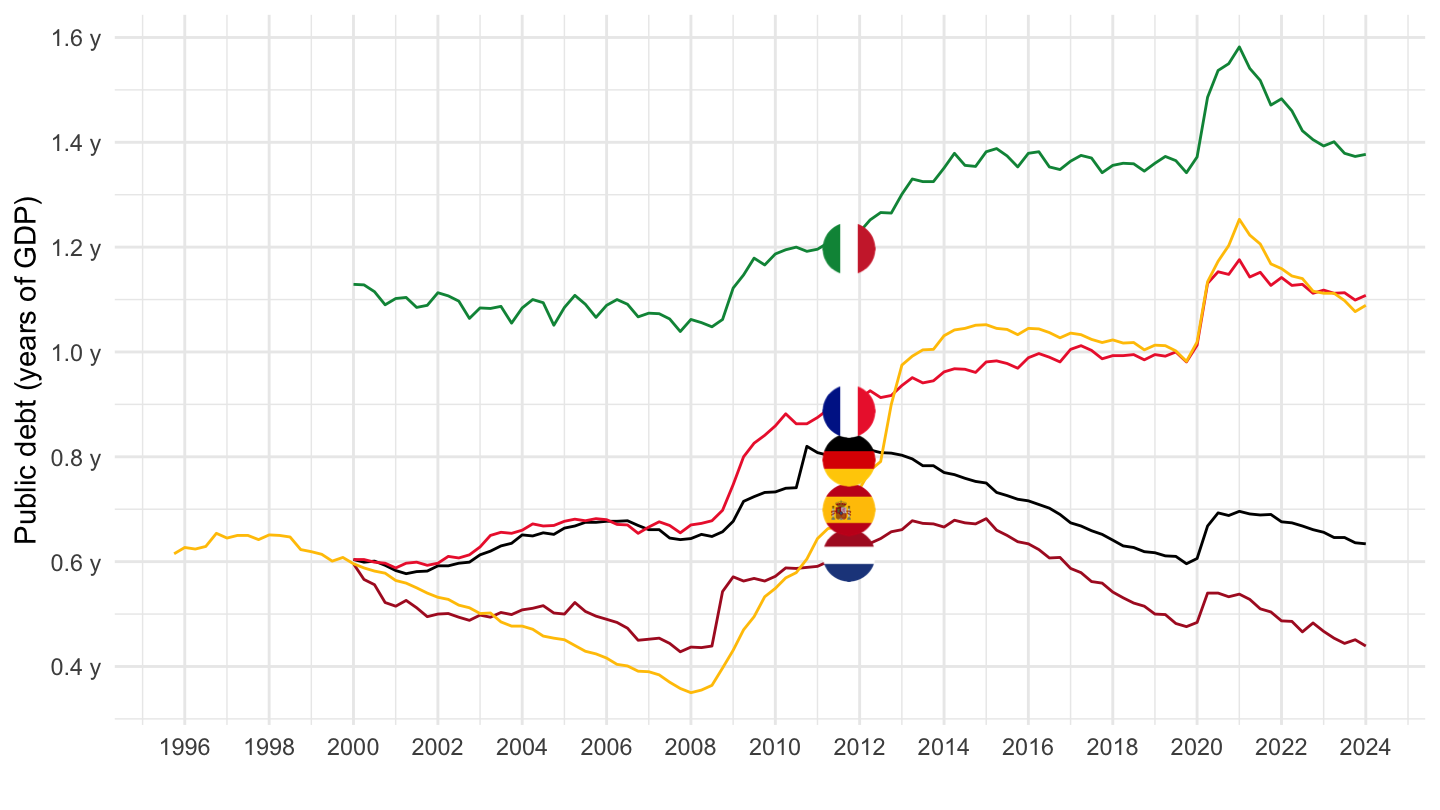
Italy, Portugal, Spain, Greece, Belgium, France
All
English
Code
gov_10q_ggdebt %>%
  filter(sector == "S13",
         unit == "PC_GDP",
         na_item == "GD",
         geo %in% c("IT", "PT", "ES", "EL", "BE", "FR")) %>%
  left_join(geo, by = "geo") %>%
  quarter_to_date() %>%
  left_join(colors, by = c("Geo" = "country")) %>%
  mutate(values = values / 100) %>%
  ggplot(.) + theme_minimal() + xlab("") + ylab("Public debt (years of GDP)") +
  geom_line(aes(x = date, y = values, color = color)) +
  scale_color_identity() + add_6flags +
  theme(legend.position = c(0.2, 0.85),
        legend.title = element_blank()) +
  scale_y_continuous(breaks = 0.01*seq(0, 260, 20),
                     labels = scales::dollar_format(acc = .1, pre = "", su = " y")) +
  scale_x_date(breaks = as.Date(paste0(seq(1700, 2050, 2), "-01-01")),
               labels = date_format("%Y"))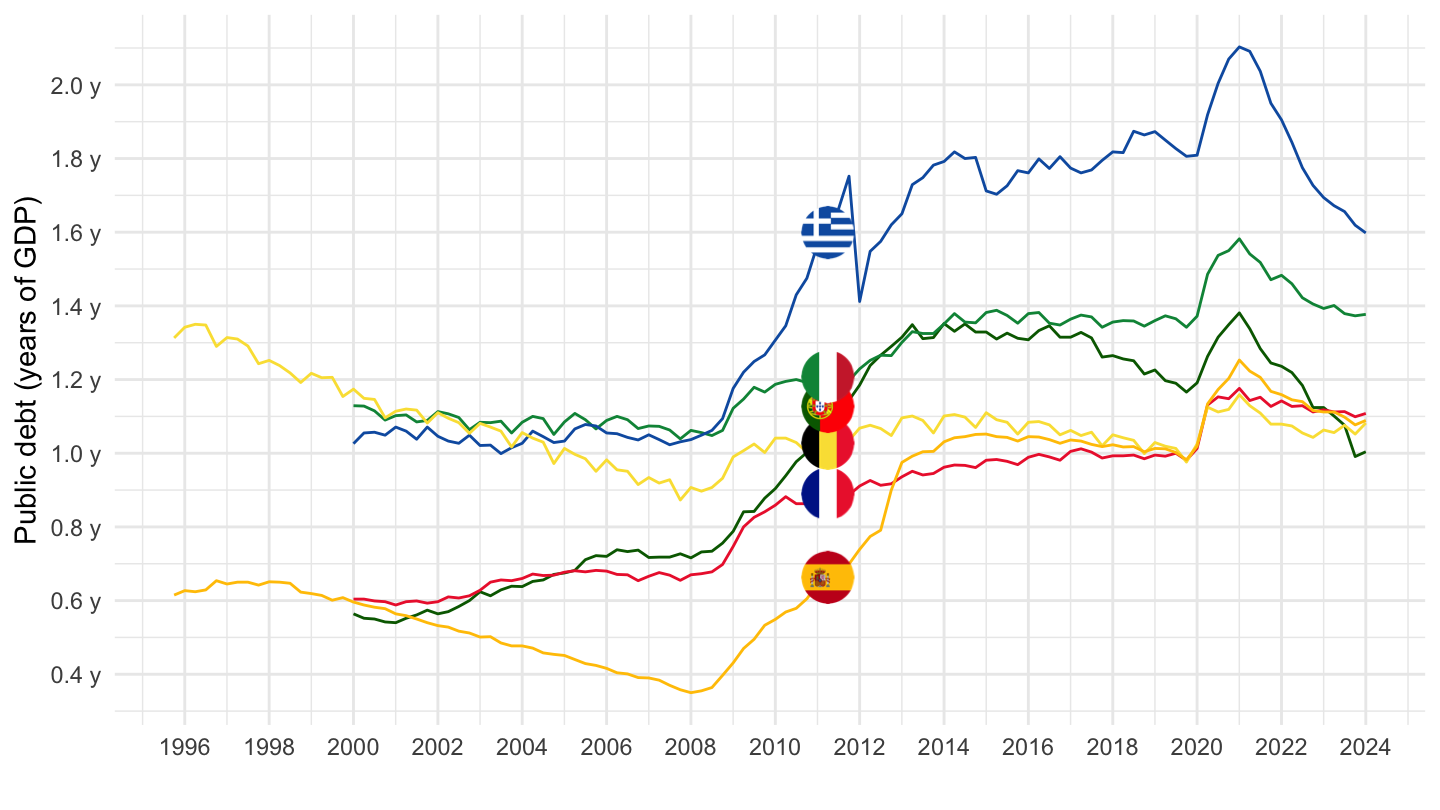
French
Code
gov_10q_ggdebt %>%
  filter(sector == "S13",
         unit == "PC_GDP",
         na_item == "GD",
         geo %in% c("IT", "PT", "ES", "EL", "BE", "FR")) %>%
  left_join(geo, by = "geo") %>%
  quarter_to_date() %>%
  left_join(colors, by = c("Geo" = "country")) %>%
  mutate(values = values / 100) %>%
  ggplot(.) + theme_minimal() + xlab("") + ylab("Dette publique") +
  geom_line(aes(x = date, y = values, color = color)) +
  scale_color_identity() + add_6flags +
  theme(legend.position = c(0.2, 0.85),
        legend.title = element_blank()) +
  scale_y_continuous(breaks = 0.01*seq(0, 260, 20),
                     labels = scales::dollar_format(acc = .1, pre = "", su = " année")) +
  scale_x_date(breaks = as.Date(paste0(seq(1700, 2050, 2), "-01-01")),
               labels = date_format("%Y"))
2000-
Code
gov_10q_ggdebt %>%
  filter(sector == "S13",
         unit == "PC_GDP",
         na_item == "GD",
         geo %in% c("IT", "PT", "ES", "EL", "BE", "FR")) %>%
  left_join(geo, by = "geo") %>%
  quarter_to_date() %>%
  filter(date >= as.Date("2000-01-01")) %>%
  left_join(colors, by = c("Geo" = "country")) %>%
  mutate(values = values / 100) %>%
  ggplot(.) + theme_minimal() + xlab("") + ylab("Public debt (years of GDP)") +
  geom_line(aes(x = date, y = values, color = color)) +
  scale_color_identity() + add_6flags +
  theme(legend.position = c(0.2, 0.85),
        legend.title = element_blank()) +
  scale_y_continuous(breaks = 0.01*seq(0, 260, 10),
                     labels = scales::dollar_format(acc = .1, pre = "", su = " y")) +
  scale_x_date(breaks = as.Date(paste0(seq(1700, 2050, 2), "-01-01")),
               labels = date_format("%Y"))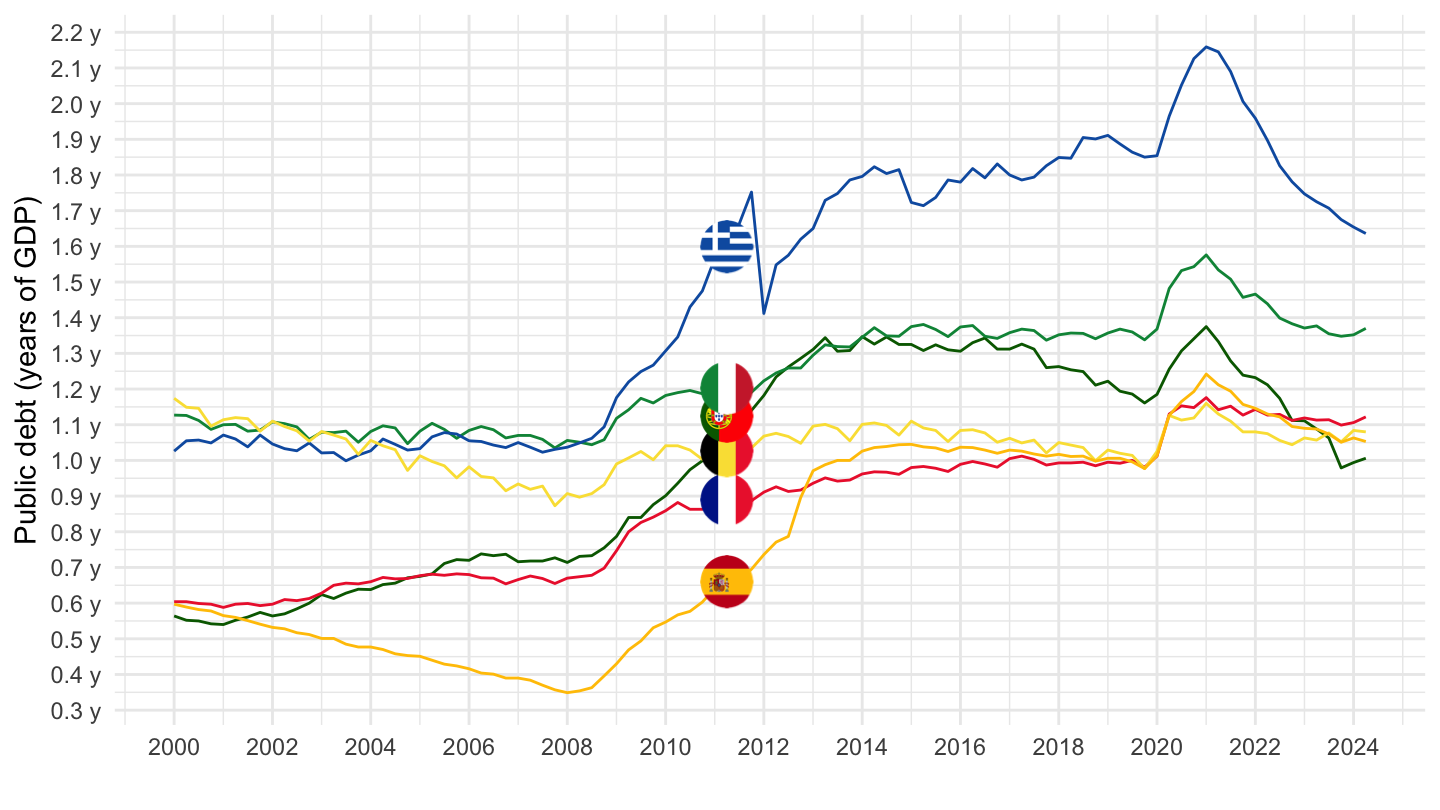
2005
Years of GDP
Code
gov_10q_ggdebt %>%
  filter(sector == "S13",
         unit == "PC_GDP",
         na_item == "GD",
         geo %in% c("IT", "PT", "ES", "EL", "BE", "FR", "EA19")) %>%
  left_join(geo, by = "geo") %>%
  quarter_to_date() %>%
  mutate(values = values / 100,
         Geo = ifelse(geo == "EA19", "Europe", Geo)) %>%
  left_join(colors, by = c("Geo" = "country")) %>%
  filter(date >= as.Date("2005-01-01")) %>%
  ggplot(.) + theme_minimal() + xlab("") + ylab("Public debt (years of GDP)") +
  geom_line(aes(x = date, y = values, color = color)) +
  scale_color_identity() + add_7flags +
  theme(legend.position = c(0.2, 0.85),
        legend.title = element_blank()) +
  scale_y_continuous(breaks = 0.01*seq(0, 260, 20),
                     labels = scales::dollar_format(acc = .1, pre = "", su = " y")) +
  scale_x_date(breaks = as.Date(paste0(seq(1990, 2025, 2), "-01-01")),
               labels = date_format("%Y"))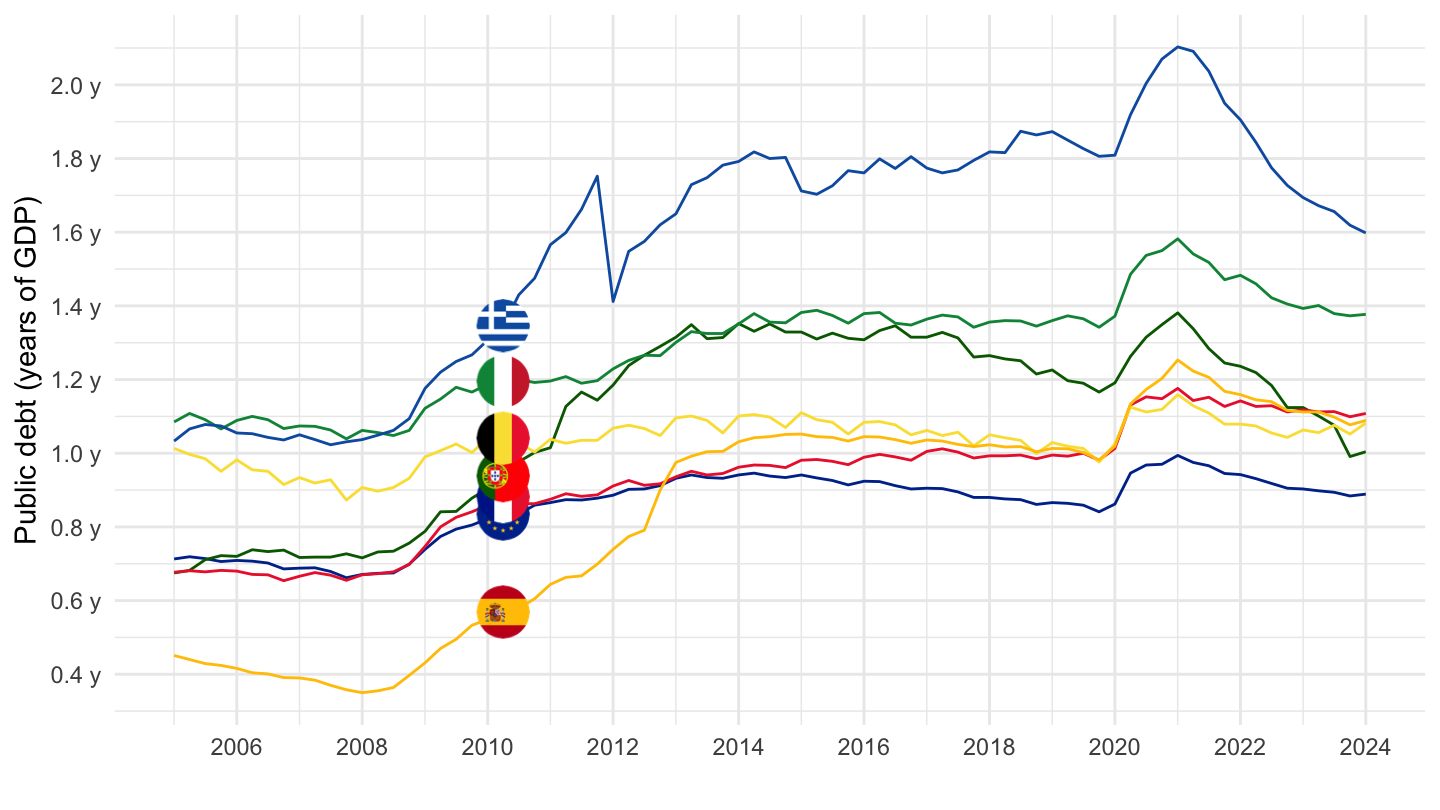
2015
Years of GDP
Code
gov_10q_ggdebt %>%
  filter(sector == "S13",
         unit == "PC_GDP",
         na_item == "GD",
         geo %in% c("IT", "PT", "NL", "ES", "FR", "EA19")) %>%
  left_join(geo, by = "geo") %>%
  quarter_to_date() %>%
  mutate(values = values / 100,
         Geo = ifelse(geo == "EA19", "Europe", Geo)) %>%
  left_join(colors, by = c("Geo" = "country")) %>%
  filter(date >= as.Date("2015-01-01")) %>%
  ggplot(.) + theme_minimal() + xlab("") + ylab("Public debt (years of GDP)") +
  geom_line(aes(x = date, y = values, color = color)) +
  scale_color_identity() + add_6flags +
  theme(legend.position = c(0.2, 0.85),
        legend.title = element_blank()) +
  scale_y_continuous(breaks = 0.01*seq(0, 260, 20),
                     labels = scales::dollar_format(acc = .1, pre = "", su = " y")) +
  scale_x_date(breaks = as.Date(paste0(seq(2015, 2025, 1), "-01-01")),
               labels = date_format("%Y"))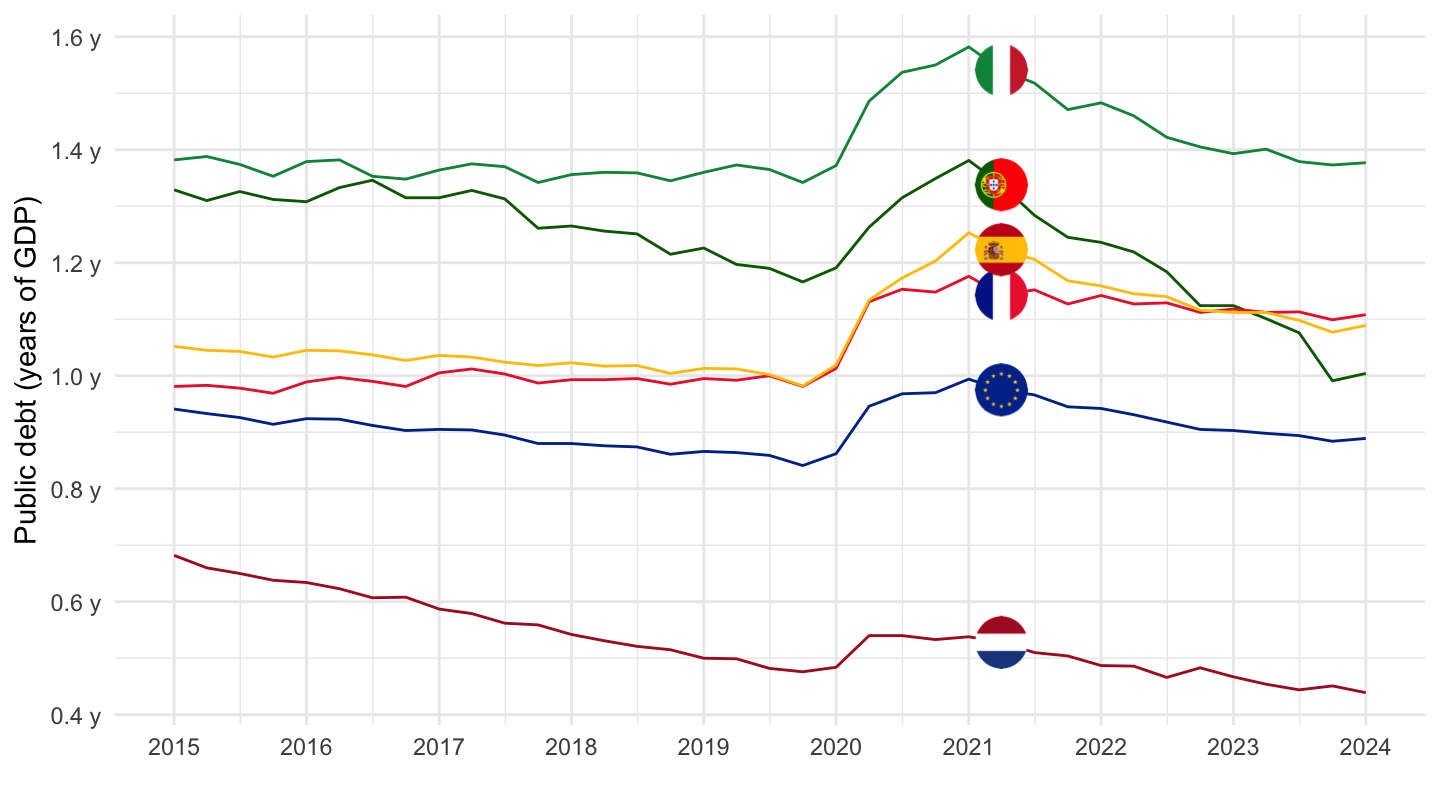
% of GDP…
Code
gov_10q_ggdebt %>%
  filter(sector == "S13",
         unit == "PC_GDP",
         na_item == "GD",
         geo %in% c("IT", "PT", "ES", "EL", "BE", "FR", "EA19")) %>%
  left_join(geo, by = "geo") %>%
  quarter_to_date() %>%
  mutate(values = values / 100,
         Geo = ifelse(geo == "EA19", "Europe", Geo)) %>%
  left_join(colors, by = c("Geo" = "country")) %>%
  filter(date >= as.Date("2015-01-01")) %>%
  ggplot(.) + theme_minimal() + xlab("") + ylab("Public debt (% of GDP)") +
  geom_line(aes(x = date, y = values, color = color)) +
  scale_color_identity() + add_7flags +
  theme(legend.position = c(0.2, 0.85),
        legend.title = element_blank()) +
  scale_y_continuous(breaks = 0.01*seq(0, 260, 20),
                     labels = scales::percent_format()) +
  scale_x_date(breaks = as.Date(paste0(seq(2015, 2025, 1), "-01-01")),
               labels = date_format("%Y"))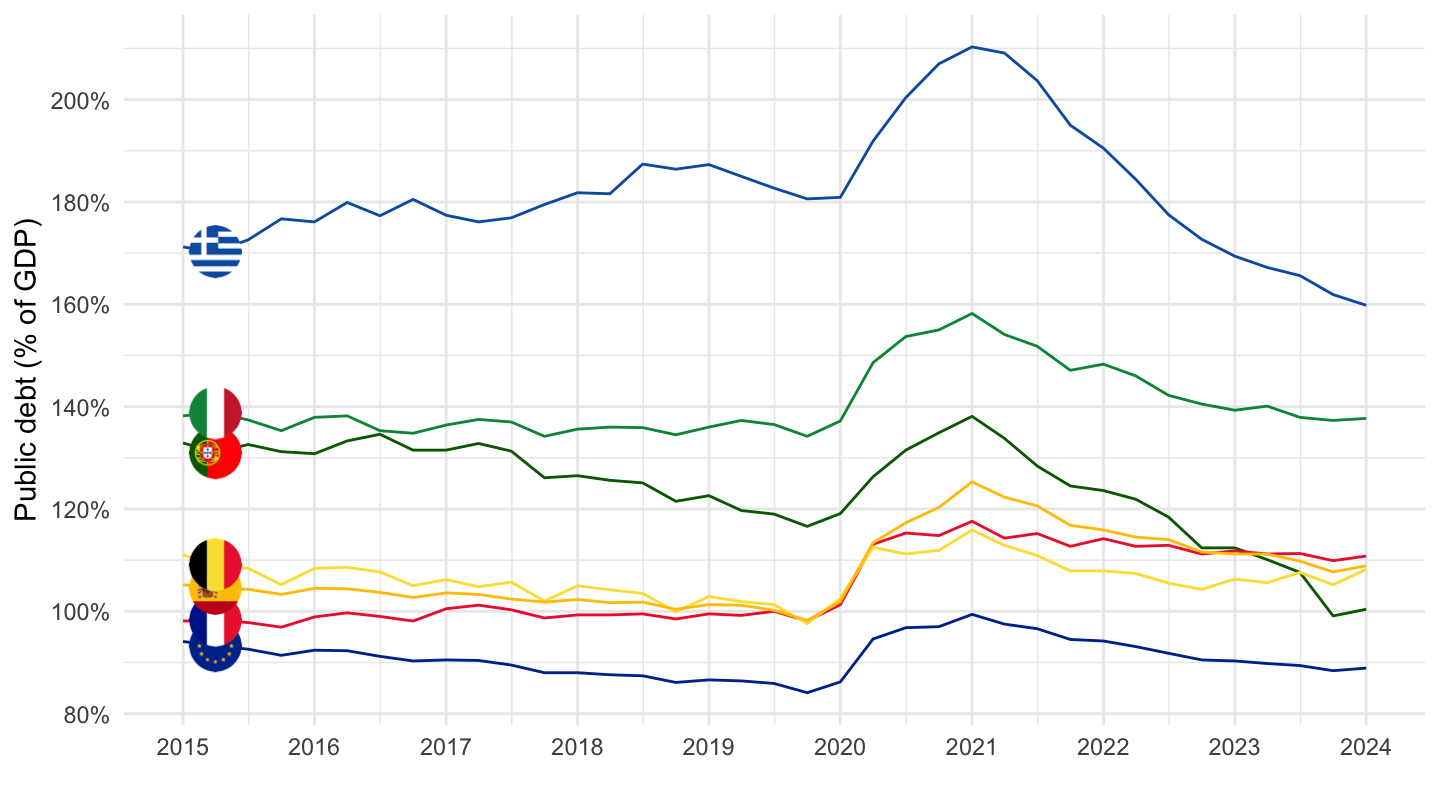
2019
Years of GDP
Code
gov_10q_ggdebt %>%
  filter(sector == "S13",
         unit == "PC_GDP",
         na_item == "GD",
         geo %in% c("IT", "PT", "NL", "ES", "FR", "EA19")) %>%
  left_join(geo, by = "geo") %>%
  quarter_to_date() %>%
  mutate(values = values / 100,
         Geo = ifelse(geo == "EA19", "Europe", Geo)) %>%
  left_join(colors, by = c("Geo" = "country")) %>%
  filter(date >= as.Date("2019-01-01")) %>%
  ggplot(.) + theme_minimal() + xlab("") + ylab("Public debt (years of GDP)") +
  geom_line(aes(x = date, y = values, color = color)) +
  scale_color_identity() + add_6flags +
  theme(legend.position = c(0.2, 0.85),
        legend.title = element_blank(),
        axis.text.x = element_text(angle = 45, vjust = 1, hjust = 1)) +
  scale_y_continuous(breaks = 0.01*seq(0, 260, 20),
                     labels = scales::dollar_format(acc = .1, pre = "", su = " y")) +
  scale_x_date(breaks = "3 months",
               labels = date_format("%b %Y"))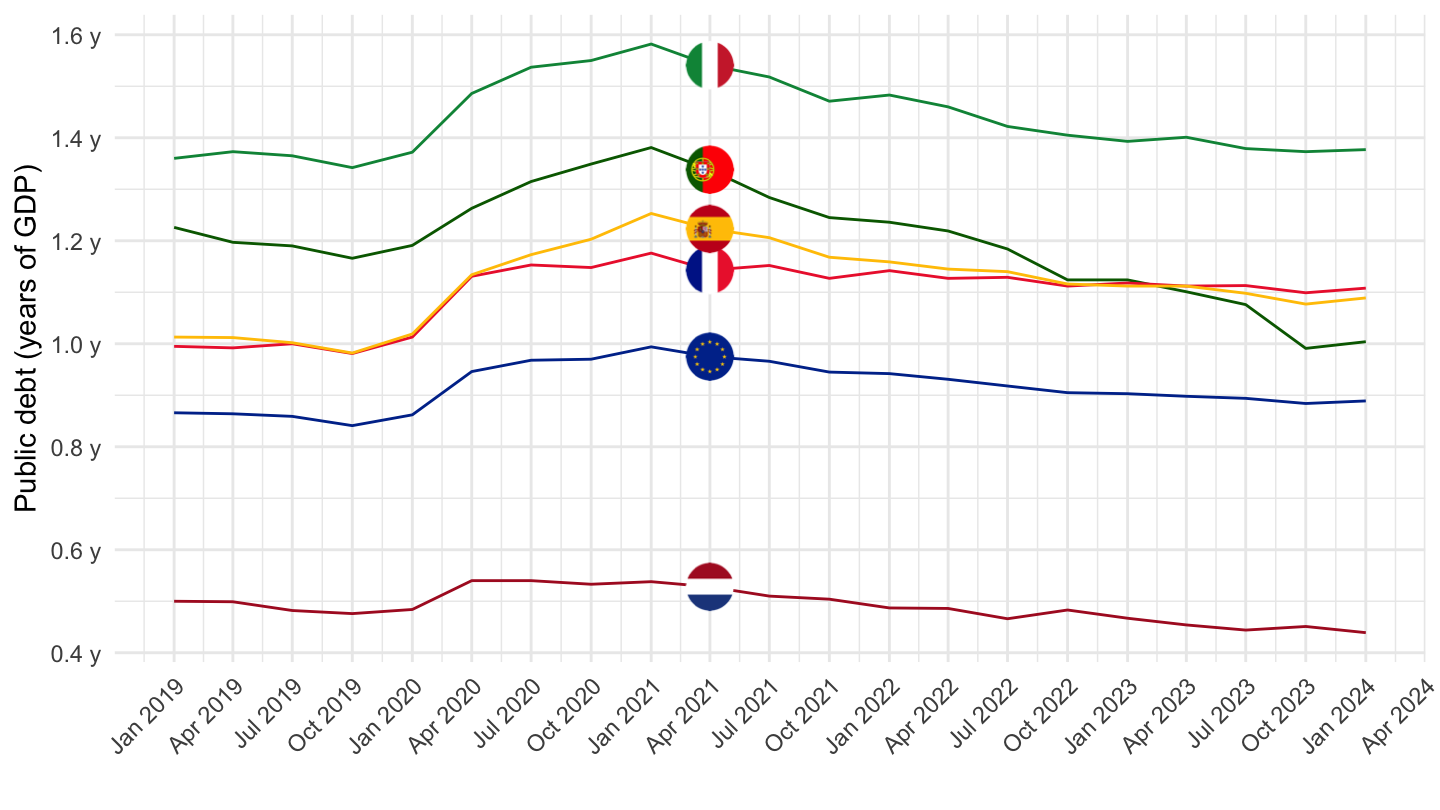
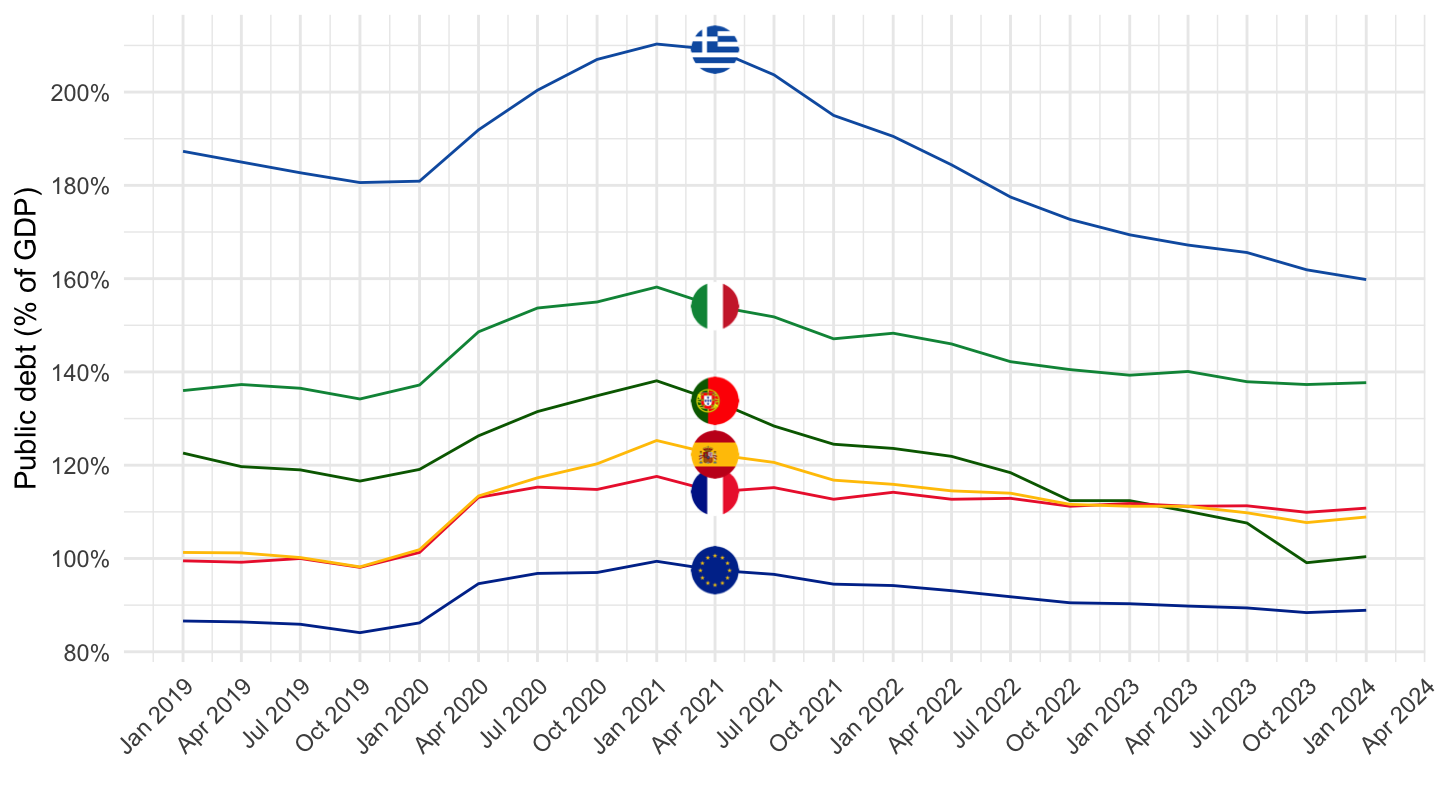
% of GDP…
Code
gov_10q_ggdebt %>%
  filter(sector == "S13",
         unit == "PC_GDP",
         na_item == "GD",
         geo %in% c("IT", "PT", "ES", "EL", "FR", "EA19")) %>%
  left_join(geo, by = "geo") %>%
  quarter_to_date() %>%
  mutate(values = values / 100,
         Geo = ifelse(geo == "EA19", "Europe", Geo)) %>%
  left_join(colors, by = c("Geo" = "country")) %>%
  filter(date >= as.Date("2019-01-01")) %>%
  ggplot(.) + theme_minimal() + xlab("") + ylab("Public debt (% of GDP)") +
  geom_line(aes(x = date, y = values, color = color)) +
  scale_color_identity() + add_6flags +
  theme(legend.position = c(0.2, 0.85),
        legend.title = element_blank(),
        axis.text.x = element_text(angle = 45, vjust = 1, hjust = 1)) +
  scale_y_continuous(breaks = 0.01*seq(0, 260, 20),
                     labels = scales::percent_format()) +
  scale_x_date(breaks = "3 months",
               labels = date_format("%b %Y"))