| source | dataset | Title | .html | .rData |
|---|---|---|---|---|
| eurostat | gov_10dd_edpt1 | Quarterly government debt | 2026-07-21 | 2026-07-21 |
Quarterly government debt
Data - Eurostat
Info
LAST_DOWNLOAD
| source | dataset | Title | .html | .rData |
|---|---|---|---|---|
| eurostat | ei_mfir_m | Interest rates - monthly data | 2026-07-22 | 2026-07-21 |
| eurostat | gov_10q_ggdebt | Quarterly government debt | 2026-07-21 | 2026-07-21 |
| fred | r | Interest Rates | 2026-07-22 | 2026-07-22 |
| fred | saving | Saving - saving | 2026-07-22 | 2026-07-22 |
| gfd | debt | Debt | 2021-08-22 | 2021-03-01 |
| imf | FM | Fiscal Monitor (FM) | 2026-07-21 | 2026-04-13 |
| imf | GGXCNL_G01_GDP_PT | Net lending/borrowing (also referred as overall balance) (% of GDP) | 2026-07-21 | 2025-08-05 |
| imf | GGXONLB_G01_GDP_PT | Primary net lending/borrowing (also referred as primary balance) (% of GDP) | 2026-07-21 | 2025-08-05 |
| imf | GGXWDN_G01_GDP_PT | Net debt (% of GDP) | 2026-07-21 | 2025-07-27 |
| imf | HPDD | NA | NA | NA |
| oecd | QASA_TABLE7PSD | Quarterly Sector Accounts - Public Sector Debt, consolidated, nominal value | 2024-09-15 | 2025-05-24 |
| wdi | GC.DOD.TOTL.GD.ZS | Central government debt, total (% of GDP) | 2023-06-18 | 2026-07-21 |
| wdi | GC.XPN.INTP.CN | Interest payments (current LCU) | 2026-07-21 | 2026-07-21 |
| wdi | GC.XPN.INTP.RV.ZS | Interest payments (% of revenue) | 2023-06-18 | 2026-07-21 |
| wdi | GC.XPN.INTP.ZS | Interest payments (% of expense) | 2026-07-21 | 2026-07-21 |
LAST_COMPILE
| LAST_COMPILE |
|---|
| 2026-07-22 |
Last
Code
gov_10dd_edpt1 %>%
  group_by(time) %>%
  summarise(Nobs = n()) %>%
  arrange(desc(time)) %>%
  head(1) %>%
print_table_conditional()| time | Nobs |
|---|---|
| 2024 | 2103 |
unit
Code
gov_10dd_edpt1 %>%
  left_join(unit, by = "unit") %>%
  group_by(unit, Unit) %>%
  summarise(Nobs = n()) %>%
  arrange(-Nobs) %>%
{if (is_html_output()) print_table(.) else .}| unit | Unit | Nobs |
|---|---|---|
| MIO_EUR | Million euro | 17212 |
| MIO_NAC | Million units of national currency | 17212 |
| PC_GDP | Percentage of gross domestic product (GDP) | 17212 |
sector
Code
gov_10dd_edpt1 %>%
  left_join(sector, by = "sector") %>%
  group_by(sector, Sector) %>%
  summarise(Nobs = n()) %>%
  arrange(-Nobs) %>%
{if (is_html_output()) print_table(.) else .}| sector | Sector | Nobs |
|---|---|---|
| S13 | General government | 34734 |
| S1 | Total economy | 4077 |
| S1311 | Central government | 4035 |
| S1313 | Local government | 4011 |
| S1314 | Social security funds | 3909 |
| S1312 | State government | 870 |
na_item
Code
gov_10dd_edpt1 %>%
  left_join(na_item, by = "na_item") %>%
  group_by(na_item, Na_item) %>%
  summarise(Nobs = n()) %>%
  arrange(-Nobs) %>%
  {if (is_html_output()) datatable(., filter = 'top', rownames = F) else .}
geo
Code
gov_10dd_edpt1 %>%
  left_join(geo, by = "geo") %>%
  group_by(geo, Geo) %>%
  summarise(Nobs = n()) %>%
  arrange(-Nobs) %>%
  mutate(Flag = gsub(" ", "-", str_to_lower(Geo)),
         Flag = paste0('<img src="../../bib/flags/vsmall/', Flag, '.png" alt="Flag">')) %>%
  select(Flag, everything()) %>%
  {if (is_html_output()) datatable(., filter = 'top', rownames = F, escape = F) else .}
time
Code
gov_10dd_edpt1 %>%
  group_by(time) %>%
  summarise(Nobs = n()) %>%
  arrange(desc(time)) %>%
print_table_conditional()| time | Nobs |
|---|---|
| 2024 | 2103 |
| 2023 | 2103 |
| 2022 | 2103 |
| 2021 | 2103 |
| 2020 | 1842 |
| 2019 | 1836 |
| 2018 | 1839 |
| 2017 | 1839 |
| 2016 | 1839 |
| 2015 | 1839 |
| 2014 | 1839 |
| 2013 | 1839 |
| 2012 | 1836 |
| 2011 | 1836 |
| 2010 | 1836 |
| 2009 | 1836 |
| 2008 | 1563 |
| 2007 | 1563 |
| 2006 | 1560 |
| 2005 | 1560 |
| 2004 | 1560 |
| 2003 | 1554 |
| 2002 | 1554 |
| 2001 | 1545 |
| 2000 | 1542 |
| 1999 | 1443 |
| 1998 | 1443 |
| 1997 | 1443 |
| 1996 | 1419 |
| 1995 | 1419 |
EA-19
Debt
Code
gov_10dd_edpt1 %>%
  filter(time %in% c("2022", "2021"),
         sector == "S13",
         unit == "PC_GDP",
         na_item == "GD") %>%
  select(geo, time, values) %>%
  spread(time, values) %>%
  left_join(geo, by = "geo") %>%
  mutate(Flag = gsub(" ", "-", str_to_lower(Geo)),
         Flag = paste0('<img src="../../bib/flags/vsmall/', Flag, '.png" alt="Flag">')) %>%
  select(Flag, Geo, geo, everything()) %>%
  arrange(-`2022`) %>%
  {if (is_html_output()) datatable(., filter = 'top', rownames = F, escape = F) else .}
Deficit
Code
gov_10dd_edpt1 %>%
  filter(time %in% c("2022", "2021"),
         sector == "S13",
         unit == "PC_GDP",
         na_item == "B9") %>%
  select(geo, time, values) %>%
  spread(time, values) %>%
  left_join(geo, by = "geo") %>%
  mutate(Flag = gsub(" ", "-", str_to_lower(Geo)),
         Flag = paste0('<img src="../../bib/flags/vsmall/', Flag, '.png" alt="Flag">')) %>%
  select(Flag, Geo, geo, everything()) %>%
  arrange(-`2022`) %>%
  {if (is_html_output()) datatable(., filter = 'top', rownames = F, escape = F) else .}
Last
Debt
Code
gov_10dd_edpt1 %>%
  filter(sector == "S13",
         unit == "PC_GDP",
         na_item == "GD") %>%
  group_by(geo) %>%
  filter(time == max(time)) %>%
  left_join(geo, by = "geo") %>%
  select_if(~ n_distinct(.) > 1) %>%
  arrange(values) %>%
  select(geo, Geo, everything()) %>%
print_table_conditional()| geo | Geo | values |
|---|---|---|
| EE | Estonia | 23.5 |
| BG | Bulgaria | 23.8 |
| LU | Luxembourg | 26.3 |
| DK | Denmark | 30.5 |
| SE | Sweden | 34.0 |
| LT | Lithuania | 38.0 |
| IE | Ireland | 38.3 |
| CZ | Czechia | 43.3 |
| NL | Netherlands | 43.7 |
| MT | Malta | 46.2 |
| LV | Latvia | 46.6 |
| RO | Romania | 54.8 |
| PL | Poland | 55.1 |
| HR | Croatia | 57.4 |
| SK | Slovakia | 59.7 |
| DE | Germany | 62.2 |
| CY | Cyprus | 62.8 |
| SI | Slovenia | 66.6 |
| HU | Hungary | 73.5 |
| AT | Austria | 79.9 |
| EU27_2020 | European Union - 27 countries (from 2020) | 80.7 |
| FI | Finland | 82.5 |
| EA20 | Euro area – 20 countries (2023-2025) | 87.1 |
| EA19 | Euro area - 19 countries (2015-2022) | 87.2 |
| PT | Portugal | 93.6 |
| ES | Spain | 101.6 |
| BE | Belgium | 103.9 |
| FR | France | 113.2 |
| IT | Italy | 134.9 |
| EL | Greece | 154.2 |
Luxembourg, Denmark, Sweden, Netherlands, Germany, France
Debt
Code
gov_10dd_edpt1 %>%
  filter(sector == "S13",
         unit == "PC_GDP",
         na_item == "GD",
         geo %in% c("NL", "LU", "DK", "SE", "FR")) %>%
  left_join(geo, by = "geo") %>%
  year_to_date() %>%
  left_join(colors, by = c("Geo" = "country")) %>%
  mutate(values = values / 100) %>%
  ggplot(.) + theme_minimal() + xlab("") + ylab("Public debt (years of GDP)") +
  geom_line(aes(x = date, y = values, color = color)) +
  scale_color_identity() + add_5flags +
  theme(legend.position = c(0.2, 0.85),
        legend.title = element_blank()) +
  scale_y_continuous(breaks = 0.01*seq(0, 260, 20),
                     labels = scales::dollar_format(acc = .1, pre = "", su = " y")) +
  scale_x_date(breaks = as.Date(paste0(seq(1700, 2100, 5), "-01-01")),
               labels = date_format("%Y"))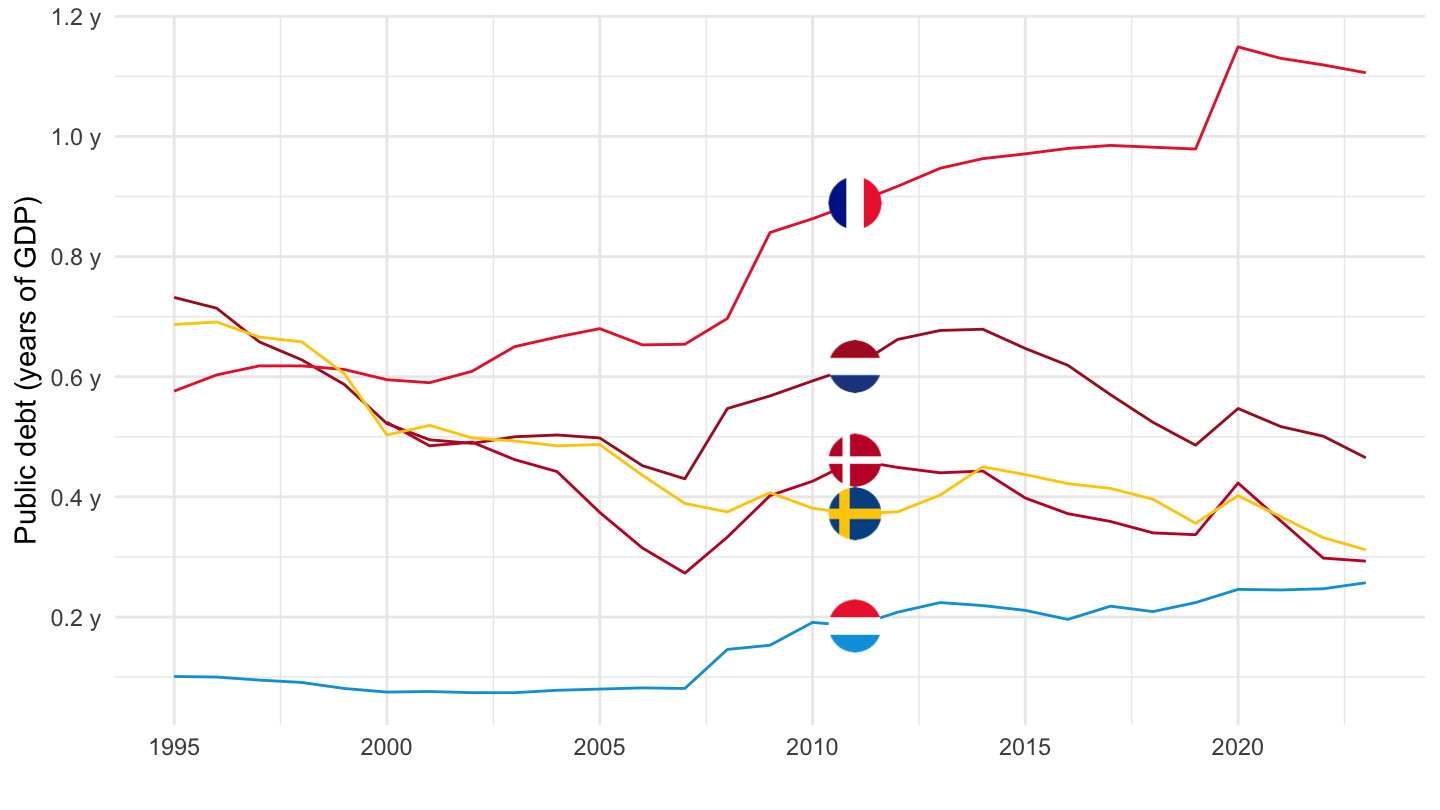
Deficit
Code
gov_10dd_edpt1 %>%
  filter(sector == "S13",
         unit == "PC_GDP",
         na_item == "B9",
         geo %in% c("NL", "LU", "DK", "SE", "FR")) %>%
  left_join(geo, by = "geo") %>%
  year_to_date() %>%
  left_join(colors, by = c("Geo" = "country")) %>%
  mutate(values = values / 100) %>%
  ggplot(.) + theme_minimal() + xlab("") + ylab("Deficit") +
  geom_line(aes(x = date, y = values, color = color)) +
  scale_color_identity() + add_5flags +
  theme(legend.position = c(0.2, 0.85),
        legend.title = element_blank()) +
  scale_y_continuous(breaks = 0.01*seq(-10, 260, 1),
                     labels = scales::percent_format(acc = 1)) +
  scale_x_date(breaks = as.Date(paste0(seq(1700, 2100, 5), "-01-01")),
               labels = date_format("%Y"))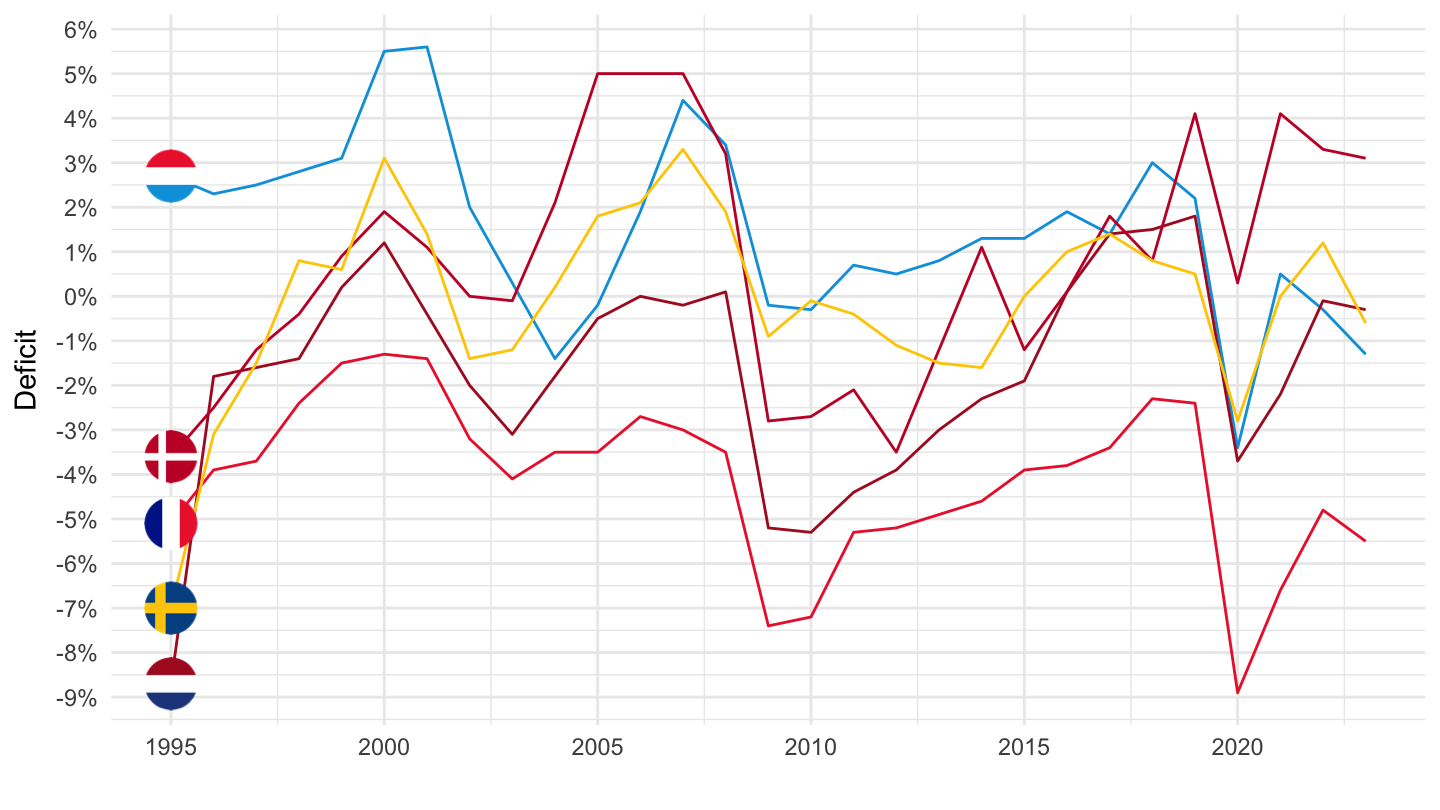
France, Germany, Italy, Spain, Netherlands
Debt
Code
gov_10dd_edpt1 %>%
  filter(sector == "S13",
         unit == "PC_GDP",
         na_item == "GD",
         geo %in% c("FR", "DE", "IT", "ES", "NL")) %>%
  left_join(geo, by = "geo") %>%
  year_to_date() %>%
  left_join(colors, by = c("Geo" = "country")) %>%
  mutate(values = values / 100) %>%
  ggplot(.) + theme_minimal() + xlab("") + ylab("Public debt (years of GDP)") +
  geom_line(aes(x = date, y = values, color = color)) +
  scale_color_identity() + add_5flags +
  theme(legend.position = c(0.2, 0.85),
        legend.title = element_blank()) +
  scale_y_continuous(breaks = 0.01*seq(0, 260, 20),
                     labels = scales::dollar_format(acc = .1, pre = "", su = " y")) +
  scale_x_date(breaks = as.Date(paste0(seq(1700, 2100, 5), "-01-01")),
               labels = date_format("%Y"))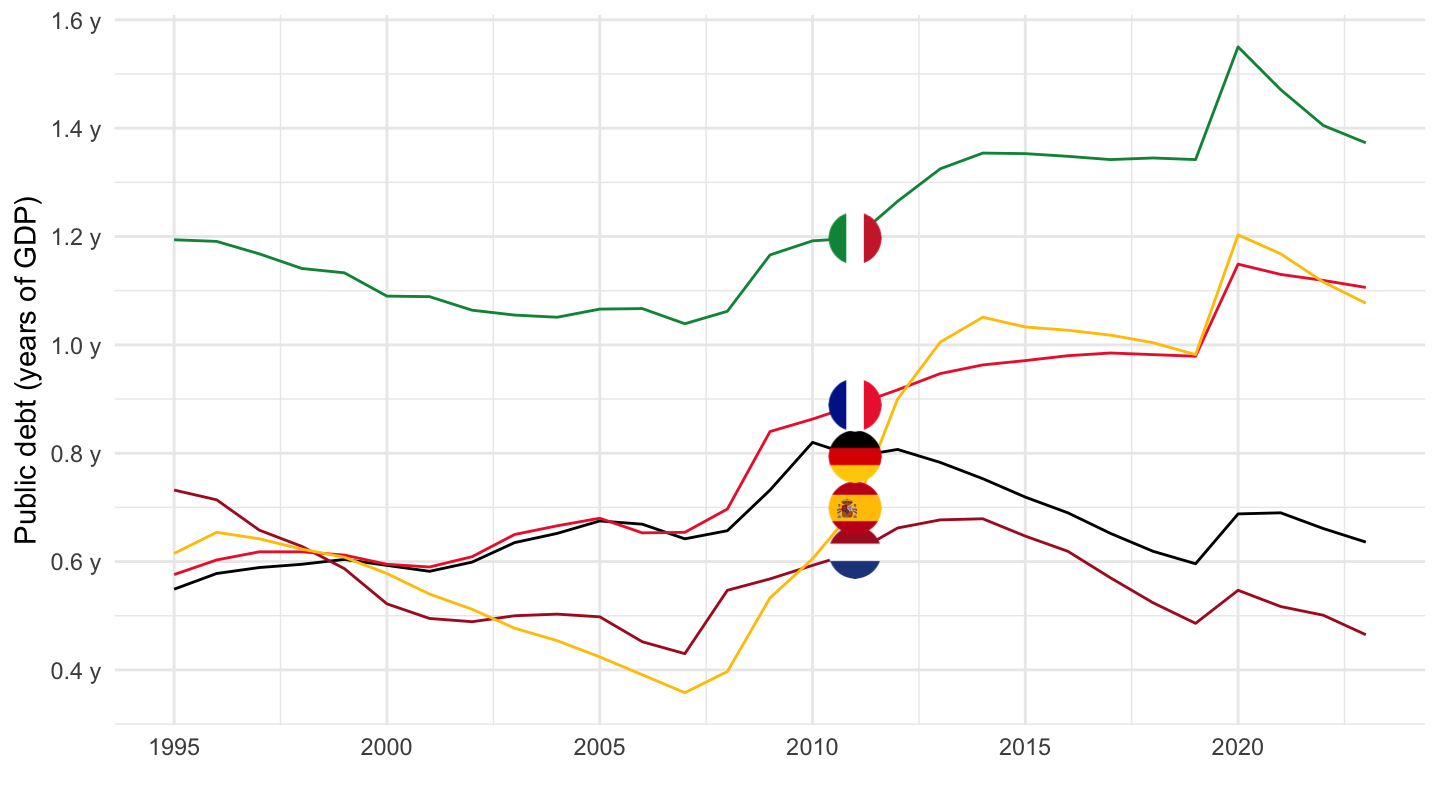
Deficit
All
Code
gov_10dd_edpt1 %>%
  filter(sector == "S13",
         unit == "PC_GDP",
         na_item == "B9",
         geo %in% c("FR", "DE", "IT", "ES", "NL")) %>%
  left_join(geo, by = "geo") %>%
  year_to_date() %>%
  left_join(colors, by = c("Geo" = "country")) %>%
  mutate(values = values / 100) %>%
  ggplot(.) + theme_minimal() + xlab("") + ylab("Deficit") +
  geom_line(aes(x = date, y = values, color = color)) +
  scale_color_identity() + add_5flags +
  theme(legend.position = c(0.2, 0.85),
        legend.title = element_blank()) +
  scale_y_continuous(breaks = 0.01*seq(-10, 260, 1),
                     labels = scales::percent_format(acc = 1)) +
  scale_x_date(breaks = as.Date(paste0(seq(1700, 2100, 2), "-01-01")),
               labels = date_format("%Y"))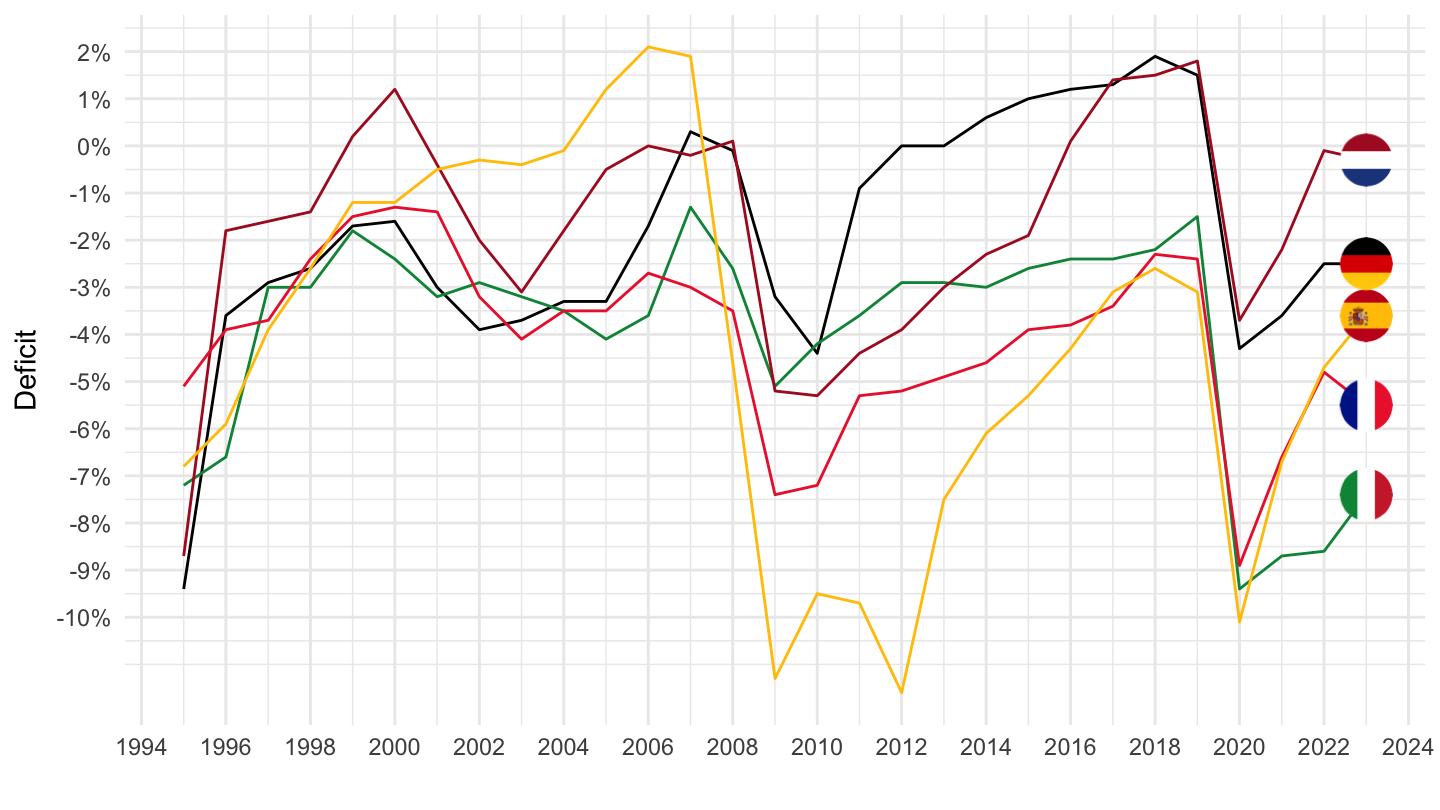
2010-
Code
gov_10dd_edpt1 %>%
  filter(sector == "S13",
         unit == "PC_GDP",
         na_item == "B9",
         geo %in% c("FR", "DE", "IT", "ES", "NL")) %>%
  left_join(geo, by = "geo") %>%
  year_to_date() %>%
  left_join(colors, by = c("Geo" = "country")) %>%
  mutate(values = values / 100) %>%
  filter(date >= as.Date("2010-01-01")) %>%
  ggplot(.) + theme_minimal() + xlab("") + ylab("Deficit") +
  geom_line(aes(x = date, y = values, color = color)) +
  scale_color_identity() + add_5flags +
  theme(legend.position = c(0.2, 0.85),
        legend.title = element_blank()) +
  scale_y_continuous(breaks = 0.01*seq(-100, 260, 1),
                     labels = scales::percent_format(acc = 1)) +
  scale_x_date(breaks = as.Date(paste0(seq(1700, 2100, 1), "-01-01")),
               labels = date_format("%Y"))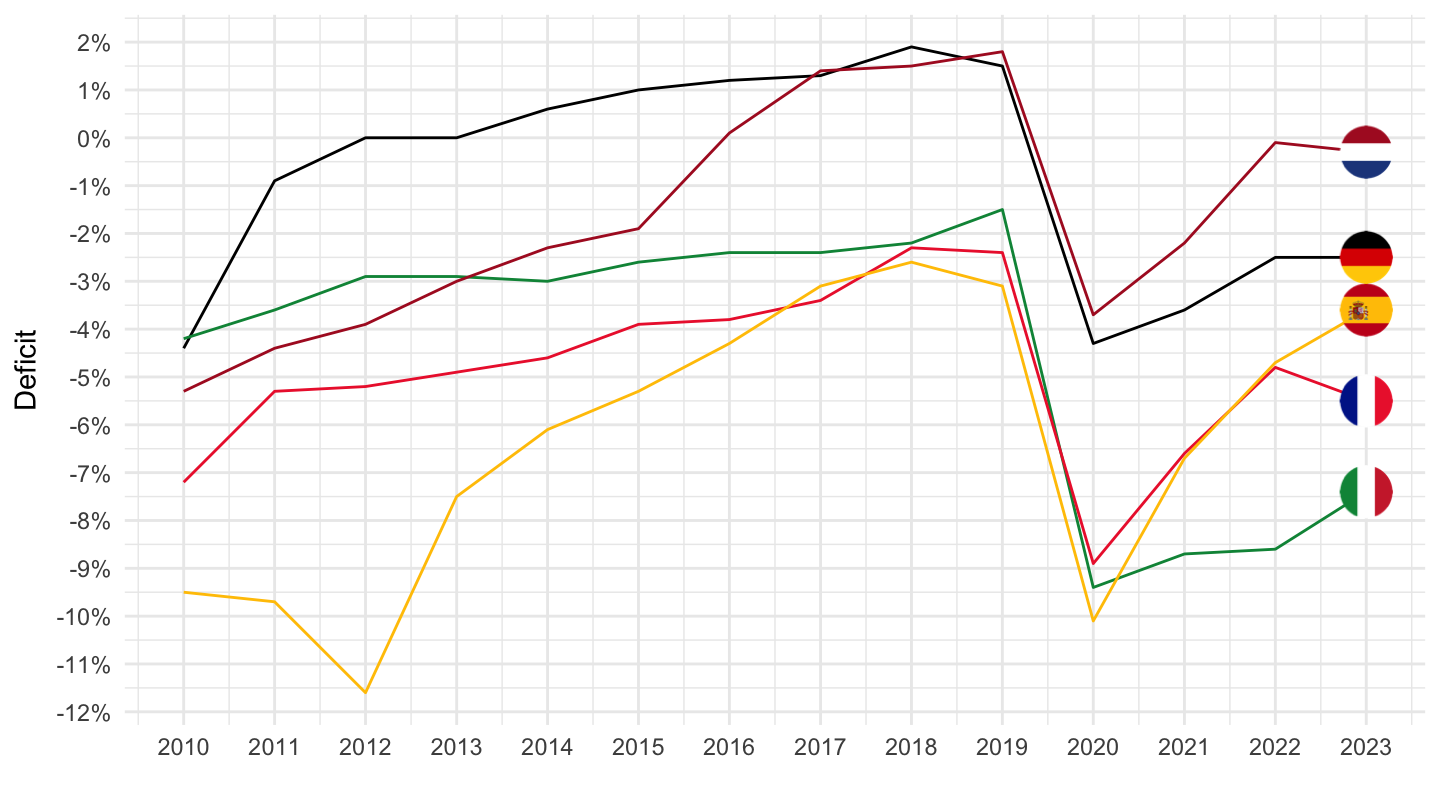
Interest payments
All
Code
gov_10dd_edpt1 %>%
  filter(sector == "S13",
         unit == "PC_GDP",
         na_item == "D41PAY",
         geo %in% c("FR", "DE", "IT", "ES", "NL", "EA19")) %>%
  left_join(geo, by = "geo") %>%
  year_to_date() %>%
  left_join(colors, by = c("Geo" = "country")) %>%
  mutate(values = values / 100,
         Geo = ifelse(geo == "EA19", "Europe", Geo)) %>%
  ggplot(.) + theme_minimal() + xlab("") + ylab("Deficit") +
  geom_line(aes(x = date, y = values, color = color)) +
  scale_color_identity() + add_6flags +
  theme(legend.position = c(0.2, 0.85),
        legend.title = element_blank()) +
  scale_y_continuous(breaks = 0.01*seq(-10, 260, 1),
                     labels = scales::percent_format(acc = 1)) +
  scale_x_date(breaks = as.Date(paste0(seq(1700, 2100, 5), "-01-01")),
               labels = date_format("%Y"))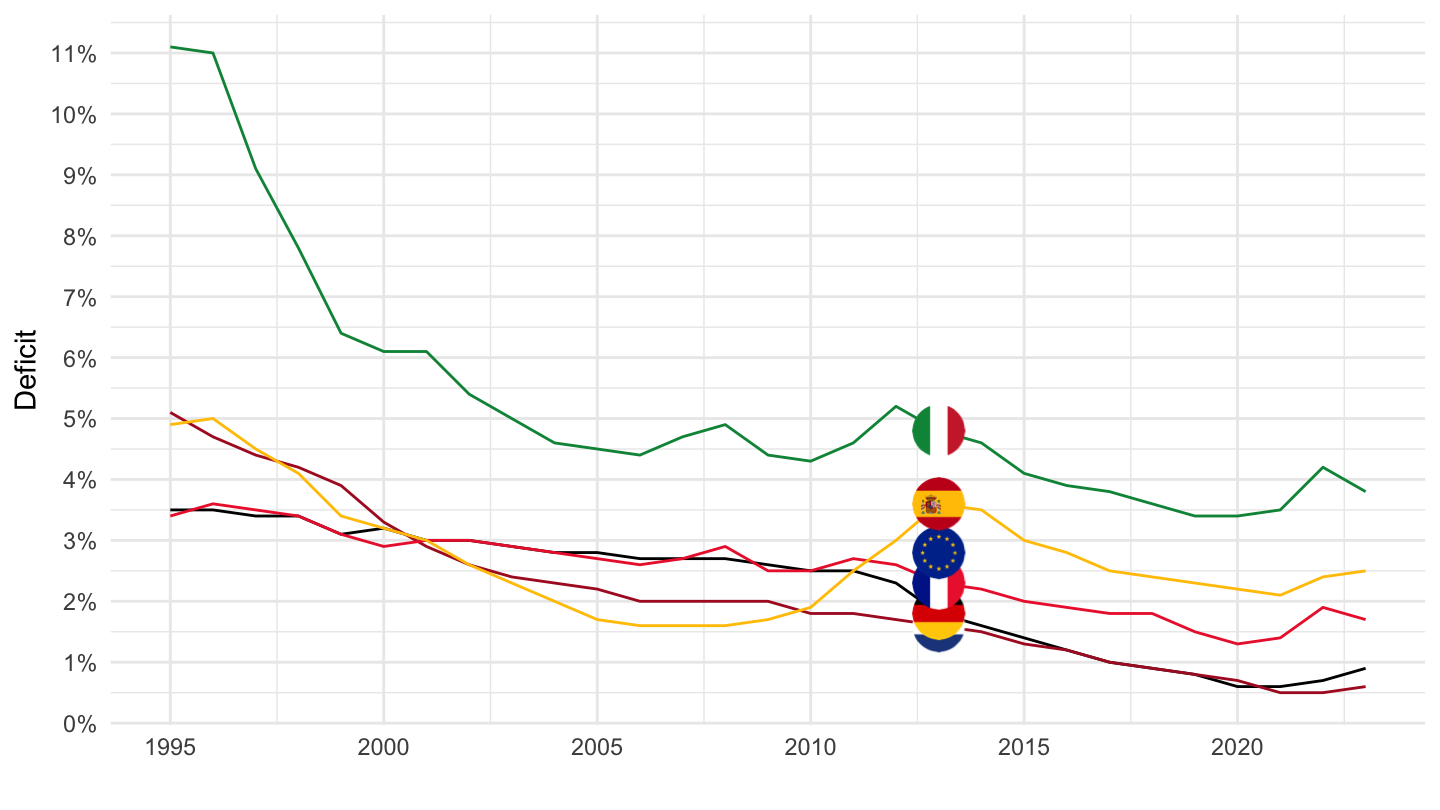
2005-
Code
gov_10dd_edpt1 %>%
  filter(sector == "S13",
         unit == "PC_GDP",
         na_item == "D41PAY",
         geo %in% c("FR", "DE", "IT", "ES", "NL", "EA19")) %>%
  left_join(geo, by = "geo") %>%
  year_to_date() %>%
  mutate(values = values / 100,
         Geo = ifelse(geo == "EA19", "Europe", Geo)) %>%
  left_join(colors, by = c("Geo" = "country")) %>%
  filter(date >= as.Date("2005-01-01")) %>%
  ggplot(.) + theme_minimal() + xlab("") + ylab("Interest payments (% of GDP)") +
  geom_line(aes(x = date, y = values, color = color)) +
  scale_color_identity() + add_6flags +
  theme(legend.position = c(0.2, 0.85),
        legend.title = element_blank()) +
  scale_y_continuous(breaks = 0.01*seq(-10, 260, 1),
                     labels = scales::percent_format(acc = 1)) +
  scale_x_date(breaks = as.Date(paste0(seq(2005, 2100, 2), "-01-01")),
               labels = date_format("%Y"))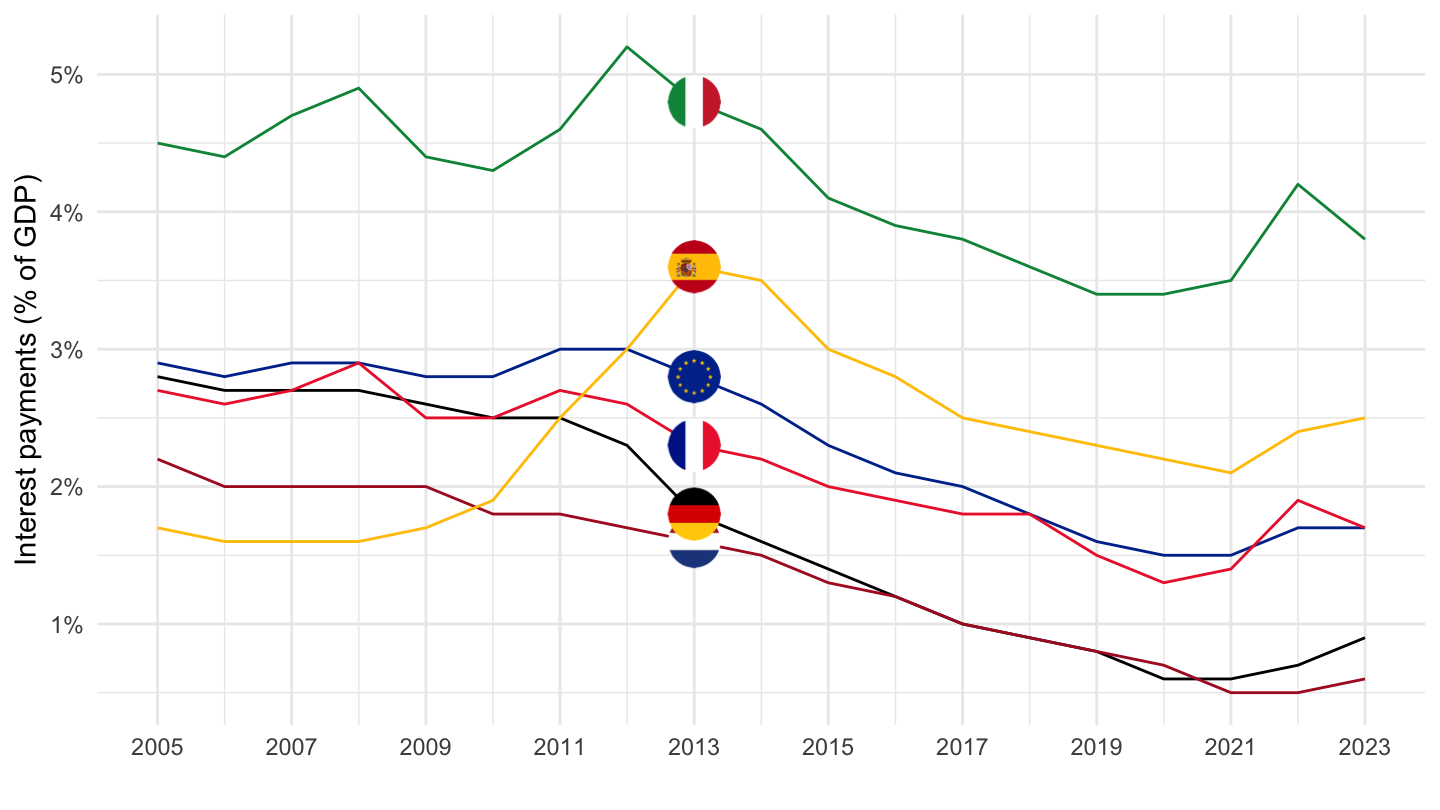
France, Europe
2005-
Code
gov_10dd_edpt1 %>%
  filter(sector == "S13",
         unit == "PC_GDP",
         na_item == "D41PAY",
         geo %in% c("FR", "EA19")) %>%
  left_join(geo, by = "geo") %>%
  year_to_date() %>%
  mutate(values = values / 100,
         Geo = ifelse(geo == "EA19", "Europe", Geo)) %>%
  left_join(colors, by = c("Geo" = "country")) %>%
  filter(date >= as.Date("2005-01-01")) %>%
  ggplot(.) + theme_minimal() + xlab("") + ylab("Interest payments (% of GDP)") +
  geom_line(aes(x = date, y = values, color = color)) +
  scale_color_identity() + add_2flags +
  theme(legend.position = c(0.2, 0.85),
        legend.title = element_blank()) +
  scale_y_continuous(breaks = 0.01*seq(-10, 260, .1),
                     labels = scales::percent_format(acc = .1)) +
  scale_x_date(breaks = as.Date(paste0(seq(2005, 2100, 2), "-01-01")),
               labels = date_format("%Y"))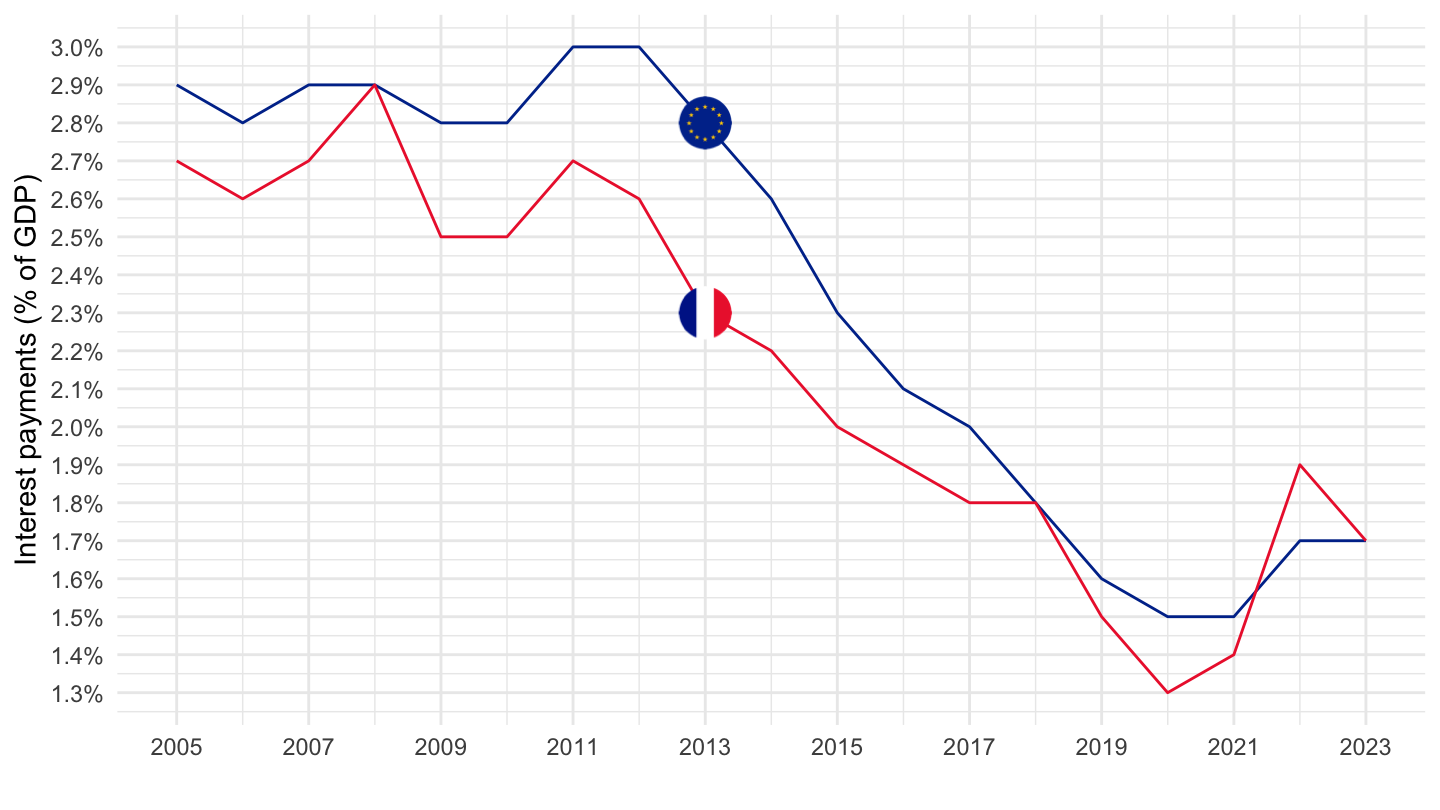
France, Portugal, Greece, EUrope
2005-
Code
gov_10dd_edpt1 %>%
  filter(sector == "S13",
         unit == "PC_GDP",
         na_item == "D41PAY",
         geo %in% c("FR", "EA19", "EL", "PT")) %>%
  left_join(geo, by = "geo") %>%
  year_to_date() %>%
  mutate(values = values / 100,
         Geo = ifelse(geo == "EA19", "Europe", Geo)) %>%
  left_join(colors, by = c("Geo" = "country")) %>%
  filter(date >= as.Date("2005-01-01")) %>%
  ggplot(.) + theme_minimal() + xlab("") + ylab("Interest payments (% of GDP)") +
  geom_line(aes(x = date, y = values, color = color)) +
  scale_color_identity() + add_4flags +
  theme(legend.position = c(0.2, 0.85),
        legend.title = element_blank()) +
  scale_y_continuous(breaks = 0.01*seq(-10, 260, .5),
                     labels = scales::percent_format(acc = .1)) +
  scale_x_date(breaks = as.Date(paste0(seq(2005, 2100, 2), "-01-01")),
               labels = date_format("%Y"))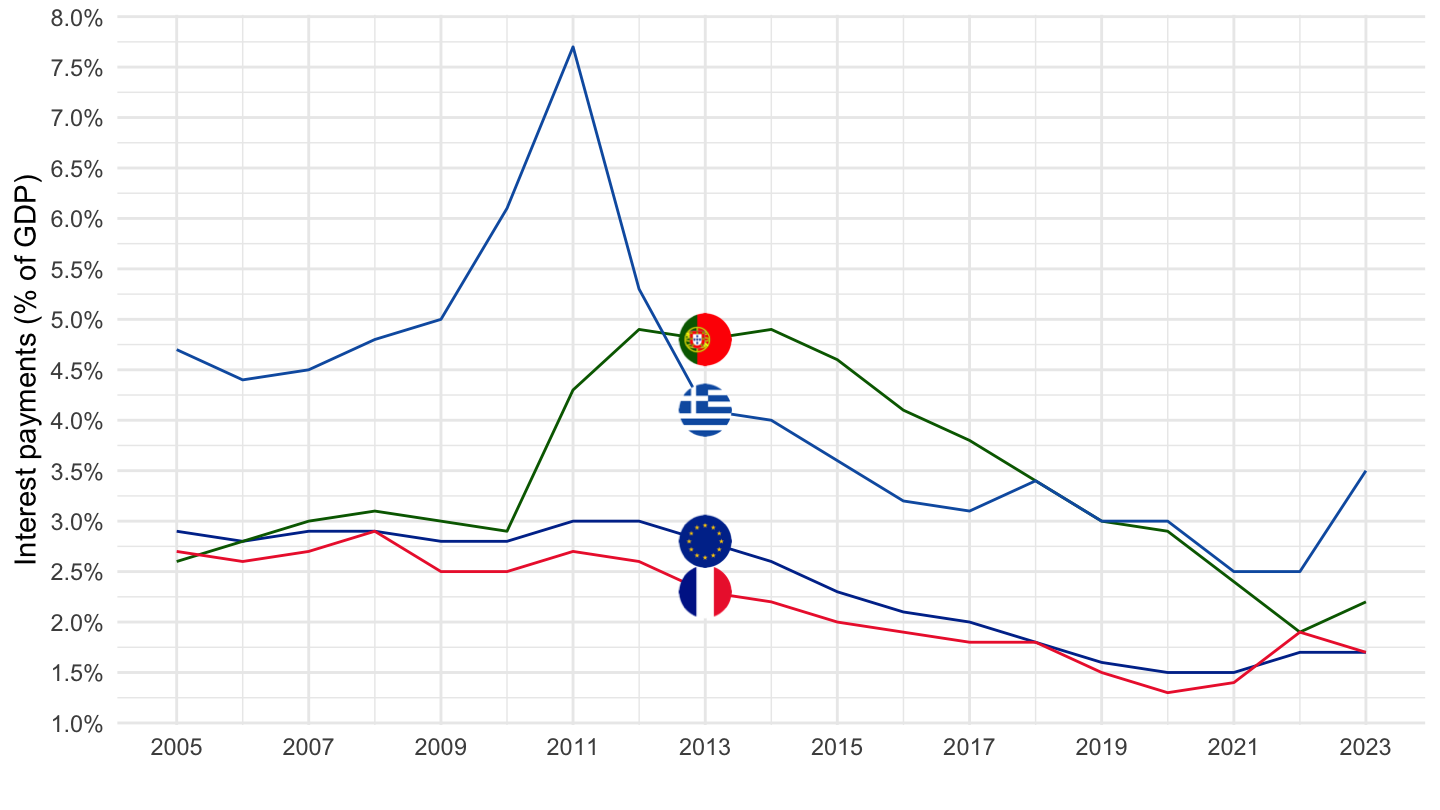
Italy, Portugal, Spain, Greece, Belgium, France
All
Debt
Code
gov_10dd_edpt1 %>%
  filter(sector == "S13",
         unit == "PC_GDP",
         na_item == "GD",
         geo %in% c("IT", "PT", "ES", "EL", "BE", "FR")) %>%
  left_join(geo, by = "geo") %>%
  year_to_date() %>%
  left_join(colors, by = c("Geo" = "country")) %>%
  mutate(values = values / 100) %>%
  ggplot(.) + theme_minimal() + xlab("") + ylab("Public debt (years of GDP)") +
  geom_line(aes(x = date, y = values, color = color)) +
  scale_color_identity() + add_6flags +
  theme(legend.position = c(0.2, 0.85),
        legend.title = element_blank()) +
  scale_y_continuous(breaks = 0.01*seq(0, 260, 20),
                     labels = scales::dollar_format(acc = .1, pre = "", su = " y")) +
  scale_x_date(breaks = as.Date(paste0(seq(1700, 2100, 5), "-01-01")),
               labels = date_format("%Y"))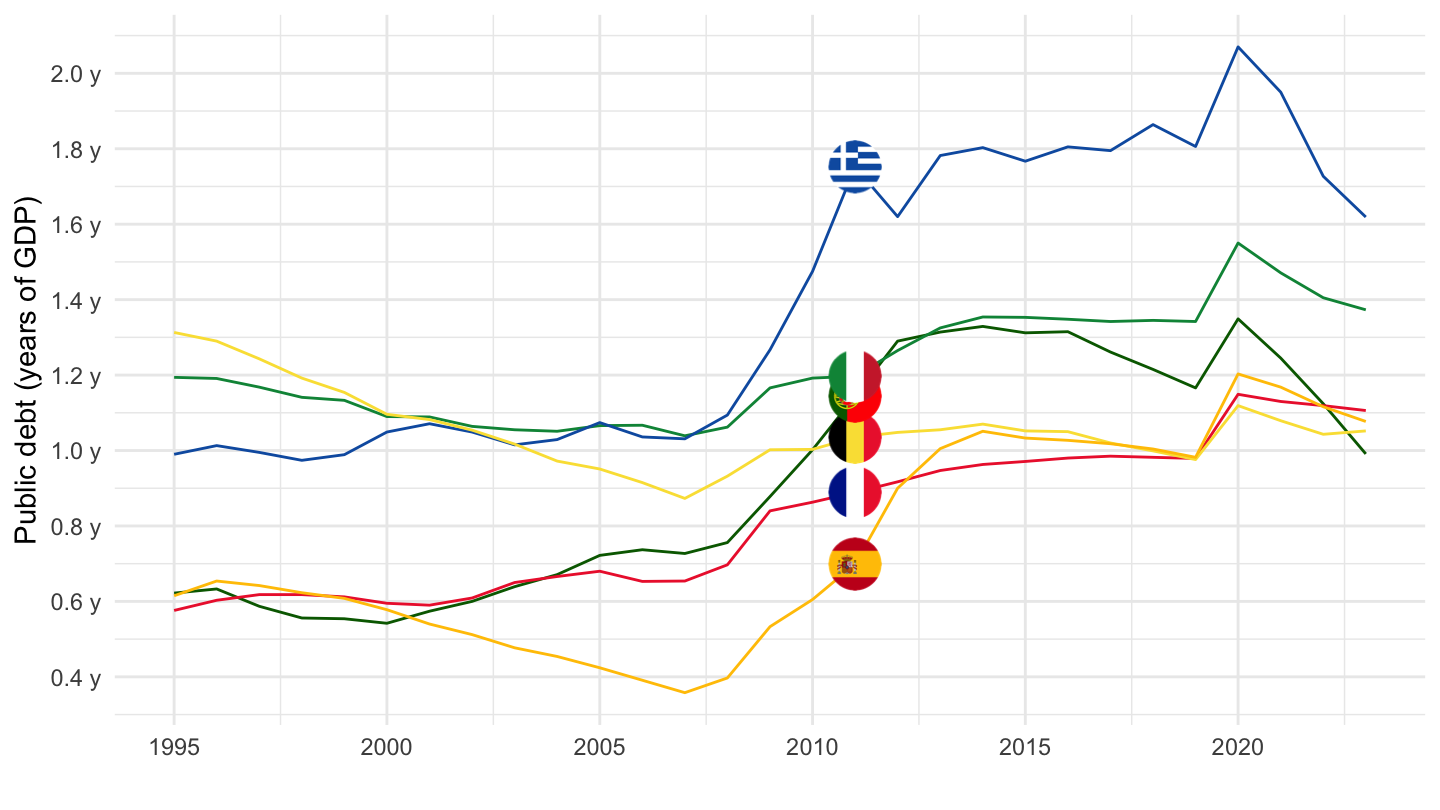
Deficit
Code
gov_10dd_edpt1 %>%
  filter(sector == "S13",
         unit == "PC_GDP",
         na_item == "B9",
         geo %in% c("IT", "PT", "ES", "EL", "BE", "FR")) %>%
  left_join(geo, by = "geo") %>%
  year_to_date() %>%
  left_join(colors, by = c("Geo" = "country")) %>%
  mutate(values = values / 100) %>%
  ggplot(.) + theme_minimal() + xlab("") + ylab("Deficit") +
  geom_line(aes(x = date, y = values, color = color)) +
  scale_color_identity() + add_6flags +
  theme(legend.position = c(0.2, 0.85),
        legend.title = element_blank()) +
  scale_y_continuous(breaks = 0.01*seq(-10, 260, 1),
                     labels = scales::percent_format(acc = 1)) +
  scale_x_date(breaks = as.Date(paste0(seq(1700, 2100, 5), "-01-01")),
               labels = date_format("%Y"))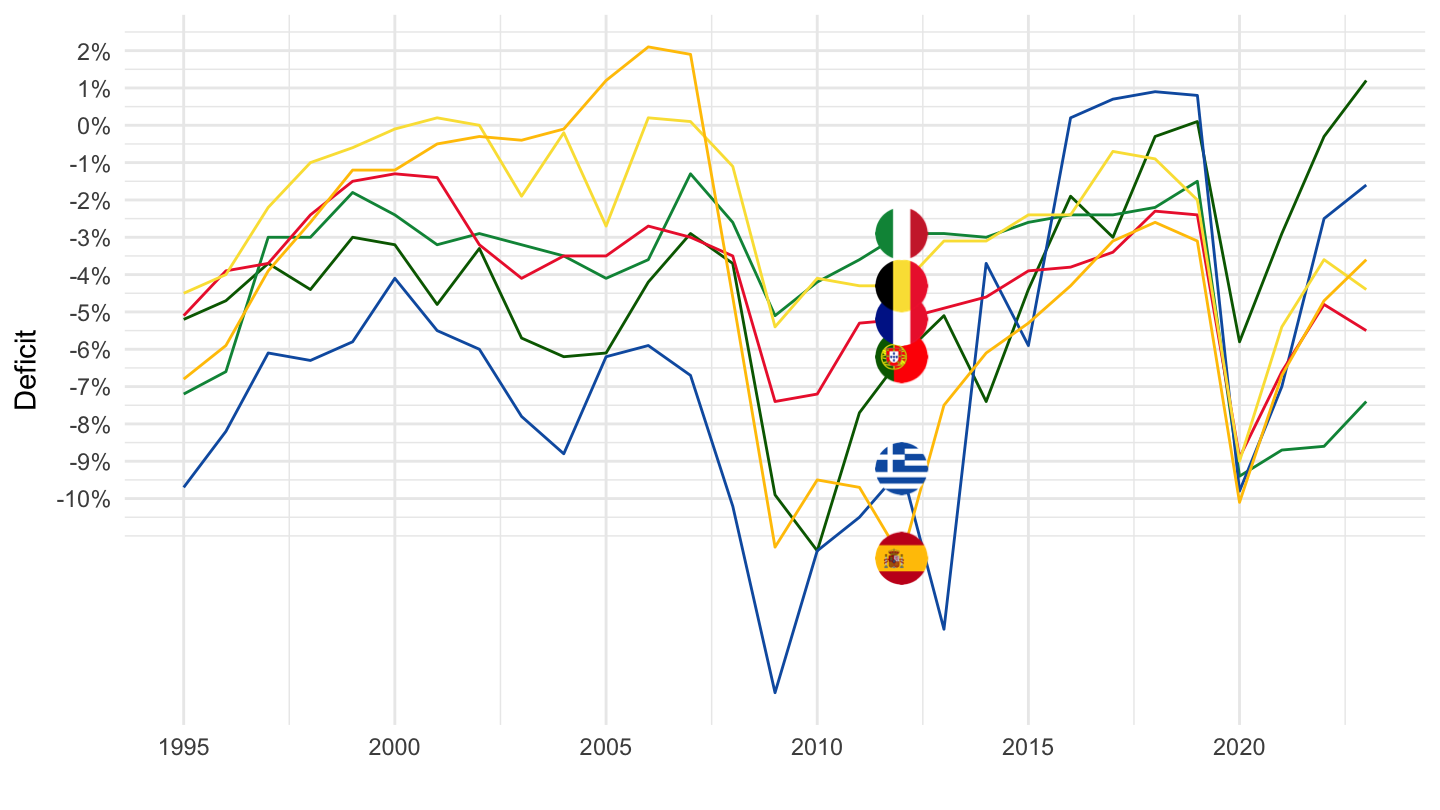
Debt
Years of GDP
Code
gov_10dd_edpt1 %>%
  filter(sector == "S13",
         unit == "PC_GDP",
         na_item == "GD",
         geo %in% c("IT", "PT", "ES", "EL", "BE", "FR", "EA19")) %>%
  left_join(geo, by = "geo") %>%
  year_to_date() %>%
  mutate(values = values / 100,
         Geo = ifelse(geo == "EA19", "Europe", Geo)) %>%
  left_join(colors, by = c("Geo" = "country")) %>%
  filter(date >= as.Date("2015-01-01")) %>%
  ggplot(.) + theme_minimal() + xlab("") + ylab("Public debt (years of GDP)") +
  geom_line(aes(x = date, y = values, color = color)) +
  scale_color_identity() + add_7flags +
  theme(legend.position = c(0.2, 0.85),
        legend.title = element_blank()) +
  scale_y_continuous(breaks = 0.01*seq(0, 260, 20),
                     labels = scales::dollar_format(acc = .1, pre = "", su = " y")) +
  scale_x_date(breaks = as.Date(paste0(seq(2015, 2100, 1), "-01-01")),
               labels = date_format("%Y"))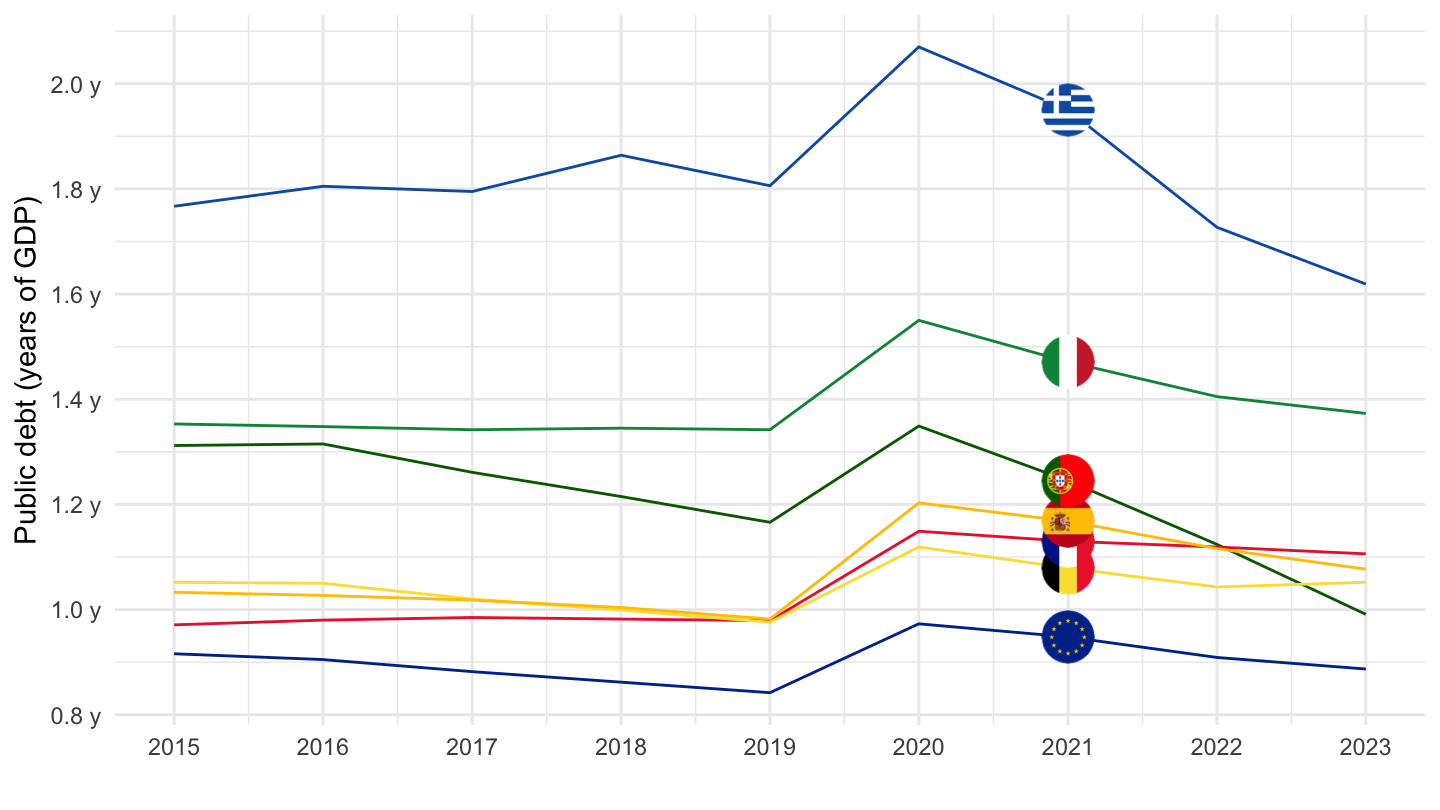
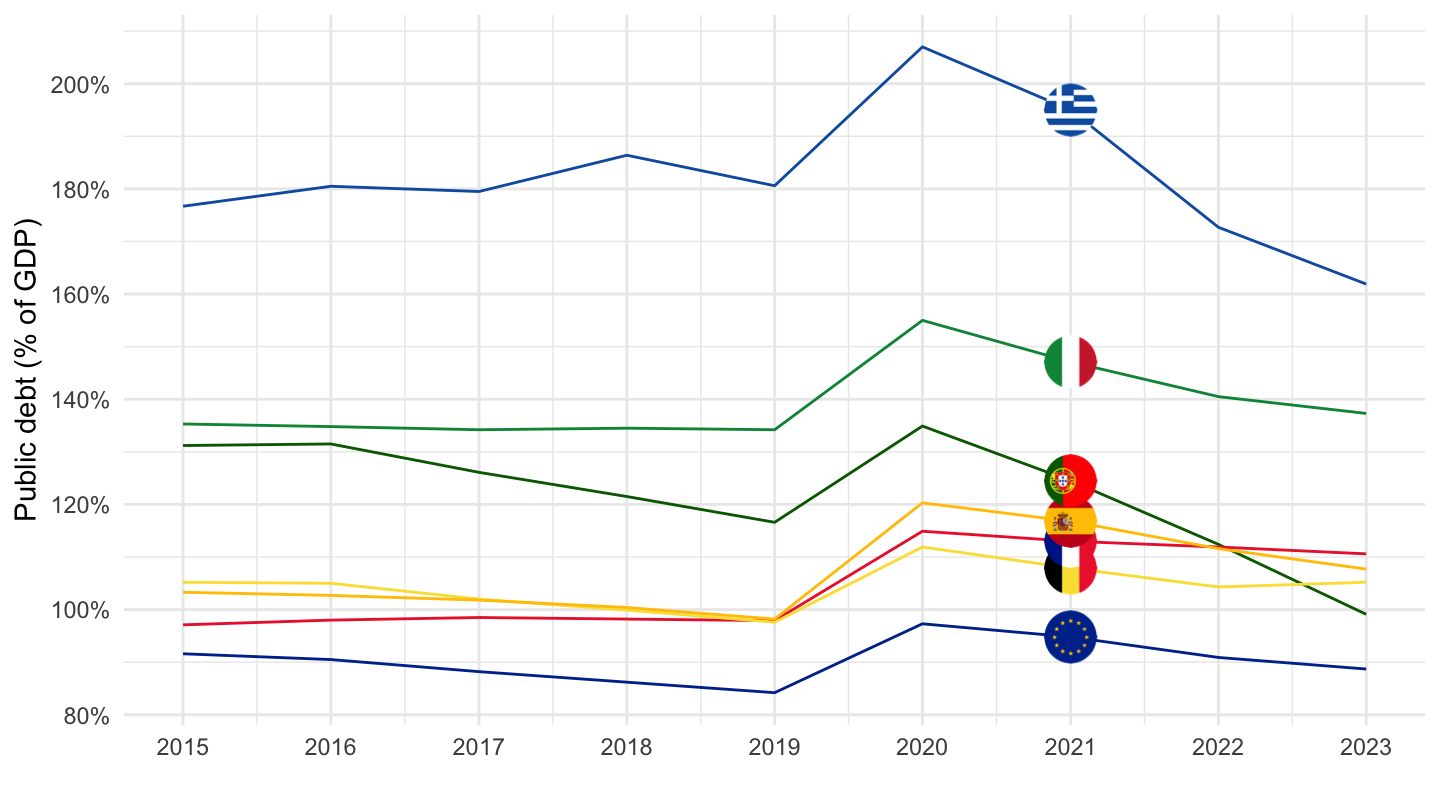
% of GDP…
Code
gov_10dd_edpt1 %>%
  filter(sector == "S13",
         unit == "PC_GDP",
         na_item == "GD",
         geo %in% c("IT", "PT", "ES", "EL", "BE", "FR", "EA19")) %>%
  left_join(geo, by = "geo") %>%
  year_to_date() %>%
  mutate(values = values / 100,
         Geo = ifelse(geo == "EA19", "Europe", Geo)) %>%
  left_join(colors, by = c("Geo" = "country")) %>%
  filter(date >= as.Date("2015-01-01")) %>%
  ggplot(.) + theme_minimal() + xlab("") + ylab("Public debt (% of GDP)") +
  geom_line(aes(x = date, y = values, color = color)) +
  scale_color_identity() + add_7flags +
  theme(legend.position = c(0.2, 0.85),
        legend.title = element_blank()) +
  scale_y_continuous(breaks = 0.01*seq(0, 260, 20),
                     labels = scales::percent_format()) +
  scale_x_date(breaks = as.Date(paste0(seq(2015, 2100, 1), "-01-01")),
               labels = date_format("%Y"))